contract ho. ¥-7^05, eng 26
TRANSCRIPT


Contract Ho. ¥-7^05, Eng 26
Reactor Experimental Engineering Division
DEVELOPMENT OP HXBROGEH-OXIGEN RECOMBIHERS
PROGRESS REPORT
by
J. A. Ransohoff
and
Irving Spiewak
Date Issued
OCT 1z-im.
OAK RIDGE NATIONAL LABORATORYOperated by
CARBIDE AND CARBON CHEMICALS DIVISIONUnion Carbide and Carbon Corporation
Post Office Box P
Oak Ridge, Tennessee

INTERNAL DISTRIBUTION
ORNL 1583Reactors-Research
and Power
1. C. E. Center 31. K. Z. Morgan
2. Biology Library 32. T. A. Lincoln
3. Health Physics Library 33. A. S-1Householderk-5. CentiflLk Research Library 3^. C. si
6. ReacJ>* •nftmmental Engineering 35. D. §HfwcW'anLibrA 36. D.
7-12. Lab<#?KorarKcords Department 37. E.
13. Labjtj jbJrJFJecords, ORNL R.C. 38. R*jll*. C. ff.i 39. JJ
15. W*FI fjHf(K-25) to. a! MAMv16. L.ftff f#W ^Y"12) in. pyjjgs17. AJJm •«»erg 1+2. rMlffies18. Elf WwtrT fc3.19- £• B*J fe»#Ley 1*. mi Jyttughton20. 'wnxers ^5. ^m*i
21. •pmerLage 1*6.j22. •*«Vw Mant *7"J wL*l 'Jbppendiek23. Bmrtout 1*8J leall2k. lid 1*9# ^•« Rill
25. 0rfl S*J fcpLler 50f j rCowen
26. [slell 51. W • 'Breazeale (consultant)27. A. Ho: Llaender 52. R. A. Charpie
28. M. T. Kelley 53. R. H. Wilson
29. W. J. Fretague 51*. I. Spiewak
30. G. H. Clevett 55. R. E. Aven
EXTERNAL DISTRIBUTION
56.57.58.59.
60-70.71.
72-76.77.78.
79-81.82.
83-8U.85-90.
91.92.93.
95.
AF Plant RepresejAF Plant
AF Plant Repr^ANP ProjectArgonneArmed I
Atomic
Burbank
attle
bod-RidgeWorth
toryeapons Project (Sandia)
sion, WashingtonnstituteBattel
Becht
Brod rial Laboratory
irch and Development CompanyrCarbon Chemicals Company (Y-12 Plant)bent Group
Javal Research
Edison CompanyDepartment of the Navy - Op-362Detroit Edison Company

100.
101.
102-101*-.105-108.
109.110-116.
117.118-121.122-123.
121*.
125.126.127.128.
129.130-131.132-133.
131*.135.136.137.138.139.ll*0.lUl.ll*2.
1^3-llA.Ib5-lk6.
Ikf.ll*8.
11*9-15**.155-169.
170.
,duPi3n^-Qonipacny^1duPont Company, WIFoster Wheeler Co'
General Electric
General Electr
Hanford OperIdaho
Iowa
Knolls AjRg^^^e^LaboratoryLos AL^KL |̂w|ettHfic Laboratorylta88sJfojjte0B' Institute of Technology (Kaufmann)MoniN^^Chemj^al Company
SoryIvisory Committee for Aeronautics, ClevelandIvisory Committee for Aeronautics, Washington
j^&e&rch LaboratoryNew^jjfrk Operations OfficeNorth American Aviation,
Nuclear
Patent Brand
PowerpljPratR« „ _
Office
^rations Office, Augustauarters
STNaval Radiological Defense LaboratoryUniversity of California Radiation Laboratory, BerkeleyUniversity of California Radiation Laboratory, LivermoreVitro Corporation of AmericaWalter Kidde Nuclear Laboratories, Inc.Westinghouse Electric CorporationTechnical Information Service, Oak Ridge
Pioneer Service and Engineering Company
2a -
ta
sion (Fox Project)

- 3 -
TABLE OF CONTENTS
CHAPTER PAGE
8
8
8
11
11
13
15
I. THE TESTING AND OPERATION OF FLAME AND CATALYTIC
RECOMBINERS ON THE HOMOGENEOUS REACTOR EXPERIMENT———*—•*-
Description of the Off-Gas System--**—--—-———*———
Recambiner Details——————*———*.-~—.— —
Catalytic Reeombiners—————————————
Flame Recombiner**———-————«.*- ——
Testing of the Recombiners—-———.——————
DgO System Recombiners————— —-———— 15
Fuel Catalytic Recambiner——-————————— 26
Flame Recombiner—-———— —-——— 16
Flashback Testing—————— — 17
Recombiner Operation————————————— 19
DgG Recombiners——————-
Fuel Catalytic Recombiner——
Flame Recombiner——————-
Estimated Gas Prodaetion in the HRE-
Acknowledgments———
19
20
20
22
22

-1* -
TABLE OF CONTENTS (CONT'D)
CHAPTER PAGE
II. THE CATALYTIC REACTION OF 2H2 + 02 ON PLATINIZED ALUMINA 2k
Summary 2k
Introduction 2fc
The Apparatus 25
Discussion of Results 29
Reliability and Possible Sources of Error — kk
Conclusions 1*5
Future Plans and Recommendations — 1*5
III. THE DEVELOPMENT OF AN EXPLOSION PROOF, AUTOMATIC LOADADJUSTING, FLAME RECOMBINER — 1*8
Summary—— — —— 1*8
Introduction 1*8 <"'
The Apparatus — 1*9
Operating Characteristics 52
Conclusions — 56
Acknowledgments 56
APPENDIX A. A Catalytic Combustion Hydrogen Gas Analyser — 57
APPENDIX B. Derivation of the Equation Relating RecombinationEfficiency to Hydrogen-Oxygen Ratio • 61*
APPENDIX C. Theoretical Calculation of Recombination with DiffusionControlling .— 67
APPENDIX D. Table of Observed Mass Transfer Coefficeints 70
APPENDIX E. Summary of Observed and Calculated Data 72

LIST OF FIGURES
- 5 -
TABLE OF CONTENTS (CONT'D)
PAGE
1 HRE Off-gas System ———————————— 9
2 HRE Catalytic Recombiner——————————— 12
3 HRE Flame Recombiner ————————— ill
1* Gas Production in the HRE—————————— 23
5 Test Catalytic Recombiner Flow Diagram—————— 26
6 Catalytic Recombiner----------——————— 27
7 Reeombiner Efficinecy vs. Oxygen to Hydrogen Ratio—— 29
8 Typical Plot of °° vs. Hf 31200 - Ho 20© - Ho
9 Typical Plot of °° vs. Hf at 231°C 3*20o - Ho 20© " Hq
10 Typical Plot of °° vs. Hf at J*37°C 3520q - Hq 20q — Hq
11 Typical Plot of °° vs. ?£ at 1*32°C 3620q - Hq 20o - Hq
12 Typical Plot of °° vs. Hf at 515°C-— 3720q — Ho 20© — Ho
13 Hydrogen Mass Transfer Coefficients as a Functionof Temperature and Pressure ——————— 39
lk Hydrogen Mass Transfer Coefficients as a Functionof Flow Rate — *0
15 Comparison of Hydrogen and Deuterium Data ————- 1*3
16 Experimental Flame Recombiner Flowsheet ————— 50
*';'

LI3T ffl FIGURES
17
18
19
20
21
22
.^Ksss^^et'
TABLE OF CONTENTS (CONT'D)
PAGE
Experimental Flame Recombiner ———————— 51
Flame Recombiner Temperature vs. Gas Flow Rate —— 55
Sensing Cell and Cell Block for a CatalyticRecombiner Hg System ——————
Schematic Diagram of the Analyzer Sampling System-
Schematic Diagram of the Heater Current Control —
A Typical Analyzer Calibration Curve——.
.- 58
- 59
.- 60
.- 62

- 7 -
DEVELOPMENT OF HYDROGEN-OXYGEN RECOMBINERS
During the past year there have been several developments in the
recombiner field which should be of interest to those concerned with
homogeneous reactor technology. It is the purpose of this report to review
our experience with recombiners under actual reactor operating conditions,
and to discuss new developments in the field. This end can best be
accomplished by reporting our work in three somewhat independent chapters,
each of which shall be a report in itself:
Chapter I
Chapter II
Chapter III
- The testing and operation of flame and catalyticrecombiners in the ORNL Homogeneous ReactorExperiment - by J. A. Ransohoff
- The effect of ©xygen concentration, temperature,pressure, and space velocity on catalytic recombinationby platinized alumina - by J. A. Ransohoff and I. Spiewak
- The development of a flashback-proof, automatic loadadjusting flame recombiner, mainly for use on a boilingreactor - by J. A. Ransohoff and I. Spiewak.
J. A. Ransohoff
I. Spiewak

- 8 -
CHAPTER I
THE TESTING AND OPERATION OF FLAME AND CATALYTIC RECOMBINERS
ON THE HOMOGENEOUS REACTOR EXPERIMENT
Summary
It is estimated that the HRE produces 10 cfm (STP) of 2H.2 + O2 per
megawatt during power operation. There is no evidence that any of the com
bustible gas produced in the reactor escapes unreccmbined. In this section
we will describe the off-gas system, and discuss the preliminary testing of
the recombiners, the performance of the recombiners under operating
conditions, and the reliability of our gas production estimates.
Description of the Off-Gas System
The HRE was expected to produce 11.3 cfm* (STP) of 2H2 + 02 per megawatt
of reactor power. Since the operating level may be set at any fraction of
that power for prolonged periods of time, the gas handling system was
designed to handle all gas quantities between zero and 15 cfm. A simplified
flow diagram Of the HRE off-gas system is shown in Figure 1.
* T. J. Sworski (p.117j HHP Quarterly Report, Jan. 1, 1953, 0RNL-ll*78,Uranyl Sensitized Reaction of H2 and 02) has developed an equation to beused in predicting the amount of gas produced in aqueous homogeneous reactors.For UO2SOI1. solutions it is:
g= I.83 - 0.0l*88(C)1/2where g = molecules % formed per 100 ev of
fission energy
C = concentration of U (total) in solution—gms of U02S01|./liter
For mean operating conditions in the HRE on Feb. 23-21*, the predicted "g" valueusing Sworski's equation was 1.53, and the predicted gas production 11.3 cfm (STP)per megawatt of reactor power.

02 INPUT
1. STOICHIOMETRIC GAS INLET2. CORE3. SECOND OF 3 CONCENTRIC PIPES4. CANNED ROTOR CENTRIFUGAL PUMP
5. VORTEX
6. THIRD OF 3 CONCENTRIC PIPES7. DOUBLE PIPE HEAT EXCHANGER
8. LETDOWN VALVE
9. DUMP TANKSIO.PULSAFEEDER
11. OXYGEN ABSORBER12. FUEL EVAPORATOR13. FORE CONDENSER14. FLAME RECOMBINER
15. CATALYTIC RECOMBINER16. AFTER CONDENSER17. COLD TRAPS18.STEAMER POT
19.STEAMER POT20.PRESSURIZER
FIGURE 1
HRE OFF-GAS SYSTEM

- 10 -
The gas formed in the fuel solution at pressures up to 1000 psi and
temperatures up to 250°C is removed from solution, let down to atmospheric
pressure, recombined to water, and returned as such to the fuel solution. The
gas, along with some steam and fuel solution, is throttled through a valve (8)
into the dump tanks (9) where an evaporator (12) adds up to 1*0 cfm (STP) of
steam to the gas so that the mixture flowing from the dump tanks to the
JL JUL
recombiner system is noncombustible. > The steam is condensed from the gas
in a large condenser (13); making the mixture once again combustible; and the
condensate is either returned by gravity to the dump tanks, or is collected In
condensate weigh tanks if it is desired to concentrate the fuel solution.
The gases then flow from the condenser to the flame recombiner (ll*) where
the H"2 and O2 are burned to water, most of which is condensed in the combustion
chamber which is a 3 1/2 foot length of 10 inch pipe, jacketed by a 12 inch
pipe through which cooling water is circulated. At extremely low power levels
(less than 20 kw), operation of the flame recombiner is erratic, and overall
recombiner operations are improved if the spark is shut off and the gases are
allowed to flow into the catalytic recombiner (15) where the H2-02 reaction is
catalysed by l/8 inch platinized ^imrfna pellets. Following the catalytic
recombiner is another condenser (16) in which most of the remaining water vapor
is condensed. The gases still remaining (fission products plus 1200 cc/min. of
02 that are continually bled into the system at (11)), then pass through cold
* D. V. Knhn et al, Explosion Limits in Mixtures of H2 and 02, Steam and He,Oak Ridge National Laboratory, Y-73V 1951- Secret.
** H. M. McLeod et al, Recombination of Stoichiometric Mixtures of H2 and 02in a Flame Recombiner (Feasibility Report), Oak Ridge National Laboratory,Y-706, 1951. Secret.

- 11 -
traps (17) where last traces of water vapor are removed from the gas. Before
the O2 is released to atmosphere, it is stripped of accompanying fission
products by being passed through a charcoal bed. The condensed products of
combustion are returned to the fuel in the dump tanks by gravity.
In addition to the gases produced in the fuel solution, it was expected
that up to l/l* cfm of 2D2 + 02 would be produced by decomposition of D2O in
the reflector. Accordingly, the He used to pressurize the reflector is
circulated through a catalytic recombiner placed in the high pressure D2O gas
system. The gas circulation is accomplished by use of a liquid-gas jet placed in
the D2O Circulation line, and the recirculated gas returns to the reflector
vessel along with the liquid. To provide for a means of handling the
decomposed gas in the event of a reflector dump or He bleedoff, a catalytic
recombiner is also placed in the low pressure D2O system.
Recombiner Details
Catalytic Recombiners
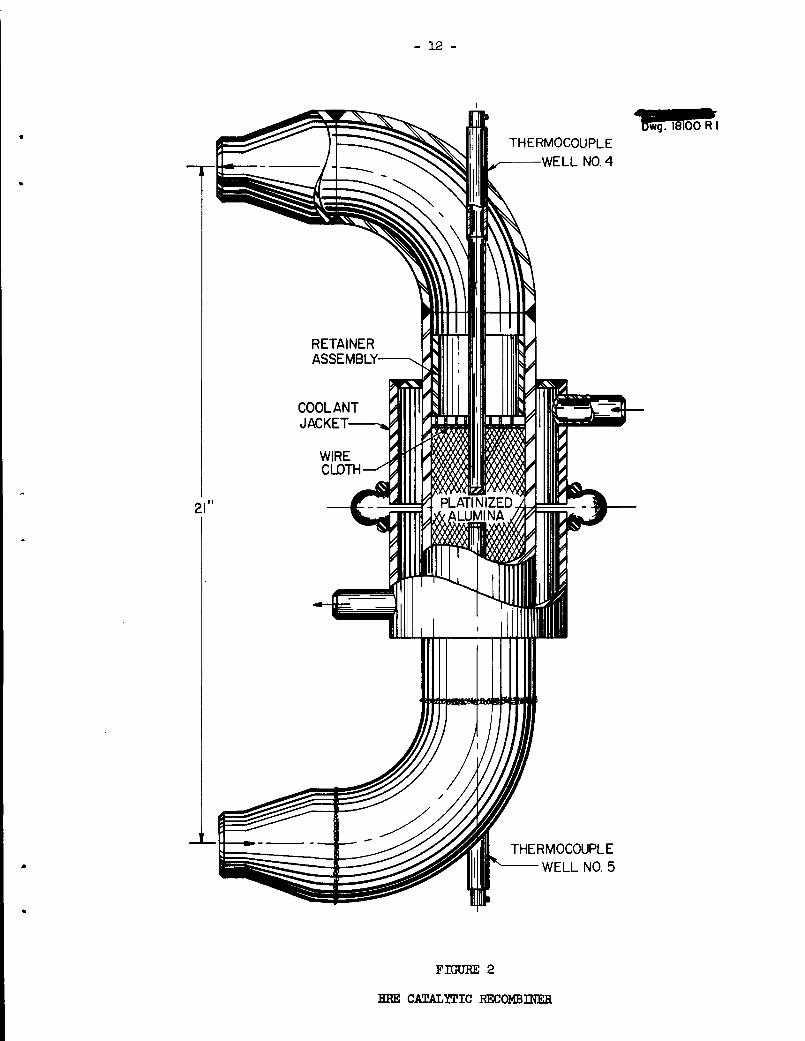
All of the catalytic recombiners on the HRE are essentially the same as
that shown in Figure 2. Unless the gases passing through the catalytic re
combiners have a low enough H2 concentration so that the mixture is non-
combustible, an explosion is likely to result.
There is enough He in the reflector vessel, and the velocity with which
it is circulated is sufficiently high to adequately dilute the radiolytic
D2 + 02 formed in the reflector. Whatever gases flow into the low-pressure
catalytic recombiner in the fuel system are first diluted by up to 3 cfm (STP)
of steam produced by a small evaporator (19) placed between the flame and
catalytic recombiners. This quantity of steam is more than enough to dilute
12
THERMOCOUPLE
WELL NO. 4
THERMOCOUPLE
WELL NO. 5
FIGURE 2
HRE CATALYTIC RECOMBINER
wg. 18100 R I

- 13 -
the l/l* cfm of 2H2 + 02 that the catalytic recombiner is expected to handle
at maximum load.
The catalyst may be poisoned by either a liquid film of water or a layer
of adsorbed I2. Protection from "water poisoning" is provided by Jacketing
the recombiners with high-pressure steam which serves to keep the catalyst
dry. It is now believed that the I2 produced by fission in an 02 rich fuel
solution will be oxidized to IO3, and if this be the case, no precaution
against poisoning need be taken. If molecular I2 is produced however, the
catalyst may be cleansed of Ig by occasionally heating the bed to about 1*00°C
with the hot gases produced in the flame recombiner during relatively high
power operation.
Flame Recombiner
The flame is established at a many-holed nozzle upon which a spark
impinges from one of three spark plugs located along the periphery of the
nozzle (see Figure 3). The spark impulse is produced by a magneto, and an
Ignition transformer is held in standby In case of magneto failure.
The flow area of the nozzle consists of ll*7 holes 1/32 inch in diameter,
the total cross section being 0.112 sq. in. When the flow rate through the
nozzle reaches 25 cfm of reactor gas, the velocity through the nozzle becomes
61*0 feet/sec, and the pressure drop through the nozzle approaches the 11 foot
water head by which the condensate is returned to the dump tanks. At flows of
less than three cfm, the pressure drop across the nozzle is so low that the
flame burns too close to the tip, the nozzle overheats, and flashbacks result.

« % • *
FIGURE 3
HRE FLAME RECOMBINER
1. SFARK PLUG
2. COOLING WATER JACKET
3. BURNER NOZZLE
4. HEAD DETAIL
* 1
•p-
i

- 15 -
To prevent flashbacks at low power levels, a steamer pot (l8) provides
2 to 3 cfm (STP) of steam to the gas stream flowing from the fore condenser
to the recombiner. The steam produced serves both to cool the flame by
dilution, and to provide the minimum flow necessary to keep the flame from
burning directly on the nozzle. The spark is operated continuously at all
times to Insure constant burning of the gas, although at flows of greater
than 2 cfm a stable flame is established.
Testing of the Recombiners
D2O System Recombiners
The low pressure D2O catalytic recombiner was tested by passing
electrolytic 2H2 + O2, diluted with He, through the D2O low pressure system,
and observing the temperature rise in the catalyst. No extensive quantitative
data was taken, but a flow of 1* cfm of He with 2 percent H2 increased 70°C
in temperature while flowing through the bed, and this was accepted as
sufficient proof that the overdesigned bed would serve its function.
The high pressure D2O recombiner was tested with water in the reflector
vessel at 200°C and circulating, and enough He in the system to bring the
total pressure to 650 psi. H2 and 02 vere added in nearly stoichiometric
amounts from high pressure cylinders. The results are expressed below in
terms of equilibrium recombiner temperatures:

- 16 -
Reflector Temperature Reflector Pressureoc psi
197196197
650625653
Gas Admitted
cfm (STP) 2H2+02
0.0
0.330.1*2
EquilibriumRecombiner
TemperatureQC
200
286360
Fuel Catalytic Recombiner
To test the fuel catalytic recombiner, electrolytic gas was admitted to
the low pressure fuel system, and allowed to flow through the recombiners
with the spark turned off and both steamer pots producing approximately 2.5
cfm of steam. Operation was satisfactory.
The Data
Gas Admitted
cfm (STP) 2H2 + 02
0.0
0.22
0.10
Recombiner Temp. °Ct.c. No.l* t.e. No.5
115 115270 210
208 I65
Flame Recombiner
The flame recombiner on the HRE was operated at flows varying from less
than l/l* to more than 15 cfm (STP) of 2H2 + 02 prior to power operation of the
reactor. It was discovered during this operation that the fuel off-gas
recording apparatus was not entirely reliable, and it was decided to make a
heat balance across the recombiner system to see if off-gas flow could be
determined accurately in that manner. From the data taken (see table below),
it was agreed that heat balance determination of off-gas flow rate would be
accurate to within 5 or 10 percent.

- 17 -
The Data
Gas Flow Heat Balance (BTU/Min.)cfm at STP A B Percent Difference
H2. 02
0.80
In with Gas
51*1*
Out with Cooling Water
5l*l
(A-B)/B
I.67 0.62.58 1.1*0 877 805 8.93.3 1.60 1090 971*- 11.92.35 1.27 780 793 1.65.0 2.1*5 1670 139k 19.8*.3 2.0 1362 1322 3.05.0 2.1*6 1675 15^5 8.56.1* 3.1 2110 1953 8.06.2 1*.0 2110 2313 -8.7Excess 0.68 1*61* 1*99 -7.0Excess 0.60 1*09 1*27 -*.37.1 3.6 21*10 2l*0l* 0.37.7 3.7 2520 2l*0l* 1*.85.3 2.1*5 1670 1773 -5.82.6 1.22 832 853 -2.55.7 2.67 1816 1720 5.66.8 3.1 2110 1977 6.79-5 *.3 2930 261*0 11.0
3-* 1.72 1152 1080 6.7
There is an inherent error of about five percent due to variations in
cooling water flow, and an error of a percent or two in gas flow measurement
through the calibrated orifices used for these tests. Errors that might be
caused by conditions in the off-gas cell and general heat losses and gains due
to irrelevant factors were accounted for by using as "zero" temperature the
temperature of the exit cooling water when no H2 was flowing.
Flashback Testing
Flashbacks originating in the recombiner system create peak pressures of
from 100 to 1*00 psi depending on the starting pressure and the H2-O2
concentration.*
* T. H. Pigford,Explosion and Detonation Properties of Mixtures of H2 and 02and Water Vapor, Oak Ridge National Laboratory, ORNL-1322, 1952./

- 18 -
Such explosions will be quenched In the line between the dump tanks and
the fore condenser, or in the condenser itself, if the gas mixture contains
more than 70$ steam*. There is, of course, a possibility that the process
solution evaporator (12) may fall or be turned off for some reason, or that
gas flows much greater than expected will have to be handled. It was feared
that if the mixture in the off-gas line were combustible, an explosion
originating in one of the recombiners might travel back through the off-gas
line to the dump tanks and thence through the let-down valve into the high-
pressure system.
To see whether or not this would be the case, H2 and O2 were admitted
to water circulating in the high pressure system at (1) with that system
operating at 250°C and 1000 psi. The gases then flowed with the water
into the core (2) where the circulatory motion of the liquid set up a gas
vortex (5)* From the vortex, the mixture of Eq, O2, steam and water passed
through the let-down heat exchanger (7) and valve (8) into the low pressure
system where the gas was allowed to pass undiluted to the recombiners. The
liquid taken from the core was replaced by pumping water from the dump tanks
back into the core with a pulsafeeder (10).
* H. M. McLeod et al, Recombination of Stoichiometric Mixtures ofH2 and 02 in a Flame Recombiner (Feasibility Report), Oak Ridge NationalLaboratory, Y-706, 19514

- 19 -
The sparks in the flame recombiner were left off, and when the
combustible gas came in contact with the catalyst, flashbacks resulted.
With a gas flow of 8 cfm, it was immediately evident that the flashbacks
were travelling all the way to the dump tanks. However, when the gas flow
was Increased to 12 cfm, the flashbacks, which had been occurring every
ten seconds, increased in frequency to about once every 6 or 7 seconds, and
then ceased. Concurrently the temperature in the line connecting the dump
tanks and the recombiner system rose sharply, and the gas was immediately
turned off.
Apparently a flame had become established somewhere between the let
down valve and the line leading from the dump tanks, but we were satisfied
that an explosion originating in the recombiners would not travel back up
through the let-down valve into the high pressure system at design
temperature and pressure.
Recombiner Operation
On February 20, 23, 2l*, and March 18, the HRE was operated at power
levels high enough to learn something about the operation of the recombiners
under actual power operating conditions. The following observations were
made:
D20 Recombiners
No decisive temperature increase in either of the D2O recombiners was
observed. However, it would require a considerable period of high-power
- 20 -
operation to effect a very large increase in D2 - O2 concentration in the
He diluent, and there is no reason to suspect the recombiners of being
Ineffective; so no conclusions can yet be drawn.
Fuel Catalytic Recombiner
The spark to the flame recombiner was left off during power operation
of the reactor at 10 and 20 kw, and the catalytic recombiner was allowed to
recombine the gas produced, which it did nicely. Some buildup in -pressure
was observed during this operation, but it is believed that this was due to
frozen cold traps which did not allow the excess 02 to escape; rather than
incomplete recombination.
Flame Recombiner
Minor flashbacks which could best be described as mild pressure surges
were observed in varying degree from the point at which the flame recombiner
was put into use (varied from 0 to 1*0 kw) up to power levels of 200 kw.
From about 150 to 300 kw reactor power, there is a transitional range in
which burning is relatively smooth but is accompanied by a rather shrill
whistle. At power levels above 300 kw, burning is extremely smooth and is
unaccompanied by noise of any kind. As the reactor power is increased much
above 1 Mw, the pressure drop through the recombiner nozzle becomes such
that it is difficult to keep the pressure in the fore condenser below 1
atmosphere as is desired because of a leak in the condenser. It was found
that shutting off the steamer pot directly before the reeombiner reduced the
mass rate of flow and the gas temperature to a point where the condenser
pressure was no longer excessive.

- 21 -
It is possible, however, to reach a reactor power* where so much gas
is produced that the temperature (at the base) of the recombiner exceeds
600 °C, a temperature considered too high for safe long term operation.
This is probably the limiting factor in determining maximum permissible
operating power of the present HRE.
* During the high power run of March 18, the thermocouple at the baseof the flame recombiner read 6l0 °C at which point the reactor power wasreduced. The nuclear instruments read ll*8o kw at the power level correspondingto the recombiner temperature mentioned above. At that power approximately15 cfm of 2H2 + 02 should be produced (by extrapolating the data obtained onFebruary 23-21*). The power was not maintained long enough to determinethe amount of gas produced, but during pre-power tests on the recombiners,flows of 15*6 and 13.2 cfm were established long enough to obtain reliabledata. The corresponding temperatures at the base of the recombiner were1*80 °C and 575 °C, so it seems probable that about 16 cfm were being burnedin the recombiner during the ran of March 18, and that the reactor powerwas probably much nearer to l600 than 1500 kw. This contention is notweakened by an admission on the part of the nuclear people that it ispossible that the nuclear instruments could have been as much as 10$ lowduring that particular operation.

- 22 -
Estimated Gas Production in the HRE
Earlier in this report it was noted thatradiolytie gas production
had been predicted to be 11.3 cfm (STP) of 2H2 + 02 per megawatt of reactor
power; and the reliability of using heat balance across the recombiners to
determine gas production was discussed. During the power operation of the
HRE on February 23-21*, the following data were taken using the heat balance
method*
Estimated Recombiner Power
Estimated Reactor Power (Cooling H2O Balance) cfm (STP) 2H2 + 02kw kw to Produce Heat Removed
70 2.8 0.7260 9.6 2.1*520 20.8 5.25**0 22.0 5.5810 31.7 7.9
1000 1*0.0 10.0
The above data are expressed graphically in Figure 1*.
Acknowledgments
This work has been made possible by Messrs. H. M. McLeod, T. S. Mackey,
Don Phillips, M. J. Fortenbexry, A. D. Ryon, A. A. Palko, and D. W. Euhn who
did most of the early development work; by R. VanWinkle who guided the
recombiners through the HRE mock-up stage, and the members of the HRE operating
crew and S. E. Beall under whose supervision the recombiners were actually
used.

23
Jwg
3U
-
40
£*:
- -
CC
£ 302
RECOMBINERro
O
—
10
n
-
1.25
1.00
o(A
7.5 w
Zo
5.0
2.5
o
QOq:a.
CO<
10 15 20 25 30
REACTOR POWER (KW)
35 40 45
FIGURE 1*
GAS PRODUCTION IN THE HRE

-21*.
CHAPTER II
THE CATALITIC REACTION OF 2H2 + 02 ON PLATINIZED ALUMINA
Summary
A study is made of the effect of oxygen concentration, temperature
from 230 °C to 520 °C, pressure from 25 to 110 psia, and space velocity
from 725,000 to 1,850,000 hrs."1. Also, a comparison of the recombination
rates of H2 and D2 under comparable conditions is made. The reaction
controlling mechanism is stated to be diffusion of gas to the catalyst
surface, and the basis for this conclusion is developed.
Introduction
In the Intermediate Scale Homogeneous Reactor, it is planned to re-
combine the radiolytic deuterium and oxygen at reactor pressure, thereby
eliminating equipment Involved in low-pressure recombination such as a
let-down system, a large pulsafeeder, additional heat exchangers, etc.
Since the consequences of an explosion starting at a pressure of 1000 psi
are likely to be quite severe, and since the only way to guarantee against
a deuterium-oxygen explosion is to prevent a combustible mixture from
occurring, a flame recombiner of the type used in the HRE is not applicable.
The information available On the catalytic recombination of H2 and O2 by
platinized alumina as of January 1, 1953 was Insufficient to enable the
design with confidence of a high-pressure catalytic recombiner for the ISHR.
Therefore, experiments were planned:

- 25 -
1. To study the effects of excess O2, flow rate, temperature,and pressure on the reaction rate. The primary range ofinterest was with excess 02 present, since this would bethe case in the ISHR, for reasons dealing with uranylsulfate corrosion.
2. To determine if possible the reaction controlling mechanismfrom the available data.
3. To investigate the applicability of H2 data for D2 recombiners.
1*. To investigate other catalysts and recombiner types.
5. To investigate the effect of I2 poisoning quantitatively.
The Apparatus
A simplified flow diagram of the test apparatus is shown in Figure 5.
The recombiner consists of a short piece of 1 inch stainless steel pipe with
a thermocouple well inserted 1/2 inch into it, and with a steam jacket around
it. A 1 1/2 inch section of the pipe is screened off with perforated plates,
and the volume within the plates contains I.39 in.3 of l/8 Inch platinized
alumina right cylinders, (Figure 6). Steam is admitted to the system through
a calibrated orifice, and H2, or D2, also metered through a calibrated orifice,
is added to the steam. The two gases then flow through a superheater at the
base of which a measured quantity of O2 is added to the mixture. The non-
combustible mixture (H2 concentration varies from 2 to 10 percent, O2 from 1
to 10 percent) then flows through the catalyst where a portion of the gas is
recombined, and out of the system through one or both of two needle valves
which control the system pressure. One of the valves is a six-turn, 3/1* inch
valve used for coarse control, and the other is a 30 turn, l/l* inch needle
valve, in parallel with the other, used for fine control.

STEAM
H.
Oc
t »
RECOMBINER
© TFIGURE 5
TEST CATALYTIC RECOMBINER FLOW DIAGRAM
f «
Dwg
CONDENSER
TO H2 ANALYZER
•1X1-^ TO WASTE
i
i

- 27
Dwg. 21055
THERMOCOUPLE WELL
CATALYST BED
FIGURE 6
CATALYTIC RECOMBINER

- 28 -
After leaving the higher pressure system, the now highly superheated
steam-H2-02 mixture is joined by a metered stream of air, and the new
mixture then flows through a condenser. At the base of the condenser is a
small cylinder In which the condensed water is separated from the air stream.
The water and most of the air flow through another pressure controlling valve
(condenser pressure Is maintained at about 5 psi) to waste. A small portion
of the air flows through a drying bed of CaSO^ to a H2 analyser (see
Appendix A). By knowing the amount of air metered into the system and the
excess of O2, and the % concentration of the off-gas stream, one may
determine the amount of H2 which goes through the system unrecombined. The
following data were taken for each run: H2, O2, steam, and air flow, pressure
drop across the recombiner, pressure In the recombiner, temperature in the
recombiner, temperature of the gas before and after the recombiner, off-gas
H2 concentration, and various cooling water and other control measurements
of no consequence in analysing the recombiner characteristics.
In the interest of safety, the entire high-pressure system from the
point where O2 was admitted to beyond the exit valves was sandbagged, and
the valves were remotely operated. The pressure was measured by means of a
remote Instrument thereby removing the danger of an exploding gage should an
accident occur, and rupture discs were located at appropriate places in the
system. No accidents occurred.

g
- 29 -
Discussion of Results
Tests conducted by an MIT Practice School Group* on H2O-H2-O2 mixtures
indicated that diffusion of gas to the catalyst surface controlled the
reaction rate. As the ratio of O2/H2 was increased, the amount of re
combination increased, until at ratios above 1, additional 02 did not increase
recombiner effectiveness. This was explained on the basis that at ratios
below 1, both hydrogen and oxygen diffusion were important, but above 1
hydrogen diffusion alone controlled the kinetics. Similar results were
obtained in the present investigation. Figure 7, which records efficiency vs.
O2/H2, Indicates that the efficiency levels off just above a unit ratio.
92
90
88
86
81*
82
80
78
76
7*
pDvg.21056
"0
Pressure 50 psia.
Temp. 350°C.
Flow 9.61 scfm.
0.5 1.0Initial O2/H2
Figure 7
1.5 2.0
Recombiner Efficiency vs. Oxygen to Hydrogen Ratio
• Gaven, J. V. et.al., "Catalytic Recombination of Hydrogen & Oxygen-n"KT-131* (1952).

- 30 -
For diffusion controlling, three modes of operation exist:
1. Using stoichiometric gas, the diffusion of the heavier component,oxygen, would control rate throughout.
2. With a starting O2/H2 greater than 1, hydrogen diffusion wouldcontrol.
3. With a starting ratio between 0.5 and 1, there would be some pointin the bed where the controlling diffusant would change from oxygento hydrogen.
If diffusion is the only factor governing the reaction rate, the following
equation can be derived (Appendix B) to apply to the third mode of operation:
ta mk-» ta s&+ ta ^ -** w12/
where Hq is initial hydrogen flow
Hf is unrecombined hydrogen flow
00 is initial oxygen flow
f is the ratio of Ho/% for a run in the same bed at the
same temperature, pressure, and total flow rate with
hydrogen diffusion controlling throughout.
x Is a constant depending on the relative diffusivities of
hydrogen and oxygen in steam, x= (B? )\D0/
For a given run, values are obtained experimentally for Ho, Hf, and 0o.
The quantity f may also be determined experimentally, and was done so during
the early development of the method, by operating with enough excess oxygen so
that hydrogen diffusion was controlling throughout the bed.

31 -
For a series of runs, at constant temperature, pressure and total flow
rate, a log-log plot is made of ° vs.20©~Ho 20o-Hq
(1), this should result in a straight line of slope x, with an intercept when
is zero of (*~1)
Hf.. According to equation
In °o20o-Ho
f(iy. Such a plot for the runs of Figure 7 is shown
in Figure 8. The two lowest points have a considerable excess of oxygen, the
Dvg.21057
tf 1*.0o
oo
0.04 0.06 0.1 0.2 0.1* 0.6 1.0 2.0
Hf/(20o-Ho)
Typical Plot of vs, %200 - Ho 20o - Ho
Figure 8
k,0 6.0 10

- 32 -
third point is Just on the borderline of hydrogen diffusion controlling
throughout, and the uppermost point is in the region where oxygen diffusion
controls throughout the bed.
The runs for which equation (l) applies, those in which the diffusion
of both components is important, are seen to fall on a straight line whose
slope, x, is 2.09. This corresponds to (Dh/D0)"°°5, based on literature
data*. The agreement of the experimental exponent with the theoretical one
of 2/3 Is believed to be excellent, since there is considerable uncertainty
in the dlffuslvity data and also in the theoretical exponent.
The Intercept of Figure 8 indicates that f equals 9.1. The value of
f obtained experimentally from the lowest three runs shown varies from 9.1
to 9.7.
Another observation may be made from the slope of Figure 8. The O2/H2
ratio at which the recombination levels off should be x/2, the ratio which Is
shown in Appendix B to be the demarcation between oxygen and hydrogen con
trolling. The value of x/2 from Figure 8 is 1.05; in Figure 7, the
recombination levels off Just above 1.
* The hydrogen-steam dlffuslvity Is listed in the International CriticalTables. The oxygen-steam dlffuslvity was obtained by a minor correction onthe air-steam dlffuslvity of ICT, using the Gilliland equation. Thetheoretical 2/3 exponent is based on the Chilton-Colburn mass transfercorrelation. Both Gilliland equation and Chilton-Colburn correlation arefound in Hougen and Watson, "Chemical Process Principles", Vol. 3>Chapter XX, John Wiley & Sons, New Tork (19^-7).

where:
- 33 -
The consistency with which the experimental data fit the correlation
strenghtens the contention that the recombination is diffusion-controlled.
Figures 9-12 are plots of °o vs. H* at temperatures ranging20o-Ho 200-Ho
from 231 to 515°C. and pressures of 30 to 110 psia. The flow rate was
maintained close to 13.2 standard cfm. The slopes of all the lines are close
to 2.1.
The variation of reaction rate with temperature and pressure can best
be seen in Figure 13, which is a graph of mass transfer coefficients with
temperature and pressure parameters. The coefficients, which are hydrogen-
controlling, are calculated from the plots of Figures 9-12 by means of the
following equation:
M(ho-hf) = % A A h^ (2)
which simplifies to:
% -MIn (hp/hf) =MIn f (3)
M is total mol flow rate, lb. mol/sec.
ho and hf are initial and final hydrogen mol fractions
Kh Is hydrogen mass transfer coefficient lb. mol.8ec.ft.2(mol. fraction)
A is total area of catalyst pellets, ft.2
Ahjjg is log mean mol fraction driving force with hydrogenconcentration at catalyst surface being zero.
t is ho/hf defined previously under equation (1).

o
O
- 3^ -
Dwg. 21058
3.0 1 -1— I i i i
TEMPERATURE 23I°CFLOW RATE 13.2 scfm
O 30 psia7 50 psia0 80 psiaA 100 psia
Zt«**<
i*"
-
<s*-
- -
i 1 i i i i
2.0
o
XI
o
31.0
0.8
0.6
0.5.05 .06 .08 .10
PLOT OF
0.2H,
200-H0
FIGURE 9
Op20o-Ho
vs200-Ho
0.4 0.6 0.8 1.0
AT 231°C

o
O
3.0
2.0
to
OOJ
1.0
0.8
Q6
05.05 .06
- 35
)wg. 21059
1 1 1 I 1—r„.
TEMPERATURE 347°CFLOW RATE 13.2scfm
O 30 psia7 50 psia0 80 psiaA 100 psia
-
-
-
-
1 1I i i
,
.08 .10 0.2Hf
04 0.6 Q8 1.0
20o-Hf
FIGURE 10
PLOT OF VS20o-Ho 20o-Ho
Hf AT ^3T°C

.05 .06
- 36
Dwg. 21060
200-H0
FIGURE 11
PLOT OF °° VS Hf AT ^32°C20o-Ho 200-Ho
0.6 08 1.0

o
O
- 37 -
Dwg. 21061
3.0
2.0
o
OOJ
1.0
0.8
0.6
0.5.05 .06 .08 .10
1 1 1 l 1 1
TEMPERATURE 515°CFLOW RATE 13.2 scfm
V 30 psia0 50 psiaD 80 psiaA 100 psia
--
-
-
1 1 i l i,
0.2 0.4 0.6 0.8 1.0
PLOT OF
H2
200" H0
FIGURE 12
Op200-Ho
VS Hf AT 515°C20o-Ho

-38-
It can be seen that the mass transfer coefficients (recombination rates)
increase gradually as the temperature Is increased, at temperatures above
300 °C. The kinetics at 231°C appear to be abnormally low, indicating
probably that the chemical and adsorption kinetics on the catalyst surface
are coming into play. The theoretical coefficients (Appendix C) are also
plotted in Figure 13, and they increase slowly with temperature.
The effect of pressure on recombiner efficiency appears to be that
Increasing pressure aids recombination, particularly close to atmospheric
pressure. At 100 psia. the effect of pressure change appears to be much
less; perhaps the mass transfer coefficients are approaching an asymptotic
value. Diffusion theory predicts a mass transfer coefficient independent of
pressure. The experimental dependence may be explained by postulating
multimolecular layers of the non-controlling diffusant adsorbed on the
platinum surface, through which the controlling diffusant must travel. Since
the resistance of such a layer might change very little with pressure, the
relative resistance of the layer and the true gas film might be negligible
at high pressures, but appreciable at the pressures of the current investi
gation.
Figure Ik shows the change in hydrogen mass transfer coefficients with
flow rate, at constant temperature and with a pressure parameter. The
curves are parallel to the theoretical diffusion-controlling curve, but they
lie about a factor of three below the theoretical. It is believed that
channeling can account for the discrepancy.

12
o
ECM
220
PRESSURE (psia)
O 30A 50D 80V ioo-iio
FU3W RATE (scfm)
13.23
260 300 340 380 420
TEMPERATURE (°C)
460
FIGURE 13
HYDROGEN MASS TRANSFER COEFFICIENTS AS A
FUNCTION OF TEMPERATURE AND PRESSURE
500 540

25.0
20.0
o
e
CM
ol0.0
o 8.0E
roO 6.0
4.0
- 1+0 -
wg. 21063
"T"" 1
THEORETICAL
—i— 1 1—
'
-
TEMPERATURE psia
A 400°C 25(GAVEN) -O 399°C 100D 399°C 50
- -
-
A
> y -
-
0/G^ -
-
1 1
*^
I 1 i "3.050 6.0 8.0 10 20
FLOW RATE (scfm)
40 60 80 100
FIGURE Ik
HYDROGEN MASS TRANSFER COEFFICIENTS AS A
FUNCTION OF FLOW RATE

- 41 -
Normal channeling in a bed of granular particles where the particle
diameter is 1/8 the bed diameter causes a decrease in the friction factor
of O.67*. Since the friction factor is proportional to the mass transfer
coefficient, according to the heat transfer-mass transfer-momentum transfer
analogy, the same change would occur in the mass transfer coefficient. The
test bed was further handicapped by a large thermocouple well, and entrance
and exit distributor plates with a small amount of hole area.
A better bed, also in a 1-in. pipe, but with no thermocouple well, was
tested by Gaven, et. al.** This bed contained an entrance screen of high
porosity and no exit screen. The major portion of their investigation was in
the oxygen-diffusion controlling range, but one point in the hydrogen-
controlling range, based on the average of three runs, is plotted on Figure
14. Although the Gaven point is at lower pressure than the curves of the
present Investigation, the mass transfer coefficient is about twice as high.
Combining the probable effects of normal channeling and abnormal channeling
Introduced by poor bed design, the experimental results of the present
Investigation are brought quite close to the theoretical mass transfer
predictions.
* Perry, "Chemical Engineers' Handbook", 3rd edition, p. 39^, (1950)
## Gaven, et. al., op.cit.
- 42 -
In order to evaluate the relative recombination rates of deuterium and
hydrogen, a series of carefully controlled runs were carried out at 350°C. and
50 psia. varying the amount of excess oxygen. These are plotted in the usual
manner in Figure 15. The deuterium line is seen to fall below the hydrogen
line, which is expected because of its lower diffusivlty. However, the slope
of the D2 line, which remains 2.1, according to the theory developed
previously should have decreased to about l.fk.
Its failure to conform to the predicted slope may be caused by the
catalytic exchange reaction, D2 + EgO = ED + EDO = H2 + D2O, which occurs
quite rapidly on a platinum catalyst. This side reaction should have been
quite important in the oxygen-diffusion-controlling range, where an adsorbed
D2 would find an H2O molecule much quicker than an O2. It is believed that
in a heavily oxidizing region, such as the platinum surface in the deuterium
controlling range, the exchange reaction was retarded considerably. Nothing
quantitative can be gained from this speculation; apparently the D2 Von*
should have been carried out with a D2O diluent rather than the normal steam.
It is possible to calculate a deuterium mass transfer coefficient
for the run shown in the lowest point of Figure 15, which was deuterium-
controlled for the entire bed. The table below compares the predicted and
observed mass transfer coefficients for deuterium and hydrogen. An oxygen
mass transfer coefficient, obtained in the same series of hydrogen runs, is
also listed.

o
O
43 -
Jwg. 21064
5.0
4.0 PRESSURE
1
SOdsio
1 1 r-
TEMPERATURE 350°C
RUN FLOW RATE
0 H2 961 scfmD D2 9.67scfm
)^X^
-
i I i i
-
o
X
'o2.08
1.0
OS0.1 0.2 0.4
H<06 0.8 1.0
200-H0
FIGURE 15
COMPARISON OF HYDROGEN AND DEUTERIUM DATA
2.0

- kk -
Mass Transfer Coefficients, Lb. Mol/Sec. Ft.2 (mol fraction)Temperature-350oC- Pressure-50 psia.- Flow Rate- 9.65 scfm.
Observed Predicted Observed
Diffusant Coefficient Coefficient Predicted
Eydrogen 3.52 x 10*3 13.05 x 10"3 0.270Deuterium 2.58 x 10"3 10.72 x 10⁻³ 0.240Oxygen 2.05 x 10⁻³ 5.78 x 10⁻³ 0.355
Based on the hydrogen diffusion, the deuterium diffusion was somewhat
poorer than expected and the oxygen diffusion somewhat better.
Reliability and Possible-Sources of Error
The possible sources of error in this work lie predominantly in the
flow measuring devices. One major exception to that generalization is the
seriousness of a leak of any kind in the high pressure system. Early In the
experimentation a leak did develop, but it was stopped, and great pains were
taken to see that no others developed. There are several concrete check
points which do testify to the lack of a leak in the system during the
operations which led to the data reported herein. First, the presence of
a leak would cause the apparent effect of pressure on recombination to in
crease with increasing pressure rather than decrease as was the case. Also,
pressure control, recombiner temperatures and variations in pressure drop
through the bed were of such consistency as to give confidence in the
tightness of the system.

- 45 -
The E>> analyser was found to be sensitive to very small changes in
H2 concentration, and the air metering systemwhich measured the diluent air
into the system was found to be reliable. Furthermore, the H2 analyser
was recalibrated a few times each day, and no drift was discovered, testifying
to the validity of H>> off-gas measurements.
The H2, O2 and air meters were all calibrated by a wet test meter, and
are believed to be accurate within 2 or 3 percent. The steam orifice was
calibrated by weighing condensate, and it is believed that an error of
several percent is possible in the steam measurements. Furthermore, the
steam measuring system has been known to accumulate some condensate, and this
condition caused occasional errors in measurement. In fact, the space
velocities for two of the points (they are asterisked In Appendix E) in the
flow rate data were calculated from the recombiner temperature and the
H2-O2 flow because the steam flow measured was In doubt and unreasonable,
and pressure drop data also lent support to the calculated rather than the
directly measured values for steam flow.
The pressure measuring device had a drift of several psi. throughout
a day's operations, but showed no permanent drift.
Conclusions
1* It is concluded that diffusion of hydrogen and oxygen to the
catalyst surface is the controlling resistance to the recombination. The
design of an actual bed operating at temperatures above 300°C. may be
calculated on the basis of the usual Chilton-Colburn correlation for mass
transfer. Care should be taken that channeling is minimized; If this is
done then a safety factor of 2 in the thickness of the bed is considered
very conservative for all operating pressures.

- k6 -
2. For temperatures below 300°C, chemical and adsorptive rates enter
into the picture. The safety factors for bed design should be increased In a
manner consistent with the data of this investigation. For temperatures
below 230°C, for which no quantitative data are available, additional
experimental work is required to permit good design.
3* The difference in the recombination rates of deuterium and hydrogen
is attributed to the difference in the diffuslvities. The chemical and
adsorptive activity of the two appear to be comparable for the catalytic re
combination.
k. Because of the lack of experimental information, no conclusions as
yet are made on the effect of fission product poisons,or the life of the
catalyst. In the two months of intermittent operation, no deterioration of
the catalyst was observed, although there was an accumulation of rust.
Future Plans and Recommendations
1. It is planned to operate a high pressure recombiner loop. The
objectives of this system are to investigate the life of the catalyst and the
structural materials at ISHR design pressure and temperature, and to confirm the
tentative recombiner design based on the diffusion-controlling mechanism. The
relative severity of explosions at varying deuterium (or hydrogen) to oxygen
ratios will be evaluated.
2. It is planned to evaluate experimentally the amount of iodine poisoning
likely to occur in the ISHR system.

-47-
3. It is planned to operate a small-scale system simulating the ISHR,
to test the relation between the various components involved in the gas
system. Startup procedures will be defined.
4. For other investigators of the H2-O2-H2O catalytic recombination,
it is suggested that additional information on the reaction should be obtained
in the hydrogen-rich region. This was not done here because it is outside
the ISHR specifications.

- 48 -
CHAPTER III
THE DEVELOPMENT OF AN EXPLOSION PROOF, AUTOMATIC LOAD ADJUSTING,FLAME RECOMBINER
Summary
The advantages, possible uses, and operating characteristics of a new
type, safer, lower temperature flame recombiner are described. It is
particularly adaptable to reactors where the radlolytic gases that are
evolved are associated with large quantities of steam such as in a boiling
reactor. Due to a lack of time, the information reported here is mostly
qualitative, but the method definitely has been proven valid.
Introduction
McLeod et al , found that H2-O2-steam mixtures containing less than
25 percent 2H2 + 02 in a pipe would arrest the explosion of a combustible
mixture of the gases elsewhere in the system. In a boiling reactor, the
radlolytic gases produced are expected to be only about 1 percent of the
steam volume concurrently evolved. The total volume depends upon the power
level of the reactor. It was reasoned that as the steam-gas mixture
travelled up the condenser which is used to remove power from the system, the
mixture would eventually lose enough steam to become combustible. The
location of the first combustible gas would depend upon the power level of the
reactor. It follows then, that if one could distribute Ignition sources
* H. M. McLeod et al, Recombination of Stoichiometric Mixtures of H2 andO2 in a Flame Recombiner (Feasibility Report), ORNL, Y-706, 1951.

49 -
(for example spark plugs) throughout the condenser, wherever the gas became
combustible it would burn, and the noncombustible front directly behind the
flame would protect against flashbacks. In order to test the validity of this
idea, a column containing alternating cooling coils, and spark plugs was
constructed, and means were provided to add steam, E% and O2 to the column,
and to remove water from the bottom and unrecombined gas from the top.
The Apparatus
A drawing of the apparatus is shown schematically in Figure 16, and a
detail of a section Is shown in Figure 17. The cooling colls, of course, serve
to condense out part of the steam admitted, the spark plugs to provide an
ignition source, the thermocouples to indicate the temperature at various
points in the system, and the sight glasses to allow visual observation of the
combustion. A 3-inch thick plexiglass shield was placed directly in front of
the apparatus to protect operators in the event of an accident, of which there
were none.
The steam, %, and O2 vere metered into the system through calibrated
orifices - the same ones described in Section II of this report. Pressure was
controlled by adjusting the O2 excess and the opening of the remotely operated
valve, at the upper outlet of the column, and the condensed water was allowed
to flow through a valve at the base of the column, the valve operation being
controlled by a differential pressure cell which was activated by the water
level in the column.

LEVELCONTROL
50 -
DRAIN
FIGURE 16
EXPERIMENTAL FLAME RECOMBINER FLOWSHEET
Dwg. 20117 RI
02, 1^ a STEAMMIXTURE

1. WINDOW
2. THERMOWELL
3. SPARK PLUG
4. CONDENSER TUBE OUTLET
5. INLET CONDENSER HEADER
FIGURE 17
EXPERIMENTAL FLAME RECOMBINER
H

- 52 -
The H>> analyser described in the previous section was also used in this
work. Diluent air was admitted downstream from the pressure control valve.
The spark Impulse was generated by an automobile battery charger, connected
In series with an induction coil; the spark was distributed to the 12 plugs by
a Lincoln distributer driven by an electric motor. The spark gap was adjusted
to l/8 inch. The plugs were protected from shorts, due to water dripping on
them from the condenser colls above, by a sheet metal shield located just
above the spark gap.
Operating Characteristics
Noncombustible mixtures of H2, O2 and steam (usually containing about 5 to
15 percent Eq) were admitted to the bottom of the column described in the
previous section. The column's temperature profile could be directly attributed
to the partial pressure of steam at the position of the thermocouples in the
column from the bottom thermocouple up to thermocouple Ho. 6 (the thermocouples
are numbered from the top). That is, the bottom two or three were at the same
temperature, that being the boiling point of steam at column pressure; and the
next few points were somewhat lower due to the reduced partial pressure of
steam in the system.
However, thermocouple Ho. 6 began to rise sharply upon the introduction of
H2 to the system, as did the thermocouples Ho. 5 and Ho. k, immediately above It.
Gas flow, which at first vas less than one cfm (STP) of 2H2 + 02 (plus a slight
excess of O2), vas then gradually Increased until the flow of H2 and O2 reached
9.6 cfm. At no point during the transition from less than one to 9.6 cfm of

- 53 -
2% + 02 flow were any pressure surges or other types of instability noticed
in the system. Furthermore, once the flow reached 3 cfm, the maximum
temperature appeared to have been reached in the system.
With a flow of 3 cfm of 2H2 + 02, a temperature of 320°C was noted at
thermocouple Ho. 6, the temperatures below that corresponding to partial
pressures of steam as described earlier, and the temperatures of the
thermocouples above ranging from a little above 200° down to about 50°C. As
the flow vas increased, the temperature at Ho. 6 was seen to remain essentially
constant, and the temperatures of thermocouples 1 through 5 rose considerably
until they were all above 150°C.
All during this period, the column was being operated with a slight
excess of O2. The column pressure was maintained at approximately 60 psi by
throttling the outlet valve at the top of the column. The H2 analyser Indicated
a recombiner efficiency of 99•5 to 99.98 percent, depending upon the amount of
excess O2 used. It was decided that if stoichiometric gas could be admitted
to the system, and the valve at the top completely closed off, It might be
possible to obtain recombiner efficiencies of 100 percent.
This vas done, with the capacity remaining about the same. It was, of
course, Impossible to obtain exactly stoichiometric mixtures of Bg and 02, so
the column vas operated between 50 and 70 psia pressure, the pressure rising
vhen an excess of 02 vas being admitted, and falling when H2 flow vas in
creased. This somewhat questionable procedure proved to be satisfactory over
relatively short periods of operation, but would doubtlessly become quite
trying If the period of operation were to be Increased to several hours.

-5*-
During the total recombination operation, it was noticed that
thermocouple Ho. 1, the one at the top of the column eventually became
hottest — 350°C. This may be explained by recalling that during open
operation of the column, the amount of unrecomblned Ejj increased with in
creased excess 02* Apparently, combustion of the gases in the presence of
a diluent is incomplete. At high flows of combustible gas, the H2
concentration in the noncombustible residue at the top of the column in
creases quite rapidly, and as a result there is enough combustion at the
Ho. 1 spark plug to maintain a relatively high temperature in that region.
A sample curve of gas flow vs. thermocouple temperature is shown in
Figure 18. This curve is not exactly reproducible due to inability to
exactly duplicate conditions.
At no time during the operation of this machine was a visible flame
established at any point; and the operation was completely free of flashbacks.
There were occasions when burning was observed in "noncombustible" regions,
but this may be explained as being due to channelling effects, and such
combustion was definitely not extensive. The dependence of the column on a
noncombustible front for smooth operation was displayed as the result of an
accident during one period of operation. The valve at the base of the column
failed to operate properly, and a sizeable leg of water built up in the column;
the bottom six condensing coils were covered. The result was that the column
of water was cooled by the cooling water circulating through the colls, and
steam was in turn removed from the gas bubbling through the column of water
present In the bottom of the column. Ho longer were small amounts of gas
being burned while the whole mixture was still noncombustible, and no longer

400
- 55 - Dwg. 21066
FLOW RATE OF 2H2+ 02 (scfm)
FIGURE 18
FLAME RECOMBINER TEMPERATURE VS. GAS FLOW RATE

- 56-
were there spark plugs every few inches which could ignite the gas as soon
as the mixture became combustible. Instead, the gas leaving the water leg
vas highly combustible, and a series of explosions ensued.
The gas flow was left on while attempts were made to reopen the valve
at the column's base, and meanwhile the explosions continued and became
worse. The explosions were not only evidenced by mild pressure surges,
(mild due to the slowness of the pressure Instrument) but persistant orange-red
flashes could be seen through the sight glasses as well. When it became
obvious that the valve trouble would not be quickly remedied, and that as the
column of water continued to rise the explosions would become more violent,
the apparatus was shut down.
Conclusions
This type of recombiner will certainly operate satisfactorily and is
definitely applicable to boiling reactors in general and the proposed "teapot"
In particular. Additional and more quantitative testing is necessary, and
certainly a combustion apparatus of this type must be tested at high pressures
before being used in a reactor. However, its usefulness and applicability have
been demonstrated by this work. It will probably be necessary to use some
other type of ignition source in higher pressure work, but this is not an
insurmountable problem.
Acknowledgments
To Robert Gamble, Paul R. Kasten, R. H. Lyon, E. R. Baxter, Royce Goodman,
V. B. Pike, Cecil Hubbard, Harold Gutherie, W. p. Walker, and J. R. XcWherter
for able and enthusiastic assistance.
/a*

- 57 -
APPENDIX A
A Catalytic Combustion Hydrogen Gas Analyser
Description of the H2 Analyser
The analyser consists of two sensing cells and a cell block as shown in
Figure 19* The first cell is an active element with an electrically heated
platinum wire, while the second cell is a reference element of alumel wire
also electrically heated.
Each of the elements, which are in series in the gas stream, has a
thermocouple spot welded to the center of the heater wire. The heaters are 10
mil diameter wire and the thermocouples are made from 12 mil chromel-P and
10 mil nickel wires. The aluminum cell block is k l/2 x 2 x 2 inches and the
sensing cells are 1 l/k x 1 x 1 1/2 inches over-all.
Operation
Figure 20 is a schematic diagram of the complete analyser system. A
sample stream is taken from the process line, dried by passage through a
calcium sulphate bed, and then introduced into the cell block. A constant
differential pressure relay and needle valve are used to hold the flow through
the cells at approximately 0.6 CFH.
Figure 21 is a schematic drawing of the heater current control and thermo
couple circuit. To place the analyser in operation, the platinum wire current
is adjusted to approximately 3 amperes and then the alumel wire current is

SENSING CELL
CELL BLOCK
FIGURE 19
UNCLASSIFIEDDwg. 21067
SENSING CELL AND CELL BLOCK FOR A CATALYTIC
RECOMBINER HYDROGEN SYSTEM
CD

UNCLASSIFIEDDwg. 21068
CONSTANT DIFFERENTIALPRESSURE RELAY
ACTIVE CELL-REFERENCE CELL-
"C" CLAMPROTOMETER
FIGURE 20
SCHEMATIC DIAGRAM OF THE ANALYZER SAMPLING SYSTEM
VJl

> I
rwoinpT-2
IflJUUUL) t-4
PLATINUM
HEATER WIRE
> *
115 V AC REGULATED UNCLASSIFIEDDwg. 21069
Tnnnnr>T
iT-3
T-5 UflflftflJ
jwjtoi
ALUMEL
HEATER WIRE
w^UmvX
FIGURE 21
SCHEMATIC DIAGRAM OF THE HEATER CURRENT CONTROL
ONO

- 6l -
adjusted until the two thermocouples, which are connected in parallel
opposition, are at the same temperature with no hydrogen present in the gas
stream; with equal wire temperatures, the net output of the thermocouple
circuit is zero. When uncombined hydrogen and oxygen are present in the gas
stream, the hot platinum wire will catalyze the exothermic recombination
reaction of a small amount of the gas and the platinum wire temperature will
increase. Since no recombination takes place on the alumel wire, the two
thermocouples will be at different temperatures and a millivoltmeter in the
thermocouple circuit will indicate the difference in potential between them.
This potential is then related to the percentage of hydrogen in the gas by
calibrating the analyser with known quantities of gas from an electrolytic
cell.
Calibration
Figure 22 is a calibration curve obtained with a total flow of 0.6 CFH
through the analyser cells, and a platinum wire current of 3.0 amperes and
an alumel wire current of 1.8 amperes. Hydrogen and oxygen gas in a stoichio
metric ratio for calibration was obtained from an electrolytic cell consisting
of two steel plate electrodes in a 15 percent sodium hydroxide solution. The
calibration on such a cell is 0.0037 SCFM of 2RV> + O2 total gas liberated for
10 amperes of direct current through the cell.
For purposes of the calibration, the diluent air stream was passed through
the electrolytic cell to reduce the effect of a possible leak. Checks against
cell leaks and non-linearity were made by changing both the gas production and
diluent air flow, and observing any differences in analyser readings - there
were none.

LlJ 4
oorQ
- 62 -
UNCLASSIFIEDDwg. 21070
2 4 6 8
DETECTOR OUTPUT (millivolts)
FIGURE 22
A TYPICAL ANALYZER CALIBRATION CURVE
10

-63-
The analyser as described has a useful sensitivity of l/k percent hydrogen
as determined by drift on weekly checks.
Recorder
The recorder used was a Minneapolis-Honeywell self-balancing potentiometer
with a range of 0 to 1 millivolts. The range was extended in one millivolt -
steps by use of an external suppression circuit.
The platinum cell and cell block were developed by Dr. S. B. Spracklen
of the Carbide and Carbon Chemicals Company and are available from the Davis
Emergency Equipment Company, Newark, N. J., as Code 11 thermal conductivity
units. The alumel reference cell can be fabricated from a platinum cell by
replacing the platinum wire with alumel.
Acknowledgment
The authors wish to thank Mr. D. S. Toomb of the Reactor Experimental
Engineering Division, Instrumentation Section, Oak Ridge National Laboratory,
for permission to use this section of his paper, "A Catalytic Combustion
Hydrogen Gas Analyser", and for developing this analyser which proved to be
both convenient and dependable.

- 6k -
APPENDIX B
Derivation of the Equation Relating Recombination Efficiencyto Eydrogen-Oxygen Ratio
Assume a catalytic bed with uniform lateral mixing, no longitudinal mixing
and no channeling. Assume also that diffusion of E2 and O2 to the catalyst
surface is the only factor determining reaction rate.
A slug of steam containing dilute amounts of Eq and 02 enters the bed. The
amount of O2 is slightly in excess of the stoichiometric ratio. Since 02 is the
slower-diffusing gas, it controls the reaction rate in the initial portion of the
bed, and its diffusion may be expressed
dO
where
« -Ko A60 (1)
0 is the concentration of O2 in the gas stream
© is time
Kq Is the mass transfer coefficient for O2
A is the catalyst area in contact with the slug of gas
AO is the concentration difference across the film
If it is assumed that the O2 concentration at the catalyst surface is close
to zero, then equation (1) may be written:
g -"Kb AO (2)As the gas passes through the bed, recombination occurs and the hydrogen-
oxygen ratio decreases until at some plane 1, hydrogen diffusion begins to
control the kinetics. For the remainder of the bed:
j| -% AH (3)where H replaces 0 in equation (2).

-65-
Integrating equation (2) between entering plane 0 and plane 1, and
equation (3) between plane 1 and final plane 2:
0o5;
E
ln^=K0A©0.1 (k)
In fi = KH A ©i.2 (5)E2
where the subscripts o,l,2 refer to the respective planes.
For a system possessing a constant Reynolds number and assumed constant
density and viscosity:
'DE\n5" v
-GO"
where Dh and D0 are the dlffusivlties; of E2 and 02> respectively,
n is an exponent of 0.6 to 0.7; according to the literature.
Substituting (6) into (k), adding (k) and (5), and simplifying by letting
IP" ^I*rp ^I-°0-l +̂ 1-2 -H (7)If H2 diffusion controlled throughout the bed (low Ho/0o), equation (5)
may be written:
lnl°!~KHA9t (8)
where
©t is the total time in the bed
E* refers to hydrogen concentration in a bed
where hydrogen diffusion controls throughout

-66 -
For a given Reynolds number, temperature and pressure, ©•& is a constant,
and equating ©t in (7) and (8):
1 in^=^_ln°o+ 1 to HlKga E2* ~ KgA ""* 0X T KgA ""* E2
If Eo*/H2* is called f, this simplifies to:
1 °1 Hi
Furthermore, at plane 1:
KbOx = 0.5 KgH-L or 0X =| Ei (10)
Also,
o± « 0.5 Ex + 00 - 0.5 Hq (11)
from a material balance.
Combining (9), (10) and (11) and simplifying:
The quantities E©, 0o and E2 are measured experimentally. When H2
20q-Eq0o
is plotted against , ° on log-log paper, for a series of constant flow-20q-Eo
pressure-temperature runs, a straight line of slope x should be produced. Further
more when 2 is 1 (logarithm is o), Eq = (x-l)x~ # Vja±9 anows the
(5)evaluation of f, which may be checked experimentally by runs with high excess
oxygen.
-6T-
APPENDIX C
Theoretical Calculation of Recombination with
Diffusion Controlling
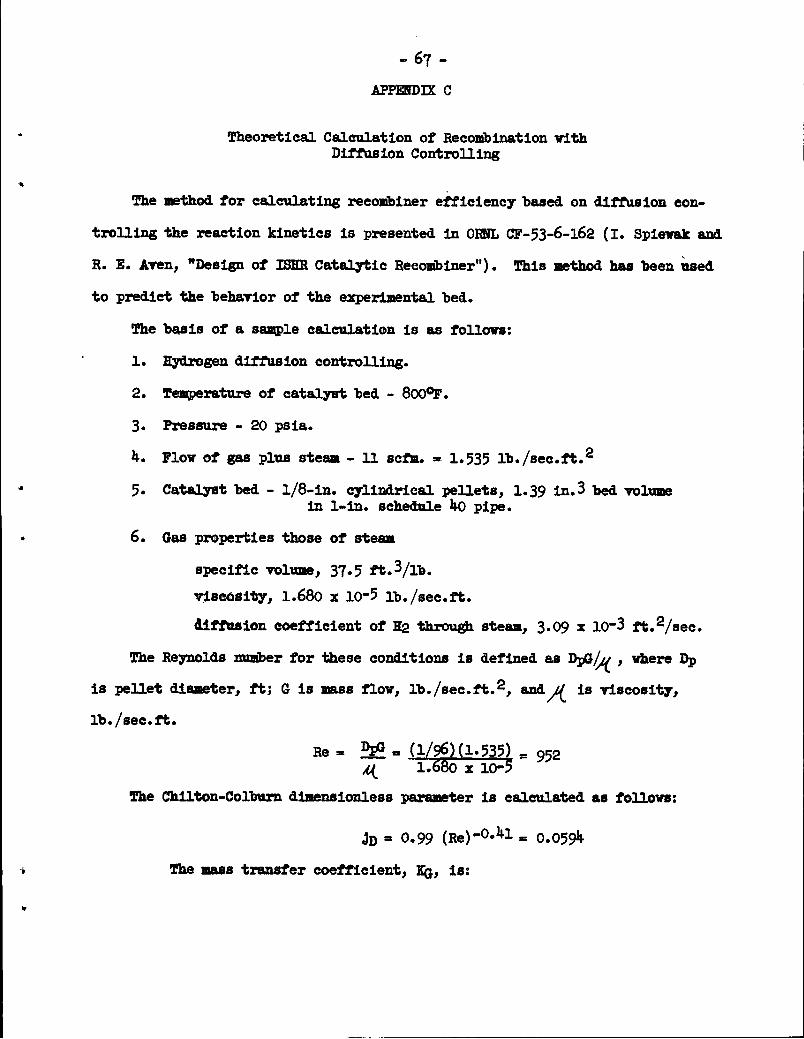
The method for calculating recombiner efficiency based on diffusion con
trolling the reaction kinetics is presented in ORNL CF-53-6-162 (I. Spiewak and
R. E. Aven, "Design of ISHR Catalytic Recombiner"). This method has been used
to predict the behavior of the experimental bed.
The basis of a sample calculation is as follows:
1. Hydrogen diffusion controlling.
2. Temperature of catalyst bed - 800°F.
3. Pressure - 20 psia.
k. Flow of gas plus steam - 11 scfm. » 1.535 lb./sec.ft.2
5. Catalyst bed - l/8-in. cylindrical pellets, 1.39 in*3 bed volumein 1-in. schedule kO pipe.
6. Gas properties those of steam
specific volume, 37.5 ft.3/lb.
viscosity, 1.680 x 10⁻⁵ lb./sec.ft.
diffusion coefficient of H2 through steam, 3.09 x 10~3 ft.2/sec.
The Reynolds number for these conditions is defined as DpG/^y , where Dp
is pellet diameter, ft; G is mass flow, lb./sec.ft.2, and U is viscosity,
lb./sec.ft.
Re - M - (1/96) (1-535) . 952AJ^ 1.680 x 10⁻⁵
The Chilton-Colburn dlmenslonless parameter is calculated as follows:
Jd = 0.99 (Re)-0*1*1 = 0.059*
The mass transfer coefficient, Kg, is:

- 68 -
%- Jd _6_ /_J2l2\2/3= (»059*)(1«535) f(1/37-5)(3-09 x10-3)1 2/3^ mpT \ijr-) (i8)(2o)L i.68xio-b J W
%=7.29xl0-* 2'g"01,^ see. ft.* psi.
where M is average molecular weight of gas stream
Pf is gas pressure, psi*
P is gas density, lb./ft.3
D is diffusion coefficient ft.2/sec.
The equation describing the mass transfer is:
gf-lQAAfUI (2)where AH/At is moles of hydrogen transferred per second
A Is the catalyst area in the bed
Afyj is the log mean driving force expressed as mol fractionhydrogen in gas stream
The amount of hydrogen transferred per second is also equal to the total gas
flow rate times the change in hydrogen concentration going through the bed.
Therefore, modifying equation (2):
" =m(f!-f2) - KqA 1%£2LAt In fi/f2
tari/fa- ^ (3)m
where *1»*2 BX^ mo1 fractions of H2 in and out of bed
m is gas flow rate, lb. mol./see.
Substituting into equation (3)
% = 7.29 x 10-* ™°i± = l.*6 x 10⁻² mol.sec.ft.Spsi. sec.ft.^(mol.fraction)
A = O.278 ft.2 for catalyst bed
m= 5.1 x 10-* lb. mol./sec.
-69-
fl/f2 = 2850
This ratio has been defined as f In the body of the report.
The theoretical amount of mass transfer for a given mass flow rate and
composition is independent of pressure. The variation in Kq with temperature
between the limits kOO°F and 1000°F is only 12#.

- 70 -
APPENDIX D
Table of Observed Mass Transfer Coefficients
Total Coefficient
Temperature Pressure
psia.
80
Flow Rate
scfm
ControllingDiffusant
Hydrogen
lb. mol.°C. sec. fi.£(mol.fraction)
232 16.27 2.70 x 10⁻³²^3 100 l6.*5 Hydrogen 2.52 x 10-3222 50 16.15 Hydrogen 2.63 x 10-3285 30 16.23 Hydrogen 2.65 x 10-3296 50 16.3 Hydrogen 3.01 x 10-3302 80 16.25 Hydrogen 3.10 x 10-3425 35 16.15 Hydrogen *.97 x 10-3*35 50 16.15 Hydrogen 5.38 x 10-3432 80 16.0 Hydrogen 5.98 x 10-3434 100 15.95 Hydrogen 6.44 x 10⁻³
423 30 13.33 Hydrogen
* V
*.87 x 10-3438 50 13.27 Hydrogen 5.3* x 10-3*39 80 13.27 Hydrogen 5.73 x 10-3427 110 13.2 Hydrogen 5.77 x 10-3516 80 12.98 Hydrogen 6.1k x 10-3516 100 13.08 Hydrogen 6.18 x 10-3507 30 13.17 Hydrogen k.66 x 10-3522 50 13.17 Hydrogen 5.73 x 10-33*7 50 13.17 Hydrogen *.69 x 10-33*2 30 13.27 Hydrogen *.08 x 10-33*8 80 13.23 Hydrogen *.03 x 10-3351 110 13.3 Hydrogen 5.19 x 10-3233 30 13.33 Hydrogen 2.38 x 10-3231 50 13.3 Hydrogen "2.19 x 10-3229 80 13.33 Hydrogen 2.15 x 10-3230 100 13.* Hydrogen 2.08 x 10⁻³
401 50 9.06 Hydrogen 3.51 x 10-3400 50 13.7 Hydrogen *.38 x 10-3396 50 17.1 Hydrogen 4.88 x 10⁻³*od 50 20.0 Hydrogen 5.12 x 10-3397 50 23.6 Hydrogen 5.*8 x 10⁻³

- 71 -
APPENDIX D (CONT'D)
Table of Observed Mass Transfer Coefficients
Total CoefficientTemperature Pressure
psia*
100
Flow Rate
scfm
ControllingDiffusant
Hydrogen
lb. mol.
OC sec.ft.^(1
3.68 X
sol.fraction)
398 8.81 10-3401 100 12.2 Hydrogen 4.60 X 10⁻³
399 100 l6.2 Hydrogen 5.78 X 10-3396 100 I8.7 Hydrogen 6.31 X 10-3395 100 20.8 Hydrogen 6.57 X 10-3398 100 23.3 Hydrogen 6.89 X 10-3396 100 21.8 Hydrogen 6.73 X 10⁻³⁴oo 100 16.4 Hydrogen 5.33 X 10⁻³⁴oi 100 12*7 Hydrogen 4.53 X 10-3395 100 8.25 Hydrogen 3.73 X io-3405 100 14.8 Hydrogen *.97 X 10-34oi 100 12.0 Hydrogen 4.41 X 10-3399 100 18.1 Hydrogen 5.80 X 10⁻³⁴oi 100 8.05 Hydrogen 3.59 X 10⁻³
350 50 9.61 Hydrogen 3.52 X 10-3350 50 9.60 Oxygen 2.05 X 10-3350 50 9.7* Deuterium 2.58 X 10⁻³

oo
10
8
ON
VO
IAO
CO
VO
Hr-i
H
r-o
t-
VO
CO
H
r-iH
f-i
co
t-v
oO
CU
IA
HH
i-t
CO
j*C
UV
OC
U0
rHr-i
t-i
oco
t-
CU
IAO
N
HH
H
00
ON
CO
H-tf
H
CU
HH
ON
HO
NO
CO
IA
rHri
t-{
*10
8H
CU
CO
0C
MIA
CU
ON
CU
IAC
UC
U
HC
-O
sH
CO
0O
HH
CU
t-O
HO
NV
O0
CU
HH
CO
CU
IA
00
t-co
HC
OV
O
HH
ON
CUC
OH
,IA
CU
H5
HCU
*o
<p
a
t-O
OH
CO
IA
t-C
OO
NO
OO
ON
IAV
OC
OH
OH
HH
IAC
UO
no
nO
oo
lA
C-t-
00
0
CO
IA
t—IA
CU
VD
t—V
OIA
OO
O
OIA
VO
PIh
h
OV
OC
UO
-IA
CO
ON
t—H
OO
OO
OEfficiency
ON
CO
VO
t-IA
CO
0O
OO
OO
ov
ocu
CO
HC
O[-C
OC
OO
Nt—
VQ
00
00
00
ON
CU
CU
VO
ON
OC
OC
OO
N
86.982.878.4
IA
CO
IA
CO
CO
ON
CO
CU
CO
ON
On
(j\
o°
•p<u
H1V
QO
OJ
3F
j*C
OC
OC
OC
O
OO
OH
CO
CO
J*
CO
CO
CO
CU
IAC
U•Z
t-Jfr
jj-C
OC
OC
O
CO
Jf-
sl-
CO
CO
CO
CO
CO
CO
0\0
\H
-3"
~T
-4*
OC
UO
CO
CO
CO
J*
J*
J*
qO
VO
Sn3.°-
CO
CO
CO
cu
.4-
0co
.3-
IAC
OC
OC
O
ON
OIA
J*
IA
j*C
OC
OC
O
ON
rHC
OJt
IA
IA
CO
CO
CO
IA
HC
Uco
cu
HIA
HO
NC
OJ-
CO
IA
Onj*
«sfCO
COJ&
J&JT
!H
•P3t-C
-CQ
J&J*
3IA
CU
CU
Jt"
-^*-S
TH
HH
HC
UC
UIA
IA
IA
HH
H
CO
CO
CO
VO
VO
VO
HR
H
on
qcy
HH
H
IAV
OIA
33
3C
UC
UC
UIA
IA
IA
HH
t-i
Pressurepsia
OO
OIA
IA
IA
OO
OC
OC
OC
OC
OG
OC
Oaaa
OO
OC
OC
OC
OO
OO
IA
IA
IA
GO
CO
CO
0III
00
cu
03
HIA
3-
IAIA
IAC
-V0
iaiV
-cu
lA
Jt
J*
sse
t-VO
IA
cu
vp
cq
IA
CJ
HIA
VO
b-
CO
OO
nH
CO
VO
t-VO
IA
<->
InletFlowRate,scfm>3
HIA
OO
NC
O0
0IA
IA
IA
&&
8V
OV
QV
Ot—
r—t—
IA
IA
IA
C—
0QC
QIA
IA
IA
ww
w
00
CO
00
Iaoo
cK0
00
0f—
§§
§.
§
12.112.112.112.112.212.1
12.212.212.112.212.212.2
co
00
on
...
11.811.811.811.811.811.8
1R
IA
Ha1
3I-7
2-

o°i
8
IA
CO
CO
IA
CO
HH
CU
OO
CO
IA
On
jJ;IA
VO
ia3
-cu
oC
OC
OJ*
CO
HV
OIA
IA
HV
OC
OH
OV
Ocu
OC
OIA
cu
co
VO
HIA
CO
CU
OH
CO
HH
Hr-\
r-iH
HH
HH
r-{H
Hr-i
t-ir-i
HH
HH
HH
HH
*•o
8
OO
nQ
IAO
njF
On
HH
O
9^t-O
IAlA
H-sJ-
OH
H
CO
H^
Ht—
j*-
0\V
OC
UH
OO
ON
CU
CO
HIA
CO
CU
HC
O
VO
t-CU
ia
ia
On
CU
HO
08H
HIA
HIA
Or-i
H
OC
OC
Ot-t-
HO
CU
OV
O0
0C
UC
KC
OIA
VO
•0_
a)a
dA
)i
^to
aC
OO
NO
OC
OC
Ot-
CU
IA
On
on
vo
On
HV
OIA
-*
HO
OO
ON
IAC
O
33
,3
IA
HO
ON
CO
HC
OC
-H
OO
CU
HJt
t-t-lA
-=f
IAV
OO
OO
IA
OO
CU
t-IA
OO
OC
U.*
33
3
Efficiency*
IAV
OIA
co
co
t-
Jt
IAO
NV
OO
NO
NC
OO
NC
OJ*
t-lA
VO
CO
CU
IA
ON
_*
ON
ON
ON
J*
co
cu
On
On
On
t—C
UC
O-s*
CO
On
On
On
VO
t-IA
CO
CO
CO
8S
n8
n-*
CO
CU
On
On
On
CU
iO
NO
NIA
HC
0V
OV
OIA
o
4>0)
1C
UC
UC
UC
Ot-t-
§3
3t—
On
On
Ch
5fS
88
8IA
IA
IA
On
CO
00
CO
O.*
CO
CO
CU
CU
CU
CU
'emperatureBed
t-O
IAC
UP
OC
UC
OIA
IA
HH
HIA
IA
IA
on
On
On
CO
OH
HH
IA
IA
IA
IA
IA
IA
IA
CU
CU
HC
UC
UC
UIA
IA
IA
ass
IA
IA
IA
IA
OO
HIA
IA
CU
IA
CO
-*
CO
CU
cu
cu
cu
t-ia
lA
Jt
IA
ON
ON
OIA
IA
IA
r-^H
H
ON
CO
CU
OJ*
IA
IA
IA
Ht-iH
H
HH
CU
-tf-tf
Jt
t-ir
*H
VO
V0
IA
33
3H
HC
UIA
IA
IA
HH
H
OO
33
3
1*aa§
lis
CO
CO
CO
CO
OO
OC
OC
OC
OO
OO
IA
IA
IA
co
co
co
oo
OO
OC
OC
OC
O
o
HIA
VO
ON
-*H
IAV
Ot—
CO
t—C
OH
CU
CO
CO
VOE—
P-COH
iO
t—C
Ot—
CO
CU
IA
E±
£cbco
co
t-
3o
Sia
CO
NO
VO
co
Jh
IAC
Ovo
c—co
ot-
co
co
cu
InletFlowRate,scfm
\~
/
<sg
gg
I—C
OIA
00
IAC
Oo
oO
nO
nO
nO
nO
nO
nC
aO
NO
IA
CU
-*
ON
t-V
OO
nO
nO
n
CU
CO
CU
Onco
op
oo
CO
co
OQ
5n&co
co
oo
H
§C
Ot-t-
33
3
CU
IAC
O
33
3
11.4U.311.4U.4
Jt-*
IA
h^Ih
co
co
co
IA
IA
33
b-t-f-
HH
H
Sid3
SII
CO
cu
duSi-7
3-

oi
CO
VO
cu
O^
3^
8V
OH
HO
-*ia
qC
U-tf
Ht-t-
HC
OC
OIA
CU
J*
00
00
t—IA
CU
HM
ittC
U-tf
CO
CO
t-C
UC
UIA
Oo
sH
HH
HH
HH
HH
<-i
HH
HH
HH
>-i
HH
CU
HH
HC
U
£J*
Ht—
OIA
OIA
HIA
IA
CU
OC
OH
CO
CO
IAC
OH
ON
t-H
VO
t-
co<&
O*H
CU
CU
CU
HC
UC
Uo
VO
CO
-sfrIA
t—3
-C
OC
O-srvo
jfCU
Htt«
w.-?
VO
j*IA
CO
J*
IA
-*
IAC
OC
OIA
IA
3-v
oIA
ON
IA
&H
OH
fla>
HC
OV
OH
HC
UIA
CO
HH
H
CU
CU
ON
00
HH
OJ
HC
UC
UC
U
CO
t-
CO
CU
CU
VO
CU
CU
CO
OC
OJ*
t-
CU
IA
Jt
ON
33
-*
J*
HC
UC
OIA
CO
IAC
UV
OC
OC
Ucu
t—
oo
«po
HH
CU
CU
CU
CU
CO
CU
CO
CU
CU
CO
HC
Otf
o&
««
gffo
Oj*
t-t-H
jjj-jjj*
OJ*
Ht—
CO
ON
CU
t-V
QV
Ot--*
t-
oo
oC
UC
O
o>
*.
OC
UO
N0
0C
Uo
oC
UO
CO
co
cu
ON
VO
CO
CU
Ht—
lAO
NJl-C
OC
OC
O•H
si
vo
vo
IA
IA
VO
vo
vo
VO
VO
VO
VO
VO
IA
IA
IAV
OV
OV
OV
OIA
vo
vo
00
t—
-
1m
t-O
NO
CU
OJ
CO
:C
UC
UC
U
IA
OC
OC
Ocu
cu
IA
-*
00
IA
IA
IA
CU
CU
CU
CO
HO
Q
CU
CU
IA
IA
ON
t-t-C
OC
UC
UC
Uo
nO
nco
CU
CU
CU
CU
CO
QO
QH
ON
CO
CU
CO
IA
t—IA
CU
CU
CO
oo
CO
CO
CO
HC
OC
OC
OC
OIA
OIA
CO
CU
HIA
t-C
Ut—
CO
ON
CU
IA
OO
On
CK
IA
OO
NH
If
<j)PCs
a>
cu
cu
cu
cu
cu
cu
cu
CU
CU
CU
cu
cu
CU
cu
CU
CU
CU
CO
CU
cu
CU
CO
-*
j*
EH
On
On
JtJfJ*
oo
IAV
OIA
HO
OO
NC
OC
Ucu
On
On
On
IA
IA
CU
-*
H
-*
j*
IA
IA
IA
vo
vo
IA
IA
IA
vo
vo
lAJ*
-*
-*
.*
JtJ
tJ
tIA
IA
•*."*•H
HH
rtrt
RR
HH
HH
HH
HH
HH
i-iH
rAH
HH
H
§05
CO
i-l
aid
OO
IA
IA
CO
CO
CO
88
00
OC
OC
OC
OO
Oo
qO
OIA
IA
OO
OC
OC
OC
OO
OO
IA
IA
IA
CO
CO
IA
IA
CO
CO
rH
HH
H
On
On
VO
VO
t—V
OIA
CO
CO
CU
IA
IA
CO
ON
OH
On
tA
t-J*
3$
IA
IA
IAV
O
oO
vp
oC
UC
Ot-t-
cu
cu
CU
CO
HIA
CO
CO
33
ftH
t—IA
.*3
5C
O3
fj*
t-C
OC
OIA
VO
VO
0OV
QH
VO
IA
IA
IA
CO
CO
t-
££
HO
CO
t-
cu
cu
CO
IAV
OH
VD
.9F
CO
CO
CO
ON
ON
IA
IA
Y^
pl
CO
cu
CO
OQ
IAC
Ot-
Ht-IA
co
vp
cp
t-lA
HC
OC
OH
VO
UN
•2.2
2•S
hH
H
InletRate,1Hq
co
co
CO
CO
IA
IA
IA
IAV
OIA
IA
t-t—
t-
t—
t-eo
t—t—
t-t-
t—vo
vo
t-t-
CU
CU
CU
CO
.*H
Hco
co
co
ON
OO
ON
O0
JC
O^5
•e
•0
.o
o0
o•
••
...
CU
33
33
33
3IA
IA
IA
IA
IA
IA
IA
Jt
Jj-
J*
jj-IA
IA
J*
IA
•*.•*,H
Ht-A
HH
HH
HH
i-i>
-\H
HH
HH
H
Jt
00
OC
UC
UC
O
4)
H•rl
Hd
4»
hh
biS
Pi
8"P
t
«<
<<
!
-74
-

Iw
oo
iooC
U
3tt
H-*
CU
VO
OC
UC
OO
N
CO
.*Jt
lA-*
VO
OO
NH
IAO
t—C
OC
OH
IAH
CQ
.*H
H-*
CU
CO
CO
OO
OO
HC
UC
UC
OC
UO
CU
IA
HC
O
CU
HH
HH
HC
OH
OO
HH
HC
UH
#•?oocu
CO
IA
co
vp
CO
OJ
CO
t-
lAC
UH
CO
HO
^H-S
oco
co
t—.*
IAC
O.*
CO
VO
ON
HO
NC
UO
NJt
VO
CO
t—H
CO
t-
ON
CO
.*O
IA
OO
NO
NC
OC
OC
UC
U-*
ON
t-
HH
HH
CU
VO
CO
OO
Hf,Un-recombinedEydrogenscfmV
OC
UC
OIA
CU
H
HO
OO
PO
HH
t-
cu
co
CJN
CO
OH
-*
CU
ON
CU
CO
HO
\t-IA
O.*
t—V
OO
CU
Ot-
CU
HC
UC
Oco
J*
-*.*
VO
CO
VO
CO
CO
OO
OO
OO
OO
OO
VO
HIA
t-C
-O
QIA
VO
VO
CO
OIA
OO
OH
On
Efficiency*
ON
IA
OV
OO
nO
nO
CU
HC
U-*
lAC
UO
t—V
OIA
VO
CO
00
CU
£3
ON
IA
CO
CO
ON
IA
co
co
ON
CO
IA
t—V
OH
IA
HO
NO
NC
OC
OC
OC
OC
OC
OC
—0
00
0C
OO
nO
NIA
OC
Ut-
t-
t-
t-
t-.
xe,°C1Outlet
oC
Ucu
cu
J*
.*
Hvp
CU
OJ
.*
jfr
cu
vp
OO
NIA
OC
O-*
IA
.*O
IA
CU
HH
CU
HH
HH
HH
CO
CO
CO
CO
CO
CO
CO
CO
CO
CO
IA
OO
OC
O.*
ON
HO
OO
CU
CO
CO
CO
CO
Temperatu1Bed
IA
IA
CO
CO
-*
-*
HC
UC
OC
O-*
-*
cu
C—
co
co
-*
-*
CUCU
OCU
HO
NC
QO
CO
IAIA
IAIA
IAIA
J*3F
JA
-*-*
CO
CO
CO
CO
CO
CO
CO
CO
CO
CO
OC
UO
IAC
OIA
IA
IA
.*.*
CO
CO
CO
CO
CO
•p
33
HH
.*
.*
IA
IA
HH
OO
NV
OIA
HH
HC
UC
OC
OC
OC
OC
OC
Ocu
olA
lA
lA
lA
IA
lA
IA
IA
IA
IA
OC
UC
UC
OC
UIA
IA
IA
IA
IA
Hi-i
HH
r-{
Pressurepsia
oO
IA
IA
<g<3§
§O
OO
OO
OO
OO
OIA
IA
IA
IA
IA
IA
IA
IA
IA
IA
OO
OO
OIA
IA
IA
IA
IA
o
CO
QC
OH
t-O
Nt-V
O
VQ
o.*
vo
t-VO
8#
33
^0
0^3
^C
O0
JC
UC
UC
UH
HH
CO
IA
VO
ON
CO
CU
t-
OJ
t—3
CUC
OC
OC
UC
UC
UC
U
InletFlowRate,scfm£3&
SIS3
*O
nO
v3
33
33
&K
&<
8<
8C
OC
OC
OC
OC
OC
OC
OC
OC
OC
O
On
On
CO
OJ.*
CU
CU
CO
-*
-*
co
co
co
co
co
H
§
14.414.3
CO
CO
-*
J*
HH
co
co
-*
Jt
33
on
on
on
on
on
on
on
on
on
on
On
On
Ov
On
On
to
On
H1
Hay22DeuteriumRuns
-75
-

Oo
*£
CU
OC
OC
Ucu
CU
CO
IAV
Oo
-*
CO
HO
tf\ON
t—C
OC
OC
UO
NH
CO
IAH
IAIA
IAV
OC
OC
OO
IAH
*O
OO
*
OV
OIA
-*
*O
jCJNCO
C—VO
IAVOt—
COIA
t—ONVO
*
recombinedEydrogenscfmO
OH
HC
U
VO
CO
OO
IAt—
t—IA
t-fO
O*
OC
OC
Ut-IA
CO
VO
ON
IA
-*
CU
IAC
OO
CO
t—C
OH
t—C
UO
VO
CO
OJ
OO
OH
HH
HH
OO
HO
HO
1Efficiency
CU
CO
ON
.*H
00
VO
CO
t—O
NO
CO
CO
CO
*V
OO
N*
H
QlA
HC
OIA
ON
CO
CO
t—t—
HO
NC
QV
Q*
CO
*IA
CO
CO
VO
CO
IAC
OO
NC
OC
O0
0C
OC
OC
OC
OC
OC
JNC
OC
OC
OO
N
e,°C1Outlet
t—t—
t—t—
c—C
OC
OC
OC
OC
O
Oj*
IAIA
CO
HC
UC
OO
nO
CU
ON
On
CU
IAIA
VO
t—V
Ot-C
OP
-VO
VO
COV
OC—
VOC
On
oco
co
CO
CO
CO
CO
CO
CO
CO
CO
CO
CO
1H
OV
OO
On
q5
on
qt-
**
CO
.*C
O
CO
HO
NV
OIA
CO
VO
QH
IA
IA
HO
nH
oS
qO
NO
SO
NO
So
So
QO
NQ
QO
NQ
CO
.*C
OC
OC
OC
OC
OJ*
*C
O.*
*C
O*
IB
OC
OIA
IA
*IA
IA
IA
IA
IA
r-iH
r-iH
H
VO
ON
CU
CU
CU
CU
CO
t—O
NO
NC
OC
Ot—
CO
IAIA
VO
VO
VO
VO
IA
IA
IA
IA
IA
IA
IA
IA
HH
'-ii-ir^
r-irii-iH
r-iH
Hr-lr-i
3C8
0300
gp
.(k
OO
OO
OIA
IA
IA
IA
IA
88
88
88
88
88
88
88
HH
HH
HH
HH
HH
HH
HH
oO
t—V
OIA
VO
co
t—ia
F-v
oC
OIA
t—C
OO
OO
nC
UC
OC
OO
CO
IA
**
00
IAt-
CUH
*H
IA
*O
p\
ON
*H
CUO
nC
OIA
t—0
0O
NO
OC
OIA
CO
t—V
OO
NC
O
HH
H
InletFlowRate,scfnHo
ON
OC
UV
OV
OC
UIA
©H
co
vo
t—O
nH
IAV
OH
Q*
CO
*C
O*
CO
CU
*C
OH
C0
CO
V0
CU
VO
CU
*lA
O\C
UC
UIA
CO
IAV
Ot—
00
OH
CO
VO
CO
t—V
OO
NC
O
HH
H
8
CO
IAV
O«
*0
••
(#
»
CO
CU
tAS
OH
HH
HC
U
HC
UC
OH
OC
UV
OC
OU
MA
CO
CO
CO
CO
co
H*
t—O
nH
on
*H
t-
co
qvq
t-
HH
HH
CU
HH
Hri
HH
4)
•Q
HH1
May12
May5
May7
-76
-
Q)
Oto
H0)
od-p
om
4)fl
K2§"8
Dfl
+»
O00.
O