controlled, rapid deposition of structured coatings from...
TRANSCRIPT

Controlled, Rapid Deposition of Structured Coatings fromMicro- and Nanoparticle Suspensions
Brian G. Prevo and Orlin D. Velev*
Department of Chemical Engineering, North Carolina State University,Raleigh, North Carolina 27695-7905
Received July 17, 2003. In Final Form: December 16, 2003
The objective of the study was to develop the operational basis for rapid and controlled deposition ofcrystal coatings from particles of a wide size range. We deposited such structured coatings by draggingwith constant velocity a small volume of liquid confined in a meniscus between two plates. Two types ofstructured coatings were characterized: latex colloidal crystals and thin layers from metallic nanoparticles.The crystal deposition was sped up by use of preconcentrated suspensions. Crystal coatings larger thana few square centimeters were deposited in minutes from aqueous suspension volumes of approximately10 µL. The governing mechanism of crystal deposition is convective assembly at high volume fractions.The two major process parameters that allow control over the coating thickness and structure were thedeposition speed and particle volume fraction. The evaporation rate was not found to affect the processto a large extent. A volumetric flux balance was used to relate the deposition parameters to coating structureand properties. Operational “phase” diagrams were constructed, relating the crystal layer thickness andpacking symmetry to the process parameters. These diagrams could be instrumental in transforming theconvective colloidal deposition into a robust scaleable technology.
I. IntroductionColloidal crystals are self-assembled materials with
periodically varying dielectric constant on the submi-crometer length scale. Crystalline macroporous materialshave potential for a wide variety of applications, such asphotonic band gap materials for light filters, waveguides,and antireflective coatings.1-6 Colloidal crystals may beconverted into such “photonic crystals”7,8 by backfillingthe void space of colloidal crystals with inorganic oxidesor with metallic or semiconducting nanoparticles (“inverseopals”) to achieve sufficient dielectric contrast.9-12 Peri-odically porous metallic films also exhibit enhancedelectromagnetic transmission by way of surface plasmonresonance,13 which may find application in novel litho-graphic and optical applications.14,15 These periodicallyroughened metallic surfaces could generate strong surface-enhanced Raman scattering intensities for chemicalsensors (SERS).16-19 Various metal nanoparticles havedemonstrated catalytic potential,20,21 and structured po-
rous metallic films could be used for catalytic supports.22
Thin nanoparticle coatings can also impart decorativefunctions to surfaces, modify their wetting and tribologicalproperties, or change their hardness or conductivity.
The potential technological applications of micro- andnanoparticle coatings require the development of rapid,inexpensive, and easily controlled deposition procedures.The mechanism of self-assembly of colloidal particlesuspensions in thin evaporating films has been identifiedas “convective assembly”.23,24 Ordering and assembling ofcolloidal particles by solvent evaporation has been in-vestigated for various systems ranging from ring formationin drying droplets,25-29 to ordered deposits on the peripheryof holes from dewetting films,30 to colloidal crystalformation in thin wetting films.23,24,31-36 Thick colloidal
* Corresponding author. Fax: 919-515-3465. E-mail: [email protected].
(1) Yablonovitch, E. J. Mod. Optic. 1994, 41, 173-194.(2) Colvin, V. L. MRS Bull. 2001, 26, 637-641.(3) Lu, Y.; Yin, Y. D.; Li, Z. Y.; Xia, Y. N. Langmuir 2002, 18, 7722-
7727.(4) Gates, B.; Lu, Y.; Li, Z. Y.; Xia, Y. Appl. Phys. AsMater. 2003,
76, 509-513.(5) Yamasaki, T.; Tsutsui, T. Appl. Phys. Lett. 1998, 72, 1957-1959.(6) Matsushita, S. I.; Yagi, Y.; Miwa, T.; Tryk, D. A.; Koda, T.;
Fujishima, A. Langmuir 2000, 16, 636-642.(7) Joannoupolous, J. D., Meade, R. D., Winn, J. N. Photonic Crystals;
Princeton University Press: New Jersey, 1995.(8) Yablonovitch, E. Phys. Rev. Lett. 1987, 58, 2059-2062.(9) Norris, D. J.; Vlasov, Y. A. Adv. Mater. 2000, 13, 371-376.(10) Vlasov, Y. A.; Astratov, V. N.; Karimov, O. Z.; Kaplyanskii, A.
A. Phys. Rev. B 1997, 55, 357-360.(11) Subramania, G.; Constant, K.; Biswas, R.; Sigalas, M. M.; Ho,
K. M. Appl. Phys. Lett. 1999, 74, 3933-3935.(12) Velev, O. D.; Kaler, E. W. Adv. Mater. 2000, 12, 531-534.(13) Ebbesen, T. W.; Lezec, H. J.; Ghaemi, H. F.; Thio, T.; Wolff, P.
A. Nature 1998, 391, 667-669.(14) Lezec,H.J.;Degiron,A.;Devaux,E.;Linke,R.A.;Martin-Moreno,
L.; Garcia-Vidal, F. J.; Ebbesen, T. W. Science 2002, 297, 820-822.(15) Martin-Moreno, L.; Garcia-Vidal, F. J.; Lezec, H. J.; Degiron, A.;
Ebbesen, T. W. Phys. Rev. Lett. 2003, 90, 167401.
(16) Garcia-Vidal, F. J.; Pendry, J. B. Phys. Rev. Lett. 1996, 77, 1163-1166.
(17) Freeman, R. G.; Grabar, K. C.; Allison, K. J.; Bright, R. M.;Davis, J. A.; Guthrie, A. P.; Hommer, M. B.; Jackson, M. A.; Smith, P.C.; Walter, D. G.; Natan, M. J. Science 1995, 267, 1629-1632.
(18) Blatchford, C. G.; Campbell, J. R.; Creighton, J. A. Surf. Sci.1982, 120, 435-455.
(19) Tessier, P. M.; Christensen, S. D.; Ong, K. K.; Clemente, E. M.;Lenhoff, A. M.; Kaler, E. W.; Velev, O. D. Appl. Spectrosc. 2002, 56,1524-1530.
(20) Cho, A. Science 2003, 299, 1685.(21) Rolison, D. R. Science 2003, 299, 1698-1701.(22) Velev, O. D.; Tessier, P. M.; Lenhoff, A. M.; Kaler, E. W. Nature
1999, 401, 548-548.(23) Denkov, N. D.; Velev, O. D.; Kralchevsky, P. A.; Ivanov, I. B.;
Yoshimura, H.; Nagayama, K. Langmuir 1992, 8, 3183-3190.(24) Denkov, N. D.; Velev, O. D.; Kralchevsky, P. A.; Ivanov, I. B.;
Yoshimura, H.; Nagayama, K. Nature 1993, 361, 26-26.(25) Deegan, R. D.; Bakajin, O.; Dupont, T. F.; Huber, G.; Nagel, S.
R.; Witten, T. A. Nature 1997, 389, 827-829.(26) Deegan, R. D.; Bakajin, O.; Dupont, T. F.; Huber, G.; Nagel, S.
R.; Witten, T. A. Phys. Rev. E 2000, 62, 756-764.(27) Deegan, R. D. Phys. Rev. E 2000, 61, 475-485.(28) Adachi, E.; Dimitrov, A. S.; Nagayama, K. Langmuir 1995, 11,
1057-1060.(29) Nguyen, V. X.; Stebe, K. J. Phys. Rev. Lett. 2002, 88, 164501.(30) Ohara, P. C.; Gelbart, W. M. Langmuir 1998, 14, 3418-3424.(31) Dimitrov, A. S.; Nagayama, K. Chem. Phys. Lett. 1995, 243,
462-468.(32) Dimitrov, A. S., Nagayama, K. Langmuir 1996, 12, 1303-1311.(33) Jiang, P.; Bertone, J. F.; Hwang, K. S.; Colvin, V. L. Chem. Mater.
1999, 11, 2132-2140.
2099Langmuir 2004, 20, 2099-2107
10.1021/la035295j CCC: $27.50 © 2004 American Chemical SocietyPublished on Web 02/11/2004

crystals have been made by slowly withdrawing thesubstrate from the immersion vessel (akin to dip-coat-ing),33,36 sedimentation,37 and forced filtration.38 In relatedwork, Brinker et al.39 have shown good corollary betweenthe dip-coating “evaporation induced self-assembly” pro-cess and the structures of MCM-surfactant coatings.
The process of convective deposition of structuredcoatings has yet to be rationalized theoretically and scaledup into a practically usable technology. The relationbetween the operating parameters and the number andstructure of deposited layers has not been well-understood.The symmetry of the two-dimensional (2D) colloidalcrystals obtained by convective assembly in thin liquidfilms has been found to be similar to the one establishedfrom earlier studies of particle assembly in slits betweensolid plates.23 Confinement of monodisperse spheres inthin films leads to free volume Alder phase transitionsand crystallization.40 Pansu et al.41,42 and others43,44 haveclassified the two-dimensional crystal phases of micro-spheres confined in the thin gap between solid plates.Extensive molecular dynamics and lattice Monte Carlosimulations have confirmed this phase behavior in con-fined geometries.45,46 The thickness of films with free liquidsurfaces, however, is not a directly controllable parameter.
Another problem in the present state of the art in theconvective assembly of crystalline coatings is that themethods used require long times and large volumes ofsuspensions. The most common method, dipping of thesubstrates in a cuvette or beaker of suspension and thenslowly withdrawing them or decreasing the level byevaporation takes hours to weeks and several millilitersor more of liquid suspension. The relatively small volumefractions of the particles, on the order of a few percent orless, means that large volumes of solvent have to beevaporated, potentially at a relatively high energy con-sumption. The microspheres in such a dip-coating processwill deposit not only on the substrate, but also on thewalls of the vessel, leading to waste of (usually expensive)material.
In this study, thin structured micro- and nanoparticleparticle layers were deposited by dragging with constantvelocity the meniscus of microliter suspension dropletstrapped between two plates (Figure 1).47 This techniqueoffers precise control and reduced material consumptionrelative to standard dip coating. Two different systemswere studied: latex colloidal crystals and thin metallicnanoparticle layers. To achieve rapid deposition, we usedpreconcentrated suspensions of high volume fraction, sothe crystals could be assembled at speeds as high as 90µm/s. Coatings were deposited at different relative hu-
midities to test the effect of solvent evaporation on themechanism of particle deposition. We formulated opera-tional “phase” diagrams to relate coating thickness andstructure to the deposition process parameters. Thesediagrams are based on the volumetric flux balance of theevaporating solvent film and the assembling particles.This balance and the process parameters involved arebriefly presented below.
Volumetric Flux Balance over the Drying Region. Themechanism by which the dispersed particles are broughttogether and crystallized in the thin wetting films isconvective assembly. The particles are transported to theedge of the growing crystal by the flux of the liquidcompensating for the evaporation from the crystal surface.A detailed transient mass transport analysis of the dryingfilm region has been developed;48 however, for steady-state assembly a simpler equation balancing the volu-metric fluxes of the solvent and the accumulation ofparticles in the drying region has been proposed byDimitrov and Nagayama32
where ε and h are the porosity and the height of thedeposited colloidal crystal, φ is the volume fraction of theparticles in suspension, and â is an interaction parameterthat relates the mean solvent velocity to the mean particlespeed before entering the drying region. â is difficult toobtain experimentally, and for sufficiently small particlesizes, one may assume complete entrainment, such thatâ ≈ 1.31,32 Equation 1 has been applied to colloidal crystalsmade by slowly withdrawing a substrate from suspensionof particles (akin to dip-coating).
The material fluxes considered in eq 1 are the entrantflux of the carrier solvent (JS), the resulting hydrodynamicflux of the particles (JP), the evaporation flux of the solventleaving the drying region (JE), and the accumulation ofparticles in the dried film (Figure 2). The steady-stateflux balance is taken over a control volume that moves atthe rate of accumulation of drying particles, which is equalto the rate of colloidal crystal formation, vC.
Evaporation is not constant over the drying region andis a function of proximity to the bulk suspension meniscus.Measuring JE experimentally during the process ofdepositing a colloidal crystal film is difficult.49 It has beenassumed 31,32,34 that JE is the rate of evaporation averagedover the drying length, l, i.e., JE ) ⟨je(x)⟩l. The rate ofevaporation at any point in the drying region, je(x), is
(34) Dushkin, C. D.; Yoshimura, H.; Nagayama, K. Chem. Phys. Lett.1993, 204, 455-459.
(35) Dushkin, C. D.; Lazarov, G. S.; Kotsev, S. N.; Yoshimura, H.;Nagayama, K. Colloid Polym. Sci. 1999, 277, 914-930.
(36) Gu, Z. Z.; Fujishima, A.; Sato, O. Chem. Mater. 2002, 14, 760-765.
(37) Zhu, J. X.; Li, M.; Rogers, R.; Meyer, W.; Ottewill, R. H.; Russell,W. B.; Chaikin, P. M. Nature 1997, 387, 883-885.
(38) Park, S. H.; Qin, D.; Xia, Y. Adv. Mater. 1998, 10, 1028-1032.(39) Brinker, C. J.; Lu, Y. F.; Sellinger, A.; Fan, H. Y. Adv. Mater.
1999, 11, 579-585.(40) Alder, B. J.; Wainwright, T. E. J. Chem. Phys. 1957, 27, 1208-
1209.(41) Pansu, B.; Pieranski, P.; Strzelecki, L. J. Phys. Paris 1983, 44,
531-536.(42) Pansu, B., Pieranski, Pi., Pieranski, Pa. J. Phys. Paris 1984, 45,
331-339.(43) Pusey, P. N.; Van Megen, W. Nature 1986, 320, 340-342.(44) Murray, C. A.; Van Winkle, D. H. Phys. Rev. Lett. 1987, 58,
1200-1203.(45) Schmidt, M.; Lowen, H. Phys. Rev. Lett. 1996, 76, 4552-4555.(46) Zangi, R.; Rice, S. A. Phys. Rev. E 2000, 61, 660-670.(47) Adachi, E.; Nagayama, K. Langmuir 1996, 12, 1836-1839.
(48) Routh, A. F.; Russel, W. B. AIChE J. 1998, 44, 2088-2098.(49) Keddie, J. L. Mater. Sci. Eng. R. 1997, 21, 101-170.
Figure 1. Schematic of the coating apparatus. The inset aboveillustrates the process of convective assembly driven by theevaporation flux, JE.
vC )âjelφ
h(1 - ε)(1 - φ)(1)
2100 Langmuir, Vol. 20, No. 6, 2004 Prevo and Velev
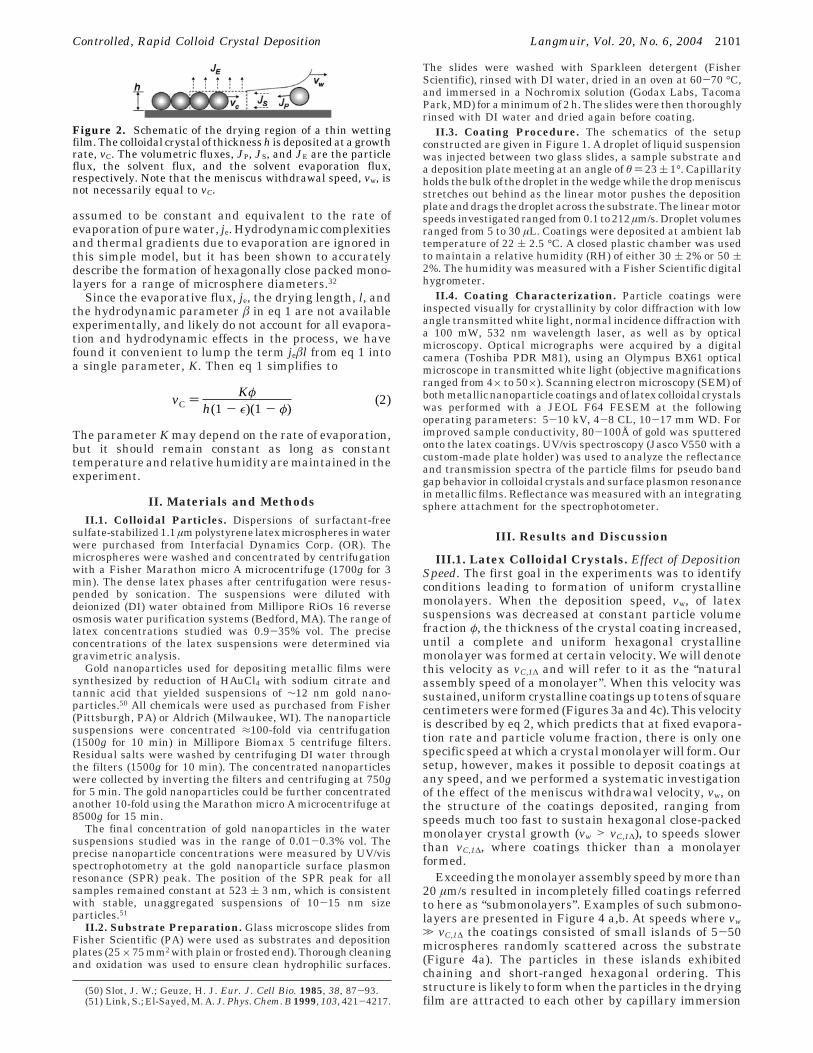
assumed to be constant and equivalent to the rate ofevaporation of pure water, je. Hydrodynamic complexitiesand thermal gradients due to evaporation are ignored inthis simple model, but it has been shown to accuratelydescribe the formation of hexagonally close packed mono-layers for a range of microsphere diameters.32
Since the evaporative flux, je, the drying length, l, andthe hydrodynamic parameter â in eq 1 are not availableexperimentally, and likely do not account for all evapora-tion and hydrodynamic effects in the process, we havefound it convenient to lump the term jeâl from eq 1 intoa single parameter, K. Then eq 1 simplifies to
The parameter K may depend on the rate of evaporation,but it should remain constant as long as constanttemperature and relative humidity are maintained in theexperiment.
II. Materials and MethodsII.1. Colloidal Particles. Dispersions of surfactant-free
sulfate-stabilized 1.1 µm polystyrene latex microspheres in waterwere purchased from Interfacial Dynamics Corp. (OR). Themicrospheres were washed and concentrated by centrifugationwith a Fisher Marathon micro A microcentrifuge (1700g for 3min). The dense latex phases after centrifugation were resus-pended by sonication. The suspensions were diluted withdeionized (DI) water obtained from Millipore RiOs 16 reverseosmosis water purification systems (Bedford, MA). The range oflatex concentrations studied was 0.9-35% vol. The preciseconcentrations of the latex suspensions were determined viagravimetric analysis.
Gold nanoparticles used for depositing metallic films weresynthesized by reduction of HAuCl4 with sodium citrate andtannic acid that yielded suspensions of ∼12 nm gold nano-particles.50 All chemicals were used as purchased from Fisher(Pittsburgh, PA) or Aldrich (Milwaukee, WI). The nanoparticlesuspensions were concentrated ≈100-fold via centrifugation(1500g for 10 min) in Millipore Biomax 5 centrifuge filters.Residual salts were washed by centrifuging DI water throughthe filters (1500g for 10 min). The concentrated nanoparticleswere collected by inverting the filters and centrifuging at 750gfor 5 min. The gold nanoparticles could be further concentratedanother 10-fold using the Marathon micro A microcentrifuge at8500g for 15 min.
The final concentration of gold nanoparticles in the watersuspensions studied was in the range of 0.01-0.3% vol. Theprecise nanoparticle concentrations were measured by UV/visspectrophotometry at the gold nanoparticle surface plasmonresonance (SPR) peak. The position of the SPR peak for allsamples remained constant at 523 ( 3 nm, which is consistentwith stable, unaggregated suspensions of 10-15 nm sizeparticles.51
II.2. Substrate Preparation. Glass microscope slides fromFisher Scientific (PA) were used as substrates and depositionplates (25×75 mm2 with plain or frosted end). Thorough cleaningand oxidation was used to ensure clean hydrophilic surfaces.
The slides were washed with Sparkleen detergent (FisherScientific), rinsed with DI water, dried in an oven at 60-70 °C,and immersed in a Nochromix solution (Godax Labs, TacomaPark, MD) for a minimum of 2 h. The slides were then thoroughlyrinsed with DI water and dried again before coating.
II.3. Coating Procedure. The schematics of the setupconstructed are given in Figure 1. A droplet of liquid suspensionwas injected between two glass slides, a sample substrate anda deposition plate meeting at an angle of θ ) 23 ( 1°. Capillarityholds the bulk of the droplet in the wedge while the drop meniscusstretches out behind as the linear motor pushes the depositionplate and drags the droplet across the substrate. The linear motorspeeds investigated ranged from 0.1 to 212 µm/s. Droplet volumesranged from 5 to 30 µL. Coatings were deposited at ambient labtemperature of 22 ( 2.5 °C. A closed plastic chamber was usedto maintain a relative humidity (RH) of either 30 ( 2% or 50 (2%. The humidity was measured with a Fisher Scientific digitalhygrometer.
II.4. Coating Characterization. Particle coatings wereinspected visually for crystallinity by color diffraction with lowangle transmitted white light, normal incidence diffraction witha 100 mW, 532 nm wavelength laser, as well as by opticalmicroscopy. Optical micrographs were acquired by a digitalcamera (Toshiba PDR M81), using an Olympus BX61 opticalmicroscope in transmitted white light (objective magnificationsranged from 4× to 50×). Scanning electron microscopy (SEM) ofboth metallic nanoparticle coatings and of latex colloidal crystalswas performed with a JEOL F64 FESEM at the followingoperating parameters: 5-10 kV, 4-8 CL, 10-17 mm WD. Forimproved sample conductivity, 80-100Å of gold was sputteredonto the latex coatings. UV/vis spectroscopy (Jasco V550 with acustom-made plate holder) was used to analyze the reflectanceand transmission spectra of the particle films for pseudo bandgap behavior in colloidal crystals and surface plasmon resonancein metallic films. Reflectance was measured with an integratingsphere attachment for the spectrophotometer.
III. Results and Discussion
III.1. Latex Colloidal Crystals. Effect of DepositionSpeed. The first goal in the experiments was to identifyconditions leading to formation of uniform crystallinemonolayers. When the deposition speed, vw, of latexsuspensions was decreased at constant particle volumefraction φ, the thickness of the crystal coating increased,until a complete and uniform hexagonal crystallinemonolayer was formed at certain velocity. We will denotethis velocity as vC,1∆ and will refer to it as the “naturalassembly speed of a monolayer”. When this velocity wassustained, uniform crystalline coatings up to tens of squarecentimeters were formed (Figures 3a and 4c). This velocityis described by eq 2, which predicts that at fixed evapora-tion rate and particle volume fraction, there is only onespecific speed at which a crystal monolayer will form. Oursetup, however, makes it possible to deposit coatings atany speed, and we performed a systematic investigationof the effect of the meniscus withdrawal velocity, vw, onthe structure of the coatings deposited, ranging fromspeeds much too fast to sustain hexagonal close-packedmonolayer crystal growth (vw > vC,1∆), to speeds slowerthan vC,1∆, where coatings thicker than a monolayerformed.
Exceeding the monolayer assembly speed by more than20 µm/s resulted in incompletely filled coatings referredto here as “submonolayers”. Examples of such submono-layers are presented in Figure 4 a,b. At speeds where vw
. vC,1∆ the coatings consisted of small islands of 5-50microspheres randomly scattered across the substrate(Figure 4a). The particles in these islands exhibitedchaining and short-ranged hexagonal ordering. Thisstructure is likely to form when the particles in the dryingfilm are attracted to each other by capillary immersion
(50) Slot, J. W.; Geuze, H. J. Eur. J. Cell Bio. 1985, 38, 87-93.(51) Link, S.; El-Sayed, M. A. J. Phys. Chem. B 1999, 103, 421-4217.
Figure 2. Schematic of the drying region of a thin wettingfilm. The colloidal crystal of thickness h is deposited at a growthrate, vC. The volumetric fluxes, JP, JS, and JE are the particleflux, the solvent flux, and the solvent evaporation flux,respectively. Note that the meniscus withdrawal speed, vw, isnot necessarily equal to vC.
vC ) Kφ
h(1 - ε)(1 - φ)(2)
Controlled, Rapid Colloid Crystal Deposition Langmuir, Vol. 20, No. 6, 2004 2101

and bridging forces.52 Further decrease of the depositionspeed for a given φ increased substrate coverage as theislands began to interconnect in thin strips of hexagonallyordered particles (Figure 4b).23,29,31 Thus, the structure ofnonconnected islands of particles is converted into two-dimensional particle “foam”. The empty areas in thecoating are formed when the evaporation ruptures thefilm, dewetting occurs, and the particles are pulledtogether by the retracting film edges.30
When the deposition speed was equal to the naturalmonolayer assembly speed, vw ) vC,1∆, the crystal covereduniformly the whole area of the plate (Figures 3a and 4c).The whole coating is made of hexagonal crystal domainsof different orientation. The domain size of the typicalcrystals in themonolayerdeterminedbyopticalmicroscopywas in the range of 100-250 µm. The coating looksuniformly translucent when illuminated and observedperpendicularly to the surface (Figure 3a). When il-luminated at a shallow angle with white light, however,the crystalline coating lights up in a variety of intense
colors (Figure 3b). Each of the crystal domains acts as agrating diffracting light of a certain wavelength dependingon the angle of incidence and lattice orientation.
The structure of the 2D crystal monolayers could alsobe conveniently studied by laser diffraction in transmittedmode. When illuminated with a beam of large spot size(4 mm in diameter) the diffraction pattern of the mono-layers was typically a sharp circle (Figure 5a). These ringsare 2D optical analogues of the common X-ray diffractionfrom 3D samples of crystalline powders (Debye-Scherrermethod). They point to a well structured, but multicrys-talline, layer, every individual crystal of which is signifi-cantly smaller than the beam diameter. The diffractionpattern changed to six distinct spots set within a diffusering when the size of the laser beam spot was reducedwith a pinhole of diameter 0.25 mm (Figure 5b). Thispattern with 6-fold symmetry corresponds to diffractionfrom a single close-packed hexagonal crystal. It confirmsthe microscopy observations that the sizes of the largerdomains in the monolayer samples were ≈250 µm.
The angle of diffraction for the six-spot and sharp ringpattern for a monolayer of 1.1 µm spheres was measuredto be 34.5°. This angle was corrected for refraction onexiting the composite layer by using Snell’s law. Thecoherent scattering length could be calculated from thevon Laue relation53 (note that this formula is differentfrom the common Bragg diffraction, which does not occurin crystal monolayers)
where h is the lattice constant, θ is the scattering angle,λ0 is the laser wavelength, and nC is the effective refractiveindex of the latex coating that is mixture of air (nA ) 1.0)and polystyrene (nPS ) 1.583).54 We determined nC to be1.382 and calculated h to be 939 nm. The correspondinglattice constant for a hexagonal close-packed monolayerof 1.1 µm microspheres is 0.866DP ) 953 nm. Thus theexperimental value was just 2% lower than the expectedlattice constant, proving that von Laue laser diffractionprecisely reveals the structure and lattice dimensions of2D crystal monolayers.
Decreasing the deposition speed below the naturalassembly speed for a monolayer or, equivalently, increas-ing the volume fraction of the suspended particles resultedin thicker coatings. Meniscus withdrawal speeds slightlyslower than the monolayer assembly speed resulted inincomplete bilayers with structure similar to the sampleshown in Figure 4d. Further decreases of the depositionspeed led to the formation of complete polycrystallinebilayers, incomplete trilayers, complete trilayers, etc.Optical microscopy was used to classify the number oflayers, and the particle packing type in the crystals (Figure6). The symmetry of the multilayer crystals was not alwayshexagonal, but alternated between hexagonal (∆) andsquare (0) as the coating thickness changed. In all caseswe observed the previously reported23,41,42 2D packingtransitions in the order n∆ f (n + 1)0 f (n + 1)∆corresponding to maximized packing density as thicknessincreases (Figure 6), where n is the number of layers.
The submonolayer, monolayer, and multilayer coatingdata were used to construct plots of the crystal thicknessand structure as a function of varying deposition speed
(52) Kralchevsky, P. A.; Denkov, N. D. Curr. Opin. Colloid InterfaceSci. 2001, 6, 383-401.
(53) Lumsdon, S. O.; Kaler, E. W.; Williams, J. P.; Velev, O. D. Appl.Phys. Lett. 2003, 82, 949-951.
(54) Mittleman, D. M.; Bertone, J. F.; Jiang, P.; Hwang, K. S.; Colvin,V. L. J. Chem. Phys. 1999, 111, 345-354.
Figure 3. Examples of crystal monolayer from 1.1 µmpolystyrene latexes deposited at 30% RH and 84.5 µm/s. (a)The coating appears translucent and opaque due to scatteringwhen viewed in ambient light. (b) The crystalline order leadingto bright diffraction is revealed when illuminated with a whitelight from behind.
h sin θ )λ0
nC(3)
2102 Langmuir, Vol. 20, No. 6, 2004 Prevo and Velev

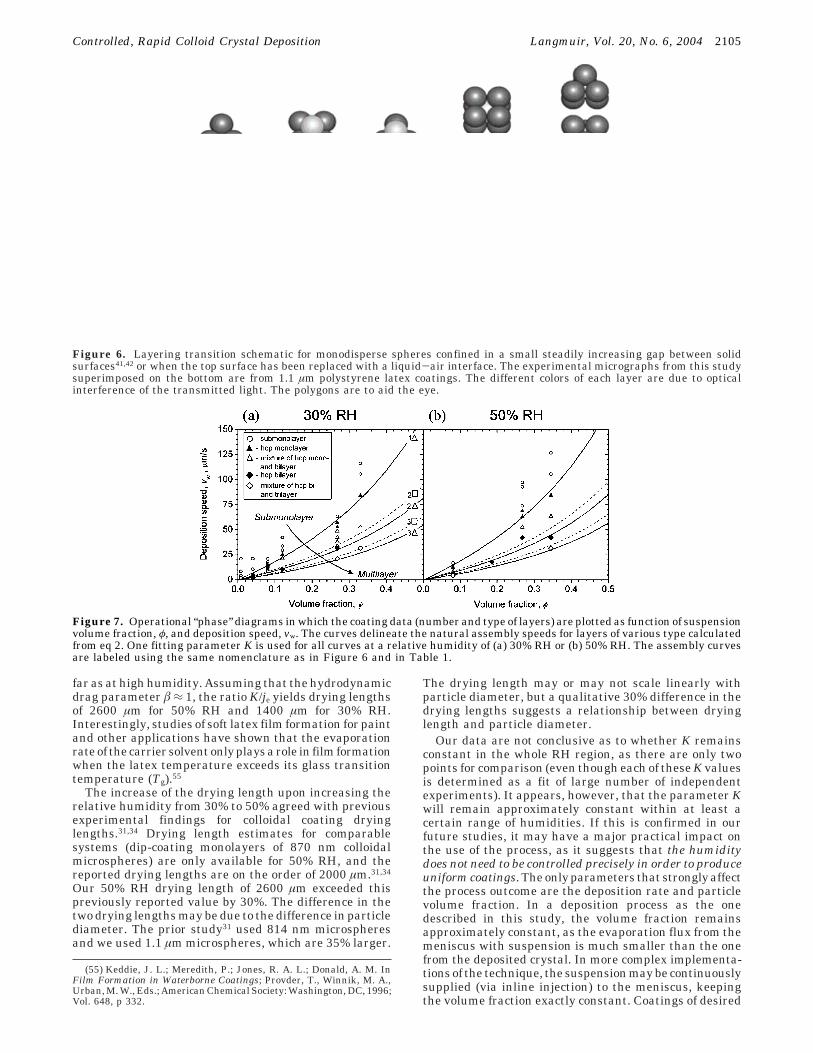
and microsphere volume fraction. Such data for coatingsof different thicknesses at two different relative humidities(RH), 30% and 50%, are shown in Figure 7. To interpretthe results, the volumetric flux model, eq 2, was appliedto calculate the natural assembly speeds of multilayers.This equation has been derived for hexagonal monolayers,at fixed particle packing fraction of (1 - ε) ) 0.605.33
However, in our coating process we could adjust the speedof meniscus withdrawal (equivalent here to vw) and theparticlevolumefraction toawiderangeofvalues, includingnatural formation speeds of multilayers (vC,n). In suchfilms, the packing fraction, (1 - ε), is larger than 0.605,but lower than 0.74, the limit for 3D close packed spheres.The packing fractions (1 - ε) and thicknesses h for crystalswith different number of particle layers and symmetry,corresponding to the sequence described by Pansu et al.41,42
are given in Table 1. These parameters were used in eq2 in predicting the natural assembly speed of multilayersand in comparing to data obtained at large particleconcentrations, φ, and low deposition speeds, vw.
All curves for the natural assembly speeds, vC(h,φ,ε),for layers of different thickness and symmetry (1∆, 20,2∆, ...) overlying the data in Figure 7 were calculatedusing only one fitting parameter, K, from eq 2. Hexagonalclose-packed monolayers were easiest to make and toobserve and exhibited the least number of defects, so theirmeasured natural assembly velocities were used for fittingK (by the least-squares method). Colloidal crystal thick-ness was assumed to have a negligible effect on the localrate of evaporation because porous 2D thin films offer lowresistance to evaporation.48 For constant φ and K, the shiftin the calculated vC,n toward the φ-axis for thicker coatings(n > 1) is governed solely by the increase in the termh(1 - ε) from eq 2 as shown by Table 1.
The top left region above the monolayer curve for Figure7a,b corresponds to incomplete monolayer (submonolayer)coatings. The lower right region (high volume fraction,low deposition speed) corresponds to multilayer coatings.When the deposition speed is equal to the natural assemblyspeed of the nth layer, the growth of that layer is sustained
Figure 4. Examples of polystyrene latex coatings deposited at decreasing velocities: (a) dilute submonolayer, (b) submonolayerstripes, (c) monolayer at natural assembly speed, (d) monolayer and hexagonal bilayer striping (the bilayers appear brown, andmonolayers appear beige due to optical interference). Scale bars for parts a and c are 50 µm and for parts b and d are 250 µm. Theright-hand column contains high magnification images of the structure to the left (all scale bars ) 5 µm).
Controlled, Rapid Colloid Crystal Deposition Langmuir, Vol. 20, No. 6, 2004 2103

and kinetically stable. The solid data points in Figure 7represent visually confirmed coatings in which thatparticular phase, n∆, dominated. Intermediate velocitiesbetween two calculated vC,n are too rapid to sustain thegrowth of the thicker crystal, yet too slow to prevent anyformation of the thicker crystal phase. The resultingcoatings deposited at speeds that are incommensuratewith a specific vC,n form stripelike patterns of the twophases perpendicular to the direction of coating (cf. Figure4d). The hollow polygons in the operational diagrams ofFigure 7 represent coatings that were oscillatory mixturesor striped coatings of n∆ and (n + 1)∆. The presence ofan (n + 1)0 layer is implicit as an intermediary phasebetween the neighboring hexagonal regions, but it wasnever observed over ranges longer than a few micro-spheres. Because of the absence of long-range squarepacking regions, no square data points are plotted on theoperation diagrams. This issue is discussed in detail below.
In general, the coating data for all multilayers coincidedvery well with their predicted natural assembly curves,even though these curves were drawn from a single fittingparameter for monolayers. Equations 2, though only basedon a simple balance of fluxes, accurately predicts thecoating structure and thickness dependencies on thecontrolling parameters, vw andφ. This agreement of curvesand data demonstrates how by using the operational
“phase” diagrams the coating process can be predictedand controlled to obtain hexagonal multilayers of specifiedthickness.
Square-Packed versus Hexagonal-Packed Arrays.Square-packed layers are of interest for photonic crystals,as they can be precursors for body-centered cubic phases.In principle, following the operational diagrams of Figure7, judicious deposition speed selection should eventuallyyield large areas of square layers if the correct balancebetween volume fraction and deposition speed is main-tained. We, however, rarely observed long-range strips ofsquare packing, confirming earlier work23 describing thesquare layers as intermediate phases between largehexagonal layers (e.g. Figure 4d). The rarity of squareordering can be attributed to two reasons. First, it maybe a result of the flexibility of the liquid/air interface,permitting particle protrusion.23 Hence, the particles,preferring to maximize the packing density, may pushthrough the meniscus to form hexagonal, rather thansquare, arrays. Second, the operational phase diagramsof Figure 7 show that the natural assembly curves of thesquare arrays are always close to the ones for thecorresponding hexagonal layer. Thus, the window ofopportunity for stable growth of any 2D phase is muchmore restricted than for the corresponding hexagonallayers.
Effect of Evaporation Rate. The above results prove thatas long as the evaporation rate is kept constant it ispossible to relate the speed of meniscus withdrawal to thestructure of the crystal coatings deposited. Only a singleparameter from eq 2, K ) jeâ l, is used to fit all data atcertain humidity. It was expected that the parameter Kwill vary with the evaporation flux je as humidity changes.The rate of evaporation is faster at lower relative humidity.The evaporation rate of thin films of pure water onhydrophilized glass substrates was measured to be 0.08( 0.02 µm/s at 30% RH and 0.043 ( 0.009 µm/s at 48%RH. Thus the evaporation flux at 30% RH is approximatelytwice the evaporation flux at 50% RH.
The values of K fitted from coating data, however, didnot show a significant dependence on the humidity. Thefitting procedure for monolayers coated at 30% and at50% RH yielded K values of 109 ( 9 µm2/s and 113 ( 11µm2/s, respectively. These values are not statisticallydifferent and coincide within the boundaries of theexperimental error. This surprising result is confirmedby the approximately equal assembly speeds for thecoatings at 30% and 50% RH (cf. Figure 7a,b).
Thus, there must be an effect that balances theevaporation rate and maintains a constant value of theK parameter. This balancing effect is most probably relatedto the drying length, l, over which the liquid film penetratesinto the porous colloidal crystal before it is completelyevaporated. At low humidity, fast-drying films should havecorrespondingly shorter drying lengths, l ≈ je
-1: as theliquid film dries faster, the water does not penetrate as
Figure 5. Diffraction of normally incident laser beam trans-mitted through a uniform hexagonal latex monolayer. (a) Ringdiffraction pattern from a 4 mm diameter beam spot (crystalpowder diffraction). (b) Reducing the beam spot to 0.25 mmchanges the diffraction pattern to six symmetrical spots withina diffuse ring (single hexagonal crystal diffraction).
Table 1. Relation between Number of Layers,Microsphere Packing Type (hexagonal ∆ or square 0),
Film Thickness (h), and Packing Fraction (1 - E)a
n film thickness, h (1 - ε)
1∆ DP 0.604620 1.707DP 0.61342∆ 1.817DP 0.665730 2.414DP 0.65063∆ 2.633DP 0.6889
a Film thicknesses and packing fractions were calculated usingthe results of Pansu et al.42 n ) integer number of particle layers,DP ) particle diameter.
2104 Langmuir, Vol. 20, No. 6, 2004 Prevo and Velev
far as at high humidity. Assuming that the hydrodynamicdrag parameter â ≈ 1, the ratio K/je yields drying lengthsof 2600 µm for 50% RH and 1400 µm for 30% RH.Interestingly, studies of soft latex film formation for paintand other applications have shown that the evaporationrate of the carrier solvent only plays a role in film formationwhen the latex temperature exceeds its glass transitiontemperature (Tg).55
The increase of the drying length upon increasing therelative humidity from 30% to 50% agreed with previousexperimental findings for colloidal coating dryinglengths.31,34 Drying length estimates for comparablesystems (dip-coating monolayers of 870 nm colloidalmicrospheres) are only available for 50% RH, and thereported drying lengths are on the order of 2000 µm.31,34
Our 50% RH drying length of 2600 µm exceeded thispreviously reported value by 30%. The difference in thetwo drying lengths may be due to the difference in particlediameter. The prior study31 used 814 nm microspheresand we used 1.1 µm microspheres, which are 35% larger.
The drying length may or may not scale linearly withparticle diameter, but a qualitative 30% difference in thedrying lengths suggests a relationship between dryinglength and particle diameter.
Our data are not conclusive as to whether K remainsconstant in the whole RH region, as there are only twopoints for comparison (even though each of these K valuesis determined as a fit of large number of independentexperiments). It appears, however, that the parameter Kwill remain approximately constant within at least acertain range of humidities. If this is confirmed in ourfuture studies, it may have a major practical impact onthe use of the process, as it suggests that the humiditydoes not need to be controlled precisely in order to produceuniform coatings. The only parameters that strongly affectthe process outcome are the deposition rate and particlevolume fraction. In a deposition process as the onedescribed in this study, the volume fraction remainsapproximately constant, as the evaporation flux from themeniscus with suspension is much smaller than the onefrom the deposited crystal. In more complex implementa-tions of the technique, the suspension may be continuouslysupplied (via inline injection) to the meniscus, keepingthe volume fraction exactly constant. Coatings of desired
(55) Keddie, J. L.; Meredith, P.; Jones, R. A. L.; Donald, A. M. InFilm Formation in Waterborne Coatings; Provder, T., Winnik, M. A.,Urban, M. W., Eds.; American Chemical Society: Washington, DC, 1996;Vol. 648, p 332.
Figure 6. Layering transition schematic for monodisperse spheres confined in a small steadily increasing gap between solidsurfaces41,42 or when the top surface has been replaced with a liquid-air interface. The experimental micrographs from this studysuperimposed on the bottom are from 1.1 µm polystyrene latex coatings. The different colors of each layer are due to opticalinterference of the transmitted light. The polygons are to aid the eye.
Figure 7. Operational “phase” diagrams in which the coating data (number and type of layers) are plotted as function of suspensionvolume fraction, φ, and deposition speed, vw. The curves delineate the natural assembly speeds for layers of various type calculatedfrom eq 2. One fitting parameter K is used for all curves at a relative humidity of (a) 30% RH or (b) 50% RH. The assembly curvesare labeled using the same nomenclature as in Figure 6 and in Table 1.
Controlled, Rapid Colloid Crystal Deposition Langmuir, Vol. 20, No. 6, 2004 2105

thickness and symmetry can be deposited by preciselycontrolling only the speed of deposition. This promiseseasy technological implementation of the method, as it isvery easy to vary (or keep constant) the deposition speedvia the electronic motor control.
Applications. In previous convective assembly experi-ments, colloidal crystals have been deposited over periodsof many hours or even days. The reasons for such slowassembly speeds are made clear by the operational phasediagrams in Figure 7a,b. The very slow deposition speeds(from 10 nm/s to 1 µm/s) have been necessitated by thelow particle concentrations used (0.1-3% by vol).23,33,35
Much more rapid colloidal coating processes are neededfor industrial-scale viability. The experiments reportedhere prove that faster colloidal crystal deposition speedsare possible at high particle volume fractions. Largeuniform crystal coatings were deposited in a few minutes.
The deposition process, however, cannot be speededindefinitely by increasing the volume fraction of theparticles. The operational diagrams constructed here(Figure 7) also provide an estimate of the highest speedat which it is possible to assemble films ranging fromsubmonolayers up to hexagonal trilayers. The highestconcentration where the suspension can flow and spread(the jamming limit) is at a particle volume fraction of∼0.55, so the corresponding deposition velocity, vC, on thevertical axis is the highest one attainable in such coatingprocess. Similar diagrams can be constructed for thedeposition of thicker coatings, although as seen in theplots this will require much slower and better controlleddeposition speeds because of the small difference in growthrates for different layers. The most uniform colloidalcrystal coatings in the experiments were the ones madeat the higher volume fractions (0.15-0.35) with speedsranging from 10 to 90 µm/s. The operational diagramssuggest a reason for this uniformity as the spread betweenthe curves for different layers increases with the volumefraction. The type of crystal being deposited may be easierto control at higher volume fractions.
These colloidal crystal coatings could hardly be con-sidered as precursors for the elusive 3D photonic crystalswith a complete band gap. Even though they produce sharpdiffraction peaks, like most crystals deposited by convec-tive assembly, they are polycrystalline, with some degreeof defects such as vacancies and dislocations. This poly-crystallinity stems from competing nucleation and growthof the crystal domains34 and to a lesser extent fromparticle-substrate adhesion (because the surfaces werehydrophilized, negatively charged glass plates, the nega-tively stabilized latex was strongly repelled from thesubstrate surfaces). The thicker crystals also exhibitedcracks due to the surface tension forces present duringthe drying phase. Nevertheless, such rapidly and inex-pensively deposited materials have a range of potentialapplications, from light filters and decorative coatings, tomodification of wetting properties and surface functional-ity, to catalysis and filtration.
III.2. Metallic Nanoparticle Coatings. Effect ofDeposition Speed. The same technique and concepts caneasily be extended to a variety of coatings. We studied theeffect of the operation parameters on the thickness,structure, and reflectivity of coatings from gold nanopar-ticles. Suspensions of nanoparticles of diameter ∼12 nmwere deposited by a procedure similar to that for latexcolloidal crystals. The concentrations of the gold suspen-sions were at least an order of magnitude lower (0.01-0.3% vol) than the latex ones. As the operational diagramsin Figure 7 indicate, lower volume fractions require slowerspeeds. Indeed, the deposition of nanoparticles required
slower meniscus withdrawal than the latex crystals. Thedeposition speeds studied ranged from 1.0 to 40 µm/s. Atspeeds below about 10 µm/s, uniform continuous layersthat appeared homogeneous to the naked eye were formed(Figure 8a, 2% vmax region). When deposition speedsexceeded ca. 10 µm/s, the nanoparticle films exhibitedstriping behavior qualitatively similar to the submono-layer striping of latex coatings (Figure 8b,c).
SEMobservationsprovedthat thenanoparticles in thesecoatings did not order in organized lattices such as thelatex microspheres during the deposition process. Instead,they tended to form aggregated structures with microme-ter-sized features (Figure 8d). The lack of well-crystallizedstructure can be attributed to a variety of factors. First,the nanoparticles (referred to by other scientists as“nanocrystals”) are not as monodisperse and spherical asthe latexes. Second, the repulsive interactions betweenthe gold nanoparticles are relatively weak due to the lowsurfaceconcentrationof changedgroups,andtheattractivevan der Waals interactions are strong because of the largeHamaker constant. These particles are not stericallyprotected by polymer chains adsorbed or grafted on thesurface. Thus, the nanoparticles may begin to aggregatewhen concentrated in the meniscus. Third, it is alsopossible that the equilibrium thickness of the film isrelatively large compared to the nanoparticle diameter,so it does not provide the same strong confinement as inthe case with the large latex microspheres.
A major feature of these coatings is the remarkableuniformity of the stripes forming at submonolayer deposi-tion speeds. The striping could be conceptually related toring formation by evaporating droplets of particle suspen-sions.25,28 Each stripe represents an attempt by the dryingsystem to begin depositing a continuous layer in the filmmeniscus pinned down by the already deposited particles.However, as the withdrawal velocities are too rapid tosustain this growth, the meniscus suddenly jumps to anew position, and so on. Each stripe was ca. 150 µm thick.The spacing between these stripes decreased in directproportion to the decrease in the deposition speed. Halving
Figure 8. (a) Gold nanoparticle coatings deposited on the samesubstrate at decreasing deposition speeds from right to leftleading to increasing surface coverage (listed as % of vmax )211.2µm/s). The concentration of the suspension was 0.3% vol.(b) Optical micrograph of the 20% region. (c) Optical micrographof the 10% region. (d) SEM of the 2% region.
2106 Langmuir, Vol. 20, No. 6, 2004 Prevo and Velev

the deposition speed approximately halved the stripespacing (cf. Figure 8b,c). The stripes corresponding to 20%vmax had a spacing of ≈600 µm and the gold stripesdeposited at 10% vmax had a spacing of ≈300 µm. Thestriping length was found to scale with the depositionspeed as
where lS is the center-to-center distance between stripesof particles, lC is the stripe width (equivalent to the spacingat which the stripes overlap and a uniform layer with nostripes results, Figure 8d), and vw and vC have the samerespective definitions as before. Over several periods ofstriping, the fraction of surface coverage can be ap-proximated as lC/(lS + lC). For the regions of gold depositedat 20% and 10% vmax, the surface coverage fraction can beestimated as 0.2 and 0.33, respectively. We predicted thespeed for which the onset of uniform layers occurs as vw) vC ∼ 5% vmax, or about 10 µm/s, which coincided withthe experimentally determined natural monolayer as-sembly speed. Thus, eq 4 provides another means for rapidestimation and setting of the natural assembly speed.
Tunable Metal Nanocoating Reflectivity. One potentialuse of such metallic nanoparticle coatings of variabledensity could stem from the ability to adjust their opticalreflectance and transmittance. Increasing the surfacecoverage of the gold nanoparticles (by decreasing thedeposition speed, Figure 8) increased their UV/vis reflec-tance (Figure 9). Thus, the control of the coating depositionparameters makes it possible to control the opticalproperties of the films obtained. The SPR peak on thereflectance spectra of the coatings shifted from 525 nmfor the aqueous nanoparticle suspensions to approximately650 nm (Figure 9).
Visually, the nanoparticle coatings had a bluish tintcompared to the deep red of the liquid suspension ofnanoparticles. The position of the SPR peak depends onthe size domain of the scatterers and was red-shifted tohigher wavelengths for larger particles (or aggregatesizes).18,51 This is consistent with the aggregated structureof the nanoparticle films observed via microscopy andSEM. This long-ranged aggregation could potentially beavoided by particle stabilization with grafted chains orcan be used for adjusting the optical properties of thecoatings in a way that is not achievable in uniform metallayers formed by chemical vapor deposition.
In summary, coatings from gold nanoparticles weredeposited rapidly in a controlled manner from aqueous
suspensions and required no processing steps to modifythe substrate or the nanoparticles from their native statesapart from cleaning the substrates and concentrating thenanoparticles. This process is simpler and faster than thecommonly used assembly onto preformed polyelectrolytelayers.17,56,57 The degree of surface coverage was dependentprimarily on the deposition speed and followed thebehavior suggested by eq 2. The striping density of thenanoparticles was proportional to the deposition speed asdescribed by eq 4. Such coatings, while composed ofunordered metallic nanoparticles, have potential for usein optical coatings as well as in catalysis and chemicalsensors (e.g. by SERS).19
IV. ConclusionsThe coating experiments with latex crystals and gold
nanoparticles described here provide a glimpse at the widerange of applications for which convective assembly canbe used. Maintaining control over the structure andnumber of particle layers is a major step toward large-scale applicability. Out of the three controlling parametersof our system (deposition speed, particle concentration,and solvent evaporative flux), the deposition speed is themost potent and easily varied parameter. In principle, eq2 should hold for any type of colloidal material, even thoughit was originally intended for single layers of monodispersespheres, because it correctly captures the basics ofconvective assembly process. We demonstrated that thisequation could be used to construct operational phasediagrams for any volume fraction of suspensions fromparticles ranging from ∼10 to ∼1100 nm.
Working at higher volume fractions permitted fasterdeposition rates, as predicted by the operational diagramsconstructed. The K parameter remained constant for atleast two different relative humidities, which implies thatthe evaporation rate of the solvent does not have muchinfluence on the deposited coating structure. This raisesthe intriguing and important possibility that humiditydoes not need to be controlled precisely in order to produceuniform structured coatings.
These coating experiments also showed how time andmaterial consumption can be drastically decreased incomparison to conventional dip-coating. Depositing micro-and nanoparticle coatings from a small meniscus ofconcentrated suspension reduces material waste by coat-ing only a single surface of the substrate (as opposed toboth sides of the substrate and the walls of the immersionvessel in dip-coating). The coating time scale is reducedfrom hours or days to minutes. Coatings of tens of squarecentimeters were deposited onto microscope slides frommicroliter volumes in just minutes. This process has thepotential for scale-up and for moving from batch operation,as used in this study, to continuous coating technology byinjection of a continuous supply of liquid suspension inthe moving meniscus.
Acknowledgment. We are grateful to Ruben Car-bonellandJosephDeSimone forencouragementandusefuldiscussions as well as to Christopher Kloxin for hisassistance with the diffraction studies. This study wassupported by the NSF Science and Technology Center forCO2-based Solvents and Processes, the Department ofChemical Engineering, NCSU, and the Camille and HenryDreyfus Foundation.
LA035295J
(56) Fendler, J. H. Chem. Mater. 1996, 8, 1616-1624.(57) Decher, G.; Eckle, M.; Schmitt, J.; Struth, B. Curr. Opin. Colloid
Interface Sci. 1998, 3, 32-39.
Figure 9. UV/vis reflectance spectra for the ∼12 nm goldnanoparticle coatings shown in Figure 8.
lS
lC∝
vw
vC(4)
Controlled, Rapid Colloid Crystal Deposition Langmuir, Vol. 20, No. 6, 2004 2107