conventional roofs: measuring impacts of...
TRANSCRIPT

14th Canadian Conference on Building Science and Technology - Toronto, Ontario 2014 Page 1
ABSTRACT
A field monitoring study was implemented to measure the impacts and benefits of membrane colour (white, grey and black) and insulation strategy on the performance of conventional roofing assemblies. The same roof membrane cap sheet type with three different surface granule colours was placed over three different conventional insulation strategies, creating a total of nine unique roofing assemblies on the same building. The thicknesses of the different insulation products were varied to achieve approximately the same R-value for each of the nine roof assemblies. Sensors were installed to measure temperature, relative humidity, moisture content, and heat flux at various points within each of the roof assemblies. Displacement sensors were also installed within the insulation boards to measure the dimensional stability of the different insulation products, and solar radiation sensors were installed above the cap sheet to document the long-term reflectivity and soiling of the roofing membranes. In conjunction with the sensors, webcam photos were captured to study the impact of night sky cooling, wetting/frost, and other differences between the assemblies. To complement the field study, supplemental laboratory testing of the insulation products was performed to measure the installed insulation R-values and whole building energy simulations were performed to apply the calibrated results from the study to other building types and climate zones across North America.
Presented in this paper are findings from the study which highlight the impact of both roof membrane colour and insulation strategy on the thermal behaviour and energy gains/losses through conventional roofing assemblies. Whole building energy modeling is used to synthesize the study findings and demonstrate how whole building heating and cooling energy consumption is affected by different roof membrane colours and insulation types/strategies across Canada.
CONVENTIONAL ROOFS: MEASURING IMPACTS OF INSULATION STRATEGY & MEMBRANE COLOUR IN CANADA
Graham Finch, MASc, P.Eng. Lorne Ricketts, MASc, EIT. Marcus Dell, MASc, P.Eng
BACKGROUND
Exposed membrane roofs (i.e. roofs with exposed roofing membrane on top of the roof insulation and structure, also called conventional roofs) make up the majority of low-slope roofing assemblies in Canada. Membrane colours from dark to light are chosen based on product availability, aesthetics, building type/use, energy efficiency, and standard practice, which varies from southern to northern latitudes. Lighter, more reflective membrane colours or finishes (high solar reflectivity index (SRI)) are common in hot climates where required by energy code (ASHRAE 90.1); though with Leadership in Energy and Environmental Design (LEED) projects and some other energy rating programs, light or white coloured roofs are often used regardless of geography. In Canada, the benefit of using white membrane roofs to achieve cooling savings is often small and can be offset by higher wintertime heating loads (DOE Cool Roof Calculator, 2013; Roof Savings Calculator, 2013; Smith, 2001).
The thermal insulation used within new conventional roofing assemblies typically consists of rigid polyisocyanurate (varying from <R-5 to R-6/inch), expanded polystyrene (EPS, R-4 to R-4.5/inch), or rigid stone wool (R-3.7 to R-4.3/inch). The R-value of insulation products varies depending on age,

14th Canadian Conference on Building Science and Technology - Toronto, Ontario 2014 Page 2
density, moisture content, et cetera and some variation can even exist between batches of the same product. Wood fiberboard, rigid fiberglass, extruded polystyrene (XPS), and spray polyurethane foam insulations are also used in some applications, but these additional insulation types are less common in new conventional roofs, except where wood fiberboard is used to protect the polyiso insulation during membrane installation. It is also common to use a combination of insulation layers within conventional roofs, thus blending the positive attributes of each insulation type in “hybrid systems”. An example of a hybrid system would be using polyisocyanurate over tapered EPS, or the use of rigid stone wool over polyisocyanurate, as investigated in this research. In this hybrid system, the stone wool is used on top of the polyisocyanurate as it is generally more dimensionally stable than polyisocyanurate (diurnal movement and long-term shrinkage), which reduces exposed membrane stresses and keeps the lower polyisocyanurate insulation layer within a tighter temperature range closer to the interior temperature (depending on the ratio of outboard insulation to polyisocyanurate insulation). This also results in conditions that optimize the apparent R-value of the polyisocyanurate insulation as covered later within this paper.
The research study investigates the thermal differences and net heat flux through conventional roof assemblies utilizing light to dark coloured (low to high solar absorptivity) roof membranes in conjunction with different insulation material combinations including polyisocyanurate and stone wool. It then extends these findings using whole building energy modeling to demonstrate how building energy consumption is affected by these roof characteristics.
FIELD MONITORING PROGRAM
A large-scale field monitoring study was implemented in the Lower Mainland of British Columbia with the intent of measuring the impacts and benefits of roof membrane colour and insulation strategy on the long-term thermal and hydrothermal behaviour and performance of conventional roofing assemblies.
The roofing variables consist of three different 2-ply SBS membrane cap sheet colours placed over three different conventional insulation strategies (polyisocyanurate, stone wool, and a hybrid combination of both) creating a total of nine unique roofing assemblies each 1600 ft2 (150 m2) on the same building. The thicknesses of the insulation combinations were varied to achieve approximately the same total effective R-value in each assembly.
Sensors were installed within each of the nine roof assemblies to measure material temperatures, relative humidity, moisture content, heat flux, and dimensional stability of the insulation. Reflected solar radiation from the roof cap sheets was measured using solar radiation sensors (pyranometers) pointed downwards towards the roof surface, and direct solar radiation was measured with a solar radiation sensor as part of the weather station used to measure exterior conditions. In addition, a camera was set-up to automatically capture photos of the roof surfaces to study the impact of night sky cooling, wetting/frost, and soiling of the white membrane. Finally, the apparent R-values of the insulation products were measured in a laboratory to allow for comparison with the in-situ values calculated using the embedded heat flux and temperature sensors.
The study building is an industrial building located in Chilliwack within the Lower Mainland of British Columbia, Canada. The climate within Chilliwack is similar to the larger metropolis of Vancouver, though as it is farther inland, it gets hotter in the summer and colder in the winter. The average annual

14th Canadian Conference on Building Science and Technology - Toronto, Ontario 2014 Page 3
temperature at the Chilliwack airport, located approximately 1 km from the site is 10.5°C, with the average July temperature of 18.5°C and January temperature of 2.2°C (Environment Canada 2013).
The building was selected because it provided a single large uninterrupted test area for the roof monitoring, the construction schedule coincided with the research study, and the building owners were willing to have a number of different roof assemblies installed on their building. Prior monitoring of an adjacent building housing similar industrial storage and equipment ascertained that the interior conditions in the new building would be on average between 20°C and 25°C year round. A sketch of the building is presented in Figure 1 showing the three different membrane colours and three insulation combinations. As shown, the nine roof assemblies were constructed and monitored at the west part of the building. The adjacent section of the roof along the east side is insulated with stone wool, but is not monitored or included within the study.
Figure 1 Study Building and Layout of Roof Membrane Cap Sheet Colour and Insulation Strategy
Each roof assembly consists of a 2-ply torch-on SBS cap (white, grey, or black) and base sheet over asphalt protection board (only over polyisocyanurate), insulation layers (as indicated), reinforced air/vapour barrier membrane, and metal Q-deck over open web steel joists. The air/vapour barrier membrane spans between the metal deck flutes, and has been designed and tested by the manufacturer to do so without sagging in this application. The use of a continuous rigid gypsum board over the deck flutes with standard self-adhered membrane is generally more common in this application.
The asphalt protection board (where used) and insulation layers are structurally adhered together and to the air/vapour barrier membrane using a low-rise, two-part urethane adhesive, negating the need for mechanical fasteners in the assembly and associated perforations in the air barrier membrane. The top surface of the stone wool insulation contains an integral asphalt impregnated surface and does not require an additional overlay protection board.
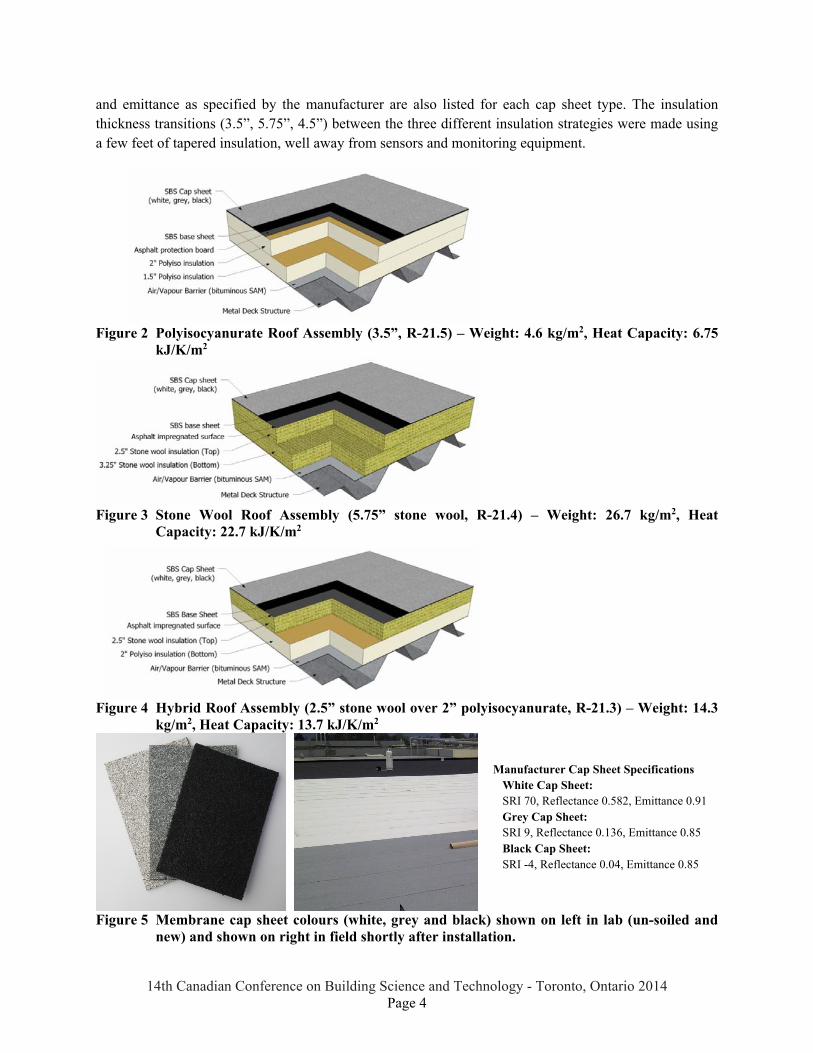
The three SBS cap sheet colours include standard black, grey, and white (LEED compliant SRI cap). The thickness of each insulation combination was varied to achieve approximately the same design R-value of R-21.5 (at standard test conditions of 23.9°C). Samples of insulation were taken from the site for laboratory testing covered later in this paper. These three insulation combinations are shown in Figures 2 through 4 along with the apparent R-value of the insulation, insulation weight, and total insulation heat capacity. Figure 5 shows the membrane cap sheet colours. The solar reflective index (SRI), reflectance,
Polyisocyanurate
Hybrid
Stone wool
120’ 120’
W – ISO-SW
W – SW
W – ISO G – ISO-SW
G – SW
G – ISO
B – ISO-SW
B – SW
B – ISO
14th Canadian Conference on Building Science and Technology - Toronto, Ontario 2014 Page 4
and emittance as specified by the manufacturer are also listed for each cap sheet type. The insulation thickness transitions (3.5”, 5.75”, 4.5”) between the three different insulation strategies were made using a few feet of tapered insulation, well away from sensors and monitoring equipment.
Figure 2 Polyisocyanurate Roof Assembly (3.5”, R-21.5) – Weight: 4.6 kg/m2, Heat Capacity: 6.75 kJ/K/m2
Figure 3 Stone Wool Roof Assembly (5.75” stone wool, R-21.4) – Weight: 26.7 kg/m2, Heat Capacity: 22.7 kJ/K/m2
Figure 4 Hybrid Roof Assembly (2.5” stone wool over 2” polyisocyanurate, R-21.3) – Weight: 14.3 kg/m2, Heat Capacity: 13.7 kJ/K/m2
Figure 5 Membrane cap sheet colours (white, grey and black) shown on left in lab (un-soiled and
new) and shown on right in field shortly after installation.
Manufacturer Cap Sheet Specifications White Cap Sheet: SRI 70, Reflectance 0.582, Emittance 0.91 Grey Cap Sheet: SRI 9, Reflectance 0.136, Emittance 0.85 Black Cap Sheet: SRI -4, Reflectance 0.04, Emittance 0.85

14th Canadian Conference on Building Science and Technology - Toronto, Ontario 2014 Page 5
In conjunction with the field monitoring program, ASTM C518 laboratory material testing of the thermal resistance of polyisocyanurate and stone wool insulation was undertaken on representative batch samples of the products installed within the test roofs (within 2 months of manufacturing) and some additional polyisocyanurate products which were aged for 4 years. This data is used to the support the field monitoring data and demonstrates that while the total effective R-value for each assembly is between R-21.3 and R-21.5, the apparent R-value for each case will vary depending on the in-service conditions.
Figure 6 presents both the apparent insulation R-value per inch as determined by ASTM C518 testing for actual insulation samples used in this study, as well as the total R-values for each of the 3 insulation assemblies (Figures 3-5) based on the membrane surface temperature and anticipated thermal gradient through the assembly (Dell and Finch, 2013). The impact of long-term polyisocyanurate aging is predicted with the matching colour dashed lines for both the hybrid and polyisocyanurate assemblies. This plot demonstrates the sensitivity of the apparent R-value of the different roof assemblies when exposed to either extreme cold or hot outdoor temperatures. The results agree well with published data for stone wool and polyisocyanurate data from the National Roofing Contractors Association (Graham 2010, NRCA 2011) and Building Science Corporation (BSC 2013a).
The roof assembly constructed polyisocyanurate may have a calculated effective R-value of R-21.3, but when exposed to cold (-10°C) would drop to R-20 or potentially as low as R-16.5 depending on aging effects; and when exposed to hot temperatures (60°C membrane surface temperature) would drop to R-19 or potentially as low as R-17 during those peak hours depending aging effects. In the hybrid assembly, the use of a layer of stone wool insulation (in this study, equivalent to approximately 45% of the assembly R-value) over top of the polyisocyanurate significantly improves the effective R-value of the polyisocyanurate as it keeps it near optimum temperatures (near room temperature); and therefore, results in a better assembly R-value in cold and hot conditions. The roof assembly insulated with entirely stone wool insulation will have a more stable R-value (increasing at colder temperatures, but decreasing at hot temperatures from calculated R-value), but is not susceptible to a loss of R-value with age.

14th Canadian Conference on Building Science and Technology - Toronto, Ontario 2014 Page 6
3.0
3.5
4.0
4.5
5.0
5.5
6.0
6.5
‐10 0 10 20 30 40 50
Insulation R‐value per Inch ‐IP Units
Mean Temperature of Insulation [°C]
Installed & Aged Insulation R‐valuesper Inch vs Mean Temperature
Polyiso ‐ Average
Polyiso ‐ Aged (4 years)
Stone Wool ‐ Average
14
15
16
17
18
19
20
21
22
23
24
‐10 0 10 20 30 40 50 60
Effective Assembly R‐value
Outdoor Membrane Surface Temperature [°C](Indoor, 21oC)
Effective Roof Insulation R‐value ‐ Based on Roof Membrane Temperature
Stone Wool (Initial or Aged)Hybrid (Initial Average)Hybrid (Aged)Polyiso (Initial Average)Polyiso (Aged)
Figure 6 Insulation Board R-value/inch depending on insulation temperature (left) and Study Roof Assembly R-value depending on membrane surface temperature (right)
FIELD MONITORING RESULTS
This paper presents results from the field monitoring program with a focus on the differences in thermal behaviour between the different insulation strategies and membrane colours. To compare the insulation assemblies, the measured heat flux data along with cap surface temperature and interior surface temperatures are compared for each assembly. Of interest are key behavioural differences between the polyisocyanurate and stone wool due to varying apparent R-value, different heat capacities, and latent energy transfer, in conjunction with roof membrane colour.
Based on the monitoring to date, we have found large differences in heat flux and the interior and exterior surface temperatures due to light to dark membrane colour as would be expected. Significant differences in the heat flux and interior and exterior surface temperatures were found depending on the insulation strategy. This finding is unique to this study. An apparent thermal lag is observed within the stone wool insulation and hybrid insulation assemblies compared to the polyisocyanurate insulation. This finding presents as dampened heat flux measurements, reduced cap sheet surface temperatures, and lower interior surface temperatures, primarily when the roof is heated by the sun. At night or during cold sunless winter days, the differences between the assemblies are very small. This lag in temperatures can be beneficial from a thermal comfort and energy efficiency standpoint because it moderates peak temperatures well as energy losses and gains. The reduction in peak membrane temperature and in rate of membrane temperature change also likely reduces the rate of deterioration of the membrane. It is theorized that this thermal lag effect is primarily due to the difference in heat capacity between the two types of insulation types and thus the difference in heat capacity of the three insulation arrangements. The temperature-dependence of the polyisocyanurate thermal resistance (R-value) and latent energy transfer from moisture movement through the stone wool insulation are also contributing factors.

14th Canadian Conference on Building Science and Technology - Toronto, Ontario 2014 Page 7
Figure 71 presents the hourly heat flux measurements for a representative 2-day seasonal winter and summer period. Measured heat flux data compares the hourly transfer of heat energy across each assembly from interior to exterior. A positive value indicates that heat flow is upwards (i.e. when the interior is warmer than the exterior membrane surface temperature) and a negative value indicates that heat flow is inwards (i.e. membrane heated above interior temperature by solar radiation).
As expected, there is a large difference in the heat flux between the black and white cap membranes at peak conditions, but there are also significant differences between the polyisocyanurate and stone wool insulation arrangements. The heat flow through the stone wool compared to the polyisocyanurate in these cases is typically less and is offset by a few hours.
‐25
‐20
‐15
‐10
‐5
0
5
10
Feb 21 Feb 22 Feb 23
Heat Flux [W
/m²]
‐25
‐20
‐15
‐10
‐5
0
5
10
May 9 May 10 May 11
W‐ISO HF
W‐ISO‐SW HF
W‐SW HF
G‐ISO HF
G‐ISO‐SW HF
G‐SW HF
B‐ISO HF
B‐ISO‐SW HF
B‐SW HF
Figure 7 Heat Flux Measurements through each Roof Assembly – February 21-23, 2013 (cold) and May 9 – 11, 2014 (warm).
Figure 8 presents the monthly average daily energy transfer for the average of the poyliso, hybrid and stone wool roof assemblies, and Figure 9 the same data but averaged for the white, grey, and black roof membranes. Average exterior temperature for each month is also provided on each graph. These two figures clearly illustrate the different performance of the roof assemblies. Differences are more dramatic during the warmer months when exposed to more solar radiation and indicate less heat flow through the stone wool assemblies than through the polyiso assemblies. The lowest amount of inward heat flux occurs with the stone wool assemblies followed by the polyiso and then the hybrid insulation assemblies. The assemblies with a white cap sheet also typically had less inward heat flux than the black and grey roofs.
1 In all of the subsequent plots within the legend code, ‘W’ refers to the white roof membrane, ‘G’ for grey, and ‘B’ for black. ISO refers to the polyiso insulation, and ISO-SW refers to the hybrid (stone wool over polyiso), and SW refers to the stone wool. The 9 different test areas are defined in short form using a combination of these letters. Within the heat flux plots, negative values indicate gain of energy through the roof insulation (e.g. due to solar loading) and positive values indicate a loss of energy (e.g. due to colder outdoor conditions).

14th Canadian Conference on Building Science and Technology - Toronto, Ontario 2014 Page 8
0
5
10
15
20
25
‐150
‐100
‐50
0
50
100
May Jun Jul Aug Sept Oct Nov Dec Jan Feb Mar Apr Annual
Temperature [°C]
Daily Energy Tran
sfer [W
∙hr/m² per day]
ISO ISO‐SW SW Ambient Exterior Temperature
Figure 8 Monthly Average Daily Energy Transfer by insulation arrangement
0
5
10
15
20
25
‐200
‐150
‐100
‐50
0
50
100
May Jun Jul Aug Sept Oct Nov Dec Jan Feb Mar Apr Annual
Temperature [°C]
Daily Energy Tran
sfer [W
∙hr/m² per day]
White Grey Black Ambient Exterior Temperature
Figure 9 Monthly Average Daily Energy Transfer by membrane colour
Roof membrane surface temperatures and interior metal deck surface temperatures are presented for selected days for the winter (Feb 22), and summer (June 30) within Figures 10 and 11 respectively. These plots show the seasonal differences in membrane and interior surface temperatures from dark to light roofing and demonstrate the temperature lag between the stone wool, hybrid, and polyisocyanurate insulation strategies. These findings support the differences in measured heat flux as shown above and help understand what other impacts the difference in insulation strategy has.

14th Canadian Conference on Building Science and Technology - Toronto, Ontario 2014 Page 9
0
10
20
30
40
50
60
70
80
90
Jun 30 00:00 Jun 30 06:00 Jun 30 12:00 Jun 30 18:00 Jul 1 00:00
Temperature [°C]
W‐ISO T‐CAP
W‐ISO‐SW T‐CAP
W‐SW T‐CAP
G‐ISO T‐CAP
G‐ISO‐SW T‐CAP
G‐SW T‐CAP
B‐ISO T‐CAP
B‐ISO‐SW T‐CAP
B‐SW T‐CAP
Outdoor‐T
Figure 10 Roof Membrane Cap Sheet Temperature for 9 Monitored Roof Assemblies – June 30, 2013 (Summer)
24
26
28
30
32
34
36
Jun 30 00:00 Jun 30 06:00 Jun 30 12:00 Jun 30 18:00 Jul 1 00:00
Temperature [°C]
W‐ISO TEMP‐DECK
W‐ISO‐SW TEMP‐DECK
W‐SW TEMP‐DECK
G‐ISO TEMP‐DECK
G‐ISO‐SW TEMP‐DECK
G‐SW TEMP‐DECK
B‐ISO TEMP‐DECK
B‐ISO‐SW TEMP‐DECK
B‐SW TEMP‐DECK
Figure 11 Interior Metal Roof Deck Surface Temperature for 9 Monitored Roof Assemblies – June 30, 2013 (Summer)
As shown by the summertime data, the use of stone wool insulation compared to polyisocyanurate reduces peak membrane surface temperatures, reduces the peak interior surface temperature, and shifts the peak temperatures by 1 to 2 hours later. This can be a potential benefit for both thermal comfort and cooling energy consumption.
As demonstrated by the first set of wintertime data the exterior surface of the polyisocyanurate insulation roof typically has the coldest temperatures (all colours), followed by the stone wool insulation and hybrid insulation assemblies. This indicates less heat loss through and higher apparent R-value of the polyisocyanurate insulation compared to the hybrid or stone wool under these conditions.

14th Canadian Conference on Building Science and Technology - Toronto, Ontario 2014 Page 10
ENERGY MODELING & EXTRAPOLATION OF FINDINGS
Using the field monitoring study as calibration data, whole building energy modeling was performed to investigate the optimum roof membrane colour (solar absorptivity) and insulation strategy for a conventional roof. Simulation runs were used to compare the same white, gray, and black roof membranes, and polyisocyanurate, stone wool, and hybrid insulation strategies as used in the monitoring study. Energy modeling of these variables was performed using the U.S. Department of Energy (DOE) Building Energy Codes Program commercial building prototype model for a stand-alone retail building designed to meet ASHRAE 90.1-2010. These files are available online, and use the hourly energy modeling program EnergyPlus. (DOE, 2012).
One goal of the energy modeling was to investigate the impact of temperature dependant insulation R-values and insulation aging at the roof on whole building energy consumption. While the material testing discussed earlier within the paper identified thermal conductivity variations with temperature are different for polyisocyanurate and stone wool insulation, this effect is typically not modeled in most whole building simulation programs, but can be modeled in EnergyPlus. This involves adjusting the thermal conductivity based on the calculated roof membrane temperature. Adjustment of this property and inclusion of heat capacity produced simulation results which reflected that observed in the field. This is an important finding for energy modelers and needs to be addressed by the default insulation material properties within energy modeling programs.
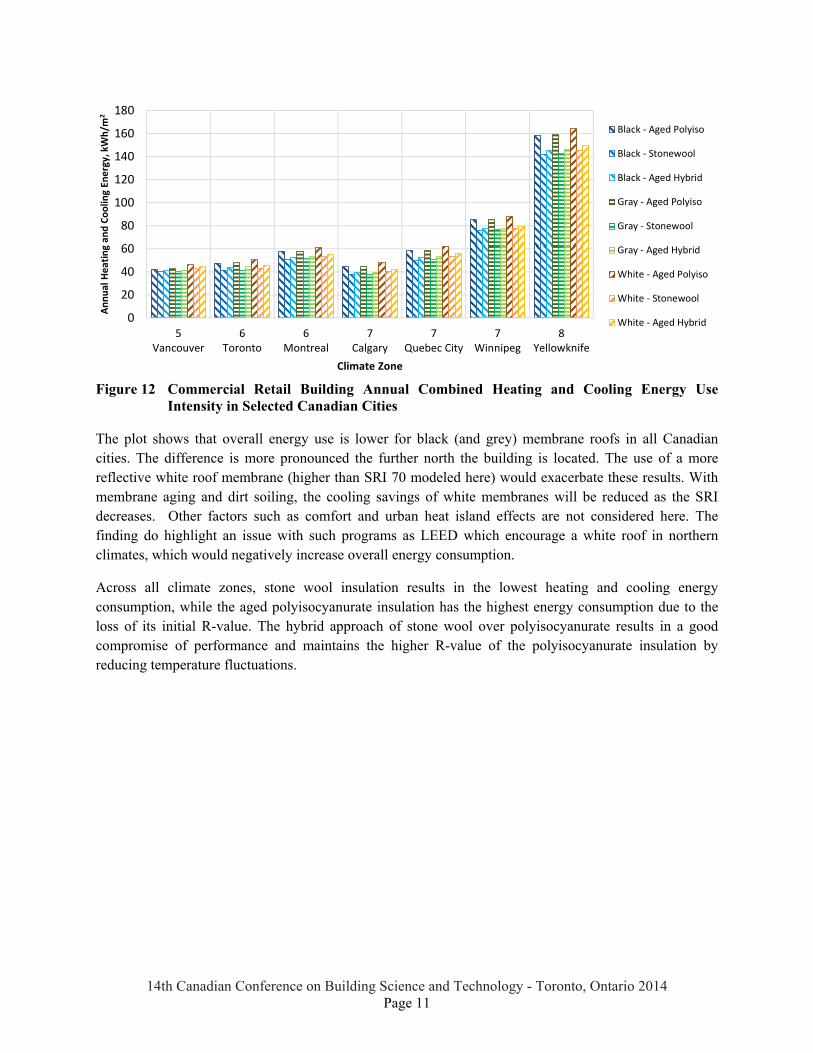
Figure 12 presents the annual combined heating and cooling energy for selected Canadian cities with the same black and white roof membranes (SRI -4 and +70 respectively) as used in the study, and aged polyisocyanurate, stone wool or hybrid insulation. Note that this modeling does not account for the effect of snow on the reflectivity of the roofs. Not shown are the breakdown between heating and cooling though in general a black membrane uses less heating energy but more cooling energy, while the white roof uses less cooling energy but more heating energy. The overall space conditioning consumption depends on the balance of heating and cooling energy within that city.
14th Canadian Conference on Building Science and Technology - Toronto, Ontario 2014 Page 11
0
20
40
60
80
100
120
140
160
180
5Vancouver
6Toronto
6Montreal
7Calgary
7Quebec City
7Winnipeg
8Yellowknife
Annual Heating an
d Coolin
g En
ergy, kWh/m
2
Climate Zone
Black ‐ Aged Polyiso
Black ‐ Stonewool
Black ‐ Aged Hybrid
Gray ‐ Aged Polyiso
Gray ‐ Stonewool
Gray ‐ Aged Hybrid
White ‐ Aged Polyiso
White ‐ Stonewool
White ‐ Aged Hybrid
Figure 12 Commercial Retail Building Annual Combined Heating and Cooling Energy Use Intensity in Selected Canadian Cities
The plot shows that overall energy use is lower for black (and grey) membrane roofs in all Canadian cities. The difference is more pronounced the further north the building is located. The use of a more reflective white roof membrane (higher than SRI 70 modeled here) would exacerbate these results. With membrane aging and dirt soiling, the cooling savings of white membranes will be reduced as the SRI decreases. Other factors such as comfort and urban heat island effects are not considered here. The finding do highlight an issue with such programs as LEED which encourage a white roof in northern climates, which would negatively increase overall energy consumption.
Across all climate zones, stone wool insulation results in the lowest heating and cooling energy consumption, while the aged polyisocyanurate insulation has the highest energy consumption due to the loss of its initial R-value. The hybrid approach of stone wool over polyisocyanurate results in a good compromise of performance and maintains the higher R-value of the polyisocyanurate insulation by reducing temperature fluctuations.

14th Canadian Conference on Building Science and Technology - Toronto, Ontario 2014 Page 12
CONCLUSIONS & RECOMMENDATIONS
This large-scale field monitoring study was implemented with the intent of measuring the impacts and benefits of roof membrane colour and insulation strategy on the long-term thermal and hygrothermal behaviour and performance of conventional roofing assemblies. As part of the study, thermal resistance testing of the polyisocyanurate and stone wool insulation was performed using ASTM C518 procedures. The insulation products were tested at a range of in-service temperatures, and a relationship between R-value and temperature was developed. The results were then applied to the three insulated assemblies monitored within this study to determine in-service apparent R-values based on exterior membrane temperature. The findings show that the stone wool and hybrid roofs will maintain R-values close to calculated values, whereas the R-value in the roof with polyisocyanurate will drop a fair amount when exposed to either extreme of cold or hot outdoor (and solar radiation induced) temperatures. This is an important consideration when designing roof assemblies.
The heat flow and temperature measurements show a difference in behaviour between the polyisocyanurate, stone wool, and hybrid insulation strategies. Stone wool has a more stable R-value than polyisocyanurate and in conjunction with a higher heat capacity and latent energy movement, will reduce peak temperatures of the membrane and interior, and offsets the peak load (thermal lag effects). This reduction in peak roof membrane temperatures as well as in the rate of temperature change positively affects the longevity of the membrane as larger magnitude and faster dimensional changes of viscoelastic materials (such as modified bitumen roof membranes) negatively affect their durability (Dell, 1990). Reduced peak interior temperatures also typically improve occupant comfort.
Energy modeling was used as a tool to better understand the impact of temperature dependant insulation R-values on annual space heating and cooling consumption and to demonstrate the importance of accounting for a varying R-value in energy models. In addition to accounting for a dynamic R-value, including the long-term aging effects of polyisocyanurate is particularly important in predicting long-term energy use within a building.
Energy simulation runs were used to extrapolate the findings and compare the same white, gray, and black roof membranes, and polyisocyanurate, stone wool and hybrid insulation strategies as used in the monitoring study to other Canadian cities. Energy modeling of these variables was performed using the U.S. Department of Energy (DOE) Building Energy Codes Program commercial building prototype model for a stand-alone retail building designed to meet ASHRAE 90.1-2010.
Comparing roof membrane colour across each Canadian city, the black membrane uses less heating energy but more cooling energy, while the white roof uses more cooling energy but less heating energy. Overall energy use is lower for black (and grey) roofs in heating dominated climate zones, even in Canadian cities with cooling requirements in the summer. With membrane aging and dirt soiling, the cooling savings of white membranes will be reduced as the surface reflectivity decreases (though one could also anticipate some heating savings as a result).
Across all climate zones, stone wool insulation results in the lowest heating and cooling energy consumption, while aged polyisocyanurate insulation has the highest energy consumption due to the loss of its initial R-value. The hybrid approach of stone wool over polyisocyanurate results in a good compromise of performance and maintains the higher R-value of the polyisocyanurate insulation.

14th Canadian Conference on Building Science and Technology - Toronto, Ontario 2014 Page 13
This study provides insight into the behaviour of polyisocyanurate and stone wool insulated conventional roof assemblies with light to dark roofing membranes. The study is ongoing and will continue for the next few years.
ACKNOWLEDGEMENTS
The authors wish to thank the product manufacturers and building owner for providing a roof to test, the building materials, funding, and providing technical peer review on this project. Special recognition is also extended to SMT Research for installing and troubleshooting the sensors and data-logging equipment, and to Building Science Labs for the ASTM C518 material testing.
REFERENCES
ASTM Standard C518, 2010, “Standard Test Method for Steady-State Thermal Transmission Properties by Means of the Heat Flow Meter Apparatus” ASTM International, West Conshohocken, PA, 2010. Available at http://www.astm.org/Standards/C518.htm.
ASHRAE Standard 90.1 “Energy Standard for Buildings except Low-Rise Residential Buildings” I-P and S-I Editions. 2007, 2010. ANSI/ASHRAE/IESNA. American Society of Heating, Refrigerating and Air-Conditioning Engineers, Inc. Available at: http://www.ashrae.org.
Building Science Corporation (BSC). 2013a. BSC Information Sheet 502: Understanding the Temperature Dependence of R-values for Polyisocyanurate Roof Insulation. Available at: http://www.buildingscience.com.
Building Science Corporation (BSC). 2013b. The Thermal Metric Project. Available at: http://www.buildingscience.com/documents/special/thermal-metric/
Dell, M. 1990. Behavioral characteristics of fully adhered modified bitumen roof membranes when subjected to in-plane loads. University of Waterloo, 1990. Waterloo, Ontario.
Dell, M., and Finch, G., 2013. Monitored Field Performance of Conventional Roofing Assemblies – Measuring the Benefits of Insulation Strategy. Proceedings from the 2013 RCI Symposium on Building Envelope Technology, November 13-14, 2013, Minneapolis, Minnesota.
DOE. 2012. Building Energy Codes Program – Commercial Prototype Building Models. Available at: http://www.energycodes.gov/development/commercial/90.1_models
DOE Cool Roof Calculator. 2013. Oak Ridge National Laboratory. Software Version 1.2. Available online: http://web.ornl.gov/sci/roofs+walls/facts/CoolCalcEnergy.htm.
Environment Canada. 2013. Canadian Climate Normals, Chilliwack Airport. Available at: http://climate.weather.gc.ca/climate_normals/
Graham, M., 2010. Revised R-values, Professional Roofing, May 2010. Available at: http://www.professionalroofing.net/.
Hedlin, C.P., 1987. Seasonal Variations in the Modes of Heat Transfer in Moisture Porous Thermal Insulation in a Flat Roof. Journal of Thermal Insulation, Vol. 11, p54-66, July 1987, (IRC Paper No. 1496).
Roof Savings Calculator (RSC). 2013. Oak Ridge National Laboratory and Lawrence Berkeley National Laboratory. Software Version v0.92. Available online: http://www.roofcalc.com/index.shtml.
Smith, T.L., 2001. Benefits of Reflective Roofs in Northern Areas of the U.S.. Proceedings of the 16th International Convention & Trade Show, April 20-24, 2001, Baltimore, Maryland.