cooper, j c b (1982) the chemical industry. quarterly
TRANSCRIPT

Students Brief
THE CHEMICAL INDUSTRY
by J C B Cooper, Glasgow C o l l e g e of Technology
Chemistry has always been of fundamental importance to human l i f e and the o r i g i n s of the chemica l i n d u s t r y d a t e back to t h e o r i g i n s of c i v i l i s a t i o n i t s e l f . The use of f i r e , the baking of c l a y , t he use of dyes e t c a r e a l l chemica l p r o c e s s e s but p robab ly most people a s s o c i a t e the o r i g i n s of chemistry with the 15th century a l chemis t s who sought to convert abundant m a t e r i a l s i n t o va luable commodities. In p a r t i c u l a r , the p r i n c i p a l aim of the a lchemis t was to f ind the Phi losopher ' s Stone, a myster ious agent which possessed the p r o p e r t i e s of producing gold and prolonging l i f e . Cer ta inly they never succeeded in c r ea t ing gold but many permanent, bene f i c i a l sp inoffs were effected r e s u l t i n g in the sc ience of chemis t ry , which has indeed c o n t r i b u t e d to p r o l o n g i n g l i f e . S impson ' s i n t r o d u c t i o n of ch loroform to s u r g e r y in 1847, L i s t e r ' s d i s c o v e r y of c a r b o l i c ac id as a d i s i n f e c t a n t in 1867 and F l e m i n g ' s d i s c o v e r y of p e n i c i l l i n in 1928 a r e we l l -documented examples.
Industry Structure
In our modern world, the chemical indus t ry occupies a sprawl ing , i l l - d e f i n e d t e r r a i n a t the hear t of every i n d u s t r i a l economy. I t s boundaries can only be de l inea ted in a very a r b i t r a r y way s ince so many other i n d u s t r i e s such as b r e w i n g , s t e e l and paper a r e in e f f e c t complex c h e m i c a l p r o c e s s e s . Thus from a s t a t i s t i c a l p o i n t of view d e f i n i t i o n of t he c h e m i c a l s e c t o r can be very confusing. For example, the OECD and United Nations include Manmade F i b r e s and S y n t h e t i c Rubber in t h e chemica l i n d u s t r y but both exclude P l a s t i c s . On the other hand, the European Petrochemical Associat ion does include P l a s t i c s . S i m i l a r l y , when making i n t e r company comparisons, there i s often the d i f f i c u l t y of deciding whether a company i s p r imar i ly concerned w i t h c h e m i c a l s in one form or a n o t h e r or whether i t r e a l l y be longs to a n o t h e r i n d u s t r y . The re fo re t h e i n t e r p r e t a t i o n of s t a t i s t i c s i s f r a u g h t with p i t f a l l s and the user must t ry to be c o n s i s t e n t .
In the UK the chemical indus t ry i s regarded as comprising those sub- sec to r s shown in Table 1.
These sub - sec to r s in turn are dominated by huge m u l t i n a t i o n a l s each with a massive i n t e r n a t i o n a l spread of inves tments and toge the r they produce the 60,000 c h e m i c a l p r o d u c t s in use in t h e world t o d a y . The twen ty l a r g e s t chemical companies in the world in 1980 outwith the USA are shown in Table 2. The major UK chemica l companies in 1979 a r e shown in Table 3 and such
•The v iews e x p r e s s e d a r e t h o s e of t he a u t h o r and not n e c e s s a r i l y t hose of the Fraser of Allander I n s t i t u t e .
29

TABLE 1 THE UK CHEMICAL INDUSTRY IN 1979
Sub-Sector
Organic Chemicals
Inorganic Chemicals
Other General Chemicals
Pharmaceut.
Toilet Prep.
Paint
Soap & Det.
Synthetic Resins
Synthetic Rubber
Dyestuffs
Fertiliser
Other Chem.
Total Chem. Industry
Output Consumption Exports Imports Employees Capital (£m) (£m) (£m) (£m) (000) Expenditure
(£m)
2,722 2,506
1 ,153
1,543
1 ,675
591
732
707
1,836
164
430
584
1 ,661
1 ,207
1 ,056
1 ,303
504
655
607
1,919
182
303
622
1 ,470
1,251 1,035
293
971
602
161
119
156
720
72
249
58
559
347
484
230
74
42
56
803
82
122
96
368
13,798 12,334 5,211 3,739
136.4
72.8
24.4
25.9
25.9
52.2
20.4
11 .4
66.6
427.0
255.7
149.9
150.3
138.5
30.5
26.9
25.1
168.1
65.8
75.0
77.0
1,163
Source: Nat ional Economic Development Office
Note: F igures for employment re fe r to June 1980
f i rms impinge more and more upon every f ace t of our da i ly l i v e s - the home, food, c l o t h i n g , t r a n s p o r t , work, r e c r e a t i o n , h e a l t h , even crime d e t e c t i o n . Many of t h e w o r l d ' s major c h e m i c a l f i r m s have a p r e s e n c e in t h e UK but in add i t ion t h e r e are o p p o r t u n i t i e s for medium sized and smal l companies which meet the requ i rements of p a r t i c u l a r use rs where these needs are too small to a t t r a c t t h e a t t e n t i o n of t h e g i a n t compan ies . The l o c a t i o n of t h e s e companies in t h e UK t e n d s to be d i c t a t e d by g e o g r a p h i c a l and economic r e a s o n s . For example , in t h e S t r a t h c l y d e r e g i o n of S c o t l a n d , t h e r e a r e a p p r o x i m a t e l y 100 c h e m i c a l companies p roduc ing the whole spec t rum of chemicals and they are l oca t ed t h e r e for a number of reasons . The indus t ry r e q u i r e s v a s t q u a n t i t i e s of w a t e r which must be of pure q u a l i t y and S t r a t h c l y d e i s f o r t u n a t e in hav ing a p l e n t i f u l supply which i s a l m o s t completely f r ee from calcium and magnesium s a l t s . Furthermore, s u b s t a n t i a l c a p i t a l i n v e s t m e n t i s c u r r e n t l y underway on s e v e r a l new w a t e r supply schemes , which w i l l t o g e t h e r add a f u r t h e r 40 m i l l i o n g a l l o n s per day t o c a p a c i t y , and on s e w e r e a g e t r e a t m e n t and d i s p o s a l - nowadays a very s e n s i t i v e problem and j u s t i f i a b l y s o . The r e g i o n i s a l s o se rved by an ex tens ive mororway network, r a i l f r e i g h t and e x c e l l e n t por t f a c i l i t i e s while the two a i r p o r t s a t Glasgow and P r e s t w i c k p r o v i d e e x t e n s i v e d o m e s t i c and
30

international connections. Moreover, the region's universities and colleges produce a substantial pool of graduates and other technically qualified personnel as well as providing various opportunities for basic research. Indeed, many chemical firms have developed close links with them.
TABLE 2 LARGEST CHEMICAL COMPANIES OUTWITH THE USA BY SALES (1980)
Company
Hoechst Bayer BASF ICI Montedison DSM Rhone-Poulenc Ciba Geigy Akzo Charbonnageo de France Solvay Mitsubishi Chemical Roche/Sapac Sumitomo Chemical Asahi Chemical Sandoz British Oxygen Chemische Werke Huls Toray L'Air Liquide
Country
W Germany W Germany W Germany UK Italy Netherlands France Switzerland Netherlands
France Belgium Japan Switzerland Japan Japan Switzerland UK W Germany Japan France
Sales ($m)
16,481 15,881 15,277 13,290 9,104 7,514 7,155 7,113 6,272
4,959 4,742 4,127 3,496 3,181 3,103 2,926 2,710 2,678 2,644 2,614
Assets (*m)
12,329 13,453 9,264 14,535 9,913 4,511 6,527 9,878 4,470
5,180 3,885 4,374 5,421 3,073 2,824 3,234 3,406 1,463 2,550 2,509
Source: Fortune
Net Income (*m)
252 356 198
- 47 -524 13
-461 182
- 35
- 50 59 42 138 39 95 121 60 34 72 134
Employees
186,850 181,639 116,518 143,200 105,532 31 ,410 95,389 81 ,184 83,100
77,600 49,057 14,066 43,643 11 ,898 20,779 35,459 44,700 18,063 22,093 25,000
Note: Financial data have been converted to US dollars at the average official exchange rate during the company's fiscal year. Shell, Courtauld and BP do not appear in this Table because they are regarded by Fortune as belonging to alternative industries.
In general, however, major chemical complexes tend to be located at coastal locations, most notably BP's Grangemouth complex with employs 2,400 people and manufactures 750,000 tons of chemicals and plastics per year using feedstocks from the adjacent BP oil refinery. This site covers 470 acres of which 170 are still available for future expansion and much of the chemicals output goes "over the fence" to neighbouring chemical plants such as Bakelite/Xylonite (now part of BP), Borg Warner and Industrial Synthetic Rubber. The major locations of UK bulk polymer production along with companies involved and capacities are shown in Table 4.
As an example of a small specialist firm, one is particularly worthy of note. The small Yorkshire firm, Phosyn Chemicals was set up in 1967 by two partners to manufacture trace element fertilisers for particularly difficult regions of the World. Six years ago the company visited Libya after
31

TABLE 3 THE LARGEST UK CHEMICAL COMPANIES BY SALES (1979)
Capital Research Sales Assets Net Income Expenditure Expenditure
Company ($m) ($m) ($m) ($m) ($m)
ICI Shell Chemicals Courtaulds BP Chemicals British Oxygen Beecham Unilever Glaxo Fisons Wellcome
11 ,755.9 6,808.7 3,638.9 3,116.4 2,691.5 2,021 .6 1 ,414.7 1 ,180.5
948.3 901.3
9,752.1 4,614.3 1 ,770.0 2,507.6 2,409.0 1,396.6 N/A 789.9 538.1 699.5
908.9 N/A 95.9 N/A 65.7 178.7 N/A 79.7 28.9 N/A
1 ,664.4 906.7 110.6 300.0 289.5 105.8 67.9 92.3 37.4 59.1
405.2 N/A N/A N/A N/A 68.5 N/A 71.2 31 .6 85.6
Source: Chemical Age
learning that the country was trying to grow wheat in the Sahara Desert. Soil samples showed which vital elements the desert lacked and within two years Phosyn had improved the wheat yield by 140%. The company has since gone on to apply its expertise to other agricultural problems in twelve countries, custom-manufacturing products to suit special needs - a classic example of market orientation.
Sulphuric acid is an important chemical which quickly loses its identity as a product and is rarely encountered directly in daily life (except perhaps in vehicle batteries), but it is a chemical upon which many other industries depend. Hence, fluctuation in the production of this "workhorse chemical" is often regarded as a barometer of the state of an industrial nation as a whole, although some chemists woul'd argue that the production of the petrochemical ethylene, the building block of the modern chemical industry, is of more interest. Indeed, in the UK, output of the petrochemical sub-sector is about 25? of the total chemical industry, involves around 25 companies with ICI, Shell Chemicals BP Chemicals and Esso Chemicals dominating and employs roughly 75,000 people. In the EEC, the chemical sector contributes about 10% of the gross value added of manufacturing industry, ranking fourth after food, engineering and transport equipment. With regard to gross formation of capital, the chemical sector comes first illustrating the very capital intensive nature of the business. Total new capital invested by the European chemical industries during the 1970's and 1980 is shown in Table 5.
Capital expenditure during the first half of 1981 was £605 million which is some 16% down on the same period of 1980. Given the present levels of surplus capacity, low profitability and poor growth prospects, several companies have indicated further cutbacks in their future investment plans.
Despite being highly capital intensive and despite the very rapid rate of technological change in this industry, the chemical sector is still a major employer in the UK although admittedly there has been a steady drop over the past decade from 443,000 at the end of 1970 to 431,000 at the end of 1980. This latter figure does of course mask significant short time working.
32

TABLE 4 PRODUCTION LOCATIOM OF MAJOR BULK POLYMERS
Material Company Capacity Location
Low Density Poly-ethylene
High Density Polyethylene
Polypropylene
Polystyrene
BXL (BP Chemicals) ICI Monsanto Shell
BP Chemicals
ICI Shell
Dow Shell ATO (UK)
Poly Vinyl Chloride BP Chemicals British Industrial Plastics ICI Vinatex
Acrylonitrile Butadiene Styrene Borg Warner
ISR/Polymon
100,000 200,000 45,000 160,000
134,000
200,000 150,000
70,000 80,000 60,000
150,000 90,000
400,000 60,000
70,000 30,000
Grangemouth Wilton Fawley Carrington
Grangemouth
Wilton Carrington
Barry Carrington Stalybridge
Barry Aycliffe Runcorn Staveley
Grangemouth Hythe
Source: European Plastics News
Note: Capacity is in tonnes
TABLE 5 TOTAL NEW CAPITAL INVESTED BY EUROPEAN CHEMICAL INDUSTRIES ($M)
Country
France W Germany Italy Netherlands UK EEC
1969-78
Inv. %
8,382 14 19,295 31 12,515 20 5,808 9 10,508 17 61,344 100
1979
Inv. %
1,229 13 3,290 34 1,449 15 671 7
2,319 24 9,644 100
1980
Inv. i
1,544 13 3,681 31 1,938 16 673 6
3,234 27 11,762 100
Source: Chemical Industries Association
Note: Percentages ref-er to share of total EEC investment
33

It is perhaps significant to point out that reported accident figures in this industry are marginally greater than for the manufacturing sector as a whole. What these figures do not capture is the insidious development of disease which often only manifests itself after many years. Long exposure to low concentrations of certain chemicals is now suspected of being carcinogenic. Even when the dangers are known, the problems are often ignored until an embarrassingly high incidence of disease forces an investigation and perhaps compensation.
A report published in Britain in 1921 warned of the hazards of several chemicals, one of which was manufactured right up to 1967 while, only recently, seven former workers from Ciba-Geigy in Paisley, Scotland, who contracted bladder cancer, won a civil action for compensation. It is hoped that the most stringent control over employee and consumer safety will be enforced as the chemical industry now enters the uncharted waters of biotechnology.
Market Structure
Demand for the output of the chemical industry derives from a very broad range of users although the industry itself consumes much of its own output for further processing. Some indication of the source of demand for the output of the chemical industry may be gleaned from Table 6 which was prepared from a recent input/output study of the Scottish economy. There is no reason to expect that the source of demand will be terribly different in the rest of the UK. Figures for the consumption of each individual class of chemical are very sparse but Table 7 provides UK consumption statistics for 18 different types of plastic during 1980 and 1981.
Interestingly, only nine of these eighteen plastics actually showed any increase over the period while the remaining nine, which showed declines or no change, reflected the fortunes of the principal user industries.
TABLE 6 SOURCE OF DEMAND FOR OUTPUT OF SCOTTISH CHEMICAL INDUSTRY (1973)
Sector t Sector
Agriculture Bakery/Other Foods Brewing Bricks/Building Materials Chemicals Coal/Other Mining Construction Electricity Gas Glass Health Service
8.5 2.3 0.6 1.5 30.5 1 .2 4.2 3.7 0.8 0.6 9.3
Man-Made Fibres Metals Motors Paper Plastics Road Transport Rubber Spinning/Weaving Whisky Other
1 .2 4.0 0.7 3.0 2.0 1.8 3.4 1.4 0.8 18.5
Source: Input/Output Tables for Scotland, 1973
34

T h e r e f o r e of major concern in t h i s c u r r e n t r e c e s s i o n i s t h e number of chemical consumers who are being forced to c lose or c o n t r a c t and the rapid r a t e of t h i s process of con t r ac t i on . In p a r t i c u l a r , high l e v e l s of import p e n e t r a t i o n in t h e motor and t e x t i l e i n d u s t r i e s a r e s e v e r e l y a f f e c t i n g demand for a whole range of chemicals . The d i f f i c u l t i e s are aggravated by two problems outwi th the i n d u s t r y ' s c o n t r o l .
(a) The d e t e r i o r a t i o n in the i n t e r n a t i o n a l compet i t iveness of the indust ry over the past couple of years due to a combination of the s t rong petropound and r e l a t i v e l y high r a t e s of i n f l a t i o n in t he UK means t h a t i t has been more d i f f i c u l t i f no t i m p o s s i b l e , to d i r e c t o u t p u t t o e x p o r t m a r k e t s . I t has been e s t i m a t e d by one company cha i rman t h a t fo r every £1 by which high s t e r l i n g r e d u c e s impor t ed raw m a t e r i a l c o s t s , e x p o r t e a r n i n g s f a l l by £2. Hence a ne t l o s s . The problem has of cou r se been compounded by the high l e v e l s of i n t e r e s t r a t e s i n t h e UK which add g r e a t l y t o b u s i n e s s u n c e r t a i n t y . Admittedly these problems are slowly beginning to ease now but i t i s u n l i k e l y t h a t c o s t i n c r e a s e s w i l l be f u l l y passed on u n t i l t h e r e i s fu r the r s u b s t a n t i a l recovery in demand.
(b) The Chemical Indus t ry Associa t ion c a l c u l a t e s t h a t UK chemical firms pay £200 m i l l i o n more for energy than t h e i r major European c o m p e t i t o r s . Oil p r i ce s are higher than Cont inental p r i ce s due to UK o i l product taxes -a c u r i o u s l y p e r p l e x i n g s i t u a t i o n fo r a major o i l p roduce r - wh i l e gas and e l e c t r i c i t y p r i ce s presen t a problem. Not s u r p r i s i n g l y , the indus t ry has welcomed t h e d e c i s i o n by t h e C o n s e r v a t i v e Government to a b o l i s h B r i t i s h Gas's monopoly on the supply of new gas from the North Sea.
Recent Background
Much of t he c u r r e n t d e p r e s s i o n ove rhang ing the c h e m i c a l i n d u s t r y h a s , to some e x t e n t , been of i t s own making. Soon a f t e r i t took off in t he 1950 ' s , the indus t ry achieved supernormal growth r a t e s often more than double the growth r a t e s of many na t iona l economies. Indeed, in the decade leading up to the o i l c r i s i s of 1973, the world chemical indust ry more than doubled i t s own output . This except ional growth occurred for a v a r i e t y of reasons .
The world economy grew r a p i d l y in t h e 1960's and t h e expans ion of many i n d u s t r i e s had a boost ing e f fec t on the demand for chemica ls . In add i t i on , low, s t a b l e crude o i l p r i ce s and the apparent s e c u r i t y of supply meant t h a t many t r a d i t i o n a l m a t e r i a l s such as s t e e l and na tu ra l f i b r e s could be r ead i ly and cheaply r e p l a c e d by p l a s t i c and c h e m i c a l f i b r e s . During t h e 1960 ' s , fo r example , c a l c u l a t i o n s show t h a t s u b s t i t u t i o n by p l a s t i c s ran a t an annual growth r a t e of a p p r o x i m a t e l y 10%. F i n a l l y , t e c h n i c a l p r o g r e s s enab led chemica l p r o d u c e r s t o enjoy t h e f r u i t s of economies of s c a l e wi th the annual capaci ty of p l an t s being increased some twenty- fo ld between the 1950's and 1970's, so genera t ing more cos t e f f ec t i venes s .
As p red ic ted by economic theory , the abnormal p r o f i t s a v a i l a b l e a t t r a c t e d even more investment expendi ture . Between 1969 and 1978, t o t a l new c a p i t a l inves ted by the European chemical indus t ry was $61,344 m i l l i o n , 17% of which was accounted for by t he UK. For 1980 a lone t he f i g u r e was $11,762 m i l l i o n , 27% by the UK. Despite i n d i c a t i o n s of overcapaci ty the chemical companies c o n t i n u e d t h e i r i n v e s t m e n t programmes on t h e a s sumpt ion t h a t
35

TABLE 7 UK PLASTICS CONSUMPTION ( thousand t o n n e s )
P l a s t i c Some Common Uses 1980 1981
Low Density Polyethylene High Density Polyethylene Polypropylene Poly Vinyl Chloride Polystyrene Expanded Polystyrene Acrylonitrile Butadiene Styrene Polyamides Acrylics Acetals Polyethylene Terephthalate Polyester Film Amino Plastics Phenolics Polyurethanes Epoxides Polyester Resins Other
TOTAL
Sacks, Carrier Bags Container Drums, Pipes Domestic Appliances i, Carpets Footwear, Window Frames Food Packaging eg eggboxes Cavity Wall Insulation
Refrigerator/Washing Machines Nylon Baths, DIY, Double Glazing Car, Plumbing Components Plastic Bottles Packaging Adhesives Car Components Furniture/Beddings Automotive Paints Glass Fibre Goods
425 155 205 367 126 21
45 17 23 6 5 17 135 65 84 13 45 240
1,994
422 169 225 372 130 23
40 16 25 6 12 18 123 58 84 13 40 242
2,018
Source: European P l a s t i c s News
demand would cont inue to grow s t rongly which, as suspected , has been wi ld ly o v e r o p t i m i s t i c . Some evidence of t h i s i s shown in Table 8. In f ac t i t i s c o n s i d e r e d t h a t p r e s e n t Western European c a p a c i t y i s s u f f i c i e n t t o meet demand u n t i l 1990. This problem of overcapac i ty has been aggravated by:-
(a) O i l compan ies moving i n t o c h e m i c a l s when, a f t e r t he v a r i o u s ' o i l c r i s e s ' of t h e 1 9 7 0 ' s , t h e y c o u l d no l o n g e r s u s t a i n t h e i r p r e v i o u s p r o f i t a b i l i t y purely from the supply of o i l .
(b) The Middle Eas t , North African, Lat in American and o ther Third World c o u n t r i e s w a n t i n g t o e s t a b l i s h t h e i r own c h e m i c a l i n d u s t r i e s e i t h e r t o s u b s t i t u t e for expensive chemical imports by using t h e i r own feedstocks or to develop a l t e r n a t i v e i n d u s t r i e s for when t h e i r own r e s e r v e s are exhausted. P r o j e c t s in such c o u n t r i e s a r e u s u a l l y e x e c u t e d in t h e form of j o i n t v e n t u r e s w i t h Wes te rn European or J a p a n e s e c h e m i c a l or o i l companies who supply the necessary capac i ty and e x p e r t i s e in exchange for much needed o i l and gas . In t h i s way, Japan in p a r t i c u l a r w i l l import t h e i r pe t rochemical requirement from the Middle East whi le i t s domestic chemical indus t ry w i l l c o n c e n t r a t e on h igh v a l u e added p r o d u c t s l i k e p h a r m a c e u t i c a l s . Planned e thylene capac i ty in the Middle East i s shown in Table 9.
(c) COMECON c o u n t r i e s , des i rous of becoming s e l f - s u f f i c i e n t in chemicals and in t h e i r c h a s e fo r hard c u r r e n c i e s , u n d e r c u t t i n g t h e Wes t ' s p r i c e s . For example, the p r i c e of Low Density Polythylene (LDPE) from Eastern Bloc c o u n t r i e s was r e c e n t l y £60 per tonne cheaper than in the West. I r o n i c a l l y , when the West s e l l s t e c h n i c a l e x p e r t i s e and p lan t to these newcomers, i t i s
36

usually paid for by so-called "compensatory deals" whereby payment is made either wholly or partly in the chemical output produced.
Such are the major contributory factors in the present price collapse and the low if not negative rates of return on investment. In response to these problems, some chemical companies have adopted a number of strategies.
(a) "Backward Integration" whereby a chemical company moves into the oil business eg ICI has a stake in the Ninian Oilfield.
(b) Joint-ventures with oil companies.
(c) Abandoning petrochemical production, leaving it to the oil companies and moving upmarket to high value added chemicals like drugs which are cyclically insensitive. Indeed the West German Hoechst Group has estimated that World demand for pharmaceuticals will treble over the next twenty years.
(d) Exploiting the relative strength of sterling and investing in the USA where the American chemical industry enjoys extensive economies of scale from access to a large domestic market and from the extensive use of natural gas as a cheaper chemical feedstock. Thus, for example Unilever paid $485 million for National Starch and BOC paid $470 million for Airco.
TABLE 8 ETHYLENE CAPACITY AND PRODUCTION IN WESTERN EUROPE
Capacity (m tonnes)
Output (m tonnes)
Utilisation (*)
Rate
1970
6.8
5.9
87
1973
10.9
9.6
88
1975
12.7
8.0
63
1978
14.0
10.5
75
1980
15.0
10.0
67
Source: Barclays Bank
These are essentially medium to long-term strategies but in the short-term many companies have sought instant savings by cutting back on capital expenditure in both plant and research and development (R/D). However the chemical industry has no future without R/D especially in such an intensely internationally competitive industry. The average time spent by a chemical company in developing a new product is seven years and costs as much as $10 million. Total R/D expenditure in 1966 and'1978 was £218 million and £284 million respectively, but recent company annual reports suggest that this will be revised downwards in the 1980's while University/Polytechnic expenditure cuts will have similar detrimental effects. While successive governments have stressed the importance of R/D for the long term health of the UK economy, their support has been heavily biased towards electronics and aerospace. The chemical industry is now seeking either tax incentives or cash grants financed by North Sea oil revenue to support R/D arguing
37
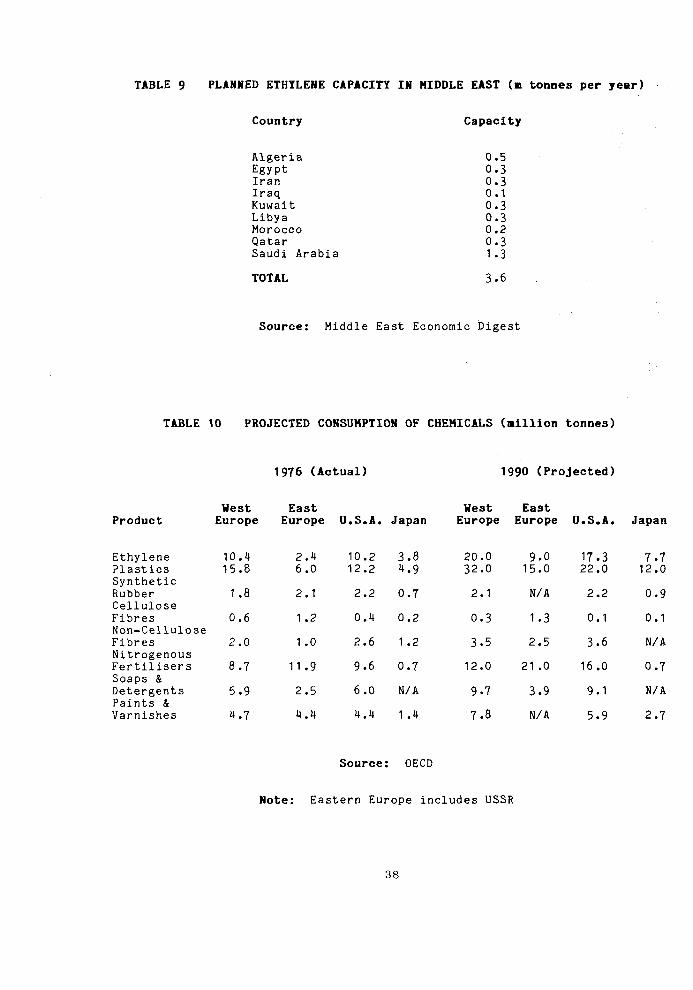
TABLE 9 PLANNED ETHYLENE CAPACITY IN MIDDLE EAST (m tonnes per year)
Country Capacity
Algeria 0.5 Egypt 0.3 Iran 0.3 Iraq 0.1 Kuwait 0.3 Libya 0.3 Morocco 0.2 Qatar 0.3 Saudi Arabia 1 .3
TOTAL 3.6
Source: Middle East Economic Digest
TABLE 10 PROJECTED CONSUMPTION OF CHEMICALS (million tonnes)
1976 (Actual) 1990 (Projected)
Product
Ethylene Plastics Synthetic Rubber Cellulose Fibres Non-Cellulose Fibres Nitrogenous Fertilisers Soaps & Detergents Paints & Varnishes
Vest Europe
10.4 15.8
1.8
0.6
2.0
8.7
5.9
4.7
East Europe
2.4 6.0
2.1
1.2
1 .0
11.9
2.5
4.4
U.S.A.
10.2 12.2
2.2
0.4
2.6
9.6
6.0
4.4
Japan
3.8 4.9
0.7
0.2
1.2
0.7
N/A
1 .4
West Europe
20.0 32.0
2.1
0.3
3.5
12.0
9.7
7.8
East Europe
9.0 15.0
N/A
1.3
2.5
21 .0
3.9
N/A
U.S.A.
17.3 22.0
2.2
0.1
3.6
16.0
9.1
5.9
Japan
7.7 12.0
0.9
0.1
N/A
0.7
N/A
2.7
Source: 0ECD
Note: Eastern Europe includes USSR
38

that,
"This would not be using resources to prop up declining industries, but would be transferring one asset into another, investing current revenue into a potentially greater revenue earner in the future. It could be regarded as a very appropriate way of conserving North Sea resources and allowing the UK to benefit from them over a much longer period than the current production estimates will provide." (Chemicals Development Committee.)
Chemical projects planned, in construction or completed in Scotland in 1980 are shown in Table 12.
Future Prospects
The immediate future of the UK chemical industry depends fundamentally upon a healthy domestic economy. However, despite marginal improvements on this front, there are still many black clouds on the horizon. The low and sometimes negative trends in end-user industries such as textiles, cars, tyres, white goods etc are not only likely to inhibit new capital investment in more efficient plant but may also result in more closures. This could be especially deleterious for the long term since consumption of most chemicals, particularly ethylene and plastics, is expected to rise quite substantially in the 1990's as shown in Table 10.
In addition the artificially high cost of energy and raw materials relative to the USA is particularly damaging and is clearly disadvantageous to the industry even with the slight changes announced in the 1982 Budget. In this respect the optimum utilisation of ethane and other natural gas liquids from the North Sea becomes especially crucial and will become even more important as world oil supplies are depleted. Britain's offshore natural gas supplies are shown in Table 11.
Early in 1980, British Gas and Mobil Oil undertook a joint feasibility study of the construction of a pipeline costing £1.1 billion to gather an estimated 21 billion cubic feet of gas worth around £30 billion in 1980 prices from 21 North Sea oilfields. Such gas is typically flared off. The pipeline had been approved by the Government and it was expected that the necessary finance would be provided by a consortium of interests particularly British Gas itself, BP, Mobil and various banks. Having been landed at St Fergus in North East Scotland, the methane gas was to be sold to British Gas and fed into the national network while the other valuable chemical feedstocks such as ethane were to be sent South by pipeline to existing petrochemical plants at Mossmoran in Fife (Shell and Esso) on to Grangemouth (BP) and thereafter to Wilton on Teesside (ICI). The availability of this gas-based naphtha would have given the UK chemical industry a very substantial commercial edge. Eventually some gas may also have been piped West to Nigg Bay where Dow Chemicals, Occidental Petroleum and Highland Hydrocarbons wish to set up new plants with very important benefits to this depressed region. Unfortunately, this integrated gas gathering pipeline has been shelved, hopefully only temporarily, due to disagreements over financing and individual companies are currently appraising private gas gathering projects of their own.
39

TABLE 11 BRITAIN'S OFFSHORE NATURAL GAS SUPPLIES
Gas Ashore Recoverable in 1977 Reserves
Production million cubic billion cubic Field Discovered Began metres metres
West Sole
Leman Bank
Hewett
Indefatigable
Viking
Rough
Frigg UK
Frlgg Norway
Forties
Piper
Brent
Tartan
Morecambe
1965
1966
1966
1966
1968
1968
1972
1971
1970
1973
1971
1974
1974
1967
1968
1969
1971
1972
1975
1977
1977
1977
1978
1980/81
1980/81
1984
1
15
7
6
6
1
,944
,525
,776
,760
,285
,057
613
952
-
-
-
-
_
61
292
97
125
125
14
128
192
N/A
N/A
84
N/A
56-84
Source: "Gas" by Richard Cassidy
Note: Estimates of reserves for Forties, Piper and Tartan are not available as production depends on oil recovery.
Finally, ecological considerations and the growing power of environmentalists will almost certainly place a heavy financial burden on many chemical companies in the future. Chemicals present one of the great paradoxes of the 20th century. Over the past thirty years or so, advances in the chemical sciences have probably done more to improve the quality of life in modern society than any other technology. There are few industries which are not served by chemicals and progress in medicine, agriculture and consumer proucts etc are legend. But, the legacy of this progress is found not only in live-saving drugs and products to make life more congenial but also in a polluted environment and increasing evidence of negative long-term effects of chemical accumulation on human health. Because of the sheer number of chemicals in use and the fact that about 1,000 new chemicals appear each year, there is a growing need to reconcile environmental considerations with those of economic growth. Already it is estimated that 12% of the total cost of a 500,000 tonnes per annum US ethylene plant is associated with environmental control systems.
40

TABLE 12 CHEMICAL PROJECTS PLANNED, IN CONSTRUCTION OR COMPLETED IN SCOTLAND, 1980
Company Location Project Cost £m Contractor
Bakelite Xylonite
Beechams
BNOC
British Oxygen
Borg Warner
BP Chemicals
BP Chemicals
Cromarty Petroleum
Esso Chemicals
Hoffman La Roche
Hoffman La Roch
ICI
ICI
ICI
ICI Organics
National Semiconductor
Nobels Explosives
Norit Clydesdale
Occidental
Grangemouth
Irvine
Nigg Bay
Gartcosh
Grangemouth
Grangemouth
Grangemouth
Nigg Bay
Mossmorran
Ayrshire
Ayrshire
Grangemouth
Ayrshire
Ayrshire
Grangemouth
Greenock
Ardeer
Cambuslang
Flotta
Polyethylene
Multi-purpose
Storage
Nitrogen
Resin
Ethanol
Polyethylene
Petrochemicals 750.0
Ethylene
Bleach-dye)
) Vitamin C )
Pharmaceuticals
Nitrocellulose
Effluent Control
Dyes
Nitrogen
Explosives
Carbon
Ethane
Mathew Hall
50.0 G Wimpey
125.0
3.0
3.0)
10.0)
Cryoplants
Catalytic International
57.6 Davy McKee/M Hall
Crawford/Russell
300.0 Lummus
Uhde
Foster Wheeler
Babtie Shaw & Morton
17.0 Sim-Chem.
Air Products
12.0
250.0
Chemetics
Crawford/Russell
Humphreys & Glasgow
Source: Chemical Age
HI