coordinated integrated monitoring program (cimp) · april 2015 santa monica bay jg7 watershed...
TRANSCRIPT

April 2015 SANTA MONICA BAY JG7 WATERSHED MANAGEMENT PLAN GROUP
Coordinated Integrated Monitoring Program (CIMP)
Prepared by City of Los Angeles and Los Angeles County Flood Control District
The MWH Team

Page i
Table of Contents List of Figures ............................................................................................................................. v
List of Tables .............................................................................................................................. v
List of Attachments ..................................................................................................................... v
Section 1 Introduction ............................................................................................................... 1
1.1 SANTA MONICA BAY JURISDICTIONAL GROUP 7 WATERSHED
MANAGEMENT PLAN AREA .................................................................................... 1
1.2 CIMP OVERVIEW ........................................................................................................ 7
1.2.1 Receiving Water Monitoring ...................................................................................... 7
1.2.2 Stormwater Outfall Monitoring .................................................................................. 7
1.2.3 Non-Stormwater Outfall Program ............................................................................... 8
1.2.4 New Development and Redevelopment Effectiveness Tracking ................................ 8
1.2.5 Regional Studies ......................................................................................................... 8
1.2.6 Special Studies ............................................................................................................ 8
Section 2 Receiving Water Monitoring Program ................................................................... 9
2.1 EXISTING MONITORING PROGRAMS .................................................................... 9
2.1.1 Santa Monica Bay Beaches Bacteria TMDL ............................................................ 12
2.1.2 Santa Monica Bay Nearshore and Offshore Debris TMDL ...................................... 14
2.1.3 Santa Monica Bay DDTs and PCBs TMDL ............................................................. 16
2.2 CIMP RECEIVING WATER MONITORING SITE ................................................... 17
2.3 MONITORING FREQUENCY, PARAMETERS, AND DURATION ....................... 20
2.3.1 Wet Weather ............................................................................................................. 20
2.3.2 Dry Weather .............................................................................................................. 21
2.4 RECEIVING WATER MONITORING SUMMARY ................................................. 21
Section 3 MS4 Infrastructure Database ................................................................................ 22
Section 4 Stormwater Outfall Monitoring ............................................................................ 24
4.1 PROGRAM OBJECTIVES .......................................................................................... 24
4.2 STORMWATER OUTFALL MONITORING SITES ................................................. 24
4.3 MONITORING FREQUENCY, PARAMETERS, AND DURATION ....................... 25
Section 5 Non-Stormwater Outfall Screening and Monitoring Program .......................... 27
5.1 PROGRAM OBJECTIVES .......................................................................................... 27
5.2 NON-STORMWATER OUTFALL SCREENING AND MONITORING PROGRAM
...................................................................................................................................... 28

SMB JG7 Coordinated Integrated Monitoring Program – April 2015 Table of Contents
Page ii
5.3 IDENTIFICATION OF OUTFALLS WITH SIGNIFICANT NON-STORMWATER
DISCHARGES ............................................................................................................. 28
5.4 PRIORITIZED SOURCE IDENTIFICATION ............................................................ 30
5.5 SIGNIFICANT NON-STORMWATER DISCHARGE SOURCE IDENTIFICATION
...................................................................................................................................... 30
5.6 NON-STORMWATER DISCHARGE MONITORING .............................................. 32
5.6.1 Monitoring Frequency, Parameters, and Duration .................................................... 32
5.7 NON-STORMWATER OUTFALL PROGRAM SUMMARY ................................... 33
Section 6 New Development/Re-Development Effectiveness Tracking Program .............. 34
6.1 PROGRAM OBJECTIVES .......................................................................................... 35
6.2 EXISTING NEW DEVELOPMENT/RE-DEVELOPMENT TRACKING
PROCEDURES ............................................................................................................ 35
6.3 SPECIAL CONSIDERATIONS FOR DATA MANAGEMENT AND REPORTING 35
6.3.1 Data Management ..................................................................................................... 35
6.3.2 Additional Data ......................................................................................................... 36
6.3.3 Reporting................................................................................................................... 37
6.4 SUMMARY OF NEW DEVELOPMENT/RE-DEVELOPMENT EFFECTIVENESS
TRACKING ................................................................................................................. 40
Section 7 Regional Studies ...................................................................................................... 41
Section 8 Special Studies ......................................................................................................... 42
Section 9 Non-Direct Measurements ..................................................................................... 43
Section 10 Adaptive Management........................................................................................ 44
10.1 INTEGRATED MONITORING AND ASSESSMENT PROGRAM ......................... 44
10.2 CIMP REVISION PROCESS ....................................................................................... 44
Section 11 Reporting ............................................................................................................. 46
11.1 DOCUMENTS AND RECORDS................................................................................. 46
11.1.1 Semi-Annual Data Submittal ................................................................................ 46
11.1.2 Annual Monitoring Reports .................................................................................. 47
11.1.3 Signatory and Certification Requirements ............................................................ 47
Section 12 Schedule for CIMP Implementation ................................................................. 49
Section 13 References ............................................................................................................ 50
Section 1 Analytical Procedures ............................................................................................... 2
1.1 Field Parameters.............................................................................................................. 2
1.2 Analytical Methods and Method Detection and Reporting Limits ................................. 2

SMB JG7 Coordinated Integrated Monitoring Program – April 2015 Table of Contents
Page iii
1.2.1 Method Detection Limit Studies ............................................................................... 14
1.2.2 Project Reporting Limits ........................................................................................... 15
1.2.3 Laboratory Standards and Reagents.......................................................................... 15
1.2.4 Sample Containers, Storage, Preservation, and Holding Times ............................... 15
1.3 Aquatic Toxicity Testing and Toxicity Identification Evaluations ............................... 17
1.3.1 Sensitive Species Selection ....................................................................................... 17
1.3.1.1 Freshwater Sensitive Species Selection ................................................................ 17
1.3.2 Testing Period ........................................................................................................... 19
1.3.3 Toxicity Endpoint Assessment and Toxicity Identification Evaluation Triggers ..... 19
1.3.4 Toxicity Identification Evaluation Approach ........................................................... 20
1.3.5 Follow Up on Toxicity Testing Results .................................................................... 22
1.3.6 Summary of Aquatic Toxicity Monitoring ............................................................... 23
Section 2 Sampling Methods and Sample Handling ............................................................ 25
2.1 Monitoring Event Preparation....................................................................................... 25
2.1.1 Bottle Order/Preparation ........................................................................................... 26
2.1.2 Container Labeling and Sample Identification Scheme............................................ 27
2.1.3 Field Meter Calibration ............................................................................................. 27
2.1.4 Weather Conditions .................................................................................................. 29
2.2 Sample Handling ........................................................................................................... 30
2.2.1 Documentation Procedures ....................................................................................... 30
2.2.2 Field Documentation/Field Log ................................................................................ 31
2.2.3 Sample Handling and Shipment................................................................................ 31
2.2.4 Chain-of Custody Forms ........................................................................................... 32
2.2.5 Laboratory Custody Procedures ................................................................................ 32
2.3 Field Protocols .............................................................................................................. 33
2.4 Sample Collection ......................................................................................................... 34
2.4.1 Overview of Sampling Techniques ........................................................................... 34
2.4.2 Field Measurements and Observations ..................................................................... 35
2.4.3 Sampling Techniques for the Collection of Water ................................................... 37
2.4.4 Receiving Water Sample Collection ......................................................................... 40
2.4.5 Stormwater Outfall Sample Collection ..................................................................... 40
2.4.6 Non-Stormwater Outfall Screening Surveys and Sample Collection ....................... 41
2.4.6.1 Non-Stormwater Sample Collection ..................................................................... 41
SMB JG7 Coordinated Integrated Monitoring Program – April 2015 Table of Contents
Page iv
2.4.7 Stormborne Sediment Collection .............................................................................. 41
2.4.8 Bioaccumulation Sample Collection......................................................................... 41
2.4.9 Trash Monitoring ...................................................................................................... 41
2.4.10 Plastic Pellet Monitoring....................................................................................... 42
2.4.11 Quality Control Sample Collection ....................................................................... 42
Section 3 Quality Assurance/Quality Control....................................................................... 43
3.1 QA/QC Requirements and Objectives .......................................................................... 44
3.1.1 Comparability ........................................................................................................... 44
3.1.2 Representativeness .................................................................................................... 44
3.1.3 Completeness ............................................................................................................ 45
3.2 QA/QC Field Procedures .............................................................................................. 45
3.2.1 Equipment Blanks ..................................................................................................... 45
3.2.2 Field Blanks .............................................................................................................. 45
3.2.3 Field Duplicates ........................................................................................................ 46
3.3 QA/QC Laboratory Analyses ........................................................................................ 46
3.3.1 Method Blanks .......................................................................................................... 46
3.3.2 Laboratory Duplicates ............................................................................................... 46
3.3.3 Matrix Spikes and Matrix Spike Duplicates ............................................................. 46
3.3.4 Laboratory Control Samples ..................................................................................... 47
3.3.5 Surrogate Spikes ....................................................................................................... 47
3.3.6 Toxicity Quality Control ........................................................................................... 47
Section 4 Instrument/Equipment Calibration and Frequency............................................ 48

SMB JG7 Coordinated Integrated Monitoring Program – April 2015 Table of Contents
Page v
List of Figures
Figure 1 Geographical Area and Land Uses
Figure 2 Percent Impervious
Figure 3 Municipal Separate Storm Sewer System (MS4)
Figure 4 Existing Monitoring Stations
Figure 5
Figure 6
Industrial Zones in the City of Los Angeles Portion of JG7
CIMP Monitoring Stations
List of Tables
Table 1 Land Use Summary
Table 2 Water Body-Pollutant Priorities
Table 3 Summary of Reconsideration Elements for SMBBB TMDL
Table 4 SMBBB TMDL Water Quality-Based Effluent Limitations and Receiving Water
Limitations
Table 5 Annual Allowable Exceedance Days of the Single Sample Objective (days)
Table 6 Santa Monica Bay Debris TMDL Compliance Schedule
Table 7 Santa Monica Bay DDTs and PCBs TMDL Waste Load Allocations
Table 8 Land Use Overview of Outfall Nearest to Receiving Water Monitoring Site SMBJ7-
RW-1
Table 9 Receiving Water Monitoring Parameters and Annual Frequency
Table 10 GIS Data Sources
Table 11 Land Use Overview of Potential Outfall Monitoring Sites
Table 12 Stormwater Outfall Monitoring Parameters and Annual Frequency
Table 13 Non-Stormwater Screening Sites in SMB JG7 WMP Group Area
Table 14 Source Identification Types
Table 15 Non-stormwater Outfall Monitoring Parameters and Annual Frequency (Year 1)
Table 16 Development Review Process and Data Collection
Table 17 Example Data Collection Template
List of Attachments
Attachment A LACFCD Background Information
Attachment B Analytical and Monitoring Procedures
Attachment C Outfall Investigation Photographic Log
Attachment D Example Calibration, Field and Chain-of-Custody Forms

Page vi
LIST OF ACRONYMS Acronym Definition
40 CFR Code of Federal Regulations
AED Allowable Exceedance Day
AIN Assessor’s Identification Number
ASBS Areas of Special Biological Significance
ASTM American Society for Testing and Materials
Basin Plan Basin Plan for the Coastal Watersheds of Los Angeles and Ventura Counties
BMPs Best Management Practices
Caltrans California Department of Transportation
CCW Calleguas Creek Watershed
CERCLA Comprehensive Environmental Response, Compensation, and Liability Act
CIMP Coordinated Integrated Monitoring Program
County Los Angeles County
COC Chain of Custody
CRM Certified/ Standard Reference Material
CSMP Coordinated Shoreline Monitoring Plan
CVRWQCB Central Valley Regional Water Quality Control Board
CWA Clean Water Act
CWC California Water Code
DAP Discharge Assessment Plan
DDD Dichlorodiphenyldichloroethane
DDE Dichlorodiphenyldichloroethylene
DDT Dichlorodiphenyltrichloroethane
DO Dissolved Oxygen
DOC Dissolved Organic Carbon
EDTA Ethylene Diamine Tetra Acetic Acid
EIA Effective Impervious Area
ELAP Environmental Laboratory Accreditation Program
EPA Environmental Protection Agency
ES Executive Summary
EWMP Enhanced Watershed Management Program
FLPE Fluorinated high-density polyethylene
GIS Geographic Information System
GM Geometric Mean
GWQC General Water Quality Constituents
HUC Hydrologic Unit Codes
IC/ID Illicit Connection/Illicit Discharge
IMCR Integrated Monitoring Compliance Report
IMP Integrated Monitoring Program

SMB JG7 Coordinated Integrated Monitoring Program – April 2015 List of Acronyms
Page vii
IWC In-stream waste concentration
JG Jurisdictional Group
LACDPW Los Angeles County Department of Public Works
LACFCD Los Angeles County Flood Control District
LCS Laboratory Control Sample/Standard
LID Low Impact Development
MAL Municipal Action Limits
MBAS Methylene Blue Active Substances
MCM Minimum Control Measure
MDL Method Detection Limit
MES Mass Emission Stations
MF Multi-Family
MGD Million Gallons per Day
MPN Most Probable Number
MRP Monitoring and Report Program
MS4 Municipal Separate Storm Sewer System
MTBE Methyl tert-butyl ether
NA Not Applicable
NELAP National Environmental Laboratory Accreditation Program
NIST National Institute for Standards and Technology
NPDES National Pollutant Discharge Elimination System
NSW Non-Stormwater
NTU Nephelometric Turbidity Units
OC Organochlorine
OP Organophosphate
PBO Piperonyl Butoxide
PCB Polychlorinated biphenyl
PDF Portable Document Format
PE Polyethylene
Permit Permit No. R4-2012-0175
PMRP Pellets Monitoring and Reporting Plan
PRM Pathogen Related Mortality
QA Quality Assurance
QC Quality Control
QPF Quantitative Precipitation Forecast
RAA Reasonable Assurance Analysis
REC-1/REC-2 Recreational Beneficial Use Designations
Regional Board Los Angeles Regional Water Quality Control Board
RL Reporting Limits
RPD Relative Percent Difference
RW Receiving Water

SMB JG7 Coordinated Integrated Monitoring Program – April 2015 List of Acronyms
Page viii
RWL Receiving Water Limitations
RWQCB Regional Water Quality Control Board
SCCWRP Southern California Coastal Water Research Project
SDTF Standardized Data Transfer Format
SF Single Family
SIC Standard Industrial Classification System
SM Standard Methods
SMB Santa Monica Bay
SMB JG7 WMP
Group Santa Monica Bay Enhanced Watershed Management Program Group
SMBBB Santa Monica Bay Beaches Bacteria
SMC Southern California Stormwater Monitoring Coalition
SMURRF Santa Monica Urban Runoff Recycling Facility
SOP Standard Operating Procedure
SPE Solid Phase Extraction
SQO Sediment Quality Objectives
SSC Suspended Sediment Concentration
STS Sodium thiosulfate
SVOC Semi Volatile Organic Compound
SWAMP Surface Water Ambient Monitoring Program
SWRCB State Water Resources Control Board
TDS Total Dissolved Solids
TIE Toxicity Identification Evaluation
TKN Total Kjehdahl Nitrogen
TM Technical Memo
TMDL Total Maximum Daily Load
TMRP Trash Monitoring and Reporting Plan
TOC Total Organic Carbon
TRE Toxicity Reduction Evaluation
TSS Total Suspended Solids
TST Test of Significant Toxicity
UC University of California
USEPA United States Environmental Protection Agency
USGS United States Geological Survey
VOC Volatile Organic Compound
WBPCs Water Body-Pollutant Combinations
WDID State Waste Discharge Identification
WLA Waste Load Allocations
WMA Watershed Management Area
WMP Watershed Management Program
WQBEL Water Quality-Based Effluent Limits

Page 1
Section 1 Introduction
The National Pollutant Discharge Elimination System (NPDES) Municipal Separate Storm Sewer System
(MS4) Permit No. R4-2012-0175 (Permit) was adopted November 8, 2012 by the Los Angeles Regional
Water Quality Control Board (Regional Board) and became effective December 28, 2012. The purpose of
the Permit is to ensure the MS4s in Los Angeles County are not causing or contributing to exceedances of
water quality objectives set to protect the beneficial uses in the receiving waters in the Los Angeles
region.
The Permit allows Permittees to customize their stormwater programs through the development and
implementation of a Watershed Management Program (WMP) or an Enhanced Watershed Management
Program (EWMP) to achieve compliance with receiving water limitations (RWLs) and water quality-
based effluent limits (WQBELs). The City of Los Angeles (City) has been a participating agency of
Jurisdictional Group 7 (JG7) of the Santa Monica Bay (SMB) Watershed since the adoption of the Santa
Monica Bay Beaches Bacteria Total Maximum Daily Loads (TMDLs) in 2003. However, the City of Los
Angeles and the other MS4 permittees in JG7 could not reach an agreement for a collaborative approach
to satisfying the requirements of the MS4 permit. Therefore, on November 26, 2013 the Regional Board
requested that the City and the Los Angeles County Flood Control District (LACFCD) (see Attachment
A for background on the LACFCD), collectively referred to as the SMB JG7 WMP Group, pursue a
WMP instead of an EWMP to fulfill the requirements of the MS4 Permit. The primary reasons for this
request included: 1) MS4 discharges to Santa Monica Bay are anticipated to be minimal due to the small
contributing drainage areas; and 2) opportunities for structural BMP implementation are limited due to the
geography of the WMP area (e.g., cliffs at outfalls, landslide and liquefaction hazards, etc.). As such, in
December of 2013 the JG7 SMB WMP Group submitted a revised notice of intent to develop a WMP for
the City of Los Angeles land area within JG7 of the Santa Monica Bay Watershed.
This Coordinated Integrated Monitoring Program (CIMP) fulfills the requirements presented in the
Monitoring and Reporting Program (MRP) portion of the Permit, which are specified in Attachment E of
the Permit. The primary objectives for the MRP are listed in Part II.A of the MRP, as follows:
Assess the chemical, physical, and biological impacts of discharges from the MS4 on receiving
waters;
Assess compliance with RWLs and WQBELs established to implement Total Maximum Daily
Load (TMDL) wet-weather and dry-weather waste load allocations (WLAs);
Characterize pollutant loads in MS4 discharges;
Identify sources of pollutants in MS4 discharges; and
Measure and improve the effectiveness of pollutant controls implemented under the Permit.
Additionally, the CIMP incorporates TMDL monitoring requirements to unify monitoring efforts and to
provide consistent observations of watershed conditions.
1.1 SANTA MONICA BAY JURISDICTIONAL GROUP 7 WATERSHED MANAGEMENT PLAN AREA
Santa Monica Bay is an integral part of the larger geographic region commonly known as the Southern
California Bight (or, bend in the coastline). It is bordered offshore by the Santa Monica Basin, to the
north by the rocky headlands of Point Dume, and to the south by the Palos Verdes Peninsula, and onshore
by the Los Angeles Coastal Plain and Santa Monica Mountains. The 264,960 acres of land that drains
naturally to Santa Monica Bay is bordered on the north by the Santa Monica Mountains from the Ventura-

SMB JG7 Coordinated Integrated Monitoring Program – April 2015 Introduction
Page 2
Los Angeles County line (to the west) to Griffith Park (to the east), extending south and west across the
Los Angeles Coastal Plain to include the area east of Ballona Creek and north of Baldwin Hills. South of
Ballona Creek, a narrow coastal strip between Playa del Rey and the Palos Verdes Peninsula forms the
southern boundary of the watershed. The Santa Monica Bay itself is the submerged portion of the Los
Angeles Coastal Plain. The continental shelf extends seaward to the shelf break about 265 feet
underwater, then drops steeply to the Santa Monica Basin at about 2,630 feet underwater.
Nearshore Santa Monica Bay is defined by the Ocean Plan as a zone bounded by the shoreline and a
distance of 1,000 feet from the shoreline or the 30-foot contour, whichever is further from the shoreline.
Offshore is defined as the waters between the near shore zone and the limit of State Waters. Lastly, State
Waters, according to Section 13200 of the California Water Code (CWC), extends three nautical miles
into the Pacific Ocean from the line of mean lower low water marking the seaward limits of inland waters
and three nautical miles from the line of mean lower low water on the mainland and each offshore island.
The SMB JG7 WMP Group area lies within the larger JG7 boundary in the southern portion of the Santa
Monica Bay watershed. The JG7 WMP area includes that portion of the area within the Hydrologic Unit
Codes (HUC-12): Manhattan Beach – Frontal Santa Monica Bay which extends along the shoreline from
Cabrillo Beach up to the Ocean Trails Reserve.
The SMB JG7 WMP Group area is bordered on the north approximately by the Bogdanovich Recreation
Center and W 25th street and the south by Royal Palms Beach, White Point Beach, the southern point of
Cabrillo Beach, and other shoreline that drains to the Santa Monica Bay. This area is bordered on the
west by the City of Ranchos Palos Verdes and on the east by Cabrillo Beach. The SMB JG7 WMP Group
area is solely under the jurisdiction of the City of Los Angeles and includes all of the White Point Natural
Preserve and Education Center as well as Point Fermin Park.
The SMB JG7 WMP Group is comprised of two participating agencies: the City of Los Angeles and
LACFCD. The SMB JG7 WMP Group area, which consists solely of JG7 area under the jurisdiction of
the City, totals approximately 1,056 acres, which is approximately 9% of the entire JG7 area within the
Santa Monica Bay Watershed (Figure 1). The geographical scope of the SMB JG7 WMP Group area
includes land owned by the Los Angeles Air Force Base Pacific Crest Housing Area, which the MS4
Permittees have no jurisdiction over and thus is excluded from the SMB JG7 WMP Group Area.
Excluding these areas, the WMP Group area covers approximately 1,056 acres. Approximate land area
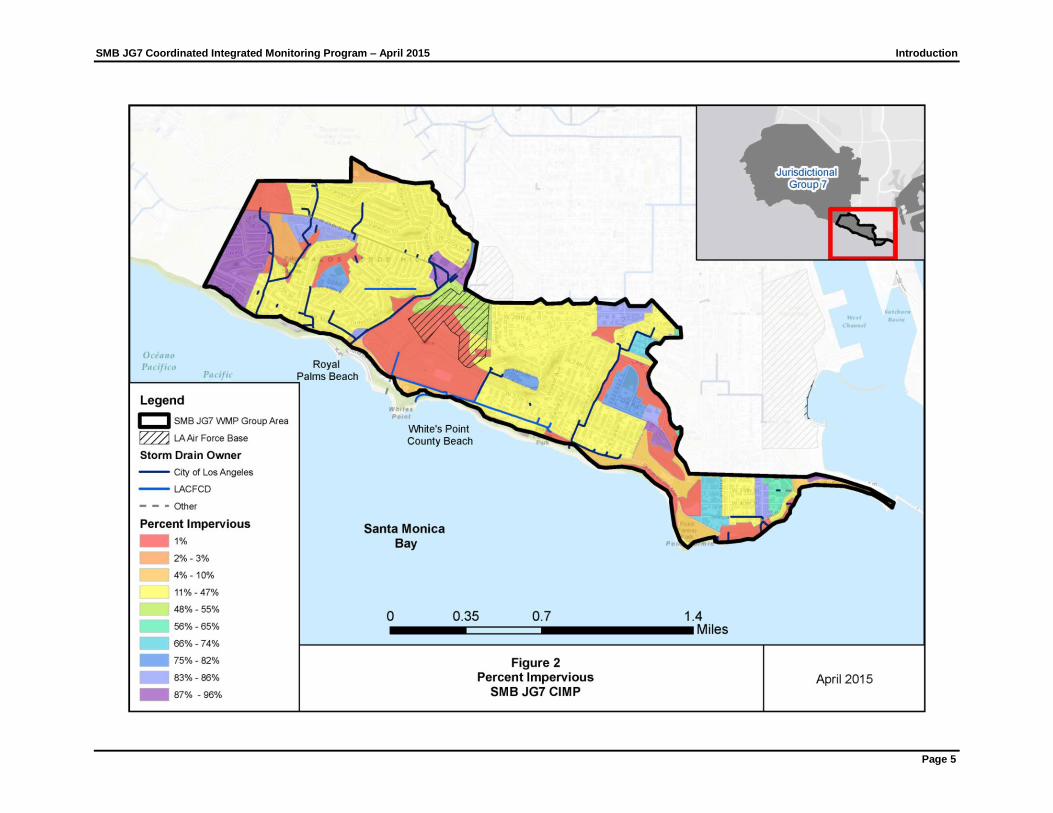
and land use summaries for the JG7 WMP Group area are listed in Table 1 and presented in Figure 1.
The most prevalent land uses are residential (67%) and open space (27%). The open space area includes
102 acres of restored coastal sage scrub habitat and hiking trails located within the White Point Nature
Preserve Wild Park as well as portions of Point Fermin Park. The remaining area consists of a mixture of
commercial, education, and industrial land uses. Figure 2 illustrates the distribution of percent
imperviousness across the JG7 WMP Group area.

SMB JG7 Coordinated Integrated Monitoring Program – April 2015 Introduction
Page 3
Table 1 Land Use Summary
Land Use
SMB JG7 WMP Group
Acres % of Total
Agriculture 0.0 0.0%
Commercial 25.5 2.4%
Industrial 1.0 0.09%
Education 32.2 3.1%
Multi-Family Residential 151.0 14.3%
Single Family Residential 561.5 53.2%
Vacant/Open 284.3 26.9%
Transportation 0.0 0.0%
Total 1056 100%
Figure 3 depicts the MS4 system in the JG7 WMP Group area, including outfalls, approximate catchment
delineations, and storm drain diameters. Attachment A of the MS4 Permit defines a major MS4 outfall (or
‘‘major outfall’’) as a municipal separate storm sewer outfall that discharges from a single pipe with an
inside diameter of 36 inches or more or its equivalent (discharge from a single conveyance other than
circular pipe which is associated with a drainage area of more than 50 acres); or for municipal separate
storm sewers that receive stormwater from lands zoned for industrial activity (based on comprehensive
zoning plans or the equivalent), an outfall that discharges from a single pipe with an inside diameter of 12
inches or more or from its equivalent (discharge from other than a circular pipe associated with a drainage
area of 2 acres or more) (40 CFR § 122.26(b)(5)).

SMB JG7 Coordinated Integrated Monitoring Program – April 2015 Introduction
Page 4
SMB JG7 Coordinated Integrated Monitoring Program – April 2015 Introduction
Page 5

SMB JG7 Coordinated Integrated Monitoring Program – April 2015 Introduction
Page 6

SMB JG7 Coordinated Integrated Monitoring Program – April 2015 Introduction
Page 7
The receiving waters defined by the Water Quality Control Plan, Los Angeles Region (Basin Plan)
(Regional Board, 1995, Updated 2011) within the SMB JG7 WMP Group area include:
Santa Monica Bay – Offshore/Nearshore Zone
Royal Palms Beach
White’s Point County Beach
Point Fermin Park Beach (not listed in Basin Plan)
Attachment B of the MS4 Permit shows mapped United States Geological Survey Hydrologic Units, and
other features, based on HUC-12 watershed boundaries. In lieu of these specified boundaries, the March
26, 2014 Regional Board Reasonable Assurance Analysis (RAA) Guidelines allows WMP groups to use
HUC-12 equivalent watersheds, prepared by the LACFCD. Using the LACFCD HUC-12 layer and
numbering conventions, the LACFCD HUC-12 boundary relevant to the SMB JG7 WMP Group is
Manhattan Beach – Frontal Santa Monica Bay (180701040500).
1.2 CIMP OVERVIEW
The CIMP is designed to provide the information necessary to guide management decisions in addition to
providing a means to measure compliance with the Permit. The SMB JG7 WMP Group’s CIMP
addresses the six required elements of the Permit MRP:
1. Receiving Water Monitoring
2. Stormwater Outfall Monitoring
3. Non-Stormwater Outfall Monitoring
4. New Development and Redevelopment Effectiveness Tracking
5. Regional Studies
6. Special Studies
Each of the six CIMP elements is summarized below.
1.2.1 Receiving Water Monitoring
Receiving water monitoring is intended to assess whether water quality objectives are being achieved, to
determine if beneficial uses are being supported, and to track trends in constituent concentrations over
time. The data from the Peninsula Cities CIMP will be used, with one alternate receiving water
monitoring site within the J7 CIMP area if the Peninsula data is not available. Section 2 discusses the
SMB JG7 WMP Group’s receiving water monitoring program.
1.2.2 Stormwater Outfall Monitoring
Stormwater outfall monitoring assesses compliance with municipal action limits (MALs), WQBELs
derived from TMDL WLAs, and evaluates whether discharges have the potential to have caused or
contributed exceedances of RWLs derived from TMDL WLAs or receiving water quality objectives.
The majority of storm drains within the SMB JG7 WMP Group generally drain towards Santa Monica
Bay. Data from stormwater outfall monitoring for the Peninsula Cities CIMP will be used to
represent stormwater quality from the J7 WMP area. If data from the Peninsula Cities is
unavailable, data from stormwater outfall monitoring from Santa Monica Bay J2/J3 will be used
to represent stormwater quality from the J7 WMP area. Alternatively, if data from the adjacent
CIMPs are not available or deemed not representative, one primary alternate and another secondary
SMB JG7 Coordinated Integrated Monitoring Program – April 2015 Introduction
Page 8
alternate outfall monitoring site within the J7 CIMP area will be monitored. A synopsis of the outfall
drainage area, along with an analysis of its land use/zoning characteristics is summarized in Section 4.
1.2.3 Non-Stormwater Outfall Program
To fulfill the Permit requirements, the MRP requires Permittees to implement a Non-Stormwater Outfall
Screening and Monitoring Program (Non-Stormwater Program) which is focused on eliminating non-
permitted non-stormwater discharges to receiving waters. Additional details of the Non-Stormwater
Program are presented in Section 5.
1.2.4 New Development and Redevelopment Effectiveness Tracking
The New Development/Re-Development Effectiveness Tracking is required to identify the information
necessary for data management and annual compliance reporting. The SMB JG7 WMP Group will
maintain an informational database record for each new development/re-development project subject to
the minimum control measure (MCM) and their adopted Low Impact Development (LID) Ordinance. In
addition, the SMB JG7 WMP Group will implement a tracking system for new development/re-
development projects that have been conditioned for post-construction BMPs. Section 6 presents the new
development and redevelopment effectiveness tracking system for the SMB JG7 WMP Group.
1.2.5 Regional Studies
The MRP identifies one regional study: the SMC Regional Watershed Monitoring Program. None of the
SMC monitoring sites are located within the SMB JG7 WMP Group area due to a lack of
streams or rivers.
1.2.6 Special Studies
The MRP requires each Permittee to be responsible for conducting special studies required in an effective
TMDL or an approved TMDL Monitoring Plan. Special studies options are further discussed in Section
8.

Page 9
Section 2 Receiving Water Monitoring Program
Receiving water bodies within the SMB JG7 WMP Group area were presented in Section 1. The
receiving water bodies (Santa Monica Bay – Offshore/Nearshore zone, Royal Palms Beach, White Point
Beach, and Point Fermin Park Beach) are designated as having existing recreational beneficial uses
(REC-1 and REC-2), among others. The objectives of the CIMP receiving water monitoring program
include the following (Part II.E.1 of the MRP):
Determine whether the receiving water limitations are being achieved;
Assess trends in pollutant concentrations over time, or during specified conditions; and
Determine whether the designated beneficial uses are fully supported as determined by water
chemistry, as well as aquatic toxicity and bioassessment monitoring.
The requirements in the MRP for selecting receiving water monitoring sites include utilizing receiving
water monitoring sites at previously designated LACDPW mass emission (ME) stations, TMDL receiving
water compliance points, and additional receiving water locations representative of the impacts from MS4
discharges. Through the evaluation of previously-utilized and existing receiving water monitoring sites,
no existing ME stations were located. As shown in Figure 4, three existing Santa Monica Bay Beaches
Bacteria TMDL monitoring stations are located within the SMB JG7 WMP Group’s jurisdictional area
(SMB 7-06, SMB-7-08, and SMB 7-09; SMB 7-07 was destroyed in a landslide). SMB J7 WMP Group
is uniquely different from other SMB subwatersheds and watershed groups in that the storm drain outfalls
are located along steep bluffs and cliffs up to a hundred feet high or more without safe access to the
shoreline. The path to shoreline locations associated with outfalls are often either non-existent or through
an unsafe rocky cliff. The City of Los Angeles has assessed all potential replacement outfalls between
SMB 7-06 and SMB 7-08, in addition to local receiving water locations, in an attempt to designate a
representative replacement additional shoreline monitoring location. However, all potential locations were
found to be unsafe for sampling. Details of the outfalls reviewed are included in Attachment C.
Additionally, four sites in the Santa Monica Bay offshore of the JG7 WMP Group area are monitored as
part of the Bight Program. Existing monitoring programs are discussed in Section 2.1 below.
One receiving water station was identified for monitoring as part of the CIMP in the event that data from
the Peninsula Cities CIMP is unavailable. Details on the monitoring site selection as well as the proposed
frequency, parameters, and duration of monitoring are discussed in Section 2.2 through 2.4.
2.1 EXISTING MONITORING PROGRAMS
A regional monitoring program to assess the health of the Southern California Bight has been coordinated
through Southern California Coastal Water Research Project (SCCWRP) at five-year intervals including
1994, 1998, 2003, 2008, and 2013. The Bight Regional Monitoring programs include:
Coastal Ecology
Shoreline Microbiology
Offshore Water Quality
Rocky Reef
Areas of Special Biological Significance (ASBS)
Coastal Wetlands and Estuaries
Through these programs, the SCCWRP has been able to conduct a regional assessment of the cumulative
impacts from multiple sources. Bight sampling locations are shown in Figure 4. The monitoring sites
SMB JG7 Coordinated Integrated Monitoring Program – April 2015 Introduction
Page 10
were analyzed for trace metals, polychlorinated biphenyls (PCBs), polycyclic aromatic hydrocarbons
(PAHs), poly brominated diphenyl ethers (PBDEs), chlorinated hydrocarbons, total organic carbon
(TOC), nitrogen, phosphorus, and grain size.

SMB JG7 Coordinated Integrated Monitoring Program – April 2015 Receiving Water Monitoring Program
Page 11

SMB JG7 Coordinated Integrated Monitoring Program – April 2015 Receiving Water Monitoring Program
Page 12
The TMDLs addressing water body-pollutant combinations within or downstream of the SMB JG7 WMP
Group include:
Santa Monica Bay Beaches Bacteria TMDL (Wet and Dry), July 15, 2003 (SMBBB TMDL);
Santa Monica Bay TMDL for Dichlorodiphenyltrichloroethanes (DDTs) and Polychlorinated
biphenyls (PCBs), March 26, 2012 (SMB DDT and PCB TMDL); and
Santa Monica Bay Nearshore and Offshore Debris TMDL, March 20, 2012 (SMB Debris
TMDL).
The water body-pollutant priorities are summarized in Table 2, as described in detail in the SMB JG7
WMP. Compliance deadlines associated with each of the TMDLs listed above are also presented in Table
2. All SMB JG7 WMP water body-pollutant combinations fall within Category 1, highest priority. No
Category 2 or 3 water body-pollutant combinations were identified.
Table 2
Water Body-Pollutant Priorities
Category Water Body Pollutant Compliance Deadline
1: Highest
Priority
(Approved
TMDL)
SMB Beaches
Summer dry weather
bacteria 7/15/2006 (Single sample)
Winter dry weather
bacteria 7/15/2009
(Single sample)
Wet weather bacteria 7/15/2013 (Single sample)
1
7/15/2013 (Geometric mean)1, 2
SMB
Offshore/
Nearshore
Debris
3/20/2016 (20% load reduction)
3/20/2017 (40% load reduction)
3/20/2018 (60% load reduction)
3/20/2019 (80% load reduction)
3/20/2020 (100% load reduction)
SMB DDTs [No compliance deadline specified in TMDL]
3
PCBs [No compliance deadline specified in TMDL]3
1 Per Resolution 2006-008, the JG7 agencies elected to pursue a non-integrated water resources approach to
SMBBB TMDL compliance, which resulted in a final wet weather compliance deadline of at most 10-years, or July
15, 2013. http://63.199.216.6/larwqcb_new/bpa/docs/2006-008/2006-008_RB_RSL.pdf 2 The rolling 30-day geometric mean will be calculated weekly based on calculation of a rolling six week geometric
mean using five or more samples, starting all calculation weeks on Sunday. 3 Although the TMDL lacks a formal compliance schedule for the WLAs, Table 6-5 of the TMDL does specify a
timeline for the DDT/PCB targets in water and sediment. Additionally, WLA target was set at existing waste load,
so antidegradation conditions exist.
2.1.1 Santa Monica Bay Beaches Bacteria TMDL
The Santa Monica Bay beaches were designated as impaired and included on California’s 1998 Clean
Water Act (CWA) §303(d) list of impaired waters due to excessive amounts of coliform bacteria. The
presence of coliform bacteria in surface waters is an indicator that water quality may not be sufficient to
maintain the beneficial use of these waters for human body contact recreation (REC-1). In 2003, the
USEPA approved the SMBBB TMDL for dry- and wet-weather conditions, the first bacteria TMDL
adopted by the Regional Board in the State of California. To comply with the requirements of the TMDL,

SMB JG7 Coordinated Integrated Monitoring Program – April 2015 Receiving Water Monitoring Program
Page 13
the Jurisdictional Groups developed a Coordinated Shoreline Monitoring Plan (CSMP) and began
monitoring compliance sites on November 1, 2004 subsequent to Regional Board approval.
As this was the first bacteria TMDL, new approaches for regulating bacteria were developed. The
SMBBB TMDL used these new approaches, including the reference beach/antidegradation approach and
the corresponding exceedance day approach to expressing TMDL allocations.
In 2012, the Regional Board put forward the Reconsideration of Certain Technical Matters for the Santa
Monica Bay Beach Bacteria TMDLs; the Marina del Rey Harbor Mothers’ Beach and Back Basins
Bacteria TMDL; and the Los Angeles Harbor Inner Cabrillo Beach and Main Ship Channel Bacteria
TMDL. The reconsideration examined certain elements of the SMBBB TMDL, which is presented in
Table 3. Through the reconsideration process, winter dry-weather single sample allowable exceedance
days were increased for certain sites and modifications were made to the geometric mean calculation for
all monitoring sites.
Table 3 Summary of Reconsideration Elements for SMBBB TMDL
TMDL Reconsideration Items
Santa Monica Bay
Beaches
Dry-Weather TMDL
Re-consider TMDL to re-evaluate allowable winter dry weather exceedance days based
on additional data on bacterial indicator densities in the wave wash, a reevaluation of
the reference system selected to set allowable exceedance levels, and a re-evaluation of
the reference year used in the calculation of allowable exceedance days.
Santa Monica Bay
Beaches
Wet-Weather TMDL
Refine allowable wet weather exceedance days based on additional data on bacterial
indicator densities in the wave wash and an evaluation of site-specific variability in
exceedance levels.
Re-evaluate the reference system selected to set allowable exceedance levels, including
a reconsideration of whether the allowable number of exceedance days should be
adjusted annually dependent on the rainfall conditions and an evaluation of natural
variability in exceedance levels in the reference system(s).
Re-evaluate the reference year used in the calculation of allowable exceedance days.
Re-evaluate whether there is a need for further clarification or revision of the geometric
mean implementation provision.
The SMBBB TMDL establishes multi-part numeric targets for total coliform, fecal coliform, and
enterococcus densities, reported as bacteria counts (Most Probable Number, MPN or colony forming unit,
cfu) per 100 milliliters of sample. The TMDL waste load allocation (WLA), expressed as water quality-
based effluent limitations (WQBELs), are based on the Los Angeles Basin Plan objectives for body-
contact recreation (REC-1) as summarized in Table 4. Dry-weather WQBELs compliance was
anticipated as of July 15, 2006 for summer dry weather, and July 15, 2009 for winter dry weather. Wet-
weather compliance has been required as of July 15, 2013. This is based on Resolution 2006-008, in
which the JG7 agencies elected to pursue a non-integrated water resources approach to SMBBB TMDL
compliance, which resulted in a final wet weather compliance deadline of at most 10-years. Therefore, all
milestones for SMB 7-06, SMB 7-08, and SMB 7-09 are currently enforceable (there are no interim
targets).

SMB JG7 Coordinated Integrated Monitoring Program – April 2015 Receiving Water Monitoring Program
Page 14
Table 4 SMBBB TMDL Water Quality-Based Effluent Limitations and Receiving Water Limitations
Constituent Daily Maximum Rolling 30-day Geometric Mean2
Total coliform1 10,000/100 mL 1,000/100 mL
Fecal coliform 400/100 mL 200/100 mL
Enterococcus 104/100 mL 35/100 mL
1 Total coliform density shall not exceed a daily maximum of 1,000/100 mL, if the ratio of fecal to total coliform exceeds
0.1.
2 The reopened 2012 TMDL modified the geometric mean calculation to weekly calculation of a rolling six week
geometric mean using five or more sample, starting all calculation weeks on Sunday.
The allowable numbers of exceedance days of the single sample objectives at each of the monitored
locations within the JG7 WMP area are summarized in Table 5.
Table 5 Annual Allowable Exceedance Days of the Single Sample Objective (days) 1
Monitoring
Sites
Beach
Monitoring
Locations
Summer Dry-Weather
(April 1 - October 31)
Winter Dry-Weather
(November 1 - March 31)
Wet-Weather
(Year-round)
Daily
Sampling
Weekly
Sampling
Daily
Sampling
Weekly
Sampling
Daily
Sampling
Weekly
Sampling
SMB 7-06
White’s Point,
Royal Palms
County Beach
0 0 1 1 6 1
SMB 7-08
Point
Fermin/Wilder
Annex, San
Pedro
0 0 1 1 2 1
SMB 7-09 Outer Cabrillo
Beach 0 0 1 1 3 1
1 The final receiving water limitations are group-based and shared among all MS4 Permittees located within the sub-drainage
area to each beach monitoring location.
In summary, to satisfy the monitoring requirements for the SMBBB TMDL, the existing bacteria TMDL
monitoring sites (SMB 7-06, SMB-7-08, and SMB 7-09) will continue to be monitored in accordance to
the Santa Monica Bay Beaches Bacteria TMDL Coordinated Shoreline Monitoring Plan (CSMP)
(Technical Steering Committee 2004).
2.1.2 Santa Monica Bay Nearshore and Offshore Debris TMDL
Compliance with the SMB Debris TMDL is based on the final Numeric Target, WLA, and Load
Allocation (LA), which are defined as zero trash in and on the shorelines of Santa Monica Bay, and no
plastic pellets discharged from plastic manufacturers and facilities. The compliance deadline is to be
achieved no later than March 20, 2020, and every year thereafter. If a Permittee adopts local ordinances
to ban plastic bags, smoking in public places, and single-use expanded polystyrene food packaging by
November 4, 2013, the final compliance deadline will be extended to March 20, 2023. The SMB Debris
TMDL compliance is assessed in accordance with the Permittees’ implementation of BMPs to address
point and non-point source trash and plastic pellet abatement, and attainment of the progressive trash
reductions in accordance with the TMDL compliance schedule as shown in Table 6.

SMB JG7 Coordinated Integrated Monitoring Program – April 2015 Receiving Water Monitoring Program
Page 15
Table 6 Santa Monica Bay Debris TMDL Compliance Schedule
Permittees Baseline1
3/20/2016 3/20/2017 3/20/2018 3/20/2019 3/20/20202
Annual Trash Discharge (gals/yr)
City of Los
Angeles 25,112 20,090 15,067 10,045 5,022 0
1 If a Permittee elects not to use the default baseline, then the Permittee shall include a plan to establish a site specific
trash baseline in their TMRP.
2 Permittees shall achieve their final effluent limitation of zero trash discharge for the 2019-2020 storm year and every
year thereafter.
Permittees are to report their compliance strategy through the development of a Trash Monitoring and
Reporting Plan (TMRP) and Plastic Pellets Monitoring and Reporting Plan (PMRP), or demonstrate that a
PMRP is not required, to be approved by the Regional Board. The SMB Debris TMDL specifies that
plastic pellet monitoring is not required if Permittees can provide documentation there are no industrial
facilities or activities related to the manufacturing, handling, or transportation of plastic pellets within the
jurisdiction. Once the TMRP and PMRP are approved and adopted, a progress report based on installation
of structural BMPs, such as full capture or partial capture systems, institutional controls, or any BMPs, is
to be reported in order to calculate the reduction in the amount of trash and plastic pellets, if applicable,
being discharged into Santa Monica Bay.
Each of the jurisdictions within SMB JG7 WMP Group will submit or have submitted a TMRP and
PMRP. Each jurisdiction has conducted the following:
City of Los Angeles: The Trash TMDL Compliance Method: Structural Measures was submitted
in September 2011 and was adopted as the TMRP for the City of Los Angeles. As indicated in
Table 1, industrial land uses in the SMB JG7 WMP only account for 0.09 percent of the entire
area, with that nearly negligible area identified as “navigation aids”. It has also been verified with
the Industrial Waste Management Division of the City of Los Angeles Bureau of Sanitation
(LASAN) that within the JG7 WMP area, there are no facilities with standard industrial
classification system (SIC) codes associated with plastic pellets (282X, 305X, 308X, 39XX,
25XX, 3261, 3357, 373X, and 2893) or facilities with the term “plastic” in the facility or operator
name. Additionally, data obtained from the City of Los Angeles Planning Department, based on
2005 SCAG land use data, shows that there is no visible industrial zoning in the SMB JG7 WMP
area (shown in Figure 5). Therefore, the SMB JG7 WMP Group is not subject to the plastic
pellet monitoring requirements of the SMB Debris TMDL. The Illicit Connection Illicit
Discharge Elimination Program Manual, developed by the City of Los Angeles Department of
Public Works in 1999, contains the operational protocols and policies for City staff to address
illicit discharges into the storm drain system. The following spill and response plan is in place
both in general, as well as in the case of a plastic pellets spill:
1. The City of Los Angeles has established a hotline (800-974-9794) where spills can be
reported. This hotline can be contacted 24/7, and is managed by LASAN’s Watershed
Protection Division. Any spills reported to the City’s 311 number or to LASAN’s call
center are immediately forwarded to this hotline.
2. An environmental compliance inspector of LASAN’s Watershed Protection Division (a
total of about 15-20 inspectors) will inspect the location of the spill and evaluate the
necessary next steps (determination of responsible party, clean-up, reporting/coordination
with Department of Fish and Game).
3. LASAN’s Watershed Protection Division will coordinate the containment and clean-up
of a plastic pellet spill. Containment may include the use of sand bags and/or mesh

SMB JG7 Coordinated Integrated Monitoring Program – April 2015 Receiving Water Monitoring Program
Page 16
screens to prevent plastic pellets from entering catch basins, or the use of trash booms if
the pellets have reached the receiving water. LASAN’s Watershed Protection Division
has an emergency contract in place with a contractor to assist with immediate
containment and clean-up needs.
LACFCD: A PMRP was submitted on September 19, 2013 for all LACFCD within the Santa
Monica Bay WMA. A TMRP was not submitted as the LACFCD does not have any land
jurisdiction that generates trash.
Figure 5. Industrial Zones in the City of Los Angeles Portion of JG7
All submitted TMRPs and PMRPs for each jurisdiction will be implemented by the corresponding
jurisdiction, once approved by the Regional Board. As the SMB Debris TMDL is fulfilled through the
implementation of BMPs to achieve compliance of zero trash in and on the shorelines of Santa Monica
Bay, monitoring is not required if complying with the WLA. Manufacturers of plastic pellets were not
identified within any of the SMB JG7 WMP Group’s jurisdictional area, and monitoring for plastic pellets
at the MS4 is not required. Appropriate actions for emergency spills and special circumstances for safety
considerations are addressed for each jurisdiction.
2.1.3 Santa Monica Bay DDTs and PCBs TMDL
The SMB DDTs and PCBs TMDL are regulated for Santa Monica Bay from Point Dume to Point
Vicente, and the Palos Verdes shelf from Point Vicente to Point Fermin. As the TMDL originates
through the United States Environmental Protection Agency (USEPA), the Regional Board has been

SMB JG7 Coordinated Integrated Monitoring Program – April 2015 Receiving Water Monitoring Program
Page 17
advised to implement the TMDL either through an implementation plan, NPDES permit, or other
regulatory mechanisms such as State waste discharge requirements (WDRs), conditional waivers of
WDRs, and/or enforcement actions. The Regional Board has decided to implement this TMDL through
the MS4 Permit. Within the Permit, the WLA targets are stated in Table 7, which is expressed as an
annual stormwater loading of pollutants to Santa Monica Bay from the LA County MS4.
Table 7 Santa Monica Bay DDTs and PCBs TMDL Waste Load Allocations
Constituent Annual Mass-Based WLA (g/yr)1
Total DDT 27.08
PCBs 140.25
1 Compliance shall be determined based on a three-year averaging period. WLA is for entire
LA County MS4.
The PCB and DDT TMDL states that the highest DDT and PCB loadings were from the Ballona Creek,
Hermosa Beach, and Santa Monica Canyon Channel watersheds, which combined accounted for 94% of
the developed area draining to Santa Monica Bay. Compliance with the WLAs for DDTs and PCBs will
be assessed through monitoring conducted as part of the Peninsula Cities CIMP at Peninsula-SD2 rather
than sampling in the JG7 WMP Group area. Data collected at Peninsula-SD2 would be extrapolated to
the J7 WMP area by scaling land uses and/or drainage areas. Rationale for the selection of this site is
provided in the following section.
2.2 CIMP RECEIVING WATER MONITORING SITE
The primary objective of receiving water monitoring is to assess trends in pollutant concentrations over
time, or during specified conditions.
The City of Los Angeles and Peninsula Cities have agreed to share the data from monitoring performed
by peninsula cities at RW-2 and its associated storm water outfall because of similarity of landuse
primarily across the J7 area. The City of LA will use the data to evaluate its receiving water quality
through an extrapolation methodology. The City will reimburse the peninsula cities through a cost
sharing MOA or letter of agreement.
Data from receiving water monitoring for the Peninsula Cities CIMP at Peninsula-RW2 will be used to
represent receiving water quality adjacent to the J7 WMP area. Such representative data would be
extrapolated based on land use or drainage area to best reflect conditions with the J7 WMP area.
Alternatively, if data are not available at Peninsula-RW2, one alternate receiving water monitoring site,
SMBJ7-RW-1, is being proposed within the Santa Monica Bay at a transect outward from the alternate
CIMP outfall monitoring site SMBJ7-O-6. This location is consistent with the stormwater plume during a
qualifying storm event when it has been deemed safe for collection by the Captain of the boat. Single
grab samples would be collected from the mixing zone in the ocean, at the nearest distance from the
shoreline that the Environmental Monitoring Division boat can safely access. Figure 6 presents the
approximate location of the receiving water monitoring site for the SMB JG7 WMP Group.
The JG7 WMP Group area consists solely of City of Los Angeles land. Primary land uses in the JG7
WMP Group area and the general catchment area of SMBJ7-RW-1 are residential and vacant. Given that
the land uses of JG7 WMP and the catchment area are comparable, monitoring at SMBJ7-RW-1 is
considered sufficiently representative of the JG7 WMP area. Table 8 presents the land use composition
of the HUC-12, the JG7 WMP area, and the catchment area of the proposed stormwater outfall SMBJ7-O-

SMB JG7 Coordinated Integrated Monitoring Program – April 2015 Receiving Water Monitoring Program
Page 18
6, which is considered an approximation of the drainage area tributary to the proposed receiving water
site SMBJ7-RW-1.
Table 8 Land Use Overview of Outfall Nearest to Dry Weather Receiving Water Monitoring Site SMBJ7-
RW-1
HUC-12 J7 WMP Area SMBJ7-RW-1
Land Use Acres % of Total Acres % of Total Acres % of Total
Agriculture 90 0.4% 0.0 0% 0.0 0%
Commercial 1,231 5% 26 2% 0.0 0%
Education 806 3% 32 3% 2.8 2%
Industrial 1,488 6% 1.0 0.1% 0.0 0%
MF Residential 2,042 9% 151 14% 22 14%
SF Residential 11,265 47% 562 53% 126 78%
Transportation 1,957 8% 0.0 0% 0.0 0%
Vacant/Open Space 5,237 22% 284 27% 11 7%
Total 24,115 100% 1,056 100% 161 100%

SMB JG7 Coordinated Integrated Monitoring Program – April 2015 Receiving Water Monitoring Program
Page 19

SMB JG7 Coordinated Integrated Monitoring Program – April 2015 Receiving Water Monitoring Program
Page 20
2.3 MONITORING FREQUENCY, PARAMETERS, AND DURATION
The MRP section of the MS4 Permit identifies specific requirements for salt water (Santa Monica Bay).
Wet- and dry-weather monitoring frequency, parameters, and duration will be addressed in the following
sections. Parameters for monitoring were based on the MS4 Permit requirements as well as the water
quality priorities as identified in the SMB JG7 WMP. Additional analytical and monitoring procedures
are discussed in Attachments B-D. Parameters to be collected and sampling frequency to meet the
receiving water monitoring requirements of the MRP are summarized in Table 91.
Table 9
Receiving Water Monitoring Parameters and Annual Frequency
Constituents Wet Weather Dry Weather
Field parameters(1)
3 1
Pollutants identified in Table E-2 of the MRP 1(2)
1(2)
Aquatic Toxicity and Toxicity Identification Evaluation (TIE) 2(3)
1
Total Coliform(4)
3 0
E. Coli (Fecal Coliform)(4)
3 0
Enterococcus(4)
3 0 1 Field parameters are defined as DO, pH, temperature, salinity (due to ocean monitoring), and specific conductivity and
TSS 2 Monitoring frequencies only apply during the first year of monitoring. Except for constituents for which a TMDL has been
established and interim compliance milestone dates have not passed or are currently being attained, monitoring for Table E-
2 pollutants will be initiated if there are two consecutive exceedances observed during the same condition (i.e., wet or dry
weather) and would continue until the deactivation criterion is triggered, which is defined as two consecutive samples that
are not exceedances during the same condition (i.e., wet or dry weather). The activation and deactivation criteria avoid the
possibility of performing additional sampling as a result of one-time events that may have resulted from sampling and/or
analytical error. 3A TIE is only required if either the survival or sublethal endpoint of the toxicity text demonstrates a percent effect value
equal to or greater than 50% at the instream waste concentration. 4 Will be monitored at the existing CSMP monitoring locations and CSMP sampling schedule
2.3.1 Wet Weather
Wet-weather receiving water monitoring will be conducted for the duration of the MS4 permit. Data
from the Peninsula Cities CIMP will be used as representative of the receiving water adjacent to the J7
WMP area due to the locations’ proximity, land use, and topographic similarities. However, SMBJ7-RW-
1 will serve as the alternate site in the case that the Peninsula CIMP data are not made available. Wet-
weather conditions will be defined as a storm event of greater than or equal to 0.1 inch of precipitation, as
measured from the closest Los Angeles County controlled rain gauge within the watershed. Wet-weather
monitoring will be conducted initially for all MRP Table E-2 parameters during the first significant rain
event of the first year of monitoring; three times a year for flow and field parameters, total coliform, E,
coli (fecal coliform), and enterococcus; and twice a year for aquatic toxicity, per Part VI.C.1.a of the
MRP.. Except for constituents for which a TMDL has been established and interim compliance milestone
dates have not passed or are currently being attained, monitoring for Table E-2 pollutants will be initiated
1 Because samples will be collected in Santa Monica Bay, suspended sediment concentrations will be significantly
less than if collected in a creek or river, making collection of sufficient sediment to conduct the analysis most likely
infeasible. As such, whole water samples will be analyzed consistent with standard receiving water monitoring for
DDTs and PCBs.
SMB JG7 Coordinated Integrated Monitoring Program – April 2015 Receiving Water Monitoring Program
Page 21
if there are two consecutive exceedances observed during the same condition (i.e., wet or dry weather)
and would continue until the deactivation criterion is triggered, which is defined as two consecutive
samples that are not exceedances during the same condition (i.e., wet or dry weather). The activation and
deactivation criteria avoid the possibility of performing additional sampling as a result of one-time events
that may have resulted from sampling and/or analytical error. Wet-weather receiving water monitoring
will target the first significant rain event of the storm year and will be performed in close coordination
with stormwater outfall monitoring to be reflective of potential impacts from MS4 discharges.
2.3.2 Dry Weather
Outfall catchment areas in the SMB JG7 WMP Group area are relatively small, ranging from less than
140 acres to approximately 370 acres. During dry weather it is unlikely that discharge from these outfalls
would be of sufficient quantity to impact the Santa Monica Bay, where wet weather monitoring is
conducted. However, data from the Peninsula Cities CIMP will be used as representative of the receiving
water adjacent to the J7 WMP area due to the locations’ proximity, land use, and topographic similarities.
Alternatively, if the adjacent CIMP data are not available, dry weather receiving water monitoring will be
conducted at SMBJ7-RW-1.
2.4 RECEIVING WATER MONITORING SUMMARY
Data from the Peninsula Cities CIMP monitoring site Peninsula-RW2 will be used as representative of the
receiving water adjacent to the J7 WMP area due to the locations’ proximity, land use, and topographic
similarities. Data from this site would be used for both wet and dry weather sampling, and potentially
extrapolated based on land use or drainage area if deemed appropriate to best reflect the receiving water
adjacent to the J7 WMP area. One alternate monitoring site within the JG7 WMP area has been selected
in the case that Peninsula CIMP data are not made available: SMBJ7-RW-1. In this case, both wet and dry
weather receiving water monitoring would be performed from a boat in the Santa Monica Bay, at a
transect outward from SMBJ7-O-6, consistent with the stormwater plume during wet weather. The
approximate location of this monitoring site is presented in Figure 6. A summary of constituents and
monitoring frequency for the receiving water monitoring site was presented in Table 9. Sampling and
analytical methods for receiving water monitoring is provided in Attachments B-D.

Page 22
Section 3 MS4 Infrastructure Database
To meet the requirements of Part VII of the MRP, a map(s) and/or database of the MS4 storm drains,
channels, and outfalls must be submitted with the CIMP and include the following information (Part
VII.A of the MRP). The SMB JG7 WMP Group has gathered for submittal as a map and/or in a database
the items below with the exception of numbers 9 and 11e, which will be determined as the CIMP
progresses:
1. Surface water bodies within the Permittee(s) jurisdiction
2. Sub-watershed (HUC-12) boundaries
3. Land use overlay
4. Effective Impervious Area (EIA) overlay
5. Jurisdictional boundaries
6. The location and length of all open channel and underground pipes 18 inches in diameter or
greater (with the exception of catch basin connector pipes)
7. The location of all dry-weather diversions
8. The location of all major MS4 outfalls within the Permittees’ jurisdictional boundary. Each
major outfall shall be assigned an alphanumeric identifier, which must be noted on the map
9. Notation of outfalls with significant non-stormwater discharges (to be updated annually)
10. Storm drain outfall catchment areas for each major outfall within the Permittee(s) jurisdiction
11. Each mapped MS4 outfall shall be linked to a database containing descriptive and monitoring
data associated with the outfall. The data shall include:
a. Ownership
b. Coordinates
c. Physical description
d. Photographs of the outfall, where possible, to provide baseline information to track
operation and maintenance needs over time
e. Determination of whether the outfall conveys significant non-stormwater discharges
f. Stormwater and non-stormwater monitoring data
Figures 1 through 3 present the available database information, listed above, for the SMB JG7 WMP
Group. Each year, a storm drain, channel, outfall map as well as an associated database for the SMB JG7
WMP Group are required to be updated to incorporate the most recent characterization data for outfalls
with significant non-stormwater discharge. As further investigations are conducted and additional data is
collected, updates to the maps and/or database will be conducted over time. Updates to the maps and/or
database will be submitted through the Annual Report.
Table 10 below summarizes the sources of the GIS data used to generate the maps and database.

SMB JG7 Coordinated Integrated Monitoring Program – April 2015 Receiving Water Monitoring Program
Page 23
Table 10
GIS Data Sources
Description Source Attributes
HUC 12 watersheds Regional Water Quality Control
Board Watershed name
Storm drains Los Angeles County Flood Control
District and City of Los Angeles Owner and size
LA Air Force Base Delineated in-house N/A
Topographic basemap ESRI N/A
EWMP and WMP Groups Regional Water Quality Control
Board
EWMP or WMP Group
Name
Land use descriptions and percent
impervious values Los Angeles County
Land use names and
groups, percent impervious
Outfalls LACFCD provided major outfalls,
others identified in-house, Outfall name
Drainage areas to outfalls Delineated in-house CatchID
TMDL monitoring stations Coordinated Shoreline Monitoring
Plan Site ID
Bight program monitoring station Bight Station name
SMB J2/J3 CIMP monitoring
stations J2/J3 CIMP Station ID

Page 24
Section 4 Stormwater Outfall Monitoring
Stormwater outfall monitoring assesses compliance with municipal action limits (MALs), WQBELs
derived from TMDL WLAs, as well as the potential to cause or contribute to exceedances of RWLs
derived from TMDL WLAs or receiving water quality objectives. The majority of SMB JG7 WMP
Group storm drains generally drain towards Santa Monica Bay. An analysis of land use per HUC-12,
drainage area and SMB JG7 WMP Group area was conducted for the monitoring site.
4.1 PROGRAM OBJECTIVES
As outlined in the Part VIII.A of the MRP, stormwater discharges from the MS4 shall be monitored at
outfalls and/or alternative access points such as manholes, or in channels representative of the land uses
within the Permittees’ jurisdiction to support meeting the three objectives of the stormwater outfall based
monitoring program:
1. Determine the quality of a Permittee’s discharge relative to MALs;
2. Determine whether a Permittee’s discharge is in compliance with applicable stormwater
WQBELs derived from TMDL WLAs; and
3. Determine whether a Permittee’s discharge causes or contributes to an exceedance of receiving
water limitations.
Each potential stormwater outfall monitoring site was evaluated and assessed on how representative it is
of the surrounding land use of the SMB JG7 WMP Group area, jurisdictions, and the HUC-12. Each
zoning category provided by the RAA guidance manual was fit into one of the following eight land use
categories:
Agricultural Commercial
Industrial Education
Single Family Residential Multi-Family Residential
Vacant/Open Space Transportation
4.2 STORMWATER OUTFALL MONITORING SITES
Due to inaccessibility of outfalls within the City of Los Angeles area in J7, and because of similarity of
landuse primarily across the J7 area, the City of Los Angeles and Peninsula Cities have agreed to share
the data from monitoring performed by peninsula cities at RW-2 and its associated storm water outfall.
The City of LA will use the data to evaluate its receiving water quality, stormwater outfall and the storm
born sediment for DDT, PCB through an extrapolation methodology. The City will reimburse the
peninsula cities through a cost sharing MOA or letter of agreement.
Data from stormwater outfall monitoring for the Peninsula Cities CIMP will be used to represent
stormwater quality from the J7 WMP area. If data from the Penisula Cities is unavailable, data from
stormwater outfall monitoring from Santa Monica Bay J2/J3 will be used to represent stormwater quality
from the J7 WMP area. Such representative data would potentially be extrapolated based on land use or
drainage area to best reflect conditions with the J7 WMP area.

SMB JG7 Coordinated Integrated Monitoring Program – April 2015 Stormwater Outfall Monitoring
Page 25
Alternatively, if data from the adjacent CIMPs are not available or deemed not representative, one
primary stormwater outfall monitoring site and one alternate site, as shown in Figure 6, has been selected
for monitoring, pending further evaluation for safe access.
Site SMBJ7-O-6, identified as the primary monitoring site, is located north of SMBBB TMDL
monitoring location SMB-7-08. This outfall is an 18-feet by 25-feet reinforced concrete box structure
that, based on the GIS data, appears to be the outfall for a 66-inch diameter reinforced concrete pipe. The
outfall is located near the intersection of Paseo del Mar and Almeria Street.
Site SMBJ7-O-3, selected as the alternate monitoring site, is located near SMBBB TMDL monitoring
location SMB-7-06. This stormwater outfall is a 2-feet diameter pipe that carries flow from the upper
canyon under the pathway to the beach front.
Runoff from both SMBJ7-O-3 and SMBJ7-O-6 is solely from the City of Los Angeles. Table 11
compares the land use composition of these catchment areas, HUC-12, and the SMB JG7 WMP Group
area. Although this table reflects the same delineation for SMBJ7-O-6 as presented for SMBJ7-RW-1, it
should be noted that the area tributary to an offshore location is likely larger than the outfall delineation
area. Additionally, pending an accessibility review, if conditions prohibit safe access to these sites another
location may be selected.
Table 11
Land Use Overview of Potential Outfall Monitoring Sites
HUC-12 J7 WMP Area SMBJ7-O-3 SMBJ7-O-6
Land Use Acres
% of
Total Acres
% of
Total Acres
% of
Total Acres
% of
Total
Agriculture 90 0.4% 0.0 0% 0.0 0% 0.0 0%
Commercial 1,231 5% 26 2% 14 8% 0.0 0%
Education 806 3% 32 3% 0.0 0% 2.8 2%
Industrial 1,488 6% 1.0 0.1% 0.0 0% 0.0 0%
MF Residential 2,042 9% 151 14% 7.3 4% 22 14%
SF Residential 11,265 47% 562 53% 131 75% 126 78%
Transportation 1,957 8% 0.0 0% 0.0 0% 0.0 0%
Vacant/open 5,237 22% 284 27% 24 14% 11 7%
Total 24,115 100% 1,056 100% 177 100 161 100%
4.3 MONITORING FREQUENCY, PARAMETERS, AND DURATION
The stormwater outfall monitoring site will be monitored for three (3) storm events per year, in
coordination with and prior to receiving water monitoring, for all required constituents except aquatic
toxicity. Samples will be collected by continuous auto-sampler, within the collection period targeting the
entire storm water discharge for storms lasting less than 24 hours, or a minimum of the first 24 hours of
the storm water discharge for storms lasting more than 24 hours. Permanent auto-samplers will be
installed within 18 months of CIMP approval. If the installation of permanent automatic stormwater
samplers cannot be expedited, the City will have the option to conduct water quality sampling using time-
weighted temporary/portable sampling equipment, as a first option, or collecting a grab sample every 20
minutes for three hours or the duration of the storm (if less than three hours), as a second option (USEPA,
1992a). Aquatic toxicity will be monitored when triggered by recent receiving water toxicity monitoring,

SMB JG7 Coordinated Integrated Monitoring Program – April 2015 Stormwater Outfall Monitoring
Page 26
where a toxicity identification evaluation (TIE) on the observed receiving water toxicity test was
inconclusive. The requirements for monitored constituents at the monitoring site are outlined in the MRP
Section VIII.B.1.c and presented in Table 12. Parameters in Table E-2 of the MRP, as listed in
Attachment B, will not be included as part of outfall monitoring until after the first year of receiving
water monitoring if it is determined there are parameters in Table E-2 present in concentrations exceeding
the applicable water quality objective in the receiving water. Monitoring for the selected site would occur
for at least the duration of the Permit term, unless an alternative site is warranted, per the adaptive
management process, as presented in Section 10. Additional analytical and monitoring procedures are
discussed in Attachment B.
Table 12 Stormwater Outfall Monitoring Parameters and Annual Frequency
Constituents Annual
Frequency
Flow, hardness, pH, dissolved oxygen, temperature, specific conductivity, and TSS 3
Table E-2 pollutants detected above relevant objectives in receiving waters2 3
Aquatic Toxicity and Toxicity Identification Evaluation (TIE) (see note 1)
Total Coliform 3
Fecal Coliform / (E. coli) 3
Enterococcus 3
1. Toxicity is only monitored from outfalls when triggered by recent receiving water toxicity monitoring where a TIE on
the observed receiving water toxicity test was inconclusive. If toxicity is observed at the outfall a TIE must be
conducted.
2. All Table E-2 parameters may not be tested at the outfall in the first monitoring year. Instead, if water quality
objectives are exceeded in the receiving water during the first significant storm event, then those exceeding parameters
would be tested at the outfall three times annually beginning with the next storm event that occurs at least 50-days later.
Page 27
Section 5 Non-Stormwater Outfall Screening and
Monitoring Program The MRP requires Permittees to implement a non-stormwater outfall-based screening and monitoring
program. The Non-Stormwater Outfall Screening and Monitoring Program (Non-Stormwater Program) is
focused on non-stormwater discharges to receiving waters from major outfalls.
5.1 PROGRAM OBJECTIVES
The objectives of the Non-Stormwater Program include the following (Part II.E.3 of the MRP):
a. Determine whether a Permittee’s discharge is in compliance with applicable non-stormwater
WQBELs derived from TMDL WLAs;
b. Determine whether a Permittee’s discharge exceeds non-stormwater action levels, as described in
Attachment G of the MS4 Permit;
c. Determine whether a Permittee’s discharge contributes to or causes an exceedance of receiving
water limitations; and
d. Assist a Permittee in identifying illicit discharges as described in Part VI.D.10 of the MS4 Permit.
Additionally, the outfall screening and monitoring process is intended to meet the following objectives
(Part IX.A of the MRP):
1. Develop criteria or other means to ensure that all outfalls with significant non-stormwater
discharges are identified and assessed during the term of this MS4 Permit.
2. For outfalls determined to have significant non-stormwater flow, determine whether flows are the
result of illicit connection/illicit discharge (IC/IDs), authorized or conditionally exempt non-
stormwater flows, natural flows, or from unknown sources.
3. Refer information related to identified IC/IDs to the IC/ID Elimination Program (Part VI.D.10 of
the MS4 Permit) for appropriate action.
4. Based on existing screening or monitoring data or other institutional knowledge, assess the
impact of non-stormwater discharges (other than identified IC/IDs) on the receiving water.
5. Prioritize monitoring of outfalls considering the potential threat to the receiving water and
applicable TMDL compliance schedules.
6. Conduct monitoring or assess existing monitoring data to determine the impact of non-stormwater
discharges on the receiving water.
7. Conduct monitoring or other investigations to identify the source of pollutants in non-stormwater
discharges.
8. Use results of the screening process to evaluate the conditionally exempt non-stormwater
discharges identified in Parts III.A.2 and III.A.3 of the MS4 Permit and take appropriate actions
pursuant to Part III.A.4.d of the MS4 Permit for those discharges that have been found to be a
source of pollutants. Any future reclassification shall occur per the conditions in Parts III.A.2 or
III.A.6 of the MS4 Permit.
9. Maximize the use of Permittee resources by integrating the screening and monitoring process into
existing or planned Integrated Monitoring Program (IMP) and/or CIMP efforts.

SMB JG7 Coordinated Integrated Monitoring Program – April 2015 Non-Stormwater Outfall Screening and Monitoring
Page 28
5.2 NON-STORMWATER OUTFALL SCREENING AND MONITORING PROGRAM
The Non-Stormwater Program is focused on dry-weather discharges to receiving waters from major
outfalls. The Program fills two roles: (1) to provide assessment of whether the non-stormwater
discharges are potentially impacting the receiving water, and (2) to determine whether significant non-
stormwater discharges are allowable. The Program is complimentary to the IC/ID minimum control
measure.
For the SMB JG7 WMP Group area, all major outfalls will be screened prior to proceeding with dry
weather monitoring. To determine whether an outfall must be monitored for non-stormwater discharges,
the SMB JG7 WMP Group has developed an outfall screening and monitoring program. The sections
starting with Section 5.3 are part of the monitoring program. Within 90 days of the approval of this
CIMP, the SMB JG7 WMP Group will initiate steps to identify and monitor the non-stormwater
discharges. The non-stormwater outfall program will involve following steps:
1. Outfall Screening: The SMB JG7 WMP Group will implement a screening process to determine
whether the monitoring site exhibits non-stormwater discharges and if so, if it is considered
significant or if it can be excluded from further investigation. This process will include: 1)
updating the outfall inventory, 2) measuring observed flows, and 3) testing for E. coli where flow
is observed.
2. Prioritized Source Investigation (Part IX.E of the MRP): The SMB JG7 WMP Group will use
the data collected as part of the Outfall Screening process to prioritize outfalls for source
investigations.
3. Significant Non-stormwater Discharge Source Identification (Part IX.F of the MRP): If the
monitoring site exhibits significant non-stormwater discharges, the SMB JG7 WMP Group will
perform source investigations per the established prioritization.
4. Monitoring Non-Stormwater Discharges Exceeding Criteria (Part IX.G of the MRP): Using
the information collected during screening and source identification efforts, the SMB JG7 WMP
Group will monitor the site if it has been determined to convey significant non-stormwater
discharges comprised of either unknown or non-essential conditionally exempt non-stormwater
discharges, or continuing discharges attributed to illicit discharges. Dry weather monitoring will
be conducted in the month of August, which is the historically driest month on record for the
SMB JG7 WMP Group area2.
5.3 IDENTIFICATION OF OUTFALLS WITH SIGNIFICANT NON-STORMWATER DISCHARGES
An initial field survey was conducted for the identification of outfalls in the JG7 WMP Group area, the
majority of which were observed to be corrugated metals pipes protruding from the top of rocky cliffs
above rocky beaches. As described in the field survey, observation of outfalls was limited by accessibility
and safety constraints. Attachment C presents the photos from this field survey.
Based on a review of the available information, identification of significant non-stormwater discharges is
not available at this time. The SMB JG7 WMP Group has undertaken a field reconnaissance to evaluate
the major outfall(s), in its jurisdiction, dependent on accessibility. A major outfall for the SMB JG7
WMP Group is defined as follows:
2 The driest month on record was determined based on the rainfall records at the LA County DPW gauges at Palos
Verdes and Torrance Airport, between 1996 and 2008.

SMB JG7 Coordinated Integrated Monitoring Program – April 2015 Non-Stormwater Outfall Screening and Monitoring
Page 29
36-inch or larger pipes
12-inch or larger pipes from industrial zoned areas
Table 13 summarizes the pertinent information for each of the outfalls in the SMB JG7 WMP Group
area. As shown, six of the 13 outfalls qualify as major outfalls and will be included in the non-
stormwater outfall screening process, noting that accessibility and safety constraints may still limit access
to these outfalls.
Table 13
Non-Stormwater Screening Sites in SMB JG7 WMP Group Area
Station ID Type of Outlet Outlet Size
Major
Outfall?
SMBJ7-O-1 Corrugated metal pipe 84-inch diameter Yes
SMBJ7-O-2 Corrugated metal pipe 48-inch diameter Yes
SMBJ7-O-3(1)
Corrugated metal pipe 72-inch diameter Yes
SMBJ7-O-4 Corrugated metal pipe 36-48-inch diameter (approx.) Yes
SMBJ7-O-5(2) Reinforced concrete pipe (damaged in
landslide, replaced by plastic pipe) 36-inch diameter (approx.) Yes
SMBJ7-O-6 Reinforced concrete pipe (however, appears to
be reinforced concrete box at outfall) 66-inch diameter Yes
SMBJ7-O-7(3)
Corrugated metal pipe (broken) 18-inch diameter (approx.) No
SMBJ7-O-8 Corrugated metal pipe 18-inch diameter (approx.) No
SMBJ7-O-9 Corrugated metal pipe 21-inch diameter No
SMBJ7-O-10 Brick 24-inch diameter No
SMBJ7-O-11 Corrugated metal pipe 27-inch diameter No
SMBJ7-O-12 Vitrified clay pipe 16-inch diameter No
SMBJ7-O-13 Polyethylene lined 12-inch diameter No
1 Adjacent to SMB 7-06 2 Adjacent to SMB 7-07 3 Adjacent to SMB-7-08
In order to collect data to determine whether the outfalls contribute significant non-stormwater discharge,
the SMB JG7 WMP Group has already performed three non-stormwater outfall screenings on major
outfalls between April and August of 2014 to ensure the source investigation schedule (25 percent by
December 2015 and 100 percent by December 2017) was met. The SMB JG7 WMP Group has identified
E. coli and flow as the primary characteristic for determining significant non-stormwater discharges and
will monitor for E. coli and flow during the three initial screening. The initial screening serves the dual
purpose of data collection for completing the MS4 infrastructure database, addressed in Section 3, and the
initial evaluation of the outfall for significant non-stormwater discharge. Criteria for identifying
significant non-storm water discharges will be determined based on the screening results (e.g., which
outfalls, if any, are flowing, how the flows compare relative to one another, the laboratory results for E.
coli, etc.). A standard field data collection form will be used, including information fields for:
Channel bottom, calculated flow
Whether discharge ponds, or reaches the receiving water
Clarity
Presence of odors and foam

SMB JG7 Coordinated Integrated Monitoring Program – April 2015 Non-Stormwater Outfall Screening and Monitoring
Page 30
Additionally, outstanding information for the MS4 inventory database will be collected, including, at a
minimum, geographically referenced photographs. The inventory of MS4 outfalls will identify those with
significant non-storm water discharges and those that do not require further assessment, including the
rationale for such determination if no further action is required. The database will contain outfall locations
linked to storm drains, channels, and outfalls map, which will be updated annually to incorporate the most
recent data for outfalls with significant non-storm water discharge.
At least one re-assessment of the non-storm water outfall-based screening and monitoring program will be
conducted during the term of the Permit term to determine whether changes or updates are needed.
Seasonal variability will be considered in the timing of the re-assessment. If changes are needed, they will
be specified in written program documents, to be implemented after approval from the Los Angeles Board
Regional Board Executive Officer, and described in the next annual report.
5.4 PRIORITIZED SOURCE IDENTIFICATION
If any outfalls exhibiting significant NSW discharges are identified through the Outfall Screening process
and incorporated into the inventory, Part IX.E of the MRP requires that the Permittees prioritize the
outfalls for further source investigations.
The following prioritization criteria will be utilized initially and may be revised as priorities in the JG7
WMP area change:
1. Outfalls with the highest loading based on considerations related to E. coli.
2. Outfalls for which monitoring data exist and indicate recurring exceedances of one or more of
the NSW Action Levels identified in Attachment G of the Permit. Once the prioritization is
completed, a source identification schedule will be developed. The schedule will focus on the
outfalls with the highest E. coli loading rate first and ensure that source investigations are
completed on no less than 25% of the outfalls with significant NSW discharges by December 28,
2015 and 100% by December 28, 2017.
5.5 SIGNIFICANT NON-STORMWATER DISCHARGE SOURCE IDENTIFICATION
Based on the prioritized list of major outfalls with significant NSW discharges, investigations must be
conducted to identify the source(s) or potential source(s) of non-stormwater discharge.
Part IX.A.2 of the MRP requires Permittees to classify the source identification results into the following
types as summarized in Table 14:
A. IC/ID: If the source is determined to be an illicit discharge, then the Permittee must implement
procedures to eliminate the discharge consistent with IC/ID requirements (Permit Part VI.D.10)
and document actions.
B. Authorized or Conditionally-Exempt Non-Stormwater Discharges: If the source is
determined to be an NPDES permitted discharge, a discharge subject to the Comprehensive
Environmental Response, Compensation, and Liability Act (CERCLA), or a conditionally exempt
essential discharge, then the Permittee must document the source. For non-essential conditionally
exempt discharges, the Permittee must conduct monitoring consistent with Part IX.G of the MRP
to determine whether the discharge should remain conditionally exempt or be prohibited.
C. Natural Flows: If the source is determined to be natural flows, then the Permittee must document
the source.

SMB JG7 Coordinated Integrated Monitoring Program – April 2015 Non-Stormwater Outfall Screening and Monitoring
Page 31
D. Unknown Sources: If the source is unknown, then the Permittee must conduct monitoring
consistent with Part IX.G of the MRP.
E. Originates Upstream of SMB JG7 WMP Group: If the source is determined to originate from
an upstream WMA, then the Permittee must inform the upstream WMA and Regional Board in
writing within 30 days of identifying the presence of the discharge, provide all available
characterization data and determination efforts, and document actions taken to identify its source.
Table 14
Source Identification Types
Type Follow-up Action Required by Permit
A. Illicit Discharge or
Connection
Refer to IC/ID program Implement control measures and report in
annual report. Monitor if cannot be eliminated.
B. Authorized or Conditionally
Exempt Discharges1
Document and identify if
essential or non-essential
Monitor non-essential discharges
C. Natural Flows End investigation Document and report in annual report
D. Unknown Refer to IC/ID program Monitor
E. Upstream of SMB JG7
WMP Group
End investigation Inform upstream WMA and the Regional
Board in writing within 30 days of identifying
discharge.
1 Discharges authorized by a separate NPDES permit, a discharge subject to a Record of Decision approved by USEPA
pursuant to section 121 of CERCLA, or is a conditionally exempt NSW discharge addressed by other requirements.
Conditionally exempt NSW discharge addressed by other requirements are described in detail in Part III.A. Prohibitions –
NSW Discharges of the Permit.
Source identification will be conducted using site-specific procedures based on the characteristics of the
non-stormwater discharge. Investigations could include:
Performing field measurements to characterize the discharge;
Following dry-weather flows from the location where they are first observed in an upstream
direction along the conveyance system; and
Compiling and reviewing available resources, including past monitoring and investigation data,
land use/MS4 maps, aerial photography, and property ownership information.
Where the source identification has determined the non-stormwater source to be authorized, natural, or
essential conditionally-exempt flows, and it has been determined that the source is not causing or
contributing to exceedances in the receiving water, then the outfall will require no further assessment.
However, if the source identification determines that the source of the discharge is non-essential
conditionally exempt, an ID, or is unknown, then further investigation will be conducted to eliminate the
discharge or to demonstrate that it is not causing or contributing to receiving water impairments and will
be added to the monitoring list until non-stormwater discharge is eliminated.
In some cases, source investigations may ultimately lead to prioritized programmatic or structural BMPs.
Where the SMB JG7 WMP Group has determined that they will address the non-stormwater discharge
through modifications to programs or by structural BMP implementation, the SMB JG7 WMP Group will
incorporate the approach into the implementation schedule developed in the EWMP, and monitoring of
the outfall may be discontinued.

SMB JG7 Coordinated Integrated Monitoring Program – April 2015 Non-Stormwater Outfall Screening and Monitoring
Page 32
5.6 NON-STORMWATER DISCHARGE MONITORING
As outlined in the MRP (Part II.E.3), outfalls with significant non-stormwater discharges that remain
unaddressed after source investigation shall be monitored to meet the following objectives:
a. Determine whether a Permittee’s discharge is in compliance with applicable dry-weather
WQBELs derived from TMDL WLAs;
b. Determine whether the quality of a Permittee’s discharge exceeds non-stormwater action levels,
as described in Attachment G of the Permit; and
c. Determine whether a Permittee’s discharge causes or contributes to an exceedance of receiving
water limitations.
Thus, if any outfalls have been determined to convey significant non-stormwater discharges where the
source identification concluded that the source is attributable to a continued ID (Type A from Table 14)
non-essential conditionally exempt (Type B from Table 14), or unknown (Type D from Table 14) the site
must be monitored. Monitoring will begin within 90 days of completing the source identification and will
be coordinated with dry weather receiving water sampling efforts.
5.6.1 Monitoring Frequency, Parameters, and Duration
After the outfall screening and determination of the outfall(s) that have significant non-stormwater flows,
those site(s) will be monitored. While a monitoring frequency of four times per year is specified in the
Permit, it is inconsistent with the dry weather receiving water monitoring requirements. The receiving
water monitoring requires two dry weather monitoring events per year. As a result, the SMB JG7 WMP
Group will conduct required NSW outfall monitoring twice per year. Alternatively, if monitoring twice
per year is not permitted, then bacteria related sampling can be conducted during dry weather four times
per year and all other constituents twice per year. The NSW outfall monitoring events will be coordinated
with the dry weather receiving water monitoring events, which would then be triggered, to allow for an
evaluation of whether the NSW discharges are causing or contributing to an observed exceedance of
water quality objectives in the receiving water. At the SMB JG7 WMP beaches, fecal indicator bacteria
are highest priority during dry weather and are considered a primary metric for determining significant
NSW discharges. As noted on page 5 of Attachment E of the MS4 Permit, grab samples will be taken for
constituents that are required to be collected as such, including fecal indicator bacteria. Because dry
weather receiving water monitoring and sampling occurs as grab samples, the NSW outfall samples will
also be collected as grab samples.
If the outfall(s) are found to be significant non-stormwater outfall(s), they will be monitored for all
required constituents as outlined in Part IX.G.1.a-e of the MRP, except toxicity. Toxicity monitoring is
only required when triggered by recent receiving water toxicity monitoring where a TIE on the observed
receiving water toxicity test identified pollutants during dry weather, or where the TIE results were
inconclusive. If the discharge exhibits aquatic toxicity, then a TIE shall be conducted. An overview of
the constituents to be monitored and the corresponding frequency is listed in Table 15. The outfall(s)
will be monitored for at least the duration of the Permit term, or until the non-stormwater discharge is
eliminated. Additional analytical and monitoring procedures are discussed in Attachments B-D.

SMB JG7 Coordinated Integrated Monitoring Program – April 2015 Non-Stormwater Outfall Screening and Monitoring
Page 33
Table 15
Non-stormwater Outfall Monitoring Parameters and Annual Frequency (Year 1)
Constituent Annual
Frequency
Flow, hardness, pH, dissolved oxygen, temperature, specific conductivity, and TSS 2
Table E-2 pollutants detected above relevant objectives 2
Aquatic Toxicity and Toxicity Identification Evaluation (TIE)1 TBD
Total Coliform 2 2
E. Coli (Fecal Coliform)2 2
Enterococcus2 2
1 Toxicity is only monitored from outfalls when triggered by recent receiving water toxicity monitoring where a TIE on the
observed receiving water toxicity test identified pollutants or the results of the TIE were inconclusive. If toxicity is
observed at the outfall a TIE must be conducted. 2 If monitoring twice per year for all constituents is not permitted, then bacteria related sampling can be conducted during
dry weather four times per year and all other constituents twice per year.
5.7 NON-STORMWATER OUTFALL PROGRAM SUMMARY
The SMB JG7 WMP Group will conduct the following steps as part of the non-stormwater outfall
program at all major outfalls in the SMB JG7 WMP Group area:
1. Perform the outfall screening and determine whether any major outfall has significant non-
stormwater discharge (Part IX.C of the MRP);
2. Identify sources of significant non-stormwater discharges (Part IX.F of the MRP); and, if relevant
3. Continue to monitor NSW discharges which exceed the criteria (Part IX.G of the MRP).
As non-stormwater discharges are addressed, monitoring at the outfall(s) will cease. Additionally, if
monitoring demonstrates that discharges do not exceed any WQBELs, action levels or water quality
standards for pollutants identified on the 303(d) list, then modifications to the monitoring program,
specifically the elimination of parameters/constituents may be proposed and will be subject to approval by
the Executive Officer of the Regional Board.

Page 34
Section 6 New Development/Re-Development
Effectiveness Tracking Program The New Development/Re-Development Effectiveness Tracking Program is used for tracking information
data in regards to new and re-development activities. To meet the MRP requirements of Permit
Attachment E, Part X.A, the SMB JG7 WMP Group will maintain an informational database record for
each new development/re-development project subject to the MCM requirements in Part VI.D.7 of the
Permit and their adopted LID Ordinance. The database should track the following information:
1. Name of the Project and Developer;
2. Mapped project location (preferably linked to the Geographic Information System (GIS) storm
drain map);
3. Issuance date of the project Certificate of Occupancy;
4. 85th percentile 24-hour storm event for project design (inches);
5. 95th percentile 24-hour storm event for projects draining to natural water bodies (inches);
6. Other design criteria required to meet hydromodification requirements for drainages to natural
water bodies;
7. Project design storm (inches per 24 hours);
8. Project design storm volume (gallons or million gallons);
9. Percent of design storm volume to be retained onsite;
10. Design volume for water quality mitigation treatment BMPs (if any);
11. If flow through, water quality treatment BMPs are approved, provide the one-year, one-hour
storm intensity as depicted on the most recently issued isohyetal map published by the Los
Angeles County Hydrologist;
12. Percent of design storm volume to be infiltrated at an off-site mitigation or groundwater
replenishment project site;
13. Percent of design storm volume to be retained or treated with biofiltration at an off-site retrofit
project;
14. Location and maps (preferably linked to the GIS storm drain map) of off-site mitigation,
groundwater replenishment, or retrofit sites; and
15. Documentation of issuance of requirements to the developer.
Until the WMP is approved by the Regional Board or the Executive Officer, the SMB JG7 WMP Group
is only required to implement and track MCM information in its existing stormwater management
program per Part V.C.4.d.i.
In addition to the requirements in Part X.A of the MRP, Part VI.D.7.d.iv of the Permit requires that the
SMB JG7 WMP Group implement a tracking system for new development/re-development projects that
have been conditioned for post-construction BMPs. The following information is to be tracked using GIS
or another electronic system:
1. Municipal Project ID
2. State Waste Discharge Identification (WDID) Number
3. Project Acreage
4. BMP Type and Description
5. BMP Location (coordinates)
6. Date of Acceptance

SMB JG7 Coordinated Integrated Monitoring Program – April 2015 t/Re-Development Program
Page 35
7. Date of Maintenance Agreement
8. Maintenance Records
9. Inspection Date and Summary
10. Corrective Action
11. Date Certificate of Occupancy Issued
12. Replacement or Repair Date
6.1 PROGRAM OBJECTIVES
The objective of the New Development/Re-Development Effectiveness Tracking is to assess whether
post-construction BMPs, as outlined in permits issued by the Permittees, are implemented, and to ensure
the volume of stormwater associated with the design storm is retained onsite, as required by Part
VI.D.7.c.i. of the Permit. The New Development/Re-Development Effectiveness Tracking will gather
necessary data to assess whether construction MCM, LID ordinances and BMPs are effective and being
implemented.
6.2 EXISTING NEW DEVELOPMENT/RE-DEVELOPMENT TRACKING PROCEDURES
The City of Los Angeles has an established process of tracking some or the entire 27 required
development program tracking elements (15 elements identified in Attachment E.X.A and 12 elements in
Part VI.D.7.d.iv.).
6.3 SPECIAL CONSIDERATIONS FOR DATA MANAGEMENT AND REPORTING
A fundamental step in establishing individual data management protocols consists of developing a
recommended standard operating procedure (SOP) and determining the responsible person within each
City department for collecting, reviewing, and reporting the data. The SOP developed by the City of Los
Angeles will consist of written instructions regarding documentation of routine activities and delineation
of the primary steps in the land development approval process, relevant data generated at each step, and
procedures for “handoff” of the project to the next group. Development and use of an SOP is an integral
part of successful data management as it provides information to perform a task properly, and facilitates
consistency in the quality and integrity of the tracking data.
6.3.1 Data Management
The City will conduct tracking to meet Permit requirements and facilitate reporting. The data
management protocols will include:
Designing and testing data entry sheets for the required information fields identified in Section
6.1;
Describing the procedures and identifying the persons responsible for inputting data, assessing
accuracy and consistency, and coordinating follow up actions when questions arise;
Strategy for checking and validating data entry, including identifying persons responsible for
managing and safeguarding data, performing data entry, supervising the data entry, and ensuring
quality control of the data; and
Specifying procedures for routinely and safely archiving data files.
Data collection for development review processes generally consist of the following similar steps:

SMB JG7 Coordinated Integrated Monitoring Program – April 2015 t/Re-Development Program
Page 36
Planning: Project proponents submit an application to agency planning department to determine
whether or not the project meets jurisdictional requirements. When required, the project may
require a public hearing for conditions and entitlements. Project conditions may include water
quality related requirements.
Building: Projects may be conditioned subject to engineering, community services, or building
department review and approval of plans or technical reports. During review, required water
quality BMP designs are reviewed and accepted. When a building and/or grading permit is
issued, project construction usually proceeds without further discretionary approvals.
Construction: During construction, approved BMPs are implemented and then verified by the
jurisdiction’s inspector prior to issuance of a Certificate of Occupancy.
Post-Construction Inspections: Once constructed, inspection and verification of maintenance is
transferred to the jurisdiction’s water quality program manager.
Relevant project data is collected during each phase of the development review process described above.
Based on this general process and information gathered through the questionnaire, Table 16 illustrates
data collection opportunities throughout the planning, building, construction, and post-construction
inspection processes for requirements in Part VI.D.7 of the Permit.
Table 16
Development Review Process and Data Collection
Stage Process Data Collection Opportunity
Planning Planning review, conditions, and
entitlements
Project name
Developer name
Location/Map
Documentation of issuance of requirements
Building Engineering review and approval
of plans and technical reports
85th
and 95th
percentile storm event criteria
Other hydromodification management requirements
Project design storm intensity and volume
Percent of design storm volume retained onsite
Design volume for treatment BMPs
One year/one hour storm intensity
Percent of design storm infiltrated offsite
Percent of design storm retained/treated with biofiltration
offsite
Location/Maps of offsite mitigation
Construction
Approval of BMP construction
and issuance of Certificate of
Occupancy
Issuance date of Certificate of Occupancy
Post-
Construction
Inspections
Inspection and tracking of post-
construction BMPs Inspection and maintenance dates
6.3.2 Additional Data
To facilitate annual assessment and reporting and future Reasonable Assurance Analyses (RAA) input
data compilation, the SMB JG7 WMP Group may also track the following questions and/or information:
Do any modified MCMs apply to this project?
SMB JG7 Coordinated Integrated Monitoring Program – April 2015 t/Re-Development Program
Page 37
Assessor’s Identification Number (AIN)
Street address
Revised land use (based on City/County Land Use Categories)
BMP maintenance funding source
Tributary area to each BMP
6.3.3 Reporting
Development of a data collection template and established SOPs will aid in future analyses and annual
reporting. The example data collection template, presented in Table 17, includes the information to be
tracked for each project.

SMB JG7 Coordinated Integrated Monitoring Program – April 2015 t/Re-Development Program
Page 38
Table 17
Example Data Collection Template

SMB JG7 Coordinated Integrated Monitoring Program – April 2015 t/Re-Development Program
Page 39
Annual Assessment and Reporting requirements to be included in an Annual Report are outlined in Part
XVIII.A.1 through A.7 of the MRP. With regard to New Development/Re-Development Effectiveness
Tracking, the SMB JG7 WMP Group is required to annually track, analyze, and report on the following
stormwater control measures in Part XVIII.A.1:
Estimate the cumulative change in percent effective impervious area (EIA) since the effective
date of the Permit and, if possible, the estimated change in the stormwater runoff volume during
the 85th percentile storm event.
Summarize new development/re-development projects constructed within the Permittee’s
jurisdictional area during the reporting year.
Summarize retrofit projects that reduced or disconnected impervious area from the MS4 during
the reporting year.
Summarize other projects designed to intercept stormwater runoff prior to discharge to the MS4
during the reporting year.
For the projects summarized above, estimate the total runoff volume retained onsite by the
implemented projects.
Summarize actions taken in compliance with TMDL implementation plans or approved
Watershed Management Programs to implement TMDL provisions in Part VI.E and Attachments
L-R of the Permit.
Summarize riparian buffer/wetland restoration projects completed during the reporting year. For
riparian buffers include width, length and vegetation type; for wetland include acres restored,
enhanced, or created.
Summarize other MCMs implemented during the reporting year, as deemed relevant.
Provide status of all multi-year efforts that were not completed in the current year and will
therefore continue into the subsequent year(s). Additionally, if any of the requested information
cannot be obtained, then the Permittee shall provide a discussion of the factor(s) limiting its
acquisition and steps that will be taken to improve future data collection efforts.
Group members are also required to track, evaluate, and provide an effectiveness assessment of
stormwater control measures per Attachment E, Part XVIII.A.2:
Summarize rainfall for the reporting year. Summarize the number of storm events, highest
volume event (inches/24 hours), highest number of consecutive days with measureable rainfall,
total rainfall during the reporting year compared to average annual rainfall for the subwatershed.
Precipitation data may be obtained from the LACDPW rain gauge stations available at
http://www.ladpw.org/wrd/precip/.
Provide a summary table describing rainfall during stormwater outfall and wet-weather receiving
water monitoring events. The summary description shall include the date, time that the storm
commenced and the storm duration in hours, the highest 15-minute recorded storm intensity
(converted to inches/hour), the total storm volume (inches), and the time between the storm event
sampled and the end of the previous storm event.
Where control measures were designed to reduce impervious cover or stormwater peak flow and
flow duration, provide hydrographs or flow data of pre- and post-control activity for the 85th
percentile, 24-hour rain event, if available.
For natural drainage systems, develop a reference watershed flow duration curve and compare it
to a flow duration curve for the subwatershed under current conditions.
Provide an assessment as to whether the quality of stormwater discharges as measured at
designed outfalls is improving, staying the same, or declining. The Permittee may compare water
quality data from the reporting year to previous years with similar rainfall patterns, conduct

SMB JG7 Coordinated Integrated Monitoring Program – April 2015 t/Re-Development Program
Page 40
trends analysis, or use other means to develop and support its conclusions (e.g., use of non-
stormwater action levels or municipal action levels as provided in Attachment G of the Permit).
Provide an assessment as to whether wet-weather receiving water quality within the jurisdiction
of the Permittee is improving, staying the same, or declining when normalized for variations in
rainfall patterns. The Permittee may compare water quality data from the reporting year to
previous years with similar rainfall patterns, conduct trends analysis, draw from regional
bioassessment studies, or use other means to develop and support its conclusions.
Provide status of all multi-year efforts, including TMDL implementation, that were not completed
in the current year and will continue into the subsequent year(s). Additionally, if any of the
requested information cannot be obtained, then the Permittee shall provide a discussion of the
factor(s) limiting its acquisition and steps that will be taken to improve future data collection
efforts.
Additional reporting elements required are identified in Part VI.D.7 of the Permit and include:
A summary of total offsite project funds raised to date and a description (including location,
general design concept, volume of water expected to be retained, and total estimated budget) of
all pending public offsite projects.
A list of mitigation project descriptions and estimated pollutant and flow reduction analyses.
A comparison of the expected aggregate results of alternative compliance projects to the results
that would otherwise have been achieved by retaining onsite the stormwater quality design
volume.
Part XV.A of the MRP requires each Permittee or group to submit an Annual Report to the Regional
Board by December 15th of each year. The annual reporting period is from July 1
st through June 30
th, and
information reported will cover approved and constructed projects that have been issued occupancy.
6.4 SUMMARY OF NEW DEVELOPMENT/RE-DEVELOPMENT EFFECTIVENESS TRACKING
New Development/Re-Development Effectiveness Tracking is used for tracking information data in
regards to new and re-development activities and their associated post-construction BMPs. The
information is stored and will be submitted in an annual compliance report.
The City has developed mechanisms for tracking new development/re-development projects that have
been conditioned for post-construction BMPs pursuant to MS4 Permit Part VI.D.7 The City has also
developed mechanisms for tracking the effectiveness of these BMPs pursuant to MS4 Permit Attachment
E.X.
Page 41
Section 7 Regional Studies
As stated earlier, the MRP identifies one regional study: the SMC Regional Watershed Monitoring
Program. The goal of the program is to conduct ongoing, large-scale regional monitoring on coastal
streams and rivers. However, since there are no streams or rivers in the SMB JG7 WMP Group area, there
are no SMC monitoring sites located in the WMP Group area.
Regardless, the City of Los Angeles and the LACFCD will continue to participate in the Regional
Watershed Monitoring Program (Biosassessment Program) being managed by the Southern California
Stormwater Monitoring Coalition (SMC). Initiated in 2008, the SMC’s Regional Bioassement Program is
designed to run over a five-year cycle. Monitoring under the first cycle concluded in 2013, with reporting
of findings and additional special studies planned to occur in 2014. The SMC, including the SMB JG7
WMP Group agencies, is currently working on designing the bioassessment monitoring program for the
next five-year cycle, which is scheduled to run from 2015 to 2019.
SCCWRP’s Bight Regional Monitoring program is also expected to continue. Among other focuses, this
program assesses the health of the Southern California Bight with respect to offshore water quality.

Page 42
Section 8 Special Studies
The MRP requires each Permittee to be responsible for conducting special studies required in an effective
TMDL or an approved TMDL Monitoring Plan. The effective TMDLs, revised TMDLs, and approved
monitoring plans relevant to the SMB JG7 WMP Group do not require the completion of special studies.
However, the SMB DDT and PCB TMDL has identified optional special studies as follows:
Refine the relationship between sediment and concentrations of pollutants and fish tissue
contamination;
Determine total mass of DDT and PCBs in Santa Monica Bay subsurface sediments through
sediment coring profiles;
Identify flux rate of pollutants from the sediments to the water column; and
Evaluate sediments embedded in storm drains to better estimate potential loadings of DDT and
PCBs to Santa Monica Bay and identify potential sources.
At this time, the SMB JG7 WMP Group will not participate in any special studies. At a future date, if
implementation of a special study is desirable, then a separate work plan that coordinates with the CIMP
will be developed.
Page 43
Section 9 Non-Direct Measurements
Existing monitoring programs that collect water quality data in the watershed, as identified in Section 2.1,
will be incorporated into the CIMP database to the extent practicable. Gathering and compiling
information from outside the CIMP programs will be dictated by the cost. Water quality data reported by
these monitoring programs will be evaluated for suitability for inclusion in the CIMP database. If the
water quality data is deemed to be suitable, then it will be included in the database.

Page 44
Section 10 Adaptive Management
An adaptive management approach provides a structured process that allows for taking action under
uncertain conditions based on the best available science, closely monitoring and evaluating outcomes, and
re-evaluating and adjusting decisions as more information is obtained.
The WMP and CIMP are to be implemented using the adaptive process. As new program elements are
implemented and data gathered over time, the WMP and CIMP will undergo revision to reflect the most
current understanding of the watershed and present a sound approach to addressing changing conditions.
As such, the WMP and CIMP will employ an adaptive management process that will allow the two
programs to evolve over time.
10.1 INTEGRATED MONITORING AND ASSESSMENT PROGRAM
Part XVIII.A of the MRP details the annual assessment and reporting that is required as part of the annual
report. The annual assessment and reporting is composed of seven parts:
1. Stormwater Control Measures
2. Effectiveness Assessment of Stormwater Control Measures
3. Non-stormwater Control Measures
4. Effectiveness Assessment of Non-stormwater Control Measures
5. Integrated Monitoring Compliance Report
6. Adaptive Management Strategies
7. Supporting Data and Information
Based on the findings of the annual assessment, revisions to the CIMP will be included as part of the
Integrated Monitoring Compliance Report (IMCR), which is further outlined in Section 11.2, and
submitted as part of the annual report.
10.2 CIMP REVISION PROCESS
Implementation of the CIMP will be used to gather data on receiving water conditions and
stormwater/non-stormwater quality to assess water quality and the effectiveness of the WMP. As part of
the adaptive management process, re-evaluation of the CIMP will need to be conducted to better inform
the SMB JG7 WMP Group of ever-changing conditions of the watershed. Each program of the CIMP
will be re-evaluated every two years, in line with the WMP’s adaptive management process, for the
following:
Monitoring Site Locations: As water quality priorities change and certain WBPCs are being
address or identified, monitoring site locations will either need to be added or changed.
Monitoring Constituents: Eliminate or reduce monitoring of certain constituents if constituents
were not initially detected during initiation of the CIMP and are not being addressed by a
watershed control measure.
Monitoring Frequency: Increase or decrease monitoring frequency based on the evaluation of
RWL, WQBELs, and non-stormwater action levels.
Modifications to the monitoring program, specifically the elimination of parameters/constituents, may be
proposed and will be subject to approval by the Executive Officer of the Regional Board. For all other

SMB JG7 Coordinated Integrated Monitoring Program – April 2015 Adaptive Management
Page 45
modifications or adjustments (which by their nature need immediate action), Regional Board approval
may not be necessary. Examples of this type of modifications include changing testing laboratories,
moving sampling locations due to lack or absence of flow, etc. Is is assumed that the use of a scanned
letter sent by email to the Regional Board will suffice as notification in these instances.

Page 46
Section 11 Reporting
Analysis and reporting of data is an integral part of verifying whether the CIMP is meeting MRP
objectives. The MRP, establishes NPDES permit monitoring, reporting, and recordkeeping requirements,
including those for large MS4s, based on federal Clean Water Act (CWA) section 308(a) and Code of
Federal Regulations (40 CFR) sections 122.26(d)(2)(i)(F), (iii)(D), 122.41(h)-(l), 122.42(c), and 122.48.
In addition, California Water Code (CWC) section 13383 authorizes the Regional Board to establish
monitoring, inspection, entry, reporting, and recordkeeping requirements. The following sections outline
the CIMP reporting process for the SMB JG7 WMP Group.
11.1 DOCUMENTS AND RECORDS
Consistent with the Part XIV.A of the MRP requirements, the SMB JG7 WMP Group will retain records
of all monitoring information for a period of at least 3 years from the date of the sample, measurement,
report, or application, including:
Calibration data;
Major maintenance records;
Original lab and field data sheets;
Original strip chart recordings for continuous monitoring instrumentations;
Copies of reports required by the permit; and
Records of data used to complete the application for the permit.
Records of monitoring will include:
Date, time of sampling or measurements, exact place, weather conditions, and rainfall amount;
Individual(s) who performed the sampling or measurements;
Date(s) analyses were performed;
Individual(s) who performed the analyses;
Analytical techniques or methods used;
Results of such analyses; and
Data sheets showing toxicity test results.
11.1.1 .Semi-Annual Data Submittal
Monitoring results data will be submitted semi-annually, as stated in Part XIV.L of the MRP. The
transmitted data will be in the most recent update of the Southern California Municipal Storm Water
Monitoring Coalition's (SMC) Standardized Data Transfer Formats (SDTFs) and sent electronically to the
Regional Board Stormwater site to [email protected]. The SMC SDTFs can be
found at the SCCWRP web page http://www.sccwrp.org/data/DataSubmission.aspx. The submitted
monitoring data will highlight exceedances of applicable WQBELs, receiving water limitations, action
levels, and/or aquatic toxicity thresholds for all test results, with corresponding sampling dates per
receiving water monitoring station.

SMB JG7 Coordinated Integrated Monitoring Program – April 2015 Reporting
Page 47
11.1.2 Annual Monitoring Reports
Part XVIII.A.5, of the MRP presents the requirements of the IMCR that will be included and submitted
on an annual basis as part of the Annual Report. As discussed in Section 10, the IMCR is one of seven
parts of the Annual Assessment and Reporting.
The IMCR will include the following information as required by the MRP:
Summary of exceedances against all applicable RWLs, WQBELs, non-stormwater action levels,
and aquatic toxicity thresholds for:
o Receiving water monitoring – Wet- and dry-weather
o Stormwater outfall monitoring
o Non-stormwater outfall monitoring
Summary of actions taken:
o To address exceedances for WQBELs, non-stormwater action levels, or aquatic toxicity
for stormwater and non-stormwater outfall monitoring
o To determine whether MS4 discharges contributed to RWL exceedances and efforts
taken to control the discharge causing the exceedances to the receiving water
If aquatic toxicity was confirmed and a TIE was conducted, then identify the toxic chemicals
determined by the TIE, and include all relevant data to allow the Regional Board to review the
adequacy and findings of the TIE.
The IMCR will be submitted, as part of the Annual Assessment Report section of the Annual Report, to
the Regional Board by December 15th of each year covering the preceding reporting year from July 1
through June 30th, for at least the duration of the Permit term.
11.1.3 Signatory and Certification Requirements
Part V.B of Attachment D of the Permit presents the Signatory and Certification Requirements and states:
1. All applications, reports, or information submitted to the Regional Water Board, State Water
Board, and/or US Environmental Protection Agency (USEPA) shall be signed and certified in
accordance with Standard Provisions – Reporting V.B.2, V.B.3, V.B.4, and V.B.5 below [40 CFR
section 122.41(k)(1)].
2. All applications submitted to the Regional Water Board shall be signed by either a principal
executive officer or ranking elected official. For purposes of this section, a principal executive
officer includes: (i) the chief executive officer of the agency (e.g., Mayor), or (ii) a senior
executive officer having responsibility for the overall operations of a principal geographic unit of
the agency (e.g., City Manager, Director of Public Works, City Engineer, etc.).[40 CFR section
122.22(a)(3)].
3. All reports required by this Order and other information requested by the Regional Water Board,
State Water Board, or USEPA shall be signed by a person described in Standard Provisions –
Reporting V.B.2 above, or by a duly authorized representative of that person. A person is a duly
authorized representative only if:
a. The authorization is made in writing by a person described in Standard Provisions –
Reporting V.B.2 above [40 CFR section 122.22(b)(1)];
b. The authorization specifies either an individual or a position having responsibility for the
overall operation of the regulated facility or activity such as the position of plant
manager, operator of a well or a well field, superintendent, position of equivalent
responsibility, or an individual or position having overall responsibility for environmental
matters for the company. (A duly authorized representative may thus be either a named

SMB JG7 Coordinated Integrated Monitoring Program – April 2015 Reporting
Page 48
individual or any individual occupying a named position.) [40 CFR section 122.22(b)(2)];
and
c. The written authorization is submitted to the Regional Water Board [40 CFR section
122.22(b)(3)].
4. If an authorization under Standard Provisions – Reporting V.B.3 above is no longer accurate
because a different individual or position has responsibility for the overall operation of the
facility, a new authorization satisfying the requirements of Standard Provisions – Reporting
V.B.3 above must be submitted to the Regional Water Board prior to or together with any reports,
information, or applications, to be signed by an authorized representative [40 CFR section
122.22(c)].
5. Any person signing a document under Standard Provisions – Reporting V.B.2 or V.B.3 above
shall make the following certification: “I certify under penalty of law that this document and all
attachments were prepared under my direction or supervision in accordance with a system
designed to assure that qualified personnel properly gather and evaluate the information
submitted. Based on my inquiry of the person or persons who manage the system or those
persons directly responsible for gathering the information, the information submitted is, to the
best of my knowledge and belief, true, accurate, and complete. I am aware that there are
significant penalties for submitting false information, including the possibility of fine and
imprisonment for knowing violations.” [40 CFR section 122.22(d)].
All required signatures and statements will be included as an attachment of the Annual Report, which will
be submitted to the Regional Board by December 15th of each year, for at least the duration of the Permit
term.

Page 49
Section 12 Schedule for CIMP Implementation
As stated in Part IV.C.6 of the MRP, the SMB JG7 WMP Group’s CIMP will initiate 90 days
after approval by the Executive Officer of the Regional Board. CIMP monitoring will be
implemented in a phased-in approach to allow sufficient time for permitting and installation of
equipment for all monitoring sites. Established TMDL monitoring programs, specifically the
SMBBB TMDL 2004 approved CSMP, will continue without modification.

Page 50
Section 13 References
California Department of Fish and Wildlife. Ecosystem Restoration Program, Adaptive Management
https://www.dfg.ca.gov/erp/adaptive_management.asp. April 2014.
California Regional Water Quality Control Board, Los Angeles Region, Order No. R4-2012-0175 NPDES
Permit No. CAS004001, Waste Discharge Requirements for Municipal Separate Storm Sewer
System (MS4) Discharges within the Coastal Watersheds of Los Angeles County, Except Those
Discharges Originating From The City of Long Beach MS4. November 2012.
California Regional Water Quality Control Board, Los Angeles Region, Santa Monica Bay Nearshore
and Offshore Debris TMDL, October 2010.
City of Los Angeles, Environmental Monitoring Division, Santa Monica Bay Shoreline Monitoring
Municipal Separate Storm Sewer System (MS4) Report (June 1, 2011 – May 30, 2012), 2012.
Cowgill, U.M. and D.P. Milazzo. 1990. The sensitivity of two cladocerans to water quality variables,
salinity and hardness. Arch. Hydrobiol. 120:185–196.
Kayhanian, M., C. Stransky, S. Bay, S. Lau, M.K. Stenstrom. 2008. Toxicity of urban highway runoff
with respect to sorm duration. Science of the Total Environment 389:109-128
Lee, G. F. and A. Jones-Lee. “Review of the City of Stockton Urban Stormwater Runoff Aquatic Life
Toxicity Studies Conducted by the CVRWQCB, DeltaKeeper and the University of California,
Davis, Aquatic Toxicology Laboratory between 1994 and 2000,” Report to the Central Valley
Regional Water Quality Control Board, G. Fred Lee & Associates, El Macero, CA, October
(2001).
Los Angeles RWQCB, Attachment A to Resolution No. 2002-022 Final – 12/12/02 1 Amendment to the
Water Quality Control Plan – Los Angeles Region to incorporate Implementation Provisions for
the Region’s Bacteria Objectives and to incorporate the Santa Monica Bay Beaches Wet-Weather
Bacteria TMDL, 2002.
Los Angeles RWQCB, Draft Santa Monica Bay Beaches Bacteria TMDL, Revised Staff Report (Dry
Weather Only).
http://www.waterboards.ca.gov/losangeles/board_decisions/basin_plan_amendments/technical_d
ocuments/2002-004/02_0114_tmdl%20Dry%20Weather%20Only_web.pdf, January 2002.
Los Angeles RWQCB, Proposed Amendments to the Water Quality Control Plan – Los Angeles Region
to incorporate the Santa Monica Bay Beaches Bacteria TMDL. Attachment A to Resolution No.
02-004. http://63.199.216.6/larwqcb_new/bpa/docs/2002-004/2002-004_RB_BPA.pdf, 2002b.
Los Angeles RWQCB, Water Quality in the Santa Monica Bay Watershed Under the Surface Water
Ambient Monitoring Program Fiscal Year 2001-2002, 2005.
Los Angeles RWQCB, Proposed Amendments to the Water Quality Control Plan – Los Angeles Region
for the Santa Monica Bay Nearshore and Offshore Debris TMDL. Attachment A to Resolution

SMB JG7 Coordinated Integrated Monitoring Program – April 2015 References
Page 51
No. R10-010. Adopted November 4, 2010. http://63.199.216.6/larwqcb_new/bpa/docs/R10-
010/R10-010_RB_BPA.pdf, November 2010.
Los Angeles RWQCB, Water Quality Control Plan, Los Angeles Region.
http://www.waterboards.ca.gov/rwqcb4/ water_issues/programs/basin_plan/index.shtml, 1995,
updated 2011.
Palumbo, A., Fojut, T., TenBrook, P. and Tjerdeema, R. 2010a. Water Quality Criteria Report for
Diazinon. Prepared for the Central Valley Regional Water Quality Control Board by the
Department of Environmental Toxicology, University of California, Davis. March.
Palumbo, A., Fojut, T., Brander, S., and Tjerdeema, R. 2010b. Water Quality Criteria Report for
Bifenthrin. Prepared for the Central Valley Regional Water Quality Control Board by the
Department of Environmental Toxicology, University of California, Davis. March.
Southern California Coastal Water Research Project, Bight’13 Contaminant Impact Assessment Field
Operations Manual - Appendix A, 2013
http://www.sccwrp.org/Documents/BightDocuments/Bight13Documents/Bight13PlanningDocum
ents.aspx.
Technical Steering Committee of the City of Los Angeles and County of Los Angeles, Co-Chairs, Santa
Monica Bay Beaches Bacterial TMDLs Coordinated Shoreline Monitoring Plan, 2004
United States Environmental Protection Agency (USEPA). 1991. Methods for Aquatic Toxicity
Identification Evaluations: Phase I. Toxicity Characterization Procedures. 2nd Edition. EPA-600-
6-91-003. National Effluent Toxicity Assessment Center, Duluth, MN.
United States Environmental Protection Agency (USEPA), 1992a. NPDES Storm Water
Sampling Guidance Document, EPA 833-B-92, 40 CFR 122.21 (g)(7)(ii).
United States Environmental Protection Agency (USEPA). 1992b. Toxicity Identification Evaluation:
Characterization of Chronically Toxic Effluents, Phase I. EPA/600/6-91/005F. May 1992.
National Effluent Toxicity Assessment Center, Duluth, MN.
United States Environmental Protection Agency (USEPA). 1993a. Methods for Aquatic Toxicity
Identification Evaluations- Phase II Toxicity Identification Procedures for Samples Exhibiting
Acute and Chronic Toxicity. EPA-600-R-92-080. National Effluent Toxicity Assessment Center,
Duluth, MN.
United States Environmental Protection Agency (USEPA). 1993b. Methods for Aquatic Toxicity
Identification Evaluations- Phase III Toxicity Confirmation Procedures for Samples Exhibiting
Acute and Chronic Toxicity. EPA-600-R-92-081. National Effluent Toxicity Assessment Center,
Duluth, MN.
United States Environmental Protection Agency (USEPA). 1995. Short-term Methods for Estimating the
Chronic Toxicity of Effluents and Receiving Waters to West Coast Marine and Estuarine
Organisms. EPA-600-R-95-136. August.
U.S. Environmental Protection Agency (USEPA). 1996. Marine toxicity identification evaluation (TIE):
Phase I guidance document. EPA/600/R-96/054. National Health and Environmental Effects
Research Laboratory. Narragansett, RI.

SMB JG7 Coordinated Integrated Monitoring Program – April 2015 References
Page 52
U.S. Environmental Protection Agency (USEPA). 1996a. Method 1669: Sampling Ambient Water for
Trace Metals at EPA Water Quality Criteria Levels. July 1996.
United States Environmental Protection Agency (USEPA). 2002a. Short-term Methods for Estimating the
Chronic Toxicity of Effluents and Receiving Waters to Freshwater Organisms. Fourth Edition.
October. EPA-821-R-02-013.
United States Environmental Protection Agency (USEPA). 2002b. Methods for Measuring the Acute
Toxicity of Effluent and Receiving Waters to Freshwater and Marine Organisms. Fifth Edition.
October. EPA-821-R-02-012.
United States Environmental Protection Agency (USEPA), Region 2, 2004, Guidance for the
Development of Quality Assurance Project Plans for Environmental Monitoring Projects. April
12, 2004
United States Environmental Protection Agency (USEPA). 2007. Sediment toxicity identification
evaluation (TIE) phases I, II, and III guidance document. EPA/600/R-07/080. U.S.
Environmental Protection Agency, Office of Research and Development, Atlantic Ecology
Division. Narragansett, RI.
United States Environmental Protection Agency (USEPA) 2009, New England, Quality Assurance
Project Plan Guidance for Environmental Projects Using Only Existing (Secondary) Data.
October 2009
United States Environmental Protection Agency (USEPA). 2010. National Pollutant Discharge
Elimination System Test of Significant Toxicity Technical Document. EPA/833-R-10-004, U.S.
Environmental Protection Agency, Office of Environmental Management, Washington, DC.
United States Environmental Protection Agency (USEPA), Region IX, 2013, Santa Monica Bay Total
Maximum Daily Loads for DDTs and PCBs. March 2013
Wheelock, C., Miller, J., Miller, M., Gee, S., Shan, G. and Hammock, B. 2004. Development of Toxicity
Identification Evaluation (TIE) procedures for pyrethroid detection using esterase activity.
Environmental Toxicology and Chemistry 23:2699-2708

Attachment A
LACFCD Background Information

Page A-2
In 1915, the Los Angeles County Flood Control Act was adopted by the California State
Legislature after a disastrous regional flood took a heavy toll on lives and property. The act
established the LACFCD and empowered it to manage flood risk and conserve stormwater for
groundwater recharge. In coordination with the United States Army Corps of Engineers the
LACFCD developed and constructed a comprehensive system that provides for the regulation
and control of flood waters through the use of reservoirs and flood channels. The system also
controls debris, protects existing vegetal covers, collects surface storm water from streets, and
replenishes groundwater with storm water and imported and recycled waters. The LACFCD
covers the 2,753 square-mile portion of Los Angeles County south of the east-west projection of
Avenue S, excluding Catalina Island. It is a special district governed by the County of Los
Angeles Board of Supervisors, and its functions are carried out by the Los Angeles County
Department of Public Works. The LACFCD service area is shown in Figure A-1.
By statute, the LACFCD has limited powers and purposes, which places constraints on the types
of projects and activities which the LACFCD may fund. Unlike cities and counties, the
LACFCD does not own or operate any municipal sanitary sewer systems, public streets, roads, or
highways. The LACFCD operates and maintains storm drains and other appurtenant drainage
infrastructure within its service area. The LACFCD has no planning, zoning, development
permitting, or other land use authority within its service area. The permittees that have such land
use authority are responsible under the Permit for inspecting and controlling pollutants from
industrial and commercial facilities, development projects, and development construction sites.
(Permit, Part II.E, p. 17.)
The MS4 Permit language clarifies the unique role of the LACFCD in storm water management
programs: “[g]iven the LACFCD’s limited land use authority, it is appropriate for the LACFCD
to have a separate and uniquely-tailored storm water management program. Accordingly, the
storm water management program minimum control measures imposed on the LACFCD in Part
VI.D of this Order differ in some ways from the minimum control measures imposed on other
Permittees. Namely, aside from its own properties and facilities, the LACFCD is not subject to
the Industrial/Commercial Facilities Program, the Planning and Land Development Program, and
the Development Construction Program. However, as a discharger of storm and non-storm water,
the LACFCD remains subject to the Public Information and Participation Program and the Illicit
Connections and Illicit Discharges Elimination Program. Further, as the owner and operator of
certain properties, facilities and infrastructure, the LACFCD remains subject to requirements of a
Public Agency Activities Program.”
(Permit, Part II.F, p. 18.)
Consistent with the role and responsibilities of the LACFCD under the Permit, the E]WMPs and
CIMPs reflect the opportunities that are available for the LACFCD to collaborate with permittees
having land use authority over the subject watershed area. In some instances, the opportunities
are minimal, however the LACFCD remains responsible for compliance with certain aspects of
the MS4 permit as discussed above.

Page A-3
Figure A-1 Los Angeles County Flood Control District Service Area
Page B-1
Attachment B
Analytical and Monitoring Procedures

Page B-2
Section 1 Analytical Procedures
The sections below discuss the analytical procedures for data generated in the field and in the laboratory.
1.1 Field Parameters
Field meters will be calibrated in accordance to Section 2.1.3. Portable field meters will measure field
parameters within specifications outlined in Table B-1.
Table B-1 Analytical Methods and Project Reporting Limits for Field Parameters
Parameter Method Range Project RL
Current velocity/flow Electromagnetic -0.5 to +20 ft/s 0.05 ft/s
pH Electrometric 0 – 14 pH units NA
Temperature High stability thermistor -5 – 50 oC NA
Dissolved oxygen Membrane or Optical 0 – 50 mg/L 0.5 mg/L
Turbidity Nephelometric 0 – 3000 NTU 0.2 NTU
Conductivity Graphite electrodes 0 – 10 mmhos/cm 2.5 umhos/cm
Salinity TBD TBD 1 ppt
RL – Reporting Limit NA – Not applicable
1.2 Analytical Methods and Method Detection and Reporting Limits
Method detection limits (MDL) and reporting limits (RLs) must be distinguished for proper
understanding and data use. The MDL is the minimum analyte concentration that can be measured and
reported with a 99% confidence that the concentration is greater than zero. The RL represents the
concentration of an analyte that can be routinely measured in the sampled matrix within stated limits and
with confidence in both identification and quantitation.
Under this monitoring program, RLs must be verifiable by having the lowest non-zero calibration
standard or calibration check sample concentration at or less than the RL. RLs have been established in
this CIMP based on the verifiable levels and general measurement capabilities demonstrated for each
method. These RLs should be considered as maximum allowable RLs to be used for laboratory data
reporting. Note that samples diluted for analysis may have sample-specific RLs that exceed these RLs.
This will be unavoidable on occasion. However, if samples are consistently diluted to overcome matrix
interferences, the analytical laboratory will be required to notify the SMB JG7 WMP Group regarding
how the sample preparation or test procedure in question will be modified to reduce matrix interferences
so that project RLs can be met consistently.
Analytical methods and RLs required for samples analyzed in the laboratory are summarized in
Table B-2 for analysis in water. For organic constituents, environmentally relevant detection limits will
be used to the extent practicable. The RLs listed in Table B-2 are consistent with the requirements of the
available minimum levels provided in the MRP, except for total dissolved solids, which was set equal to
the minimum level identified in the California State Water Resources Control Board’s Surface Water
Ambient Monitoring Program’s (SWAMP) Quality Assurance Project Plan. Alternative methods with

Page B-3
RLs that are at or below those presented in Table B-2 are considered equivalent and can be used in place
of the methods presented in Table B-2 .
Prior to the analysis of any environmental samples, the laboratory must have demonstrated the ability to
meet the minimum performance requirements for each analytical method presented in Table B-2.
Depending on the laboratory selected for analysis, analytical methods may change, retaining the required
minimum RL. The initial demonstration of capability includes the ability to meet the project RLs, the
ability to generate acceptable precision and accuracy, and other analytical and quality control parameters
documented in this CIMP. Data quality objectives for precision and accuracy are summarized in Table
B-3.

Page B-4
Table B-2 Analytical Methods and Project Reporting Limits (RL) for Laboratory Analysis of Water Samples
Parameter/Constituent Method(1)
Units Project MRP Table E-2
Reporting Limit Minimum Level
Toxicity
Ceriodaphnia dubia
(Freshwater)
EPA-821-R-02-013 (1002.0) and EPA-821-R-02-012 (2002.0)
TUc 2 NA
Strongylocentrotus purpuratus
(marine waters)
EPA-600-R-95-136 (1002.0)
TUc 2 NA
Haliotis rufescens
(marine waters) EPA-600-R-95-136 TUc 2 NA
Bacteria
Total coliform
(marine waters) SM 9221 MPN/100mL 10 10,000
Enterococcus
(marine waters) SM 9230 MPN/100mL 10 104
Fecal coliform
(marine and fresh waters) SM 9221 MPN/100mL 10 400
E. coli
(fresh waters) SM 9221 MPN/100mL 10 235
Conventional Pollutants
Oil and Grease EPA 1664A mg/L 5 5
Cyanide SM 4500-CN E mg/L 0.005 0.005
General

Page B-5
Parameter/Constituent Method(1)
Units Project MRP Table E-2
Reporting Limit Minimum Level
Specific Conductance EPA 120.1 µs/cm 1 1
Total Hardness SM 2340C mg/L 2 2
Dissolved Organic Carbon SM 5310B mg/L 0.6 NA
Total Organic Carbon SM 5310B mg/L 1 1
Total Petroleum Hydrocarbon EPA 1664 mg/L 5 5
Biochemical Oxygen Demand
SMOL-5210 mg/L 5 2
Chemical Oxygen Demand SM 5220D mg/L 20 20-900
MBAS SM 5540C mg/L 0.5 0.5
Chloride EPA 300.0 mg/L 1 2
Fluoride EPA 300.0 mg/L 0.1 0.1
Perchlorate EPA 314.0 µg/L 4 4
Dissolved Phosphorus SM 4500-P E mg/L 0.05 0.05
Total Phosphorus SM 4500-P E mg/L 0.05 0.05
Orthophosphate-P EPA 300.0 mg/L 0.2 NA
Ammonia (as N) SM 4500-NH3 C mg/L 0.1 0.1
Nitrate + Nitrite (as N) EPA 300.0 mg/L 0.1 0.1
Nitrate (as N) EPA 300.0 mg/L 0.1 0.1
Nitrite (as N) EPA 300.0 mg/L 0.1 0.1
Total Kjehdahl Nitrogen (TKN)
SM 4500-NH3 C mg/L 0.1 0.1
Total Alkalinity SM 2320B mg/L 2 2
Solids
Suspended Sediment
Concentration (SSC) ASTMD 3977-97 mg/L 3 NA
Total Suspended Solids SM 2540D mg/L 2 2

Page B-6
Parameter/Constituent Method(1)
Units Project MRP Table E-2
Reporting Limit Minimum Level
(TSS)
Total Dissolved Solids (TDS)
SM 2540C
mg/L
10
2
Volatile Suspended Solids EPA 1684 mg/L 1 2
Metals in Freshwater (dissolved and total)
Aluminum EPA 200.8 µg/L 100 100
Antimony EPA 200.8 µg/L 0.5 0.5
Arsenic EPA 200.8 µg/L 1 1
Beryllium EPA 200.8 µg/L 0.5 0.5
Cadmium EPA 200.8 µg/L 0.25 0.25
Chromium (total) EPA 200.8 µg/L 0.5 0.5
Chromium (Hexavalent) EPA 200.8 µg/L 5 5
Copper EPA 200.8 µg/L 0.5 0.5
Iron EPA 200.8 µg/L 100 100
Lead EPA 200.8 µg/L 0.5 0.5
Mercury EPA 1631 µg/L 0.5 0.5
Nickel EPA 200.8 µg/L 1 1
Selenium EPA 200.8 µg/L 1 1
Silver EPA 200.8 µg/L 0.25 0.25
Thallium EPA 200.8 µg/L 1 1
Zinc EPA 200.8 µg/L 1 1
Metals in Seawater (dissolved and total)
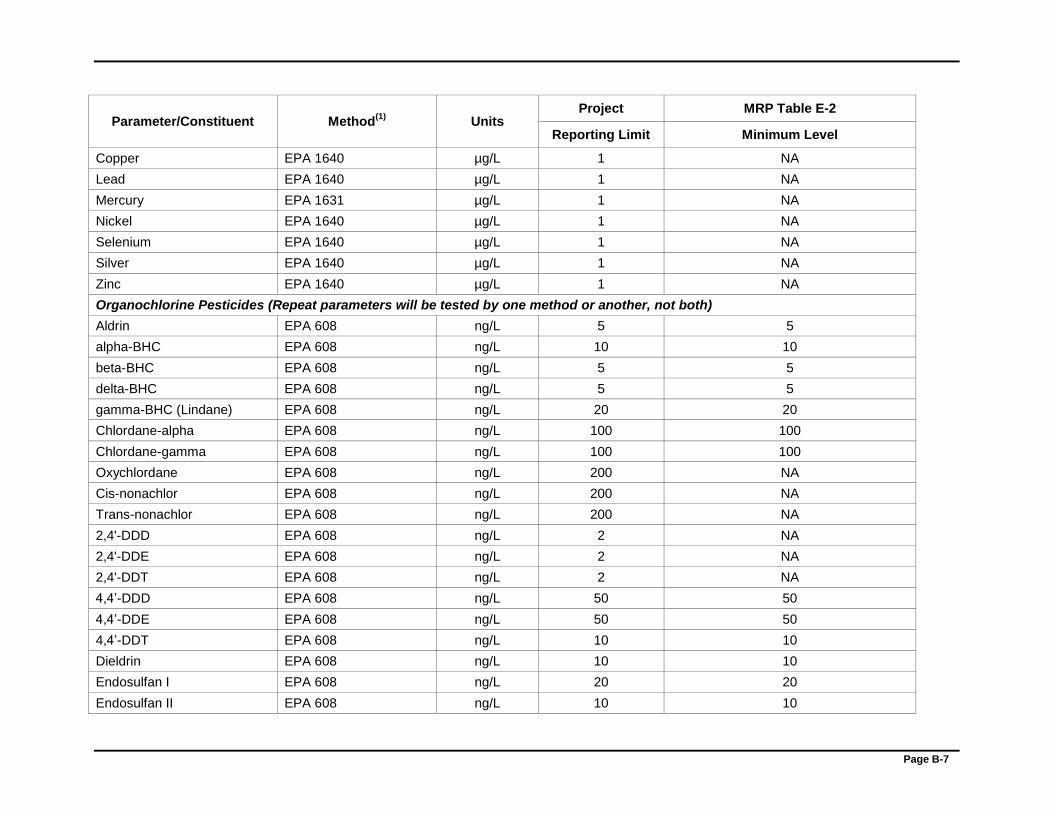
Page B-7
Parameter/Constituent Method(1)
Units Project MRP Table E-2
Reporting Limit Minimum Level
Copper EPA 1640 µg/L 1 NA
Lead EPA 1640 µg/L 1 NA
Mercury EPA 1631 µg/L 1 NA
Nickel EPA 1640 µg/L 1 NA
Selenium EPA 1640 µg/L 1 NA
Silver EPA 1640 µg/L 1 NA
Zinc EPA 1640 µg/L 1 NA
Organochlorine Pesticides (Repeat parameters will be tested by one method or another, not both)
Aldrin EPA 608 ng/L 5 5
alpha-BHC EPA 608 ng/L 10 10
beta-BHC EPA 608 ng/L 5 5
delta-BHC EPA 608 ng/L 5 5
gamma-BHC (Lindane) EPA 608 ng/L 20 20
Chlordane-alpha EPA 608 ng/L 100 100
Chlordane-gamma EPA 608 ng/L 100 100
Oxychlordane EPA 608 ng/L 200 NA
Cis-nonachlor EPA 608 ng/L 200 NA
Trans-nonachlor EPA 608 ng/L 200 NA
2,4'-DDD EPA 608 ng/L 2 NA
2,4'-DDE EPA 608 ng/L 2 NA
2,4'-DDT EPA 608 ng/L 2 NA
4,4’-DDD EPA 608 ng/L 50 50
4,4’-DDE EPA 608 ng/L 50 50
4,4’-DDT EPA 608 ng/L 10 10
Dieldrin EPA 608 ng/L 10 10
Endosulfan I EPA 608 ng/L 20 20
Endosulfan II EPA 608 ng/L 10 10

Page B-8
Parameter/Constituent Method(1)
Units Project MRP Table E-2
Reporting Limit Minimum Level
Endosulfan Sulfate EPA 608 ng/L 50 50
Endrin EPA 608 ng/L 10 10
Endrin Aldehyde EPA 608 ng/L 10 10
Heptachlor EPA 608 ng/L 10 10
Heptachlor Epoxide EPA 608 ng/L 10 10
Toxaphene EPA 608 ng/L 500 500
Aldrin EPA 1699 ng/L 0.0063 5
alpha-BHC EPA 1699 ng/L 0.0074 10
beta-BHC EPA 1699 ng/L 0.0064 5
delta-BHC EPA 1699 ng/L 0.0054 5
gamma-BHC (Lindane) EPA 1699 ng/L 0.0094 20
Chlordane-alpha EPA 1699 ng/L 0.0074 100
Chlordane-gamma EPA 1699 ng/L 0.0064 100
Oxychlordane EPA 1699 ng/L 0.0074 NA
Cis-nonachlor EPA 1699 ng/L 0.0044 NA
Trans-nonachlor EPA 1699 ng/L 0.0114 NA
2,4'-DDD EPA 1699 ng/L 0.0034 NA
2,4'-DDE EPA 1699 ng/L 0.0034 NA
2,4'-DDT EPA 1699 ng/L 0.0024 NA
4,4’-DDD EPA 1699 ng/L 0.0054 50
4,4’-DDE EPA 1699 ng/L 0.0064 50
4,4’-DDT EPA 1699 ng/L 0.0014 10
Dieldrin EPA 1699 ng/L 0.0054 10
Endosulfan I EPA 1699 ng/L 0.0244 20
3 RL assumed equal to MDL in Table 1 from EPA Method 1699

Page B-9
Parameter/Constituent Method(1)
Units Project MRP Table E-2
Reporting Limit Minimum Level
Endosulfan II EPA 1699 ng/L 0.0304 10
Endosulfan Sulfate EPA 1699 ng/L 0.0134 50
Endrin EPA 1699 ng/L 0.0034 10
Endrin Aldehyde EPA 1699 ng/L 0.0124 10
Heptachlor EPA 1699 ng/L 0.0074 10
Heptachlor Epoxide EPA 1699 ng/L 0.0124 10
Toxaphene EPA 1699 ng/L Not reported 500
PCBs (Repeat parameters will be tested by one method or another, not both)
Congeners (5, 8, 15, 18, 27, 28, 29, 31, 33, 44, 49, 52, 56, 60, 66, 70, 74, 87, 95, 97, 99, 101, 105, 110, 114, 118, 128, 137, 138, 141, 149, 151, 153, 156, 157, 158, 170, 174, 177, 180, 183, 187, 194, 195, 200, 201, 203, 206, 209)
EPA 6084 µg/L 0.002 0.002
4
Congener 189 EPA 6084 µg/L 1.0 1.0
4
Congener 5 EPA 1668A µg/L 0.00005 0.0024
Congeners (27, 29, 33, 56, 105, 141, 158)
EPA 1668A µg/L 0.0002 0.002
4
4 Listed in the State of California’s Surface Water Ambient Monitoring Program Quality Assurance Program Plan (September 1, 2008).
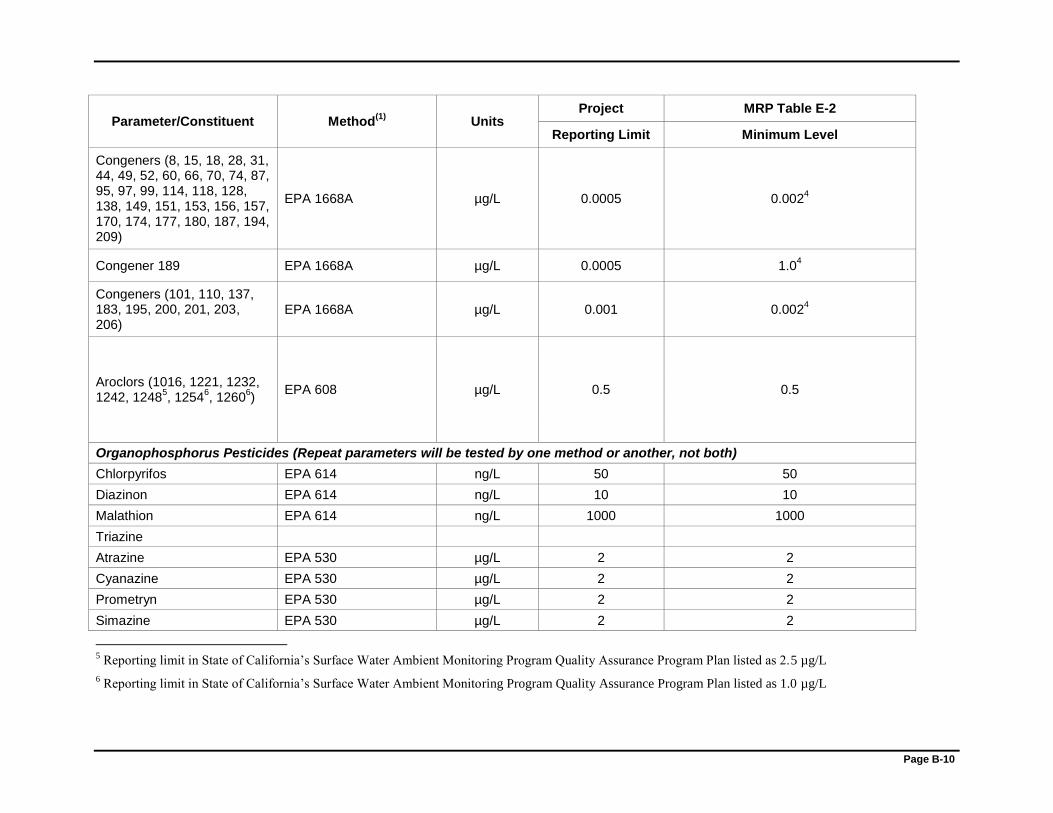
Page B-10
Parameter/Constituent Method(1)
Units Project MRP Table E-2
Reporting Limit Minimum Level
Congeners (8, 15, 18, 28, 31, 44, 49, 52, 60, 66, 70, 74, 87, 95, 97, 99, 114, 118, 128, 138, 149, 151, 153, 156, 157, 170, 174, 177, 180, 187, 194, 209)
EPA 1668A µg/L 0.0005 0.0024
Congener 189 EPA 1668A µg/L 0.0005 1.04
Congeners (101, 110, 137, 183, 195, 200, 201, 203, 206)
EPA 1668A µg/L 0.001 0.0024
Aroclors (1016, 1221, 1232, 1242, 1248
5, 1254
6, 1260
6)
EPA 608 µg/L 0.5 0.5
Organophosphorus Pesticides (Repeat parameters will be tested by one method or another, not both)
Chlorpyrifos EPA 614 ng/L 50 50
Diazinon EPA 614 ng/L 10 10
Malathion EPA 614 ng/L 1000 1000
Triazine
Atrazine EPA 530 µg/L 2 2
Cyanazine EPA 530 µg/L 2 2
Prometryn EPA 530 µg/L 2 2
Simazine EPA 530 µg/L 2 2
5 Reporting limit in State of California’s Surface Water Ambient Monitoring Program Quality Assurance Program Plan listed as 2.5 µg/L
6 Reporting limit in State of California’s Surface Water Ambient Monitoring Program Quality Assurance Program Plan listed as 1.0 µg/L

Page B-11
Parameter/Constituent Method(1)
Units Project MRP Table E-2
Reporting Limit Minimum Level
Chlorpyrifos EPA 1699 ng/L 0.0204 50
Diazinon EPA 1699 ng/L 0.0274 10
Malathion EPA 1699 ng/L 0.2964 1000
Triazine EPA 1699
Atrazine EPA 1699 µg/L 0.0000144 2
Cyanazine EPA 1699 µg/L 0.0000384 2
Prometryn EPA 1699 µg/L Not reported4 2
Simazine EPA 1699 µg/L 0.0000124 2
Herbicides
2,4-D EPA 8151A µg/L 10 10
Glyphosate EPA 547 µg/L 5 5
2,4,5-TP-SILVEX EPA 8151A µg/L 0.5 0.5
Semivolatile Organic Compounds (SVOCs)
1,2-Diphenylhydrazine EPA 625 µg/L 1 1
2,4,6-Trichlorophenol EPA 625 µg/L 10 10
2,4-Dichlorophenol EPA 625 µg/L 1 1
2,4-Dimethylphenol EPA 625 µg/L 2 2
2,4-Dinitrophenol EPA 625 µg/L 5 5
2,4-Dinitrotoluene EPA 625 µg/L 5 5
2,6-Dinitrotoluene EPA 625 µg/L 5 5
2-Chloronaphthalene EPA 625 µg/L 10 10
2-Chlorophenol EPA 625 µg/L 2 2
2-Methyl-4,6-dinitrophenol EPA 625 µg/L 5 5
2-Nitrophenol EPA 625 µg/L 10 10
3,3'-Dichlorobenzidine EPA 625 µg/L 5 5
4-Bromophenyl phenyl ether EPA 625 µg/L 5 5
4-Chloro-3-methylphenol EPA 625 µg/L 1 1

Page B-12
Parameter/Constituent Method(1)
Units Project MRP Table E-2
Reporting Limit Minimum Level
4-Chlorophenyl phenyl ether EPA 625 µg/L 5 5
4-Nitrophenol EPA 625 µg/L 5 5
Acenaphthene EPA 625 µg/L 1 1
Acenaphthylene EPA 625 µg/L 2 2
Anthracene EPA 625 µg/L 2 2
Benzidine EPA 625 µg/L 5 5
Benzo(a)anthracene EPA 625 µg/L 5 5
Benzo(a)pyrene EPA 625 µg/L 2 2
Benzo(b)fluoranthene EPA 625 µg/L 10 10
Benzo(g,h,i)perylene EPA 625 µg/L 5 5
Benzo(k)fluoranthene EPA 625 µg/L 2 2
Benzyl butyl phthalate EPA 625 µg/L 10 10
bis(2-Chloroethoxy) methane EPA 625 µg/L 5 5
bis(2-Chloroisopropyl) ether EPA 625 µg/L 2 2
bis(2-Chloroethyl) ether EPA 625 µg/L 1 1
bis(2-Ethylhexyl) phthalate EPA 625 µg/L 5 5
Chrysene EPA 625 µg/L 5 5
Dibenzo(a,h)anthracene EPA 625 µg/L 0.1 0.1
Diethyl phthalate EPA 625 µg/L 2 2
Dimethyl phthalate EPA 625 µg/L 2 2
Di-n-butylphthalate EPA 625 µg/L 10 10
Di-n-octylphthalate EPA 625 µg/L 10 10
Fluoranthene EPA 625 µg/L 0.05 0.05
Fluorene EPA 625 µg/L 0.1 0.1
Hexachlorobenzene EPA 625 µg/L 1 1
Hexachlorobutadiene EPA 625 µg/L 1 1
Hexachloro-cyclo pentadiene EPA 625 µg/L 5 5
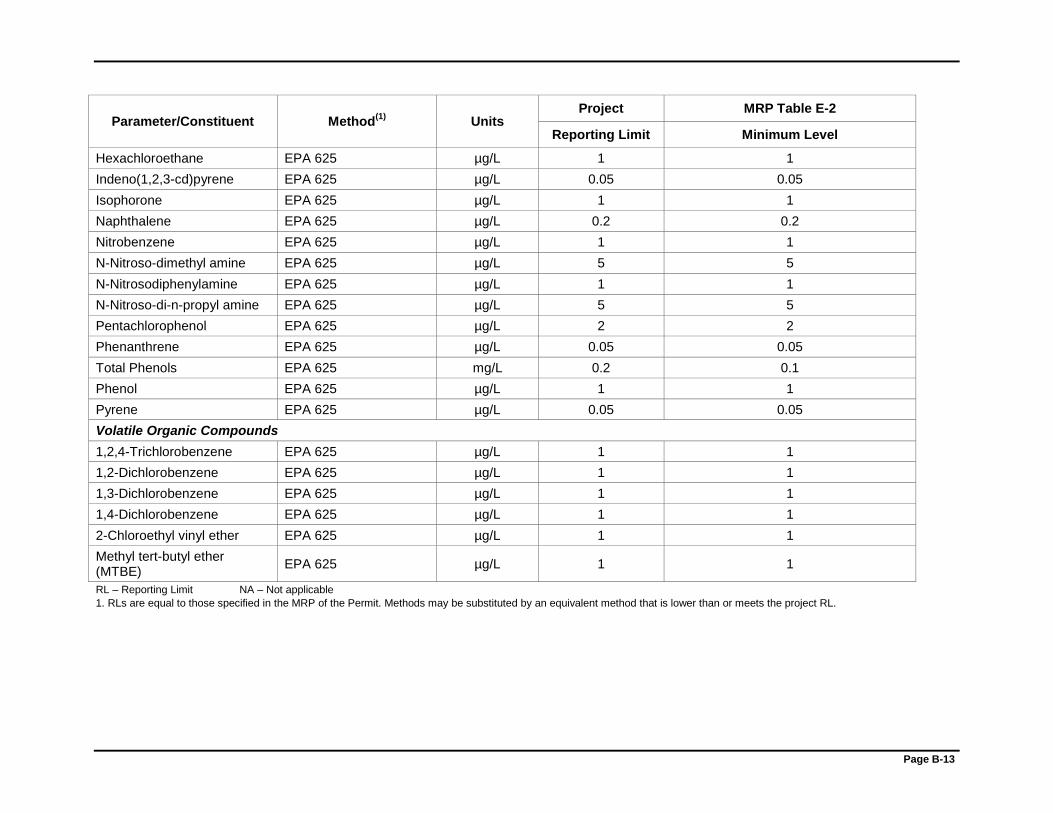
Page B-13
Parameter/Constituent Method(1)
Units Project MRP Table E-2
Reporting Limit Minimum Level
Hexachloroethane EPA 625 µg/L 1 1
Indeno(1,2,3-cd)pyrene EPA 625 µg/L 0.05 0.05
Isophorone EPA 625 µg/L 1 1
Naphthalene EPA 625 µg/L 0.2 0.2
Nitrobenzene EPA 625 µg/L 1 1
N-Nitroso-dimethyl amine EPA 625 µg/L 5 5
N-Nitrosodiphenylamine EPA 625 µg/L 1 1
N-Nitroso-di-n-propyl amine EPA 625 µg/L 5 5
Pentachlorophenol EPA 625 µg/L 2 2
Phenanthrene EPA 625 µg/L 0.05 0.05
Total Phenols EPA 625 mg/L 0.2 0.1
Phenol EPA 625 µg/L 1 1
Pyrene EPA 625 µg/L 0.05 0.05
Volatile Organic Compounds
1,2,4-Trichlorobenzene EPA 625 µg/L 1 1
1,2-Dichlorobenzene EPA 625 µg/L 1 1
1,3-Dichlorobenzene EPA 625 µg/L 1 1
1,4-Dichlorobenzene EPA 625 µg/L 1 1
2-Chloroethyl vinyl ether EPA 625 µg/L 1 1
Methyl tert-butyl ether (MTBE)
EPA 625 µg/L 1 1
RL – Reporting Limit NA – Not applicable
1. RLs are equal to those specified in the MRP of the Permit. Methods may be substituted by an equivalent method that is lower than or meets the project RL.
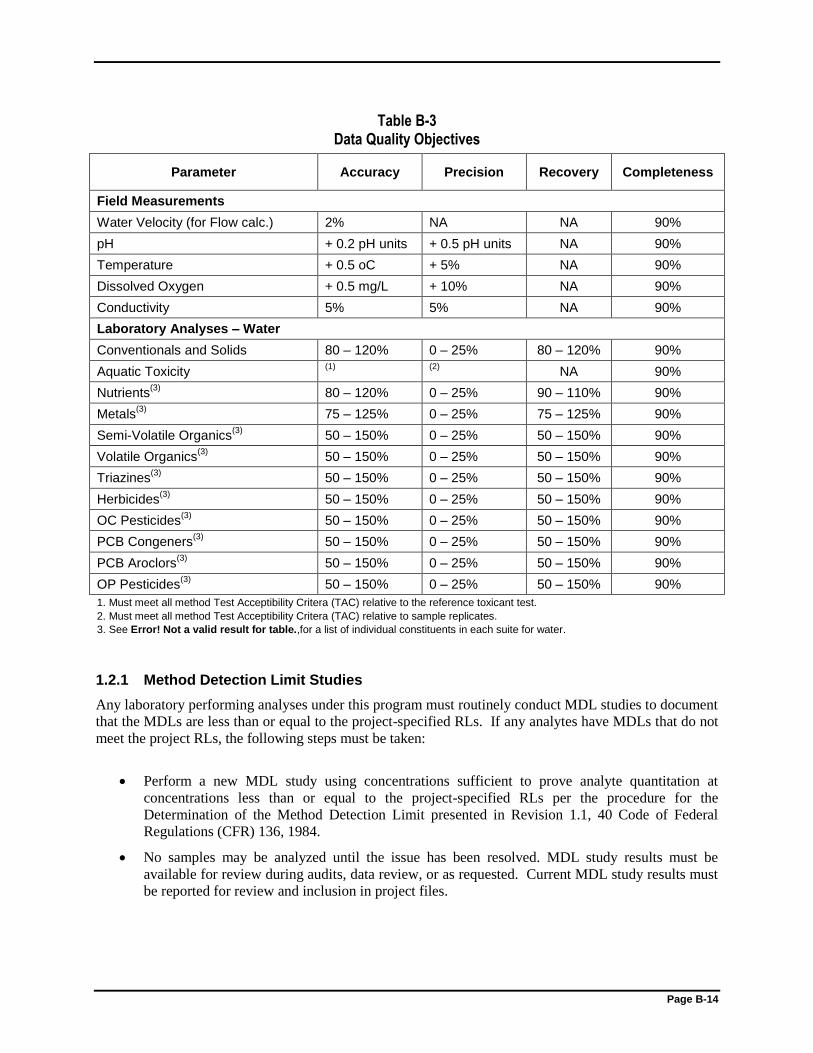
Page B-14
Table B-3 Data Quality Objectives
Parameter Accuracy Precision Recovery Completeness
Field Measurements
Water Velocity (for Flow calc.) 2% NA NA 90%
pH + 0.2 pH units + 0.5 pH units NA 90%
Temperature + 0.5 oC + 5% NA 90%
Dissolved Oxygen + 0.5 mg/L + 10% NA 90%
Conductivity 5% 5% NA 90%
Laboratory Analyses – Water
Conventionals and Solids 80 – 120% 0 – 25% 80 – 120% 90%
Aquatic Toxicity (1) (2)
NA 90%
Nutrients(3)
80 – 120% 0 – 25% 90 – 110% 90%
Metals(3)
75 – 125% 0 – 25% 75 – 125% 90%
Semi-Volatile Organics(3)
50 – 150% 0 – 25% 50 – 150% 90%
Volatile Organics(3)
50 – 150% 0 – 25% 50 – 150% 90%
Triazines(3)
50 – 150% 0 – 25% 50 – 150% 90%
Herbicides(3)
50 – 150% 0 – 25% 50 – 150% 90%
OC Pesticides(3)
50 – 150% 0 – 25% 50 – 150% 90%
PCB Congeners(3)
50 – 150% 0 – 25% 50 – 150% 90%
PCB Aroclors(3)
50 – 150% 0 – 25% 50 – 150% 90%
OP Pesticides(3)
50 – 150% 0 – 25% 50 – 150% 90%
1. Must meet all method Test Acceptibility Critera (TAC) relative to the reference toxicant test.
2. Must meet all method Test Acceptibility Critera (TAC) relative to sample replicates.
3. See Error! Not a valid result for table.,for a list of individual constituents in each suite for water.
1.2.1 Method Detection Limit Studies
Any laboratory performing analyses under this program must routinely conduct MDL studies to document
that the MDLs are less than or equal to the project-specified RLs. If any analytes have MDLs that do not
meet the project RLs, the following steps must be taken:
Perform a new MDL study using concentrations sufficient to prove analyte quantitation at
concentrations less than or equal to the project-specified RLs per the procedure for the
Determination of the Method Detection Limit presented in Revision 1.1, 40 Code of Federal
Regulations (CFR) 136, 1984.
No samples may be analyzed until the issue has been resolved. MDL study results must be
available for review during audits, data review, or as requested. Current MDL study results must
be reported for review and inclusion in project files.

Page B-15
An MDL is developed from seven aliquots of a standard containing all analytes of interest spiked at five
times the expected MDL. These aliquots are processed and analyzed in the same manner as
environmental samples. The results are then used to calculate the MDL. If the calculated MDL is less
than 0.33 times the spiked concentration, another MDL study should be performed using lower spiked
concentrations.
1.2.2 Project Reporting Limits
Laboratories generally establish RLs that are reported with the analytical results—these may be called
reporting limits, detection limits, reporting detection limits, or several other terms by the reporting
laboratory. These laboratory limits must be less than or equal to the project RLs listed in Table B-2.
Wherever possible, project RLs are lower than the relevant numeric criteria or toxicity thresholds.
Laboratories performing analyses for this project must have documentation to support quantitation at the
required levels.
1.2.3 Laboratory Standards and Reagents
All stock standards and reagents used for standard solutions and extractions must be tracked through the
laboratory. The preparation and use of all working standards must be documented according to
procedures outlined in each laboratory’s Quality Assurance (QA) Manual; standards must be traceable
according to USEPA, A2LA or National Institute for Standards and Technology (NIST) criteria. Records
must have sufficient detail to allow determination of the identity, concentration, and viability of the
standards, including any mixings performed to obtain the working standard. Date of preparation, analyte
or mixture, concentration, name of preparer, lot or cylinder number, and expiration date, if applicable,
must be recorded on each working standard.
1.2.4 Sample Containers, Storage, Preservation, and Holding Times
Sample containers must be pre-cleaned and certified free of contamination according to the USEPA
specification for the appropriate methods. Sample container, storage and preservation, and holding time
requirements are provided in Table B-4.These values may vary based on the selected laboratory. The
analytical laboratories will supply sample containers that already contain preservative (Table B-4),
including ultra-pure hydrochloric and nitric acid, where applicable. After collection, samples will be
stored at 4°C until arrival at the contract laboratory.
Table B-4 Sample Container, Sample Volume, Initial Preservation, and Holding Time Requirements for
Parameters Analyzed at a Laboratory
Parameter Sample
Container Sample
Volume(1)
Immediate Processing and
Storage
Holding Time
Water
Toxicity
Initial Screening Glass or FLPE-lined jerrican
40 L(6)
Store at 4°C 36 hours(2)
Follow-Up Testing
Phase I TIE
Total coliform, fecal coliform, and Enterococcus (marine waters)
PE 120 mL Na2S2O3 and Store at 8ºC
6 hours
Fecal coliform, E. coli (fresh waters) PE 120 mL
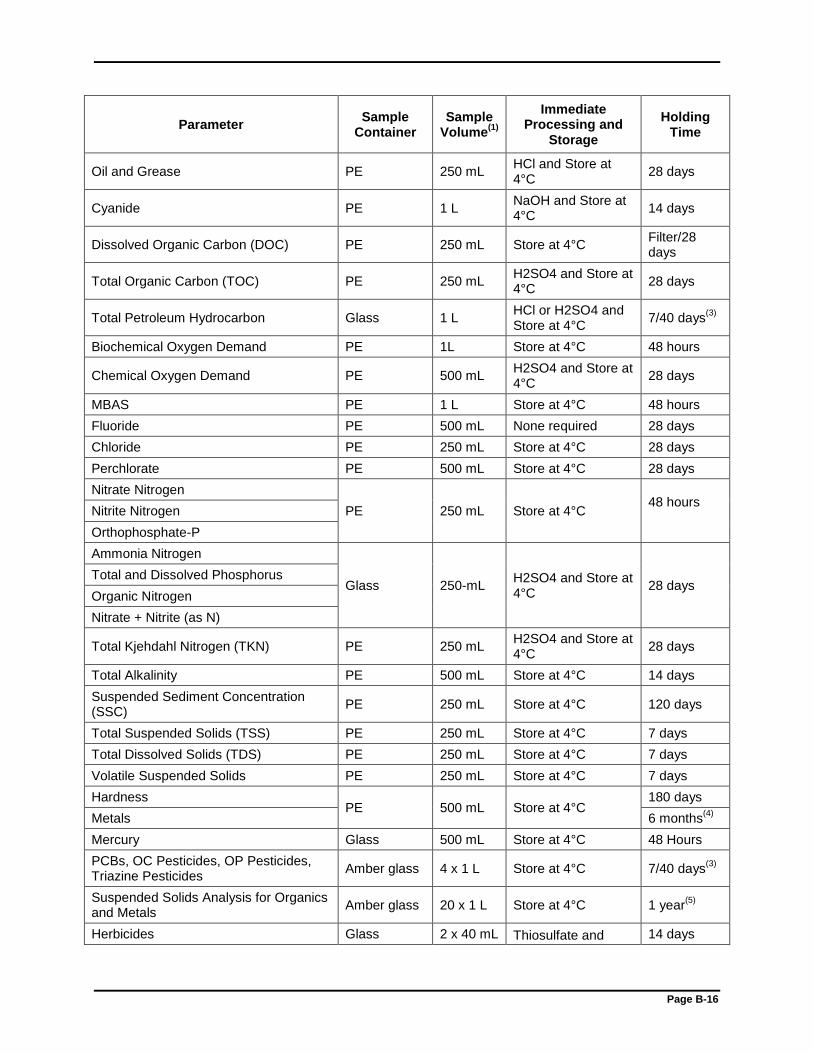
Page B-16
Parameter Sample
Container Sample
Volume(1)
Immediate Processing and
Storage
Holding Time
Oil and Grease PE 250 mL HCl and Store at 4°C
28 days
Cyanide PE 1 L NaOH and Store at 4°C
14 days
Dissolved Organic Carbon (DOC) PE 250 mL Store at 4°C Filter/28 days
Total Organic Carbon (TOC) PE 250 mL H2SO4 and Store at 4°C
28 days
Total Petroleum Hydrocarbon Glass 1 L HCl or H2SO4 and Store at 4°C
7/40 days(3)
Biochemical Oxygen Demand PE 1L Store at 4°C 48 hours
Chemical Oxygen Demand PE 500 mL H2SO4 and Store at 4°C
28 days
MBAS PE 1 L Store at 4°C 48 hours
Fluoride PE 500 mL None required 28 days
Chloride PE 250 mL Store at 4°C 28 days
Perchlorate PE 500 mL Store at 4°C 28 days
Nitrate Nitrogen
PE 250 mL Store at 4°C 48 hours
Nitrite Nitrogen
Orthophosphate-P
Ammonia Nitrogen
Glass 250-mL H2SO4 and Store at 4°C
28 days Total and Dissolved Phosphorus
Organic Nitrogen
Nitrate + Nitrite (as N)
Total Kjehdahl Nitrogen (TKN) PE 250 mL H2SO4 and Store at 4°C
28 days
Total Alkalinity PE 500 mL Store at 4°C 14 days
Suspended Sediment Concentration (SSC)
PE 250 mL Store at 4°C 120 days
Total Suspended Solids (TSS) PE 250 mL Store at 4°C 7 days
Total Dissolved Solids (TDS) PE 250 mL Store at 4°C 7 days
Volatile Suspended Solids PE 250 mL Store at 4°C 7 days
Hardness PE 500 mL Store at 4°C
180 days
Metals 6 months(4)
Mercury Glass 500 mL Store at 4°C 48 Hours
PCBs, OC Pesticides, OP Pesticides, Triazine Pesticides
Amber glass 4 x 1 L Store at 4°C 7/40 days(3)
Suspended Solids Analysis for Organics and Metals
Amber glass 20 x 1 L Store at 4°C 1 year(5)
Herbicides Glass 2 x 40 mL Thiosulfate and 14 days
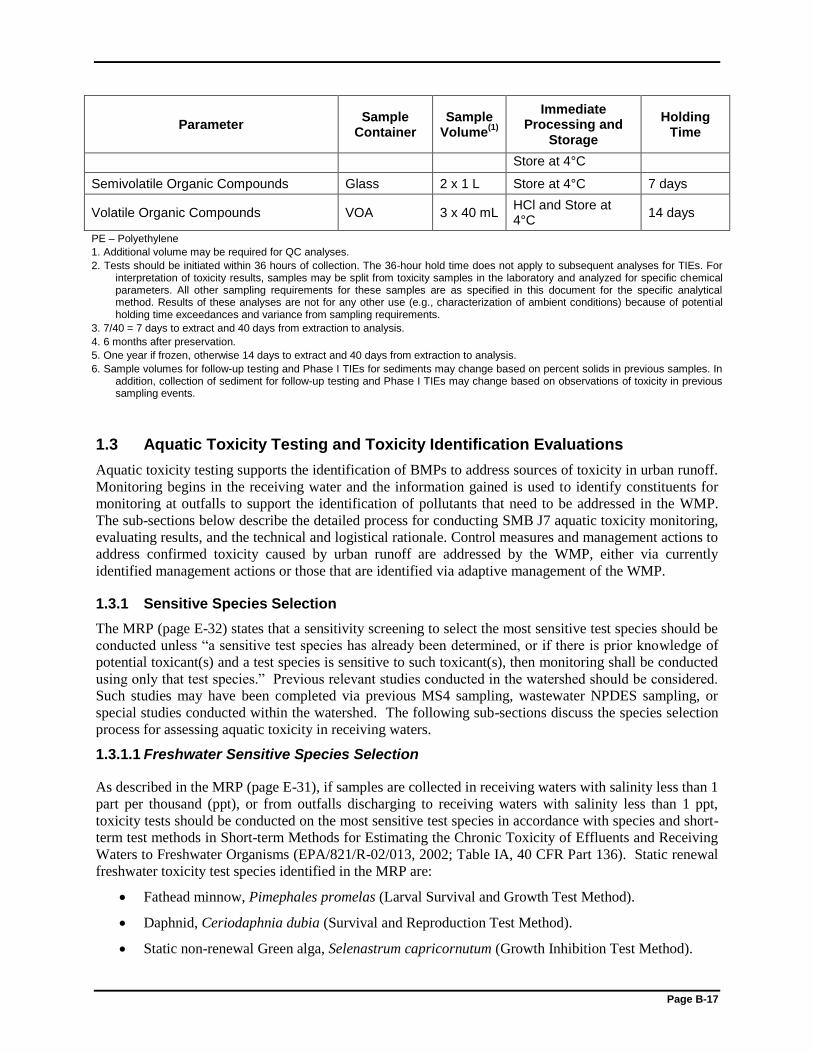
Page B-17
Parameter Sample
Container Sample
Volume(1)
Immediate Processing and
Storage
Holding Time
Store at 4°C
Semivolatile Organic Compounds Glass 2 x 1 L Store at 4°C 7 days
Volatile Organic Compounds VOA 3 x 40 mL HCl and Store at 4°C
14 days
PE – Polyethylene
1. Additional volume may be required for QC analyses.
2. Tests should be initiated within 36 hours of collection. The 36-hour hold time does not apply to subsequent analyses for TIEs. For interpretation of toxicity results, samples may be split from toxicity samples in the laboratory and analyzed for specific chemical parameters. All other sampling requirements for these samples are as specified in this document for the specific analytical method. Results of these analyses are not for any other use (e.g., characterization of ambient conditions) because of potential holding time exceedances and variance from sampling requirements.
3. 7/40 = 7 days to extract and 40 days from extraction to analysis.
4. 6 months after preservation.
5. One year if frozen, otherwise 14 days to extract and 40 days from extraction to analysis.
6. Sample volumes for follow-up testing and Phase I TIEs for sediments may change based on percent solids in previous samples. In addition, collection of sediment for follow-up testing and Phase I TIEs may change based on observations of toxicity in previous sampling events.
1.3 Aquatic Toxicity Testing and Toxicity Identification Evaluations
Aquatic toxicity testing supports the identification of BMPs to address sources of toxicity in urban runoff.
Monitoring begins in the receiving water and the information gained is used to identify constituents for
monitoring at outfalls to support the identification of pollutants that need to be addressed in the WMP.
The sub-sections below describe the detailed process for conducting SMB J7 aquatic toxicity monitoring,
evaluating results, and the technical and logistical rationale. Control measures and management actions to
address confirmed toxicity caused by urban runoff are addressed by the WMP, either via currently
identified management actions or those that are identified via adaptive management of the WMP.
1.3.1 Sensitive Species Selection
The MRP (page E-32) states that a sensitivity screening to select the most sensitive test species should be
conducted unless “a sensitive test species has already been determined, or if there is prior knowledge of
potential toxicant(s) and a test species is sensitive to such toxicant(s), then monitoring shall be conducted
using only that test species.” Previous relevant studies conducted in the watershed should be considered.
Such studies may have been completed via previous MS4 sampling, wastewater NPDES sampling, or
special studies conducted within the watershed. The following sub-sections discuss the species selection
process for assessing aquatic toxicity in receiving waters.
1.3.1.1 Freshwater Sensitive Species Selection
As described in the MRP (page E-31), if samples are collected in receiving waters with salinity less than 1
part per thousand (ppt), or from outfalls discharging to receiving waters with salinity less than 1 ppt,
toxicity tests should be conducted on the most sensitive test species in accordance with species and short-
term test methods in Short-term Methods for Estimating the Chronic Toxicity of Effluents and Receiving
Waters to Freshwater Organisms (EPA/821/R-02/013, 2002; Table IA, 40 CFR Part 136). Static renewal
freshwater toxicity test species identified in the MRP are:
Fathead minnow, Pimephales promelas (Larval Survival and Growth Test Method).
Daphnid, Ceriodaphnia dubia (Survival and Reproduction Test Method).
Static non-renewal Green alga, Selenastrum capricornutum (Growth Inhibition Test Method).
Page B-18
The three test species were evaluated to determine if either a sensitive test species had already been
determined, or if there is prior knowledge of potential toxicant(s) and a test species is sensitive to such
toxicant(s). In reviewing the available data in the ULAR watershed, metals, historical organics, and
currently used pesticides have been identified as problematic and are generally considered the primary
aquatic life toxicants of concern found in urban runoff. Given the knowledge of the presence of these
potential toxicants in the watershed, the sensitivities of each of the three species were considered to
evaluate which is the most sensitive to the potential toxicants in the watershed.
Ceriodaphnia dubia (C. dubia) has been reported as a sensitive test species for historical and current use
pesticides and metals, and studies indicate that it is more sensitive to the toxicants of concern than
Pimephales promelas (P. promelas) or Selenastrum capricornutum (S. capricornutum). In Aquatic Life
Ambient Freshwater Quality Criteria - Copper, the USEPA reports greater sensitivity of C. dubia to
copper (species mean acute value of 5.93 µg/l) compared to P. promelas (species mean acute value of
69.93 µg/l; EPA, 2007). C. dubia’s relatively higher sensitivity to metals is common across multiple
metals. Additionally, researchers at the University of California (UC), Davis reviewed available reported
species sensitivity values in developing pesticide criteria for the Central Valley Regional Water Quality
Control Board (CVRWQCB). The UC Davis researchers reported higher sensitivity of C. dubia to
diazinon and bifenthrin (species mean acute value of 0.34 µg/l and 0.105 µg/l) compared to P. promelas
(species mean acute value of 7804 µg/l and 0.405 µg/l; Palumbo et al., 2010a,b). Additionally, a study of
the City of Stockton urban stormwater runoff found acute and chronic toxicity response to C. dubia, with
no toxicity response to S. capricornutum or P. promelas (Lee and Lee, 2001). The toxicity was attributed
to organophosphate pesticides, indicating a higher sensitivity of C. dubia compared to S. capricornutum
or P. promelas. C. dubia is also the test organism selected to assess the ambient toxicity of the Los
Angeles River by the Los Angeles River Watershed Monitoring Program and has been the most-sensitive
species to the Donald C. Tillman and the Los Angeles-Glendale Water Reclamation Plant effluent as well
as the Los Angeles River receiving water in the vicinity of the water treatment plants. While P. promelas
is generally less sensitive to metals and pesticides, this species can be more sensitive to ammonia than C.
dubia. However, as ammonia is not typically a constituent of concern for urban runoff and ammonia is
not consistently observed above the toxic thresholds in the watershed, P. promelas is not considered a
particularly sensitive species for evaluating the impacts of urban runoff in receiving waters in this
watershed.
S. capricornutum is a species sensitive to herbicides. However, while sometimes present in urban runoff,
herbicides are not identified as a potential toxicant in this watershed. Additionally, S. capricornutum is
not considered the most sensitive species as it is not sensitive to pyrethroids or organophosphate
pesticides and is not as sensitive to metals as C. dubia. Additionally, the S. capricornutum growth test can
be affected by high concentrations of suspended and dissolved solids, color, and pH extremes, which can
interfere with the determination of sample toxicity. As a result, it is common to manipulate the sample by
centrifugation and filtration to remove solids to conduct the test; however, this process may affect the
toxicity of the sample. In a study of urban highway stormwater runoff (Kayhanian et. al, 2008), S.
capricornutum’s response to the stormwater samples was more variable than the C. dubia and the P.
promelas and in some cases the algal growth was possibly enhanced due to the presence of stimulatory
nutrients. Also, in a study on the City of Stockton urban stormwater runoff (Lee and Lee, 2001) the S.
capricornutum tests rarely detected toxicity where the C. dubia and the P. promelas regularly detected
toxicity.
As C. dubia is identified as the most sensitive to known potential toxicant(s) typically found in receiving
waters and urban runoff in the freshwater potions of this watershed, C. dubia is selected as the most

Page B-19
sensitive species. The species also has the advantage of being easily maintained by means of in-house
mass cultures. The relative ease of test preparation, the ease of interpreting results, and the smaller
volume necessary to run the test, make the test a valuable screening tool. The ease of sample collection
and higher sensitivity will support assessing the presence of ambient receiving water toxicity or long term
effects of toxic stormwater over time. As such, toxicity testing in the freshwater portions of the watershed
will be conducted using C. dubia. However, C. dubia test organisms are typically cultured in moderately
hard waters (80-100 mg/L CaCO3) and can have increased sensitivity to elevated water hardness greater
than 400 mg/L CaCO3), which is beyond their typical habitat range. Because of this, in instances where
hardness in site waters exceeds 400 mg/L (CaCO3), an alternative test species may be used. Daphnia
magna is more tolerant to high hardness levels and is a suitable substitution for C. dubia in these
instances (Cowgill and Milazzo, 1990)
1.3.2 Testing Period
The following describes the testing periods to assess toxicity in samples collected in the ULARWMAG
EWMP area during dry and wet weather conditions. Although wet weather conditions in the region
generally persist for less than the chronic testing periods (7 days), the C. dubia chronic test will be used
for wet weather toxicity testing in accordance with Short-term Methods for Estimating the Chronic
Toxicity of Effluents and Receiving Waters to Freshwater Organisms (EPA, 2002b). Utilization of
chronic tests on wet weather samples are not expected to generate results representative of the typical
conditions found in the receiving water intended to be simulated by toxicity testing.
Chronic toxicity tests will be used to assess both survival and reproductive/growth endpoints for C. dubia
in dry weather samples. Chronic testing will be conducted on undiluted grab samples in accordance with
Short-term Methods for Estimating the Chronic Toxicity of Effluents and Receiving Waters to Freshwater
Organisms (USEPA, 2002a).
1.3.3 Toxicity Endpoint Assessment and Toxicity Identification Evaluation Triggers
Per the MRP, toxicity test endpoints will be analyzed using the Test of Significant Toxicity (TST) t-test
approach specified by the USEPA (USEPA, 2010). The Permit specifies that the chronic in-stream waste
concentration (IWC) is set at 100% receiving water for receiving water samples and 100% effluent for
outfall samples. Using the TST approach, a t-value is calculated for a test result and compared with a
critical t-value from USEPA’s TST Implementation Document (USEPA, 2010). Follow-up triggers are
generally based on the Permit specified statistical assessment as described below.
For chronic C. dubia toxicity testing, if a ≥50% reduction in survival or reproduction is observed between
the sample and laboratory control that is statistically significant, a toxicity identification evaluation (TIE)
will be performed.
TIE procedures will be initiated as soon as possible after the toxicity trigger threshold is observed to
reduce the potential for loss of toxicity due to extended sample storage. If the cause of toxicity is readily
apparent or is caused by pathogen related mortality (PRM) or epibiont interference with the test, the result
will be rejected. If necessary, a modified testing procedure will be developed for future testing.
In cases where significant endpoint toxicity effects ≥50% are observed in the original sample, but the
follow-up TIE baseline “signal” is not statistically significant, the cause of toxicity will be considered
non-persistent. No immediate follow-up testing is required on the sample. However, future test results
should be evaluated to determine if parallel TIE treatments are necessary to provide an opportunity to
identify the cause of toxicity.
Page B-20
1.3.4 Toxicity Identification Evaluation Approach
The results of toxicity testing will be used to trigger further investigations to determine the cause of
observed laboratory toxicity. The primary purpose of conducting TIEs is to support the identification of
management actions that will result in the removal of pollutants causing toxicity in receiving waters.
Successful TIEs will direct monitoring at outfall sampling sites to inform management actions. As such,
the goal of conducting TIEs is to identify pollutant(s) that should be sampled during outfall monitoring so
that management actions can be identified to address the pollutant(s).
The TIE approach is divided into three phases as described in USEPA’s 1991 Methods for Aquatic
Toxicity Identification Evaluations – Phase I Toxicity Characterization Procedures – Second Edition
(EPA/600/6-9/003) and briefly summarized as follows:
Phase I utilizes methods to characterize the physical/chemical nature of the constituents which
cause toxicity. Such characteristics as solubility, volatility and filterability are determined without
specifically identifying the toxicants. Phase I results are intended as a first step in specifically
identifying the toxicants but the data generated can also be used to develop treatment methods to
remove toxicity without specific identification of the toxicants.
Phase II utilizes methods to specifically identify toxicants.
Phase III utilizes methods to confirm the suspected toxicants.
A Phase I TIE will be conducted on samples that exceed a TIE trigger described above. Water quality
data will be reviewed to further support evaluation of potential toxicants. A range of sample
manipulations may be conducted as part of the TIE process. The most common manipulations are
described in Table B-5. Information from previous chemical testing and/or TIE efforts will be used to
determine which of these (or other) sample manipulations are most likely to provide useful information
for identification of primary toxicants. TIE methods will generally adhere to USEPA procedures
documented in conducting TIEs (USEPA, 1991, 1992, 1993a-b).

Page B-21
Table B-5 Aquatic Toxicity Identification Evaluation Sample Manipulations
TIE Sample Manipulation Expected Response
Adjust to between pH 7 and 8.5 Alters toxicity in pH sensitive compounds (i.e., ammonia and some trace metals)
Filtration or centrifugation* Removes particulates and associated toxicants
Ethylenediamine-Tetraacetic Acid (EDTA) or Cation Exchange Column
*
Chelates trace metals, particularly divalent cationic metals
Sodium thiosulfate (STS) addition Reduces toxicants attributable to oxidants (i.e., chlorine) and some trace metals
Piperonyl Butoxide (PBO)* Reduces toxicity from organophosphate pesticides such as diazinon, chlorpyrifos and malathion, and enhances pyrethroid toxicity
Carboxylesterase addition(1)
Hydrolyzes pyrethroids
Temperature adjustments(2)
Pyrethroids become more toxic when test temperatures are decreased
Solid Phase Extraction (SPE) with C18 column*
Removes non-polar organics (including pesticides) and some relatively non-polar metal chelates
Sequential Solvent Extraction of C18 column
Further resolution of SPE-extracted compounds for chemical analyses
No Manipulation* Baseline test for comparing the relative effectiveness of other manipulations
* Denotes treatments that will be conducted during the initiation of toxicity monitoring, but may be revised as the program is implemented. These treatments were recommended for initial stormwater testing in Appendix E (Toxicity Testing Tool for Storm Water Discharges) of the State Water Resources Control Board’s June 2012 Public Review Draft “Policy for Toxicity Assessment and Control”.
1. Carboxylesterase addition has been used in recent studies to help identify pyrethroid-associated toxicity (Wheelock et al., 2004; Weston and Amweg, 2007). However, this treatment is experimental in nature and should be used along with other pyrethroid-targeted TIE treatments (e.g., PBO addition).
2. Temperature adjustments are another recent manipulation used to evaluate pyrethroid-associated toxicity. Lower temperatures increase the lethality of pyrethroid pesticides. (Harwood, You and Lydy, 2009)
Toxicity causation will be tentatively identified based on the treatments in Table B-5 and, when possible,
the results verified based on water column chemistry analyses. After an initial determination of the cause
of toxicity, the information may be used during future events to to modify the targeted treatments to more
closely target the expected toxicant or to provide additional treatments to narrow the toxicant cause(s).
Moreover, if the toxicant or toxicant class is not initially identified, toxicity monitoring during subsequent
events will confirm if the toxicant is persistent or a short-term episodic occurrence.
As the primary goal of conducting TIEs is to identify pollutants for incorporation into outfall monitoring,
narrowing the list of toxicants following Phase I TIEs via Phase II or III TIEs is not necessary if the
toxicant class determined during the Phase I TIE is sufficient for: (1) identifying additional pollutants for
outfall monitoring; and/or (2) identifying control measures. Thus, if the specific pollutant(s) or the
analytical class of pollutant(s) (e.g., metals that are analyzed via USEPA Method 200.8) are identified
then sufficient information is available to inform the addition of pollutants to outfall monitoring.
Phase II TIEs may be utilized to identify specific constituents causing toxicity in a given sample if the
results of Phase I TIE testing and a review of available chemistry data fails to provide information
necessary to identify constituents that warrant additional monitoring activities or management actions to

Page B-22
identify likely sources of the toxicants and lead to elimination of the sources of these contaminants. Phase
III TIEs will be conducted following any Phase II TIEs.
For the purposes of determining whether a TIE is inconclusive, TIEs will be considered inconclusive if:
The toxicity is persistent (i.e., observed in the baseline), and
The cause of toxicity cannot be attributed to a class of constituents (e.g., insecticides, metals, etc.)
that can be targeted for monitoring.
If (1) a combination of causes that act in a synergistic or additive manner are identified; (2) the toxicity
can be removed with a treatment or via a combination of the TIE treatments; or (3) the analysis of water
quality data collected during the same event identify the pollutant or analytical class of pollutants, the
result of a TIE is considered conclusive.
In cases where significant endpoint toxicity effects greater than 50% are observed in the original sample,
but the follow-up TIE baseline “signal” is not statistically significant, the cause of toxicity will be
considered non-persistent. No immediate follow-up testing is required on the sample. However, future test
results should be evaluated to determine if parallel TIE treatments are necessary to provide an opportunity
to identify the cause of toxicity.
Note that the MRP (page E-33) allows a TIE Prioritization Metric (as described in Appendix E of the
Southern California Stormwater Monitoring Coalition’s (SMC) Model Monitoring Program) for use in
ranking sites for TIEs. However, as the extent to which TIEs will be conducted is unknown, prioritization
cannot be conducted at this time. However, prioritization may be utilized in the future based on the results
of toxicity monitoring and an approach to prioritization will be developed through the CIMP adaptive
management process and will be described in future versions of the CIMP.
1.3.5 Follow Up on Toxicity Testing Results
If the results of two TIEs on separate receiving samples collected during the same condition (i.e., wet or
dry weather) are inconclusive, a toxicity test conducted during the same condition (i.e., wet or dry
weather), using the same test species, will be conducted at applicable upstream outfalls as soon as feasible
(i.e., the next monitoring event that is at least 45 days following the toxicity laboratory’s report
transmitting the results of a inconclusive TIE). The same TIE evaluation triggers and TIE approach
presented in Sections Error! Reference source not found. and Error! Reference source not found.,
respectively will be followed based on the results of the outfall sample.
If a toxicant or class of toxicants is identified through a TIE, the MRP (page E-33) indicates the following
actions should be taken:
ULARWMAG Members shall analyze for the toxicant(s) during the next scheduled sampling
event in the discharge from the outfall(s) upstream of the receiving water location.
If the toxicant is present in the discharge from the outfall at levels above the applicable receiving
water limitation, a toxicity reduction evaluation (TRE) will be performed for that toxicant.
The list of constituents monitored at outfalls identified in the CIMP will be modified based on the results
of the TIEs. Monitoring for constituents identified based on the results of a TIE will occur as soon as
feasible following the completion of a successful TIE (i.e., the next monitoring event that is at least 45
days following the toxicity laboratory’s report transmitting the results of a successful TIE).
The requirements of the TREs will be met as part of the adaptive management process in the ULAR
EWMP rather than conducted via the CIMP. The identification and implementation of control measures
to address the causes of toxicity are tied to management of the stormwater program, not the CIMP. It is
expected that the requirements of TREs will only be conducted for toxicants that are not already
addressed by an existing Permit requirement (i.e., TMDLs) or existing or planned management actions.
Page B-23
1.3.6 Summary of Aquatic Toxicity Monitoring
The approach to conducting aquatic toxicity monitoring as described in the previous sections of this
Attachment is summarized in Figure B-1. The intent of the approach is to identify the cause of toxicity
observed in receiving water to the extent possible with the toxicity testing tools available, thereby
directing outfall monitoring for the pollutants causing toxicity with the ultimate goal of supporting the
development and implementation of management actions.

Page B-24
Valid results from toxicity test with
sensitive species
Are the results of the toxicity test
valid compared to the test
acceptability criteria?
No Evaluate cause of test failure and
address prior to next event
Yes
Do the results of the toxicity test
exceed the toxicity identification
(TIE) thresholds?
No No further action related to this sample
Yes
Conduct TIE
Was TIE Inconclusive? No
Add identified constituents to outfall
monitoring, continue receiving water
toxicity monitoring, and refer
toxicant(s) to the Adaptive
Management Process in the EWMP
Yes
Was this the second inconclusive
TIE in three years? No
Continue receiving water toxicity
monitoring and incorporate
information into EWMP
Yes
Add toxicity monitoring to
upstream outfalls during the same
condition, continue receiving water
toxicity monitoring, and incorporate
information into EWMP
Figure B-1. Detailed Aquatic Toxicity Assessment Process

Page B-25
Section 2 Sampling Methods and Sample Handling
The sections below discuss the steps to be taken to properly prepare for and initiate water quality
sampling for the CIMP.
2.1 Monitoring Event Preparation
Monitoring event preparation includes preparation of field equipment, placing bottle orders, and
contacting the necessary personnel regarding site access and schedule. The following steps will be
completed two weeks prior to each sampling event (a condensed timeline may be appropriate in storm
events, which may need to be completed on short notice):
1. Contact laboratories to order sample containers and to coordinate sample transportation details.
2. Confirm scheduled monitoring date with field crew(s), and set-up sampling day itinerary
including sample drop-off.
3. Prepare equipment.
4. Prepare sample container labels and apply to bottles.
5. Prepare the monitoring event summary and field log sheets to indicate the type of field
measurements, field observations and samples to be collected at each of the monitoring sites.
6. Verify that field measurement equipment is operating properly (i.e., check batteries, calibrate,
etc.)
Table B-6 provides a checklist of field equipment to prepare prior to each monitoring event.

Page B-26
Table B-6 Field Equipment Checklist
Monitoring Plan
Sample Containers plus Extras with Extra Lids
Pre-Printed, Waterproof Labels (extra blank sheets)
Event Summary Sheets
Field Log Sheets
Chain of Custody Forms
Bubble Wrap
Coolers with Ice
Tape Measure
Paper Towels or “Rags in a Box”
Safety Equipment
First Aid Kit
Cellular Telephone
Gate Keys
Hip Waders
Plastic Trash Bags
Sealable Plastic Bags
Grab Pole
Clean Secondary Container(s)
Field Measurement Equipment
New Powder-Free Nitrile Gloves
Writing Utensils
Stop Watch
Camera
Blank Water
2.1.1 Bottle Order/Preparation
Sample container orders will be placed with the appropriate analytical laboratory at least two weeks prior
to each sampling event. Containers will be ordered for all water samples, including quality control
samples, as well as extra containers in case the need arises for intermediate containers or a replacement.
The containers must be the proper type and size and contain preservative as appropriate for the specified
laboratory analytical methods.
Table B-4 presents the proper container type, volume, and immediate processing and storage needs. The
field crew must inventory sample containers upon receipt from the laboratory to ensure that adequate
containers have been provided to meet analytical requirements for each monitoring event. After each
event, any bottles used to collect water samples will be cleaned by the laboratory and either picked up by
or shipped to the field crew.

Page B-27
2.1.2 Container Labeling and Sample Identification Scheme
All samples will be identified with a unique identification code to ensure that results are properly reported
and interpreted. Samples will be identified such that the site, sampling location, matrix, sampling
equipment and sample type (i.e., environmental sample or QC sample) can be distinguished by a data
reviewer or user. Sample identification codes will consist of a site identification code, a matrix code, and
a unique sample identification code. The format for sample identification codes is SM- ###.# - AAAA -
XXX, where:
SM indicates that the sample was collected as part of the SMB JG7 WMP Group CIMP.
###- identifies the sequentially numbered monitoring event, and the # is an optional indicator for
re-samples collected for the same event. Sample events are numbered from 001 to 999 and will
not be repeated.
AAAA indicates the unique site ID for each site.
XXX identifies the sample number unique to a sample bottle collected for a single event. Sample
bottles are numbered sequentially from 001 to 999 and will not be repeated within a single event.
Alternatively, if the above naming convention is not employed, the selected alterative convention will be
consistent between sampling events and sampling stations.
Custom bottle labels should be produced using blank waterproof labels and labeling software. This
approach will allow the site and analytical constituent information to be entered in advance and printed as
needed prior to each monitoring event. Labels will be placed on the appropriate bottles in a dry
environment; applying labels to wet sample bottles should be avoided. Labels should be placed on sides
of bottles rather than on bottle caps. All sample containers will be pre-labeled before each sampling event
to the extent practicable. Pre-labeling sample containers simplifies field activities, leaving only sample
collection time and date and field crew initials to be filled out in the field. Labels should include the
following information:
Program Name
Station ID
Sample ID
Date
Collection Time
Sampling Personnel
Analytical Requirements
Preservative Requirements
Analytical Laboratory
2.1.3 Field Meter Calibration
Calibration of field measurement equipment is performed as described in the owner’s manuals for each
individual instrument. Each individual field crew will be responsible for calibrating their field
measurement equipment. Field monitoring equipment must meet the requirements outlined in Table B-1
and be calibrated before field events based on manufacturer guidance, but at a minimum prior to each
event. Table B-7 outlines the typical field instrument calibration procedures for each piece of equipment
requiring calibration. Each calibration will be documented on each event’s calibration log sheet
(presented in Appendix D).
If calibration results do not meet manufacturer specifications, the field crew should first try to recalibrate
using fresh aliquots of calibration solution. If recalibration is unsuccessful, new calibration solution
should be used and/or maintenance should be performed. Each attempt should be recorded on the
equipment calibration log. If the calibration results cannot meet manufacturer’s specifications, the field
crew should use a spare field measuring device that can be successfully calibrated. If a spare field
measuring device that can be successfully calibrated is unavailable, field crews shall note the use of
unsuccessfully calibrated equipment on each appropriate field log sheet. Additionally, the SMB JG7
WMP Group should be notified.

Page B-28
Calibration should be verified using at least one calibration fluid within the expected range of field
measurements, both immediately following calibration and at the end of each monitoring day. Individual
parameters should be recalibrated if the field meters do not measure a calibration fluid within the range of
accuracy presented in Table B-1. Calibration verification documentation will be retained in the event’s
calibration verification log.

Page B-29
Table B-7 Calibration of Field Measurement Equipment
Equipment / Instrument
Calibration and Verification Description
Frequency of Calibration
Frequency of Calibration Verification
Responsible Party
pH Probe Calibration using standard buffer solutions. Use of mid-range buffer to verify successful calibration.
Day prior to or 1st day of sampling event
After calibration and at the end of each sampling day
Individual Sampling Crews
Temperature Is factory-set and requires no subsequent calibration.
Dissolved Oxygen Probe
Calibrated using water saturated air environment. DO measurement of water-saturated air will be performed and compared to a standard table of DO concentrations in water as a function of temperature and barometric pressure to verify successful calibration.
Conductivity Follow manufacturer’s specifications. Use of mid-range conductivity standard to verify successful calibration.
Turbidity Follow manufacturer’s specifications. Use of mid-range turbidity standard to verify successful calibration.
2.1.4 Weather Conditions
Monitoring will occur during dry and wet conditions. Dry weather will occur on days with less than 0.1
inch of rain and not within three days after a rain event of 0.1 inch or greater within the watershed, as
measured from the closest Los Angeles County controlled rain gauge to the SMB JG7 WMP Group area.
Wet weather will be defined as a storm event of greater than or equal to 0.1 inch of precipitation, as
determined by the closest Los Angeles County controlled rain gauge to the SMB JG7 WMP Group area.
Note that if rainfall begins after dry weather monitoring has been initiated, then dry weather monitoring
will be suspended and continued on a subsequent day when weather conditions meet the dry weather
conditions.
The MRP includes specific criteria for the time of monitoring events. For dry weather toxicity
monitoring, if triggered, sampling must take place during the historically driest month, which has been
determined to be the month of August.
The first significant rain event of the storm year (first flush) will be monitored. The targeted storm events
for wet weather sampling will be selected based on a reasonable probability that the events will result in
substantially increased flows over at least 12 hours. Sufficient precipitation is needed to produce runoff
and increase flow. The decision to sample a storm event will be made in consultation with weather
forecasting information services after a quantitative precipitation forecast (QPF) has been determined.
All efforts will be made to collect wet weather samples from all sites during a single targeted storm event.
However, safety or other factors may make it infeasible to collect samples from a given storm event. For
example, storm events that will require field crews to collect wet weather samples during holidays and/or
weekends may not be sampled due to sample collection or laboratory staffing constraints.

Page B-30
For a storm to be tracked, the event will have a predicted rainfall of at least 0.25 inches with at least a 70
percent probability of rainfall 24 hours prior to the forecasted time of initial rainfall. Subsequent storm
events must meet the tracking requirements, flow objectives, as well as be separated by a minimum of
three days of dry weather. Antecedent conditions will be based on the LACDPW rain gage listed in
Table B-8. Data can be obtained at http://dpw.lacounty.gov/wrd/Precip/index.cfm by clicking the ‘See
Data’ link in the “Near Real-Time Precipitation Map” section. The web page displays a map showing
real-time rainfall totals (in inches) for different rain gages. Although the default precipitation period is 24
hours, the user can view rainfall totals over different durations. Data from the rain gages is updated every
10 minutes. Because a significant storm event is based on predicted rainfall, it is recognized that this
monitoring may be triggered without 0.25 inches of rainfall actually occurring. In this case, the
monitoring event will still qualify as meeting this requirement provided that sufficient sample volume is
collected to do all required laboratory analysis. Documentation will be provided showing the predicted
rainfall amount.
Table B-8 Real-Time Rain Gage Used to Define Weather Conditions for CIMP Monitoring(1)
Rainfall Gage Operator Latitude Longitude
Fire Station 56 Rolling Hills (376)
Los Angeles County Department of Public Works
33°45'35.25"N 118°21'16"W
1Information for the gage can be found at http://dpw.lacounty.gov/wrd/Precip/alertlist.cfm.
The National Weather Service’s weather forecast for the SMB JG7 WMP Group area can be accessed on-
line at http://www.wrh.noaa.gov/lox/ then click on the location of the SMB JG7 WMP Group area on the
area map. From the forecast page, the link to “Quantitative Precipitation Forecast” provides forecasted
precipitation in inches for the next 24 hours, in 3-hour increments for the first 12 hours and in 6-hour
increments for the last 12 hours.
2.2 Sample Handling
Proper sample handling ensures the samples will comply with the monitoring methods and analytical hold
time and provides traceable documentation throughout the history of the sample.
2.2.1 Documentation Procedures
The SMB JG7 WMP Group is responsible for ensuring that each field sampling team adheres to proper
custody and documentation procedures. Field log sheets documenting sample collection and other
monitoring activities for each site will be bound in a separate master logbook for each event.
Alternatively, all measurements could be collected on an electronic device such as laptop or tablet
computer. Field personnel have the following responsibilities:
1. Keep an accurate written record of sample collection activities on the field log sheets.
2. Ensure that all field log sheet entries are legible and contain accurate and inclusive documentation
of all field activities.
3. Note errors or changes using a single line to cross out the entry and date and initial the change.
4. Ensure that a label is affixed to each sample collected and that the labels uniquely identify
samples with a sample ID, site ID, date and time of sample collection and the sampling crew
initials.
5. Complete the chain of custody forms accurately and legibly.

Page B-31
2.2.2 Field Documentation/Field Log
Field crews will keep a field log book for each sampling event that contains a calibration log sheet, a field
log sheet for each site, and appropriate contact information. Alternatively, all measurements could be
collected on an electronic device such as laptop or tablet computer. The following items should be
recorded on the field log sheet for each sampling event:
Monitoring station location (Station ID);
Date and time(s) of sample collection;
Name(s) of sampling personnel;
Sample collection depth;
Sample ID numbers and unique IDs for any replicate or blank samples;
QC sample type (if appropriate);
Requested analyses (specific parameters or method references);
Sample type (e.g., grab or composite);
The results of field measurements (e.g., flow, temperature, dissolved oxygen, pH, conductivity,
turbidity) and the time that measurements were made;
Qualitative descriptions of relevant water conditions (e.g., water color, flow level, clarity) or
weather (e.g., wind, rain) at the time of sample collection;
Trash observations (presence/absence);
A description of any unusual occurrences associated with the sampling event, particularly those
that may affect sample or data quality.
The field log will be scanned into a PDF within one week of the conclusion of each sampling event.
Alternatively, all measurements could be collected on an electronic device such as laptop or tablet
computer. Appendix D contains an example of the field log sheet.
2.2.3 Sample Handling and Shipment
The field crews will maintain custody of samples during each monitoring event. Chain-of-custody (COC)
forms will accompany all samples during shipment to contract laboratories to identify the shipment
contents. All water quality samples will be transported to the analytical laboratory by the field crew or by
courier. The original COC form will accompany the shipment, and a signed copy of the COC form will
be sent, typically via email or fax, by the laboratory to the field crew to be retained in the project file.
While in the field, samples will be stored on ice in an insulated container. Samples that must be shipped
to the laboratory must be examined to ensure that container lids are tight and placed on ice to maintain the
appropriate temperature. The ice packed with samples must be approximately 2 inches deep at the top
and bottom of the cooler, and must contact each sample to maintain temperature. The original COC
form(s) will be double-bagged in re-sealable plastic bags and either taped to the outside of the cooler or to
the inside lid. Samples must be shipped to the contract laboratory according to transportation standards.
The method(s) of shipment, courier name, and other pertinent information should be entered in the
“Received By” or “Remarks” section of the COC form.
Coolers must be sealed with packing tape before shipping, unless transported by field or lab personnel,
and must not leak. It is assumed that samples in tape-sealed ice chests are secure whether being
transported by common carrier or by commercial package delivery. The laboratory’s sample receiving
department will examine the shipment of samples for correct documentation, proper preservation and
compliance with holding times.

Page B-32
The following procedures are used to prevent bottle breakage and cross-contamination:
Bubble wrap or foam pouches are used to keep glass bottles from contacting one another to
prevent breakage, re-sealable bags will be used if available.
All samples are transported inside hard plastic coolers or other contamination-free shipping
containers.
If arrangements are not made in advance, the laboratory’s sample receiving personnel must be
notified prior to sample shipment.
All samples remaining after successful completion of analyses will be disposed of properly. It is the
responsibility of the personnel of each analytical laboratory to ensure that all applicable regulations are
followed in the disposal of samples or related chemicals. Samples will be stored and transported as noted
in Table B-4. Samples not analyzed locally will be sent on the same day that the sample collection
process is completed, if possible. Samples will be delivered to the appropriate laboratory as will be
indicated in Table B-9. Note that due to procurement procedures, the analytical laboratories have not
been identified at this time. Information for all laboratories will be added to this table following their
selection. All appropriate contacts will be listed along with lab certification information in Table B-9.
Table B-9 Information on Laboratories Conducting Analysis for the SMB JG7 WMP Group CIMP
Laboratory(1)
General
Category of Analysis
Shipping Method
Contact Phone Address Lab Certification No. & Expiration
Date(2)
Information for all laboratories will be added to this table following their selection and upon CIMP update.
Lab certifications are renewed on an annual basis.
2.2.4 Chain-of Custody Forms
Sample custody procedures provide a mechanism for documenting information related to sample
collection and handling. Sample custody must be traceable from the time of sample collection until
results are reported. A sample is considered under custody if:
It is in actual possession.
It is in view after in physical possession.
It is placed in a secure area (accessible by or under the scrutiny of authorized personnel only after
in possession).
A COC form must be completed after sample collection and prior to sample shipment or release. The
COC form, sample labels, and field documentation will be cross-checked to verify sample identification,
type of analyses, number of containers, sample volume, preservatives, and type of containers. A complete
COC form is to accompany the transfer of samples to the analyzing laboratory. A typical COC form is
presented in Appendix D.
2.2.5 Laboratory Custody Procedures
Laboratories will follow sample custody procedures as outlined in the laboratory’s Quality Assurance
(QA) Manual. A copy of each contract laboratory’s QA Manual should be available at the laboratory

Page B-33
upon request. Laboratories shall maintain custody logs sufficient to track each sample submitted and to
analyze or preserve each sample within specified holding times. The following sample control activities
must be conducted at the laboratory:
Initial sample login and verification of samples received with the COC form;
Document any discrepancies noted during login on the COC;
Initiate internal laboratory custody procedures;
Verify sample preservation (e.g., temperature);
Notify the SMB JG7 WMP Group if any problems or discrepancies are identified; and,
Perform proper sample storage protocols, including daily refrigerator temperature monitoring and
sample security.
Laboratories shall maintain records to document that the above procedures are followed. Once samples
have been analyzed, samples will be stored at the laboratory for at least 60 days. After this period,
samples may be disposed of properly.
2.3 Field Protocols
Briefly, the key aspects of quality control associated with field protocols for sample collection for
eventual chemical and toxicological analyses are as follows:
1. Field personnel will be thoroughly trained in the proper use of sample collection gear and will be
able to distinguish acceptable versus unacceptable water samples in accordance with pre-
established criteria.
2. Field personnel will be thoroughly trained to recognize and avoid potential sources of sample
contamination (e.g., engine exhaust, ice used for cooling).
3. Sampling gear and utensils which come in direct contact with the sample will be made of non-
contaminating materials (e.g., borosilicate glass, high-quality stainless steel and/or Teflon™,
according to protocol) and will be thoroughly cleaned between sampling stations according to
appropriate cleaning protocol (rinsing thoroughly at minimum).
4. Sample containers will be of the recommended type and will be free of contaminants (i.e., pre-
cleaned).
5. Conditions for sample collection, preservation, and holding times will be followed.
Field crews will be comprised of a minimum of two persons per crew.. To ensure safety, field crews will
have the PPE. Other constraints on sampling events include, but are not limited to, lab closures and
toxicity testing organism availability. Sampling events should proceed in the following manner:
1. Before leaving the sampling crew base of operations, confirm number and type of sample
containers as well as the complete equipment list.
2. Proceed to the first sampling site.
3. Fill-out the general information on the field log sheet.
4. Collect the environmental and quality assurance/quality control (QA/QC) samples indicated on
the event summary sheet and store samples appropriately. Using the field log sheet, confirm that
all appropriate containers were filled.
5. Collect field measurements and observations, and record these on the field log sheet.
6. Repeat the procedures in steps 3, 4, and 5 for each of the remaining sampling sites.
7. Complete the COC forms using the information on the field log sheets.
8. After sample collection is completed, deliver and/or ship samples to appropriate laboratory.
Page B-34
2.4 Sample Collection
All samples will be collected in a manner appropriate for the specific analytical methods to be used. The
proper sampling techniques, outlined in this section, will ensure that the collected samples are
representative of the waterbodies sampled. Should field crews feel that it is unsafe to collect samples for
any reason, the field crews SHOULD NOT COLLECT a sample and note on the field log that the
sample was not collected, why the sample was not collected, and provide photo documentation, if
feasible.
2.4.1 Overview of Sampling Techniques
As described below, the method used to collect water samples is dependent on the depth, flow, and
sampling location (receiving water, outfall). Nonetheless, in all cases:
1. Throughout each sample collection event, the sampler should exercise aseptic techniques (i.e., do
not touch the inner surfaces or lip edges of the sample bottle or cap).
2. The sampler should use clean, powder-free, nitrile gloves for each site to prevent contamination.
3. When collecting the sample, the sampler should not breathe, sneeze, or cough in the direction of
the container.
4. Gloves should be changed if they are soiled, or if the potential for cross-contamination exists
from handling sampling materials or samples.
5. While the sample is collected, the bottle lid shall not be placed on the ground.
6. The sampler should not eat or drink during sample collection.
7. The sampler should not smoke during sample collection.
8. Each person on the field crew should wear clean clothing that is free of dirt, grease, or other
substances that could contaminate the sampling apparatus or sample bottles.
9. Sampling should not occur near a running vehicle. Vehicles should not be parked within the
immediate sample collection area, when possible, even non-running vehicles.
10. When the sample is collected, ample air space should be left in the bottle to facilitate mixing by
shaking for lab analysis, unless otherwise required by the method.
11. After the sample is collected and the cap is tightly screwed back on the bottle, the time of
sampling should be recorded on the field log sheet.
12. Any QA/QC samples that are collected should be also be noted on the field log sheet and labeled
according the convention described in Section 2.1 of this Attachment.
13. Samples should be stored as previously described.
14. COC forms should be filled out as described in Section 2.2 of this Attachment and delivered to
the appropriate laboratory as soon as feasible to ensure hold times are met.
To prevent contamination of samples, clean metal sampling techniques using USEPA protocols outlined
in USEPA Method 16697 will be used throughout all phases of the water sample collection. The protocol
for clean metal sampling, based on USEPA Method 1669, is summarized below:
1. Samples are collected in rigorously pre-cleaned sample bottles with any tubing specially
processed to clean sampling standards.
2. At least two persons, wearing clean, powder-free nitrile or latex gloves at all times, are required
on a sampling crew.
7 USEPA. April 1995. Method 1669: Sampling Ambient Water for Trace Metals at EPA Water Quality Criteria
Levels. EPA 821-R-95-034.

Page B-35
3. One person, referred to as “dirty hands”, opens only the outer bag of all double-bagged sample
bottles.
4. The other person, referred to as “clean hands”, reaches into the outer bag, opens the inner bag and
removes the clean sample bottle.
5. Clean hands rinses the bottle at least two times by submerging the bottle, removing the bottle lid,
filling the bottle approximately one-third full, replacing the bottle lid, gently shaking and then
emptying the bottle. Clean hands then collects the sample by submerging the bottle, removing
the lid, filling the bottle and replacing the bottle cap while the bottle is still submerged.
6. After the sample is collected, the sample bottle is double-bagged in the opposite order from which
it was removed from the same double-bagging.
7. Clean, powder-free gloves are changed whenever something not known to be clean has been
touched.
2.4.2 Field Measurements and Observations
Field measurements will be collected and observations made at each sampling site during sample
collection. Field measurements will include the parameters identified in the CIMP for which a laboratory
analysis is not being conducted. Field monitoring equipment must meet the requirements outlined in
Table B-3. All field measurement results and field observations will be recorded on a field log sheet
similar to the one presented in Appendix D and as described in Section 2.2 of this Attachment.
Measurements (except for flow) will be collected at approximately mid-stream, mid-depth at the location
of greatest flow (if feasible) with a Hydrolab DS4 multi-probe meter, or comparable instrument(s). If at
any time the collection of field measurements by wading appears to be unsafe, field crews will not
attempt to collect mid-stream, mid-depth measurements. Rather, field measurements will be made either
directly from a stable, unobstructed area at the channel edge, or by using a telescoping pole and
intermediate container to obtain a sample for field measurements and for filling sample containers. For
situations where flows are not sufficiently deep to submerge the probes, an intermediate container will be
utilized. The location of field measurements will be documented on the field log sheet.
Flow measurements will be collected as outlined in the following subsections at freshwater receiving
water and non-stormwater outfall monitoring sites. Regardless of measurement technique used, if a staff
gage is present the gage height will be noted. Field crews may not be able to measure flow at several sites
during wet weather because of inaccessibility of the site. If this is the case, site inaccessibility will be
documented on the field log sheet.
The field sampling crew has the primary responsibility for responding to failures in the sampling or
measurement systems. Deviations from established monitoring protocols will be documented in the
comment section of the field log sheet and noted in the post event summaries. If monitoring equipment
fails, monitoring personnel will report the problem in the notes section of the field log sheet and will not
record data values for the variables in question. Broken equipment will be replaced or repaired prior to
the next field use. Data collected using faulty equipment will not be used.
2.4.2.1 Velocity Meter Flow Measurements
For sampling sites where water is deep enough (>0.1-foot) a velocity meter will be utilized. For these
cases, velocity will be measured at approximately equal increments across the width of the flowing water
using a Marsh-McBirney Flo-Mate® velocity meter8 or equivalent, which uses an electromagnetic
velocity sensor. A “flow pole” will be used to measure the water depth at each measurement point and to
properly align the sensor so that the depth of each velocity measurement is approximately equal to 0.6 *
8 For more information, see http://marsh-mcbirney.com/Products/2000.htm

Page B-36
total depth, which is representative of the average velocity. The distance between velocity measurements
taken across the stream is dependent on the total width. No more than 10% of the flow will pass through
any one cross section.
2.4.2.2 Shallow Sheet Flow Measurements
If the depth of flow does not allow for the measurement of flow with a velocity meter (<0.1-foot) a
“float” will be used to measure the velocity of the flowing water. The width, depth, velocity, cross
section, and corresponding flow rate will be estimated as follows:
Sheet flow width: The width (W) of the flowing water (not the entire part of the channel that is
damp) is measured at the “top”, “middle”, and “bottom” of a marked-off distance – generally 10
feet (e.g., for a 10-foot marked-off section, TopW TopW is measured at 0-feet, MidW MidW is
measured at 5 feet, and is measured at 10 feet).
Sheet flow depth: The depth of the sheet flow is measured at the top, middle, and bottom of the
marked-off distance. Specifically, the depth (D) of the sheet flow is measured at 25%, 50%, and
75% of the flowing width (e.g., MidD %50
MidD %50 is the depth of the water at middle of the section in the
middle of the sheet flow) at each of the width measurement locations. It is assumed that the
depth at the edge of the sheet flow (i.e., at 0% and 100% of the flowing width) is zero.
Representative cross-section: Based on the collected depth and width measurements, the
representative cross-sectional area across the marked-off sheet flow is approximated as follows:
}
{
)]2222
(4
[
)],2222
(4
[
)],2222
(4
[
Re
%75%50%75%25%50%25
%75%50%75%25%50%25
%75%50%75%25%50%25
BottomBottomBottomBottomBottomBottom
Bottom
MidMidMidMidMidMid
Mid
TopTopTopTopTopTopTop
DDDDDDW
DDDDDDW
DDDDDDWAverage
SectionCrossvepresentati
}
{
)]2222
(4
[
)],2222
(4
[
)],2222
(4
[
Re
%75%50%75%25%50%25
%75%50%75%25%50%25
%75%50%75%25%50%25
BottomBottomBottomBottomBottomBottom
Bottom
MidMidMidMidMidMid
Mid
TopTopTopTopTopTopTop
DDDDDDW
DDDDDDW
DDDDDDWAverage
SectionCrossvepresentati
Sheet flow velocity: Velocity is calculated based on the amount of time it took a float to travel
the marked-off distance (typically 10-feet or more). Floats are normally pieces of leaves, litter, or
floatables (suds, etc.). The time it takes the float to travel the marked-off distance is measured at
least three times. Then average velocity is calculated as follows:
Average Surface Velocity = Distance Marked off for Float Measurement
Average Time for Float to Travel Marked off Distance
BottomW BottomW

Page B-37
Flow Rate calculation: For sheet flows, based on the above measurements/estimates, the
estimated flow rate, Q, is calculated by:
Q = f x (Representative Cross Section) x (Average Surface Velocity)
The coefficient f is used to account for friction effects of the channel bottom. That is, the float travels on
the water surface, which is the most rapidly-traveling portion of the water column. The average velocity,
not the surface velocity, determines the flow rate, and thus f is used to “convert” surface velocity to
average velocity. In general, the value of f typically ranges from 0.60 – 0.90 (USGS 1982). Based on
flow rate measurements taken during the LA River Bacteria Source Identification Study (CREST 2008) a
value of 0.75 will be used for f.
2.4.2.3 Free-flowing outfalls
Some storm drain outfalls are free-flowing, meaning the runoff falls from an elevated outfall into the
channel, which allows for collection of the entire flowing stream of water into a container of known
volume (e.g., graduated bucket or graduated Ziploc bag). The time it takes to fill the known volume is
measured using a stopwatch, and recorded on the field log. The time it takes to fill the container will be
measured three times and averaged to ensure that the calculated discharge is representative. In some
cases, a small portion of the runoff may flow around or under the container. For each measurement,
“percent capture”, or the proportion of flow estimated to enter the bucket, will be recorded. For free-
flowing outfalls, the estimated flow rate, Q, is calculated by:
])()(
[CaptureEstimatedContainerFilltoTime
VolumecontainerFilledAverageQ
])()(
[CaptureEstimatedContainerFilltoTime
VolumecontainerFilledAverageQ
Based on measurements of free-flowing outfalls during the LA River Bacteria Source Identification Study
(CREST, 2008), estimated capture typically ranges from 0.75 – 1.0.
2.4.3 Sampling Techniques for the Collection of Water
The following subsections provide details on the various techniques that can be utilized to collect water
quality samples. Should field crews feel that it is unsafe to collect samples for any reason, the field crews
SHOULD NOT COLLECT a sample and note on the field log that the sample was not collected, why
the sample was not collected, and provide photo documentation, if feasible.
2.4.3.1 Direct Submersion: Hand Technique
Where practical, all grab samples will be collected by direct submersion at mid-stream, mid-depth using
the following procedures:
1. Follow the standard sampling procedures described in Section 2.4.1 of this Attachment.
2. Remove the lid, submerge the container to mid-stream/mid-depth, let the container fill and secure
the lid. In the case of mercury samples, remove the lid underwater to reduce the potential for
contamination from the air.
3. Place the sample on ice.

Page B-38
4. Collect the remaining samples including quality control samples, if required, using the same
protocols described above.
5. Follow the sample handling procedures described in Section 2.2 of this Attachment.
2.4.3.2 Intermediate Container Technique
Samples may be collected with the use of a clean intermediate container, if necessary, following the steps
listed below. An intermediate container may include a container that is similar in composition to the
sample container, a pre-cleaned pitcher made of the same material as the sample container, or a Ziploc
bag. An intermediate container should not be reused at a different site without appropriate cleaning.
1. Follow the standard sampling procedures described in Section 2.4.1 of this Attachment.
2. Submerge the intermediate container to mid-stream/mid-depth (if possible), let the container fill,
and quickly transfer the sample into the individual sample container(s) and secure the lid(s).
3. Place the sample(s) on ice.
4. Collect remaining samples including quality control samples, if required, using the same
protocols described above.
5. Follow the sample handling procedures described in Section 2.2 of this Attachment.
Some flows may be too shallow to fill a container without using an intermediate container. When
collecting samples from shallow sheet flows it is very important to not scoop up algae, sediment, or other
particulate matter on the bottom because such debris is not representative of flowing water. To prevent
scooping up such debris either: (1) find a spot where the bottom is relatively clean and allow the sterile
intermediate container to fill without scooping; or (2) lay a clean sterile Ziploc® bag on the bottom and
collect the water sample from on top of the bag. A fresh Ziploc® bag must be used at each site.
2.4.3.3 Pumping
Samples may be collected with the use of a peristaltic pump and specially cleaned tubing following the
steps listed below. Sample tubing should not be reused at a different site without appropriate cleaning.
1. Follow the standard sampling procedures described in Section 2.4.1 of this Attachment.
2. Attach pre-cleaned tubing into the pump, exercising caution to avoid allowing tubing ends to
touch any surface known not to be clean. A separate length of clean tubing must be used at each
sample location for which the pump is used.
3. Place one end of the tubing below the surface of the water. To the extent possible, avoid placing
the tubing near the bottom so that settled solids are not pumped into the sample container.
4. Hold the other end of the tubing over the opening of the sample container, exercising care not to
touch the tubing to the sample container.
5. Pump the necessary sample volume into the sample container and secure the lid.
6. Place the sample on ice.
7. Collect remaining samples including quality control samples, if required, using the same
protocols described above.
8. Follow the sample handling procedures described in Section 2.2 of this Attachment.
2.4.3.4 Autosamplers
Automatic sample compositors (autosamplers) are used to characterize the entire flow of a storm in one
analysis. They can be programmed to take aliquots at either time- or flow-based specified intervals.
Before beginning setup in the field, it is recommended to read the manufacturer’s instructions. The
general steps to set up the autosampler are described below:

Page B-39
1. Connect power source to autosampler computer. This can be in the form of a battery or a power
cable.
2. Install pre-cleaned tubing into the pump. Clean tubing will be used at each site and for each
event, in order to minimize contamination.
3. Attach strainer to intake end of the tubing and install in sampling channel.
4. If running flow based composite samples; install flow sensor in sampling channel and connect it
to the automatic compositor.
5. Label and install composite bottle(s). If sampler is not refrigerated, then add enough ice to the
composite bottle chamber to keep sample cold for the duration of sampling or until such time as
ice can be refreshed. Make sure not to contaminate the inside of the composite bottle with any of
the ice.
6. Program the autosampler as per the manufacturer’s instructions and make sure the autosampler is
powered and running before leaving the site.
After the sample collection is completed the following steps must be taken to ensure proper sample
handling:
1. Upon returning to the site, check the status of the autosampler and record any errors or missed
samples. Note on the field log the time of the last sample, as this will be used for filling out the
COCs.
2. Remove the composite bottle and store on ice. If dissolved metals are required, then begin the
sample filtration process outlined in the following subsection, within 15 minutes of the last
composite sample, unless compositing must occur at another location, in which case the filtration
process should occur as soon as possible upon sample compositing.
3. Power down autosampler and leave sampling site.
4. The composite sample will need to be split into the separate analysis bottles either before being
shipped to the laboratory or at the laboratory. This is best done in a clean and weatherproof
environment, using clean sampling technique.
2.4.3.5 Dissolved Metals Field Filtration
Samples for dissolved metals will be filtered by the laboratory, or in the event samples for dissolved
metals are required to be filtered in the field, the following method for dissolved field filtration will be
conducted. A peristaltic pump or 50mL plastic syringe with a 0.45µm filter attached will be used to
collect and filter the dissolved metals sample in the field. The apparatus will either come certified pre-
cleaned from the manufacturer and confirmed by the analytical laboratory or be pre-cleaned by and
confirmed by the analytical laboratory at least once per year. The apparatus will be double bagged in
Ziploc plastic bags. Alternative an equivalent method may be utilized, if necessary.
To collect the sample for dissolved metals, first collect the total metals sample using clean sampling
techniques. The dissolved sample will be taken from this container. Immediately prior to collecting the
dissolved sample, shake the total metals sample. To collect the dissolved metals sample using clean
sampling techniques, remove the syringe from the bag and place the tip of the syringe into the bottle
containing the total metals sample and draw up 50 mL of sample into the syringe. Next, remove the filter
from the zip-lock bag and screw it tightly into the tip of the syringe. Then put the tip of the syringe with
the filter into the clean dissolved metals container and push the sample through the filter taking care not to
touch the inside surface of the sample container with the apparatus. The sample volume needs to be a
minimum of 20 mL. If the filter becomes clogged prior to generating 20 mL of sample, remove and
dispose of the used filter and replace it with a new clean filter (using the clean sampling techniques).

Page B-40
Continue to filter the sample. When 20 mL has been collected, cap the sample bottle tightly and store on
ice for delivery to the laboratory.
2.4.4 Receiving Water Sample Collection
A grab sample is a discrete individual sample. A composite sample is a mixture of samples collected over
a period of time either as time or flow weighted. A time-weighted composite is created by mixing
multiple aliquots collected at specified time intervals. A flow-weighted composite is created by mixing
multiple aliquots collected at equal time intervals but where the volume of the aliquot is based on flow
rate. Generally, grab samples will be collected during dry weather and composite samples will be
collected during wet weather. Should field crews feel that it is unsafe to collect samples for any reason,
the field crews SHOULD NOT COLLECT a sample and note on the field log that the sample was not
collected, why the sample was not collected, and provide photo documentation, if feasible.
Grab samples will be used for dry weather sampling events, if triggered, because the composition of the
receiving water will change less over time; and thus, the grab sample can sufficiently characterize the
receiving water. Grab samples will be collected as described in Section 2.4.3 of this Attachment.
Monitoring site configuration and consideration of safety will dictate grab sample collection technique.
The potential exists for monitoring sites to lack discernable flow. The lack of discernable flow may
generate unrepresentative data. To address the potential confounding interference that can occur under
such conditions, sites sampled should be assessed for the following conditions and sampled or not
sampled accordingly:
Pools of water with no flow or no visible connection to another surface water body should not be
sampled. The field log should be completed for non-water quality data (including date and time
of visit) and the site condition should be photo-documented.
Flowing water (i.e., based on visual observations, flow measurements, and a photo-documented
assessment of conditions immediately upstream and downstream of the sampling site) site should
be sampled.
Wet weather receiving water samples collected from the Santa Monica Bay by boat will be single grab
sample.
It is the combined responsibility of all members of the sampling crew to determine if the performance
requirements of the specific sampling method have been met, and to collect additional samples if
required. If the performance requirements outlined above or documented in sampling protocols are not
met, the sample will be re-collected. If contamination of the sample container is suspected, a fresh sample
container will be used. The SMB JG7 WMP Group will be contacted if at any time the sampling crew
has questions about procedures or issues based on site-specific conditions.
2.4.5 Stormwater Outfall Sample Collection
Wet weather samples will generally be collected by a continuous sampler as either time- or flow-weighted
composites at outfalls. Grab samples may be utilized to collect wet weather samples in certain situations,
which may include, but are not limited to, situations where it is unsafe to collect composite samples or to
perform investigative monitoring where composite sampling or installation of an auto-sampler may not be
warranted. Sampling will not be undertaken if the outfalls are not flowing or if conditions exist where the
receiving water is back-flowing into the outfall. It is the combined responsibility of all members of the
sampling crew to determine if the performance requirements of the specific sampling method have been
met, and to collect additional samples if required. If the performance requirements outlined above or
documented in sampling protocols are not met, the sample will be re-collected. If contamination of the
sample container is suspected, a fresh sample container will be used. The SMB JG7 WMP Group will be

Page B-41
contacted if at any time the sampling crew has questions about procedures or issues based on site-specific
conditions.
2.4.6 Non-Stormwater Outfall Screening Surveys and Sample Collection
The outfall screening process is designed to identify outfalls that have significant non-stormwater (NSW)
discharges. The collection of water quality data will support the determination of significant NSW
discharges as well as to characterize dry weather loading.
Preparation for Outfall Surveys
Preparation for outfall surveys includes preparation of field equipment, placing bottle orders, and
contacting the necessary personnel regarding site access and schedule. The following steps should be
completed two weeks prior to each outfall survey:
1. Check weather reports and LACDPW rain gage to ensure that antecedent dry weather conditions
are suitable.
2. Contact appropriate Flood Maintenance Division personnel from LACDPW to notify them of
dates and times of any activities in flood control channels.
3. Contact laboratories to order bottles and to coordinate sample pick-ups.
4. Confirm scheduled sampling date with field crews.
5. Set-up sampling day itinerary including sample drop-offs and pick-ups.
6. Compile field equipment.
7. Prepare sample labels.
8. Prepare event summaries to indicate the type of field measurements, field observations, and
samples to be taken at each of the outfalls.
9. Prepare COCs.
10. Charge the batteries of field tablets (if used).
2.4.6.1 Non-Stormwater Sample Collection
Water quality samples will be collected consistent with the dry weather requirements outlined in the
receiving water monitoring section using the direct submersion, intermediate container, shallow sheet
flow, or pumping methods described in Section 2.4.3 of this Attachment.
2.4.7 Stormborne Sediment Collection
No sediment collection sampling would be conducted under this program in the receiving waters as data
from Santa Monica Canyon, as part of the JG2JG3 CIMP, will be evaluated for TMDL compliance.
2.4.8 Bioaccumulation Sample Collection
No bioaccumulation sampling will be conducted under this program.
2.4.9 Trash Monitoring
The SMB JG7 WMP Group members are implementing the Santa Monica Marine Debris TMDLs
through the installation of full capture devices. As such, no specific monitoring is required or will be
conducted for the Marine Debris TMDLs for these jurisdictions.

Page B-42
2.4.10 Plastic Pellet Monitoring
Manufacturers of plastic pellets were not identified within any of the SMB JG7 WMP Group’s
jurisdictional area, and monitoring for plastic pellets at the MS4 is not required. Appropriate actions for
emergency spills and special circumstances for safety considerations are addressed for each jurisdiction.
2.4.11 Quality Control Sample Collection
Quality control samples will be collected in conjunction with representative samples to verify
data quality. Quality control samples collected in the field will generally be collected in the
same manner as environmental samples. Detailed descriptions of quality control samples are
presented in Section 3 of this Attachment.
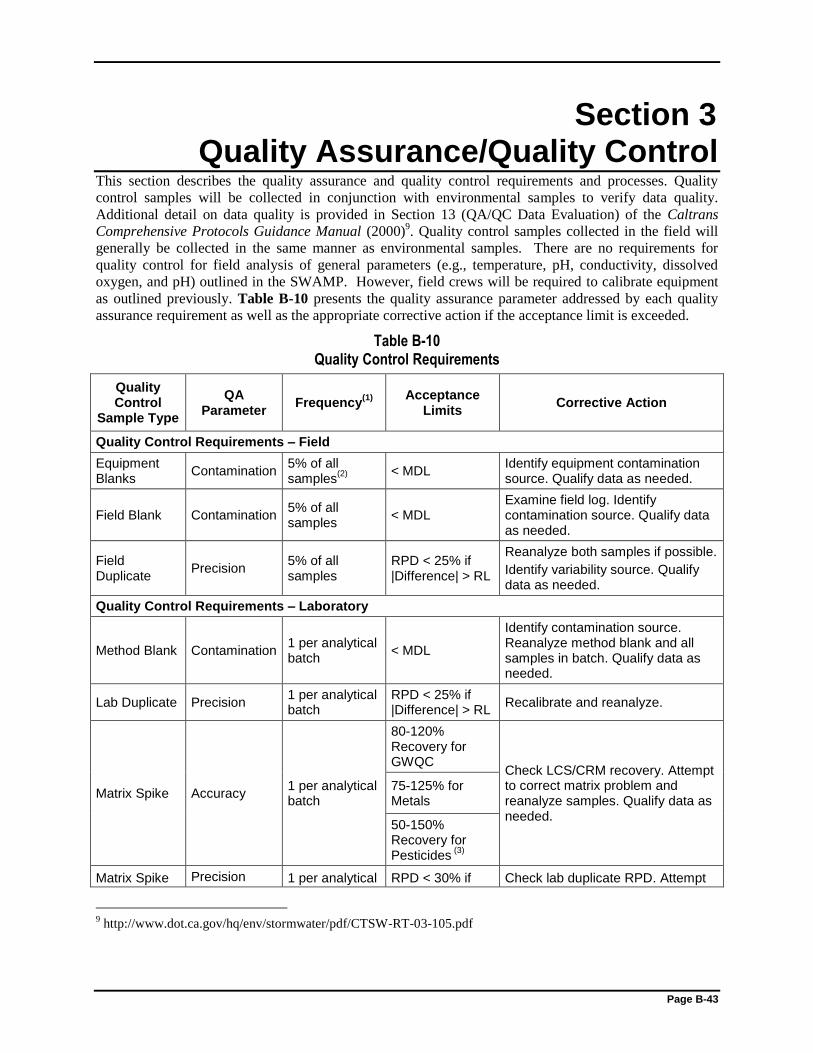
Page B-43
Section 3 Quality Assurance/Quality Control
This section describes the quality assurance and quality control requirements and processes. Quality
control samples will be collected in conjunction with environmental samples to verify data quality.
Additional detail on data quality is provided in Section 13 (QA/QC Data Evaluation) of the Caltrans
Comprehensive Protocols Guidance Manual (2000)9. Quality control samples collected in the field will
generally be collected in the same manner as environmental samples. There are no requirements for
quality control for field analysis of general parameters (e.g., temperature, pH, conductivity, dissolved
oxygen, and pH) outlined in the SWAMP. However, field crews will be required to calibrate equipment
as outlined previously. Table B-10 presents the quality assurance parameter addressed by each quality
assurance requirement as well as the appropriate corrective action if the acceptance limit is exceeded.
Table B-10 Quality Control Requirements
Quality Control
Sample Type
QA Parameter
Frequency(1)
Acceptance
Limits Corrective Action
Quality Control Requirements – Field
Equipment Blanks
Contamination 5% of all samples
(2)
< MDL Identify equipment contamination source. Qualify data as needed.
Field Blank Contamination 5% of all samples
< MDL Examine field log. Identify contamination source. Qualify data as needed.
Field Duplicate
Precision 5% of all samples
RPD < 25% if |Difference| > RL
Reanalyze both samples if possible.
Identify variability source. Qualify data as needed.
Quality Control Requirements – Laboratory
Method Blank Contamination 1 per analytical batch
< MDL
Identify contamination source. Reanalyze method blank and all samples in batch. Qualify data as needed.
Lab Duplicate Precision 1 per analytical batch
RPD < 25% if |Difference| > RL
Recalibrate and reanalyze.
Matrix Spike Accuracy 1 per analytical batch
80-120% Recovery for GWQC
Check LCS/CRM recovery. Attempt to correct matrix problem and reanalyze samples. Qualify data as needed.
75-125% for Metals
50-150% Recovery for Pesticides
(3)
Matrix Spike Precision 1 per analytical RPD < 30% if Check lab duplicate RPD. Attempt
9 http://www.dot.ca.gov/hq/env/stormwater/pdf/CTSW-RT-03-105.pdf
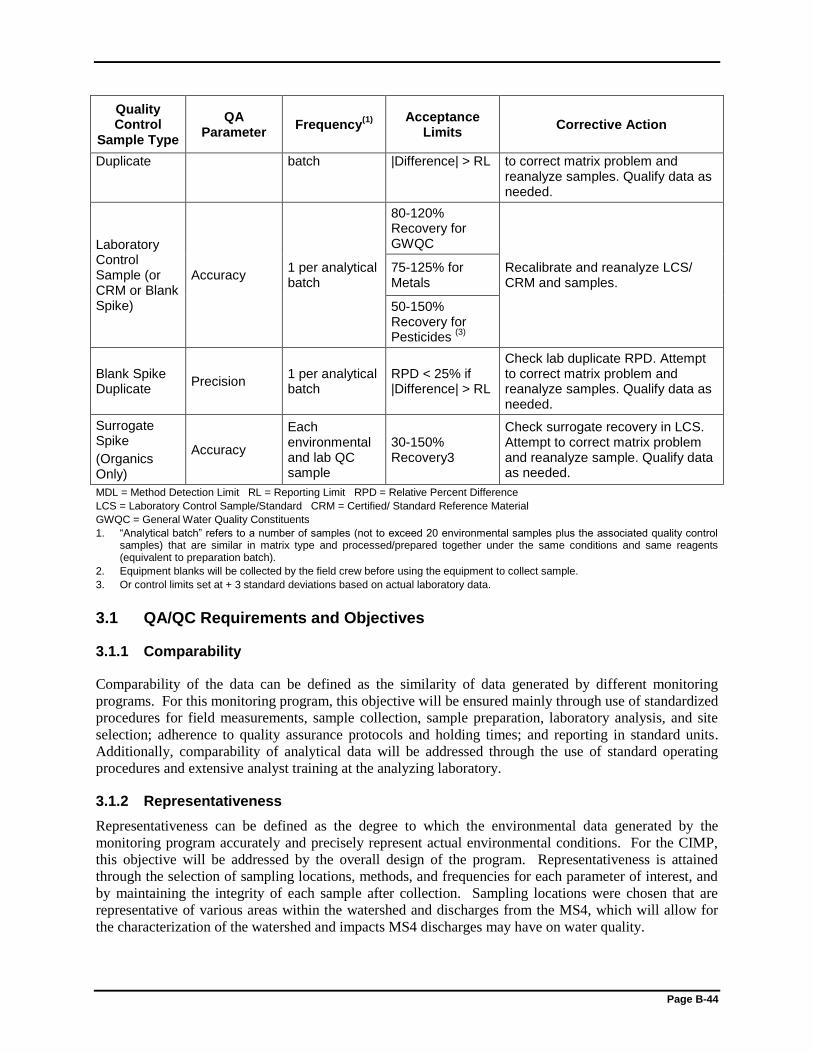
Page B-44
Quality Control
Sample Type
QA Parameter
Frequency(1)
Acceptance
Limits Corrective Action
Duplicate batch |Difference| > RL to correct matrix problem and reanalyze samples. Qualify data as needed.
Laboratory Control Sample (or CRM or Blank Spike)
Accuracy 1 per analytical batch
80-120% Recovery for GWQC
Recalibrate and reanalyze LCS/ CRM and samples.
75-125% for Metals
50-150% Recovery for Pesticides
(3)
Blank Spike Duplicate
Precision 1 per analytical batch
RPD < 25% if |Difference| > RL
Check lab duplicate RPD. Attempt to correct matrix problem and reanalyze samples. Qualify data as needed.
Surrogate Spike
(Organics Only)
Accuracy
Each environmental and lab QC sample
30-150% Recovery3
Check surrogate recovery in LCS. Attempt to correct matrix problem and reanalyze sample. Qualify data as needed.
MDL = Method Detection Limit RL = Reporting Limit RPD = Relative Percent Difference
LCS = Laboratory Control Sample/Standard CRM = Certified/ Standard Reference Material
GWQC = General Water Quality Constituents
1. “Analytical batch” refers to a number of samples (not to exceed 20 environmental samples plus the associated quality control samples) that are similar in matrix type and processed/prepared together under the same conditions and same reagents (equivalent to preparation batch).
2. Equipment blanks will be collected by the field crew before using the equipment to collect sample.
3. Or control limits set at + 3 standard deviations based on actual laboratory data.
3.1 QA/QC Requirements and Objectives
3.1.1 Comparability
Comparability of the data can be defined as the similarity of data generated by different monitoring
programs. For this monitoring program, this objective will be ensured mainly through use of standardized
procedures for field measurements, sample collection, sample preparation, laboratory analysis, and site
selection; adherence to quality assurance protocols and holding times; and reporting in standard units.
Additionally, comparability of analytical data will be addressed through the use of standard operating
procedures and extensive analyst training at the analyzing laboratory.
3.1.2 Representativeness
Representativeness can be defined as the degree to which the environmental data generated by the
monitoring program accurately and precisely represent actual environmental conditions. For the CIMP,
this objective will be addressed by the overall design of the program. Representativeness is attained
through the selection of sampling locations, methods, and frequencies for each parameter of interest, and
by maintaining the integrity of each sample after collection. Sampling locations were chosen that are
representative of various areas within the watershed and discharges from the MS4, which will allow for
the characterization of the watershed and impacts MS4 discharges may have on water quality.

Page B-45
3.1.3 Completeness
Data completeness is a measure of the amount of successfully collected and validated data relative to the
amount of data planned to be collected for the project. It is usually expressed as a percentage value. A
project objective for percent completeness is typically based on the percentage of the data needed for the
program or study to reach valid conclusions.
Because the CIMP is intended to be a long term monitoring program, data that are not successfully
collected during a specific sample event will not be recollected at a later date. Rather subsequent events
conducted over the course of the monitoring will provide robust data sets to appropriately characterize
conditions at individual sampling sites and the watershed in general. For this reason, most of the data
planned for collection cannot be considered absolutely critical, and it is difficult to set a meaningful
objective for data completeness.
However, some reasonable objectives for data are desirable, if only to measure the effectiveness of the
program when conditions allow for the collection of samples (i.e., flow is present). The program goals
for data completeness, shown in Table B-3, are based on the planned sampling frequency, SWAMP
recommendations, and a subjective determination of the relative importance of the monitoring element
within the CIMP. If, however, sampling sites do not allow for the collection of enough samples to
provide representative data due to conditions (i.e., no flow) alternate sites will be considered. Data
completeness will be evaluated on a yearly basis.
3.2 QA/QC Field Procedures
Quality control samples to be prepared in the field will consist of equipment blanks, field blanks, and
field duplicates as described below.
3.2.1 Equipment Blanks
The purpose of analyzing equipment blanks is to demonstrate that sampling equipment is free from
contamination. Equipment blanks will be collected by the analytical laboratory responsible for cleaning
equipment and analyzed for relevant pollutants before sending the equipment to the field crew.
Equipment blanks will consist of laboratory-prepared blank water (certified to be contaminant-free by the
laboratory) processed through the sampling equipment that will be used to collect environmental samples.
The equipment blanks will be analyzed using the same analytical methods specified for environmental
samples. If any analytes of interest are detected at levels greater than the MDL, the source(s) of
contamination will be identified and eliminated (if possible), the affected batch of equipment will be re-
cleaned, and new equipment blanks will be prepared and analyzed before the equipment is returned to the
field crew for use.
3.2.2 Field Blanks
The purpose of analyzing field blanks is to demonstrate that sampling procedures do not result in
contamination of the environmental samples. Per the Quality Assurance Management Plan for SWAMP
(SWRCB, 2008) field blanks are to be collected as follows:
At a frequency of 5% of samples collected for the following constituents: trace metals in water
(including mercury), VOC samples in water and sediment, DOC samples in water, and bacteria
samples.
Field blanks for other media and analytes should be conducted upon initiation of sampling, and if
field blank performance is acceptable (as described in Table B-10), further collection and
analysis of field blanks for these other media and analytes need only be performed on an as-
needed basis, or during field performance audits. An as-needed basis for the SMB JG7 WMP

Page B-46
Group CIMP will be annually.
Field blanks will consist of laboratory-prepared blank water (certified to be contaminant-free by the
laboratory) processed through the sampling equipment using the same procedures used for environmental
samples.
If any analytes of interest are detected at levels greater than the MDL, the source(s) of contamination
should be identified and eliminated, if possible. The sampling crew should be notified so that the source
of contamination can be identified (if possible) and corrective measures taken prior to the next sampling
event.
3.2.3 Field Duplicates
The purpose of analyzing field duplicates is to demonstrate the precision of sampling and analytical
processes. Field duplicates will be prepared at the rate of 5% of all samples, and analyzed along with the
associated environmental samples. Field duplicates will consist of two samples collected simultaneously,
to the extent practicable. If the Relative Percent Difference (RPD) of field duplicate results is greater than
the percentage stated in Table B-10 and the absolute difference is greater than the RL, both samples
should be reanalyzed, if possible. The sampling crew should be notified so that the source of sampling
variability can be identified (if possible) and corrective measures taken prior to the next sampling event.
3.3 QA/QC Laboratory Analyses
Quality control samples prepared in the laboratory will consist of method blanks, laboratory duplicates,
matrix spikes/duplicates, laboratory control samples (standard reference materials), and toxicity quality
controls.
3.3.1 Method Blanks
The purpose of analyzing method blanks is to demonstrate that sample preparation and analytical
procedures do not result in sample contamination. Method blanks will be prepared and analyzed by the
contract laboratory at a rate of at least one for each analytical batch. Method blanks will consist of
laboratory-prepared blank water processed along with the batch of environmental samples. If the result
for a single method blank is greater than the MDL, or if the average blank concentration plus two
standard deviations of three or more blanks is greater than the RL, the source(s) of contamination should
be corrected, and the associated samples should be reanalyzed.
3.3.2 Laboratory Duplicates
The purpose of analyzing laboratory duplicates is to demonstrate the precision of the sample preparation
and analytical methods. Laboratory duplicates will be analyzed at the rate of one pair per sample batch.
Laboratory duplicates will consist of duplicate laboratory fortified method blanks. If the RPD for any
analyte is greater than the percentage stated in Table B-10 and the absolute difference between duplicates
is greater than the RL, the analytical process is not being performed adequately for that analyte. In this
case, the sample batch should be prepared again, and laboratory duplicates should be reanalyzed.
3.3.3 Matrix Spikes and Matrix Spike Duplicates
The purpose of analyzing matrix spikes and matrix spike duplicates is to demonstrate the performance of
the sample preparation and analytical methods in a particular sample matrix. Matrix spikes and matrix
spike duplicates will be analyzed at the rate of one pair per sample batch. Each matrix spike and matrix
spike duplicate will consist of an aliquot of laboratory-fortified environmental sample. Spike
concentrations should be added at five to ten times the reporting limit for the analyte of interest.

Page B-47
If the matrix spike recovery of any analyte is outside the acceptable range, the results for that analyte have
failed to meet acceptance criteria. If recovery of laboratory control samples is acceptable, the analytical
process is being performed adequately for that analyte, and the problem is attributable to the sample
matrix. An attempt will be made to correct the problem (e.g., by mixing, concentration, etc.), and the
samples and matrix spikes will be re-analyzed.
If the matrix spike duplicate RPD for any analyte is outside the acceptable range, the results for that
analyte have failed to meet acceptance criteria. If the RPD for laboratory duplicates is acceptable, the
analytical process is being performed adequately for that analyte, and the problem is attributable to the
sample matrix. An attempt will be made to correct the problem (e.g., by mixing, concentration, etc.), and
the samples and matrix spikes will be re-analyzed.
3.3.4 Laboratory Control Samples
The purpose of analyzing laboratory control samples (or a standard reference material) is to demonstrate
the accuracy of the sample preparation and analytical methods. Laboratory control samples will be
analyzed at the rate of one per sample batch. Laboratory control samples will consist of laboratory
fortified method blanks or a standard reference material. If recovery of any analyte is outside the
acceptable range, the analytical process is not being performed adequately for that analyte. In this case,
the sample batch should be prepared again, and the laboratory control sample should be reanalyzed.
3.3.5 Surrogate Spikes
Surrogate recovery results are used to evaluate the accuracy of analytical measurements for organics
analyses on a sample-specific basis. A surrogate is a compound (or compounds) added by the laboratory
to method blanks, samples, matrix spikes, and matrix spike duplicates prior to sample preparation, as
specified in the analytical methodology. Surrogates are generally brominated, fluorinated or isotopically
labeled compounds that are not usually present in environmental media. Results are expressed as percent
recovery of the surrogate spike. Surrogate spikes are applicable for analysis of PCBs and pesticides.
3.3.6 Toxicity Quality Control
For aquatic toxicity tests, the acceptability of test results is determined primarily by performance-based
criteria for test organisms, culture and test conditions, and the results of control bioassays. Control
bioassays include monthly reference toxicant testing. Test acceptability requirements are documented in
the method documents for each bioassay method.

Page B-48
Section 4 Instrument/Equipment Calibration and
Frequency Frequencies and procedures for calibration of analytical equipment used by each contract laboratory are
documented in the QA Manual for each laboratory. Any deficiencies in analytical equipment calibration
should be managed in accordance with the QA Manual for each contract laboratory. Any deficiencies
that affect analysis of samples submitted through this program must be reported to the SMB JG7 WMP
Group. Laboratory QA Manuals are available for review at the analyzing laboratory.

Page C-1
Attachment C
Outfall Investigation Photographic Log

Page C-2
Site ID:
SMBJ7-O-1
GPS Coordinates:
33.720405, -118.328695
Description:
- Outfall diameter
approximately 5 feet
- Outfall appears to be
corrugated metal pipe
- Outfall not discharging at
time of inspection
- Cliff is moist, suggesting
minor discharge
- Relatively large area to
allow for ponding in event
of outfall discharge
- Outfall not accessible –
protruding from cliff
- Approximately ¼ mile
west of paved ground at
White Point /Royal Palms
County Beach parking lot
(walked on rocks to
access and take photos)
- No safe access to
associated with this outfall
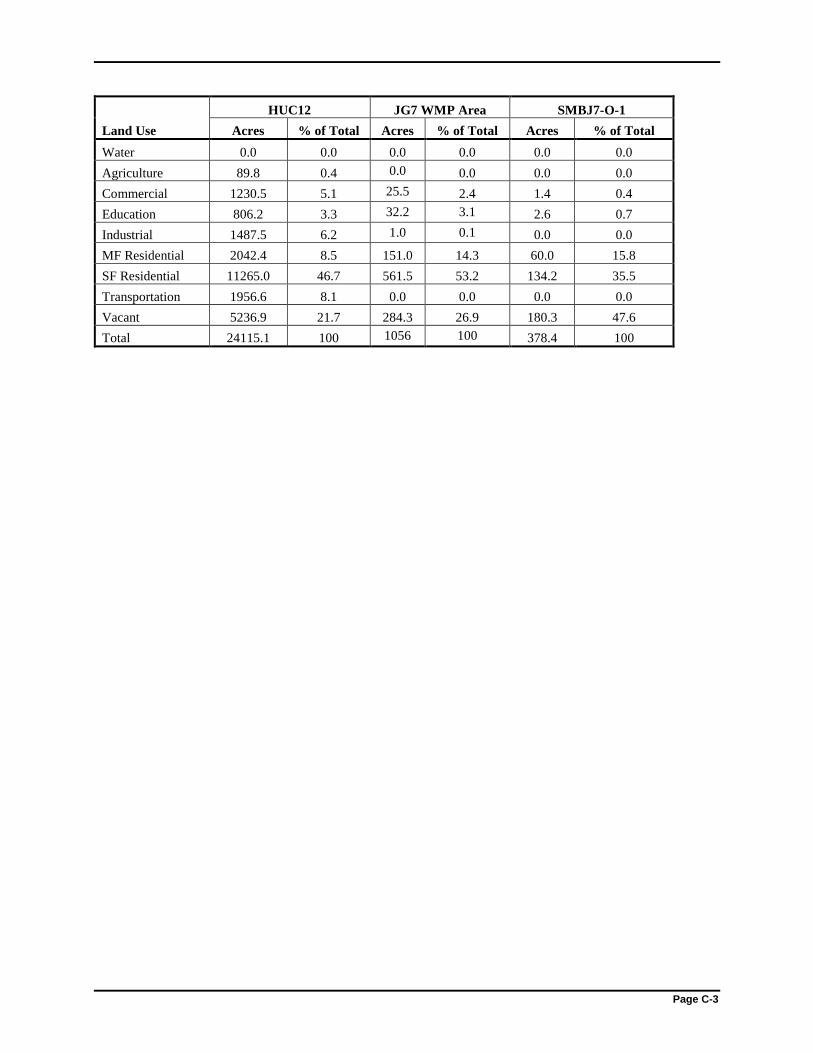
Page C-3
Land Use
HUC12 JG7 WMP Area SMBJ7-O-1
Acres % of Total Acres % of Total Acres % of Total
Water 0.0 0.0 0.0 0.0 0.0 0.0
Agriculture 89.8 0.4 0.0 0.0 0.0 0.0
Commercial 1230.5 5.1 25.5 2.4 1.4 0.4
Education 806.2 3.3 32.2 3.1 2.6 0.7
Industrial 1487.5 6.2 1.0 0.1 0.0 0.0
MF Residential 2042.4 8.5 151.0 14.3 60.0 15.8
SF Residential 11265.0 46.7 561.5 53.2 134.2 35.5
Transportation 1956.6 8.1 0.0 0.0 0.0 0.0
Vacant 5236.9 21.7 284.3 26.9 180.3 47.6
Total 24115.1 100 1056 100 378.4 100

Page C-4
Site ID:
SMBJ7-O-2
GPS Coordinates:
33.718976, -118.323855
Coordinates of bridge
Description:
- Could not observe the
outfall from either below or
above (private property
above)
- Photos are of rock-lined
spillway that appears to be
downstream of outfall
- No discharge observed at
time of investigation (dry)
- Located just west of White
Point/Royal Palms County
Beach parking lot
- This is adjacent to Station
SMB 7-06 which is
currently one of the active
bacteria TMDL monitoring
stations

Page C-5
HUC12 JG7 WMP Area SMBJ7-O-2
Land Use Acres % of Total Acres % of Total Acres % of Total
Water 0.0 0.0 0.0 0.0 0.0 0.0
Agriculture 89.8 0.4 0.0 0.0 0.0 0.0
Commercial 1230.5 5.1 25.5 2.4 0.0 0.0
Education 806.2 3.3 32.2 3.1 8.0 5.7
Industrial 1487.5 6.2 1.0 0.1 0.0 0.0
MF Residential 2042.4 8.5 151.0 14.3 6.8 4.8
SF Residential 11265.0 46.7 561.5 53.2 99.6 70.7
Transportation 1956.6 8.1 0.0 0.0 0.0 0.0
Vacant 5236.9 21.7 284.3 26.9 26.5 18.8
Total 24115.1 100 1056 100 140.8 100

Page C-6
Site ID:
SMBJ7-O-3
GPS Coordinates:
33.718484, -118.321043
Description:
- Outfall diameter
approximately 3-4 feet
- Outfall appears to be
corrugated metal pipe
- Outfall was discharging at
time of investigation
(approximately 5+ gpm)
- Ponding was observed at
the time of investigation –
flow did not reach
downstream culvert that
brings flow to the beach
- Mouth of pond/earth
channel is connected to a 2
foot diameter culvert that
appears to be the
designated location of
SMB 7-06 (see photos on
next page)
- Ponding location and
downstream channel
located on west site of
White Point/Royal Palms
County Beach parking lot

Page C-7
Site ID:
SMBJ7-O-3 (continued)

Page C-8
HUC12 JG7 WMP Area SMBJ7-O-3
Land Use Acres % of Total Acres % of Total Acres % of Total
Water 0.0 0.0 0.0 0.0 0.0 0.0
Agriculture 89.8 0.4 0.0 0.0 0.0 0.0
Commercial 1230.5 5.1 25.5 2.4 13.9 7.9
Education 806.2 3.3 32.2 3.1 0.0 0.0
Industrial 1487.5 6.2 1.0 0.1 0.0 0.0
MF Residential 2042.4 8.5 151.0 14.3 7.3 4.2
SF Residential 11265.0 46.7 561.5 53.2 131.3 74.5
Transportation 1956.6 8.1 0.0 0.0 0.0 0.0
Vacant 5236.9 21.7 284.3 26.9 23.8 13.5
Total 24115.1 100 1056 100 176.4 100

Page C-9
Site ID:
SMBJ7-O-3 (Downstream
segment)
GPS Coordinates:
33.7177861, -118.3211305
Description:
- Outfall diameter
approximately 2 feet
- Outfall not discharging at
time of investigation (dry)
- Outfall is downstream of
SMBJ7-O-3, carries water
from SMBJ7-O-3
pond/earth channel to the
beach front
- Accessible with parking
located nearby in White
Point/Royal Palms County
Beach parking lot

Page C-10
Site ID:
SMBJ7-O-4
GPS Coordinates:
33.715769, -118.317973
Description:
- Outfall diameter
approximately 3-4 feet
- Outfall not discharging at
time of investigation (dry)
- Outfall is hanging from
cliff – no safe access
- Located approximately 500
feet east of White
Point/Royal Palms County
Beach parking lot and
adjacent to SMB 7-06
which is already one of the
bacteria TMDL monitoring
stations.

Page C-11
Site ID:
SMBJ7-O-5
GPS Coordinates:
33.714331, -118.316115
Description:
- Outfall Diameter
approximately 3 feet
- Two pipes (one plastic, one
concrete channel) on top of
each other
- Outfall(s) not discharging
during the time of
inspection
- To access site, had to pass
a gate that said “Danger”
located approximately ¼
mile east of White
Point/Royal Palms County
Beach parking lot
- The shoreline at the zero
point of this outfall is SMB
7-07 which has not been
monitored since 2009 due
to a landslide which
resulted in an unsafe access
road. Prior to 2009, SMB
7-07 was monitored for
bacteria weekly.

Page C-12
HUC12 JG7 WMP Area SMBJ7-O-4/5
Land Use Acres % of Total Acres % of Total Acres % of Total
Water 0.0 0.0 0.0 0.0 0.0 0.0
Agriculture 89.8 0.4 0.0 0.0 0.0 0.0
Commercial 1230.5 5.1 25.5 2.4 0.0 0.0
Education 806.2 3.3 32.2 3.1 5.9 2.6
Industrial 1487.5 6.2 1.0 0.1 0.0 0.0
MF Residential 2042.4 8.5 151.0 14.3 22.1 9.8
SF Residential 11265.0 46.7 561.5 53.2 96.7 43.0
Transportation 1956.6 8.1 0.0 0.0 0.0 0.0
Vacant 5236.9 21.7 284.3 26.9 100.1 44.5
Total 24115.1 100 1056 100 224.8 100

Page C-13
Site ID:
SMBJ7-O-6
GPS Coordinates:
33.711563, -118.303522
Description:
- Width of Outfall
approximately 25’
- Height of Outfall
approximately 18’
- Outfall discharge was a
slow trickle during time of
observation
- Water ponded at mouth of
the outfall
- Trash and excessive
vegetation at mouth of
outfall
- Accessible from path that
begins on Paseo Del Mar
and Barbara Street
- Path was initially
determined to be safe if a
handrail was installed.
However, further
assessment by the County
Sanitation District, the
monitoring agency, found
the path to be unsafe to
access especially during
wet weather events

Page C-14
HUC12 JG7 WMP Area SMBJ7-O-6
Land Use Acres % of Total Acres % of Total Acres % of Total
Water 0.0 0.0 0.0 0.0 0.0 0.0
Agriculture 89.8 0.4 0.0 0.0 0.0 0.0
Commercial 1230.5 5.1 25.5 2.4 0.0 0.0
Education 806.2 3.3 32.2 3.1 2.8 1.7
Industrial 1487.5 6.2 1.0 0.1 0.0 0.0
MF Residential 2042.4 8.5 151.0 14.3 21.9 13.6
SF Residential 11265.0 46.7 561.5 53.2 125.7 77.9
Transportation 1956.6 8.1 0.0 0.0 0.0 0.0
Vacant 5236.9 21.7 284.3 26.9 11.0 6.8
Total 24115.1 100 1056 100 161.4 100

Page C-15
Site ID:
SMBJ7-O-7
GPS Coordinates:
33.709988, -118.298985
Description:
- Outfall diameter
approximately 1.5 feet
- Outfall material corroded
corrugated metal pipe
(broken in multiple areas)
- Outfall was not discharging
at time of inspection
- Pipe was filled with
sediment – suggests
minimal flow if any
- Located in identified
vicinity of SMB-7-08
- Accessible from a path that
begins on Paseo Del Mar
and Meyler Street. The
shoreline across from this
location is designated as
SMB 7-08 and is already
being monitored for
bacteria weekly.

Page C-16
Site ID:
SMBJ7-O-8
GPS Coordinates:
33.709331, -118.296322
Description:
- Outfall diameter
approximately 1.5 feet
- Outfall material is
corrugated metal pipe
- Outfall not discharging at
time of inspection
- Outfall represents only
road runoff
- Not accessible for
monitoring - hanging from
cliff
- Across the street from Fort
Mac Arthur Museum /
Battery Osgood-Farley
National Register Site
- This outfall is not safely
accessible

Page C-17
HUC12 JG7 WMP Area SMBJ7-O-7/8
Land Use Acres % of Total Acres % of Total Acres % of Total
Water 0.0 0.0 0.0 0.0 0.0 0.0
Agriculture 89.8 0.4 0.0 0.0 0.0 0.0
Commercial 1230.5 5.1 25.5 2.4 10.2 8.8
Education 806.2 3.3 32.2 3.1 15.6 13.5
Industrial 1487.5 6.2 1.0 0.1 1.2 1.0
MF Residential 2042.4 8.5 151.0 14.3 0.0 0.0
SF Residential 11265.0 46.7 561.5 53.2 33.3 28.9
Transportation 1956.6 8.1 0.0 0.0 0.0 0.0
Vacant 5236.9 21.7 284.3 26.9 55.1 47.8
Total 24115.1 100 1056 100 115.4 100

Page C-18
Site ID:
SMBJ7-O-9
GPS Coordinates:
33.705307, -118.291571
Description:
- Outfall diameter
approximately 1.75 feet
- Outfall material is corrugated
metal pipe
- Near the end of W. Paseo Del
Mar

Page C-19
HUC12 JG7 WMP Area SMBJ7-O-9
Land Use Acres % of Total Acres % of Total Acres % of Total
Water 0.0 0.0 0.0 0.0 0.0 0.0
Agriculture 89.8 0.4 0.0 0.0 0.0 0.0
Commercial 1230.5 5.1 25.5 2.4 0.0 0.0
Education 806.2 3.3 32.2 3.1 0.0 0.0
Industrial 1487.5 6.2 1.0 0.1 0.5 2.1
MF Residential 2042.4 8.5 151.0 14.3 2.9 12.3
SF Residential 11265.0 46.7 561.5 53.2 0.0 0.0
Transportation 1956.6 8.1 0.0 0.0 0.0 0.0
Vacant 5236.9 21.7 284.3 26.9 20.2 85.6
Total 24115.1 100 1056 100 23.6 100

Page C-20
Site ID:
SMBJ7-O-10
GPS Coordinates:
33.705402, -118.290650
Description:
- Outfall diameter
approximately 2 feet
- Outfall material is brick

Page C-21
HUC12 JG7 WMP Area SMBJ7-O-10
Land Use Acres % of Total Acres % of Total Acres % of Total
Water 0.0 0.0 0.0 0.0 0.0 0.0
Agriculture 89.8 0.4 0.0 0.0 0.0 0.0
Commercial 1230.5 5.1 25.5 2.4 0.0 0.0
Education 806.2 3.3 32.2 3.1 0.0 0.0
Industrial 1487.5 6.2 1.0 0.1 0.0 0.0
MF Residential 2042.4 8.5 151.0 14.3 0.8 20.8
SF Residential 11265.0 46.7 561.5 53.2 0.5 14.0
Transportation 1956.6 8.1 0.0 0.0 0.0 0.0
Vacant 5236.9 21.7 284.3 26.9 2.4 65.2
Total 24115.1 100 1056 100 3.7 100

Page C-22
Site ID:
SMBJ7-O-11
GPS Coordinates:
33.705864, -118.288023
Description:
- Outfall diameter
approximately 2.25 feet
- Outfall material is
corrugated metal pipe
- Near the intersection of S.
Pacific Avenue and Bluff
Place

Page C-23
Site ID:
SMBJ7-O-12
GPS Coordinates:
33.706292, -118.287400
Description:
- Outfall diameter
approximately 1.3 feet
- Outfall material is vitrified
clay pipe
- Near the intersection of S.
Pacific Avenue and Bluff
Place

Page C-24
HUC12 JG7 WMP Area SMBJ7-O-11/12
Land Use Acres % of Total Acres % of Total Acres % of Total
Water 0.0 0.0 0.0 0.0 0.0 0.0
Agriculture 89.8 0.4 0.0 0.0 0.0 0.0
Commercial 1230.5 5.1 25.5 2.4 0.0 0.0
Education 806.2 3.3 32.2 3.1 0.0 0.0
Industrial 1487.5 6.2 1.0 0.1 0.0 0.0
MF Residential 2042.4 8.5 151.0 14.3 18.3 38.0
SF Residential 11265.0 46.7 561.5 53.2 20.7 43.0
Transportation 1956.6 8.1 0.0 0.0 0.0 0.0
Vacant 5236.9 21.7 284.3 26.9 9.1 19.0
Total 24115.1 100 1056 100 48.1 100

Page C-25
Site ID:
SMBJ7-O-13
GPS Coordinates:
33.707872, -118.285646
Description:
- Outfall diameter
approximately 1 foot
- Outfall material is
polyethylene liner
- Close to the end of W 40th
Street, near intersection
with Bluff Place

Page C-26
HUC12 JG7 WMP Area SMBJ7-O-13
Land Use Acres % of Total Acres % of Total Acres % of Total
Water 0.0 0.0 0.0 0.0 0.0 0.0
Agriculture 89.8 0.4 0.0 0.0 0.0 0.0
Commercial 1230.5 5.1 25.5 2.4 1.4 5.5
Education 806.2 3.3 32.2 3.1 0.0 0.0
Industrial 1487.5 6.2 1.0 0.1 0.0 0.0
MF Residential 2042.4 8.5 151.0 14.3 10.8 41.5
SF Residential 11265.0 46.7 561.5 53.2 4.5 17.3
Transportation 1956.6 8.1 0.0 0.0 0.0 0.0
Vacant 5236.9 21.7 284.3 26.9 9.3 35.7
Total 24115.1 100 1056 100 26.0 100

Page D-1
Attachment D
Example Calibration, Field and Chain of Custody
Forms

Page D-2
Example Field Calibration Log Sheet

Page D-3
EXAMPLE Field Log Page 1 of 2
OBSERVATIONS
Weather:
Water Color: In Stream Activity:
Water Characteristics (flow type, odor, turbidity, floatables):
Other comments (trash, wildlife, recreational uses, homeless activity, etc. – Use notes section if more room is needed):
___________________________________________________________________________________________
GENERAL INFORMATION Date: ____________________ Site ID: Sampling Personnel:____________________________ GPS Coordinates: (lat) ____________________ (long) _______________________ Picture/Video #: _______________
In situ WATER QUALITY MEASUREMENTS
Time Temp (0C)
pH D.O.
(mg/L) Elec Cond.
(uS/cm)
Turbidity (NTU)
Salinity (for ocean sampling only)
(PSU)
COLLECTED WATER QUALITY SAMPLES
Sample ID Analysis Time Volume Notes
Field blank
Field duplicate
ADDITIONAL WATER QUALITY SAMPLING NOTES:

Page D-4
FLOW MEASUREMENTS WITH VELOCITY METER
Estimated Total Width of Flowing Water (ft): ____________ Distance measured from (circle): RIGHT or LEFT
Measurement Number 1 2 3 4 5 6 7 8 9 10 11 12 13 14
Distance from Bank (ft)
Depth (ft)
Velocity (ft/s)
FLOW MEASUREMENTS WITH VELOCITY METER
Estimated Total Width of Flowing Water (ft): ____________ Distance measured from (circle): RIGHT or LEFT
Measurement Number 1 2 3 4 5 6 7 8 9 10 11 12 13 14
Distance from Bank (ft)
Depth (ft)
Velocity (ft/s)
FLOW MEASUREMENTS WITH FLOAT AND STOPWATCH Number of Flow Paths:______
Fill out Path # Path# Path# Path# Path# Path#
Width of Flow at Top of Marked Section:
Width of Flow at Middle of Marked Section:
Width of Flow at Bottom of Marked Section:
Depth of Flow at 0% of Top Marked Section:
Depth of Flow at 25% of Top Marked Section:
Depth of Flow at 50% of Top Marked Section:
Depth of Flow at 75% of Top Marked Section:
Depth of Flow at 100% of Top Marked Section:
Depth of Flow at 0% of Middle Marked Section:
Depth of Flow at 25% of Middle Marked Section:
Depth of Flow at 50% of Middle Marked Section:
Depth of Flow at 75% of Middle Marked Section:
Depth of Flow at 100% of Middle Marked Section:
Depth of Flow at 0% of Bottom Marked Section
Depth of Flow at 25% of Bottom Marked Section:
Depth of Flow at 50% of Bottom Marked Section:
Depth of Flow at 75% of Bottom Marked Section:
Depth of Flow at 100% of Bottom Marked Section
Distance Marked-off for Velocity:
Time 1:
Time 2:
Time 3:
Specify if measurements are in inches or feet using “in” or “ft”
FLOW MEASUREMENTS WITH VELOCITY METER
Estimated Total Width of Flowing Water (ft): ____________ Distance measured from (circle): RIGHT or LEFT
Measurement Number 1 2 3 4 5 6 7 8 9 10 11 12 13 14
Distance from Bank (ft)
Depth (ft)
Velocity (ft/s)

Page D-5
CHAIN OF CUSTODY RECORD
Company: Phone: Job No.
Page _______ of _______
Project Manager: Email: Analysis Requested Test Instruction & Comments
Project Name: Project #
Site Name:
& Address:
Container
Sample ID Lab ID Date Time Matrix Number/Size Pres.
1
2
3
4
5
6
7
8
9
10
11
12
13
14
15
Sample Receipt: To Be Filled By Lab Turn Around Time Relinquished By: 1 Relinquished By: 2 Relinquished By: 3
Total Number of Containers Normal Signature Signature Signature
Custody Seals Yes No N/A Rush Printed Name Printed Name
Received in Good Condition Yes No Same Day Date Time Date Time Date Time
Properly Cooled Yes No N/A 24 Hrs Received By 1 Received By 2 Received By 3
Samples Intact Yes No N/A 48 Hrs Signature Signature Signature
Samples Accepted Yes No 72 Hrs Printed Name Printed Name Printed Name
Date Time Date Time Date Time