copyright by marco agostoni 2010
TRANSCRIPT

Copyright
by
Marco Agostoni
2010
The Thesis Committee for Marco Agostoni
Certifies that this is the approved version of the following thesis:
Genetic analysis of nitrogen assimilation in the Texas brown tide
Aureoumbra lagunensis
APPROVED BY
SUPERVISING COMMITTEE:
Deana L. Erdner
Jerry J. Brand
Tracy A. Villareal
Supervisor:

Genetic analysis of nitrogen assimilation in the Texas brown tide
Aureoumbra lagunensis
by
Marco Agostoni, B.S.
Thesis
Presented to the Faculty of the Graduate School of
The University of Texas at Austin
in Partial Fulfillment
of the Requirements
for the Degree of
Master of Science in Marine Science
The University of Texas at Austin
May 2010
Dedication
I dedicate this thesis to my parents. La mia scelta di studiare negli Stati Uniti ha
sicuramente portato ad avere compromessi nella loro vita. Sebbene è difficile stare
lontano da un figlio per così tanto tempo, non mi hanno mai fatto pesare la mia scelta.
v
Acknowledgements
I am grateful to my advisor, Dr. Deana L. Erdner, for the opportunity she gave me
to work on this very interesting microorganism and her valuable suggestions throughout
my research. I am also thankful to the members of my committee, Dr. Jerry J. Brand and
Dr. Tracy A. Villareal, for their detailed comments that helped shape this thesis. I would
especially like to thank Dr. Andrew Evans for his unwavering guidance, insight and
encouragement. A special gesture of appreciation is extended to Patricia Garlough for her
important role in analyzing the carbon and nitrogen composition of my samples. I thank
Dr. Alfredo F. Ojanguren for sharing with me stories and ideas regarding statistic, basic
science, and graphic design for my posters and presentations. I would like to thank my
colleagues, Rodney Withall and Claudia Rocha for assisting me with numerous daily
laboratory tasks. A final note of gratitude goes out to my parents, sister and friends, the
unconditionally supportive people who motivated and pushed me through the difficulties
of first time independent research.
May 7th
2010
vi
Abstract
Genetic analysis of nitrogen assimilation in the Texas brown tide
Aureoumbra lagunensis
Marco Agostoni, MSMarineSci
The University of Texas at Austin, 2010
Supervisor: Deana L. Erdner
The initiation, persistence, and termination of harmful algal blooms (HABs) can
all be influenced by nutrient availability. Recent studies have highlighted the role of both
organic and inorganic nitrogen sources in HAB dynamics. The pelagophyte Aureoumbra
lagunensis causes ecosystem disruptive algal blooms and is responsible for the longest
recorded harmful algal bloom (1989-1997). Because of Aureoumbra‟s small size and its
inability to use nitrate, it has been hypothesized that its ability to use ammonium and
organic nitrogen, especially at low concentrations, contributed to the unusual persistence
of this bloom. This project aimed to assess the response of Aureoumbra to inorganic and
organic nitrogen sources by examining the expression of genes responsible for nitrogen
assimilation, with an eventual intent of developing expression assays that are indicative
of nitrogen source use and/or sufficiency in Aureoumbra. Large volume batch cultures of
Aureoumbra were grown with either ammonium or urea as a nitrogen source.
Physiological characteristics (C:N, chlorophyll a cell-1
, and Fv/Fm) were monitored
throughout the growth period, and the expression of the AMT-1, AMT-2 and UREC genes
was assayed at early-, mid- and late-exponential phases. The results show that
vii
Aureoumbra can use both ammonium and urea, and that it is well adapted to low-nutrient
environments. Only one gene, AMT-1, appeared to be transcriptionally regulated in
response to changing nitrogen concentration, and only to ammonium. The results of this
study contribute to our understanding of how algae in general cope with low nutrient
availability and should ultimately help to define the dynamics of these HAB events.

viii
Table of Contents
List of Tables ........................................................................................................ ix
List of Figures ......................................................................................................... x
CHAPTER 1 1
Genetic analysis of nitrogen assimilation in the Texas brown tide Aureoumbra lagunensis ...................................................................................................... 1
Introduction .................................................................................................... 1
Materials & Methods ..................................................................................... 6
Results and Discussion ................................................................................ 20
Conclusion ................................................................................................... 33
Appendix ............................................................................................................... 35
Glossary ................................................................................................................ 37
Bibliography ......................................................................................................... 39
Vita …………………………………………………………………………….. 45

ix
List of Tables
Table 1: Degenerate and specific primers for AMT, UREC, ACT, and EL1α 16
Table 2: Amplification characteristics of the gene-specific primer sets ....... 18
Table 3: Physiological measures. ................................................................... 25
Table 4: Ratio of gene expression under different growth stages .................. 31
Table 5: Ratio UREC / AMT-1. ...................................................................... 32

x
List of Figures
Figure 1: Ammonium experiment. .................................................................... 8
Figure 2: Urea experiment ................................................................................. 9
Figure 3: Alignment of the Aureoumbra AMT-1 and AMT-2 .......................... 13
Figure 4: Alignment of the Aureoumbra UREC .............................................. 14
Figure 5: Alignment of the Aureoumbra ACT ................................................ 15
Figure 6: Physiological analysis. ..................................................................... 24
Figure 7: Expression of the AMT-1, AMT-2 and UREC genes ........................ 28
1
CHAPTER 1
Genetic analysis of nitrogen assimilation in the Texas brown tide Aureoumbra lagunensis
INTRODUCTION
The state of Texas experiences harmful algal blooms caused by several different
organisms. The pelagophyte alga Aureoumbra lagunensis causes “brown tide” blooms in
the coastal bend region of the state. Aureoumbra is an alga belonging to Phylum
Heterokontophyta, Class Pelagophyceae, present in the Laguna Madre, Texas, but also
noted in other parts of Texas, Florida and Mexico (Villareal et al., 2002). This harmful
brown alga possesses other notable characteristics: it caused the largest HAB bloom ever
recorded (9 years in the Laguna Madre; Buskey et al., 2001), and it has the highest
reported critical N:P ratio (260 at a growth rate of 0.16 day-1
; Liu et al., 2001). In
addition, it can tolerate salinities from 10 through 90 psu (Liu and Buskey, 2000); can
grow on organic phosphorus and glutamate (Muhlstein and Villareal, 2007); can produce
large quantities of extracellular polymeric substance (EPS) under stress (Liu and Buskey,
2000); and cannot use nitrate (DeYoe and Suttle, 1994). Aureoumbra has a diameter of 3-
5µm, which could allow these small cells to be better competitors in conditions of low
nutrients (Pedersen and Sand-Jensen, 1995). Furthermore, the size of these cells increases
the chl a – specific absorption coefficient (Raven and Kubler, 2002), enabling them to
absorb photons more efficiently.
Aureoumbra blooms are an example of ecosystem disruptive algal blooms
(EDABs; Sunda et al., 2006) - harmful algal blooms (HABs) that can modify or degrade
ecosystems, altering the transfer of energy from the primary producers to higher trophic
2
levels. Sunda et al. (2006) hypothesized that the initiation and persistence of EDABs are
influenced by nutrient availability, herbivore grazing, and nutrient regeneration. These
three factors work synergistically and can alter the ecosystem dynamics. If the herbivore
grazing rate on harmful algae is limited, grazer-mediated recycling of nutrients is
reduced. Harmful algae that are well adapted to nutrient-stressed environments benefit
from these positive feedbacks. Therefore, these factors contribute to EDAB formation
and exacerbate the effects on the ecosystem.
The Aureoumbra bloom of 1989-1997 is an oft-cited example of an EDAB.
Herbivore grazing on Aureoumbra can be reduced due to the presence of the EPS layer;
Liu and Buskey (2000) showed that EPS impeded digestion and clogged feeding
apparatus. EPS can also capture charged molecules such as metals from the environment.
This high concentration of metals can become toxic to grazers by bioaccumulation. The
bound metals are also removed from the environment by EPS and consumed by this alga,
reducing their availability for other species (Bhaskar and Bhosle, 2006). EPS production
increased proportionally as salinity increased (Liu and Buskey, 2000), but also as a
response to unbalanced C:N metabolism, as a sink for reducing power; when the amount
of fixed carbon exceeds the nitrogen available in the medium, extracellular
polysaccharides are synthesized (Otero and Vincenzini, 2004). The reduction in grazing
resulted in reduced nutrient recycling in nutrient-poor the Laguna Madre system
(Shormann 1992). During the severe freeze of December 1989, large numbers of
invertebrates and fish were killed, and the resulting decomposition could have been a
large source of ammonium to the lagoon (Stockwell et al., 1993; DeYoe and Shuttle,
1994). Yet, it is unclear if this initial ammonium source could sustain the entire 9-year
bloom, or if another nitrogen source had the principal nutrient role. However, one
defining characteristic of EDAB algae is that they are very well adapted to nutrient-

3
stressed environments. Because smaller organisms have 1) a higher surface area to
volume ratio and 2) a thinner boundary layer, Aureoumbra would seem to be well-
adapted to low nutrient conditions just as a consequence of its size.
Aureococcus anophagefferens is another brown tide alga present on the north-east
coast of the U.S., but it seems to have expanded southward of the east coast of USA and
to South Africa (Naidoo, 1999; Pitcher and Calder, 2000; Probyn et al., 2001). Molecular
phylogenetic analysis by Bailey and Andersen (1999) placed both algae within the same
class, the Pelagophyceae. Aureoumbra and Aureococcus share numerous other
similarities. First, both are unicellular and second, they are small. Third, they have EPS
layer external to the plasmalemma. Fourth, they share similar pigmentation with similar
ratios (excepting 19'-butanoyloxyfucoxanthin:Chl a): chlorophylls a and c, β-carotene,
fucoxanthin, diadinoxanthin, and 19'-butanoyloxyfucoxanthin. Finally, both have only a
single chloroplast with the structure that is specific for their class of Pelagophyceae
(lamellae with three adpressed thylakoids and a girdle lamella) (DeYoe et al., 1997).
Aureococcus blooms seem to be associated with high dissolved organic nitrogen (DON)
to dissolved inorganic nitrogen (DIN) ratios (Berg et al., 2003; Pustizzi et al., 2004; Berg
et al., 2008). Similar to the Aureococcus brown tide, the growth and development of
Aureoumbra blooms may be influenced by the relative availability of inorganic and
organic nutrient sources. Despite low inorganic nutrient inputs, the Laguna Madre
ecosystem is highly productive. Dissolved organic carbon is released through seagrass
exudation, while DON is released by leaching and other processes. Ziegler et al. (2004)
analyzed samples from the Laguna Madre from 1996 and 1997 (during the long
Aureoumbra bloom) and found that DON represented 96-98% of total dissolved nitrogen
in the Laguna Madre. Muhlstein and Villareal (2007) studied the ability of Aureoumbra
to grow in medium with organic nutrients such as urea and glutamic acid. Although the

4
experiment was conducted with bacterized culture, the results strongly suggest that
Aureoumbra could effectively use organic nitrogen compounds.
As mentioned, with its small size and its ability to use DON, Aureoumbra may be
seen as a useful model for understanding present and future responses to low nutrient
availability and adaptation to different sources of nitrogen. Schaefer & Alber (2007)
described the relationship between temperature and nitrogen budget in coastal areas. For
the authors, denitrification could act as the primary control on the nitrogen budget in
coastal watersheds. They found a highly positive correlation between temperature and
denitrification along 12 watersheds.In addition, LaRoche et al. (1997) suggested a
correlation between groundwater discharge and subsequent inorganic nitrogen input to
costal bays. Therefore a nitrogen loss may occur in coastal areas as a consequence of
increasing temperatures and decreasing rainfall discharge. Increasing temperatures and
decreasing rainfall discharge seems reasonable in accordance with Intergovernmental
Panel on Climate Change (IPCC) (Houghton et al., 1995) model results that show a
positive correlation between temperature and anthropogenic CO2 emission, and to a study
conducted by Chen et al. (2001) that showed a negative correlation between increase of
temperature and decrease of rainfall in Southern Texas. Furthermore, change in
temperature does not just affect coastal regions, but also the open ocean. In these areas,
changes in temperature would lead to ice melting in high latitude areas and increases in
temperature water surface in low latitude regions. Consequently, stratification would be
enhanced in both regions (Sarmiento et al., 1998). Falkowski et al. (1998) suggested that
this scenario of events would increase the density contrast between the nutrient-depleted
upper layer and the nutrient-rich lower layer, reducing nutrient fluxes to the ocean
surface. A study conducted during the years 1998 to 2006 showed a high correlation
between net primary production and the stratification anomaly (Behrenfeld et al., 2006).
5
Although the effects of global warming on biota are problematic to study, ecosystem
composition and physiological status would likely shift during conditions of high
stratification (Litchman et al., 2006). Falkowski & Oliver (2007) predicted a reduction of
numbers of large cells in the open ocean in response to a decrease in nutrient availability.
Small primary producers that are able to fix atmospheric nitrogen, or use different
sources of nitrogen, e.g. organic nitrogen, could play a bigger role in nutrient recycling
(Berg et al., 2003).
Although the Laguna Madre is not expected to experience increased stratification
with an average depth of 0.8 meter, studies of Aureoumbra will contribute to our
understanding of how algae in general cope with low nutrient availability. Aureoumbra‟s
ability to assimilate different nitrogen sources, especially at low concentrations, may be
the key to its success in the environment. To better understand how Aureoumbra
responds to its nutrient environment, this project aimed to develop a set of molecular
markers for nitrogen source use in Aureoumbra. After cloning the genes involved in
nitrogen assimilation, ammonium transporter (AMT) and urease C subunit (UREC), the
expression of these genes was analyzed under laboratory conditions using quantitative
real-time PCR (qPCR) with specific primers developed from the sequences. The primary
aim of this project was to understand how expression of N assimilation genes varies
between cells grown on different N sources and different N conditions, and if there was
evidence of transcriptional control. These results then enabled me to assess whether gene
expression assays could be used to determine the nitrogen source(s) and/or sufficiency in
Aureoumbra.

6
MATERIALS & METHODS
Culture conditions
Aureoumbra lagunensis strain 1509, obtained from the Provasoli-Guillard Culture
Collection, was used for all experiments. This strain was xenic; although it was listed as
being axenic, PCR analysis showed the presence of bacteria in the cultures. Cultures were
maintained in autoclaved 0.22µm- filtered Gulf of Mexico seawater (salinity 32 psu)
enriched with f/2 nutrients (Guillard, 1975) without nitrate or silicate. Nitrogen was
added to the medium as ammonium (50 µM) or as urea (25 µM; 50 µM in nitrogen).
Cultures were grown in 9.5L glass bottles (Pyrex solution bottle, 1595-2X) with an initial
medium volume of 8L. At the beginning of the experiment the same volume of
Aureoumbra was added to each carboy to give a specific density, corresponding to a
starting cell density of approximately 10,000 cells ml-1. Bottles were bubbled with 0.2µm-
filtered air to maintain mixing. Cultures were maintained at 22°C on a 12:12 light:dark
cycle, at an irradiance of approx. 96 µmol photons m–2
s–1
. Cells were counted using a
hemacytometer.
The first experiment was conducted using culture growth in batch under N-
sufficient conditions on NH4+ while the second experiment used urea as nitrogen source.
For each nitrogen source, 3 replicates were used. Every day, a sample was withdrawn
aseptically, and cell density and nitrogen concentration were measured. However,
spectrophotometric analysis of N concentration was not performed until the day before
the second extraction. The first sample for RNA analysis was collected on the 5th - 7th
day after inoculation, at a cell density around 100,000 cells ml-1
(early log phase – T1). A
concentration such as 100,000 cells ml-1
allowed for sufficient biomass to extract enough
RNA and yet was low enough to still have sufficient N in the medium. On the day that
the cultures were predicted to deplete the nitrogen (based on N disappearance in the

7
cultures, presumably two or three days after the first extraction), a second sample (in
middle log phase – T2) was collected for RNA extraction. Finally, a third set of samples
were collected at the end of the log phase (T3) (Figure 1,2). For RNA extraction, algae
were collected by centrifugation at 1300 x g for 6‟ at 22°C, 3 hours after the beginning of
the light cycle, and frozen at -80°C.
RNA extraction and cDNA synthesis
Total RNA extraction was performed using the UltraClean Plant RNA isolation
kit (Mo Bio, Inc). Isolation of mRNA with oligo (dT) magnetic beads was conducted
using the mRNA Enrichment kit (Mag-Bind). mRNA was quantified with an ND-1000
Spectrophotometer (NanoDrop). cDNA synthesis was performed using an oligo-dTVN
primer (Integrated DNA Technologies, Inc.) and SuperScript III reverse transcriptase
(Invitrogen catalogue 18080-093) following manufacturer‟s protocol, with incubation for
45‟ at 55°C.

8
0
0.4
0.8
1.2
1.6
0
15
30
45
3 5 7 9 11
Millio
ns
cells
ml-1
µM
NH
4
Days after inoculation
A1
A2
A3
A1
A2
A3
Figure 1: Ammonium experiment: cell densities and medium NH4+ concentrations in
the 3 replicate batch cultures A1, A2 and A3.
T1 T2
T3
+

9
0
0.4
0.8
1.2
1.6
2
0
10
20
30
3 5 7 9 11
Millio
ns
cells
ml-1
µM
Ure
a
Days after inoculation
U1
U2
U3
U1
U2
U3
Figure 2: Urea experiment: cell densities and medium urea concentrations in the 3 replicate batch cultures U1, U2 and U3
T1
T2
T3

10
Ammonium and urea assays
The assay for spectrophotometric determination of NH4+ concentrations was
adapted from Strickland & Parsons (1968) and Bolleter et al. (1961). Sample and
standard assays were conducted in a 96-well flat-bottomed plate (Molecular Devices).
All samples and standards were run in triplicate, and NH4+ standards of 5, 10, 20, 30, 40,
50, 60, 80, and 100µM were included on each plate. Each well contained 220µl of sample
or standard, followed by the sequential addition 20µl of phenol, 20µl of 20mM sodium
nitroprusside, and 40µl of oxidizing solution. Oxidizing solution was prepared by mixing
1 part bleach and 4 parts of alkaline solution (10g sodium citrate and 0.5g NaOH in 50ml
ultrapure water). Color development was performed for 1h in the dark, at room
temperature without mixing. The absorbance of the sample at 640nm was determined by
spectrophotometer (SpectraMax 190, Molecular Devices Corp.). A linear regression was
calculated from the A640 and concentration of the standards, and sample concentrations
were calculated from the equation of the regression line (R2>0.99).
The assay for enzymatic determination of urea concentrations was adapted from
McCarthy (1970) and Parsons et al. (1984). All reagents were made according to the
protocol with the exception of the enzyme solution. Crude urease (0.25g; Worthington
Biochemical Corporation) was suspended in 15ml of 1% w/v EDTA solution and
concentrated by centrifugation using Centriprep centrifugal filter devices (10,000
NMWL, Millipore), at 2060 x g for 20‟ for 3 times, at 20°C. Finally, concentrated urease
was suspended in 45ml of 1% w/v EDTA solution, and mixed with 50ml of analytic
reagent quality glycerol and 5ml of Cleland‟s reagent DTT (USB Corporation) according
to the protocol. For each assay, 100µl of urease solution was mixed to 900µl of sample,
and the sample was incubated at 50°C for 10‟ to reduce the urea to ammonium. NH4+
11
concentration was then determined using the spectrophotometric assay described above.
All samples and standards were run in triplicate, and urea standards of 0, 2.5, 5, 10, 15,
20, and 25µM were included on each plate. This method was preferred over a direct
spectrophotometric assay for urea, as the results were immediate and the same reagents
were used as for the ammonium assay (Revilla et al., 2005). However, to verify the
efficiency of this method, a measurement of 50µM of NH4+ was compared with
enzymatic determination of 25µM of urea. The enzymatic method was 93% efficient at
converting urea to ammonium.
Gene cloning
For the identification of the AMT gene, degenerate primers were designed using
known gene sequences from a variety of eukaryotic unicellular organisms. Conserved
regions were identified by eye, and degenerate primers were selected to include no more
than 4 degeneracies. For AMT, sequences of Cylindrotheca fusiformis, Thalassiosira
weissflogi, Chlamydomonas reinhardtii, and Trichodesmium erythraeum
(http://www.ncbi.nlm.nih.gov/ database) were used. For UREC, published degenerate
primer sequences were used (Baker et al., 2009). Any resulting PCR amplicons were
cloned into the pCR2.1-TOPO vector (Invitrogen) following the manufacturer‟s protocol.
Individual clones were tested for the presence of the gene fragments using clone PCR,
and positive clones were sequenced at the University of Texas ICMB Core Facility.
Sequences were edited by eye using Sequencher (GeneCodes Corp.). The resulting
sequences were verified by 1) determining the similarity to other genes through tblastx
searches against the NCBI database; and 2) assessing their affiliation with eukaryotic
genes by phylogenetic analysis based on multiple sequences both from eukaryotic and
prokaryotic organisms (Geneious, Biomatters Ltd.; Figure 3,4,5). If the partial sequences
corresponded to the gene of interest and were determined to be of eukaryotic origin,

12
specific primers were designed (Table 1). Degenerate primers for AMT identified and
amplified two different ammonium transporters belonging to Aureoumbra. Specific
primers were designed to target the two gene fragments. Although the two ammonium
transporter gene fragments, designated AMT-1 and AMT-2, were similar in sequence, we
ensured that the primers of the AMT-1 were specific for their own sequence and vice
versa for the primers of AMT-2. In addition, a partial sequence of the actin gene (ACT)
and elongation factor 1 alpha gene (EF1α) that are commonly used as housekeeping or
reference genes (Le Bail et al., 2008), were cloned, sequenced, and verified. However,
EL1α was cloned from cDNA, thus a phylogenetic analysis to assess its affiliation with
eukaryotic genes has not been run.

13
Figure 3: Alignment of the Aureoumbra AMT-1 and AMT-2 with multiple sequences from eukaryotic microalgae (blue) and prokaryotes (red). The tree was constructed using PhyML (Guindon and Gastuel, 2003) with an input tree generated by BIONJ with the MtREV model of amino acid substitution. PhyML bootstrap trees were constructed from 100 resampled datasets without gamma-corrected distances, and likelihood log of -7204.42665.
AMT-1
AMT-2

14
Figure 4: Alignment of the Aureoumbra UREC with multiple sequences from eukaryotic microalgae (blue), fungi (green), and prokaryotes (red). The tree was constructed using PhyML (Guindon and Gastuel, 2003) with an input tree generated by BIONJ with the MtREV model of amino acid substitution. PhyML bootstrap trees were constructed from 100 resampled datasets without gamma-corrected distances, and likelihood log of -3309.41939

15
.
Figure 5: Alignment of the Aureoumbra ACT with multiple sequences from eukaryotic microalgae (blue), fungi (green), and prokaryotes (red). The tree was constructed using PhyML (Guindon and Gastuel, 2003) with an input tree generated by BIONJ with the MtREV model of amino acid substitution. PhyML bootstrap trees were constructed from 100 resampled datasets without gamma-corrected distances, and likelihood log of -7612.45242.
16
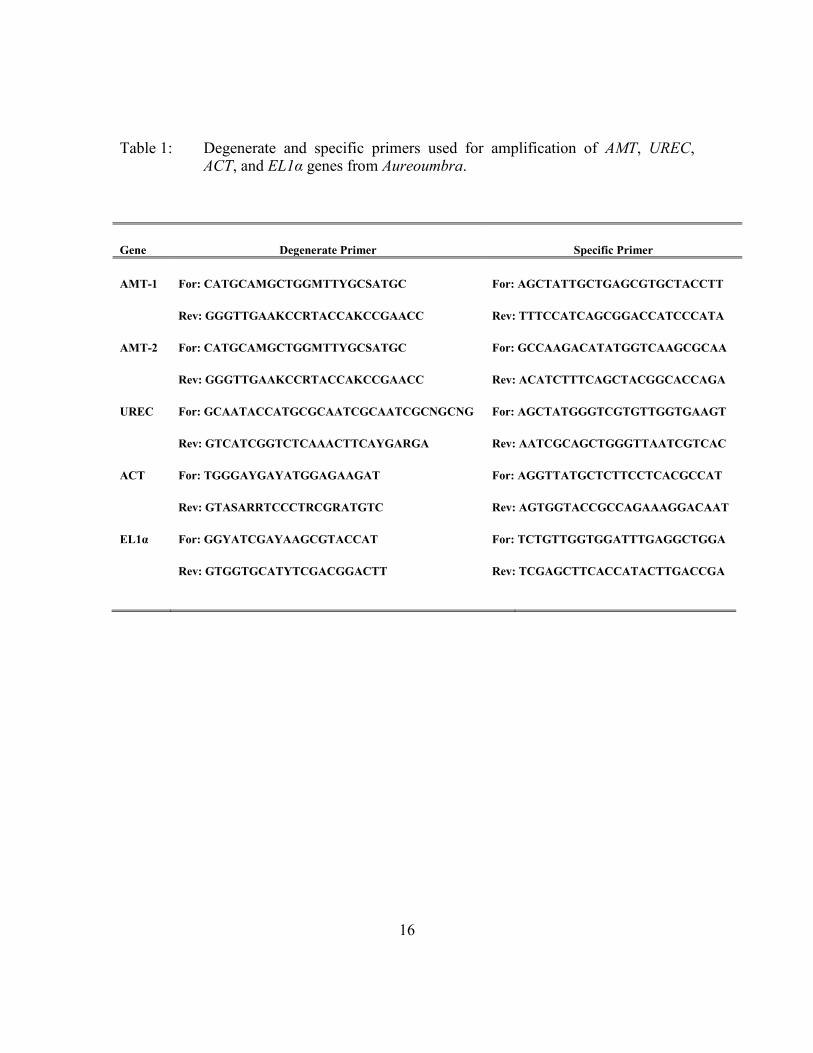
Table 1: Degenerate and specific primers used for amplification of AMT, UREC, ACT, and EL1α genes from Aureoumbra.
Gene Degenerate Primer Specific Primer
AMT-1 For: CATGCAMGCTGGMTTYGCSATGC
Rev: GGGTTGAAKCCRTACCAKCCGAACC
For: AGCTATTGCTGAGCGTGCTACCTT
Rev: TTTCCATCAGCGGACCATCCCATA
AMT-2 For: CATGCAMGCTGGMTTYGCSATGC
Rev: GGGTTGAAKCCRTACCAKCCGAACC
For: GCCAAGACATATGGTCAAGCGCAA
Rev: ACATCTTTCAGCTACGGCACCAGA
UREC For: GCAATACCATGCGCAATCGCAATCGCNGCNG
Rev: GTCATCGGTCTCAAACTTCAYGARGA
For: AGCTATGGGTCGTGTTGGTGAAGT
Rev: AATCGCAGCTGGGTTAATCGTCAC
ACT
EL1α
For: TGGGAYGAYATGGAGAAGAT
Rev: GTASARRTCCCTRCGRATGTC
For: GGYATCGAYAAGCGTACCAT
Rev: GTGGTGCATYTCGACGGACTT
For: AGGTTATGCTCTTCCTCACGCCAT
Rev: AGTGGTACCGCCAGAAAGGACAAT
For: TCTGTTGGTGGATTTGAGGCTGGA
Rev: TCGAGCTTCACCATACTTGACCGA

17
Real Time PCR assay
In order to confidently compare qPCR results between different genes, all primer
sets needed to have similar amplification efficiency. To assay the efficiency of the
specific primers, qPCR was performed using each primer set and a dilution series of
Aureoumbra cDNA and plasmid containing the cloned gene fragments (1:1; 1:10; 1:100;
1:1000; 1:10000). Standard curves of all the primer sets showed efficiency above 93%
(Table 2). In addition, melting curve analysis after qPCR showed that only one PCR
amplicon was present for each reaction. Moreover, to verify the accuracy of the data two
identical replicate analyses of each experimental sample were performed. The cycle
threshold (Ct) values of these replicates resulted to have a standard deviation <0.3.
To alleviate the need for inclusion of housekeeping gene, gene expression levels
were normalized to the same amount of starting cDNA (Libus and Štorchová, 2006).
Quantification of single-stranded cDNA was performed using RiboGreen RNA
quantification assay (Invitrogen) which allowed for precise determinations of ssDNA
concentrations. To analyze the relative gene expression, qPCR was performed with an
Eppendorf Realplex Mastercycler instrument (Eppendorf) in the presence of SYBR-green
master mix dye (Invitrogen) to bind the cDNA. The statistically significant effects of
nitrogen conditions on gene expression were determined using analysis of variance
(ANOVA). Statistical analyses (n=3 per each N condition) were performed utilizing 95%
confidence intervals (p < 0.05). All statistical analyses were computed using SPSS 16.0
software (SPSS Inc. IL).

18
Table 2: Amplification characteristics of the gene-specific primer sets, when used with a standard dilution series of Aureoumbra cDNA or cloned genes.
Gene Slope Efficiency R2
AMT-1 -3.39 97% >0.99
AMT-2 -3.40 96% >0.99
UREC -3.49 93% >0.99
ACT
EL1α
-3.49
-3.51
94%
92%
>0.99
>0.99

19
Physiological analysis
Analyses of carbon to nitrogen ratio per cell, Fv/Fm ratio, and total chlorophyll
were conducted at the same time (±0.5h) every day from the early-log phase to the end-
log phase. The aim was to better understand the physiological responses of Aureoumbra
to its environment and verify that Aureoumbra was in N limitation. The C:N ratio
allowed me to estimate the balance between these two elements. Fv/Fm was used as
indicator of photosystem II efficiency. Decreases in total chlorophyll are empirically
correlated with nitrogen stress.
For the C:N ratio, at least 12,000,000 cells were filtered onto an ashed GF/F filter
(Whatman) and dried over night at 60°C. The samples (n=1 for each bottle) were
analyzed using a Carlo-Erba NC 2500 element analyzer (Carlo Erba Strumetazione,
Milan, Italy). Total chlorophyll and Fv/Fm analyses were performed with a Turner
Designs Model 10-AU digital fluorometer. A total of 5ml of culture (n=3 for each bottle)
were filtered through a GF/F filter (Whatman) to analyze the total chlorophyll. The filters
were transferred to 10ml of 100% methanol and extracted for at least 24h at 4°C in the
dark. The photochemical efficiency (Fv/Fm) of 3ml of Aureoumbra culture (n=3 for each
bottle) was measured using a modification of Vincent et al. (1984). After dark adaptation
for 30‟, Fo was read at 15s. The samples were then exposed for at least 30s to a final
concentration of 20µM of DCMU (3‟,4‟-dichlorophenyl-1,1-dimethylurea, Sigma-
Aldrich, St Louis, MO, USA) dissolved in 100% ethanol, to reduce QA, the first electron
acceptor of photosystem II. In the presence of DCMU the fluorescence represents the
maximal fluorescence (Fm). Fm was read in the fluorometer after 15s. Fv was calculated as
Fm-Fo.

20
The statistically significant effects of nitrogen conditions on physiological
responses were determined using analysis of variance (ANOVA). Statistical analyses
(n=3 per each bottle for total chlorophyll and Fv/Fm; n=1 per each bottle for C:N ratio)
were performed utilizing 95% confidence intervals (p<0.05). All statistical analyses were
computed using SPSS 16.0 software (SPSS Inc. IL).
RESULTS AND DISCUSSION
This work is the first attempt to study gene expression in the brown tide
Aureoumbra lagunensis. The primary aim of this project was to understand how the
expression of genes associated with nitrogen assimilation varies between cells grown on
different N sources and under different N conditions. The first step was to isolate
fragments of our target genes via PCR using degenerate primers. In total, five genes were
isolated and identified: UREC, ACT, EF1α and two fragments of similar sequence that
both encode ammonium transporters: AMT-1 and AMT-2. AMT and UREC are involved
in the assimilation of ammonium and urea, respectively, whereas ACT and EF1α were
selected as potential housekeeping genes (Le Bail et al., 2008) for the qPCR assays. The
expression of AMT and UREC genes was determined under N-sufficient and N-deficient
conditions, with inorganic and organic nitrogen sources. The results provide information
on the transcriptional regulation of N assimilation in Aureoumbra and show how
Aureoumbra growth and physiology respond to different nitrogen sources.
Aureoumbra growth and physiology
From the 3rd
day after inoculation (around 25,000 cells ml-1
), Aureoumbra started
growing exponentially and stopped after 11-12 days. It behaved somewhat unexpectedly,
as it continued to grow for 2-3 divisions after the medium nitrogen was depleted, both in

21
the NH4+-grown and urea-grown cultures. It has been shown that different microalgae
are able to store nitrogen and other nutrients. Quantity and quality of nitrogen stored may
control cell division rate, thus uncoupling the relation between cell division and
environmental limiting nutrient concentration (Cunningham and Maas, 1978; Sciandra
1991). Aureoumbra could be seen as a “storage specialist” since it was able to store
nitrogen in intracellular pools enough to exponentially grow for 2-3 divisions. These
storage specialists may have an ecological advantage compared with other species when
nutrient inputs are episodic; indeed these species can accumulate nutrients and survive
between nutrient pulses (Sommer 1985, Grover 1991).
Gene expression and the physiological responses were analyzed during 3 stages
of growth. The first samples were collected 2-3 days before medium nitrogen was
depleted, in early log phase (T1), thus these samples were considered to be nitrogen-
sufficient, as external nitrogen concentration was sufficient to support several more cell
divisions. The second sample was collected one day after medium nitrogen was depleted,
in middle log phase (T2); yet the cells continued to divide and grow exponentially after
this point. The continued growth indicated that the cells had sufficient nitrogen internally
to continue dividing. The last sample was collected during the end of the exponential
phase (T3), where cell growth had slowed substantially or ceased.
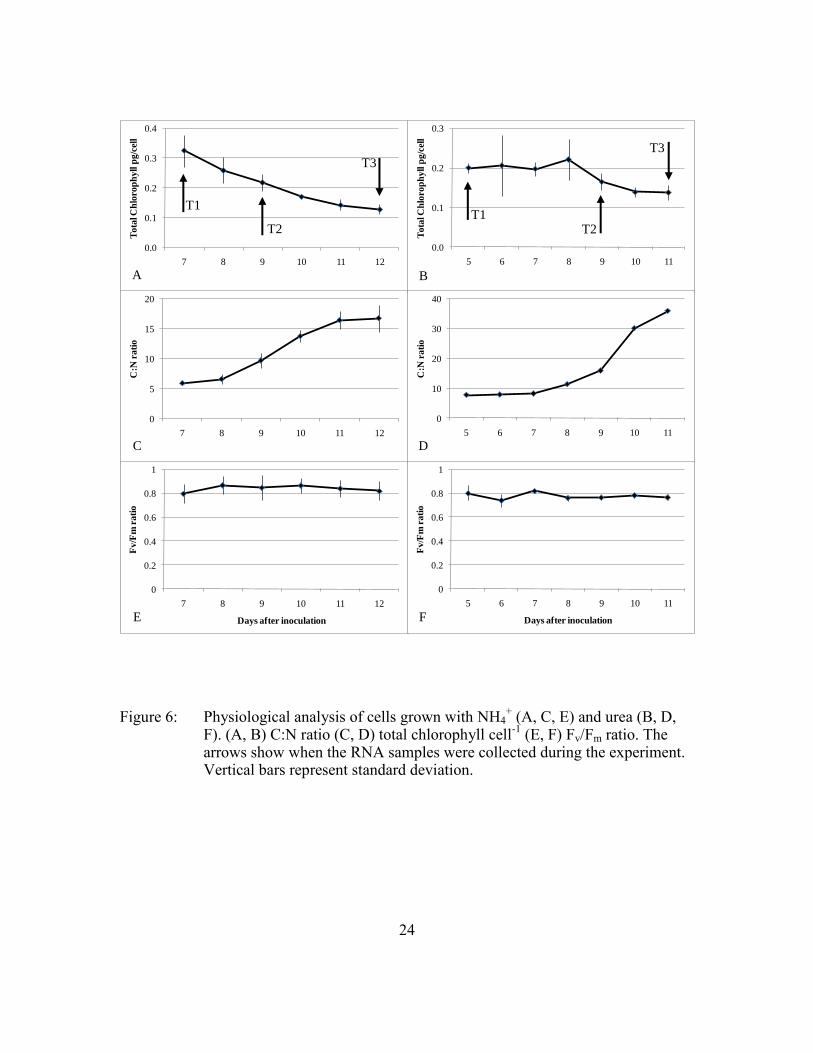
In both batch cultures, chlorophyll cell-1
decreased over time (Figure 6A,B),
whereas the cellular C:N ratio increased (Figure 6C,D). In NH4+-grown cells, the C:N
ratio at T1 was 5.9 (SD ±0.3) and increased to 16.7 (SD ±2.2) by the end of the log phase
(T3). Under growth on urea, the C:N at T1 was 7.7 (SD ±0.1) and increased to 23.9 (SD
±0.3) by the end of log phase (Table 3). An increase of C:N may be due to production of
a large quantity of EPS, which is a common response to unbalanced C:N metabolism;
under N limitation algae may produce extracellular polysaccharides as sink for reducing

22
power (Otero and Vincenzini, 2004). However, this explanation was not consistent with
the observed changes in C and N per cell. Overall, the increase in C:N ratio was due to a
strong decrease of total N cell-1
and a slight decrease of total C cell-1
(data not shown).
Total chlorophyll of NH4+-grown cells decreased from 0.32 pg cell
-1 (SD ±0.05 pg cell
-1)
at T1 to 0.12 pg cell-1
(SD ±0.02 pg cell-1
) at T3. In the urea cultures, total chlorophyll
decreased from 0.2 pg cell-1
(SD ±0.01 pg cell-1
) at T1 to 0.14 pg cell-1
(SD ±0.02 pg cell-
1) at T3 (Table 3).
Based on the decreases in chlorophyll cell-1
and increases in C:N, Aureoumbra
became N stressed over time in the batch cultures. These changes were already evident at
the mid-log time point, when medium nitrogen had become depleted. Despite the
physiological indications of N stress, the cells continued to grow through several more
divisions, indicating a divergence between growth and nitrogen uptake. This
incongruence complicates the determination of the physiological state of the Aureoumbra
cells at T2 and T3. In my opinion, since the growth rate remained exponential even after
the medium N was depleted (external N deficiency), I concluded that Aureoumbra
became internally N deficient only in the end of the log phase.
Although the Fv/Fm ratio is generally a very sensitive indicator of nitrogen
limitation in microalgae (Parkhill et al., 2001), there were no changes in the efficiency of
PSII during the experiments, indicating that Aureoumbra was somehow able to acclimate
and maintain photosynthetic function under nitrogen stress. Whereas Cullen et al. (1992)
and MacIntyre et al. (1997) showed that Thalassiosira pseudonana and Alexandrium
tamarense respectively maintained steady Fv/Fm values under N-limitation, Cruz et al.
(2003) suggested that when chlorophyll decreases in response to N limitation but Fm/Fm
remains stable, organisms are able to use different mechanisms for N repartition within

23
the cell. In both the urea- and NH4+–grown cells, Fv/Fm was close to 0.8 (Table 3) - an
indication of good physiological status (Figure 6E,F).
24
Figure 6: Physiological analysis of cells grown with NH4+ (A, C, E) and urea (B, D,
F). (A, B) C:N ratio (C, D) total chlorophyll cell-1
(E, F) Fv/Fm ratio. The arrows show when the RNA samples were collected during the experiment. Vertical bars represent standard deviation.
0.0
0.1
0.2
0.3
0.4
7 8 9 10 11 12
To
tal C
hlo
rop
hy
ll p
g/c
ell
0
5
10
15
20
7 8 9 10 11 12
C:N
ra
tio
0
0.2
0.4
0.6
0.8
1
7 8 9 10 11 12
Fv
/Fm
ra
tio
Days after inoculation
0.0
0.1
0.2
0.3
5 6 7 8 9 10 11
To
tal C
hlo
rop
hy
ll p
g/c
ell
0
10
20
30
40
5 6 7 8 9 10 11
C:N
ra
tio
0
0.2
0.4
0.6
0.8
1
5 6 7 8 9 10 11
Fv
/Fm
ra
tio
Days after inoculation
T1
T2
T3
T1 T2
T3
A B
C D
E F
25
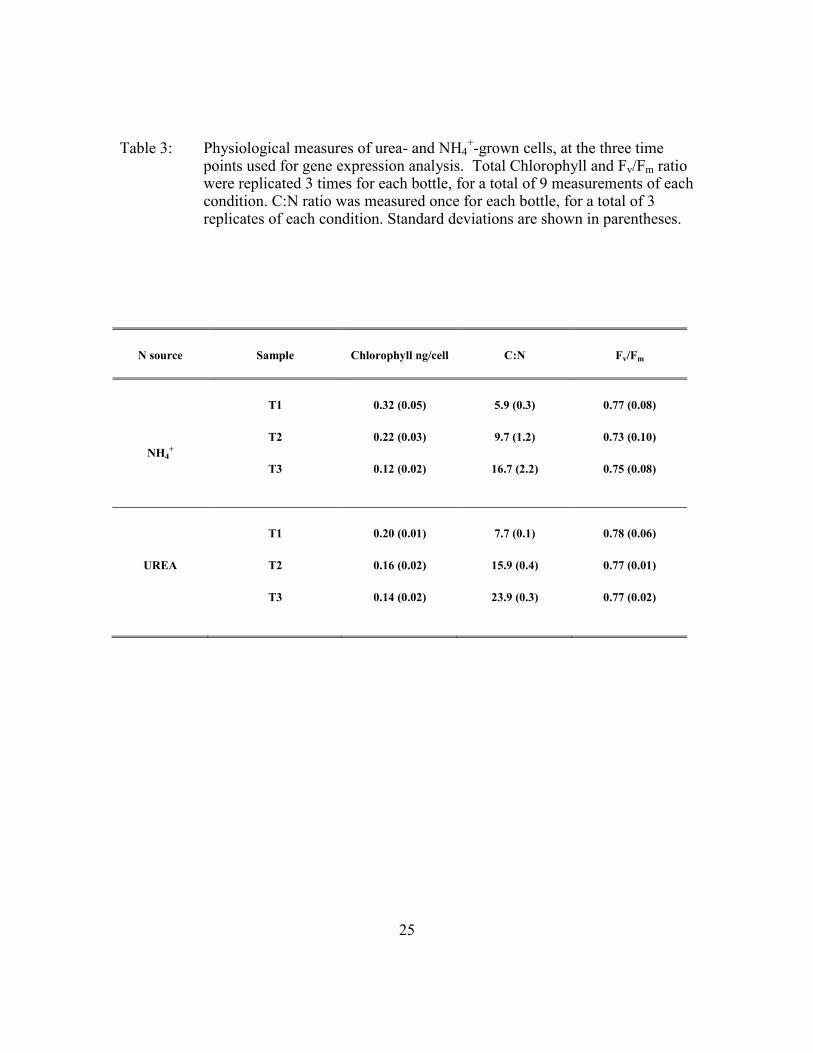
Table 3: Physiological measures of urea- and NH4+-grown cells, at the three time
points used for gene expression analysis. Total Chlorophyll and Fv/Fm ratio were replicated 3 times for each bottle, for a total of 9 measurements of each condition. C:N ratio was measured once for each bottle, for a total of 3 replicates of each condition. Standard deviations are shown in parentheses.
N source Sample Chlorophyll ng/cell C:N Fv/Fm
NH4+
T1 0.32 (0.05) 5.9 (0.3) 0.77 (0.08)
T2 0.22 (0.03) 9.7 (1.2) 0.73 (0.10)
T3 0.12 (0.02) 16.7 (2.2) 0.75 (0.08)
UREA
T1 0.20 (0.01) 7.7 (0.1) 0.78 (0.06)
T2 0.16 (0.02) 15.9 (0.4) 0.77 (0.01)
T3 0.14 (0.02) 23.9 (0.3) 0.77 (0.02)

26
Genetic analysis
Determining changes in the expression of genes involved in N assimilation as
well as their relative abundance might provide a means to assess N use and sufficiency in
Aureoumbra. Five genes were initially isolated for this analysis: UREC, ACT, EF1α,
AMT-1 and AMT-2. AMT and UREC are involved in nitrogen assimilation, and ACT and
EF1α were selected as potential housekeeping genes (Le Bail et al., 2008) for the qPCR
assays. To determine if ACT and EL1α genes might be used as reference genes, qPCR
was performed using the same quantity of cDNA from T1, T2, and T3. Unfortunately, the
expression of the two candidate reference genes repeatedly varied (approx. 10-fold) under
different conditions, such that they could not be considered as suitable housekeeping
genes. Thereafter, expression of UREC, AMT-1 and AMT-2 was normalized to the
starting amount of cDNA for each reaction (Libus and Štorchová, 2006).
AMT-1 was the only one of the three genes regulated by changing nitrogen
availability, and only by ammonium (Figure 7). When the medium NH4+ was depleted,
the expression of AMT-1 increased, and then expression decreased as the cells progressed
to late-exponential/stationary phase. However, even in late exponential phase (T3) the
relative expression level was higher than in early exponential (T1). In contrast,
expression levels of all 3 genes in urea-grown cells, and AMT-2 and UREC in NH4+-
grown cells, showed a drastic decrease in expression over time. In urea-grown cells,
expression of all the genes was drastically reduced throughout time, whereas in NH4+-
grown cells, the decrease in expression occurred only at T3. In early exponential phase
(T1), the expression of all three genes was similar in both the NH4+- and urea-grown
cells.

27
The ability of Aureoumbra to grow with urea and the presence of UREC
transcripts strongly suggest that Aureoumbra is able to hydrolyze urea to NH4+ (even
though the cultures contained bacteria - DAPI analysis not shown). Yet, greater
reductions in gene expression, higher C:N and lower chl cell-1
in urea-grown cells
suggests, not surprisingly, that Aureoumbra may favor ammonium as an N source.
Indeed, Muhlstein and Villareal (2007) calculated the maximum growth rate µmax under
different N sources in Aureoumbra (type strain TBA-2) and showed that NH4+
supported
higher growth rates than urea. In contrast, I did not find a difference in growth rate
between the two nitrogen sources (data not shown).
Furthermore, the standard error of the Ct values was much higher in the urea-
grown cells than in cells grown on NH4+. At T3 this result could be explained by the
different growth rate of bottle U3 in the last two days compared with the other two
replicates. Indeed, gene expression followed similar Ct values in bottles U1 and U2, but
not in bottle U3. However, it does not explain the difference at T2, where the growth rate
of the three bottles was similar, but the Ct values were different among all of the three
replicates. Possible explanations for this variability include stress or the presence of
bacteria. If bacteria were competing with Aureoumbra for the urea, and if bacteria types
or densities varied between the culture replicates, a different gene expression response
might occur among the three replicates. Also, physiological characteristics (based on the
lower chlorophyll cell-1
and higher C:N) of urea-grown cells suggest that these cells was
more stressed than in NH4+-grown cells, and that could lead to a greater variation in gene
expression.

28
Figure 7: Expression of the AMT-1, AMT-2 and UREC genes in cells grown on NH4+
(black bars) or urea (gray bars). Transcript levels are expressed as Ct (cycle threshold), which is inversely proportional to initial amount of cDNA target. Vertical bars represent the standard error. Major units in the Ct axis correspond to 10-fold change in relative gene expression.
14.00
17.32
20.64
23.96
27.28
T1 T2 T3
Ct
AMT-1
NH4
Urea
14.00
17.32
20.64
23.96
27.28
T1 T2 T3
Ct
AMT-2
NH4
Urea
14.00
17.32
20.64
23.96
27.28
T1 T2 T3
Ct
UREC
NH4
Urea
29
Gene expression assay
A secondary goal of the project was to determine whether gene expression assays
could be used to determine nitrogen source and sufficiency in Aureoumbra. Relative gene
expression levels could provide a tool to assess the physiological status of the cells with
respect to NH4+ and urea assimilation. In NH4
+-grown cells, AMT-1 was the only gene
increased by changes in NH4+ availability. Because of its contrasting pattern of
expression, AMT-1 is the best candidate as a gene indicator of N status, especially when
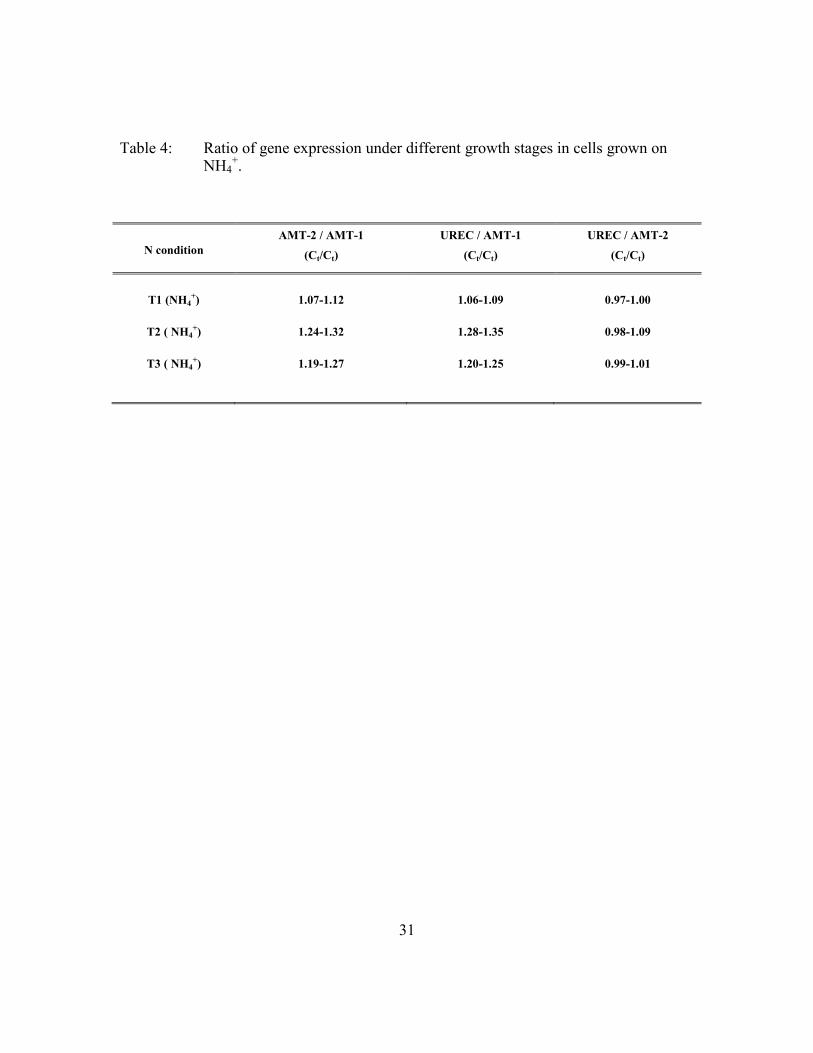
compared to AMT-2 or UREC expression. Table 4 shows the different Ct ratio between
the three genes in NH4+-grown cells during T1, T2, and T3. It is not possible to establish
a useful ratio in urea-grown cells, both because of the high standard error in relative gene
expression, and because the genes showed the same expression pattern during the three
physiological conditions. From these results, the UREC/AMT-1 ratio shows the largest
changes, and is thus the most promising indicator.
To assess the utility of this ratio for verifying N sufficiency or deficiency under
NH4+ growth of Aureoumbra, the first step was to verify significant differences among
the three growth conditions for each replicate bottle. The standard deviation among the
three bottles was 0.4 or less (Table 5), and the ratio of UREC/AMT-1 was significantly
different between all three time points (p<0.001) but not between bottles within a single
time point. However, whereas this ratio seems useful for evaluating the condition of
Aureoumbra in lab experiments when grown with ammonium, it has definite limitations.
At this point, I only have data for three discrete points in the growth curve, so it is
impossible from my data to know how the expression of these genes may vary at other
growth stages, e.g. very early log phase. In addition, I do not know how the ratio changes
(if it changes) when Aureoumbra grows under steady-state nitrogen limitation, as

30
opposed to the N starvation that occurs in batch culture. Moreover, these three ratios do
not change consistently with time or the severity of N stress. From T1 to T2 there is an
increase from 1.07 to 1.31, yet at T3 it decreases to 1.20 (Table 4). It will therefore be
hard to determine if any value between 1.20 and 1.31 corresponds to the progression from
N sufficiency to external N deficiency (T1-T2) or from external N deficiency to N
starvation (T2-T3). Hence, I cannot determine the N status of the cells from one
measurement. To resolve these issues I would need to perform additional culture
experiments to verify very early log phase and steady-state limitation gene expression.
Also perhaps I would need to perform some “blind” analyses with field samples, along
with nutrient measurements.
31
Table 4: Ratio of gene expression under different growth stages in cells grown on NH4
+.
N condition
AMT-2 / AMT-1
(Ct/Ct)
UREC / AMT-1
(Ct/Ct)
UREC / AMT-2
(Ct/Ct)
T1 (NH4+) 1.07-1.12 1.06-1.09 0.97-1.00
T2 ( NH4+) 1.24-1.32 1.28-1.35 0.98-1.09
T3 ( NH4+) 1.19-1.27 1.20-1.25 0.99-1.01

32
Table 5: Ratio UREC / AMT-1 in each experimental replicate under different NH4+
conditions.
UREC / AMT-1
(Ct/Ct) A1 A2 A3 SD
T1 1.08 1.09 1.06 0.02
T2 1.35 1.30 1.28 0.04
T2 1.22 1.20 1.25 0.02

33
CONCLUSION
Predicting the influences of nutrient availability on phytoplankton communities is
fundamental to understanding the present and future structure of marine food webs and
how physical forcing and nutrient limitations affect them. Since the gene expression of
UREC provided information on organic N assimilation in Aureoumbra, it is relevant to
consider the implications of enriching waters with urea. Urea is a fertilizer and feed
additive whose use has increased 100-fold in the last 40 years (Glibert et al., 2008). As
Aureoumbra can use urea to support its own N metabolism, discharge of this compound
to coastal waters may lead to an increase in algal blooms and could provide an advantage
to Aureoumbra in the field. Tracy Villareal (personal information, data not published)
monitored the presence of urea in the Laguna Madre from February 1997 to August 1998,
near the end of the long Aureoumbra bloom. Urea was consistently present in the Laguna
Madre together with NH4+ and NO3
-+NO2
-. Urea is an organic compound containing two
amine groups. Thus on a per molecule or per mole basis it provides twice as much N as
NH4+
or NO3-+NO2
-. For example, in one sample the NH4
+ concentration was twice that
of urea, such that the two compounds provided equimolar amounts of N. In July 1998, the
urea concentration was 4 times higher than NH4+ and 7 times higher than NO3
-+NO2
-; in
August 1998, urea was 132 times higher than NH4+ and 22 times higher than NO3
-+NO2
-.
Urea, therefore, may have been an important N source during the bloom.
Future directions
Similar experiments may be conducted with cultures using nitrite or amino acids
as the N source. Muhlstein and Villareal (2007) demonstrated Aureoumbra’s ability to
grow using these two different N sources. Fragments of the genes encoding Nitrite

34
Reductase (NiR) and Amino Acid Transporter (AAT) still remain to be cloned from
Aureoumbra. While analyses of AMT and UREC provided important information on
genes involved in inorganic vs. organic N assimilation, information on the presence and
regulation of AAT and NiR would improve our understanding of the physiology of this
alga. In particular, it would be very useful to determine if Aureoumbra possesses genes
involved in amino acid uptake. It is now recognized that amino acids, and DON in
general, can promote harmful algal blooms (Lewitus, 2007), but despite these advances,
there is a lack of marine food web models that incorporate DON and phytoplankton. It
would also be informative to determine if Aureoumbra has any uptake preference when
multiple N forms are present in the medium, e.g. both NH4+ and urea. By measuring
disappearance rate for each N form, I can understand the nitrogen preference in
Aureoumbra. By analyzing gene expression and physiological responses similarly to the
experiments above described, I can better understand how Aureoumbra copes in natural
environment where different nitrogen sources are present.
35
Appendix
Culture axenization
Since our project was focused on inorganic and organic nitrogen uptake, the
bacteria present in xenic cultures could compete with Aureoumbra for the substrate and
interfere with the analysis of nitrogen use. Therefore, we tried to axenize our cultures
following a variation of the protocol of Berg et al. (2002). Aureoumbra strain CCMP1509
was exposed to the following antibiotics sequentially during exponential growth:
Penicillin G (1.0mg ml-1
), Neomycin (0.25mg ml-1
), Gentamicin (0.25mg ml-1
),
Kanamycin (0.5mg ml-1
), Penicillin G (2.0mg ml-1
) (all antibiotics purchased from
VWR), and finally Ciprofloxacin (0.1 mg ml-1
) (Eaton Veterinary Laboratories). The
cultures were kept in antibiotic solution for no more than 15h. The day after exposure, 1
ml of the culture was added to 25ml antibiotic-free medium. The presence of bacteria was
determined by conducting PCR using universal bacterial primers SR-FWD 5‟-
AGAGTTTGATYMTGGC-3‟ (forward, positions 4–19 of Pasteurella haemolytica) and
SR-REV 5‟-GYTACCTTGTTACGACTT-3‟ (reverse, positions 1505–1488 of
Pasteurella haemolytica) (Davies et al., 1996). At the end of the multiple antibiotic
treatments, bacteria were still present in the cultures.
The antibiotic treatments may not have worked since the EPS layer could act as
refuge for heterotrophic bacteria, as shown by the fluorescent stain DAPI. A different
approach was tried to eliminate EPS from Aureoumbra. Cells were collected by
centrifugation (Eppendorf 5810R) at 800 x g for 4‟ and resuspended in a solution of 100
ml sterile 0.1M EDTA. The cells were then filtered onto a 3.0µm polycarbonate filter
(Whatman). Penicillin G (0.5mg ml-1
), Neomycin (0.2mg ml-1
), Gentamicin (0.2mg ml-1
),
and Ciprofloxacin (0.1mg ml-1
) were added. The day after treatment, 1ml of sample was

36
added to 25ml antibiotic-free medium. However the cells did not grow after EDTA
treatment and filtration.
37
Glossary
ACT – Aureoumbra actin gene
AMT-1 – Aureoumbra ammonium transporter gene 1
AMT-2 – Aureoumbra ammonium transporter gene 2
C:N – carbon to nitrogen ratio
Chl – chlorophyll
cDNA – complementary DNA
Ct – cycle threshold
DAPI - 4',6-diamidino-2-phenylindole
DCMU - 3‟,4‟-dichlorophenyl-1,1-dimethylurea
DIN – dissolved inorganic nitrogen
DNA - Deoxyribonucleic acid
DOC – dissolved organic carbon
DON – dissolved organic nitrogen
EDAB – ecosystem disruptive algal blooms
EF1α – Aureoumbra elongation factor 1 alpha gene
EPS – extracellular polymeric substance
Fv/Fm – Photosystem II efficiency
HAB – harmful algal blooms
mRNA – messenger RNA
N – nitrogen
NH4+ - ammonium cation
NO2- - nitrite ion
38
NO3- - nitrate ion
PCR – polymerase chain reaction
PSII - photosystem II
qPCR – quantitative real-time PCR
RNA – Ribonucleic acid
T1 – early log phase
T2 – middle log phase
T3 – end log phase
UREC – Aureoumbra urease C subunit gene
µmax – maximum growth rate

39
Bibliography
Baker K.M., Gobler K.J., & Collier J.L., 2009. Urease gene sequences from algae and heterotrophic bacteria in axenic and nonaxenic phytoplankton cultures. Journal of Phycology 45, 625-634
Behrenfeld M.J., O'Malley R.T., Siegel D.A., McClain C.R., Sarmiento J.L., Feldman G.C., Milligan A.J., Falkowski P.G., Letelier R.M. & Boss E.S. 2006. Climate-driven trends in contemporary ocean productivity. Nature 444, 752-755
Berg G.M., Repeta D.J., & Laroche J, 2002. Dissolved Organic Nitrogen Hydrolysis Rates in Axenic Cultures of Aureococcus anophagefferens (Pelagophyceae): Comparison with Heterotrophic Bacteria. Applied and Environmental Microbiology 68:401-404
Berg G.M., Repeta D.J., & LaRoche J., 2003. The role of the Picoeukaryote Aureococcus anophagefferens in cycling of marine high-molecular weight dissolved organic nitrogen. Limnology and Oceanography 48, 1825-1830
Berg G.M., Shrager J., Gloeckner G., Arrigo K.R., & Grossman A.R., 2008. Understanding nitrogen limitation in Aureococcus anophagefferens (Pelagophyceae) through cDNA and qRT-PCR analysis. Journal of Phycology 44, 1235-1249
Berges J. A., Charlebois D. O., Mauzerall D. C., & Falkowski P. G., 1996. Differential effects of nitrogen limitation on photosynthetic efficiency of photosystems I and II in microalgae. Plant Physiology 110, 689-696.
Berges J.A., Mulholland M., 2008. Enzymes and N cycling. Nitrogen in the Marine Environment
Bhaskar P.V., Bhosle N.B., 2006. Bacterial extracellular polymeric substance (EPS): A carrier of heavy metals in the marine food-chain. Environment International 32, 191-198
Bolleter W.T., Bushman T.R., & Tidwell P.W., 1961. Spectrophotometric determination of ammonia as indophenol. Analytical Chemistry 592-594.
Buskey E.J., Liu H., Collumb C., Guilherme J., & Bersano F., 2001. The decline and recovery of a persistent Texas brown tide algal bloom in the Laguna Madre (Texas, USA). Estuaries and Coasts 24, 337-346

40
Chen C., Gillig D., & McCarl B.A., 2001. Effects of climatic change on a water dependent regional economy: a study of the Texas Edwards aquifer. Climatic Change 49, 397–409
Collos Y., 1986 Time-lag algal growth dynamics - biological constraints on primary production in aquatic environments. Marine Ecology Progress Series 33, 193-206
Cullen J.J., Yang X., & MacIntyre H.L., 1992. Nutrient limitation of marine photosynthesis. In Falkowski, P. G. & Woodhead, A. D. [Eds.] Primary Productivity and Biogeochemical Cycles in the Sea. Plenum Press, New York, pp. 69–88
Cunningham A., & Maas P., 1978. Time lag and nutrient storage effects in the transient growth response of Chlamydomonas reinhardii in nitrogen-limited batch and continuous culture. Journal of General Microbiology 104, 227-231
Cruz J.L., Mosquim P.R., Pelacani C.R., Araújo W.L. & DaMatta F.M., 2003. Photosynthesis impairment in cassava leaves in response to nitrogen deficiency. Plant and Soil 257, 417–423
Davies R.L., Paster B.J., & Dewhirst F.E., 1996. Phylogenetic relationships and diversity within the Pasteurella haemolytica complex based on 16S rRNA sequence comparison and outer membrane protein and lipopolysaccharide analysis. International Journal of Systematic Bacteriology 46, 736–744
DeYoe H.R., & Suttle C.A., 1994. The inability of the Texas "brown tide" alga to use nitrate and the role of nitrogen in the initiation of a persistent bloom of this organism. Journal of Phycology 5, 800-806
DeYoe H.R., Buskey E.J., & Jochem F.J., 2007. Physiological responses of Aureoumbra lagunensis and Synechococcus sp. to nitrogen addition in a mesocosm experiment. Harmful Algae 1, 48-55
Deyoe H.R., Stockwell D.A., Bidigare R.R., Latasa M., Johnson P.W., Hargraves P.E., & Suttle C.A., 1997. Description and characterization of the algal species Aureoumbra lagunensis gen. et sp. nov. and referral of Aureoumbra and Aureococcus to the pelagophyceae. Journal of phycology 33, 1042-1048
Falkowski P.G., & Oliver M.G., 2007. Mix and match: how climate selects phytoplankton. Nature Reviews Microbiology 5, 813-819
Falkowski P.G., Barber R.T., & Smetacek V. 1998. Biogeochemical Controls and Feedbacks on Ocean Primary Production. Science 281, 200-206
41
Fogg G.E., Thake B., 1987. Algal cultures and phytoplankton ecology. University of Wisconsin Press, Madison, WI
Glibert M.P., et al. , 2008. Ocean urea fertilization for carbon credits poses high ecological risks. Marine Pollution Bulletin 56, 1049–1056.
Gobler C.G., Cosper E.M., 1996. Stimulation of „brown tide‟ blooms by iron. In: Yasumoto T, Oshima Y, Fukuyo Y (eds) Harmful and toxic algal blooms. UNESCO, Paris, pp 321–324
Grover J.P., 1991. Resource competition in a variable environment: phytoplankton growing according to the variable internal-stores model. The American Naturalist 138:811–835
Guillard R.R.L., 1975. Culture of phytoplankton for feeding marine invertebrates, p. 29-60. In W. L. Smith and M. H. Chanley (ed.), Culture of marine invertebrate animals. Plenum Press, New York.
Herzig R., & Falkowski P.G., 1989. Nitrogen limitation in Isochrysis galbana (Haptophyceae). I. Photosynthetic energy conversion and growth efficiencies. Journal of Phycology 25, 462-471
Hildebrand M., 2005. Cloning and functional characterization of ammonium transporters from the marine diatom Cylindrotheca fusiformis (Bacillariophyceae). Journal of Phycology 4,105–13.
Houghton J. T., Meira L.G., Filho B.A., Harris C. N., Kattenberg A., & Maskell K. 1995. Eds., Climate Change 1995: The Science of Climate Change, Cambridge Univ. Press, Cambridge
Kaster K. M., Grigoriyan A., Jenneman G., & Voordouw G., 2007. Effect of nitrate and nitrite on sulfide production by two thermophilic, sulfate-reducing enrichments from an oil field in the North Sea Applied. Microbiology and Biotechnology 75, 195–203
Laroche J., Nuzzi, R., Waters R., Wyman K., Falkowski P., & Wallace D., 1997. Brown tide blooms in Long Island's coastal waters linked to interannual variability in groundwater flow. Global Change Biology 3, 397-410
Le Bail A., Dittami S.M., de Franco P.O., Rousvoal S., Cock M., Tonon T., Charrier B., 2008. Normalisation genes for expression analyses in the brown alga model Ectocarpus siliculosus. Bmc Mol Biol 9, 75
Lewitus A. J., 2006. Osmotrophy in marine microalgae, in: Algal cultures analogues and blooms, edited by: Subba Rao, D. V., Science Publishers, Inc., Enfield, New Hampshire

42
Libus J., & Štorchová H., 2006. Quantification of cDNA generated by reverse transcription of total RNA provides a simple alternative tool for quantitative RT-PCR normalization. BioTechniques 41:156-164
Litchman E., Klausmeier C. A., Miller J. R., Schofield O. M., & Falkowski P. G., 2006. Multi-nutrient, multi-group model of present and future oceanic phytoplankton communities. Biogeosciences Discussions 3, 607–663
Liu H., & Buskey E.J., 2000. Hypersalinity enhances the production of extracellular polymeric substance (EPS) in the texas brown tide alga, Aureoumbra lagunensis (pelagophyceae). Journal of Phycology 1, 71-77
Liu H., Villareal T.A., & Buskey E.J., 2001. Nutrient-limited growth of Aureoumbra lagunensis (pelagophyceae), with implications for its capability to outgrow other phytoplankton species in phosphate-limited environments. Journal of Phycology 4, 500-508
Lomas M. W., 2004. Nitrate reductase and urease enzyme activity in the marine diatom Thalassiosira weissflogii (Bacillariophyceae): interactions among nitrogen substrates Marine Biology 144, 37–44
MacIntyre J.G., Cullen J.J. & Cembella A.D., 1997. Vertical migration, nutrition and toxicity in the dinoflagellate Alexandrium tamarense. Marine Ecology Progress Series 148, 201–216.
McCarthy J. J., 1970 A urease method for urea in seawater. Limnol. Oceanogr. 15, 309-313
Muhlstein H., & Villareal T.A., 2007. Organic and inorganic nutrient effects on growth rate-irradiance relationships in the Texas brown-tide alga Aureoumbra lagunensis (Pelagophyceae). Journal of Phycology 43, 1223-1226
Naidoo A.D., 1999. Brown tides in Saldanha Bay. Research Highlights 1998–1999. Directorate of Marine and Coastal Management, South African Department of Environmental Affairs and Tourism, Cape Town, pp. 46– 50
Otero A., & Vincenzini M., 2004. Nostoc (cyanophyceae) goes nude: extracellular polysaccharides serve as a sink for reducing power under unbalanced C/N metabolism. Journal of Phycology 40, 74-81
Parkhill J., Maillet G., & Cullen J.J., 2001. Fluorescence-based maximal quantum yield for PSII as a diagnostic of nutrient stress. Journal of Phycology 37, 517–529
Parsons T.R., Maita Y., Lalli C.M., 1984. A manual of chemical and biological methods for seawater analysis. Pergamon, New York
43
Pedersen H.M., & Sand-Jensen K., 1995. Size-dependent nitrogen uptake in micro- and macroalgae. Marine ecology progress series 118, 247-253
Peers S., Milligan A., & Harrison P. (2000). Assay optimization and regulation of urease activity in two marine diatoms. Journal of Phycology 36, 523–528
Pitcher G.C., & Calder D., 2000. Harmful algal blooms of the southern Benguela Current: a review and appraisal of monitoring from 1989 to 1997. S. Afr. J. Mar. Sci. 22, 255– 71
Probyn T., Pitcher G., Pienaar R., & Nuzzi R., 2001. Brown tides and mariculture in Saldanha Bay, South Africa. Mar. Pollut. Bull.43, 405–408
Pustizzi F., MacIntyre H., Warner M.E. & Hutchins D.A., 2004. Interaction of nitrogen source and light intensity on the growth and photosynthesis of the brown tide alga Aureococcus anophagefferens. Harmful Algae 3, 343-360
Raven J.A., & Kübler J.E., 2002. New light on the scaling of metabolic rate with the size of algae. Journal of Phycology 38, 11-16
Revilla, M., Alexander, J, and Glibert, P. M. 2005. Urea analysis in coastal waters: comparison of enzymatic and direct methods. Limnology and Oceanography: Methods 3:290-299.
Sarmiento J., Hughes T., Stouffer R., & Manabe S. 1998. Simulated response of the ocean carbon cycle to anthropogenic climate warming. Nature 393, 245-249
Schaefer S.C., & Alber M., 2007. Temperature controls a latitudinal gradient in the proportion of watershed nitrogen exported to coastal ecosystems. Biogeochemistry, 85, 333–346
Sciandra A., 1991. Coupling and uncoupling between nitrate uptake and growth rate in Prorocentrum minimum (Dinophyceae) under different frequencies of pulsed nitrate supply. Marine ecology progress series 72, 261-269
Shormann D.E., 1992. The effects of freshwater inflow and hydrography on the distribution of brown tide in south Texas. M.A. Thesis, University of Texas, Austin, Texas
Sommer U., 1985. Comparison between steady state and nonsteady state competition: experiments with natural phytoplankton. Limnology and Oceanography 30:335–346
Stockwell D.A., Buskey E.J., & Whitledge T.E., 1993. Studies on conditions conducive to the development and maintenance of a persistent "brown tide" in Laguna Madre, Texas, T.J.

44
Strickland J.D.H., & Parsons T.R., 1968. Determination of Ammonia. A Practical Handbook of Seawater Analysis. Fisheries Research Board of Canada, Ottawa, 310 pp
Sunda W.G., Hardison D.R., Shertzer K, Gobler C., & Graneli E., 2006. Positive feedback and the development and persistence of ecosystem disruptive algal blooms. Journal of Phycology 42, 963-974
Villareal T.A., Chirichella T., & Buskey E.J., 2004. Regional distribution of the Texas Brown Tide (Aureoumbra lagunensis) in the Gulf of Mexico. In: Steidinger, K.A., J.H. Landsberg, C.R. Tomas and g.a. Vargo (eds.) Harmaful algae 2002. Florida Fish and Wildlife Conservation Commission, Florida Institute of Oceanography, IOC-UNESCO, St. Petersburg, USA, 374-376
Warwick, F. V., Neale, P.J., Richerson, P.J. 1984. Photoinhibition: algal responses to bright light during diel stratification and mixing in a tropical alpine lake. Journal of Phycology 2:201-211
Ziegler S., Kaiser E., & Benner R., 2004. Dynamics of dissolved organic carbon, nitrogen and phosphorus in a seagrass meadow of Laguna Madre, Texas. Bulletin of Marine 75, 391-407
45
Vita
Marco Agostoni was born in Milan, in the country of Italy on the 7th
of February,
1977 to Claudio Agostoni and Rosanna Ginevoli. He attended the ITIS Feltrinelli for his
high school education and. He started his undergraduate education at the University of
Ancona, Italy in 2003 from where he graduated in November 2006 with a B.S. in Marine
Biology. During his senior year at the University of Ancona, Marco worked on the
development of FTIR method for the taxonomic characterization of algal samples and for
biodiversity studies. In September 2007, Marco started a masters program in the
University of Texas at Austin Marine Science Institute.
Permanent address: Via Ramponi 20, Canonica D‟adda (BG), 24040, Italy
This thesis was typed by the author.