copyright by sarah jane harris 2010
TRANSCRIPT

Copyright
By
Sarah Jane Harris
2010
The Dissertation Committee for Sarah Jane Harris certifies that this is the approved
version of the following dissertation:
The Relationship between Teacher Pedagogical Content Knowledge and
Student Understanding of Integer Operations
Committee:
__________________________
Taylor Martin, Supervisor
__________________________
Leema Berland, Co-Supervisor
__________________________
James Barufaldi
__________________________
Jill Marshall
__________________________
Keenan Pituch

The Relationship between Teacher Pedagogical Content Knowledge and
Student Understanding of Integer Operations
By
Sarah Jane Harris, BA; M.Ed.
Dissertation
Presented to the Faculty of the Graduate School of
The University of Texas at Austin
in Partial Fulfillment
of the Requirements
for the Degree of
Doctor of Philosophy
The University of Texas at Austin
December 2010

iv
Acknowledgements
Since 1993 I have been trying to improve how I teach students about integers and
integer operations. I have tried different teaching strategies, different models for integers,
and listened carefully to my student‘s frustration as they try to understand what should
not be so challenging. I would like to thank all of my students for your patience with me
as I tried to re-explain or show you how to follow rules for operations when I didn‘t
know that telling people rules wasn‘t the best way to help them learn. Hopefully this
research will help other teachers who practice telling rules to students in math classes to
try letting their students talk to each other to figure it out for themselves. Math class
could be so much more enjoyable that way. I would like to thank Norma, for providing
me with great experiences to facilitate Professional Development for teachers, to work
with the Jumpstart program the past three years, and for challenging me all the time to
think about how to make math more rigorous by getting students engaged in doing
mathematics, talking about mathematics, and using technology as a tool for
communicating in the 21st century.
I would like to thank my parents, Margie and Ken Harris, my brothers, Joel and
Tim, and my sister Mary, for your constant prayers, encouragement and support
especially when I really wanted to give up. Even though we are separated by half a
continent, I have felt your love and support throughout this challenging experience. I
would also like to thank my friend, John, for your unconditional friendship over the years
as I spent most waking hours with my head in a book or my fingers typing on a computer.

v
Third, I would like to thank my friends Shireen, Carmen, and Margaret for getting me out
of the house to go to tea to get a break from studying and for your friendship even though
I did not have much time to offer. You have been my family the past eight years while I
moved far from home to pursue a Ph.D.
I also would like to thank my advisor, Dr. Taylor Martin, for providing me with
many opportunities to become immersed in research; nothing like learning by doing.
Thanks for modeling how to stay immensely busy with many research projects,
collaborating with teams of researchers, yet still finding time to write and climb
mountains. I am happiest when I am living like that, too! Thanks for inviting me to
participate in the Active Learning Lab, at UT Austin. I would like to thank all the lab
members past and present – Stephanie R., Vanessa, Christina, Stephanie P., Carmen,
Tom, Pat, Bill, and Eugenie– for your encouragement and support through my pilot study
and dissertation study providing me great feedback and suggestions to improve my
research project.
I would also like to thank the rest of my committee for taking time out of your
busy schedule to support me in the last year of the program as I finish the requirements
for a Ph.D in mathematics education. Thank you, Dr. Jim Barufaldi, I learned so much
from your class on teacher professional development about the importance of
collaborating with lots of educational partners to impact student understanding and to
find creative ways to reach teachers with professional development in a meaningful way
that meets their needs and results in an impact on student achievement.

vi
Thank you, Dr. Leema Berland for introducing to our Active Learning Lab the
idea of argumentation in science which I decided could be really important to think about
for mathematics, too. Thank you for all your support in helping me to design the
professional development for the teachers in my study so that they would experience
argumentation first hand, and challenging any plans where I was doing more telling and
not allowing the teachers to do the talking and thinking. It was such a great experience to
see teachers interested in arguing about math for a long period of time during the
professional development, struggling over differences in perspective on a problem.
Thank you, Dr. Jill Marshall, for challenging me with great questions about the
application of the vector model for integer operations. Thank you for sharing some of
your physics resources so I could improve my content knowledge of vectors to think
about how to help teachers understand this vector model of integers. Thank you for
challenging me to consider issues of equity when designing curriculum and professional
development for this project. The curriculum and instruction improvements to the
Jumpstart program could not have been possible without this guidance that caused me to
move beyond a focus on misconceptions to a focus on opportunities for all students to
learn.
Thank you Dr. Keenan Pituch for introducing me to Hierarchical Linear Modeling
(HLM) which ended up being so important as I ended up using this method for work on
several research projects over the past year, and plan to continue using HLM analysis in
the future. I appreciate your participation on my committee and suggestions for
improvements on my models from my proposal. Thank you for allowing me to ask
vii
questions as I tried different models and different interpretations. I appreciate all of your
support through this process.
I would like to thank all of the students in the Science and Mathematics Education
program at The University of Texas. Those of you I have known for many years, Linda,
Teddy, Luz, Bryan, Steven, Jessica and those I have gotten to know more recently,
Barbara, Candace, Chris, and Nani. Thanks for your friendship, kindness and
encouragement. Good luck in your future adventures in education.
I would like to give special thanks to Carmen and Stephanie P. for helping me to
conduct the pilot study and the research for this dissertation study by interviewing
students and assisting me with data collection. This work would not have been possible
without your assistance. Thank you for giving of your time to collaborate in this research
project and for your critical feedback along the way that helped to improve this study. I
would also like to thank Leslie and Lauren, two new friends and co-workers, for
supporting me during the final days of finishing this dissertation by being a sounding
board for different ideas and for helping me to think through the analysis and
interpretation of the data I collected for this study to ensure appropriate conclusions from
the results. As recent graduates, and current researchers, I appreciate the time you have
taken to mentor me in the methods of conducting rigorous educational research.
I will close by thanking God for ongoing guidance, wisdom, discernment, and
provision over the past 7 years in all of my work in this graduate program and in life. I
could not do this without you!
viii
The Relationship between Teacher Pedagogical Content Knowledge and
Student Understanding of Integer Operations
Sarah Jane Harris, Ph.D.
The University of Texas at Austin, 2010
Supervisor: Taylor Martin
Co-Supervisor: Leema Berland
The purpose of this study was to determine whether a professional development
(PD) for teachers focused on improving teacher pedagogical content knowledge (PCK)
related to operations with integers would improve teacher PCK and if there was a
relationship between their level of PCK and the change in the understanding of their
students as measured by pre- and posttest of teacher and student knowledge. The study
was conducted summer 2010 in a large urban school district on two campuses providing a
district funded annual summer intervention, called Jumpstart. This program was for
grade 8 students who did not pass the state assessment (Texas Assessment of Knowledge
and Skills), but would be promoted to high school in the Fall 2010 due to a decision made
by the Grade Placement Committee. The Jumpstart program involved 22 teachers and
341 students.

ix
For purposes of this study, changes were made to the PD and typical curriculum
for a unit on integer operations to promote teacher and student conceptual understanding
through a process of mathematical discussion called argumentation. The teachers and
students explored a comprehensive representation for integer operations called a vector
number line model using the Texas Instruments TI-73 calculator Numln application.
During PD, teachers engaged in argumentation to make claims about strategies to use to
understand integer operations and to explain their understanding of how different
representations are connected.
The results showed statistically significant growth in teacher PCK following the
professional development and statistically significant growth in student understanding
from pre- to posttest compared to the students who participated in the program the
previous year. The findings also showed that there was a statistically significant
association between teacher posttest PCK and student improvement in understanding
even when controlling for years of teaching experience, teacher pretest knowledge, and
student pretest score. This adds to the research base additional evidence that professional
development focused on teacher pedagogical content knowledge can have a positive
effect on student achievement, even with just a short period of PD (6 hours in this case).
x
Table of Contents
TABLES .......................................................................................................................... xvi
FIGURES ......................................................................................................................... xix
CHAPTER ONE: INTRODUCTION ................................................................................. 1
Rationale ......................................................................................................................... 1
Pedagogical Content Knowledge .................................................................................... 3
Proposed Intervention Based on Pilot Study Results ...................................................... 4
Student Discourse about Mathematics ............................................................................ 5
Methods and Research Questions ................................................................................... 7
CHAPTER TWO: LITERATURE REVIEW ................................................................... 14
Developing an Understanding of Integer Operations ................................................... 14
Laying a Foundation: Kindergarten to Grade 2 ........................................................ 16
Early Introduction and Exploration: Grades 3-5 ....................................................... 18
Investigations: Grades 5-8 ........................................................................................ 21
Remediation and Application: Grades 9-12 .............................................................. 31
Limitations and Future Directions ............................................................................ 34
Use of Argumentation to Improve Student Understanding .......................................... 35
Teacher Professional Development .............................................................................. 39

xi
Helping Teachers Understand Common Student Misconceptions ........................... 40
Teacher Facilitation of Mathematical Conversations Using Argumentation ........... 43
Improving Teacher Content Knowledge Related to Integer Operations .................. 46
Developing and Researching Professional Development ......................................... 48
Conclusion .................................................................................................................... 53
CHAPTER THREE: THE PILOT STUDY ...................................................................... 55
A Pilot Study to Explore Student Understanding of Integers ....................................... 55
Research Question ........................................................................................................ 55
Research Sub-questions ............................................................................................ 55
Methods......................................................................................................................... 56
Participants ................................................................................................................ 56
Results ........................................................................................................................... 58
Student Question 1 .................................................................................................... 58
Student Question 2 .................................................................................................... 59
Student Question 3 .................................................................................................... 60
Student Question 4 .................................................................................................... 66
Student Question 5 .................................................................................................... 67
Student Question 6 .................................................................................................... 68
Discussion ..................................................................................................................... 69
xii
Re-Analysis of Pilot Study Data for Grades 7 and 9 ................................................ 69
Findings and Instructional Implications........................................................................ 75
CHAPTER FOUR: METHODOLOGY AND STUDY DESIGN .................................... 77
Study Background ......................................................................................................... 77
Research Questions ....................................................................................................... 79
Study Design ................................................................................................................. 80
Participant Recruitment ............................................................................................ 80
Participants ................................................................................................................ 82
Materials: Curriculum Revision ................................................................................ 83
Teacher Professional Development .......................................................................... 86
Data Collection Measures ......................................................................................... 92
Data Analysis ............................................................................................................ 96
Unconditional Model .............................................................................................. 100
Unconditional Model with Slope as Fixed Effect at Level 2 .................................. 101
Fully Conditional Model ......................................................................................... 101
CHAPTER FIVE: FINDINGS ........................................................................................ 103
Analysis of Differences Between Teachers ................................................................ 103
Research Question 1 ............................................................................................... 103
Research Question 2 ............................................................................................... 106
xiii
Comparison of Student Achievement (Jumpstart 2009 vs. 2010) .............................. 108
Research Question 3 ............................................................................................... 108
Hierarchical Linear Model Analysis ........................................................................... 112
Research Question 4: .............................................................................................. 112
Comparison of Teacher and Student Constructivist Learning Environment Survey
................................................................................................................................. 117
Research Question 5 ................................................................................................... 121
Subsample Exploratory Analysis of Strategy Use ...................................................... 123
CHAPTER SIX: STUDENT FOCUS GROUP INTERVIEWS ..................................... 130
Using a Number Line .................................................................................................. 131
Stories and Memory Strategies ............................................................................... 133
Ranking Different Strategies................................................................................... 133
Rules without Understanding .................................................................................. 134
Argumentation Around Subtraction of Integers: 5 – 12 ......................................... 135
CHAPTER SEVEN: CONCLUSIONS AND RECOMMENDATIONS ....................... 138
Research Questions and Conclusions ......................................................................... 138
Comparison to Findings of Previous Research ........................................................... 141
Strengths of This Study ............................................................................................... 142
Limitations .................................................................................................................. 144

xiv
Analytic Sample of Teachers .................................................................................. 144
Analytic Sample of Students ................................................................................... 144
Specific Sample Characteristics .............................................................................. 145
Changes in Teacher Knowledge ............................................................................. 146
Changes in Student Understanding of Integers ....................................................... 146
Constructivist Learning Environment Survey ........................................................ 147
Implications and Future Directions ............................................................................. 148
Implications for Professional Development............................................................ 148
Implications for Pre-service Teacher Preparation ................................................... 149
Implications for Equity ........................................................................................... 149
Future Directions .................................................................................................... 151
General Discussion ..................................................................................................... 152
Appendix A: Integer Unit Daily Overview ...................................................................... xix
Appendix B: Sample Misconceptions Prompts for Discussion ..................................... xxiii
Comparing Numbers .................................................................................................. xxiii
Adding Integers .......................................................................................................... xxiii
Subtracting Integers ................................................................................................... xxiv
Multiplication of Integers .......................................................................................... xxiv
Appendix C: July 8, 2010 Professional Development Overview .................................. xxvi

xv
Appendix D. Teacher Content & Pedagogy Assessment .............................................. xxxii
Appendix E: Teacher Demographic Survey ................................................................ xxxiii
Appendix F: Student Assessments ............................................................................... xxxiv
Appendix G: Rubric for Scoring Teacher PCK ........................................................... xxxvi
Appendix H: Student Focus Group Questions ........................................................... xxxviii
Appendix I: Real World and Domain Applications of Integers .................................. xxxix
Appendix J. Box Plots Comparing Student and Teacher CLES Survey Responses. ........ xli
Appendix K. Statistically Significant Correlations ....................................................... xlvii
Appendix L. Correlation Matrix- Teacher/Classroom Level ........................................ xlviii
Appendix M: Jumpstart 2010 Student Focus Group Interviews ..................................... xlix
Transcription Conducted by Sarah Harris 09/18/10 ................................................... xlix
Transcription Codes: ............................................................................................... xlix
Interview 1 .............................................................................................................. xlix
Interview 2 ................................................................................................................. lii
Interview 3 ................................................................................................................ liv
Interview 4 ................................................................................................................ lvi
References ....................................................................................................................... lviii
VITA ................................................................................................................................ lxx

xvi
TABLES
Table 1 State Mathematics Assessment (TAKS) Performance for the Sample .............. 57
Table 2 Percent of Students Using Strategies for Comparing Integers .......................... 59
Table 3 Percent of Students Using Alternative Strategies for Comparing Numbers ...... 60
Table 4 Percent of Students Using Strategies for Integer Addition Problem: -5 + 8 = ? 61
Table 5 Percent of Students Using Strategies for Integer Addition Problem: -3 +
-6 = ? 62
Table 6 Percent of Students Using Strategies for Integer Subtraction Problem: 2 – 7 = ?
........................................................................................................................................... 63
Table 7 Percent of Students Using Strategies for Integer Subtraction Problem: -3 – 5 = ?
........................................................................................................................................... 64
Table 8 Percent of Students Using Strategies for Integer Multiplication: -4 x 5 = ? ...... 65
Table 9 Overall Percent Accuracy of Integer Arithmetic ............................................... 66
Table 10 Percent of Students Using Representations to Solve Problems ....................... 67
Table 11 Number of Students with Different Locations of Integer Applications ........... 68
Table 12 Percent of Students Sharing Reasons for Importance of Negative Numbers .. 69
Table 13 Representative Statements for Rule-based Understanding .............................. 70
Table 14 Representative Statements for Connected Understanding ............................... 71
Table 15 Percent of Student Responses for Integer Subtraction Problem: ―2 – 7 = ?‖ .. 72
Table 16 Percent of Student Responses for Integer Subtraction Problem: ―-3 – 5 = ?‖ . 72
Table 17 Percent of Students with Each Type of Understanding ................................... 75
Table 18 Jumpstart 2009 Pretest and Posttest Results .................................................... 77

xvii
Table 19 Characteristics of Jumpstart 2010 Participating Teachers (N = 21) ................ 83
Table 20 Pedagogical Content Knowledge Assessment Performance (Percent of 100)
......................................................................................................................................... 104
Table 21 Item Analysis for Pedagogical Content Knowledge Assessments ................ 106
Table 22 Comparison of Pretest and Posttest Results by Question .............................. 107
Table 23 Comparison of the Performance of Students in Jumpstart 2009 vs. 2010 ..... 112
Table 24 Two-level Model Estimates of the Impact of Teacher Pedagogical Knowledge
on Student Performance on the Positive and Negative Numbers Posttest ...................... 116
Table 25 Constructivist Learning Environment Survey Responses (N = 21) ............... 118
Table 26 Description of the Subsample Average Scores on Outcome Measures (Percent
of 100) ............................................................................................................................. 120
Table 27 Comparison of Teacher and Student Responses to the Constructivist Learning
Environment Survey ....................................................................................................... 122
Table 28 Percent of Students Using Different Strategies on Pretest and Posttest ........ 124
Table 29 Change in Percent of Students Using Different Strategies from Pretest to
Posttest ............................................................................................................................ 124
Table 30 Comparison of Students Pre and Post Assessment by Problem Type (n = 70)
......................................................................................................................................... 126
Table 31 Statistically Significant Correlations between Subtest Scores and Strategy Use
......................................................................................................................................... 127
Table 32 Distribution of the 70 Participating Students with Pretest and Posttest Results
by Classroom .................................................................................................................. 128

xviii
Table 33 Percentage of Teachers with Similar Ratings as students: Relevance ............. xli
Table 34 Percentage of Teachers with Similar Ratings as students on Uncertainty ...... xlii
Table 35 Percentage of Teachers with Similar Ratings as students on Critical Voice . xliii
Table 36 Percentage of Teachers with Similar Ratings as students on Shared Control xliv
Table 37 Percentage of Teachers with Similar Ratings as students on Negotiation ...... xlv
Table 38 Percentage of Teachers with Similar Ratings as students Overall ................. xlvi

xix
FIGURES
Figure 1 Theory of change for this research study created by Sarah Harris 1/15/10 ...... 10
Figure 2 Example of the misuse of a memory device for multiplication/division of
integers .............................................................................................................................. 74
Figure 3 Number line Model for Subtraction as Directed Difference ............................ 79
Figure 4 Number line Model for Multiplication of 4 x -2 ............................................... 84
Figure 5 Jumpstart 2009 pretest student performance. ................................................. 109
Figure 6 Jumpstart 2009 posttest student performance................................................. 109
Figure 7 Jumpstart 2010 pretest student performance. ................................................. 110
Figure 8 Jumpstart 2010 posttest student performance................................................. 110
Figure 9 Box Plot of Teacher and Student Ratings of Relevance on the CLES Survey. xli
Figure 10 Box Plot of Teacher and Student Ratings of Uncertainty on the CLES Survey
.......................................................................................................................................... xlii
Figure 11 Box Plot of Teacher and Student Ratings of Critical Voice on the CLES ... xliii
Figure 12 Box Plot of Teacher and Student Ratings of Shared Control on the CLES . xliv
Figure 13 Box Plot of Teacher and Student Ratings of Negotiation on the CLES Survey
.......................................................................................................................................... xlv
Figure 14 Box Plot of Teacher and Student Ratings on the CLES Survey Overall...... xlvi

1
CHAPTER ONE: INTRODUCTION
Rationale
Improving student understanding of integers and operations with integers is
important for many educators; however, there is not one instructional model for integer
operations that seems satisfactory in explaining all integer operations. Integers are the set
of positive whole numbers, negative whole numbers and zero. Integers are a number and
operations concept that is foundational in mathematics, and used in applications in other
fields such as science, business, and statistics. However, students struggle with this
foundational concept, particularly around negative numbers (Ryan & Williams, 2007). A
minor calculation error impacting the sign of a solution can have a serious impact on the
answer because it may result in an inaccurate interpretation of the situation. For example,
in a physics class, a solution to a problem related to force that is inaccurately calculated
as a positive number results in a misunderstanding of the direction of the force. Many
students struggle with understanding integers and accuracy of computation with integers.
This weakness is seen in errors on student work in middle school math computation
problems, high school algebra equations, and even in college mathematics, statistics, and
science coursework.
The mathematics education community has struggled to find an instructional
model that effectively supports students in constructing a rich conceptual understanding
of integers and of negative numbers, in particular. Such a model would need to address
the purpose of the negative numbers and justify the arithmetical operations on them in
2
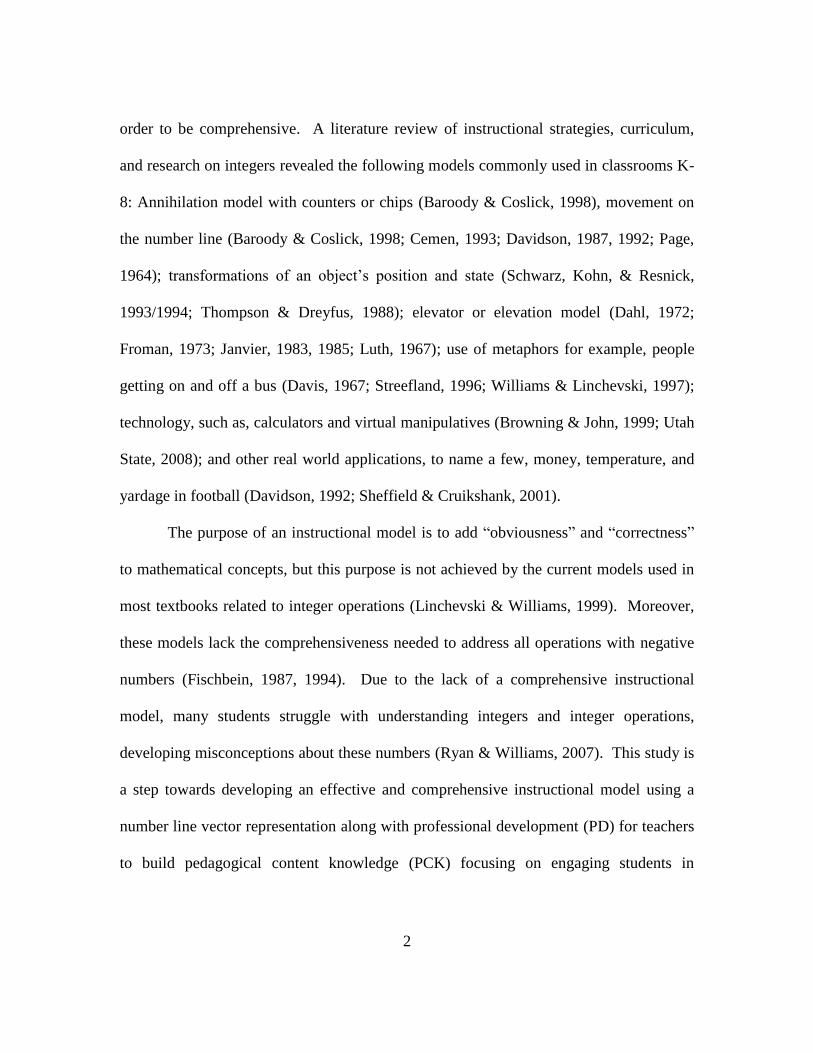
order to be comprehensive. A literature review of instructional strategies, curriculum,
and research on integers revealed the following models commonly used in classrooms K-
8: Annihilation model with counters or chips (Baroody & Coslick, 1998), movement on
the number line (Baroody & Coslick, 1998; Cemen, 1993; Davidson, 1987, 1992; Page,
1964); transformations of an object‘s position and state (Schwarz, Kohn, & Resnick,
1993/1994; Thompson & Dreyfus, 1988); elevator or elevation model (Dahl, 1972;
Froman, 1973; Janvier, 1983, 1985; Luth, 1967); use of metaphors for example, people
getting on and off a bus (Davis, 1967; Streefland, 1996; Williams & Linchevski, 1997);
technology, such as, calculators and virtual manipulatives (Browning & John, 1999; Utah
State, 2008); and other real world applications, to name a few, money, temperature, and
yardage in football (Davidson, 1992; Sheffield & Cruikshank, 2001).
The purpose of an instructional model is to add ―obviousness‖ and ―correctness‖
to mathematical concepts, but this purpose is not achieved by the current models used in
most textbooks related to integer operations (Linchevski & Williams, 1999). Moreover,
these models lack the comprehensiveness needed to address all operations with negative
numbers (Fischbein, 1987, 1994). Due to the lack of a comprehensive instructional
model, many students struggle with understanding integers and integer operations,
developing misconceptions about these numbers (Ryan & Williams, 2007). This study is
a step towards developing an effective and comprehensive instructional model using a
number line vector representation along with professional development (PD) for teachers
to build pedagogical content knowledge (PCK) focusing on engaging students in

3
classroom discourse through argumentation. There is no clear evidence supporting one
model, and there is a need for more research on representations for integer operations.
Pedagogical Content Knowledge
Teaching mathematics is a complex profession which requires more than just
knowledge of the subject matter. According to Fennema and Franke (1992), the
components of mathematics teachers‘ knowledge include the following: knowledge of
mathematics, knowledge of mathematical representation, knowledge of students,
knowledge of students‘ cognitions, and knowledge of teaching and decision making.
Fenema and Franke (1992) emphasize the importance of mathematical representations in
helping students connect abstract mathematics into something they can relate to and
understand. Some researchers have focused on developing what is referred to as
pedagogical content knowledge (PCK). According to Shulman (1995), PCK includes the
following:
The ways of representing and formulating the subject that makes it
comprehensible to others . . . an understanding of what makes the learning of
specific topics easy or difficult; the conceptions and preconceptions that students
of different ages and backgrounds bring with them to the learning of those most
frequently taught topics and lessons. (p.130)
Grouws and Schultz (1996) also include in their description of PCK the ways teachers
provide students with useful unifying ideas, clarifying examples and counter examples,
helpful analogies, important relationships, and connections among ideas which gets at
more of the behaviors of teachers rather than just the kinds of knowledge they possess.
The theoretical framework for this study is informed by this research on the
relationship between teacher PCK and student learning. Turnuklu and Yesildere (2007)

4
in their research of PCK in mathematics of 45 pre-service teachers in Turkey and their
approaches to teaching fractions, decimals, and integers, found that many of the pre-
service teachers had difficulty understanding student misconceptions related to integer
operations, facilitating mathematical discussions that would engage students in
mathematical thinking about integers, and asking questions to assess student
understanding. Their work was also informed by the research of An, Kulm, and Wu
(2004) which they used to construct the following theory: (a) PCK is associated with
teacher beliefs, content, knowledge and how one teaches, (b) Teaching is associated with
PCK and knowledge about students‘ thinking, (c) Knowledge about students‘ thinking is
associated with addressing students‘ misconceptions, engaging students in math learning,
building on students‘ ideas, promoting students‘ thinking about mathematics, and (d)
Student learning is most closely associated with knowledge about students but due to the
interrelationship of the model, Student learning is associated with all of the four
components. This integrated approach of improving teacher PCK, developing the ability
of teachers to facilitate conversations about mathematics among students in their
classrooms, and the resulting student conversations are proposed by this researcher as
keys to improving student learning.
Proposed Intervention Based on Pilot Study Results
This study was informed by the findings of a pilot study this researcher conducted
in May 2008 of 60 students from grades 7, 9, and 11, which revealed a diversity of
strategies used to solve problems involving integer operations. The greatest area of
inaccuracy and misconceptions was with subtraction of integers. Challenging such
5
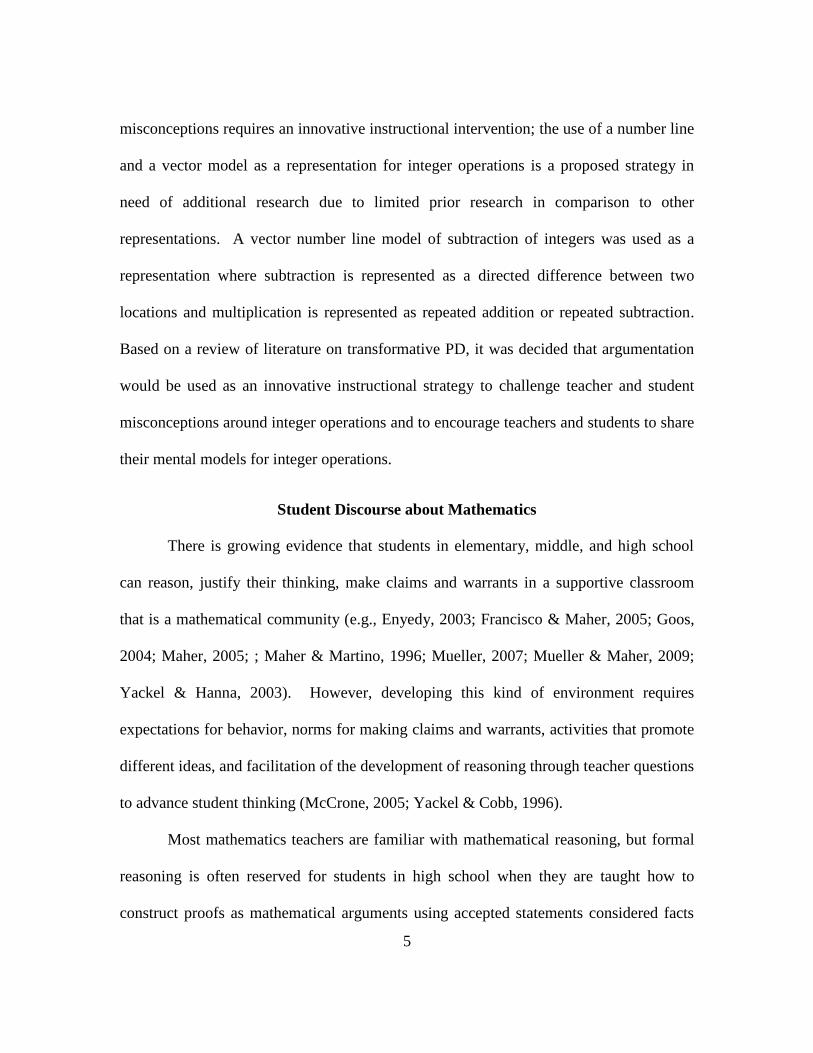
misconceptions requires an innovative instructional intervention; the use of a number line
and a vector model as a representation for integer operations is a proposed strategy in
need of additional research due to limited prior research in comparison to other
representations. A vector number line model of subtraction of integers was used as a
representation where subtraction is represented as a directed difference between two
locations and multiplication is represented as repeated addition or repeated subtraction.
Based on a review of literature on transformative PD, it was decided that argumentation
would be used as an innovative instructional strategy to challenge teacher and student
misconceptions around integer operations and to encourage teachers and students to share
their mental models for integer operations.
Student Discourse about Mathematics
There is growing evidence that students in elementary, middle, and high school
can reason, justify their thinking, make claims and warrants in a supportive classroom
that is a mathematical community (e.g., Enyedy, 2003; Francisco & Maher, 2005; Goos,
2004; Maher, 2005; ; Maher & Martino, 1996; Mueller, 2007; Mueller & Maher, 2009;
Yackel & Hanna, 2003). However, developing this kind of environment requires
expectations for behavior, norms for making claims and warrants, activities that promote
different ideas, and facilitation of the development of reasoning through teacher questions
to advance student thinking (McCrone, 2005; Yackel & Cobb, 1996).
Most mathematics teachers are familiar with mathematical reasoning, but formal
reasoning is often reserved for students in high school when they are taught how to
construct proofs as mathematical arguments using accepted statements considered facts

6
such as definitions and theorems established by the mathematical community. They learn
the acceptable form of justifying their thinking in the proof format expected by their
teacher or the textbook. However, Stylianides (2007) and Francisco and Maher (2005),
argue that this concept of mathematical proof can occur as early as elementary school
where students are given opportunities to reason and justify their thinking. Students and
teachers can collaborate to establish classroom norms for what is acceptable for a proof in
their class community. These are important prerequisites for future work with more
formal mathematical proofs which are used by participants in the larger mathematics
community to communicate to other mathematicians. Therefore, it was determined that
mathematical reasoning using argumentation would be an age appropriate activity for
grade 8 students in the Jumpstart program.
Teachers play a key role in setting up a safe environment for students to share
their thinking with others and to argue their point of view in a public way that is
productive (Yackel & Hanna, 2003). When teachers have low expectations of students in
engaging in productive discussions, they deprive students the opportunity to learn from
one another through the process of developing an argument, making a claim, and
justifying their thinking (Mueller & Maher, 2009). The purpose of this study was to
engage teachers in argumentation to challenge their understanding of integer operations
and to have them experience the value of argumentation about doing mathematics during
PD to develop their PCK. Then the PD would develop teachers‘ ability to facilitate
classroom conversations about mathematics among their students in small groups and
whole class discussions by creating, with students, expectations and norms for
7
argumentation and selecting key activities that stimulate argumentation where students
are motivated to share different strategies for solving expressions with integer operations
and to justify their solution.
Methods and Research Questions
This research was conducted during a three-week summer intervention called
Jumpstart for grade 8 students in a large urban school district in Central Texas. This
program serves students who had not passed the state mathematics assessment, Texas
Assessment of Knowledge and Skills (TAKS) test, required for promotion to high school.
However, as part of the Student Success Initiative1, students who pass grade 8 classes and
attend Jumpstart, if approved by their grade placement committee, are promoted to high
school despite their failing TAKS score. Each year, the Jumpstart program
administrators are challenged to find teachers to teach in the program. Most of the
teachers participate in summer school, so few remain that are available or interested in
teaching Jumpstart. Each year there have been several first year teachers teaching in the
program. There is a need to ensure that the teachers understand the mathematics in the
Jumpstart program as well as understand common misconceptions that students may have
by including mathematical content and pedagogy knowledge features in the PD for the
Jumpstart program.
This research study was considered an intervention that supplemented the current
PD that has occurred in the past two years with additional emphasis on the development
1 Enacted by the 76
th Texas Legislature in 1999 and modified by the 81
st Texas Legislature in 2009 to
ensure that all students receive the instruction and support they need to be academically successful in
reading and mathematics.

8
of teacher PCK related to integers. The program included 22 teachers and 341 students.
Teachers attended two days of PD prior to the start of the program. The first day of PD
constituted the intervention for this study. It focused on improving teacher understanding
of integers and integer operations. The second day of PD focused on the algebraic
patterns lessons and activities that are not a focus of this study.
During the PD, the teachers engaged in activities to explore how to build on
students‘ ideas during mathematical discussions in the classroom and how to set up class
structures and activities to promote small group discourse about mathematics using
argumentation. The PD activities focused on motivating and encouraging teachers to
share their thinking and talk about the mathematics they use to solve problems. Through
these experiences they were challenged to support their own claims about their
understanding of integers which deepened their understanding and enabled them to
experience the value of argumentation. This study was conducted to determine if PD for
teachers using a comprehensive vector model for integers and using argumentation to
promote the sharing of different solutions, diverse strategies for problem solving, and to
challenge misconceptions would improve teacher PCK. This study will also show
whether there is a relationship between teacher PCK and student understanding of integer
operations.
Data were gathered to explore the effect of the PD on teacher PCK through a pre
and post assessment. Student achievement data was collected using pre and posttest
results to determine whether teacher PCK is associated with changes in student
achievement. The Constructivist Learning Environment Survey (CLES) created by

9
Taylor, Fraser and White (1994) was used to gather evidence of the existence of the kinds
of classroom practices related to student discourse and argumentation emphasized in the
PD.
The hypothesis was that teacher PD can potentially affect teacher PCK and
potentially student understanding in the following ways:
1. Exposing teachers to activities that apply integers in real world contexts, such
as vector forces and temperature change and representing integer operations
with a comprehensive model using a number line will improve teacher
understanding of integer operations and their ability to connect the rules for
operations to a relevant context.
2. Providing teachers with experience in argumentation around misconceptions
and solution strategies, and opportunities to discuss and create structures to
use in the classroom to facilitate argumentation will enable teachers to
facilitate student argumentation around misconceptions in their classroom.
3. Students who are provided with opportunities to engage in classroom
discourse and argumentation about doing mathematics will improve their
understanding of integer operations and perform better on an assessment of
that understanding than they had prior to engaging in these activities.
These three hypotheses are shown in the proposed Theory of Change in Figure 1.

10
PROFESSIONAL
DEVELOPMENT
Real world
contexts
Number line
vector
representation
Student
misconceptions
Student discourse
using
argumentation
Classroom
structures to
promote
productive
classroom
discourse
IMPROVED
PEDAGOGICAL
CONTENT
KNOWLEDGE
Implement activities
with real world
connections
Implement number
line vector model
activities
Facilitate and
encourage classroom
discourse and
argumentation
IMPROVED STUDENT
UNDERSTANDING OF
INTEGER
OPERATIONS
Students connect
integers to real world
contexts
Students model
integer operations
with a vector number
line model
Students use
alternative models and
make connections
between models
Students engage in
discourse about math
in small groups and
class discussions
Students use
argumentation to
make claims and
warrants for a
particular solution and
solution strategy
Figure 1 Theory of change for this research study created by Sarah Harris 1/15/10
In order to examine the impact of PD on teacher PCK, changes between a pre-
and posttest of teacher PCK that related to the PD content and the curriculum the teachers
implemented was analyzed for statistical significance. In order to explore any differences
in student understanding based on teacher change in PCK, changes between a pre and
post student assessment were compared to the changes between pre and post student
assessment for a comparison group of students who attended Jumpstart 2009. A

11
hierarchical linear model was used to examine the hypothesis that there is a relationship
between the strength of a teacher‘s PCK and student understanding. The results of teacher
responses to the CLES survey were analyzed with descriptive statistics to better
understand the extent to which they provided students with opportunities to engage in
discourse practices emphasized in the PD and their responses were compared to the
responses of their students to determine whether students experienced similar
opportunities to engage in classroom discourse as their teachers described. Focus group
interviews of Jumpstart students were conducted by a grad student volunteer to learn
more about changes in student understanding over time and the impact of the instruction
and activities on their understanding.
Specifically, the five research questions were as follows:
1. What are the general patterns of teacher content and pedagogical knowledge
of integers based on responses to a pre and post assessment?
2. To what extent does PD impact teacher content and pedagogical knowledge as
measured by growth between pre and post assessment?
3. Is there a statistically significant difference between the growth between
students‘ pretest and posttest scores for Jumpstart 2010 compared to the
growth made by students in Jumpstart 2009?
4. Do differences in teacher content and pedagogical knowledge explain more of
the variance in student performance (pretest/posttest) than years of teaching
experience of a teacher?

12
5. What is the relationship between teacher responses to the Constructivist
Learning Environment Survey (CLES) and the student responses to the
CLES?
A Hierarchical Linear Model (HLM) was used to examine the relationship
between teacher content and pedagogical knowledge of integers and mathematics
learning related to the fourth research question. A two-level Hierarchical Linear Model
with student math scores as the level one outcome variable (a within-class model) and
individual class variables, such as mean math score, as the level two outcome variables (a
between-class model) was used to determine the variance in student test scores from pre
to post-test as a function of their class assignment. Classroom-level predictors (teacher
content and pedagogical knowledge of integers and years of teaching experience) were
added into the level two models to determine whether they explained the variance in
mean class scores and pretest/posttest performance slopes. Because the relationships
between variables measuring student learning are at least partially dependent on the
larger context (the classroom) in which learning occurs, teacher PCK should partially
explain the variance across classes, as should the years of teaching experience of a
teacher. It was of interest to see whether PCK following PD would outweigh experience
in explaining the variance across classes.
What follows is a roadmap to the rest of this report. In chapter 2 three research
reviews are provided: first, the research related to instructional strategies for improving
children‘s understanding of integers in K-12; second, research on classroom discourse
among students about mathematics, focusing on use of argumentation about mathematics;

13
and finally, the research that informed the creation of the teacher PD to assist teachers in
teaching students about integer operations as well as the theoretical background for
considering how PD might impact student learning. In chapter 3 a description is
provided of a pilot study this researcher conducted and how it informed this dissertation
research project. The methodological approaches used to analyze data and draw
conclusions as well as a background of the study and its participants are provided in
chapter 4. In chapter 5, the findings of this study are presented. Information from
student focus group interviews is presented in chapter 6 to add further background
information for the context of this study. A conclusion, limitations, and
recommendations from this study are provided in chapter 7.
14
CHAPTER TWO: LITERATURE REVIEW
To inform the design of this research study, three lines of research were reviewed:
how to develop understanding of integer operations through instructional strategies and
representations; how to use mathematical discussions to improve understanding,
specifically one method called argumentation; and how to develop and research teacher
PD to improve teacher PCK and eventually improving student understanding. Based on
this literature review, this researcher suggests that there is a need for additional research
on the topic of integer operations focusing on instructional strategies to improve student
understanding and professional development to improve teacher understanding, which is
the focus of this dissertation research study.
Developing an Understanding of Integer Operations
To determine what background the Jumpstart teachers and students may already
have related to integer operations and what research has shown to be most effective in
terms of instructional strategies and representations, a review of literature was conducted
focusing on three main developmental time periods in a child‘s education: early
elementary, middle grades, and high school. This first review of literature, shows the
work that has been done, primarily with small samples of students, and mostly of a
qualitative and descriptive nature, to begin to understand instruction related to this
mathematical concept of integer operations. This researcher suggests that what are
needed to move forward are larger scale studies, with qualitative and quantitative
methods, to begin to inform future curriculum development and instruction for pre-
service teachers and in-service teacher professional development.

15
Children are typically first introduced to negative integers in upper elementary
grades, using two informal semantic models. These models are helpful because they are
direct examples of the properties of integers (Schwarz, Kohn, & Resnick, 1993, 1994).
In the annihilation semantic model, children are told that there are positive integers and
negative integers, that they are represented as collections of positively charged and
negatively charged particles (respectively), and that there is a rule that allows one to
cancel out a positive particle by a negative particle resulting in what some call a "zero
pair" (Hayes & Stacey, 1999; Liebeck, 1990). In the extended number line semantic
model, children are told that the natural number line they have been using extends not
only to the right of zero, but it also extends to the left of zero. With this model they learn
that positive integers correspond to movements to the right, and that negative integers
correspond to movements to the left (Hativa & Cohen, 1995; Kent, 2000; Moreno &
Mayer, 1999; Thompson & Dreyfus, 1988; Varma, Harris, Schwartz, & Martin, 2009).
The annihilation and extended number line models allow children to solve integer
addition problems and some integer subtraction problems; however, they are not as good
at explaining the procedure for subtracting a negative integer, because situations require
the addition of zero pairs in order to physically subtract from a given amount (Hayes &
Stacey, 1999; Liebeck, 1990; Moreno & Mayer, 1999). For this reason, many teachers
transition their students quickly to a more symbolic understanding of integers once they
have the basic intuitive understanding mastered (Thompson & Dreyfus, 1988). In middle
school, students are often taught rules for integer arithmetic, such as that rule that says
when a negative number is multiplied by a negative number the result is a positive

16
answer. Then in high school, students are introduced to an additional rule for multiplying
an inequality by a negative.
Based on the researcher‘s review of literature on students‘ developing integer
understanding in grades K-12, it appears that the mathematical community has been in
search of a model that will satisfy the need for the negative numbers, justify the
arithmetical operations on them, and explain the relationship between the operations.
Fischbein (1987) argued against using the existing models for negative numbers
(annihilation and number line models). Fischbein explained that the models lack
―comprehensiveness,‖ and were based on artificial conventions which do not address the
challenges that students are faced with when working with negative numbers. This
literature review will lay the foundation of the current practices in K-12 education related
to integer understanding as well as to the research on strategies for improving such
understanding in order to illuminate the current state of what is known about the
development of integer understanding in students and to inform the development of the
research questions for this study.
Laying a Foundation: Kindergarten to Grade 2
Number Concepts
Before introducing integer concepts to students in upper elementary grades, it is
important to consider the foundations that have been laid in grades K-2 in order to
connect with prior learning about numbers and operations with whole numbers. An
understanding of ordinal and cardinal properties of numbers is also an important
prerequisite for students in Kindergarten to understand integers. In a study conducted by

17
Davidson (1992) of 4-7 year olds Davidson found that children use actions that are
familiar to them to represent negative quantities. At this age, the children most often
described zero as ―nothing‖ instead of an actual number. At these ages, the children also
showed the beginning ability to combine positive and negative amounts. The findings
showed that students had difficulty coordinating the cardinal and ordinal2
meaning of
negative numbers, which Davidson attributed to the lack of experience in the children‘s
everyday lives with ordinal evidence compared to cardinal evidence of negative numbers.
Davidson suggests that the following activities be used with students to develop
intuitions about ordinal properties and their relation to cardinal properties: (a) moving
steps from a starting point and then retracing the steps back to and beyond the starting
point, (b) marking the path with units to make it easier to retrace one‘s steps, (c) verifying
the number of steps required to arrive at the new position and then confirming when
retraced that the same number of steps were completed, and (d) using the concept of a
starting point as an intuitive basis of zero (p. 21).
Page (1964) showed how the number line can be explored by young students with
a cricket jumping along the number line. Page shares a few ways that young children
spontaneously discuss numbers that are negative: ―under two,‖ ―goodbye two,‖ ―two
below zero.‖ Some students even come up with unique ways to label the numbers below
the zero such as B1, B2, B3, for below by 1, below by 2, etc. (Baroody & Coslick, 1998,
p.8.22).
2 Cardinal properties relate to the size of a set of numbers (i.e., set A {1, 2, 3, 4, 5} has a size of 5) and
ordinal properties relate to the position of a number (i.e., 1st, 2
nd, 3
rd).

18
Representations
There are different representations of numbers that students explore at this early
age. Using concrete objects, such as counters, to represent and develop number sense is
one recommended way to introduce counting to young students (National Council of
Teachers of Mathematics, 2000). The concept of zero can be introduced by putting
different amounts of counters in different boxes and leaving one box empty to represent
zero (Sheffield & Cruikshank, 2001). When exploring real world situations, students may
naturally discover the negative numbers or ask questions about such things, which will be
a way to get them thinking about integers at an early age. For example, one might show
students the negative numbers on a thermometer and discuss what kind of temperature
would be measured in negative degrees (Sheffield & Cruikshank, 2001).
As these studies have shown, there are valuable experiences that children in K-2nd
grade can be exposed to in order to begin learning about integers.
Early Introduction and Exploration: Grades 3-5
Typically students begin to be introduced to and to explore integers (positive and
negative numbers) in grades 3 through 5. This is often done through activities which
extend the number line to the left past zero, exploring real world situations of temperature
or bank accounts, where negative numbers are needed, and through literature connections
that introduce the larger world of numbers to upper elementary students. However, one
group of researchers studied the effect of early instruction in the rules of integer
operations with third grade students and found that the students‘ knowledge of rules for
operations that they were taught in school negatively effected their problem solving

19
(Nunes, Schliemann & Carraher, 1993) as they attempted to apply these rules without any
conceptual understanding. For the most part research for this age group has focused more
on conceptual development through different models or representations of integers and
integer operations (Cemen, 1993; Hativa and Cohen, 1995).
Number Line Activities
Cemen (1993) in an article in ―The Arithmetic Teacher‖ described a strategy for
introducing integer concepts to young students with a number line. A large number line
could be made on brown paper or computer printer paper. It should be large enough for
all to see when it is taped to the board in the class room. Students would be given their
own small number line for their desk that could be used with a cut out figure of a person
to move around along the number line. Students then could discover the computational
rules. For example, adding two numbers with the same sign would mean moving in the
same direction on the number line. When the signs are different, the figure would be
moved in the opposite directions. Cemen explained that when the numbers have different
signs, they "pull" against each other as in a game of tug-of-war. The sign of the sum
would be the sign of the one that pulls harder. Subtraction on the number line would be
illustrated by turning it around, which distinguishes between the negative sign as part of
the number and the subtraction sign as an operation. Subtracting a negative would mean
turning the figure around and walking the figure backward. This would be the same as
adding a positive (not turning around and walking forward). This eventually would lead
to the rule of adding the inverse. This strategy gets at concepts of magnitude (size of
movement), direction (changes in location), and inverse.

20
Hativa and Cohen (1995) conducted research in two fourth grade classes in Tel-
Aviv, one was assigned as treatment and one as control. They used a computer program
called The Challenger that provided a number line model for students to use to explore
integer operations to reach a target number. Hativa and Cohen (1995) classified five types
of problems and related student misconceptions that involved integers: (a) subtracting a
positive number from zero, (b) subtracting a positive from a smaller positive number, (c)
adding two negative numbers, (d) adding opposites (-7 + 7) , and (e) adding a positive to
a negative. They found that when students are given a problem involving subtracting a
positive from a smaller positive number (4 – 7) that students often would solve it the
same as they would the reverse (7 – 4) as if the commutative property held true for
subtraction. When given a problem involving adding two negative numbers, students
often subtracted the numbers, because they assumed that a minus sign anywhere meant
subtraction. When given addition of opposites (-7 + 7) the students would often just add
the magnitudes (14). These challenges involve an undertanding of operations and signs
that are very different mathematical concepts. Students who were in the treatment group
made statistically significantly greater gains in achievement based on pre and post
treatment interviews.
The research of Cemen (1993) and Hativa and Cohen (1995) informed the
development of the PD and the curriculum for this study. The teacher PCK assessment
for this study included two items from the research of Hativa and Cohen (1995) to assess
teacher undetstanding of the difference between an operation and a sign in an expression.

21
The research of Cemen (1993) informed the development of teacher and student activities
using the number line representation for this study.
Investigations: Grades 5-8
Number Line Model
Several researchers have studied the use of number line models with children
using computer worlds for their investigation of integer operations. Thompson and
Dreyfus (1988) conducted a small study observing two grade 6 students over a six week
period as they used a computer program to move a turtle on the screen right and left to
explore integer operations as transformations. A negative number command would cause
the turtle to turn around and walk the number of steps. There is a distinction made
between the state (position) and the integer (change of position). After the turtle
completed its movement it would turn back around. The students were asked to predict
the result of a command, execute the command, and then discuss their prediction. The
goal was for the students to move towards forming a generalization. Students learned
that a ―negative - negative‖ is turning around twice. To solve the expression 3 – (-5), the
turtle would walk three steps forward, turn (subtract), and then turn again (negative) to
face the same direction before walking five steps forward.
Schwarz et al. (1993, 1994) conducted a similar study with trains in a computer
environment called ―Trainworlds‖ with 4 grade 5 students. The trains in this program
had magnitudes and were color coded (white, grey) for direction. The operations of
cutting or gluing trains were used to represent binary addition and subtraction. Loading
and unloading trains were used as unary actions (positive or negative) on trains.

22
Comparing trains was used to demonstrate relations between negative numbers. Three of
the four students were able to successfully map the situation in the posttest to the train
model to solve the problem.
Colthorp (1968) also researched use of the number line model by conducting a
study with two teachers each teaching one intervention class and one control class of
grade 6 students. The intervention class was given instruction with a concrete number
line approach and the control class was given more of a rule based instruction using the
algebraic approach. There were no statistically signficicant differences in achievement at
the end of the program between the groups.
In summary, the number liine model shows promise for helping teachers and
students understand conceptually the role of an operation and a sign in terms of the
magnitude and direction of movement. However the results of the use of this
representation on student achievement is mixed; therefore, additional research is needed.
Cancellation Models
Some might wonder which model or strategy is best, the counters or the number
line? Van De Walle and Lovin (2006) suggest that students should be allowed to
experience both models and explain how the two models are alike. They recommend
developing an integer understanding using both models at the same time to help students
connect the two models.
Wilkins (1996) conducted clinical interviews with 16 grade 6 students and
identified the strategies students preferred to use to solve integer addition and subtraction
problems and the accuracy of use of the different models. When given choice of a model

23
to use, 50% of the students chose to use a mental model, 23% used a number line, and
27% used two-colored counters. However the students who used mental models were
only successful 65% of the time, students who used the number line were accurate 70%
of the time, and students who used colored counters were correct 75% of the time. The
results showed that students who used the number line and two-colored counters were
more successful3 than those who used mental models. The problems students were given
were situated within real world contexts such as temperature, weather, mail delivery.
Students tended to use continuous models for continuous situations (number line) and
discrete models for discrete situations (counters).
Ball and Hill (2009) observed a grade 7 mathematics teacher conducting a lesson
on integer operations with black and red chips. The students would match up each black
chip with each red chip and then count the chips left over. However when the teacher
modeled how to do a subtraction problem with these colored chips, the students had
difficulty understanding the representation. The teacher observed was also not sure of the
representation and decided to put the colored chips away and focus on a rule or strategy
for converting the subtraction into addition, but then confused the students by trying to
connect to a real world experience of money and debt. In order to have continued with
the chips, Ball and Hill (2009) point out that the teacher could have referenced the usual
―take away‖ or ―regrouping‖ method, by thinking that three red chips need to be taken
away, but there are only two to take away, so another red chip can be created by adding
on a zero pair (one black chip and one red chip). Once three red chips are removed, there
3 Due to the small sample size of this study, significance tests were not conducted. Only descriptive
statistics were provided.

24
would be two black chips left. This shows that chips can be a challenging representation
for modeling subtraction.
Hackbarth (2000) conducted research with of 68 grade 7 students and looked at
the impact of two diferent manipulatives versus instruction just using the rules for integer
addition and subtraction. One group (N = 23) was given ―plus-minus‖ pieces, another
group was given two colored chips (N = 22) and the control group (N =23) was given
instruction on the rules for the operations. The plus and minus pieces were created from
tile spacers in the shape of a plus and ones that had both sides cut off to form a minus.
The colored chips were red on one side and yellow on the other side. The rule was based
on the following abstract method a - b = a + (-b). Hackbarth (2000) found no statistically
significant difference between the performance on pre, post, and rention tests (teacher
made) of the three groups based on instructional method. This suggests that cancellation
may not be the best instructional approach.
McCorkle (2001) compared two groups of grade 7 students, based on
performance on a pretest, posttest and follow up retention measure on integer
undertanding of operations of addition and subtraction. The intervention group received
instruction using a relational approach where students were able to manipulate a
thermometer scale with the concept of ―hotcubes‖ and ―cold cubes.‖ The control group
was taught with an instrumental textbook approach using the algebraic rules. Students in
the intervention group on average scored higher and had better retention than students in
the control group. The results of this study suggest that use of cancellation may be
associated with student understanding of addition and subtraction of integers

25
In summary, the effects of cancellation models are mixed. McCorkle (2001)
found positive results of using cancellation with addition and subtraction. Hackbarth
(200) found no significant difference between achievement of students following
instruction with rules compared to use of cancellation. Ball and Hill (2009) found
evidence of cancellation being challenging with subtraction for both teachers to
implement and for students to use as a representation. Therefore, the evidence does not
show that use of counters and a cancellation model is more effective than the number line
representation.
Rules
To determine whether rule based understanding is better than conceptual
understanding based on physical models, Harvey and Cunningham (1980) conducted
research by assessing integer understanding of 163 grade 8 students with a 46 question
assessment. The students who were most successful at integer addition used a physical
model such as the number line to help them understand the problems they were asked to
solve. Subtraction of integers was the most challenging for students, and only students
who converted subtraction to adding the opposite of the subtrahend (second number)
were successful in solving the subtraction problems. Therefore, this rule was more
effective for subtraction.
Real World Contexts
There are many real world contexts for the practical applications of integers.
Janvier (1985) developed a model based on the work of Luth (1967) that uses a concept
of elevation of a hot air balloon basket attached with changing amounts of balloons (+)

26
and sand bags (-). This model works well for addition and subtraction, but does not
provide students with an opportunity to work with multiplication and division.
Davis (1967) came up with a creative story to help students understand integers
with the context of a postman delivering mail daily to a woman named
―Mrs. Housewife.‖ Sometimes he delivers her checks (positive numbers) and sometimes
he delivers her bills (negative numbers). Each day she figures out how much money she
has or owes. According to Davis (1967), this context worked well to help students
understand subtraction of integers, because subtraction is when the postman returns to
take away the wrong mail (subtracting a negative number would mean taking away a
bill).
Metaphors and Stories
Williams and Linchevski (1999) studied student‘s ―situated intuition.‖ Situations
and models describe a reality that is meaningful to students, in which the extended world
of negative numbers already exists and the students' activities allow them to discover it.
Williams and Linchevski designed two experiments to give the students a concrete
situation for exploring the integer concept by using an abacus. They created two real
world simulations that could be enacted using two colors of beads on a double abacus. In
the first game, Disco Dance, Williams and Linchevski used a double abacus with
students to explore addition and subtraction in order to allow for an extension of the
children's existing number schemes. They situated the double abacus activity within the
context of a disco game where dancers were arriving or leaving through a gate. The
children had to keep track of the number of dancers with the double abacus after drawing

27
a card that would tell how many dancers came or left. This involved cancellation and
then compensation if they ran out of beads. The purpose was to explore situated intuition
using children‘s everyday common sense and intuition in the disco problem scenario.
There was an intuitive gap where subtraction was introduced, which caused the
researchers to believe that this might not be the best situation for exploring integer
operations. Streefland (1996) explored a similar context with a ―Bus Stop‖ scenario with
people getting on and off of a bus. This context may have been more familiar to some
students than the disco dance, and students have used colored chips more easily than
beads to model the activity.
Williams and Linchevski (1999) designed a second game with dice since the disco
game was not as intuitive for subtraction. In order to make subtraction more concrete,
they provided students with blue (+) and yellow (-) dice to represent positive and
negative. Then they introduced a third dice with all faces labeled either ―add‖ or ―sub‖
for subtract. The children were told to first throw the blue and then yellow dice and
determine the resulting score. Then they would throw the add/sub dice and either add or
subtract their new score to their previous total. So if their previous total was a (+2) and
they rolled a (-3) and a (
+7), combined the new score would be a (
+4). If they rolled
―sub,‖ then they would subtract their new score (+4) from their previous total (
+2) which
would result in (-2). The students worked in teams of two, each student represented by a
bead color. However, a weakness of this game was the arbitrary assignment of plus and
minus symbols to the teams that led to some new difficulties which had to be resolved
through discussion of fairness in the game situation. The researchers determined neither

28
the disco game nor the dice game was able to be extended to include multiplication and
division.
Chiu (2001) engaged a group of 12 middle school students and 12 post-secondary
adults in an exploration of integers within the context of the stock market. Students were
then interviewed and asked to explain the metaphors they had developed. This involved
the explanation of six arithmetic expressions. When solving problems, children used
metaphors (M = 3.67 times, SD = 2.99) twice as often as the adults (M = 0.25 times, SD =
0.62) and the difference was statistically significant (t = 2.97, p < .02). When showing
understanding of the six arithmetic expressions, adults used metaphors more often (M =
7.00 times, SD = 2.70) than children (M = 2.25 times, SD = 0.35), which was also
statistically significant (t = 3.40, p < .01). Children were more accurate when they used a
metaphor (93%) during calculation, than when they used other methods (81%, χ2
(1, N =
331) = 5.48, p < .02). However, children were slower when using a metaphor (M = 5.93
seconds, SD = 2.73) than when they used other methods (M =3.14 seconds, SD = 1.27, z
= 6.28, p < .001). Chiu (2001) found the use of three main metaphors: use of objects
(e.g., drawing bars that cancel each other out), motion (e.g., talking about location and
walking a direction), and social transactions. (e.g., describing owing or borrowing
money). The authors concluded that no matter how effective metaphorical reasoning is,
it is slower than facts or algorithms.
Games
Baroody and Coslick (1998) share a golf game created by a teacher named
Mrs. Kail for integer addition. A group of four students are given a paper bag containing

29
red and green dice with sides labeled from 0 to 5. The students play a 9-hole golf game.
For each hole, they take turns reaching into the bag to pull out a die. The color and the
number determine the person‘s score. If it is a green 4, then they are 4 over par. If it is a
red 4, then they are 4 under par. For each new hole the players‘ new score is added to
their old score. The player with the lowest score wins. In the beginning, the students had
difficulty determining their score, so the teacher provided each group with a pile of green
and red chips to use to model the score changes and check their calculation. The students
had an easier time coming to an agreement about their new scores by having the chips to
justify their line of thinking.
Students in grades 5-8 are often introduced to integers for a specific unit or short
period of time, much less than the time that they are exposed to positive whole numbers.
Baroody and Coslick (1998) suggest that teachers have a classroom economy system
where students earn a paycheck each week. They can spend their pay on items in a class
store or minutes in an educational entertainment center. They can lose money by
misconduct, incomplete homework or assignments, or by other means. They can gain
money by collaborating with others, peer tutoring and making good effort in class.
Students can be the ones playing the roles of banker, store cashier, etc. to calculate
transactions and balances in a ledger book for each student (Faulk, 2007). However, no
evidence was provided about any association between use of this kind of classroom
economy system and student performance on integer operation problems.

30
Instructional Technology
To determine whether instructional technology could be used to improve student
understanding of integers, Anctil (2002) researched whether students who used
computer-assisted instruction with a program Walking on the Number Line in a middle
school (grades 6-8) improved in their understanding of addition and subtraction of
integers. The Walking on the Number Line program was created with Director 8.0
softward on a Macintosh computer. Anctil administered a similar pre and post test to
students with ten addition and ten subtraction of integer problems following the computer
lessons. There was a statistically significant difference between pre and post-test
performance (t = 2.54, p = .017). However, this study included only thirty student
participants, twenty improved from pre to postttest, but ten either stayed the same or
decreased their score on the posttest.
Kalu (2006) designed a computer assisted instruction (CAI) program entitled
Working with Integers: Addition and Subtraction and field tested it with a group of 32
urban grade 7 pre-algebra students with a history of low motivation, poor attendance, and
low achievement. The computer program was created with Macromedia Director MX
(Educational Version). The computer program contained three sections: concepts and
properties of integers, integer rules, evaluation and posttest. The concepts and properties
section exposed students to three methods of solving integer problems: calculation,
absolute value method4, and the number line method. The students used the program for
4 This is a rule where the first step is to add the absolute values (or magnitudes ) of each number and then
the second step is to keep the sign of the number with the largest magnitude if the signs are different and to
keep the original sign of the numbers in the problem if there signs were the same.
31
five days. The results showed significant improvement in the comprehension of concepts
of adding and subtracting integers (t = 35.48, p < .01) showing that the computer assisted
instruction program was effective in improving student understanding.
Remediation and Application: Grades 9-12
By high school students are expected to have learned about integer operations,
since they are a prerequisite to Algebra 1. Any further instruction in high school on this
topic would either be in the form of remediation or application to high school
mathematics content. According to Bruno and Martinon (1999), the main reason students
experience confusion while learning about the number system is that throughout their
education, there is not a single unifying idea about numbers or perspective on the best
way to teach students about numbers. They end up learning each part of the system in an
isolated way (i.e., whole numbers, fractions, decimals, integers, irrationals, complex
numbers, etc.). Bruno and Martinon conducted a research study of 12-13 year old
students in an urban classroom in Spain. They explored three representations of integers:
abstract, contextual, and the number line. They found that the number line, which most
students did not initially know about, became an essential tool in the students‘
understanding of integers. Students obtained successful results for activities that relate the
number line to concrete situations, when the number line was employed as an aid by
students in solving problems (Bruno & Martinon, 1999, p. 808). Taking this number line
representation from the middle grades and then extending it throughout high school to
include graphing rational and irrational numbers is recommended by the National
Council of Teachers of Mathematics (NCTM, 2000) in addition to instruction in new

32
concepts to strengthen students‘ understanding of numbers such as vectors, which
simultaneously represent magnitude and direction.
Moses, Kamii, Swap, and Howard (1989) researched urban students‘
understanding of integer operations through the Algebra Project where students learned
about integers through a familiar context using a simulation of riding a subway. The
students were introduced to the concepts of direction, displacement, and equivalence.
Subtraction was modeled as comparing the endpoints of a pair of displacements. Then
students worked within a coordinate system where they explored displacements with
magnitude and direction. Then they connected this understanding in the context of the
subway rides to integer addition. Students showed improved understanding of integer
operations using the context of the subway rides and then moved on to more symbolic
abstractions of the same concepts.
Abstraction with Variables and Symbols
When students begin studying Algebra, they are introduced to variables used with
numbers in expressions and they are asked to simplify expressions by combining like
terms. At this point, some students struggle with knowing which numbers to subtract and
which numbers to add. Vlassis (2004) found that grade 8 Algebra students utilized
several procedures to simplify the expressions. Some first used brackets to group the
numbers and then group the common variables. Then they applied a sign rule that if
there was a minus next to a minus it would result in a plus. Some of the students worked
right to left assigning the minus signs to the wrong numbers. For example, in the
expression 4 – 6n – 4n, a student would respond that the answer is 2n – 4. Others used

33
the sign following the number. For example, 6y – 20 + 3y, they would subtract the 6y
and the 3y to get a result of 3y. Others used rules such as, 7 – 9 = -2 because 9 is the
larger number. Some students referred to a number line concept as a ―scale‖ and spoke
of moving up and down the scale. Most of the students referred to the minus in between
two numbers as subtraction. Some students saw the minus sign as a divider. No students
were able to see that a minus could have two roles. According to Vlassis (2004),
understanding the dual roles of a minus is important when simplifying expressions in
Algebra. Vlassis concluded that the students‘ lack of flexibility with the role of the
minus sign may be related to the traditional instruction they received with a focus on
rules and less on conceptual understanding. As students transition from arithmetic to
algebra, there are negative numbers that are constants, coefficients, or solutions. So it is
important that they continue to understand the role and meaning of the minus and the
negative in each context.
Science Application
In Physics, the distinction between whole numbers and integers is paralleled by
the distinction between scalar and vector quantities. Mass and time are scalar quantities
that have only magnitude, but not any particular direction. Weight is a vector quantity,
because it has both magnitude and direction (Baroody & Coslick, 1998). Physics is not
the only area of science with integer applications. A charged-particle box is an analogy
that can be used to help students review integer operations in high school by their math
and science teachers. This analogy could be appropriately intuitive because it builds on a
student‘s familiar ―add-to‖ interpretation of addition and change ―take-away‖ meaning of

34
subtraction (Baroody & Coslick, 1998). Any model of integer addition and subtraction
should clearly distinguish between + and – signs indicating a direction and those
indicating an operation (Baroody & Coslick, 1998). The charged particle metaphor meets
the essential criterion. In the expression (+2) + (-3) = -1, the positive sign in +2
represents the positive charge (the direction of the charge) and plus sign between +2 and -
3 represents adding charges to the box (the operation of addition). In the expression (-3)
– (-2) = (-1), the negative sign in -3, -2, and -1 each represent a negative charge (the
direction of the charge) and the minus sign between -3 and -2 represents taking away
charges from the box—the operation of subtraction (Baroody & Coslick, 1998). This
particle box concept can then be related to other concepts in science that involve the
application of integer operations such as boiling and freezing points, chemical bonds,
electric charges, magnetism, enthalpy (thermodynamics), acceleration/deceleration, and
force vectors to name a few.
Limitations and Future Directions
Based on this review of the literature, it appears that the two most common
models for integer operations seem to be the colored counters and the number line
representations. There are a few disadvantages to the model with cancellation using
colored counters. It is best used with smaller numbers, because it becomes cumbersome
dealing with a multitude of conters. It is difficult to model multiplication and division of
integers problems. Also it is impossible to extend the model to include rational numbers.
There are also disadvantages to the number line model. Despite its comprehensiveness in
being able to model all operations, there is disagreement about the best way to model

35
subtraction on the number line. Some students are confused because the ―take away‖
model is what they associate with subtraction more than a measurement model. Also
some students have difficulty physically counting on a numberline, unsure if they should
count the numbers or the spaces in between the numbers (Carr and Katterns, 1984). A
larger issue is that students need to understand the concept of an integer before they begin
modeling operations with integers which can confound the challenges with each of these
models.
According to the models and modeling perspective of learning, ―students go
beyond isolated pieces of information to construct well-organized systems of knowledge,
and they go beyond thinking within isolated topic areas to also integrate and differentiate
ideas between topic areas, subject matter areas, or domains of experience‖ (Lesh, Lester,
& Hjalmarson, 2003). However, due to the many ways students can be introduced to
integers over their K-12 experience, they need to have a way to make sense of these
different models and representations of integers in an organized manner, otherwise,
misconceptions and confusion can develop. It is important for teachers to allow students
to talk about their understanding and work with each other to clear up misconceptions
(Ryan & Williams, 2007). What follows is a discussion of the research behind use of
argumentation to improve student understanding in mathematics classrooms.
Use of Argumentation to Improve Student Understanding
According to Partnership for 21st Century Skills (2008), the 21
st century skills that
students need to develop to be prepared for careers in science, mathematics and
technology require ―thinking criticially; making judgments; solving complex,

36
multidisciplinary, open-ended problems; and communicating and collaborating‖ (p.10).
Cobb, Stephan, McClain, and Gravemeijer (2001) conducted a teaching experiment in a
grade 1 classroom focusing on linear measurement. They involved students in the
following activities: explaining and justifying their solutions, agreeing or disagreeing
with the solutions of others, and asking questions to make sense of the explanation of
others. The students established classroom norms for acceptable solutions and
explanations. Cobb et al.‘s research lays a framework for research methodology to
further study argumentation in the classroom. Argumentation is proposed as an
innovative approach to address the challenges around changing student misconceptions
and the need for students to develop more connected understanding of the procedures
they use.
Enyedy (2003) conducted a study of two grade 7 math classes in an urban middle
school. The participating students were ethnically diverse, and a majority of the students
were from low-income homes. Students used computers with a Probability Inquiry
Environment (PIE) interface that made agreement and disagreements between students
public so that the argument could be solved. The interface included an agreement bar
that could be moved to represent the extent to which one agreed with the response of
another. When a student lowered the bar to show disagreement, a conversation would
result as students argued their perspective to negotiate to a point of agreement.
Enyedy (2003) structured student predictions of solutions according to Toulmin‘s
(1958) work with argumentation where productive argumentation occurs when a student
engages in an argument by making a claim and providing a warrant. These activities

37
Enyedy refers to as ―distributed,‖ because it takes interactions among multiple students to
accomplish the activity. They are also ―emergent‖ in that the activity can change during
the interactions among students (Enyedy, 2003). However, this can only happen when
students engage in this kind of activity undisturbed. Teachers can be what Enyedy calls a
―limiting factor,‖ because they can provide constraints that limit this kind of activity to
only certain times or types of activities (p.366). This limitation prevents the development
of reasoning skills and use of mathematical tools. Enyedy followed two students and the
changes in their reasoning during activity with the computer interface, then through a
transformation of understanding following interaction with peers, and finally through a
whole class discussion. The students who participated in the PIE classroom
outperformed students in a comparison classroom based on statistically significant pre
and posttest performance gains, t(97) = 3.4, p < .001 (Enyedy, 2003, p. 395).
Mueller and Maher (2009) conducted a research studying of 24 grade 6 students
who participated in an informal afterschool program working collaboratively to solve
problems. During the problem solving sessions the students were observed constructing
arguments, justifying their solutions and solution strategies. These informal arguments
led to more of a proof format. What developed was a mathematical community as defined
by Goos (2004) as a place of inquiry where students can have a place to work on
problems and share their mathematical thinking by proposing and defending arguments,
responding to the claims of others tudents, and sharing their ideas. Students were
observed solidifying their own understanding and convincing themselves of their own
argument through the process of sharing their justification with others. At times the

38
misconceptions and faulty arguments shared by a student were pivitol in the community
gaining a deeper understanding of the mathematics.
Ball, Lewis, and Thames (2008) analyzed a six minute segment of Ball teaching a
grade 3 class of students when one student proposed that they were thinking about the
number six and whether or not it was even or odd, which started an engaging discussion
among the students. Next, one child challenged the students to justify their thinking, and
then the students began to make a progression of claims that included making claims,
clarifying claims, and then other students proposing rewording and revising those claims.
In just six minutes there were 30 claims made by students and 4 by the teacher. Ball,
Lewis and Thames found that both making mathematical claims and making claims about
mathematics were key mathematical activities in this classroom. There was evidence that
students were aware of and practiced the following key conditions of successful
classroom argumentation: ―what counts as a mathematical claim, how to express
mathematical claims so they are usable by others, and how to evaluate and respond to
mathematical claims‖ (p.26).
Through this case study, Ball, Lewis and Thames (2008) also found evidence of
the following key teacher moves that facilitated the classroom argumentation:
―(a)provides mathematically engaging experiences for students to make claims about; (b)
invites their claims about those experiences; (c) prompts them for sufficient elaboration
of claims so that all can ―dig into‖ them; (d) ensures that they hear one another‘s
discussion of claims; and (e) solicits other students‘ reactions to the original claim‖(p.32).
The researchers also found that naming and defining mathematical terms was important
39
in the formulation of claims. The students used the mathematical terms of ―even‖ and
―odd‖ and related properties as they made conjectures, asked for justification, and
explained why they agreed or disagreed. Using names and definitions forms a common
language that supports the class argumentation process.
Ryan and Williams (2007) research in the United Kingdom demonstrated the
power of argumentation to enable students to talk about mathematics in a connected way
to deepen conceptual understanding and to challenge and resolve their misconceptions.
Based on this research they developed a helpful guide to common student misconceptions
and a PD model to assist teachers in better understanding student misconceptions and
how to challenge those misconceptions by involving students in argumentation. This
research is described in more detail in the following section on teacher PD.
Teacher Professional Development
Much has been written about children‘s understanding of integers and integer
operations and teaching strategies for improving student understanding of integers;
however, little is written about effective PD for teaching teachers to teach children about
integers in a way that improves student understanding of integers and integer operations.
Upon review of literature related to this topic, there appear to be recommended topics for
the focus of teacher PD for improving student understanding of integers: Student
misconceptions and student argumentation. What follows is a brief overview of the
literature that informed the creation of the PD for Jumpstart teachers on the topic of
integer operations.

40
Helping Teachers Understand Common Student Misconceptions
Including a Developmental Look at Misconceptions
A great resource for PD to help teachers better understand common
misconceptions and errors students make at different ages is research conducted by Ryan
and Williams (2007) who completed a large, cross-sectional survey of 15,000 children
ages 4 to 15, in year 2005, in the U.K. They found that children learn and improve in
mathematics slowly and plateau around the age of 11. For some reason, there is very
little progress made between the ages of 11 and 14 years. The extra exposure to math
curriculum, teaching, and assessment in secondary school seems to have little effect on
their mathematics achievement. Ryan and Williams used data from the Mathematics
Assessment for Learning and Teaching (MaLT) database, a standardized test given to a
national sample of students (Williams, Wo, & Lewis, 2005). According to Ryan and
Williams, as learners get older, their needs change, so teachers need to adjust instruction
in order to meet the needs of their intellectually developing students.
What follows is a summary of the findings of Ryan and Williams (2007) specific
to students‘ developmental learning of integers that show some of the common
misconceptions at different age levels that represent errors related to conceptual problems
and the percent of students who accurately solved these kinds of problems: 23% of 8 year
olds recognize that subtraction is not commutative (p. 188); 44% of 10 year olds
recognize and order negative integers (p.197); 45% off 11 year olds recognize negative
decimal numbers on a number line (p.202); 25% of 14 year olds subtract integers and
44% divide integers correctly (p.218).

41
It is impossible to prepare teachers for every possible kind of student
misconception; however, including sample misconceptions in PD can provide teachers
with opportunities to brainstorm how they would adjust their instruction to address
misconceptions. The PD can also provide practice creating questions that teachers can
ask students to assess the cause of the misunderstanding and to advance their thinking
without telling the students they are wrong.
Learning from Pre-Service Teacher Preparation Programs
Baroody and Coslick (1998), in their development of an Elementary Mathematics
Methods textbook, created an entire section to provide PD to new teachers on the
common misconceptions children have related to understanding integers. They
emphasize the strange new world students find themselves in when they are introduced to
signed numbers. Suddenly when they see -2, it no longer means ―take away two.‖
Complicating this confusion of negative numbers with subtraction is the language many
people use day-to-day to refer to negative numbers as ―minus,‖ such as when someone
says that the temperature went down by ―minus 2‖ degrees. To avoid reinforcing
misconceptions and to emphasize their true meaning, teachers should refer to integers as
positive or negative, not plus or minus (Baroody & Coslick, 1998).
Baroody and Coslick (1998) provide pre-service teachers with a short vignette
that describes a young girl‘s only experience with negative numbers in the context of
temperature. The student is then introduced to a Pac-Man (MiltonBradley, 1982) card
game that includes positive and negative numbers. Six months later, when asked where
the student might find negative numbers, the student responds in ―Pac-Man‖ (Baroody &

42
Coslick p. 8.22). Below are reflection questions provided to the teacher following the
reading of the vignette:
1. What does Alexi‘s experience with the Pac-ManTM game suggest about
introducing children to negative numbers?
2. Other than temperature, accounting (credit and debit), and keeping score in
games, are there other everyday uses of integers?
3. Mathematically what do integers tell us that whole numbers do not?
4. A student teacher reads the expression -6 + (+7) as ―minus six and plus seven‖
and 6 – (+7) as ―six minus plus seven.‖ Is this good educational practice? Why
or why not?
5. What is the answer to 5 – (-8) = ? How would you explain to a student the
answer you got? What is the answer to -5 x (-8) = ? Why does it have the sign
it does? (Baroody & Coslick, p. 8.22)
Students will ask teachers some of these same questions, and teachers need to be
prepared to answer these questions with more than, ―That is just how it is‖ (Baroody &
Coslick, p. 8.22).
This past section provided some resources for PD for pre-service and in-service
teachers to improve their ability to teach students about integers by focusing on
identifying student misconceptions and instructional strategies to target these
misconceptions. These resources were used in this study to inform the development of
the curriculum, student assessments, teacher assessments, and PD activities for the
Jumpstart program; however, what is missing is what students need to do and think to
improve their understanding of integers. What follows is a review of literature on student
discourse in mathematics classrooms and how to help teachers facilitate mathematical
conversations in their classrooms.

43
Teacher Facilitation of Mathematical Conversations Using Argumentation
Argumentation is a classroom discussion method previously researched in the
context of science and mathematics instruction ( Enyedy, 2003; Kenyon, Kuhn, & Reiser,
2006; Kuhn, Kenyon, & Reiser, 2006; Ryan & Williams, 2007). Ryan and Williams
(2007) support the use of argumentation in the math classroom based on the work of
Bakhtin (1986). From this point of view, learning and teaching are thought of as
communication, and mathematics learning as a certain kind of dialogue in which the
rationale is mathematics argumentation. Ryan and Williams warn that not all good
discussions will result in good mathematics. Common feature of discussions such as
listening, responding, reflecting, and questioning occur in argumentation, but what must
stimulate this conversation is the mathematics. The discussion could begin with a
problem that needs to be solved, but argumentation is best supported when the problem
induces different points of view or strategies to discuss and argue about. A rigorous
mathematics discussion includes reasoning and persuasion using mathematics (Ryan &
Williams, 2007).
A key finding of the research conducted by Enyedy (2003) that informs PD is that
the models that students produced to support their claims served to make their reasoning
visible. This allowed their reasoning to become an object of discussion and reflection.
Teachers can facilitate classroom discourse by providing students with opportunities to
make their understanding visible to promote discussion in small groups and in a whole
class discussion.

44
Classroom Structures to Facilitate Argumentation
To better understand how to implement argumentation in mathematics, Ryan and
Williams (2007) provide a process for preparing teachers to have classrooms of students
who engage in argumentation about mathematics. In their research, 11-year old children
were given a diagnostic assessment to determine areas where there were significant
differences in responses. One of these items was selected as the problem to be the basis
of an argumentation. Ryan and Williams worked with students in small focus groups.
The emphasis of the discussion was on the student‘s reasoning and argumentation. As
researchers in a teacher role, they facilitated the discussion by providing useful
representations or models as needed to promote progress in the discussion. After their
extensive work with focus groups, Ryan and Williams came up with several key
ingredients for argumentation to occur.
First, according to Ryan and Williams (2007), it is important to begin with a
problem that can be that can promote differences of opinion to discuss. Second, there
must be class and small group norms that establish a community where children are able
to safely voice different points of view and have others seriously consider their
perspective. Third, the class must agree on and follow criteria for what makes a good
argument (such as justifying one‘s reasoning with mathematics). Finally, there has to be
time taken for the class or group to reflect on what has been discussed and learned and
whether or not the discussion caused individual perspectives to change or to be
confirmed. Based on Ryan and William‘s (2007) research, they determined that there
was a dialogue cycle for argumentation that included four stages :

45
1. Articulation: ― I think that . . .‖because . . .‖
2. Re-formulation: ―I listened to what X said and now I think that . . .‖
3. Reflection: ―My reasoning was/was not correct because . . .‖
4. Resolution: ―I now think that . . . because . . .‖ (p. 32)
Stigler and Hiebert (1999) found that students in their study often made the
following argumentation moves : ―alternatives, conflict, clarification, press on and so on‖
(p.35). Good mathematicians evaluate arguments others have made; they learn and
discover new mathematics. So it is important for students to experience this same kind of
metacognition and reasoning as they learn to be mathematicians through argumentation.
There are norms that can be established in the classroom for what makes a ―good‖
argument. Ryan and Williams (2007) provide the following sample list of expectations
for discussion:
1. One person (with the pencil) speaks at a time, everyone else listens.
2. When you take the pencil from someone, begin your explanation or reason
with: ―I agree/disagree with . . . because . . .‖
3. Then you can go on with: ―So I think that . . .‖
4. Make sure everyone has a turn to speak.
5. Leave time at the end of the session to help the reporter get ready. (p. 46)
Setting up these clear expectations allows all students to participate in an appropriate way
to show respect for the opinions of others and also keep the discussion focused on the
mathematics and reasoning. Ryan and Williams also recommend a group reporting
practice to hold students accountable for listening. The following is a sample of a
Mathematics Discussion Record template:
The question was ……………………………………
We discussed the following different answers:
We decided the correct answer was……
We decided this because …….
But did not agree with this because……
Signed……………………………… (reporter) Date: …(p. 46)
46
Students can take turns completing the discussion record and get assistance from the class
in making sure that the discussion is represented appropriately.
Ryan and Williams (2007) have worked to prepare teachers to facilitate
argumentation in their classrooms. They have used the term general pedagogical
strategies to describe the following teacher moves that improve argumentation outcomes
related to mathematics:
Elicitation of a variety of alternative ‗answers‘ and arguments, asking children to
listen and sometimes to paraphrase others‘ views, seeking further clarification of
arguments, helping to formulate and encourage a minority point of view, seeking
support and dissent, criticizing the reasons and not the individual, and so on, as
well as pressing for reasons or ‗backing.‘(Ryan :& Williams, 2007, p.43)
The work of Ryan and Williams (2007) and Enyedy (2003) has informed the
development of the PD of Jumpstart 2010 for teachers. By understanding how to set up
the class environment for argumentation and how to facilitate the discussion, the teachers
set the expectation that students take responsibility for their learning and understanding.
Improving Teacher Content Knowledge Related to Integer Operations
In order to develop deep conceptual understanding of integers within students,
teachers need to have a deep flexible content knowledge in the courses they teach. In
work with pre-service and in-service teachers, several authors emphasize that teachers
need to not only understand the facts and concepts of their discipline, but also the way the
concepts are connected and the way members in their field go about creating new
knowledge and determining the validity of new claims (Anderson, 1989; Ball, 1990;
Borko, 2004; Borko & Putnam, 1996; McDiarmid, 1995; McDiarmid, Ball, & Anderson,

47
1989). To better understand this third option for PD, what follows is the research on
content-focused PD and effective components of such a program.
Turnuklu and Yesildere (2007) gave pre-service teachers the following sample
dialogue between a student and their teacher:
Teacher: What is the result of -3 + 5?
Student: -3 + 5 is - 8.
Teacher: How did you do it?
Student: 3 plus 5 is 8. The sum has the sign of the first integer. (Turnuklu &
Yesildere, 2007, p. 9)
Turnuklu and Yesildere (2007) found that 44% of the teacher candidates understood the
students‘ misconception in the dialogue, but 56% of them had their own misconceptions
about addition and subtraction of integers. They did not understand the connection
between addition and subtraction. Examples of their misconceptions follow:
5-3 is an addition operation. It means ―5 plus -3.
There is no difference between 5-3 and 3-5
The set of integers is commutative under subtraction (Turnuklu & Yesildere,
2007, p. 9)
The teachers in the study tended to try to re-explain the task or ask questions to explain
the task rather than trying to understand the students‘ thinking of their misconception.
This response did not satisfy the students because it did not address their misconception.
According to the work of Turnuklu and Yesildere (2007), teachers need to understand the
difference between a sign and an operation and the importance of assisting students in
understanding the difference.
According to a review of math and science PD programs by Kennedy (1998),
―programs whose content focused mainly on teachers‘ behaviors demonstrated smaller

48
influences on student learning than did programs whose content focused on teachers‘
knowledge of the subject, on the curriculum, or on how students learn the subject‖
(p. 18). In a research study of PD, a national sample of teachers was surveyed by Garet,
Porter, Desimone, Birman, and Yoon (2001) who discovered that activities that are
content focused but do not increase the knowledge and skills of teachers result in a
negative impact on teacher practices. Therefore, just providing teachers with content is
not sufficient; the PD must provide a deepening of the teachers‘ conceptual knowledge
and skills in the subject(s) they teach.
Developing and Researching Professional Development
Effective Professional Development
A review of the literature on PD informed the design of the Jumpstart PD and the
plan for studying the impact of the PD on teacher and student understanding. Research
has shown that there are several key ingredients to effective PD. In developing the PD
materials, it is important to keep in mind the need for flexibility that the facilitator and
users may need (Borko, 2004; LeFevre, 2004; Remillard & Geist, 2002). Based on the
context for implementation, there may be a need to adapt the PD to the needs of the
teacher and allow the teachers to further adapt it to meet their needs. So researchers need
to decide on the tradeoffs of studying fidelity of implementation and the elements of the
PD that must be preserved to maintain the goals of the study (Borko, 2004). According
to a review of research on mathematics teaching by Hiebert (1999), there are several
components of effective opportunities for teachers to learn new teaching methods:

49
(a) ongoing (measured in years) collaboration of teachers for purposes of
planning with (b) the explicit goal of improving students‘ achievement of clear
learning goals, (c) anchored by attention to students‘ thinking, the curriculum
and pedagogy, with (d) access to alternative ideas and methods and opportunities
to observe these in action and to reflect on the reasons for their effectiveness.
(Hiebert, 1999, p. 15)
There should be an attempt to include a component of prolonged engagement of the
participants, which can be costly in terms of time and resources. However, it may be as
important as the chosen area of focus to the growth of teacher knowledge and
improvement in the quality of instruction and student achievement.
Professional Development Design Considerations
Loucks-Horsley, Stiles, Mundry, Love, and Hewson (2010) have been
conducting research on PD and reviewing research on effective PD programs for over ten
years. In their latest edition (2010) Designing Professional Development for Teachers of
Science and Mathematics, they share five important values for designing PD. First,
students and student learning outcomes need to be the focus of PD, with an emphasis that
these outcomes need to be for all students. Second, the design of the PD must address the
PCK of science and mathematics teachers, not just focusing on pedagogy or content
separately. The way the PD is enacted needs to be in line with the pedagogy expected of
teachers for working with students. So if the PD is about inquiry instruction for students,
then the design must inlude inquiry opportunities for teachers. Next, teacher leaders
should be involved in the design and facilitiation of PD building capacity within the
school and district in which they work. Finally, PD design must be aligned with and
support systemic changes by addressing standards, assessment, and curriculum to move
towards improvement in teaching and learning. What follows is some additional research
50
related to four components of PD design: ensuring equity for all students, transforming
teacher beliefs and practices, understanding possible outcomes, and ensuring relevance
for teachers.
Ensuring equity for all students. Horizon Research conducted the 1993 National
Survey of Science and Mathematics Education with a probability sample of 1,250 schools
in the United States which included 6,000 teachers in grades 1-12 (Weiss, 1997). Horizon
Research compared low and high ability high school students and the opportunity
provided to them to participate in different classroom activities. The results showed that
there were fewer opportunities afforded to low-ability students to engage in inquiry based
science activities. These same students were also provided with fewer opportunities to
write or talk about their reasoning while solving problems in mathematics classes.
Therefore, PD should emphasize ways to close opportunity to learn gaps so that all
students have the opportunity to engage in inquiry and high level thinking in mathematics
(Weiss, Matti, Smith, 1994).
Transforming teacher beliefs and practices. For PD to be transformative, by
changing deep seated beliefs of teachers, Thompson and Zeuli (1999) provide the
following recommendations based on their years of work with teachers:
1. Engage teachers in the subject matter and how kids learn in ways that create a
high level of cognitive dissonance and cause them to start thinking about
better ways to teach.
2. Allow enough time and opportunities for teachers to think through this
dissonance and engage in discussions with other teachers about it.

51
3. Use actual student work, video tapes, case studies (transcripts), or opportunities
to engage as learners for teachers to experience the kind of instruction desired
and to work through the related cognitive dissonance.
4. Provide opportunities for teachers to think and plan for how this new
understanding will impact what they do in their classrooms and how their
work with students.
5. Engage teachers in a cycle of ongoing reflection on practice and improvement.
(Thompson and Zeuli,1999 p.356-357)
In order to transform teachers old ways of teaching, research by Little (1993) found that
the PD experiences needed to allow teachers opportunities to learn through constructivist
learning activities to understand deeply the importance of these kinds of experiences for
their students.
Understanding possible outcomes. According to the extensive research of Ball
and Cohen (1999) on teacher PD, professional developers need to have realistic
expectation of outcomes related to teacher change. Their research has found that change
in attitudes, beliefs, and instruction often come after teachers have used the new practice
in their classrooms and have experienced positive results with their students. Therefore,
the practice focused on in PD should be something teachers can implement immediately
in their classrom.
Ensuring Relevance for Teachers. Mundry and Loucks-Horsley (1999)
conducted a series of case studies at different grade levels as part of the National Institute
for Science Education (NISE) PD project. In the case study of Riverside Middle School

52
(Urban Diverse School serving students in grades 6-8) they found that implementation of
a new reform mathematics curriculum required that the PD was designed to encorporate a
balance between pragmatically what teachers are concerned about such as being prepared
to implement the new curriculum and the new pedagogical practice that was the focus of
the reform effort. Therefore, the Jumpstart PD was developed around student activites to
ensure such a balance for the teachers between ensuring they are prepared to teach as
well as developing their PCK.
Data Collection to Measure Effect of Professional Development
Researchers recommend a theory of teacher change and a theory of instruction to
determine whether the PD improves teachers‘ content knowledge and their quality of
teaching (Carpenter, Fennema, Peterson, Chiang, & Loef, 1989; Sloan, 1993). Data on
teacher content knowledge prior to the PD and possibly several other times if the PD is
ongoing should be collected. Additional implementation data such as classroom
observations can also determine if there are changes in quality of instruction provided. It
is important to provide a rich description of the PD experience. If it is not possible to
conduct multiple observations throughout the year, it is important to collect additional
data through structured and unstructured interviews with teachers or focus groups of
teachers. Krueger (1988) and Krueger and Casey (2000) provide practical suggestions
for structuring focus-group questions that can be used to develop the focus group
interview. One suggestion to consider is to hold a brainstorming session with colleagues
and/or teachers to generate questions (Mertens, 2005).

53
Many studies gather data on student performance at the beginning of the year and
then after teachers experience PD and have time to implement what they have learned in
the classroom. However, the results of an observational study by Harris and Saas (2007)
showed that their content-focused PD for middle school mathematics teachers had an
impact on the student performance the year following the PD program and did not have
an impact the year the teachers were participating in the PD. Achievement tests may not
measure the kind of information that relates to the PD. So additional options may need to
be considered such as interviews with a sample of the students in each teacher‘s class,
interviews conducted with a focus group of students from a teacher‘s class and work
samples from the students.
Conclusion
According to Ryan and Williams (2007), it is not a matter of subject knowledge
or subject knowledge only, it is a matter of knowledge about the best tasks,
representations, models, contexts, and so on, to introduce in a given situation what
Shulman (1986) called ―pedagogy content knowledge‖ (p. 39). Based on this review of
literature, the PD for this study integrated content knowledge development in teachers
with a strengthening of their classroom pedagogy related to facilitating mathematical
discussion in the classroom using argumentation.
The National Council of Teachers of Mathematics (1989) emphasizes the
importance of students understanding integers and makes the following recommendation:
Instruction should help students see the underlying structure of mathematics,
which bonds its many individual facets into useful, interesting, and logical whole.
Instruction should employ informal explorations and emphasize the reasons why

54
various kinds of numbers occur, and relationships between number systems.
(NCTM, 1989, p. 91)
The study of number theory and integers provides students with a rich opportunity to
develop reasoning skills as they look for patterns and justify their thinking. Reasoning is
emphasized in Focus in High School Mathematics: Reasoning and Sense Making.
Reasoning and sense making are described as
Student's ability to think about and use mathematics in meaningful ways. . . .
Mathematical reasoning involves drawing conclusions on the basis of
assumptions and definitions. Sense making involves developing an understanding
of a situation, context, or concept by connecting it with other knowledge. (NTCM,
2009, p. 1)
This research study combined teacher reasoning about integers through argumentation
during the PD to improve teacher PCK in order to impact student understanding of
integers and integer operations. This study will add to the current research base in that it
includes a larger sample size than most of the previous studies, and it includes a
quantitative analyses along with qualitative analyses to better understand patterns in
teacher understanding, whether there was a change in teacher PCK following the PD,
whether there was a change in student understanding following implementation of the
revised curriculum activities for the unit on integer operations, and whether this change in
student understanding was statistically significantly different than the previous year.

55
CHAPTER THREE: THE PILOT STUDY
A Pilot Study to Explore Student Understanding of Integers
In May 2008, the researcher conducted a pilot study of student integer
understanding. The goal of this study was to document an ―average‖ developmental
trajectory for negative integers, and to understand the onset and offset of counting, rule
application, symmetry detection, categorical perception, and other processes. The
expectation was that there would be large individual differences at younger ages with a
steady convergence towards adulthood. Each student interview was audio recorded and
transcribed. During the analysis of the interview transcripts, attention was paid to the
results of any individuals who exhibited patterns that were well outside the ―average‖
range. Based on teacher and student interview data, a comparison was made of children
exposed to different curricula and instructional strategies. In combination, these two
lines of work provided a foundation for subsequent intervention and development studies.
Research Question
How do children take a well-established knowledge structure for positive numbers
and build on it in a way that goes beyond that structure to understand negative numbers?
Research Sub-questions
1. What is an ―average‖ developmental trajectory for negative integers?
2. At what stages of ―average‖ development is there an onset and offset of
counting, rule application, symmetry detection, categorical perception, and
other related processes?

56
3. How do the individual differences at younger ages compare to individual
differences as a child nears adulthood?
4. How do children conceptualize negative numbers?
5. In what ways do children communicate their understanding of integers?
Methods
Upon consent of the principals of a middle and high school in Central Texas,
mathematics teachers of students in grades 7, 9, and 11 were approached for permission
to ask their students if they would be interested in participating in a study. A consent
letter was sent home to the parents of interested students explaining the voluntary nature
of their participation. Interested students were asked to sign a consent form. The goal
was to include 24 students in the research project from each of grades 7, 9, and 11. The
students were given permission to leave class for approximately 25 minutes to participate
in a computer task comparing two integers to determine which integer was smaller or
larger, followed by a short interview.
Participants
The prior school year, both the middle and high school had been rated as
―Academically Unacceptable‖ according to the Texas Education Agency. Participants
were recruited from mathematics classes. They returned consent forms signed by parents
or legal guardians. The sample included 21 grade 7 students, 24 grade 9 students, and 23
grade 11 students, but only 20 of grade 11 students were able to complete the full
interview. Table 1 provides the average State Mathematics Assessment (TAKS) math

57
Table 1 State Mathematics Assessment (TAKS) Performance for the Sample
TAKS 2007
Average
TAKS 2008
Average
Grade 7 2159 2158
Grade 9 2073 2062
Grade 11 1980 2035
Note. TAKS scores are standard scores with 2100 representing passing interviews.
Students were provided with a 15-minute computer task to compare two integers
to decide which was larger or smaller depending on the prompt. Following the brief
integer comparison task on the computer, the students were interviewed to determine
what strategies or mental representations they used to complete the task and to complete
five integer arithmetic problems (-5 + 8,
-3 +
-6, 2 – 7,
-2 – 5, and
-4 5) explaining their
thinking or reasoning for each problem. The following questions were given to the
students:
1. When you are comparing the numbers on the screen, how did you decide
which one was larger5?
2. If you were not sure, how would you figure it out?
3. Here are a few computation problems. As you solve each problem, explain
what you are thinking about or how you are solving each problem.
4. Is there something you could draw to help you solve one of these problems?
5. Where have you seen negative numbers before? In school? Outside of school?
5 Students are typically taught that larger numbers are the ones further to the right of zero. They are
exposed to inequalities which are referred to as ―greater than‖ or ―less than‖ signs. So larger in this
situation is the same as greater.

58
6. Why do you think it is important to understand negative numbers?
Results
The transcripts were read the first time to develop a set of codes to use to identify
the strategies and representations used by students to compare integers and to calculate
the integer arithmetic solutions. An analysis of student responses to each question was
conducted assigning each response a code. Another experienced mathematics teacher
similarly read and coded each response. The codes were compared for discrepancies.
Discrepancies were discussed and after a review of the transcript and student work, a
final code was assigned. Some of the students gave responses that were unclear or filled
with comments about confusion or lack of certainty. These were given an ―other‖ code,
because they did not meet the description of any of the other codes chosen. What follows
is a table of data for each question and type of arithmetic problem along with a summary
statement of observations from the analysis. Whenever appropriate, relevant information
from the interactions with the teachers related to their instruction of integers was noted.
Of the 23 students, only 20 were able to stay for the interview because three students had
to go to the next class.
Student Question 1
What were you thinking about when you were comparing the numbers on the
screen? How could you tell which one was larger? What if there were two negative
numbers?

59
Table 2 Percent of Students Using Strategies for Comparing Integers
Note. Source: Analysis of student interview responses.
A majority of the students used a mental number line representation or the
closeness of the number to zero to determine which of the two numbers on the computer
screen was larger or smaller. A larger percentage of grade 7 (38%) and grade 9 (37%)
students were confused, unsure, or unable to explain the strategy or mental representation
they were using to compare the integers. The second most common strategy for grade 9
and grade 11 students was to use a rule such as thinking the opposite of what one would
for positive numbers, which is that the smaller negatives (smaller in magnitude or
absolute value) are actually greater than larger negatives (larger in magnitude or absolute
value).
Student Question 2
If you were not sure, was there anything else that you did to decide?
Strategy/Representation
Grade 7
(n = 21)
Grade 9
(n = 24)
Grade 11
(n = 20)
Total
(n = 65)
Number line: Close to 0 29 42 45 38
Opposite of Positive
numbers
10 17 25 17
Fact/Memory 4.5 4 5 5
Money metaphor 4.5 0 5 3
Misconception: Larger
negatives (magnitude) are
larger than smaller negatives
(smaller magnitude)
14 0 5 6
Other 38 37 15 31

60
Table 3 Percent of Students Using Alternative Strategies for Comparing Numbers
Note. Source: Analysis of student interview responses.
The largest percentage of students did not have an alternative strategy or
representation to use if they were not sure about which one was larger or smaller, as
shown in Table 3. This is the group marked Other, because the students really were not
sure about what to think about if they were not sure. The number line or closeness to
zero was the second most common strategy for each grade level.
Student Question 3
Here are a few computation problems. What are you thinking about or how are
you solving each computation problem?
Strategy/Representation Grade 7
(n = 21)
Grade 9
(n = 24)
Grade 11
(n = 20)
Total
(n = 65)
#line/close to 0 29 37 30 32
Rule: Opposite of Positive
numbers
5 13 5 8
Fact/Memory 9 0 5 5
Money metaphor 0 0 5 1.5
Misconception: Larger
negatives are Larger
0 0 5 1.5
Guess 9 4 5 6
Other 48 46 45 46
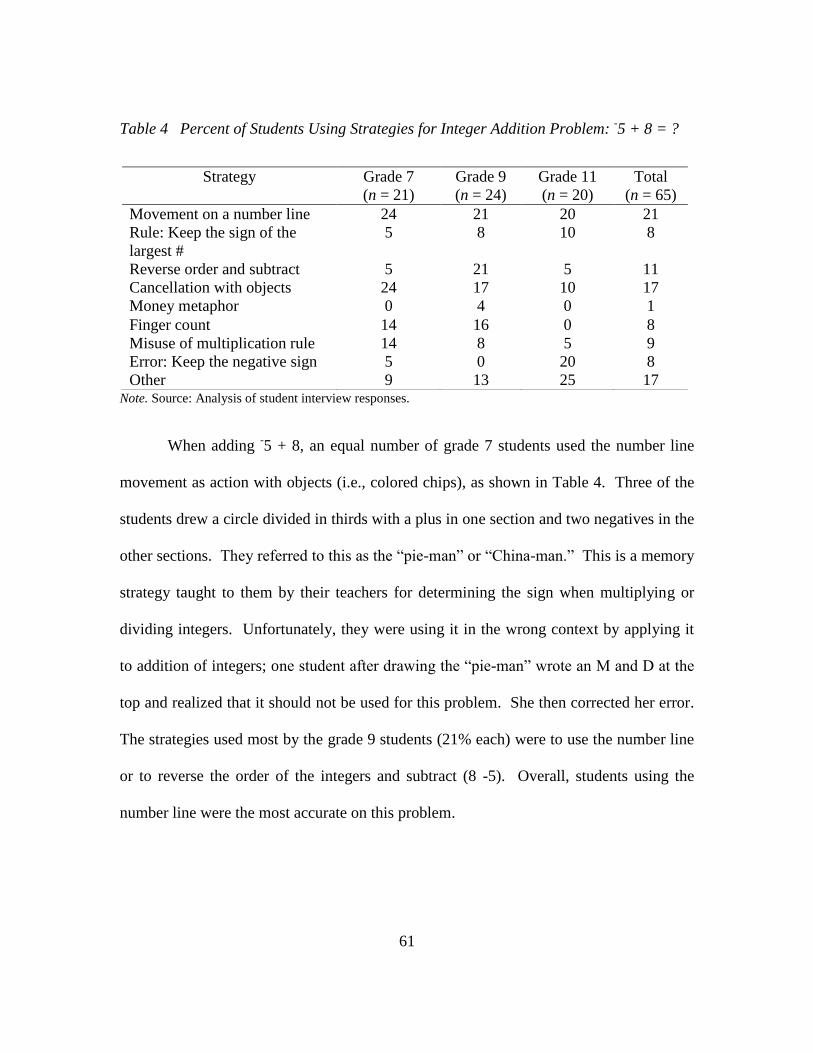
61
Table 4 Percent of Students Using Strategies for Integer Addition Problem: -5 + 8 = ?
Note. Source: Analysis of student interview responses.
When adding -5 + 8, an equal number of grade 7 students used the number line
movement as action with objects (i.e., colored chips), as shown in Table 4. Three of the
students drew a circle divided in thirds with a plus in one section and two negatives in the
other sections. They referred to this as the ―pie-man‖ or ―China-man.‖ This is a memory
strategy taught to them by their teachers for determining the sign when multiplying or
dividing integers. Unfortunately, they were using it in the wrong context by applying it
to addition of integers; one student after drawing the ―pie-man‖ wrote an M and D at the
top and realized that it should not be used for this problem. She then corrected her error.
The strategies used most by the grade 9 students (21% each) were to use the number line
or to reverse the order of the integers and subtract (8 -5). Overall, students using the
number line were the most accurate on this problem.
Strategy Grade 7
(n = 21)
Grade 9
(n = 24)
Grade 11
(n = 20)
Total
(n = 65)
Movement on a number line 24 21 20 21
Rule: Keep the sign of the
largest #
5 8 10 8
Reverse order and subtract 5 21 5 11
Cancellation with objects 24 17 10 17
Money metaphor 0 4 0 1
Finger count 14 16 0 8
Misuse of multiplication rule 14 8 5 9
Error: Keep the negative sign 5 0 20 8
Other 9 13 25 17
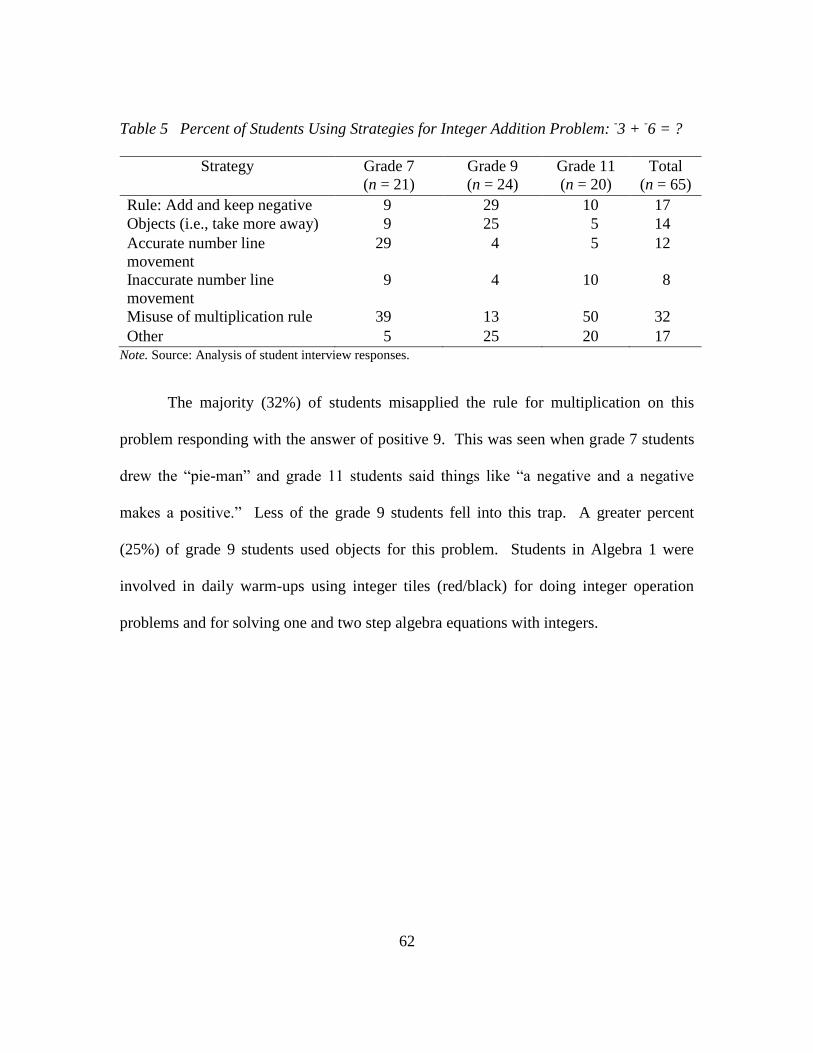
62
Table 5 Percent of Students Using Strategies for Integer Addition Problem: -3 +
-6 = ?
Strategy Grade 7
(n = 21)
Grade 9
(n = 24)
Grade 11
(n = 20)
Total
(n = 65)
Rule: Add and keep negative 9 29 10 17
Objects (i.e., take more away) 9 25 5 14
Accurate number line
movement
29 4 5 12
Inaccurate number line
movement
9 4 10 8
Misuse of multiplication rule 39 13 50 32
Other 5 25 20 17 Note. Source: Analysis of student interview responses.
The majority (32%) of students misapplied the rule for multiplication on this
problem responding with the answer of positive 9. This was seen when grade 7 students
drew the ―pie-man‖ and grade 11 students said things like ―a negative and a negative
makes a positive.‖ Less of the grade 9 students fell into this trap. A greater percent
(25%) of grade 9 students used objects for this problem. Students in Algebra 1 were
involved in daily warm-ups using integer tiles (red/black) for doing integer operation
problems and for solving one and two step algebra equations with integers.
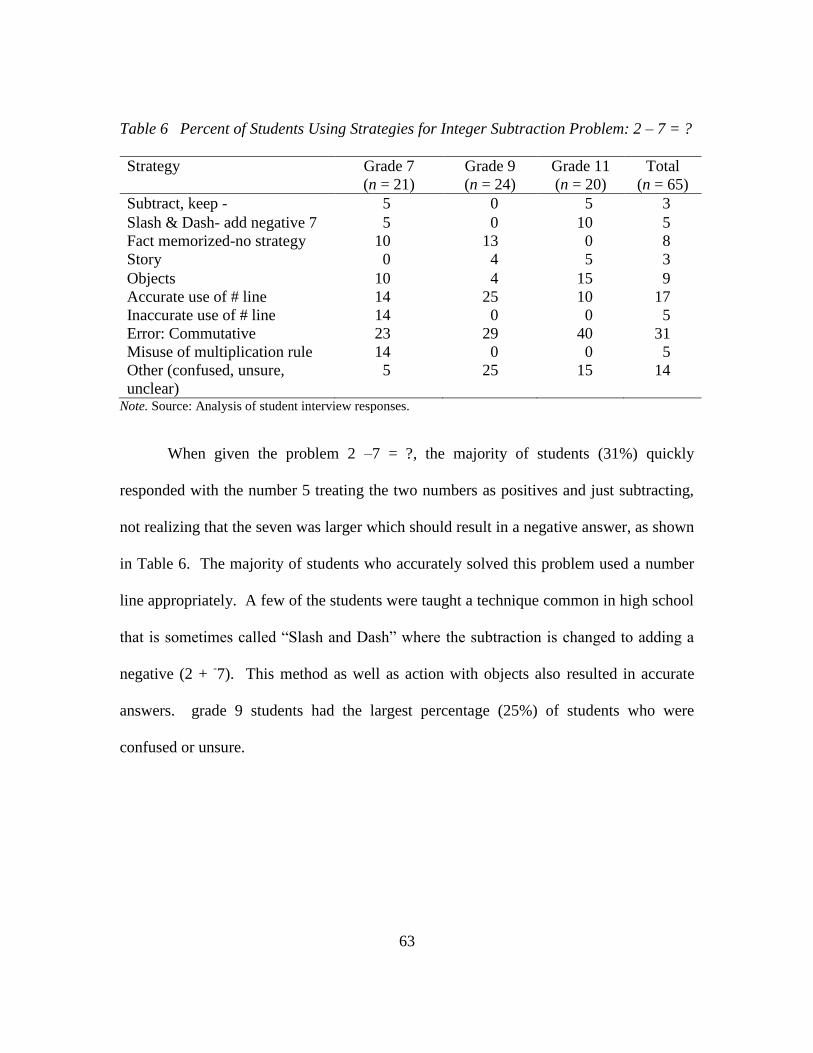
63
Table 6 Percent of Students Using Strategies for Integer Subtraction Problem: 2 – 7 = ?
Strategy Grade 7
(n = 21)
Grade 9
(n = 24)
Grade 11
(n = 20)
Total
(n = 65)
Subtract, keep - 5 0 5 3
Slash & Dash- add negative 7 5 0 10 5
Fact memorized-no strategy 10 13 0 8
Story 0 4 5 3
Objects 10 4 15 9
Accurate use of # line 14 25 10 17
Inaccurate use of # line 14 0 0 5
Error: Commutative 23 29 40 31
Misuse of multiplication rule 14 0 0 5
Other (confused, unsure,
unclear)
5 25 15 14
Note. Source: Analysis of student interview responses.
When given the problem 2 –7 = ?, the majority of students (31%) quickly
responded with the number 5 treating the two numbers as positives and just subtracting,
not realizing that the seven was larger which should result in a negative answer, as shown
in Table 6. The majority of students who accurately solved this problem used a number
line appropriately. A few of the students were taught a technique common in high school
that is sometimes called ―Slash and Dash‖ where the subtraction is changed to adding a
negative (2 + -7). This method as well as action with objects also resulted in accurate
answers. grade 9 students had the largest percentage (25%) of students who were
confused or unsure.

64
Table 7 Percent of Students Using Strategies for Integer Subtraction Problem: -3 – 5 = ?
Strategy Grade 7
(n = 21)
Grade 9
(n = 24)
Grade 11
(n = 20)
Total
(n = 65)
Rule: Add and keep negative 5 8 0 5
Slash & Dash-convert to addition 5 8 10 7
Fact-memorized 0 8 5 5
Objects referenced (i.e., chips) 24 4.5 0 9
Accurate number line movement 14 13 20 15
Inaccurate number line movement 9.5 0 5 5
Error: Subtract, and keep negative 14 4.5 45 20
Error: Use of rule for multiplication 19 29 0 17
Other 9.5 25 15 17 Note. Source: Analysis of student interview responses.
When asked to solve -3 – 5 = ?, the largest percentage of grade 11 students
subtracted the numbers and kept the answer negative unaware of why except that they
should subtract, as shown in Table 7. A large percentage of grade 7 and grade 9 students
misapplied the rule for multiplication. More grade 7 students used objects (chips) with
this problem modeling a strategy they were taught by making a key (showing which chips
represent positive and which represent negative); however, some of them resulted in
errors because they were starting with 3 negative and wanting to take away 5, so they
needed 2 more negatives to take away.

65
Table 8 Percent of Students Using Strategies for Integer Multiplication: -4 x 5 = ?
Strategy Grade 7
(n = 21)
Grade 9
(n = 24)
Grade 11
(n = 20)
Total
(n = 65)
Accurate Rule Use 38 50 60 49
Keep Negative not sure why 14 4 0 6
Use of objects 14 0 0 5
Inaccurate Rule Use 10 13 0 8
Inaccurate use of number line 5 0 0 1.5
Error: Multiply then subtract number 5 0 0 1.5
Multiply as if positives 4 x5 5 16.5 5 9
Other (unsure, confused, unclear) 9 16.5 35 20 Note. Source: Analysis of student interview responses.
The majority of the students accurately used the rule which was typically stated as
―a negative and a positive makes a negative‖ or shown with the ―pie-man‖ memory
device, as shown in Table 8. The most common mistake was to multiply the numbers as
if they were positive resulting in an answer of 20. There was a large percentage (20%) of
students who were not sure if the answer was positive or negative and they did not have a
strategy or representation that they could use to verify which one it should be.
In terms of accuracy, grade 9 students outperformed the students of grades 7 and
11 (see Table 9). This may related to a warm up activity solving integer expressions and
equations that these grade 9 students completed daily for a month prior to this interview
that involved use of a manipulative for positive and negative numbers called Algebra
Pieces (Math Learning Center , 2009)6. This activity was developed by the Algebra 1
team of teachers at the high school that the grade 9 students attended. The grade 11
students had a lower than expected accuracy; however, this student group had a much
6 Burton (2006) provides more information about use of this manipulative.

66
lower average TAKS math score than the students from the other two grades. So these
students may have had inadequate foundations in math.
Table 9 Overall Percent Accuracy of Integer Arithmetic
Accuracy Grade 7
(n = 21)
Grade 9
(n = 24)
Grade 11
(n = 20)
Total
(n = 65)
-5 + 8 = 3 62 100 60 74
-3 + -6 = -9 57 79 45 60
2 – 7 = -5 19 63 45 42
-3 – 5 = -8 19 25 35 26
-4 x 5 = -20 76 75 75 75
Total Accuracy 47 68 55 57 Note. Source: Analysis of student interview responses.
The last three questions were asked to determine what representations students
were able to use to confirm their answer: their awareness of real world applications of
integers, and their opinion on the usefulness and importance of having an understanding
of integers and integer operations. These questions were asked to determine what
additional understanding of integers students had beyond their knowledge of comparing
and ordering integers and integer operations, especially any relevant out of school
knowledge that they possessed.
Student Question 4
Is there something you could draw to help you solve one of these problems?
The students drew or created representations that were aligned with what the students had
been taught which were number lines and chips (see Table 10). More of the grade 11
students were unsure or unable to draw anything than students in grades 7 and 9. One

67
question remains, whether the students in grade 11 would have used chips or counters if
they were provided to them.
Table 10 Percent of Students Using Representations to Solve Problems
Representation Grade 7
(n = 21)
Grade 9
(n = 24)
Grade 11
(n = 20)
Total
(n = 65)
Metaphor/Story: $ 0 4 10 5
Sticks 0 8 5 5
Circles/Chips 38 42 25 35
Number line 43 46 35 42
Pie-Man 5 0 0 1
Other 5 0 5 3
Unsure 9 0 20 9 Note. Source: Analysis of student interview responses.
Student Question 5
Where have you seen negative numbers before? In school? Outside of school?
The juniors had the widest variety of places that they had seen or heard of
negative numbers. Students from grade 7 had very limited exposure to contexts that use
negative numbers. One question to consider for future research: Would exposure to real
world application of integers in a variety of contexts improve integer understanding and
accuracy in integer arithmetic?
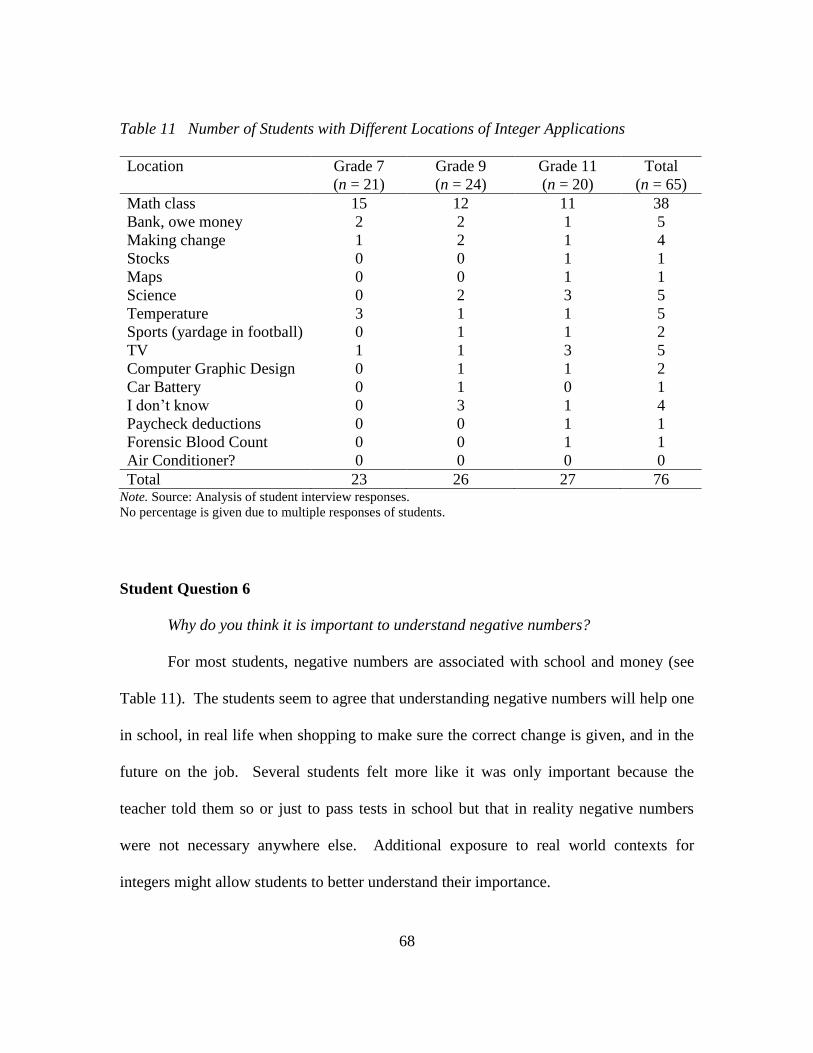
68
Table 11 Number of Students with Different Locations of Integer Applications
Location Grade 7
(n = 21)
Grade 9
(n = 24)
Grade 11
(n = 20)
Total
(n = 65)
Math class 15 12 11 38
Bank, owe money 2 2 1 5
Making change 1 2 1 4
Stocks 0 0 1 1
Maps 0 0 1 1
Science 0 2 3 5
Temperature 3 1 1 5
Sports (yardage in football) 0 1 1 2
TV 1 1 3 5
Computer Graphic Design 0 1 1 2
Car Battery 0 1 0 1
I don‘t know 0 3 1 4
Paycheck deductions 0 0 1 1
Forensic Blood Count 0 0 1 1
Air Conditioner? 0 0 0 0
Total 23 26 27 76 Note. Source: Analysis of student interview responses.
No percentage is given due to multiple responses of students.
Student Question 6
Why do you think it is important to understand negative numbers?
For most students, negative numbers are associated with school and money (see
Table 11). The students seem to agree that understanding negative numbers will help one
in school, in real life when shopping to make sure the correct change is given, and in the
future on the job. Several students felt more like it was only important because the
teacher told them so or just to pass tests in school but that in reality negative numbers
were not necessary anywhere else. Additional exposure to real world contexts for
integers might allow students to better understand their importance.

69
Table 12 Percent of Students Sharing Reasons for Importance of Negative Numbers
Reason Grade 7
(n = 21)
Grade 9
(n = 24)
Grade 11
(n = 20)
Total
(n = 65)
Teacher told me 0 0 5 2
Banks, owe $, bills 14 12.5 15 14
Store, not get short changed 29 12.5 15 18
To better understand them 0 8 15 8
Temperature 5 4 10 6
Football 0 0 5 2
Life, future, job 9 12.5 25 15
Do math better 24 17 5 15
Other 5 12.5 5 8
I don‘t know 9 21 0 11
It‘s not important 5 0 0 2 Note. Source: Analysis of student interview responses.
Discussion
The primary goal of the pilot study was to evaluate the development of the mental
representation of integers through middle and high school. The results suggest that grade
7, 9, and 11 students behave according to the rule augmentation hypothesis, using a
combination of rules and a number line representation. In this regard, they are more
similar to grade 6 students (Varma & Schwartz, 2008) than adults previously studied
(Varma et al., 2007). However, this sample of grade 11 students had relatively low
TAKS test scores in math so they may not be representative of the development of most
grade 11 students. Additional research with a larger sample is needed to determine if this
development hypothesis is correct.
Re-Analysis of Pilot Study Data for Grades 7 and 9
Prior to the development of the curriculum unit for this study, a review of the
statements made during the interviews of the 7th
and 9th
grade students was conducted to

70
determine areas in need of attention. Since the Jumpstart students are in grade 8, this
data should be most similar to the kinds of thinking that they may exhibit. It appeared
that the main difference in the student thinking related to an understanding that was rule
based or an understanding that was connected to either a representation or real world
context.
When the responses for these items were analyzed, there were five types of
strategies that were coded as ―Rule Based‖ and four types of strategies coded as
―Connected.‖ Table 13 and Table 14 provide representative statements from the students
in the pilot study of these kinds of strategies.
Table 13 Representative Statements for Rule-based Understanding
Strategy Example
Rule ―(2 – 7) It is going to be negative because 2 is smaller than 7, so
negative 5.
Commutative ―2 – 7, this is like 7-2 which is 5. I learned that in second grade.‖
Subtract ―When you are subtracting, you just subtract (Student writes -3 -5 =
-2).‖
Misuse of X
and ÷ Rule
―(-3 – 5) I'm thinking it should be just a 2, because it's like another
negative sign, but a negative and negative is a positive, so that would
make it just a 2.‖
Slash & Dash ―2 subtract 7? Well, what we do is slash and dash like that. (Student
changes 2 – 7 to 2 + -7) Negative five.‖
Fact "2 – 7 = -5, I just know it. I don‘t know how to explain it." Note. Source: Analysis of student interview responses.

71
Table 14 Representative Statements for Connected Understanding
Strategy Example
Story ―2 – 7, if I have food I want to eat less, so if I had 2 things but
I really wanted to eat 7, I'm going to be starving for like 5
apples.‖
Objects ―(Students drew 2 white squares and 7 shaded squares) I
shade them so I can tell the difference. (Students circled 2
pairs of white and shaded squares). Two minus seven is
negative five."
Number Line ―I think I just think of this as a negative number, (Student
draws a number line and moves to the number 2). Two. So
count to 7, one , two, three, four, five, six, count to seven, and
you get the distance which is -5 (moves on number line from
2 to -5).‖
Misuse of Number Line ―2 – 7, (Student draws number line showing positives only)
instead of going forward 2 to 9 you go back 2 to 5.‖ Note. Source: Analysis of student interview responses.
The data from 20 students from each grade level (7th
and 9th
) for subtraction of
integers were analyzed to determine the prevalence of rule-based and connected
understanding. Tables 15 and 16 provide the data from their responses.
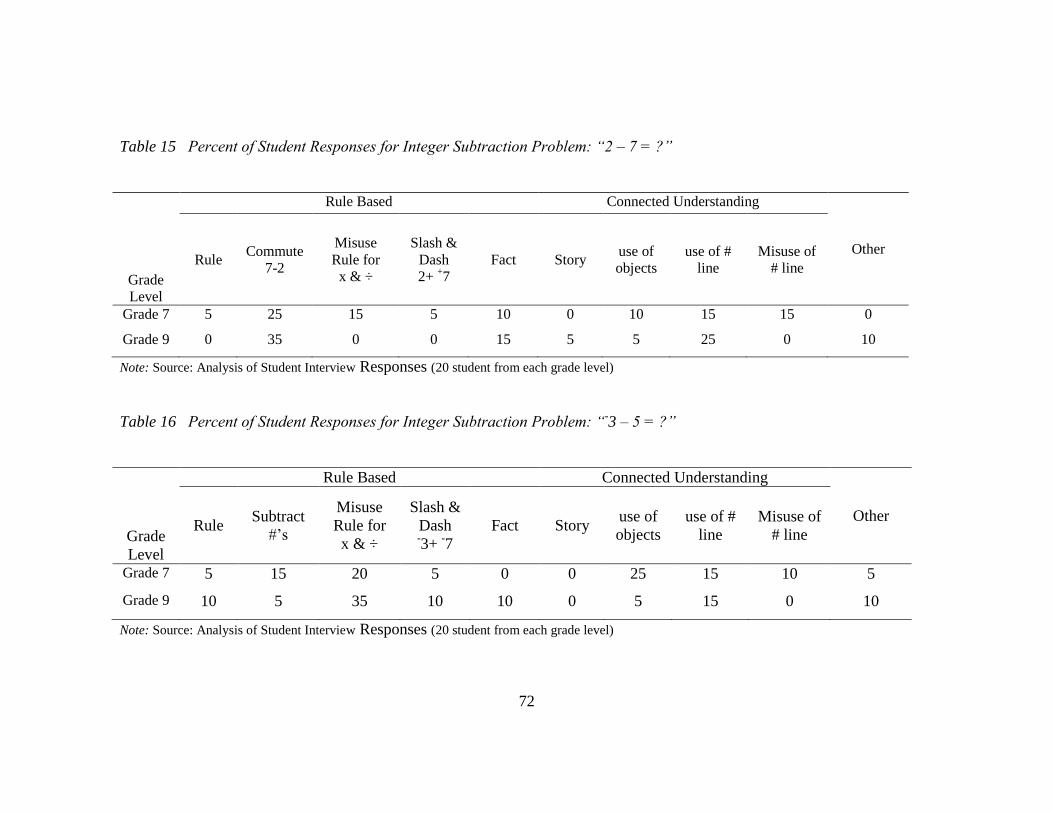
72
Table 15 Percent of Student Responses for Integer Subtraction Problem: “2 – 7 = ?”
Grade
Level
Rule Based Connected Understanding
Other Rule
Commute 7-2
Misuse
Rule for x & ÷
Slash &
Dash 2+
+7
Fact Story use of
objects use of #
line Misuse of
# line
Grade 7 5 25 15 5 10 0 10 15 15 0
Grade 9 0 35 0 0 15 5 5 25 0 10
Note: Source: Analysis of Student Interview Responses (20 student from each grade level)
Table 16 Percent of Student Responses for Integer Subtraction Problem: “-3 – 5 = ?”
Grade
Level
Rule Based Connected Understanding
Other Rule
Subtract
#‘s
Misuse
Rule for
x & ÷
Slash &
Dash -3+
-7
Fact Story use of
objects
use of #
line
Misuse of
# line
Grade 7 5 15 20 5 0 0 25 15 10 5
Grade 9 10 5 35 10 10 0 5 15 0 10
Note: Source: Analysis of Student Interview Responses (20 student from each grade level)

73
Notice that only two strategies (commute and use of number line) were employed
by more then 20% of the grade 7 and 9 students, respectively. This suggests that the
students used a range of strategies to solve these sorts of problems—both before (as
represented by the grade 7 students) and after (as represented by the grade 9 students)
instruction. Of the two strategies that were used most frequently, students in both grade
levels used one strategy—commutativity—relatively frequently. When using this
strategy, students apply the commutative property—a property of multiplication and
addition—to solve subtraction problems. In this case, that means they solved for 7-2
when asked to solve for 2-7. The researcher suggests that this misapplication of the
commutative property implies that the students lack a conceptual understanding of
integers and integer operations: Why does commutativity work for some operations but
not for others?
Similar to the previous subtraction problem, -3 -5 resulted in a diversity of student
responses. One strategy that emerged at both grade levels was the misuse of the rule for
multiplication and division of integers. An example of the misuse of the rule for
multiplication is shown in Figure 2. This image represents a memory strategy that many
teachers introduce to students to help them determine whether a multiplication problem
should result in a positive or negative answer. However, it does not apply to subtraction
problems. Using this device, three students incorrectly determined that -3 –5 =
-2 by
recognizing it as a subtraction problem, subtracting 3 from 5, and then determining that
the sign of the answer is negative. Figure 2 provides a student response to further
describe this strategy.

74
Figure 2 Example of the misuse of a memory device for multiplication/division of
integers
This is an example of students using a rule without any underlying connection:
They learned this rule, but then they misapplied it because they did not have a deep
conceptual understanding of why the rule is true. This finding suggests that PD should
include discussions about the consequences of memory strategies and tricks that are
taught without any conceptual connection.
Table 17 combines the analyses shown in Tables 15 and 16 in order to highlight
the percent of students with each type of understanding. The following Table 18 reveals
that the majority of students solved these problems using a rule-based understanding
approach.
_ _
+
Student Response:
―I used this‖ (Student points to drawing)
―Negative and positive, I went like this‖
(Student covered the negative and positive
signs with two fingers) ―and then you have
negative.‖
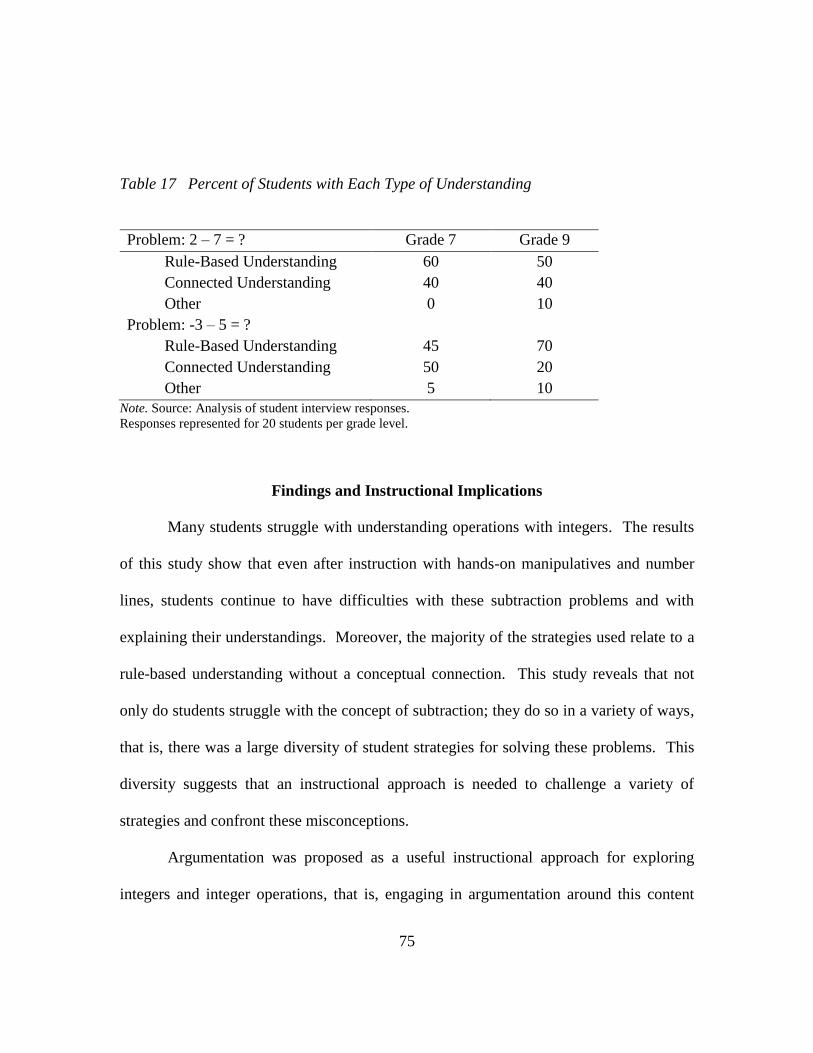
75
Table 17 Percent of Students with Each Type of Understanding
Problem: 2 – 7 = ? Grade 7 Grade 9
Rule-Based Understanding 60 50
Connected Understanding 40 40
Other 0 10
Problem: -3 – 5 = ?
Rule-Based Understanding 45 70
Connected Understanding 50 20
Other 5 10
Note. Source: Analysis of student interview responses.
Responses represented for 20 students per grade level.
Findings and Instructional Implications
Many students struggle with understanding operations with integers. The results
of this study show that even after instruction with hands-on manipulatives and number
lines, students continue to have difficulties with these subtraction problems and with
explaining their understandings. Moreover, the majority of the strategies used relate to a
rule-based understanding without a conceptual connection. This study reveals that not
only do students struggle with the concept of subtraction; they do so in a variety of ways,
that is, there was a large diversity of student strategies for solving these problems. This
diversity suggests that an instructional approach is needed to challenge a variety of
strategies and confront these misconceptions.
Argumentation was proposed as a useful instructional approach for exploring
integers and integer operations, that is, engaging in argumentation around this content

76
could enable students to discuss their diverse strategies—and the strengths and
weaknesses around each of them.

77
CHAPTER FOUR: METHODOLOGY AND STUDY DESIGN
Study Background
The purpose of this project is to contribute to an urban school district by meeting
the need of improving instruction and student achievement related to operations with
positive and negative numbers using research-based instructional practices and
curriculum for a summer three week program, called Jumpstart, for grade 8 students.
The district Secondary Mathematics Curriculum Supervisor in collaboration with this
researcher determined there was a need for this study based on the student performance
results for the past two years of the program showing little improvement in the area of
integer operations and a loss in performance of some of the students in classrooms taught
by first year teachers. Table 18 provides student data from Jumpstart 2009 pre and post
student assessments to demonstrate that positive and negative numbers was an area that
was in need of improvement, which was the basis for determining the need for the work
of this research project:
Table 18 Jumpstart 2009 Pretest and Posttest Results
Topics: Pretest
(n = 206)
Posttest
(n = 242)
Growth
(n = 177)
Positive and Negative
Numbers
43%
49%
+6%
Patterns 40% 50% +10%
Note. Growth is based on data for students who took the pre and post assessment.
Source: Jumpstart program data for 2009.
In general, the students and teachers were positive about the Jumpstart 2009
program and its curriculum and instruction components based on a survey given to

78
teachers and students at the end of the program. However, student achievement was an
area in need of improvement. In reflection, the PD was more focused on ensuring the
teachers understood the activities, and less about how to facilitate the kind of classroom
discourse that leads to improved understanding. Jumpstart is only a 15-day program;
however, there are ways to improve instruction through PD for teachers.
For example, one of the activities for positive and negative numbers involved the
use of a manipulative called "integer pieces," (Math Learning Center, 2009) which
teachers were to use for two days to allow students to explore adding, subtracting,
multiplying and dividing integers with these tools. At the end of the summer program
when the teaching materials were returned, many of the integer piece tool packets were
still in their original state—unopened. It was clear that they had not been punched out
and used by the students. Perhaps this was due to the limited amount of time spent on PD
for the teachers in the use of this tool. Another component of the positive and negative
instruction was the use of a number line card sort activity, which explored addition and
subtraction of integers. This was part of The America‘s Choice Navigator: Positive and
Negative Numbers (2009) curriculum. The method of subtracting integers on a number
line used a vector model of directed distance between two points, as shown in Figure 3.

79
difference
Figure 3 Number line Model for Subtraction as Directed Difference
Many of the teachers reported that this was a challenging representation to
understand. Additional PD in this model for integers could improve teacher and student
understanding of integers with this representation. Prior student performance data,
teacher feedback, and a review of literature on research-based instructional strategies for
integer operations led to the revision of the Integers Unit for the Jumpstart 2010 program
and the development of an improved PD module for the teachers. The following research
questions relate to measuring the extent to which these changes in the program resulted in
statistically significant changes in teachers and students.
Research Questions
The following research questions will be addressed to determine the extent to
which there is a relationship between teacher PCK and student understanding related to
integer operations:
1. What are the general patterns of teacher content and pedagogical knowledge of
integers based on responses to a pre and post assessment?
-4 0 5

80
2. To what extent does PD impact teacher content and pedagogical knowledge as
measured by growth between pre and post assessment?
3. Is there a statistically significant difference between the growth between
students‘ pretest and posttest scores for Jumpstart 2010 compared to the growth
made by students in Jumpstart 2009?
4. Do differences in teacher content and pedagogical knowledge explain more of
the variance in student performance (pretest/posttest) than years of teaching
experience of a teacher?
5. What is the relationship between teacher responses to the Constructivist
Learning Environment Survey (CLES) and the student responses to the CLES?
Study Design
Participant Recruitment
Upon consent of the district Secondary Mathematics Supervisor, the research
department, and the consent of the Jumpstart Principals, the teachers hired for Jumpstart
2010 were approached for permission to participate in the study by gathering the data
from their teacher content and pedagogy assessments to be completed during PD and
from their Constructivist Learning Environment Survey (Taylor, Fraser, & White, 1994).
An effort was made to recruit a focus group of teachers to be asked more open-ended
questions related to their experience with the Jumpstart 2010 integer lessons and PD.
However, there was no interest in participating in a focus group; many of the teachers had
commitments after their school day not making participation possible. Eventually, two
81
teachers agreed to participate, but one became sick and was absent with a substitute when
the interview was scheduled and the other had a family emergency to take care of on the
day of the interview. Attempts to reschedule the interview did not work out in the
teachers‘ schedule. Therefore, focus group teacher interviews were not included in this
study.
Due to a potential conflict of interest since the researcher worked for district at the
time of the study, all data collection and consent forms were distributed and collected by
a local university graduate student. The graduate student provided the researcher with the
data and consent forms at the end of the program when the researcher was no longer
employed by the district. All data were de-identified by the grad student and the district
supervisor prior to analysis by the researcher to protect the privacy and confidentiality of
the teacher and student participants.
The graduate student gave a presentation in each classroom explaining the
purpose of the study and the participating teachers sent home consent letters for their
students to participate by allowing the data from their pretest and posttest to be gathered
by the study researchers, providing information from a short survey of their experience
with the integer unit, and for data to be gathered from any students volunteering to
participate in a focus group. The teachers were asked to emphasize the voluntary nature
of the students' participation and the protection of their privacy by using random student
study identification numbers for their assessment and survey data. Interested students
were asked to sign an assent form once their parent had provided consent for their
participation and prior to completing the Constructivist Learning Environment Survey
82
(Taylor et al., 1994). The assessments were part of the Jumpstart 2010 program, so all
students, regardless of consent, completed the assessments. However, the results were
entered into a spreadsheet and de-identified by the district at the end of the Jumpstart
2010 program for analysis of the results in comparison to the student performance for
Jumpstart 2009, which was also de-identified. Only the final score was provided for
students. For students with consent, the actual integer assessments were collected and
items analyzed individually by integer operation and for strategy use.
Participants
There were 341 students and 22 teachers in the Jumpstart 2010 program7. For
this study, 21 of the 22 teachers attended the PD and consented to participate. One of the
teachers did not attend PD and was replaced by a substitute half way through the
program, so these two teachers did not participate in the study. Of the 341 students, only
102 had both parent consent and student assent complete. The data for these students
were analyzed in more detail based on the information agreed on in the consent forms.
Table 19 provides descriptive statistics for the sample of participating teachers based on
data gathered with permission for this study.
7 The school district provided de-identified student performance results for the pretest and posttest total
score on the America’s Choice Navigator Positive and Negative Numbers Assessment for the students enrolled in the program in 2010 and for the 315 students enrolled in the program in 2009 as a comparison group. Random identification numbers were assigned to the teachers for each year of the program and associated with the students in the data file for analysis.

83
Table 19 Characteristics of Jumpstart 2010 Participating Teachers (N = 21)
Variable Minimum Maximum Mean
Standard
Deviation
Age (years) 21 63 34 11
Gender: Female (%) --- --- 62 50
Teaching experience (years) 1 31 7.2 8.7
Prior experience teaching
Jumpstart (%)
--- --- 38 50
Advanced Degree (%) --- --- 24 44
Mathematics Major (%) --- --- 10 30
Note All characteristics are described as proportions unless otherwise stated (i.e., years).
Materials: Curriculum Revision
For the purpose of this study, the curriculum for the integers unit of the Jumpstart
2010 program was revised based on a review of research literature on improving student
understanding of integer operations (provided in Chapter 2). During the development of
the unit, feedback was provided on improvements that could be made by university
professors, graduate students, teachers in the district (including those who taught in
Jumpstart in the past), and the district Secondary Mathematics Department Supervisor.
The goal was for this revised unit to develop the concept of operations on positive and
negative numbers in a way that connects the concepts to a real world experience and a
number line representation that is comprehensive in its application to all operations of
integers. The number line revised unit for integers incorporated the use of vectors on a
number line that integrated an application called NUMLIN on the TI-73 calculator and
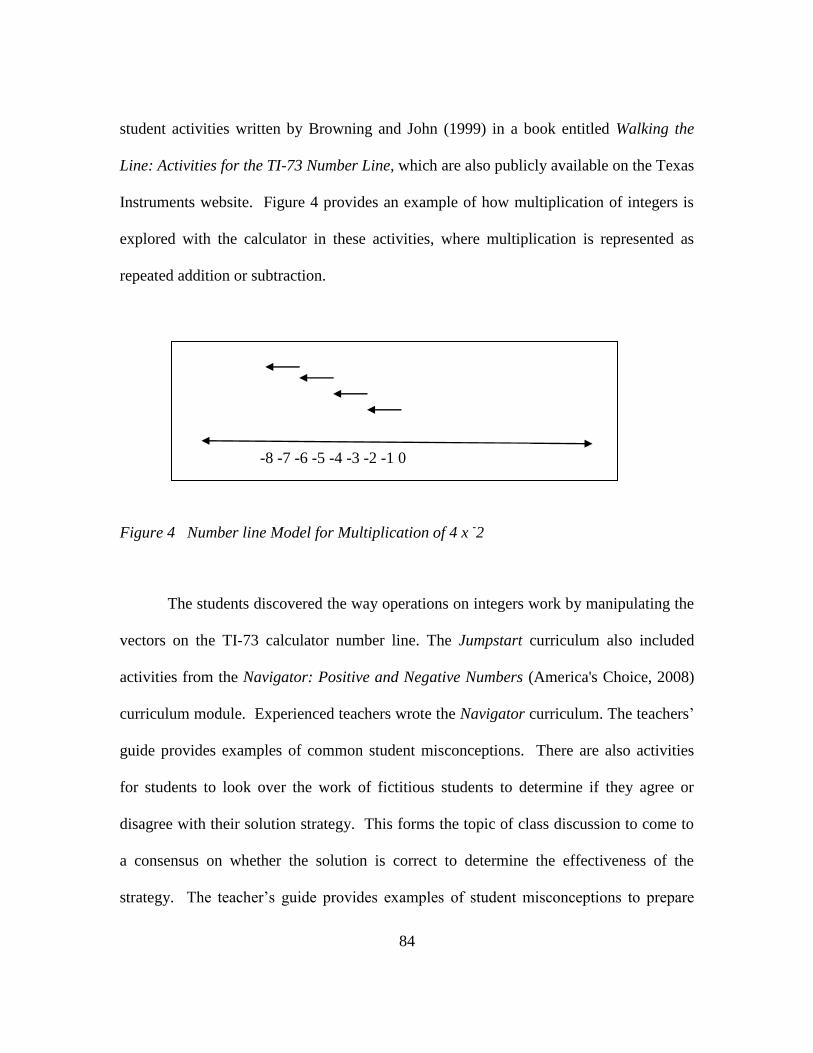
84
student activities written by Browning and John (1999) in a book entitled Walking the
Line: Activities for the TI-73 Number Line, which are also publicly available on the Texas
Instruments website. Figure 4 provides an example of how multiplication of integers is
explored with the calculator in these activities, where multiplication is represented as
repeated addition or subtraction.
Figure 4 Number line Model for Multiplication of 4 x -2
The students discovered the way operations on integers work by manipulating the
vectors on the TI-73 calculator number line. The Jumpstart curriculum also included
activities from the Navigator: Positive and Negative Numbers (America's Choice, 2008)
curriculum module. Experienced teachers wrote the Navigator curriculum. The teachers‘
guide provides examples of common student misconceptions. There are also activities
for students to look over the work of fictitious students to determine if they agree or
disagree with their solution strategy. This forms the topic of class discussion to come to
a consensus on whether the solution is correct to determine the effectiveness of the
strategy. The teacher‘s guide provides examples of student misconceptions to prepare
-8 -7 -6 -5 -4 -3 -2 -1 0

85
teachers for what they might encounter in the classroom. An example of how this
curriculum provides PD for teachers in the area of misconceptions follows:
Sometimes students learn ‗shortcut‘ rules for addition (and subtraction) as
isolated, mathematical procedures, which they over-generalize and, as a
consequence, apply inappropriately. Students need to develop a sound
understanding of addition (and subtraction) as directed distances on the number
line before they can confidently use working rules. (America‘s Choice, 2009,
p. 35)
Another way the curriculum provides teachers with insights into student
misconceptions is through Unit introductions that list the mathematical goals for the next
few lessons and then the misconceptions that are addressed. An example of the
misconceptions provided for teachers prior to students learning to subtract on a number
line follows:
Confusion about how to find a directed difference on the number line: Students
think they can find the direction of the difference by moving along the number
line from the first number in the expression to the second; for example, 8 – (-2) =
-10.Using an incorrect ―counting back‖ method by locating the first number on
the number line and counting back in the wrong direction; for example, (-9) – 3 =
-6.Commuting the subtraction, for example 3 – 5 = 5 – 3 = 2 (America‘s Choice,
2009, p. 29)
The curriculum begins with a pretest followed by an introductory lesson for the
students, where the students read several statements about integers made by a group of
fictitious students. They have to decide which students they agree with and which they
do not. This provides teachers with an opportunity to see which students agree with
common misconceptions so that they can be addressed through this unit. When the
teacher checks the students‘ pretests, there is a scoring guide that teachers can use to note
the misconceptions that students are having. The multiple choice items are pre-coded
with misconceptions, and the open-ended questions have examples provided for teachers

86
of common mistakes. Teachers can see the improvement their students make from the
pretest to the posttest. The assessments provide teachers with information they can use to
tailor the instructional activities and their attention to the needs of the students. These pre
and post assessments were used for the Jumpstart program as well as for data collection
for this study to measure student improvement in understanding of integers and integer
operations. The integer unit overview is provided in Appendix A. Periodic journal
activities were written for students to practice responding to misconceptions. Appendix B
provides the sample misconceptions prompts that were used.
Teacher Professional Development
Based on the findings of the 1993 National Survey of Science and Mathematics
Education (Weiss, 1997) that low-ability students were provided with fewer opportunities
to engage in inquiry activities or to write about their reasoning while solving math
problems, the PD and curriculum unit for this study was designed to ensure that the low-
performing grade 8 students enrolled in Jumpstart 2010 would be afforded these kinds of
opportunities and that their teachers would be prepared to facilitate such experiences.
The PD design was informed by the literature review conduted by Loucks-
Horseley, et al. (2010) which found that effective PD programs focus on improving
learning outcomes for all students, account for and advance teacher PCK, are
implemented using the same pedagogy expected of teachers, involve teacher leaders
within the school/district to buid capacity, and are aligned with the school/district
standards, assessment, and curriculum.

87
Teachers participated in six hours of PD that focused on improving PCK around
integer operations and the use of argumentation to facilitate student conversations about
mathematics. A complete outline of the PD is provided in Appendix C. The morning
started with registration and a light breakfast for the teachers while the graduate student
described the purpose of the study and the data to be collected. At that time, consent
forms were passed out and the pretest for teacher PCK was given to each consenting
teacher.
There were 18 teachers present at the start of the PD session who consented and
took the pretest. Three other teachers arrived an hour into the PD and were not given the
assessment. However, all 21 teachers took the post assessment given the last week of the
Jumpstart 2010 program. There was one additional teacher who was hired late and
missed the PD. This teacher was replaced by a substitute after the first week of the
program. This teacher was not included in the study. The teacher PCK assessment is
provided in Appendix D. Once they had completed the assessment, the graduate student
asked if they would be willing to complete a demographic survey. All consenting
teachers completed a demographic survey, which is provided in Appendix E.
The design of this study was also informed by the case study of Riverside Middle
School conducted by Mundry and Loucks-Horsley (1999) which documented that
implementation of a reform mathematics curriculum required PD that was a balance
between the practical issues that concern teachers such as being prepared to implement
curriculum activities and the new instructional practices and beliefs that were part of the

88
reform curriculum. Therefore, the student activities were used as the basis for developing
the PCK of the teachers.
For the first part of the PD, the researcher asked a series of questions to access
teachers‘ prior knowledge of teaching about integers, common student misconceptions,
and any prior experience with students using argumentation about mathematics. A brief
overview was provided to the teachers about the Jumpstart program and expectations, the
performance data from Jumpstart 2009¸ and the changes made to improve Jumpstart
2010. Then the teachers all read a chapter from Children’s Mathematics 4-15: Learning
from Errors and Misconceptions by Ryan and Williams (2007) entitled ―Children‘s
Mathematical Discussions.‖ This first section provided a transcript of a class discussion
involving a problem where students were to compare two decimal numbers, one that was
in the tenths and one that was in the hundredths. After sharing a few thoughts from the
reading, the teachers were divided into two groups to read the next two sections. The
first section transcript showed the teacher facilitating the discussion by asking questions,
starting the discussion with a number line representation and asking a more resistant
student to come up and put the decimal numbers on the number line which started a
productive discussion with students making claims and justifying their thinking. The
teacher allowed students time to think and did not move quickly to a resolution. She also
pressed students to show their thinking. The transcript modeled a cycle of thinking that
eventually led to students coming up with the same solution. During the discussion of the
first reading selection, the teachers discussed these key findings from reading of the
transcript.

89
The second reading selection started with a teacher sharing a common concern
that students would learn misconceptions by being exposed to other students‘
misconceptions. During this part of the discussions, teachers shared different experiences
and strategies for handling this concern. One theme emphasized by the reading is the kind
of classroom environment needed for this kind of safe argumentation which is accepting
of wrong answers, and where misconceptions are an opportunity to learn together. A
collaborative classroom environment where it is common practice to share ones thinking
and question the thinking of others should reduce the chance of students learning
misconceptions from other students.
The design of the PD for this study was also based on the guidance provided by
Thompson and Zeuli (1999) for creating a transformative learning experience for
teachers. To create cognitive dissonance, several problem were provided for teachers to
engage in reasoning and sharing of their thinking with others that would bring up
questions and uncertainty that would need to be resolved through inquiry and discussion,
and to provide sufficient time for that process to occur. The next part of the PD allowed
teachers to work in groups on an integer operation problem. They could choose between
representing it with a story, a rule, a number line model, a chip or tile model, or other
representation. Then a discussion was held where groups had to connect their model with
another group‘s model and argue as to what made it more effective or better in solving
problems all the time. An engaging discussion broke out when two groups were arguing
that the number line was fine for addition, but it was not a good model for subtraction.

90
The next two parts of the PD covered addition and subtraction of integers on a
number line using the America‘s Choice Navigator (2009) number line models. The
teachers understood how to do addition on a number line, but when asked to show
subtraction, there was heated discussion in many of the groups. One group even sent a
member to go to each of the groups to see what they thought was the best way to
represent the given problem. The discussion that followed lasted almost an hour as
teachers struggled with the meaning of representing subtraction on a number line,
whether their way would work all the time or just sometimes, the challenges they felt
students would have with the model. However, in the end they seemed to agree that it
might really make sense to students. Before sharing out as a whole group, the
expectations were set for the discussion modeling what should happen in their own
classrooms for a safe place for argumentation. Since measuring what occurred during PD
was not part of this research study, and teacher consent was not obtained to share their
responses during the PD, no more information can be provided at this time. After lunch,
the teachers explored the calculator activities with TI-73 NumLn application and
continued to argue about the different representations for subtraction and multiplication
of integers. Then in the final part of the PD where they explored some of the small
group-center activities their students would be doing and discussed which parts or
questions of these activities would make great problems to form the basis of
argumentation in their classroom.
Since prior research on PD has shown that ongoing PD is better than one time PD,
it was arranged for the teachers to have a weekly 1-hour PD session with their mentor to

91
discuss how things were going, to talk about issues and challenges around getting kids to
talk about math and for teachers to share what was working well. As experienced
teachers, using argumentation already in their classrooms, the mentors provided
suggestions from their own experience to get students engaged in discussions, to
encourage resistant speakers, and to set clear expectations for classroom behavior to
promote a safe environment for this kind of discussion.
Teachers were invited to participate in a Ning, a social network tool for
collaboration, where they could access pictures of student work taken in different
Jumpstart classrooms, videos from the PD, recorded overviews of each day‘s activities,
blog about their experiences, and connect with other teachers. This was a new experience
for many of the teachers. For Jumpstart 2009, PbWorks, an online collaborative
workspace for document sharing, was created, but only a few teachers ended up using it.
It was not clear how useful this tool was for the teachers. Jing, a screen casting software,
was used to record audio and video descriptions of the curriculum for the day providing
brief information about student activities shown on the screen. These videos were limited
to 5 minutes for each day. The Jing video clips were available for teachers to access on
the Ning and the links to the Jing daily overview videos were e-mailed to the teacher
weekly. This research study did not include plans to gather data on usage of this
technology. However, the district will gather data from feedback from teachers prior to
Jumpstart 2011 to determine if either of these technology tools was beneficial to the
teachers. There continues to be a need to think about how to provide ongoing PD so that

92
teachers will engage more regularly in learning and sharing through an online
community.
During the last weekly 1-hour PD sessions led by the mentors, the teacher posttest
PCK assessment was given to participating teachers. The student pre and post-
assessments were collected on the last day of the program by the UT grad student and
delivered to the researcher for analysis once the data were de-identified.
Data Collection Measures
Student achievement. To measure student achievement, a pretest was given on the
first day of the Jumpstart program to the students. It is part of the America‘s Choice
Navigator (2009) curriculum entitled Positive and Negative Numbers. A posttest from
the curriculum was given on the 14th day of the program to allow for make-up tests on
the last day of the program. These same pre and posttests have been used with this
Jumpstart program for the past two years. There is no information from the company on
reliability and validity of the measures. They are newly developed. Their older navigator
curriculum modules have been used in research and have been validated. However, that
information is not available for this module. The student results are used to compare
performance for students in Jumpstart 2009 to students in Jumpstart 2010 using the total
percentage correct out of 25 items on the pre and post-assessment. Appendix F provides
a sample of the assessment given to the students. For students with consent to participate
in the study, their assessments were analyzed in more detail for accuracy on each set of
problems based on operation type and for strategy use demonstrated by how students

93
wrote their solution to the problems. Chapter 5 presents the findings from this more
detailed review of the assessments of the participating students.
Teacher demographics. Teachers who have agreed to participate in the research
study completed a brief demographic survey provided in Appendix E. Currently, only
the number of years of teaching experience is used in the analysis due to the negative
association of this variable with student performance at the end of Jumpstart 2009. The
rest of the demographics are provided descriptively to inform the reader of the teacher
sample characteristics. Due to the small sample size, it was deemed not appropriate to use
any other demographics in the analysis.
Teacher PCK. To measure the impact of the PD on teacher PCK, an assessment
was designed to use at the beginning of the PD and to administer towards the end of the
15-day Jumpstart program at the last meeting with the teachers. There were three sources
based on a literature review used to develop the assessment: results from the student pilot
study described in chapter 3, a pre-service teacher‘s guide entitled Fostering Children‘s
Mathematical Power: An Investigative Approach to K-8 Mathematics Instruction
(Baroody & Coslick, 1998), and research by Turnuklu and Yesildere (2007) with pre-
service teachers in Turkey about their mathematical understanding of integer operations
Due to the results of the integer pilot study, the researcher wanted to include a
question about real world and non-math domain applications of integers. The students
amazed the researcher by the extensive diverse list of applications they were able to
provide, so she wanted to see if the Jumpstart 2010 teachers also had knowledge of the
extensive applications of integers. Subtraction and multiplication of integers were two

94
areas where students in the pilot study had misconceptions. Turnuklu and Yesildere
(2007) found similar misconceptions in the pre-service teachers in their study. There
were pre-service teachers with misconceptions about addition of integers (-3 +5) and
subtraction of integers (3 –5). Barrody and Coslick (1998) used the following two
questions for pre-service teachers to help them think about how to answer student
questions:
1. A student teacher reads the expression -6 + (
+7) as ―minus six and plus
seven‖ and 6 – (+7) as ―six minus plus seven.‖ Is this good educational
practice? Why or why not?
2. What is the answer to 5 – (-8) = ? How would you explain to a student the
answer you got? What is the answer to -5 x (-8) = ? Why does it have the
sign it does? (Barrody and Coslick, 1998, p. 8.22)
These three sources of problems allowed the researcher to create an assessment with
eight questions (see Appendix D) to give to the teachers before PD and then near the end
of the program to assess the change in their content and pedagogical knowledge.
In order to determine how to score the teacher PCK assessment, the researcher
sent out an e-mail and the original version of the assessment to 30 science and
mathematics education graduate students and mathematics teachers as representatives of
the range of responses the researcher might get back from experts to novices in math
content and from experts to novices in teaching expertise. Thirteen people volunteered to
complete the survey and provide the researcher with their years of experience and the
time it took them to complete the survey.
Seven of the volunteers were graduate students and the other six were teachers
she had previously taught with in district. Five of the graduate students had no prior
teaching experience. The other eight volunteers had teaching experience that ranged

95
from 1 year to 14 years. These 13 volunteers reported taking 20 to 30 minutes to
complete the 9-item survey (one question was omitted following this pilot so only eight
items remained for the assessment used in this study). Based on patterns in their
responses, the researcher created a rubric of descriptions of understanding to rate a
participant‘s response on each item as a 0, 1, or 2. The scoring rubric is provided in
Appendix G. Using this scoring rubric, the volunteers‘ responses were between 44% and
89%, which left room for study participants to exceed their scores or earn scores beneath
their scores.
Constructivist Learning Environment Survey (CLES). This short 10-minute
survey developed by Taylor and Fraser (1994) at Curtin University of Technology, was
intended specifically for science classrooms, and includes five scales: "Learning about
the World (Personal Relevance)," "Learning about Science (Uncertainty)," "Learning to
Speak Out (Critical Voice)," "Learning to Learn (Shared Control)," and "Learning to
Communicate (Student Negotiation)." The survey consists of 25 questions with five
possible answers to each question: almost never, seldom, sometimes, often, almost
always. Even though the survey was designed for science classrooms, the questions and
responses are applicable to mathematics. The CLES survey was used in 1996 by the
Dallas Public Schools as part of a systemic reform in mathematics and science. It was
given to 1,600 students in 120 high school classrooms. All the values of reliability
exceeded 0.80 except for the value for uncertainty (Dryden & Fraser, 1996). It was also
given to 494 thirteen-year old students in the Australian component of the Third
International Mathematics and Science Study (TIMSS) in 1994 resulting in reliability of

96
above 0.80 in Personal Relevance, Critical Voice, Shared Control, and Student
Negotiation, with Uncertainty still being lower at 0.72 using Cronbach‘s alpha. The
factor analysis conducted by both of these studies confirmed the factor loading for the six
items in each of the five categories (Taylor, Fraser,& Fisher, 1997). Therefore the CLES
was used to measure each of these factors of a Constructivist Learning Environment for
students and teachers in the Jumpstart program. A comparison of teacher responses to
student responses was made. An analysis was conducted of any mediating role the level
of constructivist learning environment may play in student growth from pretest to
posttest. The results of these analyses are provided in chapter 5.
Student focus groups. The graduate student recorded a discussion with students
about the curriculum activities during a focus group session. A series of prompts were
provided to stimulate the conversation. The prompts are provided in Appendix H. This
information is not part of the main analysis for the study. However, it provides
background on the thinking of some of the students in the program.
Data Analysis
Question 1: What are the general patterns of teacher content and pedagogical
knowledge of integers based on responses to a pre and post assessment? For this
analysis, descriptive statistics will be used to describe the general patterns of teacher PCK
based on coded responses to the pre and post-assessment items using means for each
rating for each item and the means and standard deviations of the overall total PCK
scores for the pretest and the posttest.

97
Question 2: To what extent does professional development impact teacher content
and pedagogical knowledge as measured by growth between pre and post assessment?
This question is answered with a paired samples t-test comparing the teachers who
completed both the pretest and the posttest to determine statistically significant
differences. This will help explain what areas of PCK were effected the most by the PD
and implementation of the curriculum in the classroom.
Question 3: Is there a statistically significant difference between students’ pre
and post-test score for Jumpstart 2010 compared to the growth made by students in
Jumpstart 2009? Since the school district refused to allow an experimental design with
an intervention group and a control group, the third research question is answered by
comparing the performance of Jumpstart 2010 students to the performance of the
comparison group of students who participated in Jumpstart 2009 using an independent
samples t-test while adjusting for clustering of students within classrooms using
Hierarchical Linear Modeling to determine the adjusted standard error, t-statistic, and
p-value. The HLM model is provided as follows:
Level-1 Model
Yij = β0 + rij
Level-2 Model
β0 = 00 +10 (YEAR) + u0j
Yij was used to represent each outcome measure (pretest and posttest) and the growth of
students between pre- and posttest. This model was run three times, once using the
98
outcome variable for pretest, once using the outcome variable for posttest, and finally
using the outcome variable of growth. A two level model was used to account for the
nesting of students ( i )within classes ( j ). Year represented allowing the model to
account for assignment of students to Year 2009 or Year 2010. The regression
coefficients β0j in the level one equation are class-specific, created from data at the
student level, and differ across classrooms. The regression coefficient β0j is treated as
dependent variables at the class level (level two). The level-2 random effects, u0j and u1j,
measured random variation in class posttest scores.
Question 4: Do differences in teacher content and pedagogical knowledge explain
more of the variance in student performance (pretest/posttest) than years of teaching
experience of a teacher? To answer these questions, Hierarchical Linear Modeling
(HLM) was used to compare performance of students in Jumpstart 2009 to students in
Jumpstart 2010 on an integer assessment and to determine the relationship between
properties of the classroom (teacher content and pedagogical knowledge, teacher
experience, and teacher beliefs) and properties of the students (changes in performance
on assessment of understanding of integer operations and beliefs about learning).
Because of the nested structure of the data, with students nested in classrooms, a
hierarchical linear model is a statistical method the researcher used to analyze this
relationship. Due to the presence of more than one random variable and a cross-level
interaction between the variables at the classroom level and the variables at the student
level, a multilevel analysis is recommended by the research community (Raudenbush &
Bryk, 2002).

99
A two-level HLM model was used with student math scores as the level one
outcome variable (a within-class model) and individual class variables, such as mean
math score, as the level two outcome variables (a between-class model). Specifically,
each student, i, in classroom j, where, i , j Ɛ Z+ can be represented by the following
equation yij = ß0j + ß1j (xij) + rij. This equation states that the posttest score of student i in
class j can be decomposed into the average posttest score in class j (ß0j), an adjustment
based on the product of the pretest score (xij) and the class pre/posttest performance slope
(ß1j ) and a randomly varying error term (rij )~ N(0,ơ2). Group mean-centering will be
used first for the level one pretest score. Then if the slope variance is not significant,
grand mean centering will be used with the slope (ß1j ) as a fixed effect at level two with
the residual term at zero.
At the second level, each classroom will have a mean posttest score (ß0j) and a
pre/posttest performance slope (ß1j ) as on outcome. The analysis began with the random
coefficient model. Then classroom-level predictors were added into the level two model
to determine whether they explain the variance in mean class scores and pre/posttest
performance slopes: teacher content and pedagogical knowledge of integer variables
based on the results of the pre and posttest and the teacher demographic of years of
teaching experience.
Because the relationships between variables measuring student learning are
at least partially dependent on the larger context (the classroom) in which learning

100
occurs, the expectation is that teacher content and pedagogical knowledge8 can partially
explain the variance across classes, although years of experience of a teacher might also
explain the variance across classes. An investigation was conducted to determine how
each of these teacher variables explain the variance across classes and whether content
and pedagogical knowledge would outweigh experience in explaining the variance across
classes. What follows are the unconditional model and the potential conditional model.
Chapter 5 presents the progression of changes in the models based on the data collected
and the final outcomes.
Unconditional Model
Level-1 Model
Yij = β0 + β1*(Student Pretest) + rij
Level-2 Model
β0 = 00 + u0j
β1 = 10 +u1j
If the slope variance is found to be not significant then the unconditional model with
slope as fixed effect at level 2 will be used as follows:
8 The CLES teacher survey results were not used as a covariate in the HLM model for two reasons. First,
the theory of change for this study focuses on changes in teacher PCK following PD and the associated
change in student understanding of integer operations; therefore, teacher PCK is the focus of the HLM
analysis. Second, CLES was used to measure if students reported using classroom practices similar to what
they experienced in PD (use of mathematical conversations and argumentation); however, the CLES
represents teacher self reports not actual evidence of use of these practices. Further analysis of the
relationship between teacher CLES results and student performance will be considered for a future study.
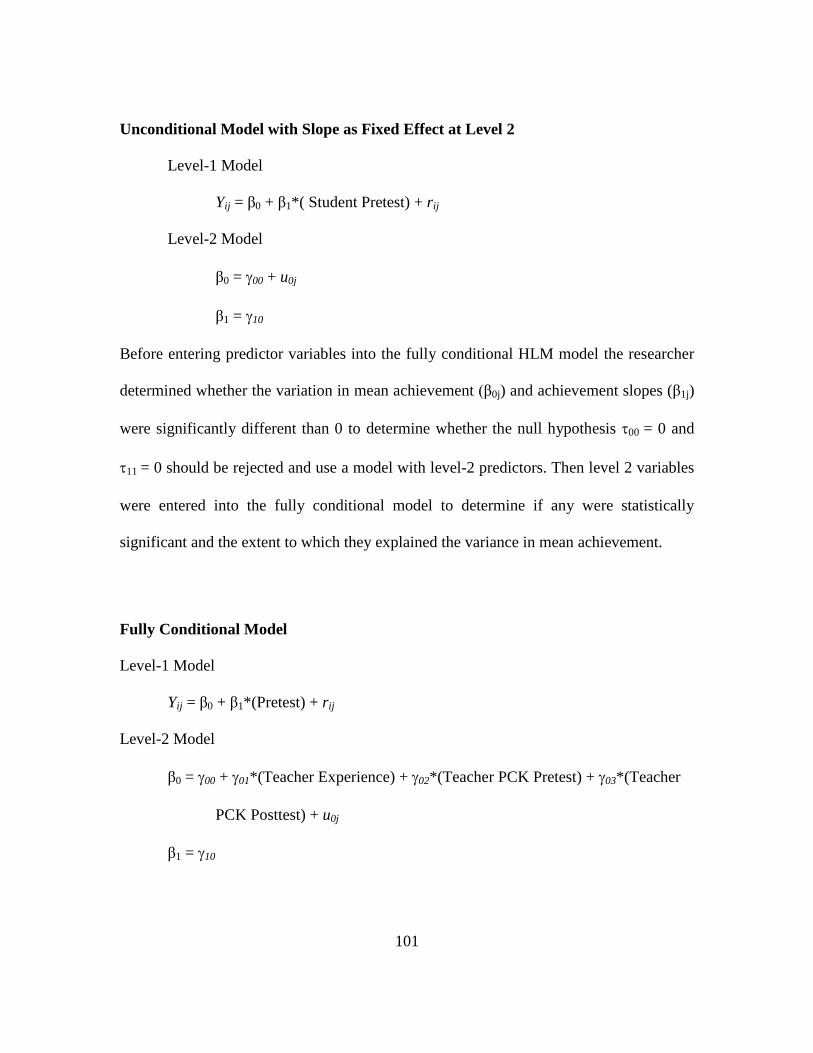
101
Unconditional Model with Slope as Fixed Effect at Level 2
Level-1 Model
Yij = β0 + β1*( Student Pretest) + rij
Level-2 Model
β0 = 00 + u0j
β1 = 10
Before entering predictor variables into the fully conditional HLM model the researcher
determined whether the variation in mean achievement (β0j) and achievement slopes (β1j)
were significantly different than 0 to determine whether the null hypothesis 00 = 0 and
11 = 0 should be rejected and use a model with level-2 predictors. Then level 2 variables
were entered into the fully conditional model to determine if any were statistically
significant and the extent to which they explained the variance in mean achievement.
Fully Conditional Model
Level-1 Model
Yij = β0 + β1*(Pretest) + rij
Level-2 Model
β0 = 00 + 01*(Teacher Experience) + 02*(Teacher PCK Pretest) + 03*(Teacher
PCK Posttest) + u0j
β1 = 10

102
All predictor variables were grand mean centered, because the slope variance was found
to not be significant. The preceding conditional model is written with slope as a fixed
effect which was conducted because the slope variance in the unconditional model was
found to not be significant.
Question 5: What is the relationship between teachers’ responses to the
Constructivist Learning Environment Survey (CLES) and the student responses to the
CLES? A comparison of the student and teacher response to the CLES subscales and
composite score will be conducted using an analysis that compares the teacher response
to the box plot of the student responses for their class to determine if teachers experience
higher, lower, or similar levels as their students for each subscale and for the total CLES
score. The results of this analysis and the results for the other four analyses are presented
in Chapter Five.

103
CHAPTER FIVE: FINDINGS
In this chapter, the researcher presents the results of this study related to each
research question as well as additional data collected from student focus groups to
provide additional background to the study. The first set of analyses provides a
description of the participating teachers based on demographics and the assessment of
PCK. The second set of analyses describes differences between students‘ performance
on the integer assessment for Jumpstart 2010 compared to the students‘ performance on
this same assessment during Jumpstart 2009. The third set of analyses looks at the
relationship between teacher characteristics and student performance on the integer
assessment to see if any of the variance in student performance can be explained by
teacher characteristics taking into consideration the nesting of students within
classrooms. The fourth set of analyses looks at assessment and survey data for a
subsample of students with parent consent and student assent to better understand
changes in their understanding during the Jumpstart program. The final analysis provides
some background information based on focus group interviews with students that
occurred towards the end of the Jumpstart program.
Analysis of Differences Between Teachers
Research Question 1
What are the general patterns of teacher content and pedagogical knowledge of
integers based on responses to a pre and post assessment?

104
The pretests and posttests of teacher PCK were scored using the rubric provided
in Appendix G. There were three teachers who arrived late to the PD and were unable to
take the pretest. All teachers completed the posttest. One of the teachers did not attend
the PD and was replaced by a substitute. Since neither of them consented to participate
in the study, their data are not included in this analysis. The performance data of their
students are used only for analyses that do not include teacher level variables.
As described in chapter 3, the teacher PCK Assessment was designed to measure
each teacher‘s understanding of the real world and non-mathematical domain applications
of integers, of the conceptual meaning of integer operations beyond memorized rules for
the operations, and of common student misconceptions related to integers and integer
operations. Table 20 provides a summary of the teachers‘ performance on the assessment
prior to the PD and at the end of the Jumpstart program.
Table 20 Pedagogical Content Knowledge Assessment Performance (Percent of 100)
Variable Minimum Maximum Mean
Standard
Deviation
Pretest (n = 18) 7 93 46 21
Posttest (n = 21) 29 93 62 20
Note. Source: Researcher‘s analysis of Teacher Assessments of PCK.

105
The results of the teacher pretest and posttest performance are summarized in
Table 21 by item to describe the weaknesses in understanding at baseline and the
weaknesses that still persist at posttest. At pretest, a majority of teachers (77%) could not
provide a rationale for why multiplication of two negative numbers results in a positive
number. At the posttest this number was reduced to 48% of teachers, which is still a
large percent of teachers who have more of a rule-based understanding of multiplication
of integers. At pretest, a majority of teachers (61%) believed that 3 –5 was the same as
3+ (-5). At the posttest only 24% of teachers still believed they were the same. Even
though both expressions result in the same answer when simplified, there is different
meaning in the operation of addition and subtraction. These two problems exemplify two
common student misconceptions that resulted in errors in response during the pilot study.
This improvement in teacher understanding of these concepts and student misconception
should be related to student understanding.
There were also improvements in teachers‘ ability to identify both real world and
domain applications of integers, from 17% at pretest to 38% at posttest. This was not a
focus of the PD; however, the curriculum exposed teachers and students to real world and
domain applications which may have contributed to this change in understanding. As to
be expected more teachers reported having experience with argumentation in their class
following PD and implementation of the curriculum in their classrooms. However, 24%
admitted to not experiencing argumentation in their class. Within their written feedback
these five teachers explained that their students were resistant to talking about
mathematics in class or that students were not willing to participate in argumentation.

106
Table 21 Item Analysis for Pedagogical Content Knowledge Assessments
Percent of Teachers
Question Rating
Pre-test Score Distribution
(Points per Question)
(n = 18 teachers)
Posttest Score Distribution
(Points per Question)
(n = 21 teachers)
0 1 2 0 1 2
How would you explain the
solution of 5 – (-8)?
50 33 17 43 10 47
Given -5 x (-8). Why does the
answer have the sign it does?
72 17 11 48 10 42
(-6) + (+7) and 6 – (+7) read
incorrectly
22 28 50 0 24 76
4 – 7 = 3, what is the
misconception and what is a
teaching strategy
6 44 50 5 33 62
Is 3 –5 the same as 3 + (-5)?
Explain
61 28 11 24 62 14
Describe prior experience with
argumentation in class
33 28 39 24 29 48
Real world and domain
applications of integers
11 72 17 14 48 38
Total Score (14 possible points)
Mean: 46
Standard Deviation: 21
Mean: 62
Standard Deviation: 20
Note. Source: Researcher‘s analysis of Teacher Assessments of PCK.
Research Question 2
To what extent does professional development impact teacher content and
pedagogical knowledge as measured by growth between pre and post assessment?
When the pretest and posttest responses of the 18 teachers were compared based
on the overall score9, the growth made from pretest to posttest in teachers‘ PCK was
statistically significant (t = 3.29, p < .01). The question that received the most
statistically significant change was when teachers were shown a statement made by a
student teacher who misread the operations and signs in two problems. Teachers on the
9 A paired samples t-test was used as a test of statistical significance using SPSS statistical software and
confirmed by a parallel analysis with SAS software.

107
posttest were more aware of the importance of differentiating between an operation and a
sign when speaking to students about expressions with positive and negative numbers.
This significant change for Research Question 3 is shown in Table 22.
Table 22 Comparison of Pretest and Posttest Results by Question
Question
(N = 18 teachers)
Pretest
Mean
(SD)
Posttest
Mean
(SD)
Difference
(SE)
t p-value
Q1. 5 – (-8) .67
(.77)
1.11
(.96)
.44
(.32)
1.41 .18
Q2. -5 x (-8) .39
(.70)
1.00
(.97)
.61
(.26)
2.37 .03*
Q3. (-6) + (+7), 6 – (+7) 1.28
(.83)
1.83
(.38)
.56
(.17)
3.34 p < .01
Q4. 4 – 7 = 3 1.44
(.62)
1.61
(.61)
.17
(.12)
1.37 .19
Q5. 3 – 5, 3 + (-5) .50
(.71)
.89
(.68)
.39
(.20)
1.94 .07
Q6. Prior Argumentation 1.06
(.87)
1.22
(.88)
.17
(.20)
.83 .42
Q7. Applications 1.06
(.54)
1.33
(.59)
.28
(.11)
2.55 .02*
Note. (a) These values represent the average raw score out of 2 points earned by teachers on the pretest and
the posttest for each question. Teachers could earn 0, 1, or 2 points per question. The total questions were
worth 14 points. (b) *Statistically significant difference at the p < .05 level. (c) See Table 25 for question
detail.
There was also statistically significant growth (t =2.37, p <.05) in teachers‘ ability
to explain the sign of the answer to the problem -5 x (-8). Teachers also made
statistically significant growth (t =2.55, p < .05) in knowing real world and domain
examples of applications for integers. What is not clear is whether the curriculum and
PD introduced new applications to them, if they learned additional applications on their
own, or if they just remembered more at the posttest. Due to the significance of this
growth, the teacher PCK score was used in the HLM model to determine whether

108
differences in teacher PCK accounts for differences in student performance from pre to
posttest.
There were also many real world and domain applications of integers that teachers
listed on their PCK assessments. These responses are provided in Appendix I to show the
diversity of responses and the wide range of applications in mathematics, other domains,
and in everyday life. These examples are a great resource for problem creation for
students to think about.
Comparison of Student Achievement (Jumpstart 2009 vs. 2010)
Research Question 3
Is there a statistically significant difference between the growth between students’
pretest and posttest score for Jumpstart 2010 compared to the growth made by students
in Jumpstart 2009?
To compare student performance between the two years of the Jumpstart
program, a histogram of student performance from pretest to posttest for each year was
used to look at patterns of change between the two years. For Jumpstart 2009, some of
the students lost ground over the 3-week program. In 2010, the Jumpstart students started
on average about 10% lower than the Jumpstart 2009 students. However, they made
almost twice as much growth and very few students lost ground. Histograms are provided
to show differences in change in performance for Jumpstart 2009 (See Figure 5 an 6) and
for Jumpstart 2010 (See Figures 7 and 8).

109
Figure 5 Jumpstart 2009 pretest student performance.
Figure 6 Jumpstart 2009 posttest student performance.

110
Figure 7 Jumpstart 2010 pretest student performance.
Figure 8 Jumpstart 2010 posttest student performance.

111
An independent samples t-test was calculated to determine if there was a
statistically significant difference between the growth made in student performance for
Jumpstart 2010 as compared to Jumpstart 2009. Then Hierarchical Linear Modeling was
used to account for the nesting of students within classrooms to adjust the standard error
and resulting t-statistic and p-values. The HLM model is provided as follows:
Level-1 Model
Yij = β0 + β1*(YEAR) + rij
Level-2 Model
β0 = 00 + u0j
β1 = 10 +u1j
Yij was used to represent each outcome measure (pretest and posttest) and the growth of
students between pretest and posttest. A two-level model was used to account for the
nesting of students ( i )within classes ( j ). Year represented allowing the model to
account for assignment of students to Year 2009 or Year 2010. The regression
coefficients β0j and β1j in the level one equation are class-specific, created from data at the
student level, and differ across classrooms. The regression coefficients β0j and β1j are
treated as dependent variables at the class level (level two). The level-two random
effects, u0j and u1j, measured random variation in class posttest scores.
Table 23 provides the outcome of the comparison. The student performance at
pretesting for 2010 was lower (but statistically significant) than students in 2009 by 7%
lower on average across the sample. Student performance at posttesting for 2010 was
slightly higher than students in 2009, but not statistically significant. The student growth

112
made from pretest to posttest for Jumpstart 2010 was statistically significantly higher
than the growth made in 2009 (t = 2.19, p = .03). Therefore, there was statistically
significant difference between the growth made this year during Jumpstart 2010 as
compared to Jumpstart 2009.
Table 23 Comparison of the Performance of Students in Jumpstart 2009 vs. 2010
Percent
Correct
out of 100
2010 Mean
(n=178)
(SD)
2009 Mean
(n = 177)
(SD)
Difference
(SE)
t p-value
Pre-test 37
(17)
43
(19)
-7
(4)
-1.77
.08
Posttest 51
(15)
49
(21)
2
(4)
.41
.68
Growth 14
(17)
06
(19)
8
(3)
2.20
.03*
Note: Source: De-identified performance data for students participating in Jumpstart 2009 and 2010
analyzed using an independent samples t-test to determine the means and standard deviations, and then
analyzed with HLM to correct t-statistics, standard error and p-values for nesting within classrooms.
*Statistically significant at the p < .05 level.
Hierarchical Linear Model Analysis
Research Question 4:
Do differences in teacher content and pedagogical knowledge explain more of the
variance in student performance (pre/post test) than years of teaching experience of the
teacher?
Hierarchical linear modeling was conducted to determine whether or not there
was a relationship between teacher PCK and student performance on the posttest.

113
Specifically, a two-level model was tested; the first level consisted of student variables
while the second level consisted of teacher or classroom variables.
Steps in Model Testing
The first step in any HLM procedure involves testing the fully unconditional
model. This model does not include any predictors at the first and second levels. Further,
only the level-one intercept (i.e., the mean of the dependent variable) is modeled at the
second level. The objective of testing the fully unconditional model is to determine
whether there is significant variance in the dependent variable (i.e., student posttest
performance). If there is significant variance in the dependent variable, then the second
step is taken.
The second step involves testing the unconditional model with a first-level
predictor. In addition, both the level-one intercept and slope are modeled at the second
level. The objective of testing this unconditional model is to determine whether the
intercept and the slope vary significantly between students. If either or both the intercept
and the slope vary significantly between students, then model testing proceeds further.
In the third step, the conditional model is tested. In this step, second-level
predictors are added into the model so that the variance in the intercept and/or slope can
be explained. The second-level variables predicted to account for variance in the intercept
and slope of posttest student performance were teaching experience (in years), teacher
pretest PCK score, and teacher posttest PCK score.
Results for the Unconditional Model Tests
The fully unconditional model was as follows:

114
Level-1 Model
Yij = β0 + rij
Level-2 Model
β0 = 00 + u0j
There was significant variance in posttest score across classes (χ2 (17) = 28.33, p = .000).
Therefore, an unconditional model with student pretest score (group mean centered) was
included as a level-one predictor. In addition, both the level-one intercept and slope were
modeled at the second level. The unconditional model was as follows:
Level-1 Model
Yij = β0 + β1*(Student Pretest) + rij
Level-2 Model
β0 = 00 + u0j
β1 = 10 +u1j
Although there was significant variance in the intercept (χ2 (16) = 52.40, p =
.000), the slope variance was not significant (χ2 (16) = 25.27, p = .065). Thus, the level-
one slope was fixed in succeeding analyses and the student pretest score was grand mean
centered10
. Since there was still significant variance in posttest student scores even after
accounting for nesting in classrooms and controlling for student pretest scores, the
predictors of interest were added into the second-level model to determine whether these
predictors could significantly explain the variance in posttest student scores.
10
For completeness, group pretest was used as a predictor for the level one intercept to test for contextual
effects associated with class pretest. However, it was not significant, so it was removed from the model.

115
Results for the Conditional Model
The conditional model was as follows:
Level-1 Model
Yij = β0 + β1*(Pretest) + rij
Level-2 Model
β0 = 00 + 01*(Teacher Experience) + 02*(Teacher PCK Pretest) +
03*(Teacher PCK Posttest) + u0j
β1 = 10
The findings for this conditional model are summarized in Table 24. The findings
reveal that, after controlling for prior student and teacher knowledge as well as teacher
experience, teacher‘s PCK (PCK) significantly predicted student posttest performance (t
(14) = 2.37, p = .033). Thus, as teacher‘s post-intervention PCK increased by one point,
there was a 0.22 increase in student math posttest performance. This positive relationship
between teacher posttest PCK and posttest student math achievement suggests that when
teachers have the necessary PCK of integers and integer operations, students‘ overall
learning of integer concepts and procedures for solving integer operation problems
improve.
When comparing the conditional model to the unconditional model, the addition
of the teacher experience, teacher pretest knowledge and teacher posttest knowledge
covariates explained 27% of the variance (i.e., 33.80-24.58/33.80) after adjusting for
differences in student pretest. Sensitivity analyses were conducted to determine the
robustness of the model if one or more of the predictors at level two were not included in

116
the model. Teacher posttest PCK remained the only significant predictor. This fully
conditional model is reported because it is a more robust estimate of the relationship
between teacher PCK and student post-test scores.
Table 24 Two-level Model Estimates of the Impact of Teacher Pedagogical Knowledge
on Student Performance on the Positive and Negative Numbers Posttest
Parameter
Unconditional Model Conditional Model
Estimate SE t p Estimate SE t p
Fixed effects
Intercept 50.79 1.73 29.28 .000 50.49 1.59 31.70 .001
Student Pretest .44 .06 6.78 .000 .45 .06 7.03 .000
Mean Teacher
Experience — — — —
.04 .23 .17 .866
Mean Teacher
PCK Pretest — — — —
.00 .09 -.04 .968
Mean Teacher
PCK Posttest — — — —
.22 .09 2.37 .033
Random effects Variance df χ2 p Variance df χ
2 p
Intercept 33.80 17 53.74 .000 24.58 14 36.26 .001
Level 1 variance 135.02 — — — 135.31 — — —
Note. Total number of students was 146. Total number of teachers was 18. All predictor variables were
grand mean centered.
The results suggest that paying attention to teacher PCK as it relates to integer
concepts and operations was an important contribution to the Jumpstart program this
year. By participating in PD, teacher PCK was changed. Increases in teacher PCK were
associated with statistically significant gains in student achievement between the pre and
posttest controlling for baseline teacher pretest PCK, student knowledge at pretest, and
years teaching experience. To better understand the impact of the PD on class instruction

117
and the implementation of strategies for solving integer operations beyond just a rule
based understanding, the next analysis looks deeper into a subset of 102 students who
returned parent consent forms and signed student assent forms for their responses to be
analyzed in more detail to better understand what students experienced in their
classrooms during Jumpstart and changes in their understanding of positive and negative
numbers.
Comparison of Teacher and Student Constructivist Learning Environment Survey
The CLES was given to measure to what extent teachers allowed students
opportunities to take ownership of the learning by talking about math with other students,
sharing their thinking with the class, and being involved in instructional decisions. Time
and resources did not allow the opportunity to observe classes to determine the level of
implementation of the strategies discussed in the PD related to getting students to talk
about mathematics through argumentation. The CLES is an indirect measurement of
whether or not these kinds of constructivist behaviors were implemented according to
teacher self-report. A similar survey was given to students. That analysis is provided
later in this chapter. Table 25 provides the results of the teacher CLES survey.

118
Table 25 Constructivist Learning Environment Survey Responses (N = 21)
Variable Description* Min. Max. Mean
(SD)
Knowledge of Content
Personal Relevance Extent to which school
mathematics is relevant to
students‘ everyday out-of-school
experiences.
0.50 0.80
0.62
(0.08)
Uncertainty Extent to which opportunities are
provided for students to
experience that mathematical
knowledge is evolving and
culturally and socially determined.
0.27 0.93 0.50
(0.18)
Knowledge of Students
Critical Voice
Extent to which students/teachers
feel that it is legitimate and
beneficial for students to question
the teachers‘ pedagogical plans
and methods.
0.63 1.00
0.84
(0.12)
Knowledge of Pedagogy
Shared Control Extent to which students have
opportunities to explain and justify
their ideas, and to test the viability
of their own and other students‘
ideas.
0.33 1.00
0.65
(0.23)
Negotiation
Extent to which students share
with the
teacher control for the design and
management of learning activities,
assessment criteria, and social
norms of the classroom.
0.40 1.00
0.79
(0.17)
Total 0.57 0.91 0.68
(0.08)
Note. Source: Analysis of Teacher CLES Survey Responses and description of variables.
* Taylor, Fraser, & White (1994)
119
The CLES provides insight into the Jumpstart teachers‘ perceptions of their
classroom environment. The low ratings of uncertainty may be related to the curriculum
for the Jumpstart program which focused more on mathematical concepts and skills
rather than connecting it to a larger sociological context or a relevant cultural application.
This may also explain the low ratings for personal relevance. However, low relevance
could also mean that teachers are not as aware of the relevance of integer operations.
This data can inform the planning of the next Jumpstart program to improve the
connection to student lives and experiences. The two areas most closely associated with
the instructional strategy of argumentation explored during the PD are critical voice and
negotiation. From the teachers‘ perspective, these two areas are highly rated so one
would expect to see implementation of these behaviors in their classroom. However,
teachers‘ perceptions are often more positive than their students (Johnson & McClure,
2004). What follows is a description of the student CLES responses and a comparison of
student responses to teacher responses to determine whether students experienced similar
levels of the subscales of the CLES survey.
Data for students who returned a signed parent consent form and who completed a
student assent form were analyzed in more detail to look at responses to the CLES survey
items and subscales, to compare their responses to the CLES survey to their teacher‘s
responses to the CLES survey, to look at the strategies used on the pretest and the posttest
to note any changes to better understand any additional relationship between participation
in Jumpstart and change in student performance on the integer assessment from pretest to
posttest.

120
There were 102 students who assented to participate in the study and who had
signed parent consent to participate. They were recruited to help learn more about what
students know about positive and negative numbers, what strategies they use to solve
integer operations problems, and to look more closely at patterns of growth from their
pretest to their posttests. Their testing data was analyzed more closely given their
permission to provide additional background of this study. Since these students are a
subset of the entire group of Jumpstart students (n = 341), the results of this analysis is
not necessarily representative of the entire sample of Jumpstart students. However,
information on strategy use may reveal changes in strategy use from pre to posttest which
might inform future program and PD design. Descriptive statistics for this subsample of
students are provided in Table 26.
Table 26 Description of the Subsample Average Scores on Outcome Measures (Percent
of 100)
Variable N Mean Standard
Deviation Minimum Maximum
Achievement
Pretest 53 39 15 4 76
Posttest 76 50 15 12 80
CLES
Personal
Relevance 69 63 13 37 100
Uncertainty 68 65 15 33 100
Critical Voice 71 68 15 37 100
Shared Control 68 63 17 20 100
Negotiation 69 69 15 30 100
CLES Total 63 66 11 45 97 Note. Source: Student assessments and CLES Survey with parent consent and student assent.
The 6 CLES subcategories consist of items that are rated from 1 to 5; there are five items for each
subcategory resulting in 25 possible points per subcategory. The percent provided in the table is the total
points out of 30 possible points, a subcategory received as rated by the student averaged across students.
There are 150 total points possible.

121
Research Question 5
What is the relationship between teachers’ responses to the Constructivist
Learning Environment Survey (CLES) and the student responses to the CLES?
For each subscale of the CLES, a box plot was created to compare the student
ratings to the teacher rating (see Appendix J). The box represents the range of student
ratings from 0 to 1.0 (0 – 100%) which is followed by a small square dot that represents
the teacher‘s rating. If the teacher‘s rating fell within the box of their student responses,
their response was rated as ―similar‖ to the responses of their students. If the teacher‘s
rating fell above the box of their student‘s responses, their response was rated as ―higher‖
than their students‘ ratings. If the teacher‘s rating fell below the box, then their response
was rated as ―lower‖ than their students‘ ratings. Next, the frequency of teachers within
each rating: similar, higher, lower was calculated to determine the percent of teachers
similar to students and the percent of teachers dissimilar to their students. Table 27
provides the summary information from that analysis.

122
Table 27 Comparison of Teacher and Student Responses to the Constructivist Learning
Environment Survey
Variable
(N = 17 teachers)
Similar
%
Higher than
Student Ratings
%
Lower than
Student Ratings
%
Knowledge of Content
Personal Relevance 35 30 35
Uncertainty 24 6 70
Knowledge of Students
Critical Voice
29 71 0
Knowledge of Pedagogy
Shared Control 35 47 18
Negotiation
23 65 12
Total 59 41 0
Note: Source: Analysis of teacher and student CLES survey responses.
The CLES Survey subscales are grouped into three main categories: Knowledge
of Content, Knowledge of Students, and Knowledge of Pedagogy. In comparing teacher
responses to student responses, a majority of the teachers‘ ratings were lower than student
ratings for Knowledge of Content (Personal Relevance and Uncertainty). In general,
teachers‘ ratings of Knowledge of Students (Critical Voice) were higher than students‘
ratings. Most teachers‘ ratings of Knowledge of Pedagogy (Shared Control and
Negotiation) were also higher than students‘ ratings. This last category, Knowledge of
Pedagogy, was the one the PD was most targeted towards improving in order to
encourage teachers to allow students to take responsibility for their learning, to engage in

123
argumentation, and to share their thinking with others. So the results of the survey show
that the majority of teachers rate these kinds of classroom environment features highly,
but their students were not as aware of them happening in the classroom.
Further research is needed to determine if more time or additional classroom
structures improve students‘ experiences having a critical voice to express their opinions,
having a say or control in decisions made about what they are learning, and negotiating
their understanding by explaining their thinking to others and challenging ideas that are
different. A limitation of this sub-sample analysis is that it represents only about 22% of
the Jumpstart students and there was variability in the number of students per class with
consent to participate in this survey. So these outcomes may not be representative of the
entire sample.
Subsample Exploratory Analysis of Strategy Use
Although not one of the main research questions, in light of the research
conducted in the pilot study related to student strategy use, data was collected for the
consenting students on strategy use by students for the pre and posttest. First, the percent
of each type of strategy use evident on the pretest and then on the posttest is presented for
all students who agreed to participate in the study in Table 28. Then a summary of
strategy use changes from pre and posttest for the 70 participating students who took both
assessments is provided in Table 28.

124
Table 28 Percent of Students Using Different Strategies on Pretest and Posttest
Strategy Pretest
(n = 71)
Posttest
(n = 101)
Change subtraction to addition 11
(32)
37
(49)
Number line (traditional method) 21
(41)
12
(32)
Vector Number line (Shows magnitude
and direction)
1
(12)
5
(22)
Pyramid or Pieman (Memory strategy
for multiplying integers)
2
(17)
5
(22)
Use of signs, counters, or sticks as
objects to manipulate for integer
operations
4
(20)
7
(25)
Note: Source: Item analysis of strategy use on pre and post assessment for a subset of participating
students.
Table 29 Change in Percent of Students Using Different Strategies from Pretest to
Posttest
Strategy
(n = 70)
Pretest
Mean
(SD)
Posttest
Mean
(SD)
Difference
(SE)
t-test p-value
Change subtraction to addition 11
(32)
41
(50)
30
(7)
4.20 P
<.001
Number line (traditional method) 21
(41)
13
(34)
-9
(6)
-1.43 .16
Vector Number line (Shows
magnitude and direction)
1
(12)
4
(20)
3
(3)
1.00 .32
Pyramid or Pieman (Memory
strategy for multiplying integers)
3
(17)
6
(23)
3
(3)
1.00 .32
Use of signs, counters, or sticks as
objects to manipulate for integer
operations
4
(20)
9
(28)
4
(3)
1.35 .18
Note. Source: Item analysis of strategy use on pre and post assessment for 70 participating Jumpstart
students who took both the pre and posttests.
The results from Table 29 show that students in this subsample of participating
students who took both the pre and posttest made a statistically significant increase in the

125
use of the strategy referred to by many of the students and teachers as ―Slash and Dash‖
where subtraction is changed into addition prior to solving the problem. To determine
whether there was any evidence that this strategy use improved their accuracy, these 70
participating students with both pre and posttest results were compared on each subset of
problems and the total score to determine areas of significant growth. The ―slash and
dash‖ strategy use was most related to improvements in solving integer subtraction
problems. Table 30 compares the growth from pretest to posttest by problem type.
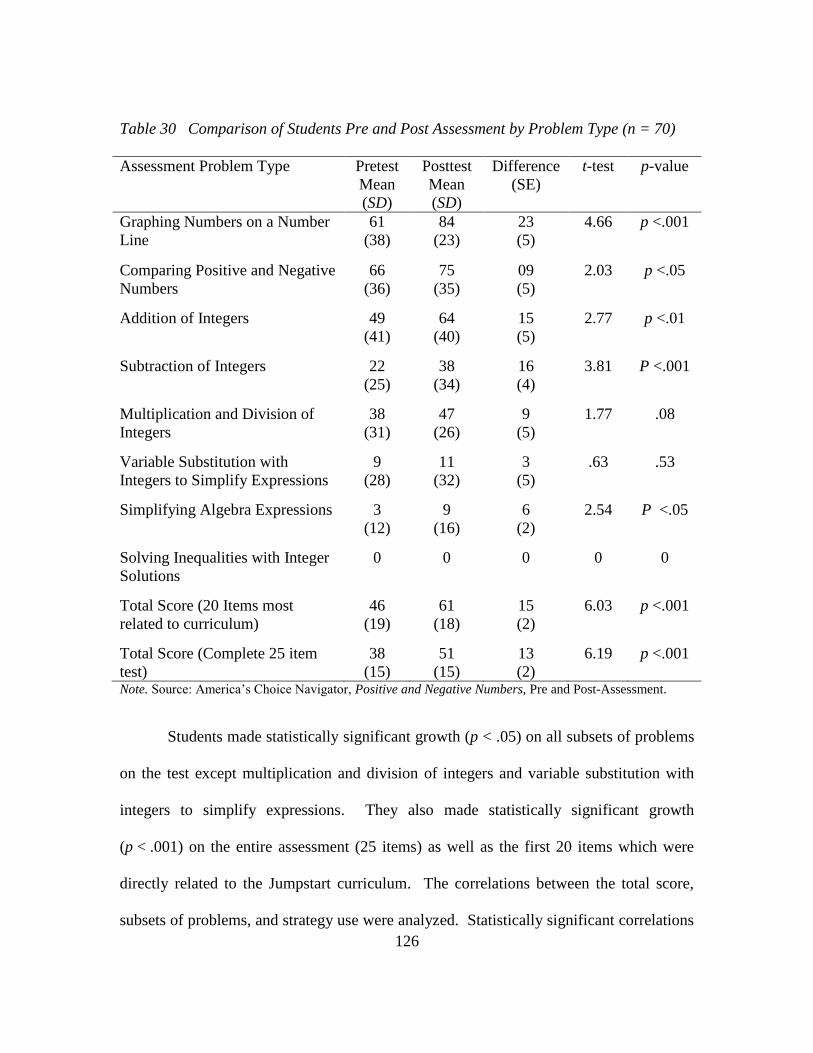
126
Table 30 Comparison of Students Pre and Post Assessment by Problem Type (n = 70)
Assessment Problem Type
Pretest
Mean
(SD)
Posttest
Mean
(SD)
Difference
(SE)
t-test p-value
Graphing Numbers on a Number
Line
61
(38)
84
(23)
23
(5)
4.66 p <.001
Comparing Positive and Negative
Numbers
66
(36)
75
(35)
09
(5)
2.03 p <.05
Addition of Integers 49
(41)
64
(40)
15
(5)
2.77 p <.01
Subtraction of Integers 22
(25)
38
(34)
16
(4)
3.81 P <.001
Multiplication and Division of
Integers
38
(31)
47
(26)
9
(5)
1.77 .08
Variable Substitution with
Integers to Simplify Expressions
9
(28)
11
(32)
3
(5)
.63 .53
Simplifying Algebra Expressions 3
(12)
9
(16)
6
(2)
2.54 P <.05
Solving Inequalities with Integer
Solutions
0 0 0 0 0
Total Score (20 Items most
related to curriculum)
46
(19)
61
(18)
15
(2)
6.03 p <.001
Total Score (Complete 25 item
test)
38
(15)
51
(15)
13
(2)
6.19 p <.001
Note. Source: America‘s Choice Navigator, Positive and Negative Numbers, Pre and Post-Assessment.
Students made statistically significant growth (p < .05) on all subsets of problems
on the test except multiplication and division of integers and variable substitution with
integers to simplify expressions. They also made statistically significant growth
(p < .001) on the entire assessment (25 items) as well as the first 20 items which were
directly related to the Jumpstart curriculum. The correlations between the total score,
subsets of problems, and strategy use were analyzed. Statistically significant correlations

127
are presented in the following table. Appendix K and L provides additional information
on other correlations.
Table 31 Statistically Significant Correlations between Subtest Scores and Strategy Use
Variable 1 Variable 2 Correlation Level of
Statistical
Significance
PRETEST
Comparing Numbers Use of Objects -.24 .04 *
Simplifying
Expressions
Change subtraction to
addition .29 .02 *
Simplifying
Expressions
Vector Number Line .31 p < .001
Simplifying
Expressions
Pieman or Pyramid Memory
Strategy .45 p <.0001
POST TEST
Addition of Integers Change subtraction to
addition .44 p < .001
Subtraction of Integers Change subtraction to
addition .39 p < .01
Total Score Change subtraction to
addition .38 p < .01
Note. * Statistically significant at the p <.05 level.
The total test score for the pretest was not statistically significantly correlated
with any strategy use by these 70 participating students. Due to the small number of
students who are considered as participants in each class and the variance in number of
participating students in each class, a paired samples t-test was more appropriate than
using HLM to account for nesting within classrooms. If a larger number of students had

128
returned consent forms and completed assessments, an HLM analysis may have been
more appropriate for a comparison. Table 32 provides the distribution of participating
students with pre and posttest results by classroom which shows that all classes are not
represented, so the outcomes needed to be interpreted with caution.
Table 32 Distribution of the 70 Participating Students with Pretest and Posttest Results
by Classroom
Classroom Students
Teacher A 0
Teacher B 8
Teacher C 0
Teacher D 1
Teacher E 1
Teacher F 2
Teacher G 0
Teacher H 2
Teacher I 1
Teacher J 0
Teacher K 4
Teacher L 3
Teacher M 2
Teacher N 6
Teacher O 4
Teacher P 4
Teacher Q 4
Teacher R 9
Teacher S 3
Teacher T 6
Teacher U 3
Teacher V
(nonparticipating) 5
Note. These students completed both the pre and posttest, submitted a parent consent form and a student
assent form. Teachers A-U consented to participate. Teacher V was a substitute and did not participate in
the PD or pedagogical content assessments.

129
The limitations of this exploratory analysis of student item category responses and
strategy use are due to the fact that these participating students make up only 22% of the
students in the Jumpstart program and they do not represent all classrooms. Also, the
sample of students returning parent consent forms may not have represented the
population of students, but more of a subset of the population which included students
who took the time to bring home the form to have their parents sign, remembering to
return the form to their teacher, and whose parents were willing to take time to read or
understand what they were involving their child in before signing. However, it was
interesting that there were more significant changes in certain strategies, and students
made more significant growth on some item categories. This information, despite its
limitations, is still valuable for looking at program strengths and weaknesses to guide
changes for the following year.
130
CHAPTER SIX: STUDENT FOCUS GROUP INTERVIEWS
Two student focus group interviews were conducted at each campus by a graduate
student, each with from two to four students participating. The audio recordings of the
interviews were provided to the researcher in a de-identified format at the end of the
Jumpstart program for analysis. The focus group interviews lasted for approximately 20
minutes. They were semi-structured interviews that began with the same prompt, ―Tell
me what you have been learning about positive and negative numbers.‖ If this prompt did
not result in students talking about their understanding the following questions were used
as time permitted to gather additional information about their understanding:
What do you think about using a number line?
How would you improve the number line activities?
What other methods did you use to solve problems with positive and negative
numbers?
What do you think about the calculator activities? Do you prefer that method?
If you had to rank the methods in order what would be the method you prefer
the most? Least? Why?
How would you solve the problem 5 – 12?
If two students came up with different answers, is there anything you could do
to check who is correct?
The prompt and back up questions were provided to a graduate student from The
University of Texas who conducted the focus group interviews at each campus.11
The
following are sample statements shared during the focus group interviews from
11
Originally weekly focus group interviews were going to be conducted, but the teachers felt that it would
be a distraction and loss of instructional time. Several grad students had originally volunteered to assist
with focus group interviews, but due to scheduling conflicts only one grad student ended up being
available. So the researcher resolved to only have 2 focus group student interviews per campus to provide
some background related to student‘s experiences with these activities related to positive and negative
numbers. This is not meant to be representative of the experiences of all students in the study.
131
participating students to give a little background into some of the students‘ perceptions of
the activities related to positive and negative numbers.
Using a Number Line
Students in the focus groups responded positively when asked about their use of a
number line.
Student 1: In these graphs, up and down, down is negative and up is positive so
when you are talking about temperature or something or water.
Student 2 : (interrupts) They make us do this to help us understand negative and
positive and the direction they go in. The calculator had a program that
lets us see a number line. You type in the equation and it shows you the
arrows and which way it is going. It is called Number Line.
Student 3: Sometimes we don‘t know how to show it, but if you use a number line
and it says -2 you can go to -2 and then if it says add 6 you can add 6 and
see what you get. To me seeing something makes it easier.
Student 4: I liked them, I like the way it works, it helps to find the difference of
negatives and positives, also to find what is bigger like -5 and
-25, we use
which one is closer to zero. It can help you find the range, the difference
of a number, what is in between.
From these brief statements, it is clear that for some student the number line helps
them connect operations with positive and negative numbers to contexts like temperature
or elevation and allows them to see what is happening. The TI-73 Numln application for
the calculator was introduced for the first time this year in Jumpstart. However, only one
student out of the four focus groups of students mentioned this calculator program. This
program was only used in four lessons spanning four days. With additional exposure to

132
the program and calculator vector model of integer operations perhaps more students
would have referenced it in their focus group discussions. The complete transcript of the
focus group interviews is provided in Appendix M.
A few students were not as pleased with the number line when dealing with
problems with larger numbers or the time it took to write out the number line. The
following are a few representative statements of these frustrations and how they were
addressed:
Student 5: I don‘t like having to write out all the negative signs. I guess you could
just put a bracket with a negative above it. Because when you are taking a
test you only have a certain amount of time, so you could just put a
negative with a bracket above the number line.
Student 6: I understand better with the pieman than the number line. The number
line is too long, too many numbers.
Student 7: Only use a number line for little numbers. Don‘t use it for extremely
large numbers. If you have hard ones, I don‘t want to cheat and use the
calculator, so maybe use pieman or try to think and figure it out for
yourself, or you could make a number line and use 100, 200 that is what I
did.
These statements are important to consider for curriculum and instruction decisions. The
following are some questions to consider in designing a curriculum and instruction
related to integers: When is use of a number line appropriate? When should students
begin generalizing their understanding from the number line to more of a rule-based
understanding to use more efficiently with larger numbers? Is there a way to
conceptualize a number line mentally that can be used with larger numbers?

133
Stories and Memory Strategies
There are several references to strategies that were not in the curriculum. Some of
the students referred to a memory strategy called Pieman which is a face with negative
signs for eyes and a positive sign for a mouth. It is used for the rules for multiplication of
integers, but some students misuse it for addition and subtraction. Others mention the use
of a story or real world application such as money.
Student 8: She (teacher) always tells us to do a story right. So you owe someone 6
dollars but you only have 5. So you subtract, I still do the subtraction so its
6 minus 5 or 5 minus 6 which is negative one.
Student 9: Sometimes I get confused about multiplying positive and negative
numbers. The teachers showed us about pieman. Pieman goes like
something like that. A positive times a negative number, a negative and
negative has to be a positive.
The mention of the use of pieman by a teacher is unfortunate, because a large part of the
time was spent PD discussing the disadvantages of using pieman as a memory strategy
with students, because the pilot study showed students misapplied it to addition and
subtraction of operations. The use of ―pieman‖ was mentioned by several students as
their favorite strategy.
Ranking Different Strategies
When asked to rank the different strategies used for solving integer operation
problems, most of the students listed the number line as their first choice. Students
seemed to confuse the TI-83 daily calculator activities used for exploring algebraic
patterns by entering functions, exploring tables, and exploring graphs. Several listed
calculators as least favorite, because they did not like all the buttons that needed to be

134
pressed to graph lines. Only one student referred to the calculator appropriately as the
number line program that uses vectors to represent operations with integers. Again, this
confusion could be because the TI-73 was only used for four days and the TI-83 was used
daily for the entire program for the patterns lessons. The following are some
representative examples of how students ranked the strategies they had learned:
Student 10: I understand better with the pieman than the number line. The
number line is too long, too many numbers.
Student 11: The calculator is easy. But pressing all the buttons is confusing,
pressing delete, gets confusing12
In order I like the number line, then the
teacher‘s way13
, then the calculator the least.
Rules without Understanding
One concern that continues to appear when interviewing students about integer
operations is the use of rules without understanding. Student responses from focus
groups seemed to attribute these rules to instruction either in Jumpstart or earlier in
middle school. The following are some representative examples of this rule-based
understanding:
Student 12: +3 x
-5 would equal +15 because a positive times a negative (pause).
A Positive times a negative equals a positive and a negative times a
positive is a negative. No a negative times a negative is a positive and a
positive times a positive is a positive (writes out rules on paper from
memory).
12
This student earlier refers to the TI-83 patterns calculator activities where students graph linear functions.
The student is referring to these calculator activities here as having too many buttons to press. 13
The teacher‘s way the student refers to is described in another part of the transcript as lining up the
positives on one side of a T-chart, the negatives on another side and crossing out zero pairs.
135
Argumentation Around Subtraction of Integers: 5 – 12
The focus group interviews ended with a sample problem for the students to solve
and explain their thinking. If two or more students came up with different responses, the
UT grad student was to encourage the students to justify their solution, to give them the
opportunity to practice their argumentation skills. This only occurred in two of the focus
groups where there was a difference between two students in the solution to this problem.
In one focus group, Student 13 argued that the answer was -7 and Student 14
believed the answer was 7. What follows is their discussion:
Student 13: I wouldn‘t use a number line. I would just subtract, since you can‘t
do it, it goes into the negative. I have to use a number line to explain it.
You are at 5 and you take away 12, 1,2,3,4,5,6……12 so it would be right
here, at -7. I solve it with just regular numbers, but I explain it with the
number line.
Student 14: I flip it, 12 – 5 and the difference is 7. I find out which is bigger, 12
is bigger, 5 is positive, I have to take more than 5 so I have to go to the
negative side. So I have to take 5 and 7 more which is 12 and I end up in
the negative side which is -7.
Initially, Students 13 and 14 had different answers. When Student 14 explained his/her
thinking after hearing Student 13, they ended up with the same answer. This is one
common outcome of argumentation around different solutions; students share their
individual strategies but come to the same conclusion resolving the difference. Student
13‘s response made this researcher realize a limitation of interview studies in that asking
students to explain their thinking may cause them to show an understanding using a
strategy they normally do not use for solving similar problems. How then, can one better
understand the strategies students actually use on a regular basis?

136
In another focus group, Students 15 and 16 start with different solutions, but
Student 16 is less confident and switches to support Student 15‘s answer when in reality
Student 16 was correct. The following is their discussion:
Student 16: (looks at Student 15‘s paper) I got a different answer so now I‘m
confused.
Student 15: Start on the positive side and then add 12 so it‘s going to be 17.
Student 16: I just subtracted, and it went to -7 rather than 17 so now I‘m
confused.
Student 15: I think it‘s 17. If you are really just subtracting then it is -7, but if you
are adding then it is 17.
Student 16. No this way over here.
Student 16. It‘s 17. I believe her
Student 15 That way (teacher way) is confusing to me. (uses cell phone
calculator) It‘s -7
Student 16. I was right, okay, I‘m not confused anymore. I just looked at 5 and
subtracted 12 and got -7.
Sometime students experience either peer pressure or a lack of confidence in their
own answers or in their understanding which can cause them to change their answer,
even if correct, and comply with the answer of another student because students can be
unsure of an answer. This is why teachers using argumentation in the classroom need to
include a class debrief to have students share out their understanding so that other class
members can assist with clearing up any misconceptions that develop during the small
group argumentation sessions (Ryan & Williams, 2007).
These snapshots of student understanding and feelings about the Jumpstart
activities related to positive and negative numbers were included to provide some insight
into the students‘ experiences. However, these are not meant to represent any kind of
overall understanding or experience of all students in the Jumpstart program. In planning
for next year‘s Jumpstart program, this researcher recommends that number line activities

137
need to continue to be used because of the positive response of the students and the
accurate use of number lines by students to solve problems. As much as the curriculum
was written to resist use of rules in the Jumpstart curriculum, teachers and students
persist in using rules. Therefore, improvements in the Jumpstart curriculum and
instruction are needed to help teachers and students connect rule based understanding to a
more meaningful context. That way if there is any confusion when using rules, they
would have a meaningful context to draw from to check their thinking. Students seemed
to be comfortable using argumentation to justify their thinking when there was a
difference of opinion about a solution. Continuing use of argumentation in the PD of
teachers and in the activities for students is recommended to give students opportunities
to clear up misconceptions and to develop reasoning and justification skills. From these
few interviews, it is not clear if the vector model for integer operations or the TI-73
number line models are appropriate activities for students to strengthen their
understanding since only one of the students addressed this type of strategy or model.
However, it was used for only 4 of the 15 days of the program. Additional research on
this model is needed to see if it is an effective model for integer operations.
138
CHAPTER SEVEN: CONCLUSIONS AND RECOMMENDATIONS
Research Questions and Conclusions
What follows is a review of the research questions that guided this investigation:
1. What are the general patterns of teacher content and pedagogical knowledge
of integers based on responses to a pre and post assessment?
2. To what extent does PD impact teacher content and pedagogical knowledge as
measured by growth between pre and post assessment?
3. Is there a statistically significant difference between the growth between
students‘ pre and posttest scores for Jumpstart 2010 compared to the growth
made by students in Jumpstart 2009?
4. Do differences in teacher content and pedagogical knowledge explain more of
the variance in student performance (pretest/posttest) than years of teaching
experience of the teacher?
5. What is the relationship between teacher responses‘ to the Constructivist
Learning Environment Survey (CLES) and the student responses to the
CLES?
Based on the findings from the analyses of data collected for this study, described
in detail in chapter 5, the following conclusions are made:
1. The analysis of the teacher pretest and posttest PCK results showed that 77%
of the teachers at pretest could not explain why multiplication of two negative
numbers results in a positive number. At the posttest, this number was
reduced to 48% of teachers. At pretest, 61% of teachers believed that 3 –5

139
was the same as 3 + (-5). After learning about the importance of
distinguishing between operations and signs of numbers, only 24% of teachers
still believed these expressions were the same expressions.
2. Overall the teachers made statistically significant growth in their PCK about
integers between the pre- and posttest, increasing in score from a mean of
46% to a mean of 62%. This growth is assumed to be a result of the PD;
however, research by Ball and Cohen (1999) showed that teachers often make
changes in attitudes and instruction after they have implemented what they
have learned in their classroom. Since the posttest was given at the end of the
program, the results measured what teachers learned from the start of the
program to the end, which includes learning from the PD as well as learning
from their experience implementing the curriculum and the argumentation
strategies with the students.
3. In comparing the pre- and posttest results for students in Jumpstart 2009 to
students in Jumpstart 2010, there were statistically significant greater gains
made in 2010. The students started out lower than the students in 2009, but
rose to about the same posttest level. In 2009, the student average gain was
6%. In 2010 the growth between pretest and posttest more than doubled to a
14% improvement. This improvement was not as great as was hoped for, but
the area of integer operations continues to be a complicated instructional field
because of the prior knowledge teachers and students come with that includes
140
misconceptions, and the short time students and teachers had during the
15-day Jumpstart program to explore these challenging concepts.
4. The HLM analysis of student posttest scores accounted for the nesting of
students within classrooms, and showed that differences in teacher PCK was
statistically significant and explained 27% of the classroom posttest variance
controlling for years of teaching experience, student pretest score, and teacher
pretest PCK score. Years of teaching experience was not significant in
explaining the differences in posttest scores at the class level. The findings
show that a 1 point increase in teacher PCK, the overall percent score would
be associated with a .22 increase in student posttest score. The average gain
in teacher PCK from pretest to posttest was 16%. For each of these
percentage points, there would be an associated .22 increase in student
posttest score which accumulates to a 4% increase on the class average
posttest. This may not seem like much of an association, but the average
growth from pretest to posttest was only 14%. So the teacher PCK was a
significant variable associated with student posttest scores.
5. The results of the teacher CLES showed that teachers rated the category of
Shared Control at an average of 65%, with a minimum rating of 33% and a
maximum rating of 100%, which explains the extent to which students are
given opportunities to explain and justify their own ideas and hear the ideas of
other students. In comparing teacher responses to the responses of the
participating students in their class, 47% of the teachers rated this category of
141
Shared Control more highly than their students, and 35% rated it the same as
their students. This is one of the higher ratings that was similar between
teachers and students which may mean that teachers are more realistic with
what they were able to implement this summer in terms of succeeding in
providing productive opportunities for students to engage in classroom
discourse about mathematics.
Comparison to Findings of Previous Research
For the subsample of 70 participating students, the strategy that was the most
evident from student work on the pretest was use of the number line (21%) which then
became second most used compared to the more abstract symbolic rule of changing
subtraction to adding the opposite of the subtrahend (second number), which was used by
at least 41% of the students on the posttest based on notes on their work on the
subtraction problems on the posttest. This is similar to the findings of Harvey and
Cunningham (1980) in their research of grade 8 student performance and strategy use on
an assessment. Subtraction of integers was the most challenging for students, and only
students who converted subtraction to adding the opposite of the subtrahend (second
number) were successful in solving the subtraction problems. Therefore, further research
is needed to better understand student use of this strategy and whether it is more effective
than other strategies in terms of accuracy for solving integer subtraction problems.
The Jumpstart curriculum starts with more conceptual representations of counters
with the cancellation model and then the number line model. Then at the end of the
program, students are engaged in an activity where they generalize the patterns they see
142
into a rule. Therefore, an increase in the use of the rule on the posttest and the decrease
in the use of other models (i.e., number line) may not mean that these models are not
satisfactory. It may just mean that developmentally these students have moved beyond
these representations and are now more comfortable with use of the rule that they
generalized from their understanding of the other representations. Additional research is
needed to determine whether that is the case.
According to the work of Turnuklu and Yesildere (2007), teachers need to
understand the difference between a sign and an operation and the importance of assisting
students in understanding the difference. In their work, pre-service teachers did not see
the difference between the expressions 3 + (- 5) and 3 –5. In this study, 61% of the
Jumpstart teachers on the pretest also believed that there was no difference between these
two expressions. However, after the PD discussion about the purpose of operations and
signs of numbers and their different roles and after implementing the curriculum with
their own students, there were only 24% of teachers who continued to believe there was
no difference in these expressions. The other 76% were able to explain the difference
due to the operation and sign of the numbers in the problem. This may seem like a minor
issue, because in actuality these expressions result in the same answer; however, students
struggle with understanding the role of operations and signs, so it is important for
teachers to understand the difference.
Strengths of This Study
Taking on a project such as this was a risk and a challenge, because only 6 hours
of PD were available to effect teacher change, and only 15 days (1.5 hours a day) of
143
instruction related to integers was included in the Jumpstart program. However, due to
the small growth made in 2009 and actual loss in understanding for some students, it was
important to thoughtfully plan how to research the effect of changes to the PD and the
curriculum to impact student and teacher understanding to inform future Jumpstart
program changes. A similar percent of students from 2009 completed both pretests and
posttests as students in Jumpstart 2010 which allowed the comparison of student growth
each year, showing statistically significantly more growth made this year following the
program changes.
All but one teacher consented to participate so that results from their pretest and
posttest could be compared to determine changes in their understanding which showed
statistically significant growth. All teachers completed the CLES survey reporting to
what extent they believed these constructivist environment features were important and
implemented in their classroom. What follows are potential limitations based on the fact
that not all data were able to be collected from students because of the challenges of
getting students to return parent consent forms. However, given that this is a summer
program with no homework, and that students do not take backpacks to and from school,
the return rate for signed parent consent forms of 102 out of 341 students was a higher
rate than was expected.

144
Limitations
Analytic Sample of Teachers
The comparison of pretest and posttest growth for teacher PCK included only 18
of the 22 teachers in the Jumpstart program because one teacher did not attend the PD
and three teachers arrived late and did not complete the pretest. The available data for
comparison represented 82% of the teachers. Therefore, the results should be interpreted
with caution because they may not represent the change in understanding of all teachers.
Analytic Sample of Students
Each year, the district faces the challenge of enrolling the students who are to be
in the program by the first day of Jumpstart. Since the program is based on whether the
students have passed the grade 8 TAKS test or not, many students wait until the results
from the summer administration are back to determine if they will need to attend
Jumpstart. Grade Placement Committees at the school are given very little time between
the release of the results and the start of the Jumpstart program to meet with parents and
students to explain the expectation that the students will attend Jumpstart. Therefore,
approximately one third of the students in Jumpstart do not enroll until closer to the third
day of the program. This is why only 216 of the 341 (63%) Jumpstart students completed
the pretest.
Since the posttest covers the curriculum taught throughout the entire Jumpstart
program, teachers are asked to wait until almost the last day of the program to administer
it to their students, allowing at least one day for make-up testing. However, at this point
145
in time many families take vacations which causes some students to miss the last day or
two of the program, some of the students are removed from the program because they
exceed the allowable number of absences or have exceeded the acceptable amount of
behavior referrals, and other students decide not to attend the last few days, perhaps
because of the fact that there will be post assessments. This explains in part why only
270 of the 341 (79%) Jumpstart students completed the posttest assessment. Accounting
for students who entered the program late and left the program early, there were only 178
of the 341 (52%) Jumpstart students present for both the pretest and posttest assessments.
This was not significantly different than the 56% of students (177 out of 316 students)
who completed both pretests and posttests for Jumpstart 2009. However, the findings of
this study are based on the outcomes for only a little more than 50% of the students each
year; therefore, the results cannot be assumed to be true for all students in the program,
including students who enrolled later and students who left the program early.
Specific Sample Characteristics
The results of this study apply to the specific students enrolled in this Jumsptart
program which are students in eighth grade transitioning to high school who have not
passed the TAKS mathematics test and are located in an urban school district in Central
Texas. The goal of this study was not to draw conclusions about or make generalizations
to any larger population in the State of Texas or the nation or for any other students with
different characteristics. The goal was to compare the results to similar students in the
previous Jumpstart 2009 program to understand if the growth made during the program
was significant and to inform the development of the next Jumpstart 2011 program.
146
Changes in Teacher Knowledge
Even though the findings showed that the PD had an effect on teacher PCK, the
results are based on an instrument designed by this researcher based on prior research,
but may have limitations due to validity and reliability issues. No test of validity or
reliability was conducted on this measure due to the small sample size of participants in
the pilot study development of the instrument (n = 13) and in the actual sample taking the
assessment as a pretest and posttest (n = 18). The assessment was closely aligned with
the PD and the curriculum the teachers were to implement. So interpretation of the
findings should not assume that the outcome measure represents a complete assessment
of a teacher‘s PCK in mathematics or even specific to integers in a broader mathematical
sense.
Changes in Student Understanding of Integers
The student outcome measure used was the pretest and posttest given each year
for the Jumpstart program that was part of the Navigator: Positive and Negative Numbers
(America‘s Choice, 2009) curriculum that teachers were asked to give all students for
accountability purposes to measure progress for students participating in the program.
This measure does not have any reliability or validity information from America‘s Choice
since it is a newly developed product. Some of the other Navigator curriculum modules,
such as the one with rational numbers, have been around longer, have been used in other
research studies, and have statistically significant evidence of their impact on student

147
performance14
. However, the goal was to use this data as an artifact of the program,
provided in a de-identified format from the district to understand changes in student
understanding of integers between the pretest and posttest. If there was another outcome
measure chosen, only the data for the 102 consenting students would have been analyzed.
So the use of the Navigator assessment data allowed for a more representative result of
the effect of student participation in the Jumpstart program on student performance.
Constructivist Learning Environment Survey
Since the CLES was not part of the Jumpstart program, it was an optional survey
that only students with parent consent and student assent completed. There were only
102 students with consent and only 71 who completed the CLES survey with a few
students leaving items unanswered, so that only 63 students had complete ratings for all
items. These participating students who took the CLES represent only 18% of the
Jumpstart 2010 students. Therefore, the summary of student responses to the CLES
should be interpreted with caution, because they may not represent the experiences of all
of the Jumpstart students. Also, there were several classes which did not have any
consenting students that completed a CLES survey, so the comparisons of similarity
between teacher and student responses should also be interpreted carefully, understanding
that the pattern of similarity between teachers and students for certain items only
represent that pattern for the small group of students that participated and for their
respective teachers.
14
For more information, visit the America‘s Choice website at
http://www.americaschoice.org/resultsmathematics.
148
Implications and Future Directions
Implications for Professional Development
The PD design of this study was informed by research such as the one conducted
at Riverside Middle School by Mundry and Loucks-Horsley (1999) which documented
that implementation of a reform mathematics curriculum that required PD was a balance
between the practical issues that concern teachers such as being prepared to implement
curriculum activities and the new instructional practices and beliefs that were part of the
reform curriculum. This researcher believes that the changes made in the PD from 2009
to include less of a focus on the curriculum activities and more of a focus on teacher
conceptual understanding of integer operations through use of argumentation had a
positive impact on teachers and students based on evidence that there were instructional
practices occurring which allowed students to engage in conversations about mathematics
based on teacher and students CLES responses. However, the PD only lasted six hours.
Haycock and Robinson (2001) conducted research which showed ―PD that makes
a difference for minority students is PD that deepens teachers‘ knowledge of the
curriculum they are teaching, helps them find or create effective lessons, and enables
them to assess and respond to student performance‖ (p. 18). Impacting a teacher‘s ability
to assess and advance student learning was an area that could have used more emphasis
and is something to consider in the development of the Jumpstart 2011 program.

149
Implications for Pre-service Teacher Preparation
In analyzing the pretest item performance of the Jumpstart teachers, many of the
teachers came to the program unable to explain why the answer to the problem -5 x (
-8) is
positive (72%), how to solve the problem 5 – (-8) beyond just changing it to an addition
problem (50%), and the difference between the expressions 3 –5 and 3 + (-5) which was
true for 61% of the teachers. Instructors of courses for pre-service teachers should
consider these entry level points as potentially areas that their pre-service students may
share and find ways to explore integer operations to improve understanding of these
operations conceptually as well as pedagogically. The Jumpstart PD caused an
improvement across teachers in their understanding of these problems, but 48% of the
teachers were still unable to explain why -5 x (
-8) is positive and 43% were unable to
describe how they would explain the solution of 5 – (-8) to a student. Additional research
is needed to continue to improve teacher understanding so that teachers will be more
confident in addressing similar questions from students in their class.
Implications for Equity
The concern that led to this dissertation study was that the students in Jumpstart
2009 who were in classes taught by first-year teachers made less growth and some even
lost ground between pretest and posttest on the measure of understanding of integers.
Research has confirmed the importance of having highly qualified teachers (defined as
the proportion holding state certification and the equivalent of a math major), especially
in schools that serve low-income students with a previous history of low achievement.
Research by Darling-Hammond (1999) using National Assessment of Educational

150
Progress (NAEP) student achievement data and state data on teacher major and
certification showed that the less advantaged students were less likely to have teachers
that are fully certified and hold a degree in their field and more likely to be taught by a
teacher who started teaching uncertified. The results of Darling-Hammond‘s study also
suggest that teacher quality is related to student achievement outcomes even after
controlling for student poverty and language background. However, in some situations,
such as this short-term summer program, it is difficult to recruit highly qualified teachers.
Therefore, the results of this research show the potential value added of including PD
focused on improving teacher PCK to improve performance for students who are not
afforded the opportunity to work with highly qualified teachers. The results of this study
showed that teacher PCK was statistically significantly associated with student
achievement even when controlling for years of teaching experience.
However, what actually occurred in the classroom in terms of opportunities to
participate in talking and writing about reasoning about mathematics is not clear. The
results of the teacher CLES showed that teachers rated the category of Shared Control at
an average of 65%, which explains that students are given opportunities to explain and
justify their own ideas and hear the ideas of other students; however, individual teacher
ratings ranged between 33% and 100%, showing that some teachers were not as
successful as others in facilitating classroom discourse about mathematics. Based on the
findings of the 1993 National Survey of Science and Mathematics Education (Weiss,
1997) low-ability students were provided with fewer opportunities to engage in inquiry
activities or to write about their reasoning while solving math problems. The goal was
151
for the PD and curriculum unit for this study to improve opportunities for the low-
performing grade 8 students enrolled in Jumpstart 2010. However, it appears that not all
students were provided with these kinds of opportunities. Therefore, it remains to be
determined what kind of support is needed for teachers to provide these kinds of
opportunities for their students.
Future Directions
There are other exploratory analyses that could be conducted with this data set,
which are outside of the research questions for this study, but that might prove interesting
to the field, such as, whether or not there was differential growth between pretest and
posttest for students in different percentiles comparing 2009 students to 2010 students
and also comparing students with teachers with high or low PCK. This would examine
whether the changes to the program and/or the changes in teacher knowledge affected
some groups of students more than others.
Additional research is needed on measures of Teacher PCK that are more content
specific. For example, the Mathematical Teacher Knowledge measure (Ball & Hill,
2009) could have been used to assess teacher knowledge, but it would cover a variety of
mathematical topics. For this study, the researcher was looking at integer understanding
specifically. Additional research and development could be performed of evaluation
measures that are topic specific and include items that measure teacher knowledge about
the topic content in mathematics, knowledge about students (i.e., common
misconceptions), and knowledge about instruction related to the selected topic. This kind

152
of evaluation measure would be beneficial for determining outcomes of short PD
experiences related to curriculum implementation for a specific unit of study.
Additional research is needed to explore the kinds of support teachers need in
order to facilitate classroom discussions about mathematics, small group discourse and
argumentation, and opportunities for students to participate in inquiry activities. The PD
and curriculum for Jumpstart were not sufficient to provide all students with these kinds
of opportunities. There were classrooms where this was happening based on a
comparison of student and teacher responses to the CLES, and there were classrooms
where less of this was happening. Beyond PD, there must be support such as mentoring
and model teaching that could be used to advance teachers‘ practice in this area.
Between pretest and posttest there was a change in strategy use on the test as
evident in the work of the 70 participating students. The change in strategy use was a
move away from the numberline and cancellation with objects model towards more of an
abstract-rule based strategy of changing subtraction to adding the opposite of the
subtrahend. Further research is needed to determine if instructional practice influenced
this strategy use or if it is more developmental as students generalize from patterns they
see with the other representations, they move towards using an abstract symbolic rule for
solving problems with subtraction of integers.
General Discussion
The topic of integers and integer operations was chosen because of its importance
as a foundational number and operations concept, the research evidence of persistent
student misconceptions (Ryan & Williams, 2007), and the challenges faced by the

153
mathematics community to agree on an effective model to support students‘ conceptual
understanding that is also comprehensive and comprehensible. Through the process of
gathering information on potential instructional strategies and the research behind their
effectiveness, research on teacher PCK seemed woven throughout as authors discussed
the importance of ensuring that teachers have knowledge of mathematics, knowledge of
representations, knowledge of students, knowledge of learning and cognition, and
knowledge of teaching (An, Kulm, & Wu, 2004; Fennema & Franke, 1992; Shulman,
1995; Turnuklu & Yesildere, 2007). Therefore a decision was made to focus less on
which instructional model is best for teaching students about integers and integer
operations and to focus more on researching teacher PD to improve teacher PCK related
to integers.
Originally, the focus of the PD was to ensure that teachers were aware of common
student misconceptions, but after further review of the literature, it was an almost
impossible task to review all of the common misconceptions. It was at that point when a
review of literature on argumentation and student discourse about mathematics informed
the final focus of this study as a less teacher-directed intervention to challenge
misconceptions and a more student-centered intervention to encourage students to share
their thinking and their strategies and for students to work through helping each other
come to a stronger understanding of integers. However, first teachers needed to
experience argumentation by expressing their understanding of different strategies for
representing integer operations and then coming to understand a new representation with
the vector model to deepen their understanding. This seemed to be an appropriate

154
intervention, since these students just finished grade 8, so integers are not a new concept
to them. They have prior knowledge and experience with integers to bring to the
discussion. The challenge remained to confront teacher beliefs about a student‘s ability
to engage in productive conversations about mathematics by providing PD that modeled
classroom structures and norms for productive argumentation.
The observations made during the PD were that most of the teachers were
engaged in the activities where they experienced argumentation around representations of
addition and subtraction of integers. There was evidence during the stations activities,
that teachers were already making connections as to how they could use certain activities
and certain questions to form the problem that would be the center of the argumentation
for the students. However, there was also evidence of teachers with rule-based beliefs
that the only way students learn is by memorizing and practicing rules until they are
automatic. On the teacher PCK posttest, several teachers shared experiences with
students resisting participation in discussions due to low confidence in mathematics and a
concern about being wrong. Others shared the challenges of facilitating small group
discussions when one of the students was overly confident and verbal, causing the other
students just to listen and not share their ideas for fear of being wrong. Twenty-four
percent of the teachers admitted to not engaging students in argumentation. If this
research project had lasted all year, teachers would have had more time to build the
classroom culture and expectations for productive conversations and more time to get to
know the students to find ways to group different students to encourage more
participation.

155
One concern is that close to 50% of teachers on the posttest continued to believe
that the only way to understand why -5 x
-8 was positive was because of a rule that when
one multiplies two negatives (or an even number of negatives) one gets a positive, despite
their exposure to a number line model of multiplication as repeated addition and
subtraction and the representation of multiplication with colored counters during the PD.
Only two of the 21 teachers that completed the demographic survey stated that they had a
major in math, so perhaps their exposure to integers may be limited to the way they were
taught in mathematics in school, possibly with rules. Since that method has worked for
them, there was some pushback about why these other representations should even be
considered. Just six hours of PD and three weeks of a required day-by-day curriculum
developed to expose students to reasoning about mathematics and use of multiple
representations may not have been sufficient to change some of the teachers‘ beliefs
about a student‘s ability to engage in productive conversations about math and beliefs
about teaching integers.
Ball and Hill (2009) conducted research in classrooms to observe and identify
―common tasks of teaching that require mathematical skill and insight‖ (p. 69). They
found that mathematical understanding for teachers involved the following: ―posing
questions, interpreting students‘ answers, providing explanations, and using
representations‖ (p. 69). Ball, Thames, and Phelps (2008) investigated Mathematical
Knowledge for Teaching (MKT) and described what they discovered in the model that
had two forms of knowledge: subject matter and PCK. On the subject matter side, the
knowledge was divided among three domains: common content knowledge, knowledge

156
at the mathematical horizon, and specialized content knowledge. On the pedagogical
content side, the knowledge was separated into these three domains: knowledge of
content and students, knowledge of content and teaching, and knowledge of curriculum.
At the time of the development of this dissertation study, this literature had not been
reviewed. So the term used throughout this paper to refer to the kind of knowledge that is
important for teachers to possess was PCK. However Ball and Hill‘s (2009) model of
MKT is one to further consider because it seems to get at some of the teacher behaviors
that support argumentation in the classroom.
Ball and Hill (2009) expressed that this MKT model gets at some of the important
aspects of teacher knowledge that are in Shulman‘s (1986, 1987) description of PCK.
After completing this conceptualization, as part of the Learning Mathematics for
Teaching Project, Ball and Hill created assessment items called Mathematical Knowledge
for Teaching (MKT) measures and administrated the questions to large groups of
teachers. The questions have also been used by other researchers and PD projects.
Through this research, Ball and Hill found that the MKT of teachers was strongly
associated with the quality of their instruction, specifically the following: ―use of
mathematical explanation and representations, responsiveness to students‘ mathematical
ideas, and ability to avoid mathematical imprecision and error‖ (p.70). Earlier research
by Hill and Ball (2004) had found that teachers who participated in a summer PD that
focused on teachers‘ use of mathematical representations, explanation, and
communication performed better on MKT measure than teachers at similar sites who did
not receive this kind of focus.

157
The sample items for the MKT measure15
were reviewed for this study to
determine if any would be appropriate to include on the teacher PCK assessments, but
most of the sample items related to operations with fractions and whole numbers. The
two items that included integers did not seem appropriate because they were related to
concepts of solving inequalities and the associative and distributive properties which
were not addressed in the Jumpstart Program. To have access to additional items, The
Learning Mathematics for Teaching Project recommends travel to a training for
researchers that occurs every few months for free. Therefore, it was decided that this
measure would not be used for this study, but is something to consider for future research
of teacher knowledge.
In conclusion, the professional development and curriculum modifications made
this year for Jumpstart 2010 resulted in statistically significantly positive gains in teacher
PCK and student achievement. The change in the professional development, compared to
the previous year resulted in less of a focus on student activities and more on developing
teacher PCK. As a result, teachers who were originally unable to explain why multiplying
two negative numbers results in a positive number, were now able to explain
conceptually why this is true when they completed the posttest. Other teachers who did
not differentiate between an operation of subtraction and the negative sign of a number at
pretesting made improvements in understanding the distinct roles of each of these
components of a mathematical expression. The resulting positive change in teacher PCK
15
Sample items are available through The Learning Mathematics for Teaching Project at
http://sitemaker.umich.edu/lmt/files/LMT_sample_items.pdf

158
was associated with positive gains in student understanding on the posttest. To have such
a positive effect on teachers and students in just six hours of PD and three weeks of a
curriculum and instruction intervention is encouraging for future PD development.

xix
Appendix A: Integer Unit Daily Overview
Day Description Materials
Day 1 Lesson 1: Pre-test
Work Time Discussion
T-Chart: Correct/Incorrect
Copies of Student Pre-test
Student Journals
Poster Paper T-Chart
Day 2 Lesson 2: On a Number Line
Discussion: #'s 1C, 1D, 5C, 5D
Confronting Misconceptions or Competing
Strategies depending on student work
Thermometer Problem
Discussion:
What is Math Reasoning & Argumentation?
Establish Group Norms
Sample Student
Misconceptions (Lesson 2)
Thermometer Points of
View
Argumentation Sentence
Stems Poster
Group Norms Poster
Day 3
Lesson 3: Understanding Positive & Negative
Numbers
Vocabulary: Greater, Less, Opposite, Ascending
Order, Descending Order
Lesson 4: Greater Than Less Than Game
Discussion: Which is greater -1/5 or -0.23
Add to group norms, add to sentence stem poster
Sentence Stem Poster
Group norms Poster
Lesson 4 Group Cards
Problem for class
discussion
Record Sheet for
Discussion
Day 4
Lesson 6: Working with Positive and Negative
Numbers
Discussion: Misconceptions from Checkpoint,
students share reasoning/argumentation
Temperature Changes Activity Lesson 6
Discussion: strategies for determining difference
in temperature, meaning of difference.
Copies of Checkpoint
Student Reflection Sheet
Sentence Stem Poster
Group norms Poster
Lesson 6 Group Cards
Misconceptions from
Checkpoint (Anonymous)
Day 5 4 Corners
Student Activity to assess prior knowledge and
strategy use.
Discussion: Argumentation using Competing
Strategies
Lesson 7: Adding Positive and Negative
Numbers
Discussion: What are these number lines
4 Poster Paper with
identical problem (-8) + 5
Markers
Lesson 7 Group Cards
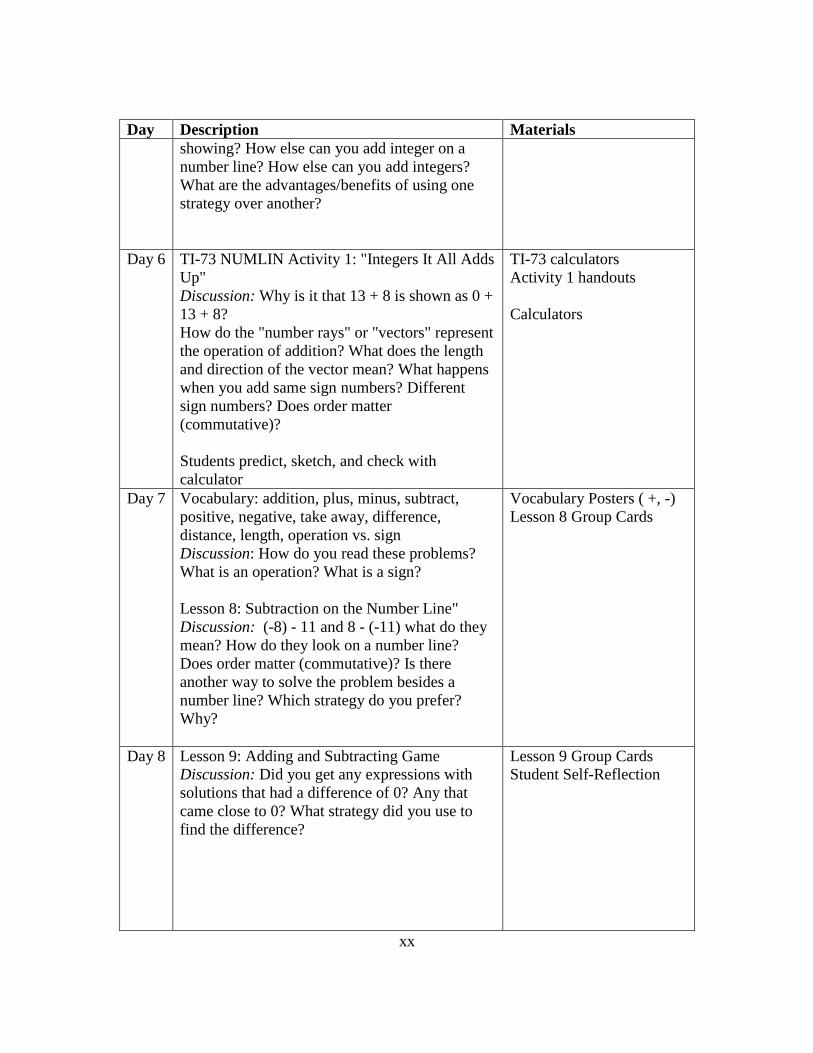
xx
Day Description Materials
showing? How else can you add integer on a
number line? How else can you add integers?
What are the advantages/benefits of using one
strategy over another?
Day 6 TI-73 NUMLIN Activity 1: "Integers It All Adds
Up"
Discussion: Why is it that 13 + 8 is shown as 0 +
13 + 8?
How do the "number rays" or "vectors" represent
the operation of addition? What does the length
and direction of the vector mean? What happens
when you add same sign numbers? Different
sign numbers? Does order matter
(commutative)?
Students predict, sketch, and check with
calculator
TI-73 calculators
Activity 1 handouts
Calculators
Day 7
Vocabulary: addition, plus, minus, subtract,
positive, negative, take away, difference,
distance, length, operation vs. sign
Discussion: How do you read these problems?
What is an operation? What is a sign?
Lesson 8: Subtraction on the Number Line"
Discussion: (-8) - 11 and 8 - (-11) what do they
mean? How do they look on a number line?
Does order matter (commutative)? Is there
another way to solve the problem besides a
number line? Which strategy do you prefer?
Why?
Vocabulary Posters ( +, -)
Lesson 8 Group Cards
Day 8 Lesson 9: Adding and Subtracting Game
Discussion: Did you get any expressions with
solutions that had a difference of 0? Any that
came close to 0? What strategy did you use to
find the difference?
Lesson 9 Group Cards
Student Self-Reflection
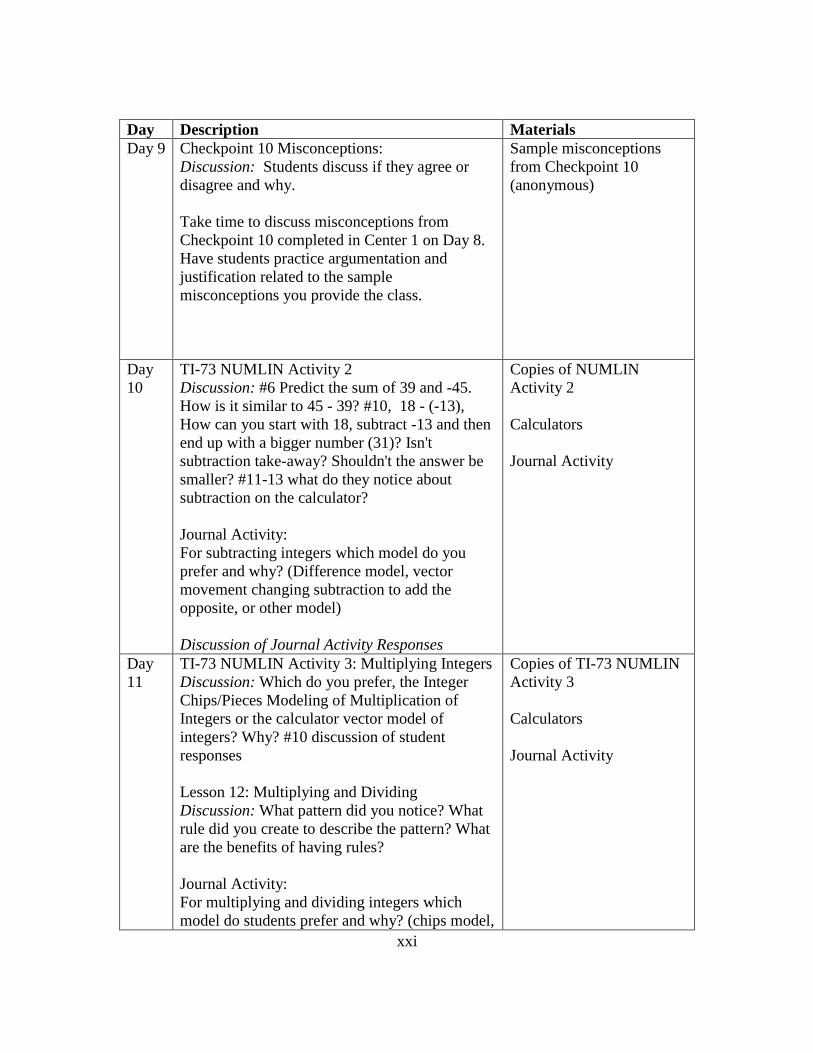
xxi
Day Description Materials
Day 9 Checkpoint 10 Misconceptions:
Discussion: Students discuss if they agree or
disagree and why.
Take time to discuss misconceptions from
Checkpoint 10 completed in Center 1 on Day 8.
Have students practice argumentation and
justification related to the sample
misconceptions you provide the class.
Sample misconceptions
from Checkpoint 10
(anonymous)
Day
10
TI-73 NUMLIN Activity 2
Discussion: #6 Predict the sum of 39 and -45.
How is it similar to 45 - 39? #10, 18 - (-13),
How can you start with 18, subtract -13 and then
end up with a bigger number (31)? Isn't
subtraction take-away? Shouldn't the answer be
smaller? #11-13 what do they notice about
subtraction on the calculator?
Journal Activity:
For subtracting integers which model do you
prefer and why? (Difference model, vector
movement changing subtraction to add the
opposite, or other model)
Discussion of Journal Activity Responses
Copies of NUMLIN
Activity 2
Calculators
Journal Activity
Day
11
TI-73 NUMLIN Activity 3: Multiplying Integers
Discussion: Which do you prefer, the Integer
Chips/Pieces Modeling of Multiplication of
Integers or the calculator vector model of
integers? Why? #10 discussion of student
responses
Lesson 12: Multiplying and Dividing
Discussion: What pattern did you notice? What
rule did you create to describe the pattern? What
are the benefits of having rules?
Journal Activity:
For multiplying and dividing integers which
model do students prefer and why? (chips model,
Copies of TI-73 NUMLIN
Activity 3
Calculators
Journal Activity
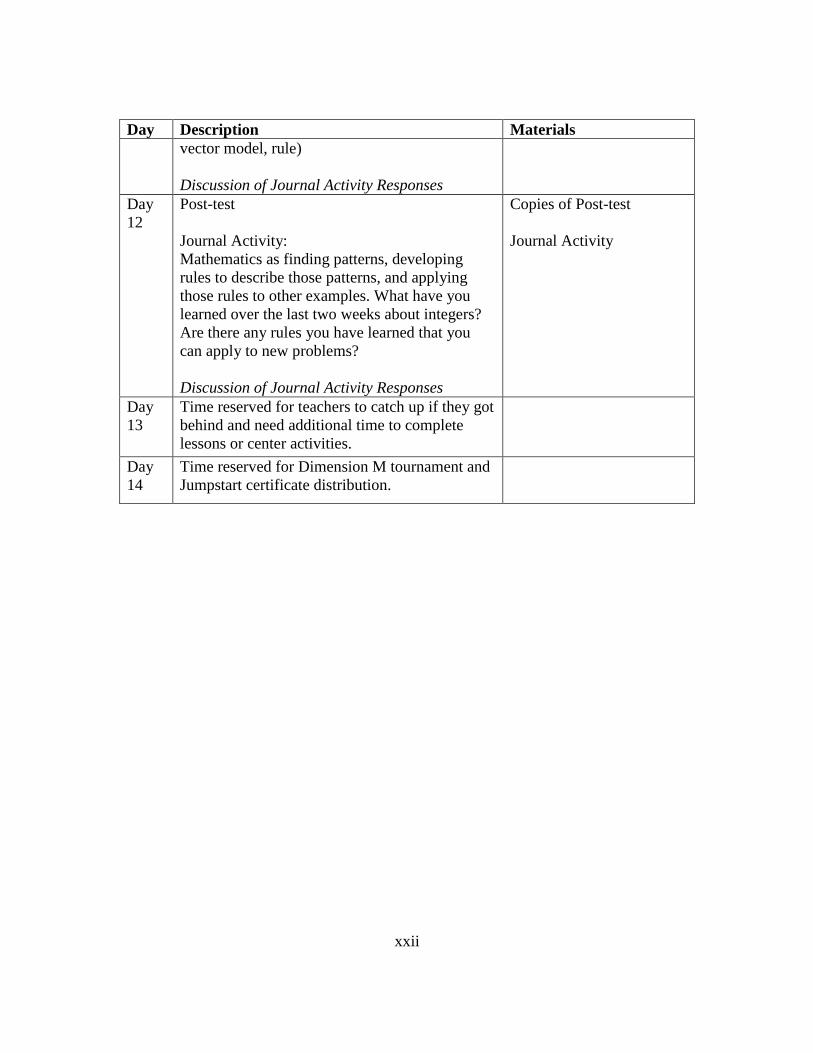
xxii
Day Description Materials
vector model, rule)
Discussion of Journal Activity Responses
Day
12
Post-test
Journal Activity:
Mathematics as finding patterns, developing
rules to describe those patterns, and applying
those rules to other examples. What have you
learned over the last two weeks about integers?
Are there any rules you have learned that you
can apply to new problems?
Discussion of Journal Activity Responses
Copies of Post-test
Journal Activity
Day
13
Time reserved for teachers to catch up if they got
behind and need additional time to complete
lessons or center activities.
Day
14
Time reserved for Dimension M tournament and
Jumpstart certificate distribution.

xxiii
Appendix B: Sample Misconceptions Prompts for Discussion
The following sample misconceptions were provided as part of the Jumpstart
curriculum to be used as prompts for argumentation in the classroom if the available
student work samples did not provide enough differences to base a discussion. I wrote
these prompts so I provide them here as a resource for work with students around
misconceptions using argumentation. These are based on common misconceptions from
the pilot study I conducted in May 2008.
Comparing Numbers
Question: How do you know if one number is larger than another number when you are
asked to compare 2 integers?
Student: "I always remember that if it‘s a negative and a positive, the negative will
always be the larger one. So if it‘s a negative 1 and a negative 9, the negative 9 would be
larger than the negative 1 because the negative 9 is the biggest."
Adding Integers
Question: (-5) + 8 = ?
Student: 5 + 8 is 13, so it would be negative, no just positive 13. I think its positive
because that's the biggest number.
Question: (-3) + (-6) = ?
Student: I was thinking about the negative sign. I could be wrong. I think it's positive 9,
because a negative times a negative makes a, NO, a negative times a negative makes a

xxiv
negative, and a negative and a positive makes a positive number. I just know that it's 9,
Positive. Because two negatives equal a positive.
Student Drew Pie Man shown below:
Subtracting Integers
Question: 2 - 7 = ?
Student: When I was in kindergarten, I didn't think you could do this problem. Now I
know this is the same thing as 7 - 2, so the answer is 5.
Question: ( -3) - 5 = ?
Student: It is -2, because you just subtract.
Another Student: You can draw 3 boxes or 3 circles and you can tell you are trying to get
to 5. You are missing 2. So the answer is 2.
Multiplication of Integers
Question: (- 4) x 5 = ?
Student: It is 20, a negative. No it's a positive, because the negative is in front of the 4,
which is smaller and the 5 is positive and it is larger. So it is positive 20.
_ _
+

xxv
Another Student: I just multiply that times that and get 20, and since the higher number is
positive, it's going to be positive.

xxvi
Appendix C: July 8, 2010 Professional Development Overview
8:30am - 3:30pm
8:00 - 8:30 Registration & Breakfast
8:30 - 8:45 Teacher consent form & pre-assessment
8:45 - 9:00 Share Participant Prior Knowledge
What makes integer operations challenging?
What are some common misconceptions?
What strategies have they used to teach about integers?
What experience do they have with students using argumentation or justifying
thinking?
What concerns do they have about facilitating class discussions?
Vocabulary for integer operations?
Posted on the Wall: Goals for Today briefly point out to the class
Goals for Today:
Why Argumentation? Results from Jumpstart 2009 (little to no progress)
NCTM new emphasis on Mathematical Reasoning
Experience argumentation through lessons from the Integers Unit
Argumentation as Competing Strategies & Confronting Misconceptions
Scaffolds to support Argumentation in the Classroom:
Conversation Stems
Groupwork Norms
Organizing Productive Group Argument in Discussion

xxvii
Norms for Class Discussions
Keeping a Record of the Discussion
Student Self Reflection
Reflecting on the Experience (Q & A)
9:00 - 9:15 Part 1: Introduction:
Overview Jumpstart 2010- Curriculum, Lessons, Centers
Overview of data collected from Jumpstart 2009
Areas in need of improvement from Jumpstart 2009
9:15 - 10:15 Part 2: Why Argumentation?
Jigsaw Parts of Ryan & Williams (2007) "Children's mathematical discussions."
Everyone reads selection 1 and then jigsaw selections 2-5.
Selection 1: Argumentation in discussion: persuasion through reasoning (pp.31-
33) (What is argumentation in math classrooms?)
Selection 2: An analysis of mathematical argumentation (pp.34-39) (What are
argumentation moves? Give examples)
Selection 3: What makes a good mathematical argument (pp.39-40) (What are the
key components of a mathematical argument?)
Selection 4: Maintaining dialogue in practice: social interaction (pp.41-44) (What
are the types of teacher moves to facilitate argumentation in class discussion)
Selection 5: Small Group Dialogues in the classroom (pp.44-49) (How would you
respond to a teacher who is concerned that sharing misconceptions might
make misconceptions contagious?)

xxviii
Groups create poster to address their question and share a brief summary of the
section they were assigned to read. Groups share out their thinking.
10:15 - 11:15 Part 3: 4 Corners Activity (Adding Integers)
Group work Norms-Brainstorm List among participants (Poster)
Complete 4 corners activity in groups
Share and discuss the different strategies
Misconceptions: What are the common student misconceptions (create
poster) Discuss Norms for Argumentation (How are we going to have this
discussion?)- Social Norms (i.e. respect) and Mathematical norms (what makes a
good mathematical argument, how do you evaluate/critique a mathematical
argument?) (create poster) [NCTM Middle School Math Journal has examples of
arguments that are of different levels of quality and justification]
Show 1 example of America's Choice number line model for addition and
hold an argumentation discussion. Question: Why did America's Choice come up
with this model? Focus of Part 1 Math: does it work for solving problems
(reference criteria for good mathematical argument). Focus of Part 2 Pedagogy:
Does it work for teaching students about integer addition?
Reflect on the argumentation experience (record conversation stems used
during the discussion). Question 1: What is the value of argumentation for
learning about math? Question 2: How can you support argumentation in the
classroom? (What structures were modeled today as examples of support
structures?) Discuss Example of Keeping a Record of the Discussion using the

xxix
Adding Integers (Note: Record can show where the argument left off, because it
may not be resolved at the end of the day)
Misconceptions about adding integers Handout: Question: What is the
student's misconception? What would you say to the kid? Argumentation often
brings out student misconceptions, what do we do? Participants practice with a
partner to assess and advance student thinking based on the sample student
misconception.
11:15 - 12:15 Part 4: Adding & Subtracting Integers on a Number Line
Given a subtraction problem, how would you represent on a number line?
Give half problem a and half problem b without telling them the difference [a. (-
8) – 11 and b. 8 – (-11) ] Pairs form groups of 4 (one pair with problem a and one
pair with problem b). Groups of 4 Discuss and converge on one strategy. (Note:
Researcher walks around modeling ways that teachers can facilitate small group
argumentation)
Meta-conversation about strategies for supporting this sort of activity in
small groups (reference the article read about small group argumentation)
Discuss why they drew the number lines the way they did (Some may be using
the same kind they did in the 4 corners activity, others may be influenced by the
America's Choice model for integer addition)
Researcher talks about skipping the whole class synthesis argument for
time, but in their classes they should take time to have small groups share out.

xxx
Show America's choice model for subtraction if no one else came up with
it. Hold Argumentation session about this model. Focus of Part 1 Math: does it
work for solving problems (reference criteria for good mathematical argument).
Focus of Part 2 Pedagogy: Does it work for teaching students about integer
subtraction?
Misconceptions about subtracting integers Handout: Question: What is the
student's misconception? What would you say to the kid? Why isn't subtraction
commutative? Participants practice with a partner to assess and advance student
thinking based on the sample student misconception
12:15 - 12:45 Lunch
12:45-1:45 Part 5: Calculator Explorations with TI-73 ( + , - , x )
Teachers explore TI-73 Integer Addition and Subtraction Activity.
Discussion: Which strategy do you prefer- Navigator number line, TI-73 number
line, or any of the others shown today? Why? Part 1: Mathematical, Part 2:
Pedagogical Question: How would you show Multiplication of integers with
chips? with a number line? Calculator Exploration of Integer multiplication with
TI-73. Which strategy do you prefer- chips or the number line for multiplication?
Why? Part 1: Mathematical, Part 2: Pedagogical
1:45-2:00 Part 6: Vocabulary
Discuss meaning of the different words used in integer operations: addition, plus,
minus, subtract, positive, negative, take away, difference, distance, length,
operation vs. sign. Discuss vocabulary, how do you read these problems?

xxxi
Especially what is an operation? What is a sign? Discuss misconceptions in how
students might read these problems. Is subtract a negative really the same as add a
positive? Why? Is subtract a positive really the same as add a negative? Why
2:00 – 3:00 Part 7: Integers Centers
Teachers rotate through 6 centers spending about 8 minutes at each center
to engage in the activity the students will be using for the integer center. Model
center facilitation as a teacher by asking questions, and encouraging students to
talk and engage in argumentation related to the center activity.
3:00 – 3:15 Part 8: Reflecting on the experience, Questions & Answers
(Add new learning to posters from the morning)
What makes integer operations challenging?
What are some common misconceptions?
What strategies have they used to teach about integers?
What experience do they have with students using argumentation or justifying
thinking?
What concerns do they have about facilitating class discussions?
Vocabulary for integer operations?
3:15 - 3:30 Part 8: Overview of Jumpstart Integer Lessons & Center Activities:

xxxii
Appendix D. Teacher Content & Pedagogy Assessment
1. List as many real world examples for integer operations that you can think of.
2. Provide as many examples as you can of how integers are used in other domains (i.e.,
physics, chemistry, animation, forensics, etc.). Be as specific as possible of your
understanding of the use of integers and integer operations within that domain.
3. Given 5 - (-8) = ? How would you explain to a student the answer you got?
4. Given -5 x (-8) = ? Why does the answer have the sign that it does?
5. A student teacher reads (-6) + (+7) as "minus six and plus seven" and 6 - (+7) as "six
minus plus seven". Is this appropriate? Explain why or why not.
6. A student when given the problem 4 - 7 = ? responds 3. What is a possible
misconception that they might have that causes them to have this response? How
would you respond to them?
7. Is 3 - 5 the same as 3 + (-5)? Why or why not? Explain.
8. Have you ever supported your students in arguing about math? Describe the
experience, any benefits, and any challenges below:

xxxiii
Appendix E: Teacher Demographic Survey
Dear Teacher,
Thank you for participating in the study of the effectiveness of 2 replacement units for
teaching students about positive and negative numbers. I would appreciate your taking
time to provide a little demographic information for research purposes. Your response to
this survey will only be used for general statistical purposes to better understand the
group of teachers in the study. The final report will summarize the results across all the
teachers participating and will not provide any information that would identify you to
your school, administrator, or district.
1. Name: _____________________________________________________
2. Age: ________________
3. Jumpstart Campus: ______________________________
4. Gender (check one) Male Female
5. Total years teaching experience: ___________
6. Have you taught in the Jumpstart Program Before? (check one) Yes No
7. Highest degree (only check one)
Bachelors Major:_______________________________
Masters Major:________________________________
Ph.D Major:__________________________________
For Study Purposes only: Teacher Study ID: _____________________________

xxxiv
Appendix F: Student Assessments
The Pre- and Post Assessments were part of the America's Choice (2009) Navigator:
Positive and Negative Numbers program purchased by the school district. These materials
are copy written so they are not provided in this report. What follows are some similar
problems so that the reader can better understand the types of problems students
encountered on these assessments.
Mid-Assessment
Mark and Label the following numbers in their correct position on the number line below:
(1) -5 (2) - 0.5 (3) 2 (4) 1
2 (5) -2.5
--------------------------------------------------------------------------------------------------
Choose the correct symbol to write between each pair of numbers
< "is less than" or > "is greater than"
(6) 2 ________ -1.5
(7) 3 ________ - 2
(8) 4 ________ -5
(9) -2 ________ -1
(10) -2.5 ______ -3
Solve the following addition problems:
(11) (-6) + 5 =
(12) (-3) + (-8) =

xxxv
(13) 7 + (-5) =
(14) 6 + (-12) =
(15) (-9) + 4 =
Solve the following subtraction problems:
(16) 3 - 8 =
(17) (-6) - 3 =
(18) 5 - (-2) =
(19) (-4) - (-5) =
(20) (-10) - 4 =
Describe if the following are true or false:
(21) (-5) x (-4) = 5 x 4
(22) 7 x (-3) = -7 x 3
(23) (-6) x 5 = -6 x -5
(24) 6 x 4 = -6 x -4
(25) (-2) x (-2) = 2 x 2
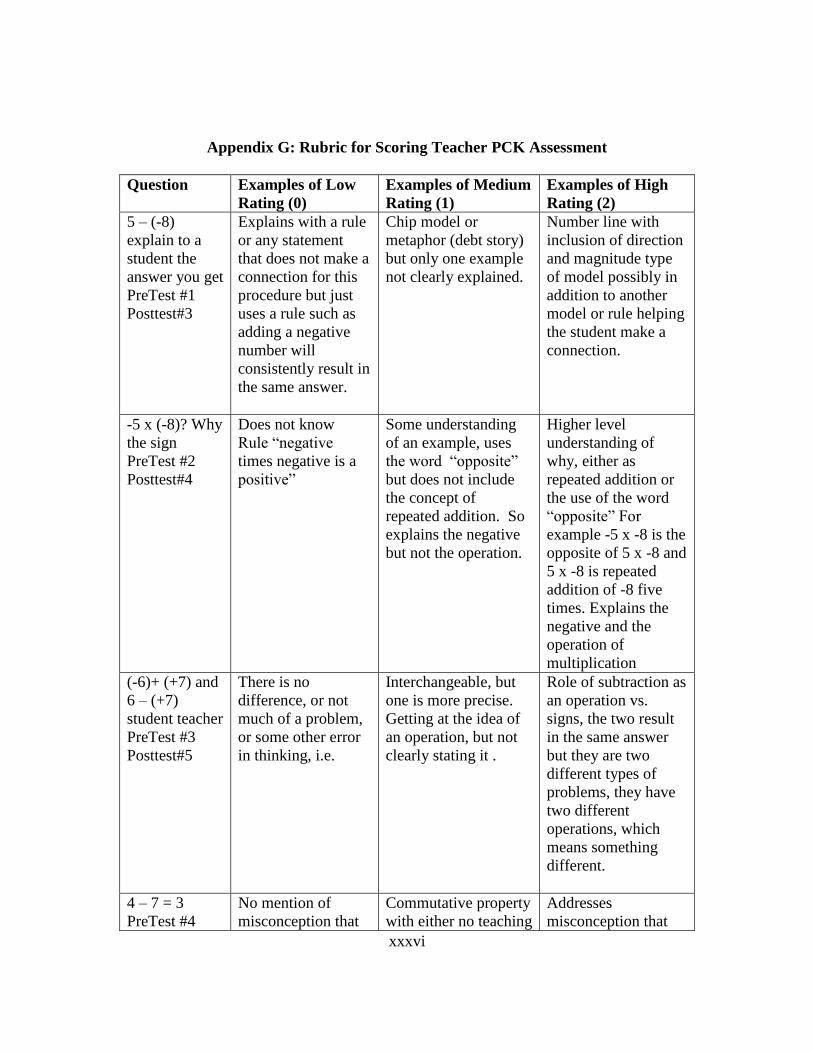
xxxvi
Appendix G: Rubric for Scoring Teacher PCK Assessment
Question Examples of Low
Rating (0)
Examples of Medium
Rating (1)
Examples of High
Rating (2)
5 – (-8)
explain to a
student the
answer you get
PreTest #1
Posttest#3
Explains with a rule
or any statement
that does not make a
connection for this
procedure but just
uses a rule such as
adding a negative
number will
consistently result in
the same answer.
Chip model or
metaphor (debt story)
but only one example
not clearly explained.
Number line with
inclusion of direction
and magnitude type
of model possibly in
addition to another
model or rule helping
the student make a
connection.
-5 x (-8)? Why
the sign
PreTest #2
Posttest#4
Does not know
Rule ―negative
times negative is a
positive‖
Some understanding
of an example, uses
the word ―opposite‖
but does not include
the concept of
repeated addition. So
explains the negative
but not the operation.
Higher level
understanding of
why, either as
repeated addition or
the use of the word
―opposite‖ For
example -5 x -8 is the
opposite of 5 x -8 and
5 x -8 is repeated
addition of -8 five
times. Explains the
negative and the
operation of
multiplication
(-6)+ (+7) and
6 – (+7)
student teacher
PreTest #3
Posttest#5
There is no
difference, or not
much of a problem,
or some other error
in thinking, i.e.
Interchangeable, but
one is more precise.
Getting at the idea of
an operation, but not
clearly stating it .
Role of subtraction as
an operation vs.
signs, the two result
in the same answer
but they are two
different types of
problems, they have
two different
operations, which
means something
different.
4 – 7 = 3
PreTest #4
No mention of
misconception that
Commutative property
with either no teaching
Addresses
misconception that

xxxvii
Question Examples of Low
Rating (0)
Examples of Medium
Rating (1)
Examples of High
Rating (2)
Posttest #6 subtraction is
commutative
property and no
teaching strategy.
approach or unsure of
teaching approach. ie.
Or teaching strategy
but no mention of
mention of
misconception that
subtraction is
commutative.
subtraction is
Commutative and
includes a teaching
approach.
Is 3 – 5 the
same as
3 + (-5)?
PreTest #5
Posttest#7
Not sure or yes they
are the same but not
sure why.
Explain why
equivalent but don‘t
mention the change in
operation. May
include a description
of +(-#) as
multiplication and that
when simplified they
becomes equivalent.
Understands the
importance of
operations and any
math concept that
makes them different,
such as inverse
operations.
Argumentation
PreTest #6
Posttest#9
No experience with
students using
argumentation in the
classroom.
Minimal, or mixed
experience, not quite
at the level expected.
May just refer to as
class discussion.
Clear past experience
and outcome that
sounds like the
expected
involvement of
students in
argumentation
Real World
Examples
PreTest #7
Posttest#1&2
No real world, no
domain example, no
explicit reference
that relates to
negative numbers
Either real world or
domain example(s)
(Besides math
domain)
Both real world and
non-math domain
examples
Number line
Posttest #8
(Not included
in Assessment
score but
included for
exploratory
purposes)
Don‘t connect
number line to
operations, i.e.,
Mention either
position, magnitude or
direction, but not all in
connecting with
integer operations.
Mentions at least two
of position,
magnitude, direction
and connects to
integer operations.

xxxviii
Appendix H: Student Focus Group Questions
Number Line Replacement Unit
This focus group discussion will begin with the following statement to begin the
discussion, ―Tell me a little about what you have been doing in your class with positive
and negative numbers?‖ Then the following questions will be used as needed if these
areas are not brought up in the discussion.
1. What did you like the most about using a number line to solve integer problems?
2. What did you like the least about using a number line to solve integer problems?
3. How did you like the calculator activities where you graphed integers as vectors?
4. If you were given an integer problem, such as 5 - 12, how would you go about solving
the problem?
5. Do you have any suggestions for how to improve these number line activities?

xxxix
Appendix I: Real World and Domain Applications of Integers
The following represents the diverse background and experiences with integers
represented by the Jumpstart 2010 teachers taken from the pre and post PCK assessments.
This list is a great resource for a variety of problem contexts for curriculum development
in the area of operations with integers.
Some Real World Examples:
Stock market
Temperature change
Rate change [leading later to velocity and acceleration]
Whole dollar bank deposits and overdrafts
Football field
Elevation
Sea level
Golf scores
Taking a trip (algebra project)
Elevator
Giving change,
Doing taxes in TurboTax
Sports scores
Measuring weight loss and weight gain
Inflation of tires is almost always a whole number (PSI) that you‘re trying to get close to
Gambling
Card games such as Euchre
Chemistry
Counting number of protons/neutrons/electrons
Ionic charge, e.g. +3, -2
Number of atoms and molecules in a chemical reaction formula, e.g. 2H2 + O2 => 2H2O
Working with temperature in analyzing any Chemical reaction involves an understanding
of integer number lines.
Conversions of units involves multiplication and division of integers
Media and Film
In filmmaking, frame rates (i.e. 24 frames per second) involve an understanding of how
fast or slow the resulting film will be. So, increasing from 24 will use more film and
therefore make the action seem slower, and decreasing from 24 will use less film and
therefore make the action seem faster. For instance, shooting 48 frames per second will
make the result look like it‘s at half speed. And shooting at 12 frames per second will
make the result look it it‘s playing at double-speed.

xl
Art and Design
When you edit something in Photoshop, there are several settings in which the default is
zero, and you can move a cursor back and forth to a positive or negative number to
change certain properties of the picture, such as the contrast, saturation, hue, brightness,
etc. Also, when you rotate objects, you are asked to choose the angle to rotate them, and
you can choose positive or negative angles.
Animation
Translating objects from one coordinate to another, so you‘re adding or subtracting
integers to the x,y,z coordinates. And if you want to ―grow‖ something, then you would
multiply appropriately by an integer
Forensics
Blood volume in forensics
Physics
Acceleration
Velocity
Force vectors
Conversions of units involves multiplication and division of integers
Finance
Debits/credits on accounting sheets
Economics
The slope of a demand curve
Applied Math/Statistics
When determining relationships between variables, parameters or constants might be
negative
Probability – an expected value can be negative in a game where you lose money
Computer Science
Loop counter to figure out how many times you have repeated a loop
Array index variables to access different elements of an array
ASCII number codes for keyboard characters
Bits and bytes have integer components to keep track of the location or size of an object
Geology
Elevation changes- how steep – change in height over distance; and then vertical
exaggeration- how exaggerated is the slope when represented?
Counts of particular things (forams in a thin section, sheath folds in a mountain range,
isoclinals folds and normal faults on a roadside outcrop)

xli
Appendix J. Box Plots Comparing Student and Teacher CLES Survey Responses.
Table #.
Figure 9 Box Plot of Teacher and Student Ratings of Relevance on the CLES Survey
Table 33 Percentage of Teachers with Similar Ratings as students: Relevance
Source: Box Plot of Teacher and Student CLES ratings of Relevance
Variable
(n=17 teachers)
Similar
%
Higher
%
Lower
%
Relevance
35 30 35

xlii
Figure 10 Box Plot of Teacher and Student Ratings of Uncertainty on the CLES Survey
Table 34 Percentage of Teachers with Similar Ratings as students on Uncertainty
Source: Box Plot of Teacher and Student CLES ratings of Uncertainty
Variable
(n=17 teachers)
Similar
%
Higher
%
Lower
%
Uncertainty
24 6 70

xliii
Figure 11 Box Plot of Teacher and Student Ratings of Critical Voice on the CLES
Table 35 Percentage of Teachers with Similar Ratings as students on Critical Voice
Source: Box Plot of Teacher and Student CLES ratings of Critical Voice
Variable
(n=17 teachers)
Similar
%
Higher
%
Lower
%
Critical Voice
29 71 0

xliv
Figure 12 Box Plot of Teacher and Student Ratings of Shared Control on the CLES
Table 36 Percentage of Teachers with Similar Ratings as students on Shared Control
Source: Box Plot of Teacher and Student CLES ratings of Shared Control
Variable
(n=17 teachers)
Similar
%
Higher
%
Lower
%
Shared Control
35 47 18

xlv
Figure 13 Box Plot of Teacher and Student Ratings of Negotiation on the CLES Survey
Table 37 Percentage of Teachers with Similar Ratings as students on Negotiation
Source: Box Plot of Teacher and Student CLES ratings of Negotiation
Variable
(n=17 teachers)
Similar
%
Higher
%
Lower
%
Negotiation
23 65 12

xlvi
Figure 14 Box Plot of Teacher and Student Ratings on the CLES Survey Overall
Table 38 Percentage of Teachers with Similar Ratings as students Overall
Source: Box Plot of Teacher and Student CLES ratings Overall on Total Score
Variable
(n=17 teachers)
Similar
%
Higher
%
Lower
%
Total
59 41 0

xlvii
Appendix K. Statistically Significant Correlations
Association Correlation Significance Level
Age & Teacher‘s Years Experience .632 p < .01
Teachers‘ Years Experience & Advanced
Degree .588 p < .01
Prior Jumpstart Teacher & Teacher PCK
posttest -.520 p < .05
Teacher Major Math & Teacher CLES
Relevance factor .524 p < .05
Teacher CLES Relevance & Teacher CLES
Uncertainty factor .436 p < .05
Teacher CLES Relevance & Teacher CLES
Critical .446 p < .05
Teacher CLES Critical & Teacher CLES
Control .700 p < .01
Teacher PCK pretest & Teacher CLES
Negotiation -.484 p < .05
Teacher PCK CLES Total vs. CLES Control .737 p < .01
Teacher PCK CLES Total vs. CLES
Negotiation .689 p < .01
Student Average Pretest(20) vs. Teacher Age -.479 p < .05
Student Average Posttest Average (20) vs. Prior
Jumpstart Exp. -.511 p < .01
Student Average Pretest(25) vs. Teacher Age -.479 p < .05
Student Average Pretest(25)vs. Post-test
Average (20) .992 p < .001
Student Average Posttest(25) vs. Prior
Jumpstart Experience -.491 p < .05
Student Posttest Avg. (25) vs. Student Pretest
Avg. (20) .994 p < .001
Note: Source: Author‘s Analysis of Teacher and Student Data
Note: Avg. (20) is the student average of the first 20 questions on the assessments. Avg. (25) is the student
average on the complete 25 item assessment. Items 21-25 are extension problems.

xlviii
Appendix L. Correlation Matrix- Teacher/Classroom Level
1 2 3 4 5 6 7 8
9 10 11 12 13 14 15 16 17 18
1 Teacher Age 1.0 N=20 for Variables 1-5 N=18 for Variables *correlation is significant at the .05 level (2-tailed)) **correlation is significant at the .01 level (2-tailed
2 Gender 0 1.0
3 Teacher Yrs Experience
.632 **
.315 1.0
4 Prior Jumpstart Teacher
.298 -.257 .313 1.0
5 Advanced Degree .252 .423 .588 **
.236 1.0
6 Teacher Major Math
-.126 .168 .042 .281 .397 1.0
7 Teacher PCK (pre) .303 -.069 .317 -.097 -.026 N/A 1.0
8 Teacher PCK (post)
.037 -.147 -.218 -.520 *
-.256 -.305 .268 1.0
9 Teacher CLES Relevance
-.053 -.146 -.243 .119 -.078 .524* -.358 -.312 1.0
10 Teacher CLES Uncertainty
.059 .344 .103 -.047 .011 .295 -.343 -.172 .436 *
1.0
11 Teacher CLES Critical
.166 -.184 -.070 .229 -.162 -.327 -.100 .346 -.446 *
-.270 1.0
12 Teacher CLES Control
.278 -.104 -.011 .099 .206 -.309 -.284 .291 -.247 -.248 .700 **
1.0
13 Teacher CLES Negotiation
-.099 -.023 -.172 .193 .175 .291 -.484 *
-.209 .401 -.016 .062 .359 1.0
14 Teacher CLES-% .166 0 -.110 .196 .125 .083 -.557 .044 .288 .291 .487* .737 ** .689 **
1.0
15 StdPreAvg20 -.479 *
.075 -.219 .194 .197 .094 .094 -.023 -.054 -.276 .011 -.092 .134 -.112 1.0
16 StdPostAvg20 -.092 .361 -.178 -.511*
.100 .015 .073 .448 *
-.011 .068 .204 .321 .108 .310 .286
1.0
17 StdPreAvg25 -.479 *
.015 -.248 .241 .162 .144 .087 -.218 -.013 -.252 .003 -.103 .141 -.098 .992 ***
.272 1.0
18 StdPostAvg25 -.129 .327 -.224 -.491* .089 .053 .020 .431 .054 .07 .190 .309 .160 .335 .296 .286 .994 ***
1

xlix
Appendix M: Jumpstart 2010 Student Focus Group Interviews
Transcription Conducted by Sarah Harris 09/18/10
Transcription Codes:
S: Graduate Student who conducted the interviews
M#: Male Student (# 1 means the first male in the group to speak, #2 is the
second)
F#: Female Student (# 1 means the first female in the group to speak, #2 is the
second)
Interview 1
1 S: Can you tell me about what you have been doing with +/- numbers
2 M1: Use calculators, program to find negative and positive numbers
3 F1: make graphs, negative numbers
4 M1: compare, find the difference, and use equations, -5 + something equal
something, and you have find what it equal in the calculator, so we have to write
down every single step.
5 S: how do you use the calculator to find that
6 F1: if they give us and equation 5 + x + 2, put it into Y=
7 M1: to find the graph, Y= type in equation, press 2nd
graph or just graph
8 F1: If we can‘t see the graph we can go to WINDOW, I hadn‘t learned that
9 M1: it is kind of complicated. Window is complicated, that is where you set the
whole graph, Ymin, Xmax is complicated.
10 F1: When I first came here it was all day, I didn‘t know how to use the calculator,
and the teacher said you are going to have a pretest and I said what do you mean a
pretest. I don‘t know how to use the calculator. Then the teacher said, I just want
to know what you know, and I said ok. Then when they gave me the pretest, I was
like, dang, I don‘t know nothing.
11 M1: I didn‘t know anything
12 F1: fractions I didn‘t know. Then they gave us a post-test. First we started
practicing everything, I didn‘t know how to do it first, now I can. I think I am
ready to go to high school. I had a few things I didn‘t know.
13 S: did you like the pretest and post test?
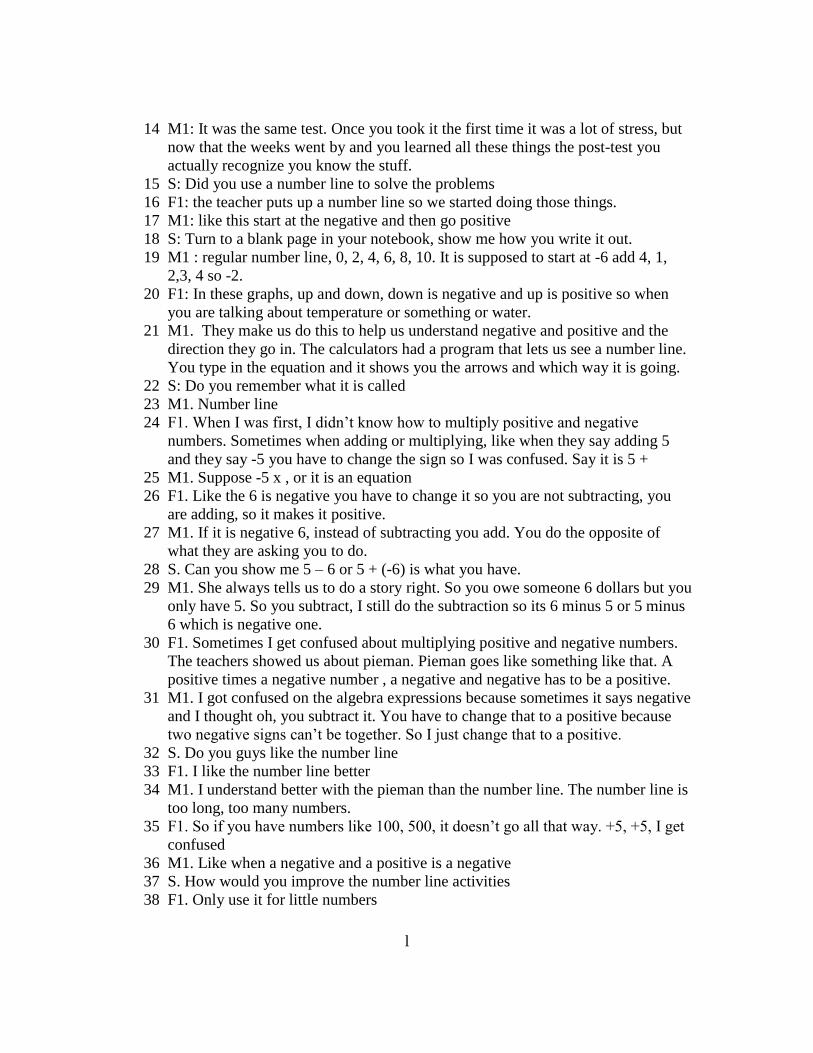
l
14 M1: It was the same test. Once you took it the first time it was a lot of stress, but
now that the weeks went by and you learned all these things the post-test you
actually recognize you know the stuff.
15 S: Did you use a number line to solve the problems
16 F1: the teacher puts up a number line so we started doing those things.
17 M1: like this start at the negative and then go positive
18 S: Turn to a blank page in your notebook, show me how you write it out.
19 M1 : regular number line, 0, 2, 4, 6, 8, 10. It is supposed to start at -6 add 4, 1,
2,3, 4 so -2.
20 F1: In these graphs, up and down, down is negative and up is positive so when
you are talking about temperature or something or water.
21 M1. They make us do this to help us understand negative and positive and the
direction they go in. The calculators had a program that lets us see a number line.
You type in the equation and it shows you the arrows and which way it is going.
22 S: Do you remember what it is called
23 M1. Number line
24 F1. When I was first, I didn‘t know how to multiply positive and negative
numbers. Sometimes when adding or multiplying, like when they say adding 5
and they say -5 you have to change the sign so I was confused. Say it is 5 +
25 M1. Suppose -5 x , or it is an equation
26 F1. Like the 6 is negative you have to change it so you are not subtracting, you
are adding, so it makes it positive.
27 M1. If it is negative 6, instead of subtracting you add. You do the opposite of
what they are asking you to do.
28 S. Can you show me 5 – 6 or 5 + (-6) is what you have.
29 M1. She always tells us to do a story right. So you owe someone 6 dollars but you
only have 5. So you subtract, I still do the subtraction so its 6 minus 5 or 5 minus
6 which is negative one.
30 F1. Sometimes I get confused about multiplying positive and negative numbers.
The teachers showed us about pieman. Pieman goes like something like that. A
positive times a negative number , a negative and negative has to be a positive.
31 M1. I got confused on the algebra expressions because sometimes it says negative
and I thought oh, you subtract it. You have to change that to a positive because
two negative signs can‘t be together. So I just change that to a positive.
32 S. Do you guys like the number line
33 F1. I like the number line better
34 M1. I understand better with the pieman than the number line. The number line is
too long, too many numbers.
35 F1. So if you have numbers like 100, 500, it doesn‘t go all that way. +5, +5, I get
confused
36 M1. Like when a negative and a positive is a negative
37 S. How would you improve the number line activities
38 F1. Only use it for little numbers

li
39 M1. Don‘t use it for extremely large numbers. If you have hard ones, I don‘t want
to cheat and use the calculator, so maybe use pieman or try to think and figure it
out for yourself, or you could make a number line and use 100, 200 that is what I
did.
40 S. how would you do this 5 – (120)
41 F1. That would be 115 by subtracting 5 from 120
42 M1. 20 minus 5 is 15, so it is 115. Like 4 x 5 is 20, so take away a 5 is 115.
43 S. how did you know there was 100.
44 M1. I just ignored the 1 that was for 100 and subtracted 5 from 20, and then added
the one back on at the end.
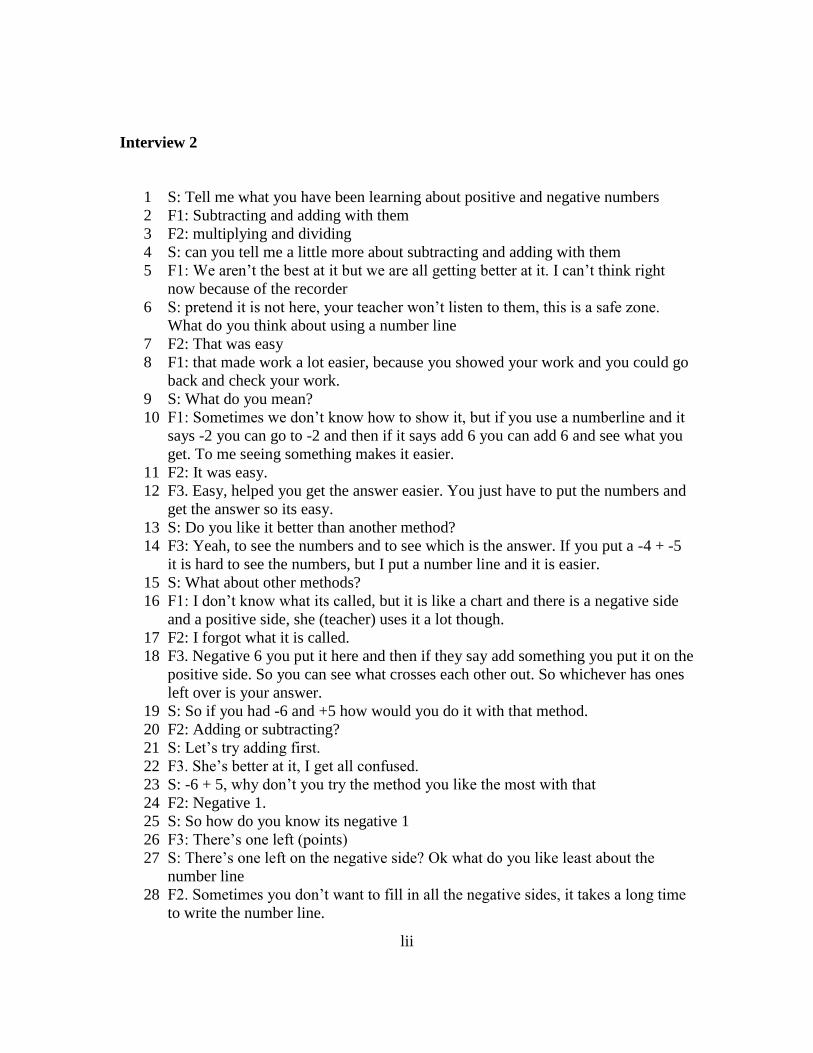
lii
Interview 2
1 S: Tell me what you have been learning about positive and negative numbers
2 F1: Subtracting and adding with them
3 F2: multiplying and dividing
4 S: can you tell me a little more about subtracting and adding with them
5 F1: We aren‘t the best at it but we are all getting better at it. I can‘t think right
now because of the recorder
6 S: pretend it is not here, your teacher won‘t listen to them, this is a safe zone.
What do you think about using a number line
7 F2: That was easy
8 F1: that made work a lot easier, because you showed your work and you could go
back and check your work.
9 S: What do you mean?
10 F1: Sometimes we don‘t know how to show it, but if you use a numberline and it
says -2 you can go to -2 and then if it says add 6 you can add 6 and see what you
get. To me seeing something makes it easier.
11 F2: It was easy.
12 F3. Easy, helped you get the answer easier. You just have to put the numbers and
get the answer so its easy.
13 S: Do you like it better than another method?
14 F3: Yeah, to see the numbers and to see which is the answer. If you put a -4 + -5
it is hard to see the numbers, but I put a number line and it is easier.
15 S: What about other methods?
16 F1: I don‘t know what its called, but it is like a chart and there is a negative side
and a positive side, she (teacher) uses it a lot though.
17 F2: I forgot what it is called.
18 F3. Negative 6 you put it here and then if they say add something you put it on the
positive side. So you can see what crosses each other out. So whichever has ones
left over is your answer.
19 S: So if you had -6 and +5 how would you do it with that method.
20 F2: Adding or subtracting?
21 S: Let‘s try adding first.
22 F3. She‘s better at it, I get all confused.
23 S: -6 + 5, why don‘t you try the method you like the most with that
24 F2: Negative 1.
25 S: So how do you know its negative 1
26 F3: There‘s one left (points)
27 S: There‘s one left on the negative side? Ok what do you like least about the
number line
28 F2. Sometimes you don‘t want to fill in all the negative sides, it takes a long time
to write the number line.

liii
29 F3. I like it, nothing bad about it.
30 S: Calculator activities graphing integers as vectors
31 F1: I don‘t like them, the way they explain it is complicated. I‘d rather show my
work on paper than use the calculator. Like when they tell you to press Y=, Zoom,
window
32 F2: On the calculator there is a lot to do. Writing takes longer. I know the
calculator is more accurate, but when she gives us the packet with all these
instructions it is confusing.
33 F3. The calculator is easy. But pressing all the buttons is confusing, pressing
delete, gets confusing.
34 S: If you had to rank the number line, the crossing out method, and the calculator
35 F1: the number line, her way (teacher), then the calculator
36 F2. The number line, then the calculator, then the teacher‘s way
37 F3. The number line, the teacher‘s way, then the calculator
38 S: suggestions to improve number line activities to make it better
39 F1: No
40 F2: Not really
41 F3: no
42 S: you said you had an issue with putting all the negative sings
43 F1: I guess you could just put a bracket with a negative above it. Because when
you are taking a test you only have a certain amount of time, so you could just put
a negative with a bracket above the number line
44 S: 5 – 12 This is not a test, we are just interested in how you think about it.
45 F1: I got a different answer so now I‘m confused.
46 S: It‘s okay if you get stuck
47 F2. Positive side and then add 12 so its going to be 17
48 F1: I just subtracted, and it went to -7 rather than 17 so now I‘m confused.
49 S: Is there anything you can do to check to see what‘s the right one
50 F1: I think its 17. If you are really just subtracting then it is -7, but if you are
adding then it is 17.
51 F3. No this way over here.
52 S: do you want to try it another way, we don‘t have a calculator which is your
second favorite.
53 F3. It‘s 17.
54 F1. That way (teacher way) is confusing to me. It‘s -7 (uses cell phone)
55 F1. I was right, okay, I‘m not confused anymore. I just looked at 5 and subtracted
12 and got -7.

liv
Interview 3
1 S: So tell me what you have been learning about positive and negative numbers
2 M1: we‘ve just been learning to multiply, add, subtract, divide.
3 S: how were you doing that
4 F1: with a pencil, your mind, with the numbers, the teacher helps us
5 M1: I understand it, its‘ pretty easy. The teacher explained it more better than our
middle school teacher.
6 S: Did you like the number line
7 F1: putting on the negative numbers and positive
8 F2: She is saying that, but you know how the negative numbers are here and the
positive numbers are here and you have to count backwards.
9 S: Can you show me an example. What did you like most about that method
10 F1: everything.
11 S: Is there anything you didn‘t like
12 M1: I didn‘t like the number line. -3 + 10 - #, you have to keep going back and
forth and back and forth . -3 , 1,2,3,4,5,6,7,8,9, 10. Seven.
13 S: Can you write out in a number sentence what you mean.
14 M1. I get this, but I don‘t like using that method. That little think shows these two
will be negative and these two will be positive, so if you have a -3 and a – 26 you
put those two together and add so it will be 3 + 26 you take those two negatives
and put them as positive.
15 S: Can you show me how you would do this one with that method
16 M1: negative and a positive, 3 and -10 so it will be negative unless the number is
big, so it would be a negative 7, but since 3 is less than 10 it will be positive.
17 S: What is your favorite thing? What about the graphing calculator activities
where you graph the integers as vectors
18 F1: I don‘t know.
19 S: What was one of your favorite activities or methods for solving the problems
20 F1: (speaks to friend in Spanish). I don‘t know how to start
21 F2: look at patterns, find 1 go to that 1
22 M1: not the patterns we‘re talking about negatives
23 F2: okay never mind.
24 F1: add and multiply, you know the one we were doing with x, 4 + -2 and you
have to cross it out. 1 ,2, 3, 4, put the positives here and negatives here and get the
answer. 4 x 3 = 1, 2, 3, 4, and that‘s 12.
+ + + +
+ + + +
+ + + +
25 M1. Since this is a row, this is three positives
26 F1. No you don‘t do that, first you do the negatives then you do the positives
27 M1. Oh the opposites
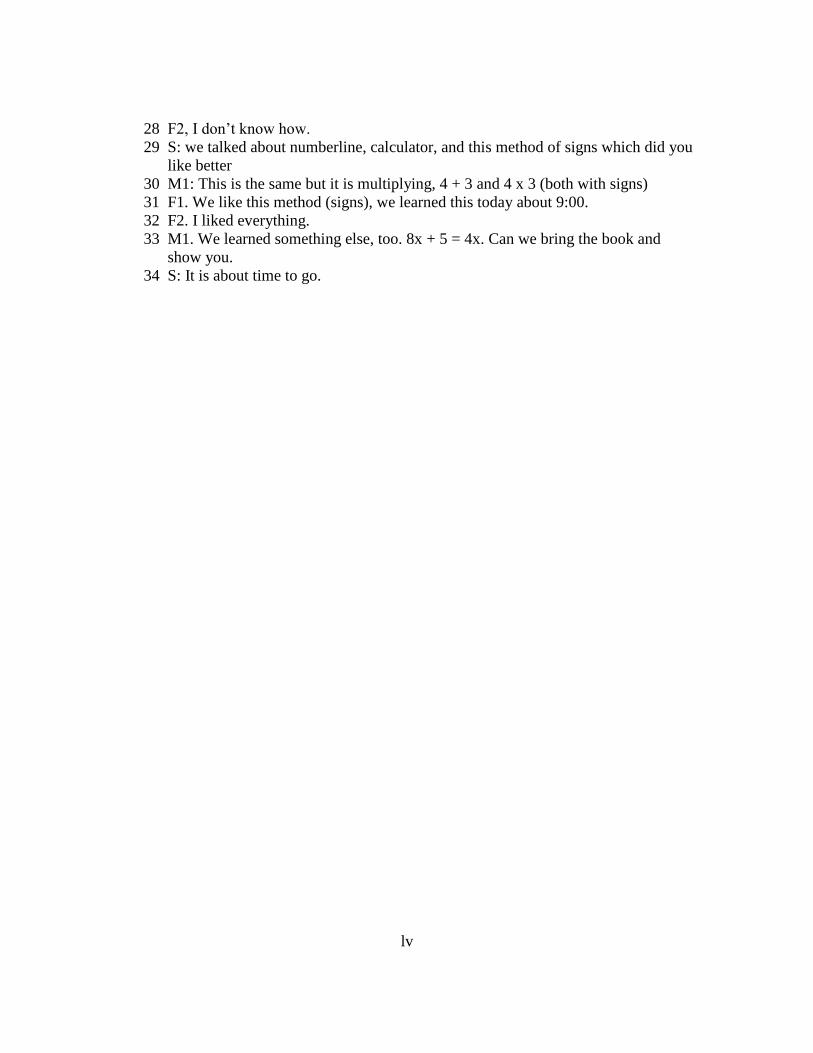
lv
28 F2, I don‘t know how.
29 S: we talked about numberline, calculator, and this method of signs which did you
like better
30 M1: This is the same but it is multiplying, 4 + 3 and 4 x 3 (both with signs)
31 F1. We like this method (signs), we learned this today about 9:00.
32 F2. I liked everything.
33 M1. We learned something else, too. 8x + 5 = 4x. Can we bring the book and
show you.
34 S: It is about time to go.

lvi
Interview 4
1 S: Tell me a little bit about the positive and negative numbers activities you‘ve
been doing in class
2 M1. How a negative times a negative and stuff like that, how a positive and a
negative react to each other. How they work.
3 S: can you show me or describe it
4 M1. -5 x 3, you can do 3 rows of or 5 rows or 3 rows of -5 and then that will equal
-15 but if you turn it the other way around it will be a positive 15.
5 F1. You turn it 3 x -5
6 M1. +3 x -5 would equal +15 because a positive times a negative,
7 F1. A Positive times a negative equals a positive and a negative times a positive is
a negative
8 M1. No a negative times a negative is a positive and a positive times a positive is
a positive.
9 (writes out rules)
10 (Interruption – class going out to computer lab, noisy)
11 S: How did you come up with yours.
12 M1. A negative times a positive is a negative, a positive times a negative is a
negative,
13 F1. A negative times a negative is a positive, and a negative times a positive is a
negative
14 M1. And two negatives times a negative is a positive.
15 S: how would that help you on this problem
16 M1. A positive times a negative is a negative 3 x -5 = -15
17 S: Tell me what you liked most about using a number line
18 M1: It helps us if it is decimals it helps me.
19 S: What do you mean
20 M1. Like point, say there are ten lines, this is .10 and this is -.10 out of a whole.
If there were only 5 lines it would be .20 and -.20.
21 S: So how would you solve a problem using this
22 F1. Like -25 – 5, so this is negative side and this is the positive side, so it is like
you owe someone 25 dollars. Then you are asking for 5 more so you are going to
add it up, so it is negative 30.
23 M1. But if you subtract it , it goes more to the
24 F1. When you are adding you go to the positive side, when you are subtracting
you go to this side.
25 F1. -25 – 5 equal -20.
26 M1. That one is -20 and that one is -30. Hers says I owe you -25 but now you
don‘t have to owe me 5 of the dollars. Mine says I‘ve been buying you lunch so
you owe me 25 dollars and now today you borrowed another 5 so now you owe
me 30 dollars.

lvii
27 S: you explained it differently.
28 F1. If you have 25 and you take away 5 you are still asking for more. So you can
be taking away, it depends on this number, if it is negative 5 you are going to go
this way, you are going to subtract more, if it is positive 5 you are taking away so
you are going to the positive side.
29 S: So you are getting different answers. Is there another method you could use to
check
30 M1: Calculator
31 S: pushing the numbers or like you did in the class
32 F1. If you got a different answer, the negative sign has to be in the right spot in a
calculator or we still could get different answers.
33 S: Which did you like better
34 F1: I liked the face for the negative times a negative
35 M1: the number line for adding and subtracting
36 F1: For adding and subtracting the number line
37 M1. For positive and negative fractions I turned it into a decimal. Percents are the
same as decimals. Once you turn a fraction into a decimal you can see how much
to take out
38 S: Suggestions for improving number line activity
39 M1: Do more fractions to help people who have problems. Make papers for that
person who is having trouble with fractions. Everyone has the same paper but
different signs.
40 F1. I liked them, I like the way it works, it helps to find the difference of
negatives and positives, also to find what is bigger like -5 and -25, we use which
one is closer to zero.
41 M1. It can help you find the range, the difference of a number, what is in between.
42 S: 5-12
43 M1. I wouldn‘t use a number line, I would just subtract, since you can‘t do it, it
goes into the negative.
44 S: what do you mean you can‘t do it
45 M1. I have to use a number line. You are at 5 and you take away 12,
1,2,3,4,5,6……12 so it would be right here, at -7.
46 S: You also got -7 by just using numbers.
47 M1. I solve with just regular numbers and explain with the number line
48 F1. I flip it, 12 – 5 and the difference is 7. I find out which is bigger, 12 is bigger,
5 is positive, I have to take more than 5 so I have to go to the negative side. So I
have to take 5 and 7 more which is 12 and I end up in the negative side which is -
7.

lviii
References
America's Choice (2009). Mathematics navigator: Positive and negative numbers.
Washington, D.C.: America's Choice.
Anctil, P.D. (2002). Walking on the number line: Teaching students how to add and
subtract integers using computer-assisted instruction. Masters Thesis, California
State University Dominquez Hills. Ann Arbor, MI: ProQuest Information and
Learning Company.
Anderson, C. W. (1989). The role of education in the academic disciplines in teacher
education. In A. Woolfolk (Ed.), Research perspectives on the graduate
preparation of teachers. Englewood Cliffs, NJ: Prentice Hall.
An, S., Kulm,G., & Wu, Z. (2004). The pedagogical content knowledge of middle school
mathematics teachers in China and the U.S, Journal of Mathematics Teacher
Education, 7(2); 145-172. Netherlands: Springer.
Bakhtin, M. (1986). Speech genres and other late essays. Austin, TX: University of
Texas Press.
Ball, D. L. (1990). The mathematical understandings that prospective teachers bring to
teacher education. The Elementary School Journal, 90, 449-466.
Ball, D.L. & Cohen, D.K. (1999). Developing practice, developing practitioners: Toward
a practice-based theory of professional education. In L. Darling-Hanmond & G.
Sykes (Eds.), Teaching as the learning profession: Handbook of policy and
practice (pp.3-32). San Francisco: Jossey-Bass.
Ball, D.L., Lewis, J., Thames, M.H. (2008). Making mathematics work in school. Journal
for Research in Mathematics Education, 14, 13-44.
Ball, D.L., Thames, M.H., & Phelps, G. (2008). Content knowledge for teaching: What
makes it special? Journal of Teacher Education, 59(5), 389-407.
Ball, D.L., Hill, H. (2009). The curious - and crucial - case of mathematical knowledge
for teaching. Phi Delta Kappan, 91(2), 68-71.

lix
Baroody, A. J., & Coslick, R. T. (1998). Fostering children's mathematical power: An
investigative approach to K-8 mathematics instruction. Mahwah, NJ: Lawrence
Erlbaum Associates.
Borko, H. (2004). Professional development and teacher learning: Mapping the terrain.
Educational Researcher, 33(8), 3-15.
Borko, H., & Putnam, R. (1996). Learning to teach. In D. Berliner & R. Calfee (Eds.),
Handbook of educational psychology (pp. 673-708). New York, NY: Macmillan.
Browning, C. A., & John, D. S. (1999). Walking the Line: Activities for the TI-73 Number
Line. Dallas, TX: Texas Instruments.
Bruno, A., & Martinon, A. (1999). The teaching of numerical extensions: the case of
negative numbers. International Journal of Mathematical Education in Science &
Technology, 30(6), 789-809.
Burton, L. (2006). Using visual algebra pieces to model algebraic expressions and solve
equations Retrieved, from http://www.authorstream.com/Presentation/
aSGuest800-94834-visual-science-technology-ppt-powerpoint/
Carpenter, T. P., Fennema, E., Peterson, P. L., Chiang, C. P., & Loef, M. (1989). Using
knowledge of children's matheamtics thinking in classroom teaching: An
experimental study. American Educational Research Journal, 26(4), 499-531.
Carr, K., & Katterns, B. (1984). Does the number line help? Mathematics in School,
13(4), 30 - 34.
Cemen, P. B. (1993). Teacher to teacher: Adding and subtracting integers on the number
line. Arithmetic Teacher, 40(7), 388-389.
Chiu, M. M. (2001). Using metaphors to understand and solve arithmetic problems:
Novices and experts working with negative numbers. Mathematical Thinking and
Learning, 3(2 & 3), 93-124.
Cohen, D. K., & Ball, D. L. (1999). Instruction, capacity, and improvement (No. CPRE
Research Report Series, RR-43). Philadelphia, PA: University of Pennsylvania,
Consortium for Policy Research in Education.
lx
Cobb, P., Stephan, M., McClain, K., & Gravemeijer, K. (2001). Participating in
classroom mathematical practices. The Journal of Learning Sciences, 10(1/2),
113-163.
Colthorp, F.L. (1968). A comparison of the effectivenes of an abstract and a concrete
approach in teaching of integers to sixth grade students. Doctoral Dissertation,
Oklahoma State University.
Dahl, R. (1972). Charlie and the great glass elevator. New York, NY: Knopf.
Darling-Hammond, L. (1999). Teacher quality and student achievement: A review of
state policy evidence.University of Washington, Seattle, WA: Center for the
Study of Teaching and Policy.
Davidson, P.M. (1987). How should non-positive integers be introduced in elementary
mathematics? Proceedings of the International Group for the Psychology of
Mathematics Education, 11, 430-436.
Davidson, P. M. (1992). Precursors of non-positive integer concepts. Biennial Meeting of
the Society for Research in Child Development. Baltimore, MD; April 1987.
Retrieved from http://www.eric.ed.gov/ERICWebPortal/custom/portlets/record
Details/detailmini.jsp?_nfpb=true&_&ERICExtSearch_SearchValue_0=ED35614
6&ERICExtSearch_SearchType_0=eric_accno&accno=ED356146.doi:ED356146
Davis, R. B. (1967). Explorations in mathematics: A text for teachers. Palo Alto:
Addison-Wesley.
Dryden, M. & Fraser, B.J. (1996). Use of classroom environment instruments in
monitoring urban systemic reform. Paper presented at the annual meeting of
theAmerican Educational Research Association, New York, April 1996.
Dryden, M. & Fraser, B.J. (1998). Awareness versus acceptance of systemic change
among secondary science teachers. Paper presented at the annual meeting
of the National Association for Research in Science Teaching, San Diego, CA.
Enyedy, N. (2003). Knowledge construction and collective practice: At the instersection
of learning, talk and social configurations in a computer-mediated mathematics
classroom. The Journal of the Learning Science, 12(3), 361-407.
lxi
Faulk, R. (2007). Using a money-based discipline or reward system in an elementary
classroom. In R. Stone (Ed.), Best practices for teaching mathematics: What
award-winning classroom teachers do (pp. 1-6). Thousand Oaks, CA: Corwin
Press.
Fennema, E. & Franke, M. (1992). Teachers‘ knowledge and its impact in: D.A. Grouws
(Ed)Handbook of Research on Mathematics Teaching and Learning (pp.147-516)
New York, NY: Macmillan Publishing.
Fischbein, E. (1987). Intuition in Science and Mathematics: An Educational Approach.
Dordrecht, Holland: D. Reidel Publishing.
Fischbein, E. (1994). The irrational numbers and the corresponding epistemological
obstacles. Paper presented at the Proceedings of the XVIII PME, Lisbon,
Portugal.
Francisco, J. M. & Maher, C.A. (2005). Conditions for promoting reasoning in problem
solving: Insights from a longitudinal study. Journal of Mathematical Behavior,
24, 361-372.
Froman, R. (1973). Less than nothing is really something. New York, NY: Ty Crowell.
Garet, M., Porter, A. C., Desimone, L., Birman, B., & Yoon, K. S. (2001). What makes
professional development effective? Results from a national sample of teachers.
American Education Research Journal, 38(4), 915-945.
Goos, M. (2004). Learning mathematics in a classroom community of inquiry. Journal
for Research in Mathematics Education, 35(4), 258-291.
Grouws, D. & Schultz, K. (1996). Mathematics teacher education. In J. Sikula (Ed.)
Handbook of research on teacher education, (2nd edition). New York, NY:
Macmillan.
Hackbarth, M. (2000). A comparison of the effectivenss in teaching the addition and
subtraction of integers using manipulatives versus rules to seventh grade
students. Masters Thesis, California State University of Dominquez Hills. Ann
Arbor, MI: Bell & Howell Infomration and Learning Company.

lxii
Harris, D. N., & Sass, T. R. (2007). Teacher training, teacher quality, and student
achievement. (Working Paper No. 3). Washington, DC: National Center for
Analysis of Data in Education Research. Retrieved October 4, 2010,
fromhttp://www.caldercenter.org/PDF/1001059_Teacher_Training.pdf
Harvey, A. A., & Cunningham, V. (1980). The integers test. Unpublished Masters thesis,
Concordia University, Montreal, Quebec, Canada.
Hativa, N. & Cohen, D. (1995). Self Learning of Negative Number Concepts by Lower Division
Elementary Students Through Solving Computer-Provided Numerical Problems.
Educational Studies in Mathematics, 28, 401-431.
Hayes, B., & Stacey, K. (1999, July). Teaching negative number using integer tiles. In Proceedings
of the 22nd Annual Conference of the Mathematics Education Research Group of
Australasia (MERGA), Adelaide, Australia.
Hiebert, J. (1999). Relationships between research and the NCTM standards. Journal for
Research in Mathematics Education, 30(1), 3-19.
Hill, H.C. & Ball, D.L.(2004). Learning mathematics for teaching: Results from
California's Mathematics Professional Development Insitutes. Journal of
Research in Mathematics Education35, 5 (November 2004), 330-351.
Janvier, C. (1983). The understanding of directed numbers. Paper presented at the 8th
International Conference for the Psychology of Mathematics Education.
Janvier, C. (1985). Comparison of models aimed at teaching signed integers. Paper
presented at the 9th International Conference for the Psychology of Mathematics
Education.
Johnson, B. & McClure, R. (2004). Validity and reliability of a shortened, revised version
of the constructivist learning environment survey (CLES). Learning
Environments Research . 7(1), 65-80.
Kalu, N. O. (2006). Working with integers: Addition and subtraction. Masters Thesis,
California State University Dominguez Hills. Ann Arbor, MI: ProQuest
Information and Learning Company.
lxiii
Kennedy, M. (1998). Form and substance of inservice teacher education (Research
Monograph No. 13 ed.). Madison, WI: University of Wisconsin-Madison,
National Institute for Science Education.
Kent, L. B. (2000). Connecting Integers to Meaningful Contexts. Mathematics Teaching in the
Middle School, 6, 62-66.
Kenyon, L. O., Kuhn, L., & Reiser, B. J. (2006). Using students' epistemologies of
science to guide the practice of argumentation. In S. Barab, K. Hay & D. Hickey
(Eds.), Proceedings of the seventh international conference of the learning
sciences (pp. 321-327). Mahwah, NJ: Lawrence Erlbaum.
Krueger, R. (1988). Developing questions for focus groups. Thousand Oaks, CA: Sage.
Krueger, R., & Casey, M. A. (2000). Focus groups: A practical guide for applied
research. Thousand Oaks, CA: Sage.
Kuhn, L., Kenyon, L. O., & Reiser, B. J. (2006). Fostering scientific argumentation by
creating a need for students to attend to each other's claims and evidence. In S.
Barab, K. Hay & D. Hickey (Eds.), Proceedings of the seventh international
conference of the learning sciences (pp. 370-375). Mahwah, NJ: Lawrence
Erlbaum.
LeFevre, D. M. (2004). Designing for teacher learning: Video-based curriculum design.
In J. Brophy (Ed.), Using video in teacher education: Advances in reearch on
teaching (Vol. 10, pp. 235-258). London, UK: Elsevier.
Lesh, R., Lester, F. K. J., & Hjalmarson, M. (2003). A models and modeling perspective
on metacognitive functioning in everyday situations where problem solvers
develop mathematical constructs. In R. Lesh & H. Doerr (Eds.), Beyond
constructivism: Models and modeling perspectives on mathematics problem
solving, learning, and teaching. Mahwah, NJ: Lawrence Erlbaum Associates.
Liebeck, P. (1990). Scores and forfeits, and intuitive model for integers. Educational Studies in
Mathematics, 21, 221-239.

lxiv
Linchevski, L., & Williams, J. (1999). Using intuition from everyday life in "filling" the
gap in children's extension of their number concept to include the negative
numbers. Educational Studies in Mathematics, 39(1-3), 131-147.
Little, J.W. (1993). Teachers' professional development in a climate of educational
reform. Educational Evaluation and Policy Analysis, 15, 129-151.
Loucks-Horsley, S., Stiles, K. E., Mundry, S., Love, N., & Hewson, P. W. (2010).
Designing professional development for teachers of science and mathematics, 3rd
Edition. Thousand Oaks, CA: Corwin Press
Luth, L. M. (1967). A model for arithmetic of signed numbers. The Arithmetic Teacher,
14 (3), 220-222.
Maher, C. A. (2005). How students structure their investigations and learn mathematics:
Insights from a long-term study. The Journal of Mathematical Behavior, 24(1), 1-
14.Maher & Martino (1996).
Maher, C.A. & Martino, A. M. (1996). The development of the idea of mathematical
proof: A 5-year study. In F. Lester (Ed.), Journal for Research in Mathematics
Education, 27(2), 194-214.
Math Learning Center (2009). Algebra Pieces Retrieved from
http://www.mathlearningcenter.org/store/product-algebra-924045.htm
McCorkle, K. (2001). Relational and instrumental learning when teaching the addition
and subtraction of positive and negative integers. Masters thesis, California State
University Dominques Hills. AnnArbor, MI: Bell & Howell Information and
Learning Company.
McCrone, S. S. (2005). The development of mathematical discussions: An investigation
in a fifth-grade classroom. Mathematical Thinking and Learning, 7(2), 111-133.
McDiarmid, G. W. (1995). Realizing new learning for all students: A framework for the
professional development of Kentucky teachers. East Lansing, MI: National
Center for Research on Teacher Learning.

lxv
McDiarmid, G. W., Ball, D. L., & Anderson, C. W. (1989). Why staying ahead one
chapter just won't work: Subject-specific pedagogy. In M. C. Reynolds (Ed.),
Knowledge base for the beginning teacher (pp. 193-205). New York, NY:
Pergamon Press.
Mertens, D. M. (2005). Research and evaluationin education and psychology:
Integrating diversity with quantitative, qualitative, and mixed methods (2nd ed.).
Thousand Oaks, CA: SAGE Publications.
MiltonBradley (1982). Pac-Man card game Retrieved from
http://www.boardgamegeek.com/boardgame/4951/pac-man-card-game
Moses, R. P., Kamii, M., Swap, S. M., & Howard, J. (1989). The Algebra Project:
Organizing in the spirit of Ella. Harvard Educational Review, 59, 423 - 443.
Moreno, R., & Mayer, R. E. (1999). Multimedia-supported metaphors for meaning making in
mathematics. Cognition and Instruction, 17, 215-248.
Mueller, M. (2007). A study of the development of reasoning in sixth grade students. Unpublished
doctoral dissertation. Rutgers, The State University of New Jersey, New Brunswick
University.
Mundry, S. & Loucks-Horsley, S. (1999). Designing effective professional development: Decision
points and dilemmas. National Institute for Science Education Brief, 3(1). Madison:
University of Wisconsin, National Institute for Science Education. Retrieved on 10/9/2010
from http://www.wcer.wisc.edu/archive/nise/publications/Briefs/Vol_3_No_1/Vol.3,
No.1.pdf.
Mueller, M. and Maher, C. (2009). Learning to reason in an informal math after-school program.
Mathematics Education Research Journal, 21(3), 7-35.
National Council of Teachers of Mathematics (1989). Curriculum and evaluation standards for
school mathematics. Reston, VA: The Council.
National Council of Teachers of Mathematics (2000). Principles and standards for
school mathematics. Reston: National Council of Teachers of Mathematics.
National Council of Teachers of Mathematics (2009). A teacher's guide to reasoning and sense
lxvi
making. Focus in high school mathematics: Reasoning and Sense Making. Reston, VA: The
Council, available at http://www.nctm.org/uploadedFiles/Math_Standards/Teacher_
Guide_FHSM.pdf.
Nunes, T., Schliemann, A. D., & Carraher, D. W. (1993). Street mathematics and school
mathematics. New York, NY: Cambridge University Press.
Page, D. A. (1964). Number lines, functions, and fundamental topics. New York:
Macmillan.
Partnership for 21st Century Skills. (2008). 21
st century skills, education, &
competitiveness: A resource and policy guide. Tucson, AZ: Author.
Raudenbush, S.W. & Bryk, A.S. (2002). Hierarchical linear models: Applications and
data analysis methods, 2nd
ed. Thousand Oaks, CA: Sage Publications.
Remillard, J. T., & Geist, P. (2002). Supporting teachers' professional learning through
navigating openings in the curriculum. Journal of Mathematics Teacher
Education, 5, 7-34.
Ryan, J., & Williams, J. (2007). Children's mathematics 4-15: Learning from errors and
misconceptions. Maidenhead, UK: Open University Press.
Schwarz, B. B., Kohn, A. S., & Resnick, L. B. (1993/1994). Positives about negatives: A
case study of an intermediate model for signed numbers. Journal of the Learning
Sciences, 3(1), 37.
Sheffield, L. J., & Cruikshank, D. E. (2001). Teaching and learning elementary and
middle school mathematics. New York, NY: John Wiley & Sons.
Schiffrin, D. (1994). Approaches to discourse. Malden, MA: Blackwell Publishing.
Shulman, L. (1986). Those who understand: knowledge growth in teachers. Educational
Researcher, 15(2), 4-14.
Shulman, L. S. (1987). Knowledge and teaching: Foundations for the new reform.
Harvard Educational Review, 57 (1), 1-22.

lxvii
Shulman, L.S. (1995). Those who understand: knowledge growth in teaching. In B. Moon &
A.S. Mayes (Eds) Teaching and Learning in the Secondary School. London, UK:
Routledge.
Sloan, H. A. (1993). Direct instruction in fourth and fifth grade clasrooms. Dissertation
Abstracts International, 54(08), 2837A. (UMI No.9334424)
Steiner, C.J. (2009). A study of pre-service elementary teachers' conceptual
understanding of integers. Dissertation, Kent State University. Ann Arbor, MI:
ProQuest LLC.
Stigler, J. W., & Hiebert, J. (1999). The teaching gap: Best ideas from the world's
teachers for improving education in the classroom. New York, NY: Free Press.
Streefland, L. (1996). Negative numbers: reflections of a learning researcher. Journal of
Mathematical Behavior, 15(1), 57-77.
Stylianides, A. J. (2007). Proof and proving in school mathematics. Journal for Research
in Mathematics Education, 38, 289-321
Taylor, P.C., Fraser, B.J., Fisher, D.L. (1997). Monitoring constructivist classroom
learning environments. International Journal of Educational Research, 27(4), 293-
302.
Taylor, P.C., Fraser, B.J., & White L. R. (1994). CLES: An instrument for monitoring the
development of constructivist learning environments, National Key Centre for
School Science and Mathematics, Curtin University, Australia, paper presented at
the annual meeting of the American Educational Research Association, New
Orleans, April 1994.
Thompson, C.L., & Zeuli, J.S. (1999). The frame and the tapestry: Standards-based
reform and professional development. In L.Darling-Hammond & G. Sykes (Eds.),
Teaching as the learning profession: Handbook of policy and practice, (pp.341-
375). San Francisco: Jossey-Bass.
Thompson, P. W., & Dreyfus, T. (1988). Integers as transformations. Journal for
Research in Mathematics Education, 19(2), 115-133.

lxviii
Toulmin, S. (1958). The uses of argument. Cambridge, England: Cambridge University
Press.
Turnuklu, E.B.&Yesildere, S. (2007). The pedagogical content knowledge in mathematics: Pre-service
primary mathematics teachers' perspectives in Turkey. Issues in the Undergraduate
Mathematics Preparation of School Teachers, 1 (2007), 1-13
UtahState (2008). National library of virtual manipulatives Retrieved from
http://nlvm.usu.edu/en/nav/vLibrary.html
VanDeWalle, J. A., & Lovin, L. H. (2006). Teaching student-centered mathematics:
Grades 5-8. Boston: Pearson Allyn & Bacon.
Varma, S., Harris, S., Schwartz, D., & Martin, T. (2008) The development of the integer concept: A
cross-sectional study. Paper presented at the 2009 Annual Meeting of the American
Educational Research Association, San Diego, CA.
Vlassis, J. (2004). Making sense of the minus sign or becoming flexible in 'negativity'.
Learning & Instruction, 14(2004), 469-484.
Weiss, I.R., Matti, M.C., & Smith, P.S. (1994). Report of the 1993 Survey of Science and
Mathematics Education. Chapel Hill, NC: Horizon Research, Inc.
Weiss, I. R. (1997). The status of science and mathematics teaching in the United States.
National Institute for Science Education Brief, 1(3), 1-8, retrieved on October 9,
2010 from http://www.wceruw.com/archive/nise/Publications/Briefs/
Vol_1_No_3/NISE_Brief_Vol_1_No_3.pdf.
Wilkins, J. R. (1996). Students' use of informal strategies and representation in solving
addition and subtraction integer problems. Unpublished Dissertation, University
of California at Los Angeles, Los Angeles.
Williams, J., Wo, L., & Lewis, S. (2005). Mathematics assessment for learning and
teaching: an overview of the age of standardisation model ages 5-to 14-years.
Paper presented at the Conference of the British Society for Research into
Learning Mathematics, St. Martin's College, Lancaster, UK, November 2005.
Williams, J. S., & Linchevski, L. (1997). Situated intuitions, concrete manipulations and the

lxix
construction of the integers: comparing two experiments. Paper presented at the
1997Annual Meeting of the American Educational Research Association, Chicago, IL.
Yackel, E., & Cobb, P. (1996). Sociomathematical norms, argumentation, and autonomy
in mathematics. Journal for Research in Mathematics Education, 27, 458-477.
Yackel, E., & Hanna, G. (2003). Reasoning and proof. In J. W. Kilpatrick, G. Martin, & D. Schifter
(Eds.), A research companion to principles and standards for school mathematics (pp. 227-
236). Reston, VA: National Council of Teachers of Mathematics.

lxx
VITA
Sarah Jane Harris was born in Colorado Springs, Colorado on November 19, 1969
She grew up in Oakland, California with her parents Margie and Ken Harris and three
younger siblings, Mary, Joel, and Timothy. After graduating from Shiloh Christian High
School in 1987, she attended California State University East Bay in Hayward,
California. She graduated in 1998 with a Bachelor of Science in Mathematics and a
secondary teaching certificate. Sarah taught middle school math, science, and reading and
high mathematics and Special Education in California for 10 years and in Texas for 5
years. In 1994 she began working on her Master‘s in Education at Holy Names
University in Oakland, California where she graduated in 1998 with a Masters of
Education with a focus on Urban Education Reform. In 2004, she entered the PhD
program in Mathematics Education at The University of Texas at Austin.
Permanent address: 135 Agency Oaks, San Antonio, TX 78249
This dissertation was typed by the author