copyright by shixuan yang 2016
TRANSCRIPT

Copyright
by
Shixuan Yang
2016
The Dissertation Committee for Shixuan Yang Certifies that this is the approved
version of the following dissertation:
Mechanics and Applications of Stretchable Serpentine Structures
Committee:
Nanshu Lu, Supervisor
K. Ravi-Chandar
Kenneth M. Liechti
Rui Huang
Nan Sun

Mechanics and Applications of Stretchable Serpentine Structures
by
Shixuan Yang, B.E.
Dissertation
Presented to the Faculty of the Graduate School of
The University of Texas at Austin
in Partial Fulfillment
of the Requirements
for the Degree of
Doctor of Philosophy
The University of Texas at Austin
May, 2016

Dedication
Dedicated to my family

v
Acknowledgements
I would like to express the deepest appreciation to my advisor and mentor, Professor
Nanshu Lu. I’m indebted to Dr. Lu for her invaluable guidance and support on both my
research and personal life through the five years of graduate school. Dr. Lu’s strong
expertise in biointegrated electronics, perceptive insights into problems and creative
thoughts always enlighten my research towards “the” direction. Her genuineness for people
and endless enthusiasm for research have set a high standard which constantly drove me to
be a better person. Without her selfless mentoring and unflinching trust, this thesis would
not have been possible.
I’m grateful to the collaborations with the research groups of Dr. Deji Akinwande,
Dr. Dae-Hyeong Kim, Dr. Nan Sun, Dr. Dean Neikirk and Dr. David Schnyer. The
thoughtful inputs from our collaborators have greatly expedited this work to its
accomplishment.
Deep appreciation goes to my committee members, Dr. K. Ravi-Chandar, Dr.
Kenneth M. Liechti, Dr. Rui Huang and Dr. Nan Sun, for having taken the time to guide
me through various stages of this research. Their interest and guidance in this project make
me feel confident and have the courage to carry on the work till the end.
I appreciate the opportunities to take classes from Dr. Stelios Kyriakides, Dr.
Leszek F. Demkowicz, Dr. Gregory J. Rodin, Dr. Mark E. Mear, Dr. Chad M. Landis and
Dr. Loukas Kallivokas. Their vast knowledge in and devotion to their own fields set good
examples for me on how to be an excellent researcher.
I would also like to convey thanks to the financial support from National Science
Foundation under Grant Nos. CMMI-1301335 and ECCS-1509767, as well as Cooperative
Agreement EEC-1160494, and the partially support from Air Force Office of Scientific

vi
Research under Grant No. FA9550-15-1-0112.
Thanks to the group members who have shared meaningful discussions with me,
and who are always there ready to offer their hands to me. I’m greatly honored to witness
the growth of this group from seed to bloom and meet so many talented researchers who
are determined to bring us a brighter future through their persistence and perseverance.
Special thanks to my friends who have shared their time with me so that I could
enjoy joyful life after research. My life will be a lot more difficult without their company
and encouragement.
I would like to express my deepest love to my parents and parents-in-law. Thanks
for bringing me and my beloved into this wonderful world and giving us the confidence to
choose who we want to be. I feel so blessed being immersed in this unconditional love
which makes me strong and fearless.
Finally, I would like to thank Ruyi Yang, my friend, my valentine, my darling and
my soul mate. Thanks for your incredible patience during our first 2-year long-distance
relationship and the courage and determination you showed me moving to Austin and
keeping me company. You must have lived through countless difficulties along the way,
most of which I’m even not aware of and hard to imagine, but you always show me your
support without any complaints. I’m so blessed to have you around me and share all the
joys and tears in life with me. You are the endless source of love and courage that give me
the reason and guts to face any struggles in my life. I would like to put my arms around
you and share the rest of my life with you.

vii
Mechanics and Applications of Stretchable Serpentine Structures
Shixuan Yang, Ph.D.
The University of Texas at Austin, 2016
Supervisor: Nanshu Lu
Stretchable structures have been developed for various applications, including
expandable coronary stents, deployable sensor networks and stretchable bio-mimetic and
bio-integrated electronics. High-performance, stretchable electronics have to utilize high-
quality and long-lasting inorganic electronic materials such as silicon, oxide dielectrics and
metals, which are intrinsically stiff and often brittle. It is therefore an interdisciplinary
challenge to make inorganic electronics stretchable while retaining their electronic
functionality. Patterning stiff materials into serpentine-shaped wavy ribbons has become a
popular strategy for fabricating stretchable inorganic electronics. However, due to the lack
of mechanics understanding, design of serpentine structures is still largely empirical,
whether for freestanding or substrate supported serpentines. This dissertation
systematically investigates the mechanics of serpentine structures with emphasis on the
effects of serpentine geometry and substrate stiffness, which involves theoretical analysis,
numerical simulation, and experimental validation. Our theory has successfully predicted
the stretchability and stiffness of various serpentine shapes and has been applied to the
optimization of serpentine designs under practical constraints. We also find that not all
geometric effects are monotonic and serpentines are not always more stretchable than linear
ribbons. To manufacture high quality stretchable devices with high throughput and low

viii
cost, we have invented a “cut-and-paste” method to fabricate both metallic and ceramic
serpentines. As a demonstration of our method, a noninvasive, tattoo-like multifunctional
epidermal sensor system has been built for the measurement of electrophysiological
signals, skin temperature, skin hydration, and respiratory rate. Engineering of epidermal
stretchable antenna for wireless communication is also detailed and rationalized.

ix
Table of Contents
List of Tables………………………………………………..……..………...…………XII
List of Figures…………………………..…………………...………………..………XIII
Chapter 1 Introduction .............................................................................................. 1
1.1 Background ......................................................................................................................2
1.1.1 Flexible Electronics ....................................................................................................................2
1.1.2 Stretchable Electronics ...............................................................................................................3
1.1.3 Bio-Integrated Electronics ..........................................................................................................6
1.2 Motivation ......................................................................................................................10
1.3 Scope of research ...........................................................................................................10
Chapter 2 Freestanding Serpentines, ...................................................................... 12
2.1 Objective and introduction ...........................................................................................13
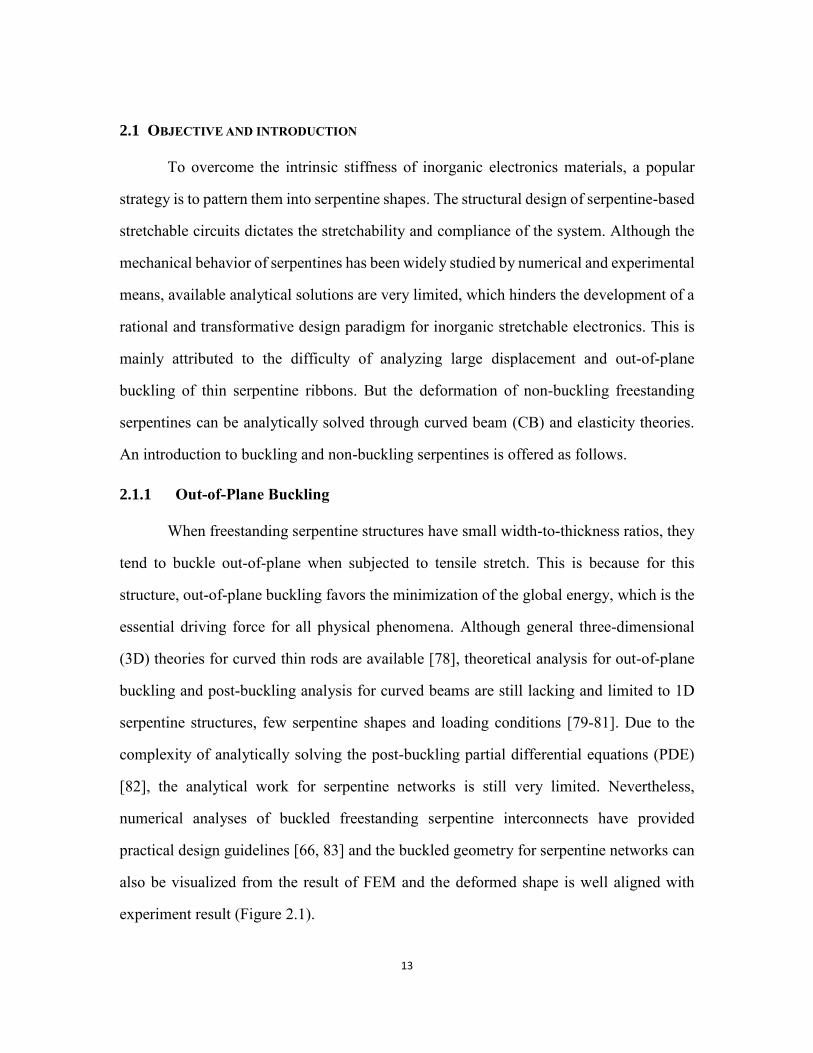
2.1.1 Out-of-Plane Buckling .............................................................................................................. 13
2.1.2 In-Plane Rigid Body Rotation .................................................................................................. 15
2.2 Problem description ......................................................................................................16
2.3 Analytical modeling and simulation ............................................................................20
2.3.1 Curved Beam (CB) Theory Solution ........................................................................................ 20
2.3.2 Elasticity Solution ..................................................................................................................... 24
2.3.3 FEM Approach ......................................................................................................................... 28
2.3.4 Comparison of CB and Elasticity Solutions ............................................................................. 28
2.4 Experiments ...................................................................................................................31
2.5 Results ............................................................................................................................33
2.5.1 Shape Effect on Stretchability and Stiffness ............................................................................. 33
2.5.2 Optimized Serpentine Shape ..................................................................................................... 36
2.6 Discussions .....................................................................................................................38
2.7 Chapter summary .........................................................................................................40
Chapter 3 Substrate-Supported Serpentines, ......................................................... 41
3.1 Objective and overview .................................................................................................42
3.2 Fabrication .....................................................................................................................44
3.2.1 Serpentine on Kapton ............................................................................................................... 44

x
3.2.2 Serpentine on Tegaderm ........................................................................................................... 46
3.3 Methods ..........................................................................................................................50
3.3.1 Electrical Resistance Measurement .......................................................................................... 50
3.3.2 SEM Observation - Serpentine on Kapton ................................................................................ 54
3.3.3 Optical Microscopic - Serpentine on Tegaderm........................................................................ 57
3.4 Results ............................................................................................................................59
3.4.1 Serpentine on Stiff Substrate .................................................................................................... 59
3.4.2 Serpentine on Compliant Substrate ........................................................................................... 65
3.5 Chapter summary .........................................................................................................69
Chapter 4 Cut-and-Paste Fabrication, .................................................................... 70
4.1 Objective and overview .................................................................................................71
4.2 Fabrication process .......................................................................................................71
4.3 Manufacturing quality ..................................................................................................74
4.3.1 Resolution Test ......................................................................................................................... 74
4.3.2 Width Uniformity ..................................................................................................................... 76
4.3.3 Thickness Profile ...................................................................................................................... 76
4.3.4 Effect of Blade Tip Sharpness and Settings .............................................................................. 78
4.4 Chapter summary .........................................................................................................80
Chapter 5 Multifunctional Epidermal Sensor System (ESS) ............................... 81
5.1 Objective and overview .................................................................................................82
5.2 Layout of the epidermal sensor system .......................................................................82
5.3 Electrophysiological sensor ..........................................................................................85
5.4 Resistance temperature detector ..................................................................................89
5.5 Epidermal hydration sensor .........................................................................................91
5.6 Respiratory sensor.........................................................................................................93
5.7 Double-stranded stretchable antenna ..........................................................................95
5.8 Mechanical study ...........................................................................................................95
5.8.1 Stretchability Study .................................................................................................................. 95
5.8.2 Cyclic Stretch Test Study .......................................................................................................... 98
5.8.3 Deformability Study ................................................................................................................. 99
5.8.4 Substrate Study ....................................................................................................................... 100
5.8.5 Material Behavior ................................................................................................................... 102

xi
5.9 Chapter summary .......................................................................................................104
Chapter 6 Serpentine-Based Stretchable Sensor Coil ......................................... 105
6.1 Objective and overview ...............................................................................................106
6.2 Coil design ....................................................................................................................106
6.3 Experimental measurement........................................................................................107
6.4 Analytical result ........................................................................................................... 111
6.5 Simulation results ........................................................................................................ 112
6.6 Application ................................................................................................................... 115
6.6.1 Hand Gesture Recognition ...................................................................................................... 115
6.6.2 NFC Antenna .......................................................................................................................... 117
6.7 Discussion ..................................................................................................................... 118
6.8 Chapter summary ....................................................................................................... 119
Chapter 7 Conclusions and outlook ...................................................................... 120
7.1 Summary and concluding remarks ............................................................................121
7.2 Suggestions for future work .......................................................................................122
References…………………………………………….…….……..………...…………123

xii
List of Tables
Table 5.1 List of measured Young’s modulus of different materials used in ESS ... 103

xiii
List of Figures
Figure 1.1 Different strategies for achieving high stretchability [69]. (a) SEM image
of wrinkling ribbons [69]. (b) SEM image of buckling ribbons. (c) SEM
image of non-coplanar-serpentine-island structure [70]. (d) Optical image
of coplanar-serpentine-island structure [71]. The scale bar in this image is
2 mm. ....................................................................................................... 5
Figure 1.2 (a) Optical image of a stretchable, interconnected passive network mesh
integrated on a balloon catheter which is inflated by 130% relative to its
deflated state (inset) [5]. (b) Top view image of a Epidermal Electronics
System (EES) with physical properties matched to the epidermis [63]. .. 8
Figure 1.3 Schematic diagram of the five-step human-robot interaction loop [20]. Step
I, the robot senses environmental stimuli (e.g., touch) through artificial
electronic skins (E-skins). Step II, the robot passes the sensed
environmental signal to the human through human-robot interface. Step
III, the human processes the received stimulation. Step IV, the human
sends out control signals through human-robot interface. Step V, robot
(actuator) takes action according to the commands it received. .............. 9
Figure 2.1 Comparison of experiment and simulation. Unstretched serpentine network
paper cut in (a) experiment and (b) model. Serpentine network paper cut
that is subject to 40% diagonal strain in (c) experiment and (d) model. 14
Figure 2.2 (a) Schematic for a unit cell of periodic freestanding serpentine structure.
(b) Boundary condition for a plane strain representation for the original
problem. (c) The 3 degree of freedom design space for serpentine shape.
................................................................................................................ 18
Figure 2.3 Schematics of the serpentine shapes where (a) α = 0°, l/R = 0,with varying

xiv
w/R (b) α =0°, l/R = 1, with varying w/R (c) α = 0°, w/R = 5, with varying
l/R (d) w/R = 1/5, l/R = 0, with varying α(e) w/R = 1/5, l/R = 1, with varying
α, and (f) w/R = 1/2, l/R = 5, with varying α. ......................................... 19
Figure 2.4 (a) Comparison between curve beam theory result and FEM result, for
narrow serpentine with w/R = 1/5, l/R = 0, α=0°. (b) Comparison between
elasticity solution and FEM result, for wide serpentine with w/R = 1, l/R
= 0, α=0°. ............................................................................................... 23
Figure 2.5 Boundary conditions for sub-problems for (a)&(b) arc and (c) arm (d).
Offset of middle line for (d) weak boundary condition and (e) continuity
condition. (f) Illustration of the local and global coordinate system. .... 27
Figure 2.6 Normalized maximum strain result for serpentine with fixed 𝛼 as a
function of (a) ribbon width w/R and (b) arm length l/R. ...................... 30
Figure 2.7 (a) 3D-printed thick serpentine ribbons to be tested by uniaxial tension. (b)
Comparison of results from CB theory (dashed curve), FEM (blue
markers), and experiments (red markers) for various l/R. (c) Comparison
of results from CB theory (dashed curve), FEM (blue markers), and
experiments (red markers) for various α at different w/R. ..................... 32
Figure 2.8 Maximum strain result for serpentine with (a) fixed 𝑤𝑅 = 0.2 and (b) fixed
𝑤𝑅 = 1. Effective stiffness of serpentine with (c) fixed 𝑤𝑅 = 0.2 and (d)
fixed 𝑤𝑅 = 1. ........................................................................................ 35
Figure 2.9 (a) Illustration of geometric constraints. (b) Optimal serpentine shape under
the constraint of X = 0 and Y = 10w. ...................................................... 37
Figure 2.10 Matrix stiffness effect for embedded serpentine. (a) Boundary conditions
for freestanding and embedded serpentine. (b) 𝜀max𝜀app as a function of
the matrix modulus 𝐸matrix against the CB (dashed line) and elasticity

xv
(solid line) solutions for freestanding serpentines. ................................ 39
Figure 3.1 Pictures of the specimen. (a) Top view of a group of four ITO serpentine
thin films sputtered on a 12.7 m thick Kapton substrate. (b)-(d) Top view
of three groups of well-bonded ITO serpentines with systematically varied
geometries. (e) A picture of a weakly-bonded ITO displays good
transparency. .......................................................................................... 45
Figure 3.2 ITO thin film directly deposited onto 10:1 PDMS substrate with sputter
deposition system. Scotch tape adhered to the PDMS on both sides for
sealing purpose. (a) Top view for sample right after deposition. Due to the
different thermal expansion coefficients of ITO and PDMS, wrinkles
develop in the as-fabricated sample. (b) Top view for samples with Scotch
tape peeled off to the right side of the ITO film. Due to the brittleness of
ITO thin film, channel cracks develop as a consequence of a relatively
mild mechanical operation. .................................................................... 48
Figure 3.3 Schematics of the dry, bench top fabrication process of stretchable ITO
serpentines on Tegaderm: (a) laminating 13 m thick PET on TRT on
cutting mat. (b) using an electronic cutter to carve serpentine-shaped
seams on PET. (c) peeling TRT-supported PET from the cutting mat. (d)
sputtering 200 nm thick ITO on PET. (e) transferring ITO covered PET
from one TRT to another with the backside of PET exposed. (f) sputtering
5 nm Ti and 50 nm SiO2 on the backside of the PET (for weakly-bonded
serpentines, this step is skipped). (g) removing unwanted PET, leaving
only ITO_PET serpentines on the TRT. (h) printing the ITO_PET
serpentine ribbons on Tegaderm. (i) the final sample. ........................... 49
Figure 3.4 The electromechanical setup for Kapton-supported ITO specimen. (a)

xvi
Schematics of the experimental setup for the in situ electrical resistance
measurement of the ITO serpentines subjected to uniaxial tension. (b) A
resistance vs. applied strain curve of a linear ITO ribbon on Kapton
substrate. ................................................................................................ 52
Figure 3.5 The electromechanical setup for Tegaderm-supported ITO specimen. (a)
Schematics of the experimental setup for the in situ electrical resistance
measurement of the ITO serpentines subjected to uniaxial tension. (b)
Resistance vs. strain curves of a straight and a serpentine ribbon. ........ 53
Figure 3.6 Channel cracks in ITO. (a) One of many SEM micrographs showing channel
cracks emanating from the inner edge of the crest and propagating
perpendicular to the tensile (horizontal) direction. (b) A sequence of SEM
snapshots showing the evolution of crack density with increased applied
strain. (c) The crack density and electrical resistance of an ITO serpentine
as functions of the applied strain. Strains at which the curves blow up are
defined as the strain-to-rupture. (d) Half or misaligned cracks are
associated with defects in ITO films. ..................................................... 56
Figure 3.7 Optical top-down image for two representative Tegaderm-supported ITO
serpentine samples. (a) A group of serpentines with varying ribbon width
that are weakly bonded to Tegaderm substrate. (b) ITO serpentine with
shape 𝑤/𝑟 = 0.2, 𝑙/𝑟 = 3, 𝛼 = 0𝑜 that is well bonded to Tegaderm
substrate. ................................................................................................ 58
Figure 3.8 Results of the multi-channel electrical resistance measurement during
uniaxial tensile tests. (a) Effect of w/r: smaller w/r leads to delayed
resistance blow-up (b) Effect of l/r is negligible on the failure strain. (c)
Effect of 𝛼 on the stretchability of horseshoe-shaped serpentines is also

xvii
negligible. (d) Effect of 𝛼 on V-shaped serpentines is only significant
when falls in the far negative (less tortuous serpentines). .................. 60
Figure 3.9 Comparison between FEM and experimental results. (a) Boundary
condition and (b) contour plot of xx of a unit cell serpentine under applied
strain app = 1% on the Kapton substrate. (c) Effect of w/r: narrower
ribbons render lower strains. .................................................................. 62
Figure 3.10 (a) New geometric variables that are used to determine the characteristic
length (b) A linear empirical relation between strain and is validated
by FEM and experiments. (c) Linear relation between strain and for
other serpentine materials such as gold and silicon bonded to Kapton. 64
Figure 3.11 Resistance vs. strain plots and stretchability plots for weakly-bonded
serpentines. (a)&(b) Serpentines with different ribbon widths (w effect).
(c)&(d) Serpentines with different arm lengths (l effect). (e)&(f)
Serpentines with different arc angles ( effect). The scale bar is 2 mm in
all insets. ................................................................................................ 66
Figure 3.12 Resistance vs. strain plots and stretchability plots for well-bonded
serpentines. (a)&(b) Serpentines with different ribbon widths (w effect).
(c)&(d) Serpentines with different arm lengths (l effect). (e)&(f)
Serpentines with different arc angles ( effect). The scale bar is 2 mm in
all insets. ................................................................................................ 68
Figure 4.1 Schematics for the “cut-and-paste” process. (a) Au-PET-TRT (APT)
laminated on the cutting mat with PET being the topmost layer. (b)
Carving designed seams in the Au-PET layer by an automated mechanical
cutting machine. (c) Peeling APT off the cutting mat. (d) Removing
excessive Au-PET layer after deactivating the TRT on hot plate. (e)

xviii
Printing patterned Au-PET layer onto target substrate. (f) Resulted
epidermal sensor systems (ESS) with Au being the topmost layer. ....... 73
Figure 4.2 Resolution tests of the cutting machine. Pictures of the same seam pattern
carved on blue PET-Al foil (Neptco Inc.) with different ribbon width: (a)
600 m, (b) 400 m, (c) 300 m, (d) 200 m, (e) 100 m, and (f) 50 m,
by the cutting machine. The resolution of the cutting machine is
determined to be 200 m. ...................................................................... 75
Figure 4.3 Width uniformity and surface profile of the cut ribbons. (a) Image of
sampling spots for width uniformity investigation after cutting a 25 m
thick Kapton sheet on TRT. Ribbon width is 400 mm by drawing. (b)
Width distribution fitted by Gaussian distribution (black curve) with a
mean of 340 m and a standard deviation of 87 m. (c) Image of sampling
spots for height profile investigation of the cut Kapton ribbon after
excessive parts removed. (d) Height profile of the Katpon ribbon, showing
flat plateau and steep transition zone. .................................................... 77
Figure 4.4 Effects of blade tip sharpness and cutting parameters. Images of a (a) new
blade (b) a used blade and (c) a destroyed blade. Cutting results for
different parameter combinations where KT stands for Kapton thickness,
Sh for sharpness, Ra for cutting rate, Th for thickness, NB for new blade,
UB for used blade: (d) KT=25.4mm, Sh=5, Ra=1, Th=7, NB (e)
KT=25.4mm, Sh=10, Ra=1, Th=7, NB (f) KT=25.4mm, Sh=5, Ra=10,
Th=7, NB (g) KT=25.4mm, Sh=5, Ra=1, Th=20 NB (h) KT=12.7mm,
Sh=5, Ra=1, Th=7, NB (i) KT=25.4mm, Sh=10, Ra=1, Th=7, UB.
Zoomed in images of final ESS cut by optimized parameters: (j) crest of
the Au RTD, (k) intersection of the Au EP sensor, (l) crest of the

xix
stretchable Al coil. ................................................................................. 79
Figure 5.1 Top view of an ESS which incorporates three electrophysiological (EP)
electrodes (Au-PET), a resistance temperature detector (RTD) (Au-PET),
two coaxial dot-ring impedance sensors (Au-PET), and a wireless planar
stretchable strain sensing coil (Al-PET), all in filamentary serpentine (FS)
layout. ..................................................................................................... 84
Figure 5.2 ECG, EMG and EEG measurements by ESS. (a) ESS placed on human
chest along with conventional Ag/AgCl electrodes to measure ECG. (b)
ECG simultaneously measured by ESS (red) and Ag/AgCl electrodes
(black). Stronger ECG signals are obtained by the ESS. (c) ESS attached
on human forearm for EMG measurement when the subject is gripping a
commercial dynamometer with different forces. (d) EMG result from ESS
in which Higher amplitude corresponds to higher gripping force. (e) EEG
measured on human forehead by both ESS and Ag/AgCl electrodes. (f)
Two frequency spectrum of the EEG are well overlapped. 10 Hz alpha
rhythm measured by ESS is clearly visible when eyes are closed. ........ 87
Figure 5.3 (a) The resistance reading for RTD is stable for 25% applied strain, which
results in negligible temperature change. (b) Calibration curve of RTD.
The measured temperature coefficient of resistance is 0.0017. (c) Picture
of RTD placed on the forearm along with traditional thermalcouple for
temperature monitoring. (d) Skin temperature changes measured by both
epidermal RTD and thermocouple found good correlation. .................. 90
Figure 5.4 Calibration curves for hydration sensor measured on human skin. The
magnitude of impedance is plotted as a function of (a) sweeping frequency
and (b) hydration level. (c) Picture of ESS placed on the forearm along
xx
with commercial coaxial corneometer for hydration monitoring. (d) Real
time skin hydration before and after Espresso intake measured by both
commercial coaxial corneometer and ESS. (e) Magnitude change of
impedance responding to repeated firm pressure applied on ESS which is
gently attached on skin. (f) Magnitude of impedance without (red) and
with (blue) one time hard press immediately after ESS is applied on skin.
After one time hard press, magnitude drops orders of magnitude and
pressure effect is eliminated. .................................................................. 92
Figure 5.5 Stretchable strain gauges made by electrically conductive rubber (ECR) on
ESS for respiratory rate and pattern monitoring. (a) Picture of the ESS
strain gauge where ECR (black) is the strain sensing component and Au
serpentine ribbons (yellow) serve as interconnects. Calibration curves for
(b) horizontal and vertical ECR resistors and (c) Wheatstone bridge
obtained by horizontal uniaxial tension tests. (d) FEM strain distribution
in ECR when the supporting Tegaderm substrate is stretched horizontally
by 5%. (e) Voltage outputs from the ECR Wheatstone bridge during
normal and deep breath. (f) Voltage outputs from the ECR Wheatstone
bridge during cough. .............................................................................. 94
Figure 5.6 Resistance change measured as function of applied strain. “Al” denotes
straight Al-PET ribbon, “Au” denotes straight Au-PET ribbon, “Coil”
denotes Al-PET serpentine ribbon used in wireless strain sensor coil, “EP”
denotes Au-PET serpentine ribbon used in EP electrode, and “RTD”
denotes Au-PET serpentine ribbon used in RTD. .................................. 96
Figure 5.7 In situ images of different serpentine ribbons on Tegaderm stretched to
certain strains. (a) Al coil serpentine at different applied strain up to its

xxi
strain-to-rupture. (b) Au EP serpentine at different applied strain up to its
strain-to-rupture. (c) Au RTD serpentine at different applied strain up to
its strain-to-rupture. ................................................................................ 97
Figure 5.8 Cyclic test for RTD. Peak strain of 20% and 30% are applied on RTD and
the resistance result shows the device is robust up to several hundreds
number of cycles. ................................................................................... 98
Figure 5.9 Deformability of ESS on human skin. Tattoo-paper supported ESS under (a)
longitudinal stretch (b) transverse stretch (c) biaxial stretch (d)
longitudinal compress (e) transverse compress (f) biaxial compress (g)
shear (h) rub (i) poking by a glass rod. .................................................. 99
Figure 5.10 Resistance of Al coil and Au RTD before and after all possible
deformations of skin-mounted ESS. .................................................... 100
Figure 5.11 ESS on different substrates. (a) ESS on Tegaderm. (b) Applying ESS on
the crook of the elbow. (c) As applied ESS. (d) ESS when elbow bends.
(e) ESS on tattoo paper. (f) Applying ESS on forearm. (g) As applied ESS.
(h) ESS under compression. (i) ESS on KRST. (j) Applying ESS on skin.
(k) As applied ESS. (l) ESS under compression. ................................. 101
Figure 5.12 Stress-strain behavior of involved materials. (a) Uniaxial stress-strain
curves of PET, Kapton, kind removal silicone tape (KRST), tattoo paper,
ESS, Tegaderm, and ECR. (b) Bar plot of the Young’s moduli in log scale.
(c) Top view of Tegaderm, inset showing cross section of Tegaderm. (d)
Uniaxial stress-strain curves of Tegaderm, Tegadmer backing layer and
Tegaderm adhesive layer. ..................................................................... 103
Figure 6.1 (a) Experimental setup for the measurement of the resonant frequency of
the coupled system. The sensor coil is placed on top of the reader coil and

xxii
separated by a 6 mm thick acrylic slab plus 4 mm air gap. The reader is
connected to an Impedance Analyzer (HP 4194A). (b) Schematics of the
wirelessly coupled reader and sensor coils. (c) Phase response of the
coupled system as a function of sweeping frequency at different applied
strains. ................................................................................................... 110
Figure 6.2 (a) 3D model of the coil with extension wire (atmosphere box is not
showing). (b) Serpentine coil under 30 % applied strains with contour plot
of the magnetic (B) filed magnitude. (c) Both experimental (red) and FEM
(blue) results showing decreased resonant frequency with increased
tensile strain. ......................................................................................... 114
Figure 6.3 (a) Sensor coil attached on human wrist (top left) under different hand
gestures: “flat” (top right), “stretch” (bottom left) and “compress” (bottom
right). (b) Phase response as a function of sweeping frequency at repeated
“flat”, “stretch” and “compress” hand position. Good repeatability is
observed. ............................................................................................... 116
Figure 6.4 (a) Image for on-chest measurement. (b) Phase respond as a function of
sweeping frequency at “still”, “inhalation”, and “exhalation” instant. It
shows the resonant frequency and phase are stable in the three cases. . 117
Figure 6.5 (a) Images of different separation distance between reader and the Al coil.
(b) Plots of resonant frequency (black) and phase (blue) as function of
reader-coil distance. It shows the resonant frequency is unaffected by the
reader-coil distance whereas the phase depends on it. .......................... 118

1
Chapter 1 Introduction
This chapter will discuss the background and motivation for flexible and stretchable
electronics and their applications in bio-integrated devices. As conventional wafer-based
electronics are planar and rigid, many mechanics strategies are proposed to enhance the
flexibility and stretchability of intrinsically stiff and brittle inorganic electronics. Out of
many available strategies, patterning inorganic conducting and semiconducting membranes
into meandering serpentine ribbons offers high stretchability, low stiffness, as well as
convenient bio-integration. The goal of this dissertation is to understand the fundamental
mechanics of serpentine-shaped stretchable structures and propose an affordable method
for manufacturing disposable yet high performance epidermal sensors for reliable vital sign
monitoring.

2
1.1 BACKGROUND
This section is going to introduce the history and status quo of flexible (bendable),
stretchable, and bio-integrated electronics, each of which will be discussed in a following
subsection.
1.1.1 Flexible Electronics
Flexible electronics refers to electronic devices that are able to bend to a finite
radius of curvature. The idea of flexible electronics can be dated back to 1948 [1], when a
brief discussion of creating circuits on flexible insulating materials such as paper was first
introduced. Following development on this topic has brought revolutionary changes to the
design of electronic devices in the consumer, medical and military sectors [2-6]. The
unconventional benefits of flexible electronics such as light weight, low cost and
mechanical robustness provide solutions to the problems which are inefficient or even
impossible to solve with traditional rigid electronics and thus offer possibilities for various
new applications. The last 30 years [7, 8] has evidenced the booming growth of flexible
electronics with lots of promising achievements such as flexible displays [9], conformable
electronics textiles [10], rollable solar cells [11-16], adaptive RFID tags [4], artificial E-
skins [17, 18], flexible photonic devices [19], and so on.
Organic materials are appealing for the design of flexible electronics due to their
intrinsically small mechanical stiffness, light weight, low cost and adaptability for roll-to-
roll processes [20-22]. Organic electronics can be fabricated through mass-printing
methods such as offset printing or screen printing [23], and digital printing technologies
such as inkjet printing or laser patterning. However such printing methods cannot provide
satisfactory resolution and are not suitable for high-throughput, large-area fabrication of
devices with small features. Moreover, the moderate electronic performance and chemical
instability prevent organic electronics from becoming high-end devices.

3
Therefore, high-performance flexible electronics still relies on high-quality single-
crystal inorganic semiconductors, such as silicon, gallium arsenide, and gallium nitride,
which are well established materials with high on-off ratio, high carrier mobility, and
excellent chemical stability [24-29]. Since inorganic materials usually rupture at small
strain, for example 1%, strain management strategies have been proposed to achieve high
bendability. An early strategy is to thin down the inorganic functional materials and their
substrates, if any [30-32]. Later on, mechanicians suggested sandwiching the inorganic
films between identical polymer layers so that the brittle material is placed along the neutral
axis of the multilayer to minimize the bending strain [26, 30, 33]. Recently, researchers
proposed that there can be multiple neutral axes in an alternating stiff-soft-stiff multilayer
stack such that a multilayer flexible electronics can be realized [19]. The fabrication of
inorganic flexible electronics involves thin film deposition, photolithography, and micro-
transfer printing [34-36], which are high-resolution patterning methods and will be detailed
later.
1.1.2 Stretchable Electronics
Although flexible electronics represents an important step towards soft electronics,
it is difficult to conform simply bendable electronics to complex 3D surfaces or mimic soft
biological systems. As a result, rubber-like inorganic stretchable electronics have began to
emerge [37-41]. Examples include stretchable transistors and CMOS circuits [31, 42], soft
bio-mimic devices, tissue-like bio-integrated electronics [5, 43-46], and deployable sensor
networks[47, 48].
Inorganic semiconductors and conductors are known to be very stiff and even brittle.
For example, silicon and gallium arsenide tend to rupture at strains around 1%[49]. Copper
and gold films tend to yield and develop irreversible deformation around 0.2%. In contrast,
bio-tissues can deform by tens of percent and deployable sensors such as balloon catheters

4
[5, 50-52] and structural health monitoring systems [48] demand stretchability of hundreds
of percent. To minimize strain in inorganic materials and achieve high system compliance,
several mechanical design strategies have been proposed. One strategy is exploiting the
wrinkling and buckling delamination of stiff nano-ribbons or nano-membranes on soft
elastomeric substrates [31, 53-59], as shown in Figure 1.1 (a)&(b). The inorganic nano-
ribbons or nano-membranes are transferred onto a pre-stretched, compliant elastomeric
substrate, which is then released to form wrinkled or buckled shapes, depending on the
level of the film-substrate adhesion. Under external stretching, the compliant substrate will
be elongated and the wrinkled nano-membrane will flatten and accommodate the stretch
through rigid body rotation. Although this strategy was widely adopted in early inorganic
stretchable electronics [58, 60-62], its implementation has dimed nowadays due to the fact
that their corrugated surfaces are not amenable to encapsulation and bio-integration.
Another strategy is to adopt the so called island-plus-serpentine designs supported by
stretchable substrates, as shown in Figure 1.1 (c)&(d). In this configuration, the functional
electronics are fabricated on or as the rigid islands and the islands are connected to their
adjacent islands through stretchable serpentine interconnects. When the substrate is
stretched, the serpentine interconnects will rotate in plane or buckle out of plane to
accommodate the applied stretch, leaving small strains in the stiff islands. One issue for
the island-plus-serpentine design is that the islands are still rigid and non-stretchable, which
compromise the overall device compliance and stretchability. Eliminating the islands while
keeping serpentines interconnected yield the so called filamentary serpentine network,
which enabled epidermal electronics [63]. A more stretchable variation is called fractal
serpentine design [64-66], whose stretchability can reach hundreds of percent.
Similar to flexible electronics, success of stretchable electronics relies on suitable
photolithography and transfer printing technologies [67, 68]. The process of transfer

5
printing starts with preparation of an assembly of microstructures on a rigid donor wafer,
which mainly involves thin film deposition, photolithography and wet/dry etching. Then
an elastomeric stamp will be pressed against the microstructures to peel them off the donor
substrate and transfer them to the target stretchable substrate. This process has been widely
adopted in the manufacture of inorganic flexible and stretchable electronics.
Figure 1.1 Different strategies for achieving high stretchability [69]. (a) SEM image of
wrinkling ribbons [69]. (b) SEM image of buckling ribbons. (c) SEM image of non-
coplanar-serpentine-island structure [70]. (d) Optical image of coplanar-serpentine-island
structure [71]. The scale bar in this image is 2 mm.

6
1.1.3 Bio-Integrated Electronics
Bio-integrated electronics is an important branch of flexible and stretchable
electronics. Conventional wafer-based inorganic electronics are intrinsically stiff and
planar [72], while human bodies are compliant, curvilinear and highly deformable.
Typically, the bulk electrodes are mounted on the skin via adhesive tapes, mechanical
clamps or straps, or penetrating needles [73-75], which are irritating, obstructive and
invasive methods that cause discomfort for the patient and induce error in the biosignal
readings, due to the huge mismatch in the mechanical properties between conventional stiff
electronic devices and compliant human bodies. In contrast, high-performance flexible and
stretchable electronics can be engineered in form factors that are close to human tissues
and organs, which enables intimate and non-irritating contact with human body for sensing,
diagnosis and therapy.
As an example, Figure 1.2 (a) shows an instrumented balloon catheter for minimum
invasive cardiac ablation therapy which is capable of measuring temperature, flow, tactile,
optical and electrophysiological data. The balloon catheter serves as a platform for
collections of sensors and actuators and the devices offers several modes of sensory
feedback control. In vivo epicardial experiments of cardiac electrophysiological recording
of rat and rabbit hearts have been successfully conducted by using this instrumented
balloon catheter and tactile data has been extracted to monitor balloon-inflation level,
electrical contact between the heart and device and onset of tachycardias. This
multifunctional balloon catheter is also equipped with RF ablation electrodes which can be
used to create lesions on the heart, and the extent of lesion can be monitored by the onsite
temperature sensor, which makes controlled lesion formation possible [5]. Another
example is the epidermal electronics system (EES), as shown in Figure 1.2 (b), whose
thicknesses, effective elastic moduli, bending stiffnesses, and areal mass densities matched

7
to the epidermis, such that it can develop conformal contact and adequate adhesion to
human skin with van der Waals interactions alone. Electrophysiological (EP) signals such
as electroencephalograms (EEG), electrocardiograms (ECG) and electromyograms (EMG)
can be monitored by this device system and other onboard sensors such as temperature
sensor and RF diode make it multifunctional for human body health monitoring.
In addition to medical applications, bio-integrated electronics can also help to
establish human-machine interfaces for prosthetic control, remote surgery, education and
gaming. For example, Figure 1.3 illustrates a human-robot interaction loop in which bio-
integrated electronics can serve as building blocks in all the five phases [20, 76, 77].

8
Figure 1.2 (a) Optical image of a stretchable, interconnected passive network mesh
integrated on a balloon catheter which is inflated by 130% relative to its deflated state (inset)
[5]. (b) Top view image of a Epidermal Electronics System (EES) with physical properties
matched to the epidermis [63].

9
Figure 1.3 Schematic diagram of the five-step human-robot interaction loop [20]. Step I,
the robot senses environmental stimuli (e.g., touch) through artificial electronic skins (E-
skins). Step II, the robot passes the sensed environmental signal to the human through
human-robot interface. Step III, the human processes the received stimulation. Step IV, the
human sends out control signals through human-robot interface. Step V, robot (actuator)
takes action according to the commands it received.

10
1.2 MOTIVATION
Development of high-performance flexible, stretchable and bio-integrated
electronics is a highly interdisciplinary challenge which requires advances in electronics,
materials and mechanics. The fundamental mechanics understanding of the novel
structures of stiff materials and the interaction between hard and soft materials have all
proved to be the critical driving forces for inorganic soft electronics. Despite existing
achievements, many strain analyses just rely on finite element simulation and analytical
solutions are lacking. As a result, many structural designs of deformable circuits are still
empirical. Therefore theoretical derivation and corresponding experimental validation are
highly desirable.
The wide-spread success of soft electronics also hinges on high-throughput and
low-cost manufacturing methods. The current photolithography-based fabrication process
for bio-integrated electronics involves clean room facilities and chemical processes, which
are time, cost and labor intensive, and the overall yield is still unsatisfactory. Therefore,
alternative time and cost effective manufacturing processes are in demand.
1.3 SCOPE OF RESEARCH
The goal of this dissertation is to understand the fundamental mechanics of
serpentine-shaped stretchable structures and propose an affordable method for
manufacturing disposable yet high performance epidermal sensors for reliable vital sign
monitoring. Chapter 2 analytically investigates non-buckling freestanding serpentine
ribbons via curved beam and elasticity theories. When serpentines are supported by
polymer substrates, the substrate stiffness and serpentine-substrate adhesion also affect the
serpentine behavior, which are studied in Chapter 3. In terms of manufacture and
application of serpentines, Chapter 4 introduces a “cut-and-paste” fabrication method
which can produce affordable and disposable stretchable serpentines, and Chapter 5

11
demonstrates its capability through an epidermal sensor system for multimodal vital sign
monitoring. In addition to sensing, serpentines can also be used in wireless stretchable
antenna, which is thoroughly investigated in Chapter 6. Conclusions and outlook of future
research are given in Chapter 7.

12
Chapter 2 Freestanding Serpentines1,2
Freestanding serpentine structures can be found in many stretchable structures that
are made out of intrinsically stiff materials, such as cardiovascular stents and deployable
sensor networks. Because they are not confined by any supporting substrates, they can
deform freely when subjected to external loading. When serpentine width is comparable or
larger than the thickness, the serpentine ribbon can buckle and twist out-of-plane to lower
the elastic energy. When serpentine width is smaller than its thickness, the serpentine will
deform in-plane and hence can be modeled by 2D plane-strain curved beam or elasticity
theory. Analytical solutions using both theories are derived based on three independent,
dimensionless geometric variables. Finite element modeling (FEM) and experiments are
used for validation. As a demonstration, the theoretical results are applied to optimize the
geometry of a freestanding serpentine under practical constraints. Polymer embedded non-
buckling serpentines are also investigated.
1 T. Widlund, S. Yang, Y. Y. Hsu, N. Lu*, “Stretchability and compliance of freestanding serpentine-shaped ribbons” International Journal of Solids and Structures, vol. 51, no. 23-24, pp. 4026-4037, Nov, 2014. Author contributions: T. W. conducted FEM and analytical analysis. S. Y. performed experiments and validation of T. W.’s FEM and analytical work. N. L. supervised and coordinated the project. N. L. and T. W. wrote the paper. 2 S. Yang, S. Qiao, N. Lu*, “Elasticity solutions to non-buckling serpentine ribbons”, to be submitted Author contributions: S. Y. conducted FEM analysis. S. Y. performed analytical analysis with S. Q.’s assistance. N. L. supervised and coordinated the project. N. L. and S. Y. wrote the paper.
13
2.1 OBJECTIVE AND INTRODUCTION
To overcome the intrinsic stiffness of inorganic electronics materials, a popular
strategy is to pattern them into serpentine shapes. The structural design of serpentine-based
stretchable circuits dictates the stretchability and compliance of the system. Although the
mechanical behavior of serpentines has been widely studied by numerical and experimental
means, available analytical solutions are very limited, which hinders the development of a
rational and transformative design paradigm for inorganic stretchable electronics. This is
mainly attributed to the difficulty of analyzing large displacement and out-of-plane
buckling of thin serpentine ribbons. But the deformation of non-buckling freestanding
serpentines can be analytically solved through curved beam (CB) and elasticity theories.
An introduction to buckling and non-buckling serpentines is offered as follows.
2.1.1 Out-of-Plane Buckling
When freestanding serpentine structures have small width-to-thickness ratios, they
tend to buckle out-of-plane when subjected to tensile stretch. This is because for this
structure, out-of-plane buckling favors the minimization of the global energy, which is the
essential driving force for all physical phenomena. Although general three-dimensional
(3D) theories for curved thin rods are available [78], theoretical analysis for out-of-plane
buckling and post-buckling analysis for curved beams are still lacking and limited to 1D
serpentine structures, few serpentine shapes and loading conditions [79-81]. Due to the
complexity of analytically solving the post-buckling partial differential equations (PDE)
[82], the analytical work for serpentine networks is still very limited. Nevertheless,
numerical analyses of buckled freestanding serpentine interconnects have provided
practical design guidelines [66, 83] and the buckled geometry for serpentine networks can
also be visualized from the result of FEM and the deformed shape is well aligned with
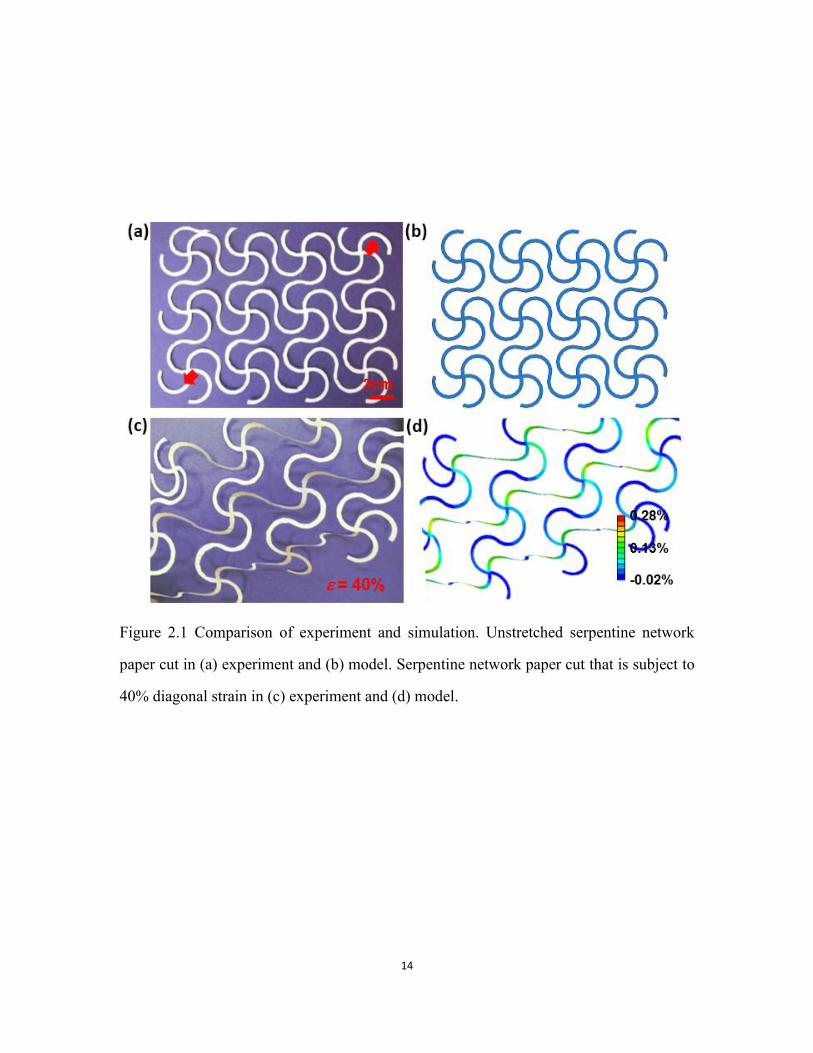
experiment result (Figure 2.1).
14
Figure 2.1 Comparison of experiment and simulation. Unstretched serpentine network
paper cut in (a) experiment and (b) model. Serpentine network paper cut that is subject to
40% diagonal strain in (c) experiment and (d) model.

15
2.1.2 In-Plane Rigid Body Rotation
When freestanding serpentine structures have large width-to-thickness ratio, they
tend to experience in-plane rigid body rotation when subject to tensile stretch. These
structures can be found in a lot of expandable systems made out of intrinsically stiff
materials. Examples include the cardiovascular stents for angioplasty [52] or percutaneous
coronary intervention [51], and deployable sensor networks for structural health
monitoring [48], Tubular metallic stents in the form of a serpentine-meshed scanfold can
be inserted into blood vessels in a very small initial diameter, tunnel through the veins and
arteries, and get expanded by more than 200% using a balloon catheter, to provide support
inside the patient’s arteries. As another example, ultra narrow, highly tortuous serpentines
were incorporated in the design of a spider-web-like highly expandable sensor network
[48]. The microfabrication of inorganic-material-based sensors which has to utilize regular-
sized spinners, mask aligners, and vacuum chambers can all be performed on a wafer-sized
rigid substrate. Once the circuit is released from the rigid substrate, the sensor network can
be deployed by more than 100 times in area so that they can cover macroscopic civil or
aerospace structures to perform structure health monitoring. In both examples, the large
expandability comes from just the in-plane rigid body rotation of the freestanding
serpentine ligaments.
Although serpentines have been widely used as the stretchable configuration of stiff
materials, the designs of the serpentine shape are still largely empirical. According to
existing studies, the applied strain-to-rupture of metallic serpentine ribbons varies from 54%
to 1600%, depending on the geometric parameters such as ribbon width, arc radius, arm
length, substrate support, and so on [48, 70, 84-86]. A few experimental and finite element
modeling (FEM) studies have been conducted to provide insights into the shape-dependent
mechanical behavior [83, 84, 86] of serpentine ribbons. Two recent theoretical articles

16
provided viable routes to predict the stretchability of buckled serpentines [87] and self-
similar serpentines [88], but the shapes of the unit cells are very limited. Moreover, the
effective compliance of the serpentine structure and the shape optimization under practical
constraints have been rarely discussed.
This chapter intends to reveal the effects of the geometrical parameters on the
stretchability and effective stiffness of freestanding non-buckling serpentine structures.
Two analytical approaches, i.e. Curved Beam (CB) and elasticity theories will be used to
study this problem and comparison of the two methods will be conducted. Serpentine
stretchability and effective stiffness as functions of dimensionless geometric variables will
be offered, and geometric optimization will be performed based on the analytical results.
Polymer embedded non-buckling serpentines will also be numerically simulated and
compared with freestanding solutions.
2.2 PROBLEM DESCRIPTION
The structure that we intend to study is a periodic serpentine ribbon whose unit cell
is depicted in Figure 2.2(a). As labeled in Figure 2.2(a), the curved section is called the arc,
and the straight section is called the arm. A uniaxial tensile displacement 𝑢0 in the
direction of periodicity is applied at each end. As we limit ourselves to thick ribbons that
do not buckle out-of-plane under applied 𝑢0, plane strain conditions can be assumed such
that we only need to solve a 2D elasticity problem. Applying the symmetric and anti-
symmetric features of the serpentine structure as well as the boundary conditions, the 2D
problem can be further simplified and the boundary value problem to solve is illustrated in
Figure 2.2(b). Specifically, the quarter serpentine is clamped at the right end, which is the
axis of symmetry, and subjected to a displacement loading 𝑢0 2⁄ at the middle point of the
the left end, whose reaction force is denoted by P. The geometry of the 2D serpentine
structure can be fully defined by the four independent parameters labeled in Figure 2.2(a):

17
the arc radius R, the ribbon width w, the arm length l, and the arc opening angle 𝛼. The
end-to to-end distance of a unit cell is denoted by S, which takes the form
𝑆 = 4(𝑅𝑐𝑜𝑠(𝛼) −
𝑙
2𝑅𝑠𝑖𝑛(𝛼)) (2.1)
If the serpentine is stretched by 𝑢0 at each end as shown in Figure 2.2(a), we
define the applied strain as
𝜀𝑎𝑝𝑝 =2𝑢0𝑆
(2.2)
After non-dimensionalization, three independent dimensionless parameters are
used in this study: 𝑤 𝑅⁄ , 𝑙 𝑅⁄ , and 𝛼. The three dimensionless parameters are essentially
the three degrees of freedom in the serpentine design space as illustrated in Figure
2.2(c) .Many different serpentine geometries can be analytically defined by different
combinations of the three parameters, which can be represented as points in the first
quadrant of the 3D design space. Representative serpentine shapes are summarized in
Figure 2.3. Since dimensionless variables are used in this study, self-similar serpentines,
no matter macro-, micro-, or nano-scale, as long as their 𝑤 𝑅⁄ , 𝑙 𝑅⁄ and 𝛼 are all the
same, their structural properties such as normalized effective stiffness and stretchability
will not have any difference, assuming no size-dependent material properties.

18
Figure 2.2 (a) Schematic for a unit cell of periodic freestanding serpentine structure. (b)
Boundary condition for a plane strain representation for the original problem. (c) The 3
degree of freedom design space for serpentine shape.

19
Figure 2.3 Schematics of the serpentine shapes where (a) α = 0°, l/R = 0,with varying w/R
(b) α =0°, l/R = 1, with varying w/R (c) α = 0°, w/R = 5, with varying l/R (d) w/R = 1/5, l/R
= 0, with varying α(e) w/R = 1/5, l/R = 1, with varying α, and (f) w/R = 1/2, l/R = 5, with
varying α.

20
In this problem, we are particular interested in two mechanical behaviors of
serpentines: the stretchability and the effective stiffness. Stretchability is defined as the
critical applied strain beyond which the material of the serpentine ribbon will rupture and
will be denoted by 𝜀appcr . Therefore, if the failure criterion is 𝜀max = 𝜀cr, where 𝜀max and
𝜀cr represent the maximum tensile strain and the intrinsic strain-to-rupture of the material,
respectively, the normalized maximum tensile strain in the serpentine, 𝜀𝑚𝑎𝑥 𝜀𝑎𝑝𝑝⁄ , will
govern the stretchability by
𝜀𝑎𝑝𝑝𝑐𝑟 =
𝜀𝑐𝑟
𝜀𝑚𝑎𝑥 𝜀𝑎𝑝𝑝⁄, (2.3)
which means we only need to focus in the study of 𝜀𝑚𝑎𝑥 𝜀𝑎𝑝𝑝⁄ and the stretchability of
serpentines will be directly reflected from it.
Effective stiffness is defined as the ratio of the reaction force P to the overall
displacement. With Young’s modulus E and Poisson’s ratio v, the stiffness of a plane strain
straight ribbon of length S and width w is given by 𝑤 𝑆⁄ , where = 𝐸 (1 − 𝜐2)⁄ is the
plane strain modulus. Therefore the effective stiffness of a serpentine ribbon normalized
by that of straight ribbon of the same end-to-end length is given by 𝑃𝑆 (2𝑤𝑢0)⁄ . When
𝛼 approaches −90𝑜 , i.e. when the serpentine degenerates to a linear ribbon, both
𝜀max 𝜀app⁄ and 𝑃𝑆 (2𝑤𝑢0)⁄ should approach one.
2.3 ANALYTICAL MODELING AND SIMULATION
In this study, we adopt both curved beam (CB) and elasticity theories to analytically
solve this problem.
2.3.1 Curved Beam (CB) Theory Solution
The internal forces in the curved beam shown in Figure 2.2(b) can be expressed as
𝑁𝑎𝑟𝑐 = 𝑃 cos(𝜃) , 𝑉𝑎𝑟𝑐 = −𝑃 sin(𝜃) ,𝑀𝑎𝑟𝑐 = 𝑃𝑅 (sin(𝛼) + cos(𝜃)) + 𝑃𝑙
2cos(𝛼) (2.4)

21
𝑁𝑎𝑟𝑚 = 𝑃 sin(𝛼) , 𝑉𝑎𝑟𝑚 = −𝑃 cos(𝛼) ,𝑀𝑎𝑟𝑚 = 𝑃𝑠 cos(𝛼), (2.5)
where N is the internal normal traction at the centroid of the cross section and M is the
internal moment at the cross section. Castigliano's theorem can be used to correlate the
applied displacement 𝑢𝑜 and reaction force P
𝑢𝑜
2=
𝜕𝑈
𝜕𝑃=
𝜕(𝑈𝑎𝑟𝑚+𝑈𝑎𝑟𝑐)
𝜕𝑃, (2.6)
where U is the total elastic energy and comprises energy from the serpentine arm and arc,
whose form are
𝑈𝑎𝑟𝑚 = ∫ [𝜅
𝑉𝑎 𝑟𝑚²
2𝐺𝐴+𝑁𝑎𝑟𝑚²
2𝐴+𝑀𝑎𝑟𝑚²
2𝐼2] 𝑑𝑠
𝑙2
0
(2.7)
and
𝑈𝑎𝑟𝑐 = ∫ [(𝑁𝑎𝑟𝑐𝑅−𝑀𝑎𝑟𝑐)²
2𝐴𝑅²+𝑀𝑎𝑟𝑐²
2𝐼2]
𝛼+𝜋
20
𝑅𝑑𝜃, (2.8)
where κ=1.5, is the correction coefficient for strain energy in a rectangular section. Since
the stiffness of a straight ribbon is given by 𝑤 𝑆⁄ , and for plane strain problems, we
assume a thickness t = 1 so that 𝐴 = 𝑤, 𝐼2 = 𝑤3/12, and = 𝐸/(1 − 𝜈²). Therefore we
obtain the relationship between the applied displacement 𝑢𝑜 and the reaction force P as
𝑢0
2=
𝑃𝑅3
𝑤3
[ cos2(𝛼) (
𝑙3
2𝑅3+ 3(
𝜋
2+ 𝛼)
𝑙2
𝑅2+ 12
𝑙
𝑅− 12(
𝜋
2+ 𝛼))
+sin(2𝛼) (6 (𝜋
2+ 𝛼)
𝑙
𝑅+ 9)
+ 𝑤2
𝑅²[(𝜋
2+ 𝛼) (
𝑙
2𝑅cos(𝛼) + sin(𝛼))
2+
𝑙
2𝑅(sin²(𝛼) +
3
2𝐺cos²(𝛼))] + 18 (
𝜋
2+ 𝛼)]
. (2.9)
The effective stiffness is then given by

22
𝑃𝑆
2𝑤𝑢0=
𝑤²𝑅²(cos(𝛼) −
𝑙2𝑅
sin(𝛼))
2
[ cos2(𝛼) (
𝑙3
2𝑅3+ 3(
𝜋2+ 𝛼)
𝑙2
𝑅2+ 12
𝑙𝑅− 12 (
𝜋2+ 𝛼))
+sin(2𝛼) (6 (𝜋2+ 𝛼)
𝑙𝑅+ 9)
+ 𝑤2
𝑅²[(𝜋2+ 𝛼) (
𝑙2𝑅
cos(𝛼) + sin(𝛼))2
+𝑙2𝑅
(sin²(𝛼) +32𝐺
cos²(𝛼))] + 18(𝜋2+ 𝛼)
]
(2.10)
For the curved beam, the hoop stress in the arc is given by
𝜎𝜃𝜃 =𝑁−
𝑀
𝑅
𝐴−
𝑀𝑦
(1+𝑦
𝑅)𝐼2
, (2.11)
where A is the cross-sectional area and y is the distance from the middle line. By applying
Hook’s law, the hoop strain is then obtained by
𝜀𝜃𝜃 =𝜎𝜃𝜃
(2.12)
As the maximum local strain always occurs at the center of the inner crest of the
arc (as shown in Figure 2.4 (a)), i.e. θ = 0º and y = -w/2, we finally obtain the normalized
maximum strain as
𝜀𝑚𝑎𝑥𝜀𝑎𝑝𝑝
=
𝑤𝑅[12
2 −𝑤𝑅
+ (12
2 −𝑤𝑅
−𝑤𝑅)(𝑠𝑖𝑛(𝛼) +
𝑙2𝑅
𝑐𝑜𝑠(𝛼))] (cos(𝛼) −𝑙2𝑅
sin(𝛼))
[ cos2(𝛼) (
𝑙3
2𝑅3+ 3(
𝜋2+ 𝛼)
𝑙2
𝑅2+ 12
𝑙𝑅− 12(
𝜋2+ 𝛼))
+ sin(2𝛼) (6 (𝜋2+ 𝛼)
𝑙𝑅+ 9)
+ 𝑤2
𝑅²[(𝜋2+ 𝛼) (
𝑙2𝑅
cos(𝛼) + sin(𝛼))2
+𝑙2𝑅
(sin²(𝛼) +32𝐺
cos²(𝛼))] + 18 (𝜋2+ 𝛼)
]
(2.13)
Now, fully analytical results for the effective stiffness (Equation (2.10)) and
stretchability (Equation (2.13)) from CB theory have been achieved, and will be compared
with the elasticity solution derived in the following subsection.

23
Figure 2.4 (a) Comparison between curve beam theory result and FEM result, for narrow
serpentine with w/R = 1/5, l/R = 0, α=0°. (b) Comparison between elasticity solution and
FEM result, for wide serpentine with w/R = 1, l/R = 0, α=0°.

24
2.3.2 Elasticity Solution
The elasticity solution starts with breaking down the original problem in Figure 2.2
(b) into three sub-problems, as illustrated in Figure 2.5 (a)-(c). Figure 2.5 (a) and Figure
2.5 (b) depict two sub-boundary value problems for the arc, where 𝑀2 in Figure 2.5 (a) is
the balancing moment for P in the arc section, 𝑀1 in Figure 2.5 (c) is the balancing
moment for P in the arc section, and 𝑀1 in Figure 2.5 (b) is the reaction moment:
𝑀1 = 𝑃𝑙
2𝑐𝑜𝑠 (𝛼),𝑀2 = 𝑃
𝑎+𝑏
2(1 + 𝑠𝑖𝑛 (𝛼)), (2.14)
where a and b represent the inner and outer radii of the arc
𝑎 = 𝑅 −𝑤
2, 𝑏 = 𝑅 +
𝑤
2.
(2.15)
The resultant moment M at the fixed end of the arc is therefore given by
𝑀 = 𝑀1 +𝑀2 (2.16)
The original serpentine problem is now decomposed into three sub-cases with
simple geometry and well-defined boundary conditions and it is hence possible to find
analytical Airy stress functions for each of them. A Polar coordinate system will be used
to solve the stress/strain field in the arc whereas a Cartesian coordinate system will be used
for the arm. The coordinate origins and vectors are illustrated in Figure 2.5 (a)-(c). Based
on the boundary value problems and the principle of Airy stress functions, stress functions
can be assembled for sub-problems defined in Figure 2.5 (a), (b) and (c), respectively:
𝜑1 = (𝐴1
𝑟+ 𝐴2 𝑟𝑙𝑛(𝑟) + 𝐴3 𝑟3 ) 𝑐𝑜𝑠(𝜃) + 𝐴4𝑙𝑛(𝑟) + 𝐴5𝑟
2 + 𝐴6𝑟2𝑙𝑛 (𝑟), (2.17)
𝜑2 = 𝐵1 𝑙𝑛(𝑟) + 𝐵2 𝑟2 + 𝐵3 𝑟2 𝑙𝑛 (𝑟) (2.18)
and
𝜑3 = 𝐶1 𝑦2 + 𝐶2 𝑥𝑦 + 𝐶3𝑦3 + 𝐶4𝑥𝑦
3 (2.19)
where Ai, Bi and Ci are constants to be determined by applying the boundary conditions.
The stress field for each of the sub-problem can then be derived by taking

25
derivatives of the corresponding stress function in polar or Cartesian coordinates and can
be expressed in terms of geometrical parameters, applied force P, spatial variables such as
𝑟, 𝜃, 𝑥, 𝑦 , and the unknown constants. The unknown constants can be determined by
implementing weak force boundary conditions.
For Figure 2.5 (a)
1. 𝑟 = 𝑎, 𝜎𝑟𝑟 = 𝜎𝑟𝜃 = 02. 𝑟 = 𝑏, 𝜎𝑟𝑟 = 𝜎𝑟𝜃 = 0
3. 𝜃 = 0,∫ 𝜎𝜃𝜃𝑑𝑟𝑏
𝑎
= 𝑃,∫ 𝜎𝑟𝜃𝑑𝑟𝑏
𝑎
= 0,∫ 𝜎𝜃𝜃𝑟𝑑𝑟𝑏
𝑎
= (𝑎 + 𝑏
2+ 𝑐)𝑃 𝑠𝑖𝑛(−𝛼)
4. 𝜃 = 𝜋
2+ 𝛼,∫ 𝜎𝜃𝜃𝑑𝑟
𝑏
𝑎
= 𝑃 𝑠𝑖𝑛(−𝛼) ,∫ 𝜎𝑟𝜃𝑑𝑟𝑏
𝑎
= 𝑃 𝑐𝑜𝑠(𝛼) ,∫ 𝜎𝜃𝜃𝑟𝑑𝑟𝑏
𝑎
= (𝑎 + 𝑏
2+ 𝑐)𝑃 𝑠𝑖𝑛(−𝛼)
(2.20)
For Figure 2.5 (b)
1. 𝑟 = 𝑎, 𝜎𝑟𝑟 = 𝜎𝑟𝜃 = 02. 𝑟 = 𝑏, 𝜎𝑟𝑟 = 𝜎𝑟𝜃 = 0
3.∫ 𝜎𝜃𝜃𝑑𝑟𝑏
𝑎
= 0,∫ 𝜎𝑟𝜃𝑑𝑟𝑏
𝑎
= 0,∫ 𝜎𝜃𝜃𝑟𝑑𝑟𝑏
𝑎
= −𝑙
2𝑃 𝑐𝑜𝑠(𝛼)
4. 𝜃 = 𝜋
2+ 𝛼,∫ 𝜎𝜃𝜃𝑑𝑟
𝑏
𝑎
= 0,∫ 𝜎𝑟𝜃𝑑𝑟𝑏
𝑎
= 0,∫ 𝜎𝜃𝜃𝑟𝑑𝑟𝑏
𝑎
= −𝑙
2𝑃 𝑐𝑜𝑠(𝛼)
(2.21)
For Figure 2.5 (c)
1. 𝑦 = −
𝑏 − 𝑎
2, 𝜎𝑦𝑦 = 𝜎𝑥𝑦 = 0
2. 𝑦 =𝑏 − 𝑎
2, 𝜎𝑦𝑦 = 𝜎𝑥𝑦 = 0
3. 𝑥 = 0,∫ 𝜎𝑥𝑥𝑑𝑦
𝑏−𝑎2
−𝑏−𝑎2
= 𝑃 𝑠𝑖𝑛(−𝛼) ,∫ 𝜎𝑥𝑦𝑑𝑦
𝑏−𝑎2
−𝑏−𝑎2
= −𝑃 𝑐𝑜𝑠(𝛼),∫ 𝜎𝑥𝑥𝑦𝑑𝑦
𝑏−𝑎2
−𝑏−𝑎2
=𝑙
2𝑃 𝑐𝑜𝑠(𝛼)
4. 𝑥 =𝑙
2,∫ 𝜎𝑥𝑥𝑑𝑦
𝑏−𝑎2
−𝑏−𝑎2
= 𝑃 𝑠𝑖𝑛(−𝛼) ,∫ 𝜎𝑥𝑦𝑑𝑦
𝑏−𝑎2
−𝑏−𝑎2
= −𝑃 𝑐𝑜𝑠(𝛼),∫ 𝜎𝑥𝑥𝑦𝑑𝑦
𝑏−𝑎2
−𝑏−𝑎2
= 0
(2.22)
Those weak boundary conditions work well for long serpentines and would fail
when 𝛼 approaches −90o and l approaches 0. This is because when 𝛼 approaches
−90o and l approaches 0, the curve length of the serpentine is comparable with or even
smaller than the ribbon width and Saint-Venant's principle no longer holds. Violation of

26
Saint-Venant's principle imply that the weak boundary condition is no longer applicable to
short serpentines with 𝛼 close to −90o and l close to 0. One way to resolve this issue is
to find the point-wise traction and apply the exact boundary condition to the stress functions
and the stress functions, if they do exist, will be very complicated. Another approach to
tackle this issue is to make the minimum number of modifications to the solution based on
weak boundary conditions. We took the second approach and consider that the reaction
force P on the arc is applied not at the median line of the ribbon, but with an offset of c, as
highlighted in Figure 2.5 (d).
After deriving the stress fields from the stress function and the weak boundary
conditions, the displacement fields for the arc and the arm can be obtained through
constitutive and geometric equations. Weak displacement continuity conditions are
adopted at the arm-arc interface:
1. 𝑢arm|𝑥=0,𝑦=−d = 0
2. 𝑣arm|𝑥=0,𝑦=−d = 0
3. 𝜙arm|𝑥=0,𝑦=−d = 𝜙arc|𝑟=a+b2+d,𝜃=
π
2+𝛼
, (2.23)
which essentially requires that the displacement and rotation of arc and arm are continuous
through one point which is offset d to the middle line, as shown in Figure 2.5(e). As we
pointed out before, the solutions to c and d are only valid when 𝛼 → −90o, as 𝛼 grows
from −90o, the effect of weak boundary conditions on the stress field decays, thus c and
d should vary with 𝛼. Simply assuming a quadratic variation, we propose the full solutions
to be
𝑐(𝛼) =
𝑐4𝛼2
𝜋2 𝛼 ≤ 0𝑜
0 𝛼 > 0𝑜, 𝑑(𝛼) =
𝑑4𝛼2
𝜋2 𝛼 ≤ 0𝑜
0 𝛼 > 0𝑜 (2.24)

27
Figure 2.5 Boundary conditions for sub-problems for (a)&(b) arc and (c) arm (d). Offset of
middle line for (d) weak boundary condition and (e) continuity condition. (f) Illustration of
the local and global coordinate system.

28
So far, the stress, strain, and displacement were all derived in the local polar or local
Cartesian coordinates. To establish results in the global Cartesian coordinate system, one
more step of coordinate transformation has to be implemented. The global 𝒆𝒙′ − 𝒆𝒚′
coordinate along with each local coordinate are illustrated in Figure 2.5 (f) and the
transformation angle for arc and arm are
𝜑1 = −𝜃,𝜑2 = −(𝜋 + 𝛼) (2.25)
Through this coordinate transformation, the results are represented in the global
Cartesian coordinate system. The total displacement is then formulated as
𝑢𝑎𝑝𝑝 =𝑢0
2= 𝑣′
arc|𝑟=a+b
2+𝑑,𝜃=
π
2+𝛼+ 𝑣′arm|𝑥=0,𝑦=−𝑑,
(2.26)
and the maximum local strain always occurs at the center of the inner crest of the arc (as
shown in Figure 2.4 (b)), i.e.
𝜀max = 𝜀𝜃arc|𝑟=𝑎,𝜃=0
(2.27)
Finally, by combining Equations (2.2), (2.26) and (2.27) we can obtain elasticity
solutions for 𝜀max 𝜀app⁄ = 𝑓(𝑤 𝑅⁄ , 𝑙 𝑅⁄ , 𝛼) and 𝑃𝑆 (2𝑤𝑢0)⁄ = 𝑔(𝑤/𝑅, 𝑙/𝑅, 𝛼)
2.3.3 FEM Approach
The commercial FEM package ABAQUS 6.10 was used to perform a plane strain
simulation of a unit cell as shown in Figure 2.2 (a). The serpentine material was assumed
to be linearly elastic, with a Young’s modulus E = 130 GPa, and a Poisson’s ratio 𝜈 =
0.27 (e.g. silicon). Symmetric displacement boundary conditions were applied at both
ends to ensure 𝜀app = 10% for all the models. Small deformation (i.e. linear geometric
relation) was assumed. After convergence tests, element size was smaller than w/40. Strain
distributions and reaction forces were obtained directly from FEM solutions.
2.3.4 Comparison of CB and Elasticity Solutions

29
As an illustration, results for representative serpentine structures are shown in
Figure 2.4. It is obvious that CB theory and elasticity results are in good agreement with
FEM ones for narrow and wide serpentine structures, respectively, and the maximum strain
always occurs at the inner crest of the arc.
Figure 2.6 (a)&(b) plot the normalized maximum strain 𝜀𝑚𝑎𝑥 𝜀𝑎𝑝𝑝⁄ as dots for
FEM result, dash curves for CB theory result and solid curves for the elasticity result. The
inset in each plot shows representative shapes for that plot and the parenthesized numbers
below the serpentines show the x axis value for that serpentine shape. There are several
useful insights in the plots. It is evident that for narrow serpentine structures the CB theory
result aligns well with the FEM result, but for wide serpentine structures the good
agreement no longer holds. By contrast, the elasticity solution reproduces the FEM result
well for all serpentine structures. This is because CB theory makes certain assumptions,
such as plane that is perpendicular to neutral axis remains normal during deformation,
which only reflects the truth when the serpentine is narrow or the arm length is large.
However, for serpentines with large ribbon width or short arm length these assumptions no
longer hold, therefore CB beam theory fails to provide a faithful predication for wide
serpentine structures. It has to be noted that even though elasticity has better performance,
CB has its own advantage for prediction of narrow serpentine structures due to its
simplicity for application.

30
Figure 2.6 Normalized maximum strain result for serpentine with fixed 𝛼 as a function of
(a) ribbon width w/R and (b) arm length l/R.

31
2.4 EXPERIMENTS
Experimental validation of the analytical and FEM results was conducted with 3D-
printed acrylonitrile butadiene styrene (ABS) straight and serpentine ribbons. Instron Dual
Column Testing System (Model 3367) and Bluehill 2 were used as the uniaxial tension test
and data acquisition system. Displacement-controlled tensile tests on the 3D-printed
serpentine ribbons were performed with a strain rate of 0.1% s-1. Engineering strains, i.e.
total elongation divided by the initial gauge length, were measured in the experiments. The
intrinsic material strain-to-rupture 𝜀cr was measured using a straight specimen whereas
the applied strains-to-rupture (or stretchability) 𝜀appcr was measured for various serpentine
ribbons. Although ABS is an elastic-plastic material and it ruptures within the plastic
regime, the inner edge of the crest of the ABS serpentine is always subjected to pure tensile
strain and small-scale yielding assumption has been validated for its failure [89], therefore
the failure criterion 𝜀max = 𝜀cr is still applicable. Comparison between modeling and
experimental results is offered in Figure 2.7. Figure 2.7 (a) depicts the 3D printed
serpentine specimens with systematically changing arm length. Every specimen shown in
this figure has a thickness of 0.1 inch and a ribbon width of 0.039 inch. Because of their
relatively large thickness, the serpentine specimens undergo in-plane elongation during the
tensile tests, which is compatible with our plane strain assumption for the models.
Measured 𝜀cr 𝜀appcr⁄ are compared with CB theory and FEM results as given by Figure 2.7
(b)&(c). Figure 2.7 (b) plots 𝜀𝑚𝑎𝑥 𝜀𝑎𝑝𝑝⁄ as a function of l/R with fixed = 0o and w/R=1/5
and Figure 2.7 (c) plots 𝜀𝑚𝑎𝑥 𝜀𝑎𝑝𝑝⁄ as a function of with fixed w/R=1/5 and l/R=0. The
experiment result shows good agreement with FEM and analytical results.

32
Figure 2.7 (a) 3D-printed thick serpentine ribbons to be tested by uniaxial tension. (b)
Comparison of results from CB theory (dashed curve), FEM (blue markers), and
experiments (red markers) for various l/R. (c) Comparison of results from CB theory
(dashed curve), FEM (blue markers), and experiments (red markers) for various α at
different w/R.

33
2.5 RESULTS
2.5.1 Shape Effect on Stretchability and Stiffness
Figure 2.6 suggests that when 𝛼 = 0𝑜, the normalized maximum strain 𝜀𝑚𝑎𝑥 𝜀𝑎𝑝𝑝⁄
depends monotonically on 𝑤 𝑅⁄ and reversely monotonically on 𝑙 𝑅⁄ , i.e. serpentine with
smaller ribbon width and longer arm exhibits smaller 𝜀𝑚𝑎𝑥 𝜀𝑎𝑝𝑝⁄ , therefore higher
stretchability. This is because the applied strain is mainly accommodated by the rotation of
the arm in such a way that only moderate strains will be induced in the arc. Figure 2.8
(a)&(b) plot the maximum strain result as function of arc angle 𝛼 for narrow serpentine
(𝑤 𝑅⁄ = 0.2) and wide serpentines (𝑤 𝑅⁄ = 1), respectively. It can clearly be seen that the
effect of 𝛼 is not a simply monotonic function on 𝜀𝑚𝑎𝑥 𝜀𝑎𝑝𝑝⁄ . When 𝛼 approaches
−90𝑜, i.e. the serpentine becomes closer to a straight ribbon, 𝜀𝑚𝑎𝑥 𝜀𝑎𝑝𝑝⁄ first increases
until it reaches a peak value and then decreases and ends up at 1 when 𝛼 = −90𝑜, for both
narrow serpentine and wide serpentine structures. It is also obvious that in the full range of
𝛼 examined in the two plots, a large portion of the curve is above 1 (green dashed curve
in Figure 2.8 (a)&(b)) , which means that the stretchability of those serpentine shapes is
actually smaller than their straight counterparts. For the serpentine shapes examined, the
arc angle 𝛼 corresponding to the curve that is above 1 is always negative and close to
−90𝑜, which indicates the maximum strain augmentation always happens in a less tortuous
(for wide serpentine) or almost straight serpentine structure (for narrow serpentines). The
plots reveal that serpentine structures are not always more favorable in the sense of gaining
higher stretchability, and actually a big portion of the serpentine structures are less
stretchable than their straight ribbon counterparts, which might be contrary to intuition.
Therefore in order to design a high stretchable serpentine structure, a specific serpentine
structure should be carefully evaluated before to conclusions.
Other than stretchability, the effective stiffness is also of great importance for the
34
serpentine structure since it reflects how “compliant” the structure is. Figure 2.8 (c)&(d)
plot the effective stiffness of serpentine ribbons normalized by that of a straight ribbon for
both narrow (𝑤 𝑅⁄ = 0.2) and wide serpentines (𝑤 𝑅⁄ = 1), respectively, in semi-log scale.
It is obvious that, again, the elasticity result finds good agreement with FEM result while
CB theory result exhibits significant discrepancy, especially when 𝑤 𝑅⁄ = 1. It shows that
the all of the three parameters have a monotonic effect on the effective stiffness, i.e. the
effective stiffness monotonically increases with increasing 𝑤 𝑅⁄ and monotonically
decreases with increasing 𝑙 𝑅⁄ and 𝛼. Both of the plots show that the effective stiffness
of serpentines are always smaller than 1, which indicates the serpentine structure is always
“more compliant”, even though it is not always more stretchable, than a straight ribbon.
Actually the stiffness of a serpentine can be orders of magnitude smaller than a straight
ribbon, which is the enabling mechanism for making tissue-like electronics out of stiff
inorganic materials [48, 63, 90, 91].

35
Figure 2.8 Maximum strain result for serpentine with (a) fixed 𝑤 𝑅⁄ = 0.2 and (b) fixed
𝑤 𝑅⁄ = 1 . Effective stiffness of serpentine with (c) fixed 𝑤 𝑅⁄ = 0.2 and (d) fixed
𝑤 𝑅⁄ = 1.

36
2.5.2 Optimized Serpentine Shape
In practical circuit design, stretchable serpentine interconnects are usually
subjected to design and fabrication constraints. For example, although narrower
serpentines are always more compliant and more stretchable, the width of serpentines
cannot approach zero due to limitations in fabrication resolution as well as electrical
resistance considerations. Assuming that a practically realizable minimum width is pre-
determined, this section will demonstrate how to construct the most stretchable serpentine
shape with CB theory. For a given w, the mathematical procedure of finding out the optimal
shape under certain geometric constraints is to identify three equations to solve for the three
unknowns, w/R, l/R and . The first equation comes from the non-overlapping requirement,
i.e. the distance between the two nearest ribbons, X as defined in Figure 2.9 (a) should be
larger or equal to 0, i.e.
𝑋 = (𝑅 −𝑤
2) cos(𝛼) − 𝑙 sin(𝛼) − (𝑅 +
𝑤
2) (1 − cos(𝛼)) = 0. (2.28)
Solving this equation, we can obtain the largest possible 𝛼for given (w/R, l/R)
combinations. The second equation reflects the finite breadth constraint when considering
limited real estate on the circuit board, e.g. Y = 10w, where the breadth Y is defined in
Figure 2.9 (a)
𝑌 = 2𝑅 + 𝑤 + 2𝑅 sin(𝛼) + 𝑙 cos(𝛼) = 10𝑤. (2.29)
The third equation is the minimization of 𝜀𝑚𝑎𝑥 𝜀𝑎𝑝𝑝⁄ , i.e. minimizing the values
given by Equation (2.13). Since the optimization problem now reduces to a problem of
minimization under two constraints, we can certainly use Lagrangian multipliers.
Therefore, with given constraints of w and Y, the most stretchable serpentine shape is
depicted in Figure 2.9 (b). Shape optimization under other geometric constraints can be
formulated following similar approaches.

37
Figure 2.9 (a) Illustration of geometric constraints. (b) Optimal serpentine shape under the
constraint of X = 0 and Y = 10w.

38
2.6 DISCUSSIONS
There is another large group of non-buckling serpentine structures that has been
widely used for stretchable electronics [92-96]. For this group of structures, the thick, non-
buckling serpentines of stiff metal are embedded in a polymer matrix, so that the polymer
matrix can physically protect and support the conductive serpentine pathway. The existence
of the polymer matrix may affect the stretchability of the embedded serpentine structure.
We have performed finite element analysis to reveal 𝜀max in the serpentine structure when
the polymer matrix is uniaxially stretched. Figure 2.10 (a) shows the FEM model for both
freestanding and embedded serpentine structures and Figure 2.10 (b) plots 𝜀𝑚𝑎𝑥 𝜀𝑎𝑝𝑝⁄ as
a function of the matrix modulus 𝐸matrix against the CB (dashed line) and elasticity (solid
line) solutions for freestanding serpentines, which are flat since they are independent of
𝐸matrix. It shows that, when 𝐸matrix < 100 MPa, the FEM results agree well with the
analytical solutions for freestanding serpentines, which indicates that compliant polymer
matrices have almost no effect on serpentine stretchability.

39
Figure 2.10 Matrix stiffness effect for embedded serpentine. (a) Boundary conditions for
freestanding and embedded serpentine. (b) 𝜀max 𝜀app⁄ as a function of the matrix modulus
𝐸matrix against the CB (dashed line) and elasticity (solid line) solutions for freestanding
serpentines.

40
2.7 CHAPTER SUMMARY
In this chapter, we have adopted both CB theory and linear elasticity to study the
stretchability and effective stiffness of non-buckling freestanding serpentine structures. We
have also carried out FEM and experimental studies to validate these theories. While CB
theory only captures the strain and effective stiffness of narrow serpentines (ribbon width
to arc radius ratio is small), elasticity solutions are valid for both narrow and wide
serpentines. Surprisingly, we find that not all serpentines are more stretchable than their
linear counterparts, but they are always more compliant. Therefore, the optimization of
serpentine shapes relies on the theories we have developed and has been demonstrated
under practical constraints. When non-buckling serpentines are embedded in a polymer
matrix, we find that the matrix has no effect on serpentine deformations when it is more
than three orders of magnitude more compliant than the serpentine material. However,
when thin serpentine ribbons are bonded to polymer surfaces, both compliant and stiff
polymer substrates may affect the mechanical behavior of the serpentines. Such situations
will be discussed in the next chapter.

41
Chapter 3 Substrate-Supported Serpentines1,2
Other than freestanding serpentine structures, in many applications, stiff serpentine
thin films are supported by stiff or compliant polymer substrates, which help maintain the
integrity or bio-integration of the device. In such structures, the substrate stiffness and
serpentine-substrate adhesion may affect the stretchability of the serpentine thin films. In
this chapter, systematic experimental and numerical studies are conducted to investigate
those effects using indium tin oxide (ITO) as a representative brittle material. As ITO is
electrically conductive, serpentine ITO ribbons are stretched using in situ resistance
measurement to indicate the mechanical failure, which is validated by in situ scanning
electron microscope (SEM) and optical microscope observation.
1 S. Yang, B. Su, G. Bitar, N. Lu*, “Stretchability of indium tin oxide (ITO) serpentine thin films supported by Kapton substrates,” International Journal of Fracture, vol. 190, no. 1-2, pp. 99-110, Nov, 2014. Author contributions: S. Y. conducted device design, FEM and analytical analysis. S. Y., B. S. and G. B. performed fabrication and testing. N. L. supervised and coordinated the project. N. L. and S. Y. wrote the paper. 2 S. Yang, E. Ng, N. Lu*, “Indium Tin Oxide (ITO) serpentine ribbons on soft substrates stretched beyond 100%,” Extreme Mechanics Letters, vol. 2, pp. 37-45, Jan, 2015, 2015. Author contributions: S. Y. conducted device design and FEM analysis. S. Y. and E. N. performed fabrication and testing. N. L. supervised and coordinated the project. N. L. and S. Y. wrote the paper.

42
3.1 OBJECTIVE AND OVERVIEW
Although freestanding serpentine structures can provide extraordinary
stretchability and compliance, they have a hard time to maintain their shapes without any
underlying support. Therefore, bonding serpentine ribbons to polymer substrates is a
popular strategy for building stretchable electronics [71, 76, 77, 91, 97-103]. Because of
the constraint provided by the polymer substrate, the mechanical behavior of the serpentine
ribbons can be very different from their freestanding counterparts. Such constraint is
dictated by the substrate stiffness as well as the serpentine-substrate adhesion [86].
In the field of flexible electronics, polymers such as polyimide and polyethylene
terephthalate (PET) are popular substrates on account of their mechanical stiffness which
protects electronic components they host from accidental stretches. For example, Kapton,
which is a polyimide film developed by DuPont, has been widely used in the fabrication of
novel flexible devices such as flexible displays [9, 104], rollable solar cells [105], flexible
2D electronics [28, 29] and photonics [19], and energy generators [99, 101]. As a
transparent, conductive material, indium tin oxide (ITO) is widely used in conventional
rigid displays [106-108], touch panels [109-111] and solar cells [112-114]. However, it is
too brittle to be used in highly flexible devices, even when patterned into serpentine shapes
on Kapton or PET substrates. This suggests that serpentines do not always enhance
deformability, and that substrate can play a significant role in serpentine behavior.
By contrast, serpentine structures have proved to be very successful in stretchable
electronics when the substrates are stretchable polymers such as elastomers [115, 116],
stretchable medical tapes, i.e. Tegaderm (3M) [91], and elastic fabrics [10]. Examples
include epidermal electronics [63], inflatable balloon catheters [5], 3D “heart sock” [117,
118], stretchable lithium ion batteries [71] and stretchable antennae [119, 120]. This
suggests substrate compliance is a critical condition for serpentines to be stretchable.
43
The mechanics of polymer supported serpentines have been studied by many
researchers. The mechanics of metallic serpentines has been studied extensively through
both experimental [70, 84, 86, 95] and theoretical/numerical means [83, 87, 88, 121].
Except for metal-based devices, stretchable continuous ceramic structures have also found
wide application where high stretchability and large areal coverage is needed. For instance,
filamentary serpentine single crystalline silicon has been transfer-printed onto elastomers
for stretchable amplifiers and solar cells [63]. Stretchable ceramics such as lead zirconium
titanate (PZT) ribbons [122] and zinc oxide (ZnO) ribbons [123] are used in biomechanical
energy harvesting applications due to their superior piezoelectric properties [124].
However, up to now, ceramic serpentine ribbons are far less used than metal serpentines,
due to their challenging fabrication processes and less understood mechanical behavior.
While stretchable metallic serpentine ribbons can be fabricated on polymer substrates by
thin film deposition and patterning through either lift-off [84, 85] or etch-back [70, 86]
processes, so far no simple method is available for the fabrication of ceramic serpentine
ribbons on stretchable substrates. The only successfully demonstrated method is to
transfer-print ceramic nanomembranes (either silicon or ZnO) from silicon on insulator
(SOI) wafer to polymer substrates and patterning through dry etching can be done before
or after transfer [63, 123]. The stretchability of these brittle serpentine ribbons, however,
has never been tested.
This chapter presents systematic experimental and numerical studies of the
mechanical behavior of brittle serpentines supported by stiff and compliant substrates. ITO
is chosen as a representative brittle material in this study in order to avoid plasticity so that
electrical resistance can be used as a simple indictor of the mechanical integrity of the
serpentine ribbons. Using in situ electro-mechanical stretch tests, the effects of serpentine
geometry, substrate stiffness and serpentine-substrate adhesion are studied.

44
3.2 FABRICATION
3.2.1 Serpentine on Kapton
Serpentine on Kapton was fabricated through thin film deposition. Polyimide foils
(Dupont Kapton 50NH, 12.7 m) were cleaned in acetone and then isopropyl alcohol (IPA)
in an ultrasonic cleaner followed by deionized Water rinse. After dehydration, the cleaned
Kapton was covered by a molybdenum stainless steel stencil (Towne Technologies, Inc.)
with straight and serpentine-shaped openings and then loaded in a sputter deposition
chamber (AJA International, Inc.). The Kapton substrate was first cleaned with argon (Ar)
plasma in RF power when the base pressure reaches 5×10⁻⁶ torr. Immediately after cleaning,
200 nm thick ITO was then sputtered from an ITO target (Kurt J. Lesker) onto the Kapton
substrate through the openings on the stencil with a working gas pressure of 2×10⁻³ torr
and a RF power of 65 W. After deposition, the stencil was removed and specimens were
cut into rectangular pieces, each including a group of four to five ITO serpentine ribbons
with systematically varied shapes, as shown in Figure 3.1 (a)
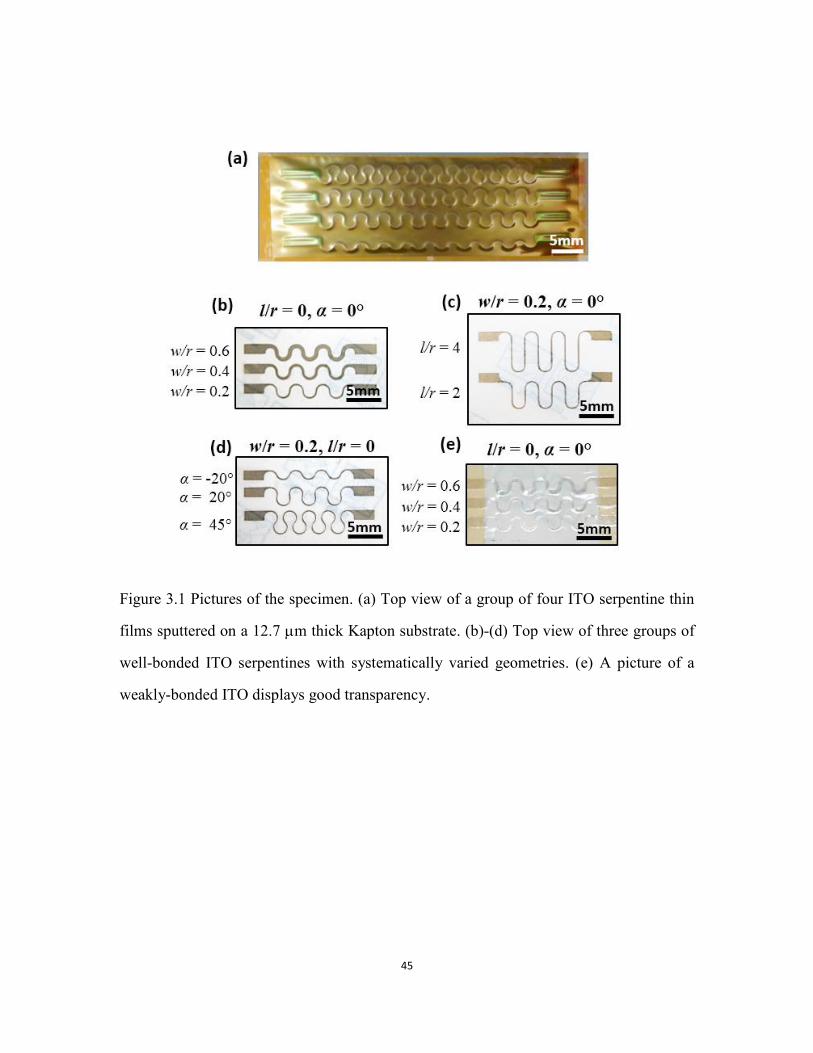
45
Figure 3.1 Pictures of the specimen. (a) Top view of a group of four ITO serpentine thin
films sputtered on a 12.7 m thick Kapton substrate. (b)-(d) Top view of three groups of
well-bonded ITO serpentines with systematically varied geometries. (e) A picture of a
weakly-bonded ITO displays good transparency.

46
3.2.2 Serpentine on Tegaderm
While ITO can be directly deposited onto stiff polymeric substrates like Kapton or
PET, it’s never an easy task to directly deposit brittle materials onto compliant substrates.
This is because during deposition, the huge mismatch in the Young’s moduli of the brittle
material and compliant substrate will induce wrinkles in the as-fabricated sample, as shown
in Figure 3.2 (a). And again, due to this huge mismatch in materials’ stiffness, channel
cracks in the stiff ceramic material will be easily triggered by even mild mechanical
operations, such as sample removal from the sample holder of the deposition system, as
shown in Figure 3.2 (b). Since ITO is too brittle to be directly deposited onto compliant
substrates, an alternative fabrication method has to be used to make the compliant
substrate-supported samples.
We successfully developed a completely dry patterning and transfer process to bond
ITO serpentine ribbons either weakly or strongly to compliant substrates. The whole
process is illustrated is Figure 3.3. Figure 3.3 (a) shows a piece of 13 m thick transparent
polyethylene terephthalate (PET) film (Goodfellow Corp.) pre-cleaned by acetone and
isopropyl alcohol (IPA) and attached to a thermal release tape (TRT) (Semiconductor
Equipment Corp.), which is supported by a cutting mat. The cutting mat is fed into an
electronic cutting machine (Silhouette Cameo) which can cut the PET with serpentine-
shaped seams as shown in Figure 3.3 (b). The cut PET on TRT is peeled off the cutting mat
(Figure 3.3 (c)) and loaded into a magnetron sputter system (AJA International, USA)
where 200 nm thick ITO is deposited from an ITO target (Kurt J. Lesker Company) on the
PET with base pressure of 1.0 × 10⁻⁷ torr , working gas (argon) pressure of 2.0 ×
10−3 torr, and RF power of 60 W (Figure 3.3 (d)). After deposition, the ITO covered PET
is transferred to another TRT as shown in Figure 3.3 (e). To achieve well-bonded
serpentines, 5 nm Ti and 50 nm SiO2 are sputtered on the backside of PET, i.e., the surface
47
not covered by ITO, as shown in Figure 3.3 (f). When the TRT is heated to 115 °C on a hot
plate, the excessive PET can be easily peeled off, leaving only serpentine ribbons on the
TRT (Figure 3.3 (g)). The serpentine ribbons can be transferred onto Tegaderm (3M), a
transparent wound dressing polymer tape with thickness of 47 m and Young’s modulus
of 7.43 MPa, whose adhesive surface is treated by ultraviolet ozone (UVO) for 5 minutes
(Figure 3.3 (h)), rendering the final sample as shown in Figure 3.3 (i). UVO treated polymer
surfaces are hydrophilic and able to form strong chemical bonding through condensation
reactions with the SiO2 layer deposited on the backside of the PET. For weakly-bonded
samples, SiO2 deposition (Step (f)) and UVO treatment of Tegaderm are omitted, but the
native adhesive on Tegaderm can still ensure successful transfer of the serpentine ribbons.
The whole process takes less than 15 minutes excluding the deposition time and the yield
is almost 100%. Other than brittle materials, it has also been proven that this “cut-and-
paste” method is effective in patterning metal-on-polymer laminates, which will be
discussed in the next chapter. With this new fabrication method, ITO serpentine ribbons
weakly- and well-bonded on compliant Tegaderm substrate can be fabricated and the top
views are shown in Figure 3.1 (b)-(e). Figure 3.1 (b)-(d) show groups of as-fabricated, well-
bonded ITO/PET serpentines on Tegaderm. While thin ITO film should exhibit high
transparency, the dark color of the serpentine ribbons in the well-bonded samples is due to
the presence of the Ti and SiO2 adhesive layers. Figure 3.1 (e) shows the weakly-bonded
serpentines without the Ti and SiO2 layers and the transparency of ITO thin film is
evidenced.

48
Figure 3.2 ITO thin film directly deposited onto 10:1 PDMS substrate with sputter
deposition system. Scotch tape adhered to the PDMS on both sides for sealing purpose. (a)
Top view for sample right after deposition. Due to the different thermal expansion
coefficients of ITO and PDMS, wrinkles develop in the as-fabricated sample. (b) Top view
for samples with Scotch tape peeled off to the right side of the ITO film. Due to the
brittleness of ITO thin film, channel cracks develop as a consequence of a relatively mild
mechanical operation.

49
Figure 3.3 Schematics of the dry, bench top fabrication process of stretchable ITO
serpentines on Tegaderm: (a) laminating 13 m thick PET on TRT on cutting mat. (b) using
an electronic cutter to carve serpentine-shaped seams on PET. (c) peeling TRT-supported
PET from the cutting mat. (d) sputtering 200 nm thick ITO on PET. (e) transferring ITO
covered PET from one TRT to another with the backside of PET exposed. (f) sputtering 5
nm Ti and 50 nm SiO2 on the backside of the PET (for weakly-bonded serpentines, this
step is skipped). (g) removing unwanted PET, leaving only ITO_PET serpentines on the
TRT. (h) printing the ITO_PET serpentine ribbons on Tegaderm. (i) the final sample.

50
3.3 METHODS
3.3.1 Electrical Resistance Measurement
Since ITO is mechanically brittle and electrically conductive, resistance vs. applied
strain curves have been widely adopted to indicate the overall mechanical integrity of thin
ITO films as a function of strain [125, 126]. Figure 3.4 (a) shows the schematic for the
experimental setup for Kapton-supported ITO specimen. To perform uniaxial tension tests,
Kapton sheets with a group of ITO serpentine ribbons are gripped on a home-made
stretcher and applied displacements are obtained by measuring the change of the gauge
length between the grips. The applied strain, app, is then calculated as the ratio of the
applied displacement to the initial gauge length. The ITO films are connected to external
multi-channel data acquisition (DAQ) system (NI USB-6225) through an anisotropic
conductive film (ACF). The data acquisition system is configured to conduct simultaneous
resistance measurements up to five channels, which enables the resistance change of each
serpentine ribbons in the same group to be monitored simultaneously. The normalized
resistance vs. applied strain result for a straight ITO specimen is provided in Figure 3.4 (b).
Due to the brittle nature of the ITO thin film, channel cracks will develop when the local
strain reaches the material’s intrinsic failure strain and it will not take too long for the film
to completely lose its electrical conductivity, which is reflected by the sudden increase of
the curve in this plot. If we adopt the failure criterion of 10% deviation from initial
resistance, the strain-to-rupture of a straight, Kapton-supported ITO sample is found to be
1.08%, which agrees with 1% from previous studies [125, 126], indicating that our
electrical resistance measurement is a good indicator of the damage state in straight ITO
ribbons.
Figure 3.5 (a) depicts the experimental setup for a Tegaderm-supported ITO
specimen. It is almost the same as that of the Kapton-supported ITO specimen except that,

51
in this case, a webcam is used to perform top-down in situ observation of the failure
behavior of serpentine ribbons when they are under uniaxial tension. Figure 3.5 (b) shows
normalized resistance vs. strain curves for a straight sample and a typical serpentine-shaped
sample, with an expanded view included as the inset. The plot shows that the stretchability
of a straight ITO ribbon is around 1.12%. For the serpentine specimen shown in Figure 3.5
(b), whose shape is given by 𝑤/𝑟 = 0.2, 𝑙/𝑟 = 2, 𝛼 = 0°and whose adhesion to Tegaderm
is weak, the stretchability is found to be 113%, which represents a 100 fold enhancement
of the straight ITO stretchability. It is the first time that a continuous ITO ribbon can be
stretched beyond 100%.

52
Figure 3.4 The electromechanical setup for Kapton-supported ITO specimen. (a)
Schematics of the experimental setup for the in situ electrical resistance measurement of
the ITO serpentines subjected to uniaxial tension. (b) A resistance vs. applied strain curve
of a linear ITO ribbon on Kapton substrate.

53
Figure 3.5 The electromechanical setup for Tegaderm-supported ITO specimen. (a)
Schematics of the experimental setup for the in situ electrical resistance measurement of
the ITO serpentines subjected to uniaxial tension. (b) Resistance vs. strain curves of a
straight and a serpentine ribbon.

54
3.3.2 SEM Observation - Serpentine on Kapton
To validate that resistance measurement can also sufficiently reflect the damage
state in serpentine thin films, we tried to compare the strain-to-rupture measured by crack
density and electrical resistance. Semi-in situ scanning electron microscope (SEM) tension
test was preformed to obtain the crack density vs. applied strain curve and the results are
summarized in Figure 3.4. The SEM picture in Figure 3.4 (a) indicates that when the
Kapton-bonded serpentine ribbons are subjected to uniaxial tension, the inner edge of the
crest of the serpentine is where cracks like to initiate. This observation can later be
explained by the strain concentration at the inner crest using FEM. We therefore focus on
this area and obtain a series of snapshots at different levels of applied strain as shown in
Figure 3.4 (b). The defect appearing in all snapshots serves as a reference point to align the
frames. Starting with a crack free snapshot at app = 1.3%, a channel crack perpendicular to
the tensile (horizontal) direction first emanates from the defect at app = 1.4%. Since then,
the number of cracks within the rectangular box has gradually increased with increasing
app. A crack density vs. applied strain curve (black) can be offered in Figure 3.4 (c), along
with the resistance vs. applied strain curve (blue) which is obtained from the semi-in situ
electrical measurement. By adopting the “10% deviation” criterion, the strain-to-rupture
deduced from the crack density measurements is 1.3% whereas it is determined to be 1.45%
from the resistance measurement. Similar discrepancy between crack density and electrical
resistance measurements has been observed in straight ITO-on-Kapton specimens [125,
126]. Figure 3.4 (d) offers a possible explanation to such discrepancy. Defects in ITO thin
films induced either by imperfections in the Kapton substrates or during ITO deposition
tend to give rise to half or misaligned channel cracks, as highlighted in Figure 3.4 (d). The
presence of these types of cracks has less effect on the overall resistance of the ribbon
compared to perfectly straight channel cracks shooting across the whole ribbon width.
55
Therefore there is a small strain lag when the sharp increase in the resistance curve is
compared to the crack density curve. Despite the small lag, the resistance is able to capture
the failure of the ITO serpentine in a much more experimentally economic way.

56
Figure 3.6 Channel cracks in ITO. (a) One of many SEM micrographs showing channel
cracks emanating from the inner edge of the crest and propagating perpendicular to the
tensile (horizontal) direction. (b) A sequence of SEM snapshots showing the evolution of
crack density with increased applied strain. (c) The crack density and electrical resistance
of an ITO serpentine as functions of the applied strain. Strains at which the curves blow up
are defined as the strain-to-rupture. (d) Half or misaligned cracks are associated with
defects in ITO films.

57
3.3.3 Optical Microscopic - Serpentine on Tegaderm
For Tegaderm-supported ITO serpentine structures, the failure behavior of the
serpentine thin films depend on the serpentine geometry as well as the presence of the
adhesive layer. The behavior of ITO serpentines during stretch was continuously observed
by a top-down webcam. Two representative results are shown in Figure 3.7. Figure 3.7 (a)
shows the deformation of a group of weakly-bonded serpentine samples with systemically
varying ribbon width that are under 50% uniaxial stretch. It is evident that the narrowest
serpentine, i.e. the one with 𝑤/𝑟 = 0.2, is almost fully debonded and straightened when
it ruptures while the wider serpentines rupture before debonding, which has been validated
by our electrical resistance measurement as will be discussed later. Figure 3.7 (b) shows
the result for a well-bonded serpentine that has small ribbon width and long arm length.
Due to the strong constraint from the substrate, compressive stress builds up in the
serpentine arm, which is in the direction perpendicular to the stretch direction, which
induces out-of-plane buckling of the arm, as shown in Figure 3.7 (b). The out-of-plane
buckling will cause a large tensile strain in the top surface of the serpentine arm and
therefore results in reduced stretchability, which has been confirmed by the electrical
resistance measurement.

58
Figure 3.7 Optical top-down image for two representative Tegaderm-supported ITO
serpentine samples. (a) A group of serpentines with varying ribbon width that are weakly
bonded to Tegaderm substrate. (b) ITO serpentine with shape 𝑤/𝑟 = 0.2, 𝑙/𝑟 = 3, 𝛼 = 0𝑜
that is well bonded to Tegaderm substrate.

59
3.4 RESULTS
3.4.1 Serpentine on Stiff Substrate
For stiff substrate-supported structure, resistance results of different ITO serpentine
shapes as a function of the applied strain are plotted in Figure 3.8. Figure 3.8 (a) studies
the effect of 𝑤/𝑟 with 𝑙/𝑟 fixed to be 0 and 𝛼 fixed to be 0º. It is evident that the width
has a monotonic effect on the strain-to-rupture of the serpentine, i.e. the strain-to-rupture
increases when 𝑤/𝑟 decreases. This indicates that provided the same arm length and arc
opening angle, narrower serpentine ribbons are more stretchable. Among the four
serpentine shapes we tested, the one with w/r = 0.2 exhibited a strain-to-rupture of 1.25%,
which is 15.7% higher than the straight ribbons as shown in Figure 3.4 (b). Despite of the
enhancement, the stretchability of ITO serpentine ribbons bonded to Kapton substrate is
still far less than freestanding or elastomer-supported metallic serpentine ribbons [70, 83,
84, 86], due to first the constraint from the stiff Kapton substrate which suppresses both in-
plane rigid body rotation and out-of-plane twist of the ribbons and second the intrinsic
brittleness of the ITO. Figure 3.8 (b)&(c) suggest that the effect of arm length and arc
opening angle on the serpentine stretchability are limited, which is due to the strong
constraint from the stiff substrate on serpentine. Figure 3.8 (d) studies the effect of for
V-shaped serpentines, with w/r fixed to be 0.5, l/r fixed to be 0 and varying from -60º to
-15º. It shows that, although serpentines with = -45º, -30º, and -15º share very similar
stretchability, = -60º serpentine clearly shows lower stretchability. All of these
experimental observations can be explained by the FEM results.

60
Figure 3.8 Results of the multi-channel electrical resistance measurement during uniaxial
tensile tests. (a) Effect of w/r: smaller w/r leads to delayed resistance blow-up (b) Effect of
l/r is negligible on the failure strain. (c) Effect of 𝛼 on the stretchability of horseshoe-
shaped serpentines is also negligible. (d) Effect of 𝛼 on V-shaped serpentines is only
significant when falls in the far negative (less tortuous serpentines).

61
ABAQUS/CAE is used to build the finite element model of a unit cell of the
Kapton-supported ITO serpentine as depicted in Figure 3.9 (a). Due to the large difference
in the thickness of ITO and Kapton (200 nm vs. 12.7 m), the ITO thin film is modeled by
shell elements, whereas the Kapton substrate is modeled by 3D solid elements. ITO and
Kapton are assumed to be linear isotropic materials with moduli of 118 GPa and 2.5 GPa,
and Poisson’s ratios 0.27 and 0.34, respectively. Tie constraints are applied between the
substrate and the film and tensile strain app = 1% is applied on the Kapton substrate along
the x direction. Simulation results suggest the maximum strain always occurs at the inner
edge of the arc, as shown in Figure 3.9 (b), which is consistent with our experimental
observation. Based on Equation (2.3) the following equation should hold
𝜀𝑚𝑎𝑥𝜀𝑎𝑝𝑝
=𝜀𝑐𝑟𝜀𝑎𝑝𝑝𝑐𝑟
(3.1)
which provides a way to quantitatively compare the FEM and experimental results.
One representative comparison is plotted in Figure 3.9 (c), in which the black curve is the
FEM result and the blue curve is the result from experiments. Therefore in the most ideal
cases, the black and blue curves should fully overlap. Figure 3.9 (c) shows both methods
justify the monotonic effect of ribbon width on the stretchability of Kapton-supported
serpentine structure. It is worthwhile to note that in Figure 3.9 (c), for serpentine ribbons
with 𝑤/𝑟 > 0.4, their stretchability is lower than that of straight ribbons, since the curves
are about 1.

62
Figure 3.9 Comparison between FEM and experimental results. (a) Boundary condition
and (b) contour plot of xx of a unit cell serpentine under applied strain app = 1% on the
Kapton substrate. (c) Effect of w/r: narrower ribbons render lower strains.

63
Empirical geometry-stretchability relations have also been proposed to predict the
stretchability of Kapton-supported serpentine thin films. In this analysis we use three new
dimensionless geometric variables 𝑏/𝑠, 𝑏/𝑟 and 𝑤/ℎ, where b is the breadth of a unit
cell, and s and h are the total length and height of one unit cell, as labeled in Figure 3.10
(a). The three new variables are chosen in order to account for the “island” effect of
serpentine breadth and the stress/strain concentration at the inner edge of the crest [127].
Therefore for every serpentine shape, the three independent geometrical variables
𝑤/𝑟, 𝑙/𝑟 and 𝛼 can be converted to 𝑏/𝑠, 𝑏/𝑟 and 𝑤/ℎ. A characteristic dimensionless
length scale λ can be defined and is assumed to be linearly proportional to 𝜀𝑚𝑎𝑥 𝜀𝑎𝑝𝑝⁄
through
𝜀max
𝜀app= 𝑚1𝜆 + 𝑚2.
(3.2)
Equation (3.2) suggests that the stretchability of the serpentine is completely
determined by . To obtain 𝑚1 and 𝑚2 we build finite element models for different
serpentine shapes, i.e. different combinations of 𝑏/𝑠, 𝑏/𝑟 and 𝑤/ℎ, and find the best
empirical equation for λ as
λ = (𝑏
𝑆)0.15
× (𝑏
𝑟)0.38
[(𝑤
ℎ)2
− 0.32𝑤
ℎ+ 0.42], (3.3)
and the corresponding linear regression coefficients are obtained as 𝑚1 = 0.0082 and
𝑚2 = 0.0064 . Comparison of experiments, FEM and Equation (3.3) shows good
agreement (Figure 3.10 (b)). By using different coefficients 𝑚1 and 𝑚2, our empirical
equation is also capable of predicting the stretchability of serpentines made out of other
materials such as gold and silicon, as shown in Figure 3.10 (c). The good agreement of the
prediction and FEM result proves that the characteristic dimensionless length scale given
by Equation (3.3) is applicable for different film-substrate material combinations as long
as the substrate is stiff enough to suppress any in-plane rotation or out-of-plane twist of the
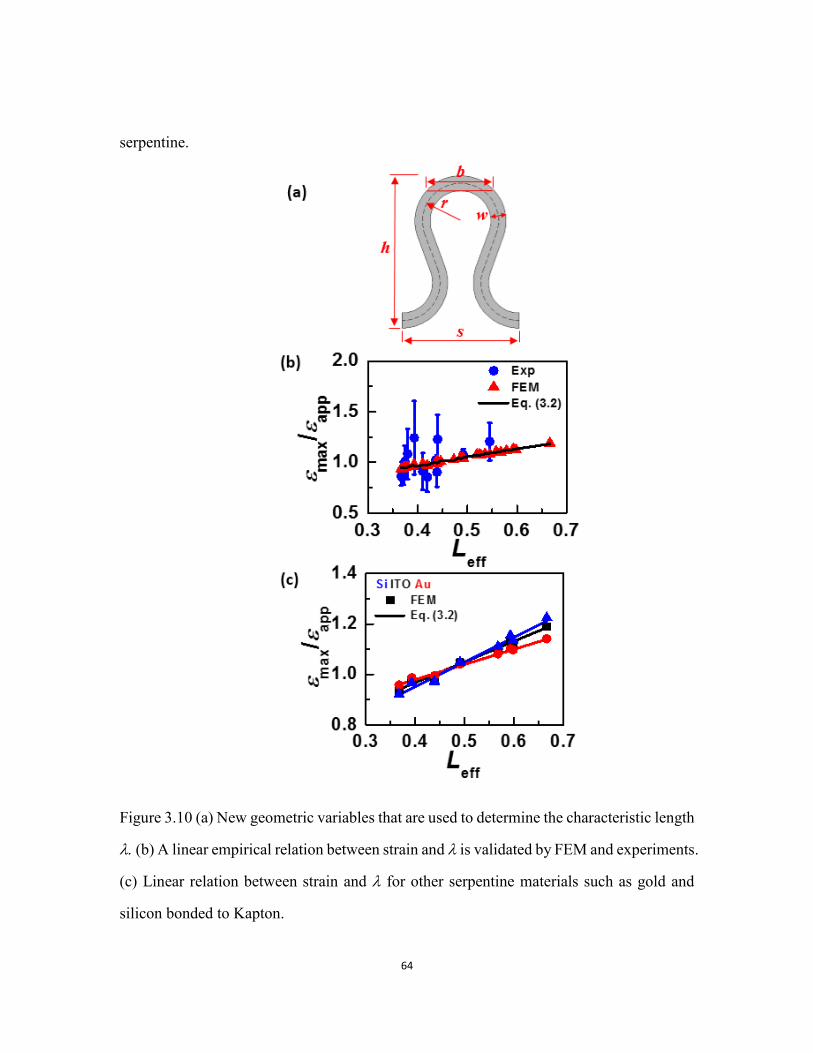
64
serpentine.
Figure 3.10 (a) New geometric variables that are used to determine the characteristic length
(b) A linear empirical relation between strain and is validated by FEM and experiments.
(c) Linear relation between strain and for other serpentine materials such as gold and
silicon bonded to Kapton.
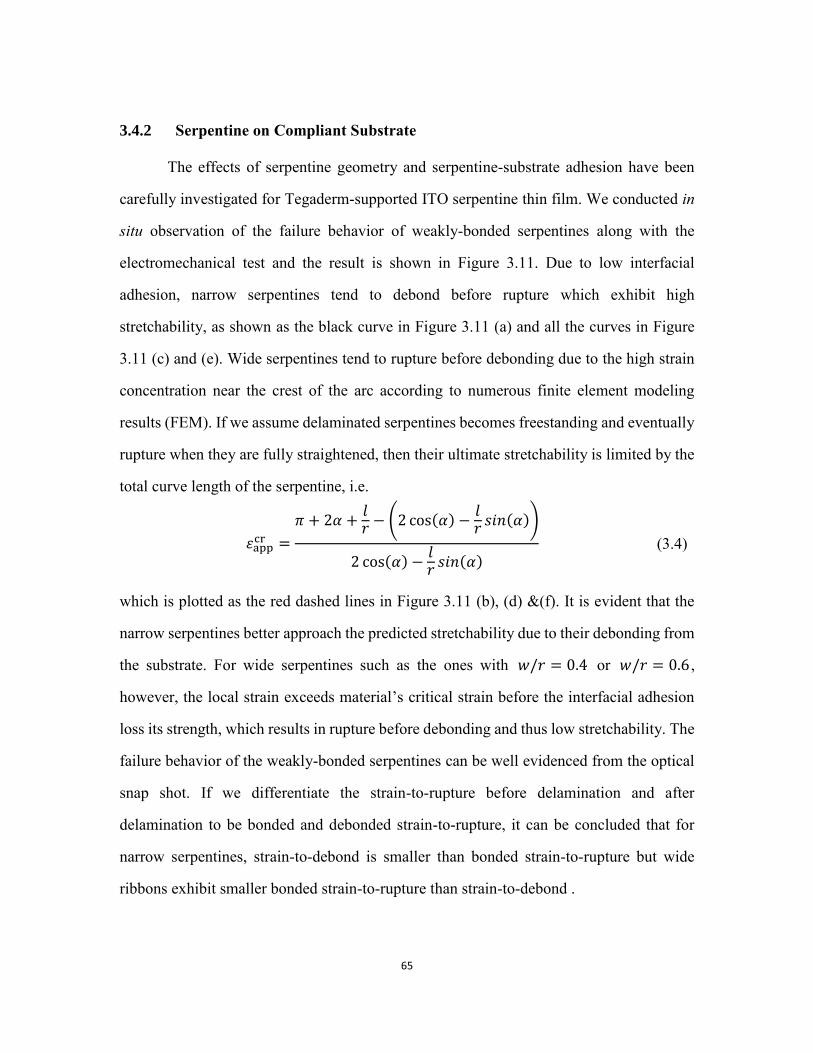
65
3.4.2 Serpentine on Compliant Substrate
The effects of serpentine geometry and serpentine-substrate adhesion have been
carefully investigated for Tegaderm-supported ITO serpentine thin film. We conducted in
situ observation of the failure behavior of weakly-bonded serpentines along with the
electromechanical test and the result is shown in Figure 3.11. Due to low interfacial
adhesion, narrow serpentines tend to debond before rupture which exhibit high
stretchability, as shown as the black curve in Figure 3.11 (a) and all the curves in Figure
3.11 (c) and (e). Wide serpentines tend to rupture before debonding due to the high strain
concentration near the crest of the arc according to numerous finite element modeling
results (FEM). If we assume delaminated serpentines becomes freestanding and eventually
rupture when they are fully straightened, then their ultimate stretchability is limited by the
total curve length of the serpentine, i.e.
𝜀appcr =
𝜋 + 2𝛼 +𝑙𝑟 − (2 cos
(𝛼) −𝑙𝑟 𝑠𝑖𝑛
(𝛼))
2 cos(𝛼) −𝑙𝑟 𝑠𝑖𝑛
(𝛼) (3.4)
which is plotted as the red dashed lines in Figure 3.11 (b), (d) &(f). It is evident that the
narrow serpentines better approach the predicted stretchability due to their debonding from
the substrate. For wide serpentines such as the ones with 𝑤/𝑟 = 0.4 or 𝑤/𝑟 = 0.6 ,
however, the local strain exceeds material’s critical strain before the interfacial adhesion
loss its strength, which results in rupture before debonding and thus low stretchability. The
failure behavior of the weakly-bonded serpentines can be well evidenced from the optical
snap shot. If we differentiate the strain-to-rupture before delamination and after
delamination to be bonded and debonded strain-to-rupture, it can be concluded that for
narrow serpentines, strain-to-debond is smaller than bonded strain-to-rupture but wide
ribbons exhibit smaller bonded strain-to-rupture than strain-to-debond .

66
Figure 3.11 Resistance vs. strain plots and stretchability plots for weakly-bonded
serpentines. (a)&(b) Serpentines with different ribbon widths (w effect). (c)&(d)
Serpentines with different arm lengths (l effect). (e)&(f) Serpentines with different arc
angles ( effect). The scale bar is 2 mm in all insets.

67
Figure 3.12 demonstrates the stretchability of well-bonded ITO serpentine on
Tegaderm. Figure 3.12 (a), (c) &(e) suggest that the overall the stretchabilities for these
samples are lower compared with weakly-bonded ones because of retarded detachment
from substrate, however it does not mean that delamination is fully prohibited. Figure 3.12
(b), (d), (f) provide a direct comparison of the stretchability of weakly-bonded (red dash
line) and well-bonded (solid black line) samples. While Figure 3.12 (b) suggests there is
no significant change of failure mechanism for a serpentine with 𝑙/𝑟 = 0, 𝛼 = 0° due to
the close alignment of the two data sets, Figure 3.12 (d) &(f) indicate clear deviations for
serpentines with large 𝑙/𝑟 and 𝛼 . This is because compliant substrates develop
contraction in the transvers direction due to Poisson’s effect [54, 128-131], which induces
buckling of a thin film that is well-bonded on the top of it (inset in Figure 3.12 (d) &(f)).
While carefully controlled buckling has been harnessed to achieve stretchable electronics
[54], buckled brittle thin films are susceptible to fracture due to the local tensile strain at
the buckled peaks or ridges [131, 132]. For serpentines with long arms or large arc angles
the transverse buckling will be more easily triggered, which leads to low stretchability for
such structures. Figure 3.12 (c)-(f) suggest the stretchability of well-bonded serpentines is
not always monotonic. While simply increasing the arm length or arc angle can enhance
the stretchability of weakly-bonded serpentines, it is no longer true for well-bonded
serpentines for two reasons. First, when the arm is too long, transverse buckle-delamination
within the arms can induce rupture of ITO and the longer the arm, the earlier the rupture.
The optimum arm length was found to be l/r = 1. Second, when 𝛼 is too large, strain-to-
rupture is reached before strain-to-debond is reached. The optimum arc angle is found to
be α=20°.
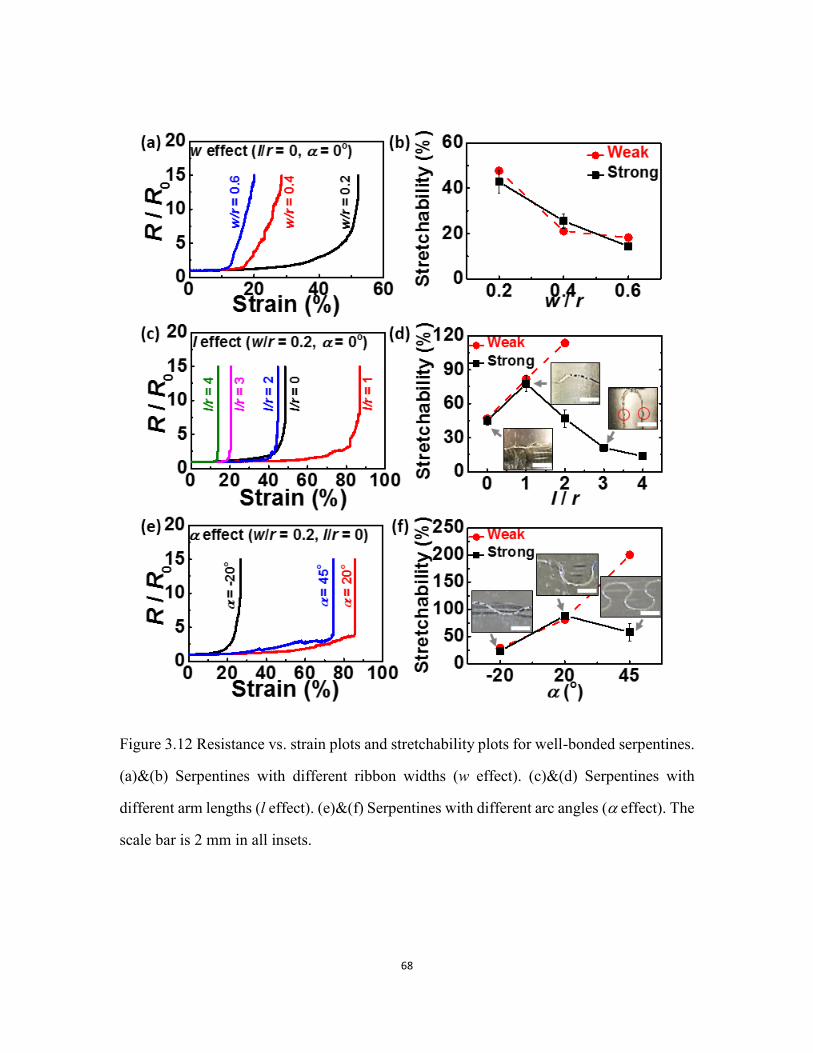
68
Figure 3.12 Resistance vs. strain plots and stretchability plots for well-bonded serpentines.
(a)&(b) Serpentines with different ribbon widths (w effect). (c)&(d) Serpentines with
different arm lengths (l effect). (e)&(f) Serpentines with different arc angles ( effect). The
scale bar is 2 mm in all insets.
69
3.5 CHAPTER SUMMARY
In this chapter, we have studied the stretchability of stiff and compliant polymer-
supported ITO serpentine thin films. It is found that when the substrate is stiff, the in-plane
rotation and out-of-plane buckling of the serpentine is completely suppressed, which leads
to low stretchability and very limited effects of the serpentine geometry. When the substrate
is compliant, the serpentine has some degree of freedom to rotate and buckle, which is also
affected by the serpentine-substrate interfacial adhesion. To demonstrate the stretchability
experimentally, an innovative bench-top manufacturing method has been developed to
fabricate ITO serpentine thin films on compliant polymers, and we were able to stretch ITO
serpentines by more than 100%. In the next chapter we will extend this new fabrication
method to manufacture stretchable devices.

70
Chapter 4 Cut-and-Paste Fabrication1,2
The conventional cleanroom-based micro-fabrication method is not suitable for
rapid prototyping or mass production of disposable medical patches such as epidermal
electronics. We therefore invent a dry, benchtop, freeform and portable manufacturing
method called the “cut-and-paste” method to manufacture disposable epidermal sensor
systems in a time and cost effective manner. Manufacturing quality has been carefully
investigated and pros and cons are explicitly discussed.
1 S. Yang, Y.-C. Chen, L. Nicolini, P. Pasupathy, J. Sacks, B. Su, R. Yang, D. Sanchez, Y.-F. Chang, P. Wang, D. Schnyer, D. Neikirk, N. Lu*, “"Cut-and-Paste" Manufacture of Multiparametric Epidermal Sensor Systems,” Advanced Materials, vol. 27, no. 41, pp. 6423-6430, Nov 4, 2015. Author contributions: S. Y., Y.-C. C., L. N., P. P., B. S., R. Y., N. L., D. N., and D. S. conducted device design, fabrication, calibration, and testing. S. Y. led the FEM analysis with J. S. and D. S.’s assistance. Y. C., P. W., S. Y., Y.-C. C., L. N. and R. Y. served as human subjects. L. N. and D. N. performed EP analysis. N. L., D. N., and D. S. supervised and coordinated the project. N. L., S. Y., Y.-C. C., L. N., P. P., D. N., and D. S. wrote the paper. 2 S. Yang, E. Ng, N. Lu*, “Indium Tin Oxide (ITO) serpentine ribbons on soft substrates stretched beyond 100%,” Extreme Mechanics Letters, vol. 2, pp. 37-45, Jan, 2015, 2015. Author contributions: S. Y. conducted device design and FEM analysis. S. Y. and E. N. performed fabrication and testing. N. L. supervised and coordinated the project. N. L. and S. Y. wrote the paper.

71
4.1 OBJECTIVE AND OVERVIEW
Conventional manufacturing process of epidermal electronics relies on standard
microelectronics fabrication processes. It involves vacuum deposition of thin films, spin
coating, photolithography, wet or dry etching and transfer printing [63, 133-139]. Although
it has proven to be effective, there are several limitations associated with such processes.
For example, this method depends on cleanroom-based facilities which are not portable,
vacuum deposition and photolithography are time consuming, chemicals used in wet
etching are hazardous to human body, wafers and masks used are expensive, and the rigid
wafer is not compatible with roll-to-roll process. In this chapter, we report an innovative
time- and cost-effective, benchtop, freeform, and portable fabrication method, which is
applied to manufacture high-quality epidermal sensors. Detailed fabrication process of this
new method is discussed and manufacture quality is investigated.
4.2 FABRICATION PROCESS
A schematic of the “cut-and-paste” fabrication process is shown in Figure 4.1,
snapshots of detailed experimental steps can be found in our recently published paper [91].
The process starts with laminating a commercially available metal-coated PET foil
(Goodfellow, USA) on a flexible, single-sided thermal release tape (TRT, Semiconductor
Equipment Corp., USA) with the metal side touching the adhesive of the TRT. The other
side of the TRT is then adhered to a tacky flexible cutting mat, as shown in Figure 4.1 (a).
The cutting mat is fed into an electronic cutting machine (Silhouette Cameo, USA) with
the PET side facing the cutting blade. By importing the AutoCAD design into the
Silhouette Studio software, the cutting machine can automatically carve the Au-on-PET
sheet with designed seams within minutes (Figure 4.1 (b)). Once seams are formed, the
TRT is gently peeled off from the cutting mat (Figure 4.1 (c)). Slightly baking the TRT on
a 115 °C hotplate for 1~2 minutes deactivates the adhesives on the TRT so that the excesses

72
can be easily peeled off by tweezers (Figure 4.1 (d)). The patterned devices are finally
printed onto a target substrate with native adhesives, which could be a temporary tattoo
paper (Silhouette) or a medical tape, such as 3M TegadermTM transparent dressing or 3M
kind removal silicone tape (KRST) (Figure 4.1 (e)), yielding an epidermal sensor system.
Steps illustrated by Figure 4.1 (a) to Figure 4.1 (e) can be repeated for other thin sheets of
metals and polymers, which can be printed on the same target substrate with alignment
markers, rendering a multimaterial multifunctional system. For well-trained users, the
entire process only takes about 15 minutes from beginning to end, which indicates that this
new method has a significant advantage over conventional cleanroom-based fabrication
approaches.

73
Figure 4.1 Schematics for the “cut-and-paste” process. (a) Au-PET-TRT (APT) laminated
on the cutting mat with PET being the topmost layer. (b) Carving designed seams in the
Au-PET layer by an automated mechanical cutting machine. (c) Peeling APT off the cutting
mat. (d) Removing excessive Au-PET layer after deactivating the TRT on hot plate. (e)
Printing patterned Au-PET layer onto target substrate. (f) Resulted epidermal sensor
systems (ESS) with Au being the topmost layer.

74
4.3 MANUFACTURING QUALITY
To develop a better understanding of the performance of this new fabrication
method and provide guidelines for future developments, we have carefully performed
studies on the resolution, surface profile, width uniformity and blade wear effect of this
new fabrication method by examining the rendered ribbon geometry.
4.3.1 Resolution Test
Epidermal sensors are designed to be at least as stretchable and conformable as the
human skin in order to survive different kinds of skin deformation while remaining in close
contact with human skin for high-fidelity bio-signal monitoring. According to previous
studies on the stretchability and conformability [140-143] of stretchable serpentine
structures, it is believed that the serpentine has to be minimized in width in order to be
highly stretchable and conformable. For our “cut-and-paste” method, the smallest feature
width, i.e. the resolution, mainly depends on the cutter’s intrinsic mechanical performance.
Figure 4.2 shows a representative resolution test. In the test, the same pattern is cut with
different ribbon widths, from 600 m down to 50 m. The raw material being cut in this
test is 9-m-thick Al on 12-m-thick PET foil (NEPTAPE® by NEPTCO, Inc.). It is
evident that the pattern can be successfully cut when ribbon width is set to 200 m, even
though the uniformity is compromised. When the ribbon width is set to be 100m or less,
the pattern can no longer be preserved. For our devices we set the ribbon width to be
400m in order to achieve high structural integrity and device functionality.

75
Figure 4.2 Resolution tests of the cutting machine. Pictures of the same seam pattern carved
on blue PET-Al foil (Neptco Inc.) with different ribbon width: (a) 600 m, (b) 400 m, (c)
300 m, (d) 200 m, (e) 100 m, and (f) 50 m, by the cutting machine. The resolution of
the cutting machine is determined to be 200 m.
76
4.3.2 Width Uniformity
Ideally the resulting ribbon width should be the same as the setting in computer,
however, due to the mechanical tolerance of the cutter, the width of the carved pattern
exhibits variation. Ribbon width uniformity is examined by measuring and summarizing
the widths of many cross-width lines which are evenly spaced along the median line of the
serpentine, as shown in Figure 4.3 (a). We used 25-m-thick Kapton sheet (Dupont) for
this study. The cutter was set to cut 400-m-wide ribbons but Figure 4.3 (b) indicates that
ribbon width distribution was centered on 340 m, with a standard deviation of 87 m.
4.3.3 Thickness Profile
Thickness profile of the cut ribbon has been examined by profilometer (Dektak 6M
stylus profilometer, vender, USA) at three different locations on one ribbon, (Figure 4.3
(c)). Cross-sectional profile in Figure 4.3 (d) indicates that the thicknesses of the cut ribbon
exhibit good consistency in different locations and are close to the thickness of the raw
material, which is 25 m.

77
Figure 4.3 Width uniformity and surface profile of the cut ribbons. (a) Image of sampling
spots for width uniformity investigation after cutting a 25 m thick Kapton sheet on TRT.
Ribbon width is 400 mm by drawing. (b) Width distribution fitted by Gaussian distribution
(black curve) with a mean of 340 m and a standard deviation of 87 m. (c) Image of
sampling spots for height profile investigation of the cut Kapton ribbon after excessive
parts removed. (d) Height profile of the Katpon ribbon, showing flat plateau and steep
transition zone.

78
4.3.4 Effect of Blade Tip Sharpness and Settings
Cutting quality is found to be highly dependent on the sharpness of the cutting blade.
The mechanical blade tip can be worn or destroyed and lose its sharpness, depending on
the cutting time, raw material, parameter setting and even mishandling of the cutter.
Therefore it is important to optically check the blade condition before running any cutting
job. Cutting jobs with different cutting parameters (see figure caption of Figure 4.4) have
been performed with the results displayed in Figure 4.4 (d)-(i). It is concluded that the
cutting thickness setting, thickness of the foil to be cut, and the blade condition are the most
important factors for cutting quality control. After the parametric study we came up with a
set cutting parameters, sharpness=5, cutting rate=2, thickness=1, that gives the best quality
for our device. The close-up of representative spots of our samples is shown in Figure 4.4
(j)-(l).

79
Figure 4.4 Effects of blade tip sharpness and cutting parameters. Images of a (a) new blade
(b) a used blade and (c) a destroyed blade. Cutting results for different parameter
combinations where KT stands for Kapton thickness, Sh for sharpness, Ra for cutting rate,
Th for thickness, NB for new blade, UB for used blade: (d) KT=25.4mm, Sh=5, Ra=1,
Th=7, NB (e) KT=25.4mm, Sh=10, Ra=1, Th=7, NB (f) KT=25.4mm, Sh=5, Ra=10, Th=7,
NB (g) KT=25.4mm, Sh=5, Ra=1, Th=20 NB (h) KT=12.7mm, Sh=5, Ra=1, Th=7, NB (i)
KT=25.4mm, Sh=10, Ra=1, Th=7, UB. Zoomed in images of final ESS cut by optimized
parameters: (j) crest of the Au RTD, (k) intersection of the Au EP sensor, (l) crest of the
stretchable Al coil.

80
4.4 CHAPTER SUMMARY
In this chapter, we have introduced a freeform “cut-and-paste” method to produce
stretchable devices in a time and cost effective fashion. The fabrication process was
described in detail and manufacturing quality has also been studied. Although the
resolution of the “cut-and-paste” method is not as good as photolithography-based methods,
the fabrication area can be significantly lager and the fabrication time is greatly reduced.
To demonstrate the “cut-and-paste” method, a multifunctional epidermal sensor system
(ESS) will be introduced in the next chapter.

81
Chapter 5 Multifunctional Epidermal Sensor System (ESS)1
Our body is radiating data about ourselves continuously. It is important to collect
and analyze biological data for fitness tracking, health monitoring and disease prevention.
Using our “cut-and-paste” fabrication method, we have successfully manufactured a
multimaterial, multiparametric epidermal sensor system (ESS) which can be noninvasively
laminated on human skin to continuously monitor electrocardiogram (ECG),
electromyogram (EMG), electroencephalogram (EEG), skin temperature, skin hydration
and the respiratory rate of the human body.
1 S. Yang, Y.-C. Chen, L. Nicolini, P. Pasupathy, J. Sacks, B. Su, R. Yang, D. Sanchez, Y.-F. Chang, P. Wang, D. Schnyer, D. Neikirk, N. Lu*, “"Cut-and-Paste" Manufacture of Multiparametric Epidermal Sensor Systems,” Advanced Materials, vol. 27, no. 41, pp. 6423-6430, Nov 4, 2015. Author contributions: S. Y., Y.-C. C., L. N., P. P., B. S., R. Y., N. L., D. N., and D. S. conducted device design, fabrication, calibration, and testing. S. Y. led the FEM analysis with J. S. and D. S.’s assistance. Y. C., P. W., S. Y., Y.-C. C., L. N. and R. Y. served as human subjects. L. N. and D. N. performed EP analysis. N. L., D. N., and D. S. supervised and coordinated the project. N. L., S. Y., Y.-C. C., L. N., P. P., D. N., and D. S. wrote the paper.
82
5.1 OBJECTIVE AND OVERVIEW
Many health conditions of the human body can be reflected by non-invasive
measurements of surface biosignals, such as surface ECG, surface EMG, surface EEG, skin
temperature, skin hydration and respiratory rate [141]. One of the main focuses in
measuring surface biosignals is to capture high fidelity and low noise data in real time.
Conventional measurement exploits rigid electrodes that are attached to human skin
through wet gels, which may cause skin irritation or may dry out after long-term wearing.
Emerging epidermal electronics exhibit low stiffness and high stretchability that are well
matched with human skin. They are demonstrated to be compelling alternatives to
conventional surface sensors. In Chapter 4, we developed a low-cost, bench-top “cut-and-
paste” method for manufacturing stretchable devices. As a demonstration, this chapter will
introduce a multimaterial, multifunctional epidermal sensor systems (ESS), manufactured
by this method. We will use this ESS to measure surface ECG, surface EMG, surface EEG,
skin temperature, skin hydration and respiratory rate.
5.2 LAYOUT OF THE EPIDERMAL SENSOR SYSTEM
The top view of a multimaterial, multiparametric ESS supported by transparent
temporary tattoo paper and its white liner is shown in Figure 5.1, which includes three Au-
based filamentary serpentine (FS) EP electrodes which can be used for measurement of
ECG, EMG and EEG, one Au-based FS resistance temperature detector (RTD), two Au-
based dot-ring impedance sensors (for hydration measurement), and an Al/PET-based
planar stretchable coil. In this picture, all Au-based sensors have the Au side facing up The
stretchable coil, however, has the blue colored PET facing up because PET has
demonstrated good biocompatibility [144-147] but some people’s skin can be allergic to
Al. For the three EP electrodes, the inter-electrode distance is set to be 2 cm for effective
EP signal recording [141]. The FS is designed with a 1/5 ribbon width to arc radius ratio

83
in order to balance the trade-off between stretchability and occupied area, according to our
recent mechanics of serpentine research [37]. The same FS design is not applicable to the
stretchable Al coil because it will consume too much space when more turns are needed
for higher inductance. Therefore a double-stranded serpentine design is proposed for the
Al-PET coil, as shown in Figure 5.1, which saves space without compromising the number
of turns or the stretchability. The two longhorns at the upper left and right corners of the
Au pattern serve as alignment markers for printing Au and Al devices on the same tape.
The overall size of this device is 7.5 cm × 5 cm, which ensures that this multifunctional
epidermal sensor system can fit well in the majority of parts of the human body, including
the chest, forehead, forearms and waist. The sensors are designed in such a way that they
exhibit high electrical sensitivity to biosignals as well as mechanical robustness to skin
deformations.

84
Figure 5.1 Top view of an ESS which incorporates three electrophysiological (EP)
electrodes (Au-PET), a resistance temperature detector (RTD) (Au-PET), two coaxial dot-
ring impedance sensors (Au-PET), and a wireless planar stretchable strain sensing coil (Al-
PET), all in filamentary serpentine (FS) layout.

85
5.3 ELECTROPHYSIOLOGICAL SENSOR
Electrophysiological (EP) signals on the surface of human skin measure the flow
of ions in the underlying tissues and organs, which reflects their health and function. For
example, noninvasive ambulatory monitoring of ECG on human chest can help detect
multiple important features of heart malfunction like irregular heartbeat (arrhythmia) [148].
EMG reflects human muscle activity and can identify neuromuscular diseases and serve as
a control signal for prosthetic devices or other machines [141]. EEG measured from the
surface of the human scalp can be used to not only capture cognitive and memory
performance [149], but also chart brain disorders like epilepsy [150] and stroke [151].
Figure 5.2 (a)&(b) show ECG measured from human chest using silver/silver
chloride (Ag/AgCl) gel electrodes and the ESS without applying any conductive gels. Both
ESS and Ag/AgCl electrodes are connected to a small portable amplifier (AvatarEEGTM)
with a shared ground port. Out of the three EP electrodes integrated on the ESS, as shown
in Figure 5.1, the center one is utilized as a ground and the other two electrodes measure
EP signals in a bipolar montage to reflect the difference in electrical potential. Signals
recorded by this amplifier are processed using a Principle Component Analysis based
algorithm [152] with the final results shown in Figure 5.2 (b). It is evident that the important
features of ECG are captured by both electrodes, but the ECG measured by our ESS
demonstrates higher amplitude and more details compared with the Ag/AgCl electrodes.
Specifically, the average amplitude of the P waves in the ECG measured by our ESS is
around 1.9 times of that measured by the Ag/AgCl electrodes.
Except for EEG, the same type of ESS has also been placed on the forearm,
specifically over the flexor muscles, to measure the EMG during two hand clenches (Figure
5.2 (c)&(d)). The intensity of the gripping force can be measured by a commercial
dynamometer (Exacta™) and it is clear that the higher gripping force corresponds to higher

86
signal amplitude in the measured EMG. Specifically, the average amplitude of the signal
envelope corresponding to 44 N gripping force is about 3 times of that for a gripping force
of 14 N.
Finally the EEG has been measured by placing Ag/AgCl electrodes and the ESS on
human forehead. Both electrodes are referenced against one FS electrode placed behind the
human ear on the mastoid location, as shown in Figure 5.2 (e). Signals are high and low
passed filtered at 0.1Hz and 40 Hz respectively and frequency spectrums are calculated
using standard fast Fourier transformations (FFT). The EEG measurements between
conventional and ESS agree remarkably well and their FFT spectrums almost fully overlap
in the upper right panel of Figure 5.2 (f), which confirms that conventional and ESS
electrodes are almost indistinguishable in measured EEG signals, but the ESS offers
additional merits including conformability, compliance and customizable electrode
patterns. The lower right panel of Figure 5.2 (f) compares the FFT of the ESS measured
EEG signal while the participant maintained eyes open and eyes closed. One can note the
expected increase in relative alpha power associated with the eyes closed period relative to
eyes open (centered around 10 Hz). Figure 5.2 (f) shows the maximum amplitude of the
relative alpha power increased by 1.75 times from eyes open period to eyes close period.

87
Figure 5.2 ECG, EMG and EEG measurements by ESS. (a) ESS placed on human chest
along with conventional Ag/AgCl electrodes to measure ECG. (b) ECG simultaneously
measured by ESS (red) and Ag/AgCl electrodes (black). Stronger ECG signals are obtained
by the ESS. (c) ESS attached on human forearm for EMG measurement when the subject
is gripping a commercial dynamometer with different forces. (d) EMG result from ESS in
which Higher amplitude corresponds to higher gripping force. (e) EEG measured on human

88
forehead by both ESS and Ag/AgCl electrodes. (f) Two frequency spectrum of the EEG
are well overlapped. 10 Hz alpha rhythm measured by ESS is clearly visible when eyes are
closed.

89
5.4 RESISTANCE TEMPERATURE DETECTOR
In addition to EP signals, skin temperature is also an important indicator of human
health. In our EES, the ultrathin, stretchable RTD can be built as a narrow but long ribbon
of Au FS as labeled in Figure 5.1, which has a high initial resistance R0 and a predictable
change in resistance as the temperature changes. In order to eliminate the deformation
effect on the final resistance reading, strain induced resistance is evaluated and the result
is plotted in Figure 5.3 (a). It shows the resistance reading for RTD is stable for 25% applied
strain, which is around the maximum strain that human skin can suffer without permanent
damage. This means the temperature change due to strain is negligible. RTD resistance and
temperature changes are related through the following equation
∆𝑅
𝑅0= 𝛼(𝑇 − 𝑇0) (5.1)
Based on our experimental result (Figure 5.3 (b)) the temperature coefficient of
resistance is found to be α = 0.0017 °C-1. To perform skin temperature measurement, the
epidermal RTD was attached on a human forearm, along with a commercial thermocouple
(TMD-56, Amprobe) as pictured in Figure 5.3 (c). Skin temperature measured by the
epidermal RTD and the thermocouple are plotted in Figure 5.3 (d). The experiment shows
that skin temperature is initially stabilized at around 30 °C. At t = 2’13”, an ice bag is
brought in contact with the RTD and skin for 1 minute and then removed. The
corresponding temperature drop and recovery are clearly visible in Figure 5.3 (d). The
strong correlation between RTD and thermocouple outputs has validated the use of RTD
as a compliant and stretchable skin temperature detector.

90
Figure 5.3 (a) The resistance reading for RTD is stable for 25% applied strain, which results
in negligible temperature change. (b) Calibration curve of RTD. The measured temperature
coefficient of resistance is 0.0017. (c) Picture of RTD placed on the forearm along with
traditional thermalcouple for temperature monitoring. (d) Skin temperature changes
measured by both epidermal RTD and thermocouple found good correlation.

91
5.5 EPIDERMAL HYDRATION SENSOR
Skin hydration is widely used in dermatology and cosmetology for the detection of
diseases (e.g., atopic dermatitis, etc.) [153-157], the assessment of mental stress or
hormone levels [158, 159], and the evaluation of medical therapies or cosmetic treatments
[160, 161]. Skin hydration level is reflected by the impedance of skin, which can be
conveniently measured by impedance sensors in the coaxial dot-ring design as labeled
Figure 5.1. Laminating the epidermal hydration sensor (H. sensor) on human skin, an
inductance, capacitance, and resistance (LCR) meter (Digital Multimeter, Rigol) was used
to measure the impedance at different frequencies as well as different skin hydration levels.
A commercial corneometer (MoistureMeterSC Compact, Delfin Inc.) was used to quantify
the skin hydration level. Calibration for the skin hydration sensor was conducted and
plotted in Figure 5.4 (a)&(b), in which the same data set for impedance magnitude is plotted
as function of sweeping frequency and hydration level in Figure 5.4 (a)&(b), respectively.
Figure 5.4 (c)&(d) illustrate a continuous hydration measurement with both epidermal H.
sensor and the corneometer before and after the subject drank a can of cold Espresso. The
caffeine in Espresso is expected to lead to perspiration as it stimulates human central
nervous system, which activates the sweat glands. The results are shown in Figure 5.4 (d),
which clearly indicates gradual increase of hydration after drinking Espresso based on the
measurements of both the epidermal H. sensor and the corneometer. It is interesting to note
that skin hydration peaks seven minutes after drinking the Espresso and starts to decay after
that, likely due to the thermoregulation of the body. The tests also suggest that laminating
ESS on dry skin may induce slight sweating, which induces lower impedance readings. It
is also important to notice that the contact pressure significantly affects the measurement
of skin impedance, as shown in Figure 5.4 (e)&(f), and mishandling of the measuring
process such as loose contact of the ESS to the skin can largely fail a measurement.

92
Figure 5.4 Calibration curves for hydration sensor measured on human skin. The magnitude
of impedance is plotted as a function of (a) sweeping frequency and (b) hydration level. (c)
Picture of ESS placed on the forearm along with commercial coaxial corneometer for
hydration monitoring. (d) Real time skin hydration before and after Espresso intake
measured by both commercial coaxial corneometer and ESS. (e) Magnitude change of
impedance responding to repeated firm pressure applied on ESS which is gently attached
on skin. (f) Magnitude of impedance without (red) and with (blue) one time hard press
immediately after ESS is applied on skin. After one time hard press, magnitude drops
orders of magnitude and pressure effect is eliminated.

93
5.6 RESPIRATORY SENSOR
The respiration rate is the number of breaths a person takes per minute and normal
respiration rates for an adult person at rest range from 12 to 16 breaths per minute. Irregular
respiration rates are closely related to fever, illness, and with other medical conditions,
such that it is an important vital signs to be carefully monitored. In our ESS, an epidermal
respiratory rate sensor was built using electrically conductive rubber (ECR), which is
similar to our previous compliant strain gauge work [162], but was made by the more cost
and time effective “cut-and-paste” method. Three types of ECR strain gauges were
fabricated as shown in Figure 5.5 (a). The vertical and horizontal ECR strips are used to
measure the vertical and horizontal tensile strains by measuring their change in resistance.
The gauge factor (GF) is calculated from the calibration curve shown in Figure 5.5 (b) by
using equation
𝐺𝐹 =∆𝑅 𝑅0⁄
𝜀 (5.2)
The temperature induced resistance change can be compensated for in a square-
shaped Wheatstone bridge as shown in Figure 5.5 (a) and the sensitivity of output voltage
to applied uniaxial strain is given in Figure 5.5 (c). FEM results of strain distributions in
the ECR resistors are offered in Figure 5.5 (d) when a horizontal tensile strain of 5% is
applied on the Tegaderm substrate.
The test on skin was performed by applying Tegaderm-supported ECR-based strain
gauges on the chest of a human subject and various respirational patterns have been studied.
Figure 5.5 (e) illustrates the deformation of human chest during normal breath and deep
breath using the Wheatstone bridge. Larger amplitude and lower frequency are observed
for deep breath. Figure 5.5 (f) shows chest skin deformation due to a cough as measured
by the Wheatstone bridge and cough induced voltage output pattern is characterized by
undulated plateau.

94
Figure 5.5 Stretchable strain gauges made by electrically conductive rubber (ECR) on ESS
for respiratory rate and pattern monitoring. (a) Picture of the ESS strain gauge where ECR
(black) is the strain sensing component and Au serpentine ribbons (yellow) serve as
interconnects. Calibration curves for (b) horizontal and vertical ECR resistors and (c)
Wheatstone bridge obtained by horizontal uniaxial tension tests. (d) FEM strain
distribution in ECR when the supporting Tegaderm substrate is stretched horizontally by
5%. (e) Voltage outputs from the ECR Wheatstone bridge during normal and deep breath.
(f) Voltage outputs from the ECR Wheatstone bridge during cough.

95
5.7 DOUBLE-STRANDED STRETCHABLE ANTENNA
In the ESS we exploited a double-stranded design for the wireless epidermal strain
sensor. The resonant frequency of this sensor coil can be altered by changing its inductance
through mechanical loadings such as stretching or bending, providing a direct correlation
between local skin deformation with the electrical resonant frequency. This planar
stretchable coil has the potential to work as a near field communication (NFC) antenna for
wireless data transmission. Details about the design and analysis of this stretchable coil
sensor will be discussed in Chapter 6.
5.8 MECHANICAL STUDY
5.8.1 Stretchability Study
Since human skin can be stretched up to 30% without causing serious damage [163],
it’s important for the epidermal sensor system to exhibit higher stretchability in order to
survive different kinds of skin deformations. The stretchabilities of different serpentine
ribbons on Tegaderm substrates were tested using a customized tensile tester with in situ
resistance measurement and top down webcam observation, which is similar to the
experimental setup for Tegaderm-supported ITO serpentine, as shown in Figure 3.2 (a).
The resistance results are plotted in Figure 5.6 and close-up top view optical images are
shown in Figure 5.7. According to Figure 5.6, while straight Al-on-PET and Au-on-PET
ribbons exhibit limited stretchability (2.89% and 13.72%, respectively), their serpentine-
shaped ribbons as shown in Figure 5.7 (a) (Al coil), Figure 5.7 (b) (Au EP electrode) and
Figure 5.7 (c) (Au RTD), are much more stretchable, well beyond the elastic limit of human
skin (30%). For serpentine ribbons such as the Al coil and Au RTD, rupture sites are always
found at the crest of the arc (Figure 5.7 (a)&(c)) whereas for serpentine network such as
the Au EP electrode, fracture first occurs at ribbon intersections (Figure 5.7 (b)) due to
strain concentrations and overcutting at turning points (Figure 4.4 (d)-(i)).

96
Figure 5.6 Resistance change measured as function of applied strain. “Al” denotes straight
Al-PET ribbon, “Au” denotes straight Au-PET ribbon, “Coil” denotes Al-PET serpentine
ribbon used in wireless strain sensor coil, “EP” denotes Au-PET serpentine ribbon used in
EP electrode, and “RTD” denotes Au-PET serpentine ribbon used in RTD.

97
Figure 5.7 In situ images of different serpentine ribbons on Tegaderm stretched to certain
strains. (a) Al coil serpentine at different applied strain up to its strain-to-rupture. (b) Au
EP serpentine at different applied strain up to its strain-to-rupture. (c) Au RTD serpentine
at different applied strain up to its strain-to-rupture.

98
5.8.2 Cyclic Stretch Test Study
Except for stretchability, the electrical performance of the sensors under cyclic
loading is also of great importance. This is because skins near joints such as ankle and
waist often undergo repeated stretching, which results in cyclic loading for any epidermal
sensor that is attached to those locations. To ascertain that epidermal sensors preserve full
functionality under repeated loading, cyclic uniaxial stretch tests with 20% and 30% peak
strains have been performed. Figure 5.8 shows the cyclic test result for RTD and it is
evident that the resistance remains unchanged up to several hundred numbers of cycles for
20% peak strain and stays stable for 100 cycles for 30% peak strain, which suggests the
device exhibit good performance under repeated loading.
Figure 5.8 Cyclic test for RTD. Peak strain of 20% and 30% are applied on RTD and the
resistance result shows the device is robust up to several hundreds number of cycles.

99
5.8.3 Deformability Study
A deformability study was also conducted to evaluate the system-level mechanical
response of the epidermal sensor system, as shown in Figure 5.9. The patch has been
subjected to different loading conditions such as stretching, compression, shear as well as
surface rub and surface poking. Due to the small thickness and stretchable serpentine
structure, the entire patch retains intimate contact with the skin under various loadings
therefore exhibits high deformability. The electrical resistance of the Al and Au serpentines
before and after various kinds of skin deformation is provided in Figure 5.10. It is evident
that the ESS can survive all possible skin deformations without any mechanical degradation.
Figure 5.9 Deformability of ESS on human skin. Tattoo-paper supported ESS under (a)
longitudinal stretch (b) transverse stretch (c) biaxial stretch (d) longitudinal compress (e)
transverse compress (f) biaxial compress (g) shear (h) rub (i) poking by a glass rod.

100
Figure 5.10 Resistance of Al coil and Au RTD before and after all possible deformations
of skin-mounted ESS.
5.8.4 Substrate Study
Since the “cut-and-paste” fabrication method is not sensitive to the substrate
material, as long as the compliant target substrate adheres sufficiently well to the thin film
ESS, it can be transfer-printed onto different substrate materials. Figure 5.11 shows ESS
on three different types of substrates. While Tegaderm and tattoo papers are thin,
transparent and truly skin-like (Figure 5.11 (a)-(h)), the KRST is much thicker and behaves
like a cloth tape (Figure 5.11 (i)-(l)). Because of its relatively large thickness, KRST does
not crumple after being peeled off from the skin and the silicone adhesive allows multiple
attachment and detachment before losing adhesion.

101
Figure 5.11 ESS on different substrates. (a) ESS on Tegaderm. (b) Applying ESS on the
crook of the elbow. (c) As applied ESS. (d) ESS when elbow bends. (e) ESS on tattoo paper.
(f) Applying ESS on forearm. (g) As applied ESS. (h) ESS under compression. (i) ESS on
KRST. (j) Applying ESS on skin. (k) As applied ESS. (l) ESS under compression.

102
5.8.5 Material Behavior
This study involves a variety of different materials in order to yield high
performance ESS. In order to fully understand the mechanical properties of different
materials and their effect on the ultimate mechanical performance of ESS, we have
conducted mechanical property tests, using a dynamic mechanical analyzer (RSA-G2, TA
Instruments), for all the materials involved. Specimens were cut into rectangular strips with
an aspect ratio of 10:1 and were pulled in the longitudinal direction. Repeated tests have
been conducted and the representative stress-strain curves are offered in Figure 5.12 (a)&(b)
and Table 5.1. Since Tegaderm has been mainly adopted in this work, its mechanical
behavior is studied in detail. Tegaderm comprises a backing layer and an adhesive layer,
whose mechanical responses are quite different. The top view of Tegaderm tape and the
stress-strain curves for both layers are plotted in Figure 5.12 (c)&(d).

103
Figure 5.12 Stress-strain behavior of involved materials. (a) Uniaxial stress-strain curves
of PET, Kapton, kind removal silicone tape (KRST), tattoo paper, ESS, Tegaderm, and
ECR. (b) Bar plot of the Young’s moduli in log scale. (c) Top view of Tegaderm, inset
showing cross section of Tegaderm. (d) Uniaxial stress-strain curves of Tegaderm,
Tegadmer backing layer and Tegaderm adhesive layer.
Table 5.1 List of measured Young’s modulus of different materials used in ESS

104
5.9 CHAPTER SUMMARY
In this chapter, we have demonstrated a multimaterial, multiparametric ESS based
on serpentine designs, which is compliant and stretchable such that it can be intimately but
noninvasively applied on human skin to measure ECG, EMG, EEG, skin temperature, skin
hydration and respiratory rate. The ESS has potential to communicate with external
receivers wirelessly through the on-board double-stranded stretchable coil, which will be
discussed in detail in next chapter.

105
Chapter 6 Serpentine-Based Stretchable Sensor Coil1
The biological signals captured by epidermal sensors should be wirelessly
transmitted to data analytic devices. Conventional lead-wire based data transmission
system is obstructive, and the movement of the lead wires can significantly contribute to
moving artifacts. To transmit data with high fidelity and unobstructively, near field
communication (NFC) represents a wireless and safe strategy. This chapter discusses the
design, manufacture and experimental testing of a planar stretchable coil integrated on the
ESS that can operate as an antenna near NFC frequencies. The stretchable coil can also be
applied as a wireless, skin-mounted strain sensor which is applicable for detecting hand
gestures. The coupled mechanoelectromagnetic performance of the stretchable coil is
investigated experimentally, numerically and analytically.
1 S. Yang, Y.-C. Chen, L. Nicolini, P. Pasupathy, J. Sacks, B. Su, R. Yang, D. Sanchez, Y.-F. Chang, P. Wang, D. Schnyer, D. Neikirk, N. Lu*, “"Cut-and-Paste" Manufacture of Multiparametric Epidermal Sensor Systems,” Advanced Materials, vol. 27, no. 41, pp. 6423-6430, Nov 4, 2015. Author contributions: S. Y., Y.-C. C., L. N., P. P., B. S., R. Y., N. L., D. N., and D. S. conducted device design, fabrication, calibration, and testing. S. Y. led the FEM analysis with J. S. and D. S.’s assistance. Y. C., P. W., S. Y., Y.-C. C., L. N. and R. Y. served as human subjects. L. N. and D. N. performed EP analysis. N. L., D. N., and D. S. supervised and coordinated the project. N. L., S. Y., Y.-C. C., L. N., P. P., D. N., and D. S. wrote the paper.

106
6.1 OBJECTIVE AND OVERVIEW
Human body biological signals such as ECG, EMG, EEG, skin temperature, skin
hydration, and respiratory rate can be faithfully measured by ESS discussed in Chapter 5.
However, it takes extra effort to transmit the measured data to external data processing
system. Conventional lead-wire based data transmission systems are obstructive, and the
movement of the lead wires can significantly contribute to moving artifacts. To establish a
high performance, ambulatory monitoring ESS, a compliant, stretchable and wireless data
transmission component has to be established. For example, a skin-like, stretchable NFC
antenna is desirable. The development of wireless antennas includes antennas for soil-
structure interfaces [164], structural health monitoring [165], and microfluidic
radiofrequency antennas [166]. In addition, flexible wireless passive antennas have also
been proposed for pressure measurements [167, 168] and biomedical applications [169],
although, their stretchabilities are limited. One paradigm-shifting design for stretchable
antenna was proposed in 2011 [63], in which the antenna was fabricated as serpentine coils
in order to enhance its stretchability and compliance with preserved electrical functionality.
The idea of serpentine coil is then developed in many studies [119, 120] in which thin and
stretchable coils on epidermal electronics are exploited for NFC data transmission. In this
chapter, we propose a double-stranded serpentine coil that exhibits high stretchability and
a low resonant frequency, which can be fabricated by the “cut-and-paste” method
introduced in Chapter 4, and can be used as a hand gesture detector and antenna for wireless
communication.
6.2 COIL DESIGN
The resonant frequency (f) of sensor coils depend on their inductance (Ls) and
capacitance (Cs) through the equation

107
𝑓𝑠 =1
2𝜋√𝐿𝑠𝐶𝑠
(6.1)
As we hope to build a low frequency RLC coil that operates below 100 MHz for
easier measurement and for future use as an NFC antenna, Equation (6.1) suggests that the
coil should have high inductance and capacitance. Since we used a parallel plate capacitor
in the design and the overall capacitance is fixed to be 3.76 pF, a coil with large inductance
is preferred. Inductance depends on the layout of the coil. For a planar coil, its inductance
depends on the number of turns, shape of the turns, and the area that is enclosed by the coil
[170-173]. In general, the larger the area, the more turns, the higher the inductance, which
conflicts with the need of building a wireless strain sensor that is small enough to be
attached to many locations on the human body. Another design goal is to make it highly
stretchable and compliant so that it doesn’t mechanically load the skin. Last but not least,
it is desirable to have highly strain-dependent inductance for high sensitivity measurement.
With the aforementioned constraints and goals, we exploited a double-stranded serpentine
design shown as the blue coils in Figure 5.1. This design helps maximize the use of limited
real estate to fill in as many serpentine-shaped turns as possible. In the maintime it leaves
a reasonable gap between serpentines so that stretchability of the coil is ensured.
6.3 EXPERIMENTAL MEASUREMENT
Figure 6.1 illustrates the wireless measurement on the sensor coil. A circular reader
coil is connected to an Impedance Analyzer (HP 4194A) via a standard BNC-RCA adaptor.
Figure 6.1 (a) shows the experimental setup and the reader is inductively coupled to the
sensor coil in a transformer like configuration, so there is no cable connection between the
reader and the sensor coil (Figure 6.1 (b)). In our wireless strain sensor, the planar inductor
(Ls) and capacitor (Cs) together with the inductor’s parasitic resistance (Rs) forms an RLC

108
resonant circuit. The reader coil inductor (Lr) has its own series parasitic resistance (Rr) and
capacitance (Cr) which also forms an RLC circuit. Thus the reader and the sensor together
form two coupled RLC resonant circuits with a coupling factor of k. The HP4194A is used
to obtain the swept-frequency impedance response of the two coupled circuits. The
parasitic capacitance induced by connectors and adaptors which connect the reader coil to
the HP4194A add to Cr and hence lower fr. The baseline response is that of the reader coil:
𝑍𝑖𝑛 = 𝐶𝑟||(𝑅𝑟 + 𝑗𝜔𝐿𝑟) (6.2)
where || represents parallel circuit combination, ω is the angular frequency in
radians/sec, and Zin is the complex input impedance as a function of frequency. When the
sensor is present, the input impedance is given by
𝑍𝑖𝑛 = 𝐶𝑟|| (𝑅𝑟 + 𝑗𝜔𝐿𝑟 +𝜔2𝑀2
(𝑅𝑠 + 𝑗𝜔𝐿𝑠 +1
𝑗𝜔𝐶𝑠)) (6.3)
where M is the mutual inductance between the reader and sensor coils. The
HP4194A measures both magnitude |Zin| in Ohms (Ω) and the Phase (θ) in degrees (°). For
this work, we use the phase response to determine the resonant frequency. By design we
have ensured that 𝑓𝑠 ≪ 𝑓𝑟 which affords reliable estimation of the sensor’s resonant
frequency without perturbation from the reader’s resonance. Thus the baseline response
corresponds to the phase of the reader coil is around 90°. When the sensor is coupled to the
reader, we observe a dip in the phase baseline with the minima point corresponding to the
sensors resonant frequency (𝑓𝑠). The size (i.e. deviation from the baseline) of this dip is
dependent on the distance and orientation between the reader and the sensor coils as a result
of changing coupling factor k. However the frequency corresponding to the dip, i.e. 𝑓𝑠, is
independent of these changes. Thus one can reliably estimate 𝑓𝑠 from this coupled but
wireless measurement.

109
Uniaxial stretch tests has been performed on Tegaderm supported stretchable coils
and strain-induced shift of resonant frequency of the coupled circuit has been recorded, as
shown in Figure 6.1 (c), which shows a monotonic decay as the sensor coil is uniaxially
elongated. The resonant frequency shifted from 38.6 MHz in the undeformed shape down
to 34.3 MHz at the strain of 20%, which is more sensitive to deformation compared to a
previously reported stretchable epidermal antenna [120].
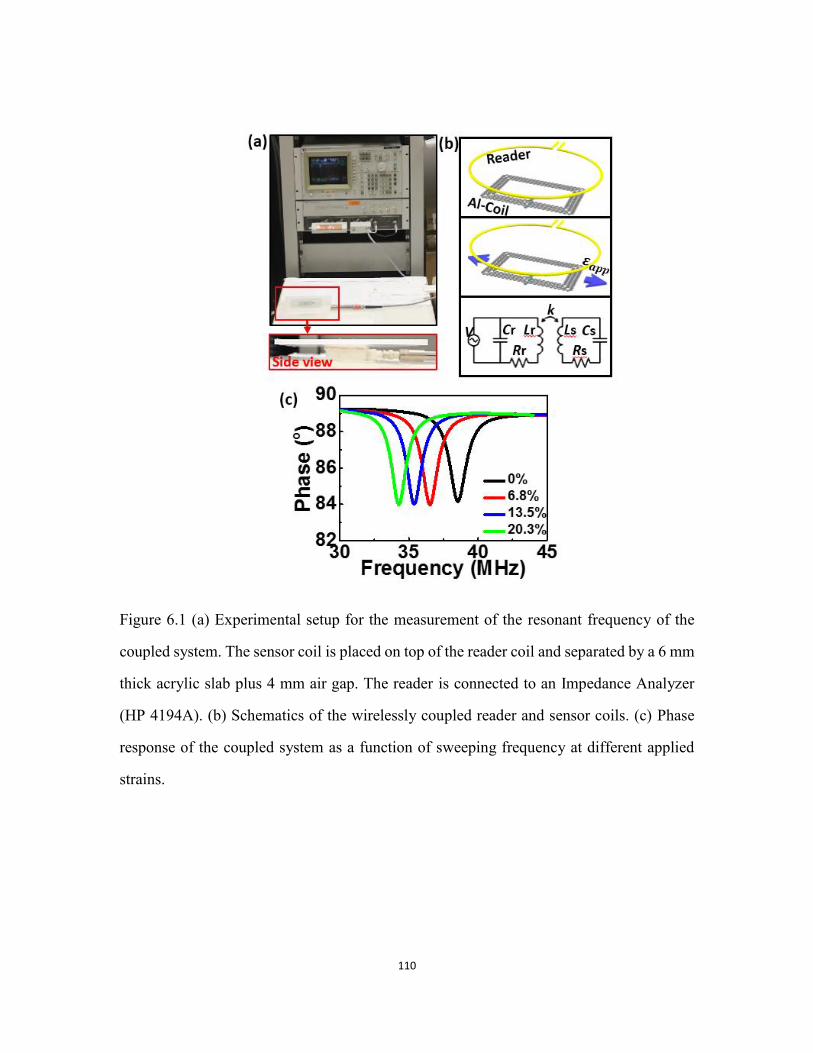
110
Figure 6.1 (a) Experimental setup for the measurement of the resonant frequency of the
coupled system. The sensor coil is placed on top of the reader coil and separated by a 6 mm
thick acrylic slab plus 4 mm air gap. The reader is connected to an Impedance Analyzer
(HP 4194A). (b) Schematics of the wirelessly coupled reader and sensor coils. (c) Phase
response of the coupled system as a function of sweeping frequency at different applied
strains.

111
6.4 ANALYTICAL RESULT
Here we try to develop an analytical understanding of the inductance change with
applied strain. The inductance of a planar, rectangular, single turn coil is approximately
proportional to the square root of the area that is enclosed by the coil [171]. Thus
𝐿 ~ √𝐴~√𝑙1𝑙2, (6.4)
where l1 and l2 are the initial length and width of the rectangle. Assuming the coil is bonded
to a substrate with Poisson’s ratio , when stretched by a strain of in direction 1, the
deformed length and width becomes
𝑙1(𝜀) = (1 + 𝜀)𝑙1, 𝑙2(𝜀) = (1 − 𝑣𝜀)𝑙2. (6.5)
Therefore the inductance of the deformed coil is
𝐿(𝜀)~√𝐴(𝜀) ~ √𝐴(1 + 𝜀)(1 − 𝜈𝜀)~ 𝐿0√(1 + 𝜀)(1 − 𝜈𝜀) (6.6)
and hence the strain dependence of the resonant frequency is given by
𝑓(𝜀) =1
2𝜋√𝐿(𝜀)𝐶 ~ 𝑓0
1
[(1+𝜀)(1−𝜈𝜀)]0.25~ 𝑓0 (1 +
1
4(𝜈 − 1)𝜀).
(6.7)
For a multi-turn planar rectangular coil, existing theory [170] has been extended to
predict coil inductance under different applied strains. The inductance of a multi-turn
rectangular coil is formulated as
𝐿 = ∑𝐿0 +∑𝑀, (6.8)
where L is the total inductance, 𝐿0 is the self-inductance of each straight segment and M
is the mutual-inductance between any two segments. The self-inductance is given by
𝐿0 = 0.002𝑙 [𝑙𝑛 (2𝑙
𝐺𝑀𝐷) − 1.25 +
𝐴𝑀𝐷
𝑙+ (
𝜇
4)𝑇], (6.9)
in which GMD is the geometric mean distance and AMD is the arithmetic mean
distance, both depending on the coil geometry and l is the segment length, T is the
frequency correction parameter which is taken to be 1 m/H and 𝜇 is the magnetic
permeability and is also set to be 1 H/m. The mutual-inductance is given by

112
𝑀 = 2𝑙𝑄, (6.10)
where Q is a parameter depending on the geometry of the segment
𝑄 = 𝑙𝑛 1
𝛽+ (1 +
1
𝛽2)0.5
− (1 + 𝛽2)0.5, (6.11)
where 𝛽 = 𝐺𝑀𝐷 𝑙⁄ .
So given a rectangular coil with straight segments and uniform cross section, the
total inductance of the coil solely depends on the layout of the coil, and the total inductance
can be calculated in an iterative manner.
6.5 SIMULATION RESULTS
Finite element analysis was performed to model the inductance change of the sensor
coil (one layer coil) with applied uniaxial tension. The mechanical deformation was
modeled by ABAQUS and the inductance was modeled by ANSYS Maxwell. In ABAQUS,
the sensor coil was modeled as Tegaderm-bonded serpentine-shaped wires with rectangular
cross-sections and the entire structure was subjected to horizontal tensile displacement. The
deformed shape of the coils was imported into ANSYS Maxwell and a 3D model was
generated with rectangular cross-section 9 m × 400 m assigned to the coil. The coil was
immersed in a rectangular box of atmosphere of size: 500 mm × 500 mm × 750 mm, to
account for the dielectric effect of the surrounding air. Two extension wires were used to
lead the two ports of the coil to the boundary of the atmospheric box (Figure 6.2 (a),
atmosphere box not showing) and a current excitation of 1 A was applied across the ports.
The solution type of “Magnetostatic” was selected and the magnetic flux density fields (B
field) of the deformed coils are computed (Figure 6.2 (b)). Coil inductance is a direct output
of the solution. Once numerical solutions of the sensor coil inductance are available,
assuming capacitance to be unaffected by stretch, we are able to calculate the resonant
frequency of the stretched sensor using Equation (6.1). This result is plotted in Figure 6.2

113
(c) as blue, square markers. It is evident that our FEM results can predict the decrease of
resonant frequency as a result of increasing inductance when the coil is uniaxially stretched.
But there is still a big discrepancy between experimental and FEM results, which requires
future investigation.
To reveal the effect of serpentine, the straight counterpart of the serpentine coil has
also been modeled, both are bonded on Tegaderm substrates and subjected to the same
tensile strains. The resonant frequency results of straight coils are plotted in Figure 6.2 (c)
as the blue, triangle markers, which is almost stationary under stretch (39.4MHz for 0%
and 39.2MHz for 30%). Therefore, serpentine coils are ideal for wireless skin strain sensing
as it is both more deformable and more sensitive to strain. However, when using those coils
as NFC antenna, the fact that the resonant frequency of straight coils is less sensitive to
mechanical strain compared with its serpentine counterpart poses a very interesting tradeoff
between deformability and stability of frequency.

114
Figure 6.2 (a) 3D model of the coil with extension wire (atmosphere box is not showing).
(b) Serpentine coil under 30 % applied strains with contour plot of the magnetic (B) filed
magnitude. (c) Both experimental (red) and FEM (blue) results showing decreased resonant
frequency with increased tensile strain.
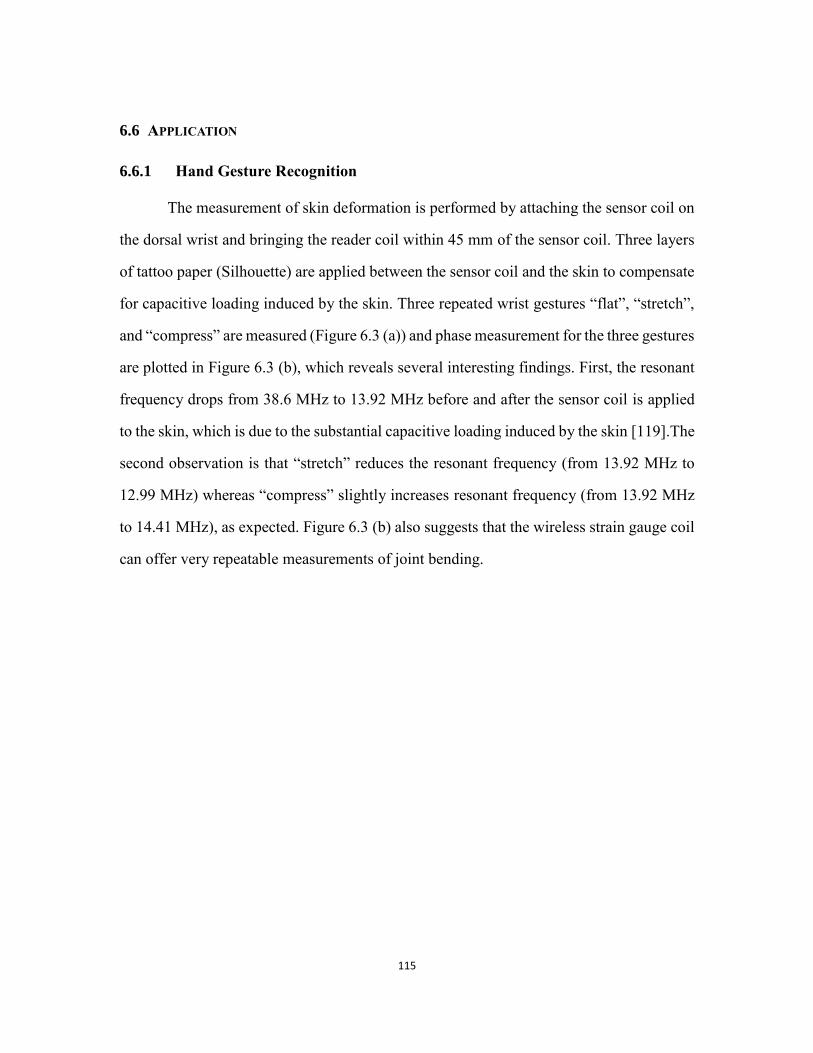
115
6.6 APPLICATION
6.6.1 Hand Gesture Recognition
The measurement of skin deformation is performed by attaching the sensor coil on
the dorsal wrist and bringing the reader coil within 45 mm of the sensor coil. Three layers
of tattoo paper (Silhouette) are applied between the sensor coil and the skin to compensate
for capacitive loading induced by the skin. Three repeated wrist gestures “flat”, “stretch”,
and “compress” are measured (Figure 6.3 (a)) and phase measurement for the three gestures
are plotted in Figure 6.3 (b), which reveals several interesting findings. First, the resonant
frequency drops from 38.6 MHz to 13.92 MHz before and after the sensor coil is applied
to the skin, which is due to the substantial capacitive loading induced by the skin [119].The
second observation is that “stretch” reduces the resonant frequency (from 13.92 MHz to
12.99 MHz) whereas “compress” slightly increases resonant frequency (from 13.92 MHz
to 14.41 MHz), as expected. Figure 6.3 (b) also suggests that the wireless strain gauge coil
can offer very repeatable measurements of joint bending.

116
Figure 6.3 (a) Sensor coil attached on human wrist (top left) under different hand gestures:
“flat” (top right), “stretch” (bottom left) and “compress” (bottom right). (b) Phase response
as a function of sweeping frequency at repeated “flat”, “stretch” and “compress” hand
position. Good repeatability is observed.
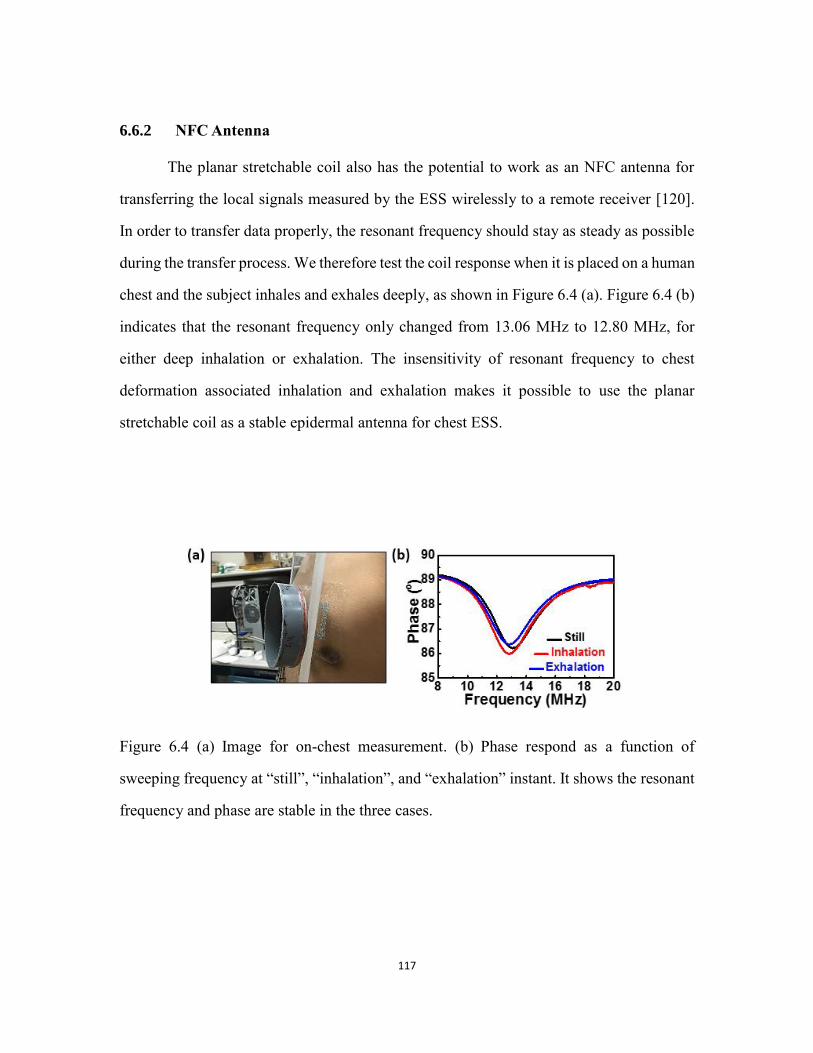
117
6.6.2 NFC Antenna
The planar stretchable coil also has the potential to work as an NFC antenna for
transferring the local signals measured by the ESS wirelessly to a remote receiver [120].
In order to transfer data properly, the resonant frequency should stay as steady as possible
during the transfer process. We therefore test the coil response when it is placed on a human
chest and the subject inhales and exhales deeply, as shown in Figure 6.4 (a). Figure 6.4 (b)
indicates that the resonant frequency only changed from 13.06 MHz to 12.80 MHz, for
either deep inhalation or exhalation. The insensitivity of resonant frequency to chest
deformation associated inhalation and exhalation makes it possible to use the planar
stretchable coil as a stable epidermal antenna for chest ESS.
Figure 6.4 (a) Image for on-chest measurement. (b) Phase respond as a function of
sweeping frequency at “still”, “inhalation”, and “exhalation” instant. It shows the resonant
frequency and phase are stable in the three cases.
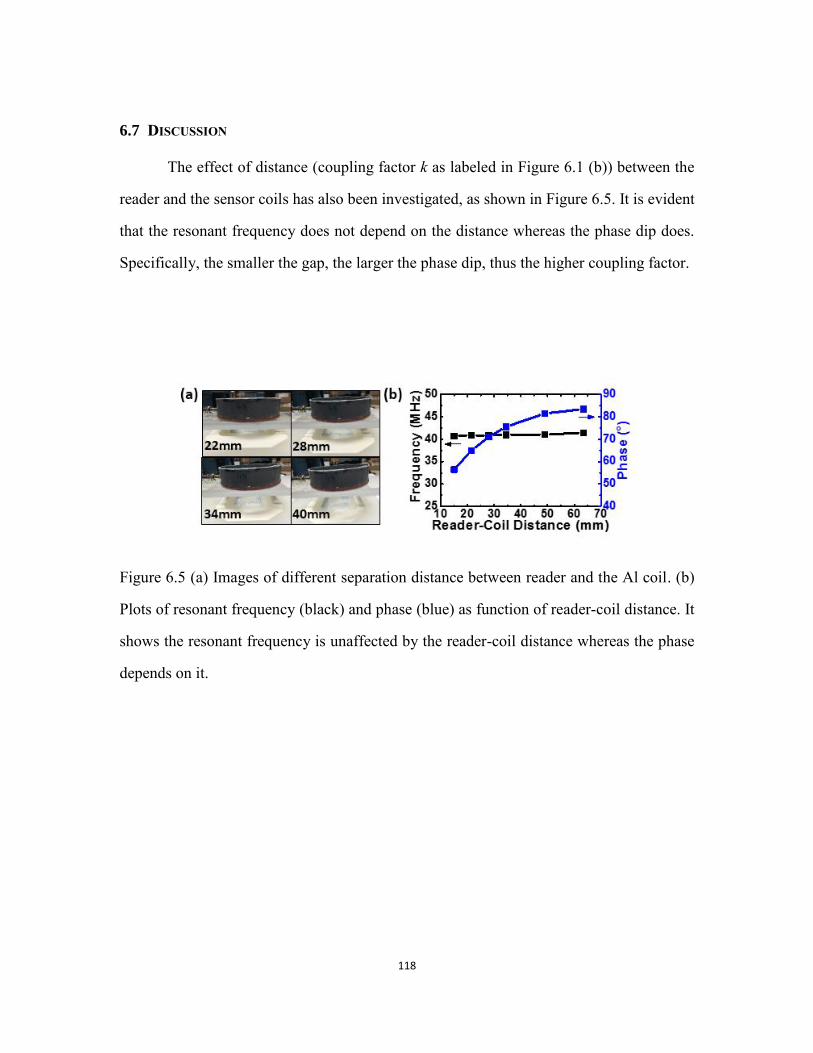
118
6.7 DISCUSSION
The effect of distance (coupling factor k as labeled in Figure 6.1 (b)) between the
reader and the sensor coils has also been investigated, as shown in Figure 6.5. It is evident
that the resonant frequency does not depend on the distance whereas the phase dip does.
Specifically, the smaller the gap, the larger the phase dip, thus the higher coupling factor.
Figure 6.5 (a) Images of different separation distance between reader and the Al coil. (b)
Plots of resonant frequency (black) and phase (blue) as function of reader-coil distance. It
shows the resonant frequency is unaffected by the reader-coil distance whereas the phase
depends on it.

119
6.8 CHAPTER SUMMARY
In this chapter, we have introduced the design of a stretchable double-stranded
serpentine coil that can be used for hand gesture recognition and as an epidermal antenna
for wireless data communication. Detailed experiments as well as analytical and numerical
solutions have been discussed. Our study suggests that the resonant frequency of the
stretchable coil decreases as the coil is stretched. The numerical result also shows that the
resonant frequency of coils with straight segments are much less sensitive to the applied
strain compared to the serpentine coils. This indicates that there is a tradeoff between the
stretchability and frequency stability of planar coils. When the coil is laminated on human
skin, we find that its resonant frequency is sensitive to skin loading. Further work is
required for the optimization of compliant stretchable antennas.

120
Chapter 7 Conclusions and outlook
The last chapter summarizes this thesis work and proposes suggestions for future
endeavors along this route.

121
7.1 SUMMARY AND CONCLUDING REMARKS
Echoing back to the introduction in Chapter 1, the goal of this dissertation is to
understand the fundamental mechanics of serpentine-shaped stretchable structures and
propose an affordable method for manufacturing disposable yet high performance
epidermal sensors for reliable vital sign monitoring.
Two most commonly used serpentine configurations for stretchable structures, i.e.
freestanding serpentine structures and substrate-supported serpentine structures have been
systematically studied. For freestanding serpentine structures, it was found that the
serpentine structure is actually not always more stretchable, yet always “more compliant”,
than its straight counterpart. Analytical solutions using simple curved beam theory and
more rigorous elasticity theory have both been derived to calculate the stretchability and
effective stiffness of freestanding serpentine structures, which have been validated both
numerically and experimentally. An example for optimizing serpentine shapes under
practical constraints has also been offered. For substrate-supported metallic and ITO
serpentine ribbons, in situ electrical resistance measurement during uniaxial stretching with
top down microstructure observation has been carried out. The study reveals that, while
high substrate stiffness completely prevents serpentine ribbons from in-plane rotation or
out-of-plane twist, serpentines on compliant substrates are not necessarily as stretchable as
freestanding ones because transverse buckling can crack brittle serpentine ribbons that are
well bonded on the compliant substrates.
As the conventional microfabrication process for serpentine based inorganic
stretchable electronics is time and labor intensive, a dry, benchtop, and freeform
manufacturing method named the “cut-and-paste” method for the fabrication of stretchable
and disposable epidermal sensors has been proposed in this thesis. Various fabrication
parameters have been investigated and optimized manufacturing guidelines have been

122
proposed. As a demonstration of the cost and time effective “cut-and-paste” method, we
have manufactured a multimaterial, multiparametric epidermal sensor systems (ESS),
which can be intimately but noninvasively laminated on human skin to monitor
electrophysiological signals, skin temperature, skin hydration and respiratory rate. The ESS
may potentially harvest energy from and communicate with wireless interrogators through
the on-patch double-stranded stretchable coil. Design, measurement, and coupled
mechanical-electromagnetic modeling of the stretchable coil structure have been discussed
in details.
Overall, the research goals of this dissertation have been fulfilled. The mechanics
of serpentine structures was systematically investigated with emphasis on the effects of
serpentine geometry and substrate stiffness, which involves theoretical analysis, numerical
simulation, and experimental validation. To manufacture high quality serpentine ribbons
with high throughput and low cost, we have invented a “cut-and-paste” method to fabricate
both metallic and ceramic serpentines. As a demonstration of our method, a noninvasive,
tattoo-like multifunctional epidermal sensor system has been built for the measurement of
various vital signs. Engineering of epidermal stretchable antenna for wireless
communication is also detailed and rationalized.
7.2 SUGGESTIONS FOR FUTURE WORK
Here are some thoughts and suggestions for future endeavors:
1. It will be very helpful to develop closed-form analytical solutions for the
buckling and post buckling analysis for freestanding serpentine networks, not only because
it is a very interesting mechanics problem, but also it will be important for the combined
mechanical and electrical circuit design of stretchable devices based on such structures.
2. The current “cut-and-paste” fabrication is far from perfect and improvements can
be made. Some good starting points include but not limited to the improvement of the

123
cutting resolution and uniformity, specimen thinness, and process automation.
3. More medical sensors and actuators such as blood pressure sensor, blood-oxygen
monitor, transdermal heaters, and drug delivery systems can be integrated in the “cut-and-
paste” fabricated ESS, to form a closed-loop monitoring and treatment medical system.
4. In the simulation of stretchable coils, instead of performing the mechanical
stretch and electromagnetic frequency analyses in two different modules, carrying out the
two simulations in one software package such as ANSYS allow for coupling and may yield
simulation results that can better reproduce the experimental results.

124
References
[1] C. Brunetti, and R. W. Curtis, “Printed-Circuit Techniques,” Proceedings of the
Institute of Radio Engineers, vol. 36, no. 1, pp. 121-161, 1948.
[2] J. Y. Ouyang, C. W. Chu, C. R. Szmanda et al., “Programmable polymer thin film
and non-volatile memory device,” Nature Materials, vol. 3, no. 12, pp. 918-922,
Dec, 2004.
[3] P. F. Baude, D. A. Ender, M. A. Haase et al., “Pentacene-based radio-frequency
identification circuitry,” Applied Physics Letters, vol. 82, no. 22, pp. 3964-3966,
Jun 2, 2003.
[4] E. Cantatore, T. C. T. Geuns, G. H. Gelinck et al., “A 13.56-MHz RFID system
based on organic transponders,” Ieee Journal of Solid-State Circuits, vol. 42, no. 1,
pp. 84-92, Jan, 2007.
[5] D. H. Kim, N. S. Lu, R. Ghaffari et al., “Materials for multifunctional balloon
catheters with capabilities in cardiac electrophysiological mapping and ablation
therapy,” Nature Materials, vol. 10, no. 4, pp. 316-323, Apr, 2011.
[6] D. H. Kim, S. D. Wang, H. Keum et al., “Thin, Flexible Sensors and Actuators as
'Instrumented' Surgical Sutures for Targeted Wound Monitoring and Therapy,”
Small, vol. 8, no. 21, pp. 3263-3268, Nov 5, 2012.
[7] F. Garnier, R. Hajlaoui, A. Yassar et al., “All-Polymer Field-Effect Transistor
Realized by Printing Techniques,” Science, vol. 265, no. 5179, pp. 1684-1686, Sep
16, 1994.
[8] Z. N. Bao, Y. Feng, A. Dodabalapur et al., “High-performance plastic transistors
fabricated by printing techniques,” Chemistry of Materials, vol. 9, no. 6, pp. 1299-
1301, Jun, 1997.
[9] J. A. Rogers, Z. Bao, K. Baldwin et al., “Paper-like electronic displays: Large-area
rubber-stamped plastic sheets of electronics and microencapsulated electrophoretic
inks,” Proceedings of the National Academy of Sciences of the United States of
America, vol. 98, no. 9, pp. 4835-4840, Apr 24, 2001.
[10] K. I. Jang, S. Y. Han, S. Xu et al., “Rugged and breathable forms of stretchable
electronics with adherent composite substrates for transcutaneous monitoring,”
Nature Communications, vol. 5, Sep, 2014.
[11] D. J. Lipomi, B. C. K. Tee, M. Vosgueritchian et al., “Stretchable Organic Solar
Cells,” Advanced Materials, vol. 23, no. 15, pp. 1771-1775, Apr 19, 2011.
[12] D. J. Lipomi, H. Chong, M. Vosgueritchian et al., “Toward mechanically robust
and intrinsically stretchable organic solar cells: Evolution of photovoltaic
properties with tensile strain,” Solar Energy Materials and Solar Cells, vol. 107,

125
pp. 355-365, Dec, 2012.
[13] C. Lungenschmied, G. Dennler, H. Neugebauer et al., “Flexible, long-lived, large-
area, organic solar cells,” Solar Energy Materials and Solar Cells, vol. 91, no. 5,
pp. 379-384, Mar 6, 2007.
[14] M. He, J. H. Jung, F. Qiu et al., “Graphene-based transparent flexible electrodes for
polymer solar cells,” Journal of Materials Chemistry, vol. 22, no. 46, pp. 24254-
24264, Dec 14, 2012.
[15] M. Kaltenbrunner, M. S. White, E. D. Glowacki et al., “Ultrathin and lightweight
organic solar cells with high flexibility,” Nature Communications, vol. 3, pp. 770,
Apr, 2012.
[16] K. S. Lee, Y. Lee, J. Y. Lee et al., “Flexible and Platinum-Free Dye-Sensitized
Solar Cells with Conducting-Polymer-Coated Graphene Counter Electrodes,”
Chemsuschem, vol. 5, no. 2, pp. 379-382, Feb 13, 2012.
[17] T. Someya, T. Sekitani, S. Iba et al., “A large-area, flexible pressure sensor matrix
with organic field-effect transistors for artificial skin applications,” Proceedings of
the National Academy of Sciences of the United States of America, vol. 101, no. 27,
pp. 9966-9970, Jul 6, 2004.
[18] M. L. Hammock, A. Chortos, B. C. K. Tee et al., “25th Anniversary Article: The
Evolution of Electronic Skin (E-Skin): A Brief History, Design Considerations, and
Recent Progress,” Advanced Materials, vol. 25, no. 42, pp. 5997-6037, Nov, 2013.
[19] L. Li, H. T. Lin, S. T. Qiao et al., “Integrated flexible chalcogenide glass photonic
devices,” Nature Photonics, vol. 8, no. 8, pp. 643-649, Aug, 2014.
[20] N. S. Lu, and D. H. Kim, “Flexible and Stretchable Electronics Paving the Way for
Soft Robotics,” Soft Robotics, vol. 1, no. 1, pp. 53-62, Mar, 2014.
[21] C. D. Dimitrakopoulos, and P. R. L. Malenfant, “Organic thin film transistors for
large area electronics,” Advanced Materials, vol. 14, no. 2, pp. 99-117, Jan 16, 2002.
[22] S. R. Forrest, “The path to ubiquitous and low-cost organic electronic appliances
on plastic,” Nature, vol. 428, no. 6986, pp. 911-918, Apr 29, 2004.
[23] P. F. Moonen, I. Yakimets, and J. Huskens, “Fabrication of Transistors on Flexible
Substrates: from Mass-Printing to High-Resolution Alternative Lithography
Strategies,” Advanced Materials, vol. 24, no. 41, pp. 5526-5541, Nov 2, 2012.
[24] D. H. Kim, R. Ghaffari, N. Lu et al., “Flexible and stretchable electronics for
biointegrated devices,” Annu Rev Biomed Eng, vol. 14, pp. 113-28, 2012.
[25] R. F. Service, “Materials science - Inorganic electronics begin to flex their muscle,”
Science, vol. 312, no. 5780, pp. 1593-1594, Jun 16, 2006.
[26] Y. G. Sun, and J. A. Rogers, “Inorganic semiconductors for flexible electronics,”
Advanced Materials, vol. 19, no. 15, pp. 1897-1916, Aug 3, 2007.
[27] G. S. Huang, and Y. F. Mei, “Thinning and Shaping Solid Films into Functional
and Integrative Nanomembranes,” Advanced Materials, vol. 24, no. 19, pp. 2517-

126
2546, May 15, 2012.
[28] W. N. Zhu, M. N. Yogeesh, S. X. Yang et al., “Flexible Black Phosphorus
Ambipolar Transistors, Circuits and AM Demodulator,” Nano Letters, vol. 15, no.
3, pp. 1883-1890, Mar, 2015.
[29] H. Y. Chang, S. X. Yang, J. H. Lee et al., “High-Performance, Highly Bendable
MoS2 Transistors with High-K Dielectrics for Flexible Low-Power Systems,” Acs
Nano, vol. 7, no. 6, pp. 5446-5452, Jun, 2013.
[30] J.-H. A. Sang-Il Park, Xue Feng, Shuodao Wang, Yonggang Huang, and John A.
Rogers, “Theoretical and Experimental Studies of Bending of Inorganic Electronic
Materials on Plastic Substrates,” Advanced Functional Materials, vol. 18, pp.
2673–2684, 2008.
[31] D. H. Kim, J. H. Ahn, W. M. Choi et al., “Stretchable and foldable silicon integrated
circuits,” Science, vol. 320, no. 5875, pp. 507-511, Apr 25, 2008.
[32] S. P. Lacour, J. Jones, S. Wagner et al., “Stretchable interconnects for elastic
electronic surfaces,” Proceedings of the Ieee, vol. 93, no. 8, pp. 1459-1467, Aug,
2005.
[33] E. Y. M. Z. Suo, H. Gleskova, and S. Wagner, “Mechanics of rollable and foldable
film-on-foil electronics,” Applied Physics Letters, vol. 74, 1999.
[34] A. Kumar, H. A. Biebuyck, N. L. Abbott et al., “The Use of Self-Assembled
Monolayers and a Selective Etch to Generate Patterned Gold Features,” Journal of
the American Chemical Society, vol. 114, no. 23, pp. 9188-9189, Nov 4, 1992.
[35] M. S. Miller, H. L. Filiatrault, G. J. E. Davidson et al., “Selectively Metallized
Polymeric Substrates by Microcontact Printing an Aluminum(III) Porphyrin
Complex,” Journal of the American Chemical Society, vol. 132, no. 2, pp. 765-772,
Jan 20, 2010.
[36] P. C. Hidber, W. Helbig, E. Kim et al., “Microcontact printing of palladium colloids:
Micron-scale patterning by electroless deposition of copper,” Langmuir, vol. 12,
no. 5, pp. 1375-1380, Mar 6, 1996.
[37] T. Widlund, S. X. Yang, Y. Y. Hsu et al., “Stretchability and compliance of
freestanding serpentine-shaped ribbons,” International Journal of Solids and
Structures, vol. 51, no. 23-24, pp. 4026-4037, Nov, 2014.
[38] J. Song, “Mechanics of stretchable electronics,” Current Opinion in Solid State &
Materials Science, vol. 19, no. 3, pp. 160-170, Jun, 2015.
[39] H. Jang, Y. J. Park, X. Chen et al., “Graphene-Based Flexible and Stretchable
Electronics,” Adv Mater, vol. Online, Jan 5, 2016.
[40] P. K. Yang, L. Lin, F. Yi et al., “A Flexible, Stretchable and Shape-Adaptive
Approach for Versatile Energy Conversion and Self-Powered Biomedical
Monitoring,” Advanced Materials, vol. 27, no. 25, pp. 3817-3824, Jul 1, 2015.
[41] S. Hong, H. Lee, J. Lee et al., “Highly Stretchable and Transparent Metal Nanowire

127
Heater for Wearable Electronics Applications,” Advanced Materials, vol. 27, no.
32, pp. 4744-4751, Aug 26, 2015.
[42] S. K. Lee, B. J. Kim, H. Jang et al., “Stretchable Graphene Transistors with Printed
Dielectrics and Gate Electrodes,” Nano Letters, vol. 11, no. 11, pp. 4642-4646, Nov,
2011.
[43] H. C. Ko, M. P. Stoykovich, J. Z. Song et al., “A hemispherical electronic eye
camera based on compressible silicon optoelectronics (Supplementary
Information),” 2008.
[44] D. H. Kim, R. Ghaffari, N. S. Lu et al., “Electronic sensor and actuator webs for
large-area complex geometry cardiac mapping and therapy,” Proceedings of the
National Academy of Sciences of the United States of America, vol. 109, no. 49, pp.
19910-19915, Dec 4, 2012.
[45] D. H. Kim, J. A. Rogers, J. Viventi et al., “Flexible Biomedical Devices for
Mapping Cardiac and Neural Electrophysiology,” 2011 Ieee International
Reliability Physics Symposium (Irps), 2011.
[46] J. Viventi, D. H. Kim, J. D. Moss et al., “A Conformal, Bio-Interfaced Class of
Silicon Electronics for Mapping Cardiac Electrophysiology,” Science
Translational Medicine, vol. 2, no. 24, Mar 24, 2010.
[47] D. Son, J. Lee, D. J. Lee et al., “Bioresorbable Electronic Stent Integrated with
Therapeutic Nanoparticles for Endovascular Diseases,” Acs Nano, vol. 9, no. 6, pp.
5937-5946, Jun, 2015.
[48] N. S. Giulia Lanzara, Zhiqiang Guo, Fu-Kuo Chang, “A Spider-Web-Like Highly
Expandable Sensor Network for Multifunctional Materials,” advanced materials,
vol. 22, no. 41, pp. 4643-4648, 2010.
[49] J. Y. Sun, N. S. Lu, J. Yoon et al., “Debonding and fracture of ceramic islands on
polymer substrates,” Journal of Applied Physics, vol. 111, no. 1, Jan 1, 2012.
[50] Y. W. Su, Z. J. Liu, S. D. Wang et al., “Mechanics of stretchable electronics on
balloon catheter under extreme deformation,” International Journal of Solids and
Structures, vol. 51, no. 7-8, pp. 1555-1561, Apr, 2014.
[51] A. Roguin, E. Grenadier, B. Peled et al., “Acute and 30-day results of the serpentine
balloon expandable stent implantation in simple and complex coronary arterial
narrowings,” American Journal of Cardiology, vol. 80, no. 9, pp. 1155-1162, Nov
1, 1997.
[52] R. Beyar, A. Roguin, J. Hamburger et al., “Multicenter pilot study of a serpentine
balloon-expandable stent (beStent(TM)): Acute angiographic and clinical results,”
Journal of Interventional Cardiology, vol. 10, no. 4, pp. 277-286, Aug, 1997.
[53] D. Khang, H. Jiang, Y. Huang et al., “A stretchable form of single-crystal silicon
for high-performance electronics on rubber substrates,” Science, vol. 311, no. 5758,
pp. 208-212, JAN 13 2006, 2006.

128
[54] Y. Sun, W. Choi, H. Jiang et al., “Controlled buckling of semiconductor
nanoribbons for stretchable electronics,” Nature Nanotechnology, vol. 1, no. 3, pp.
201-207, DEC 2006, 2006.
[55] Y. Sun, V. Kumar, I. Adesida et al., “Buckled and wavy ribbons of GaAs for high-
performance electronics on elastomeric substrates,” Advanced Materials, vol. 18,
no. 21, pp. 2857-2862, NOV 3 2006, 2006.
[56] W. Choi, J. Song, D. Khang et al., “Biaxially stretchable "Wavy" silicon
nanomembranes,” Nano Letters, vol. 7, no. 6, pp. 1655-1663, JUN 2007, 2007.
[57] S. P. Lacour, S. Wagner, Z. Y. Huang et al., “Stretchable gold conductors on
elastomeric substrates,” Applied Physics Letters, vol. 82, no. 15, pp. 2404-2406,
Apr 14, 2003.
[58] N. Bowden, S. Brittain, A. G. Evans et al., “Spontaneous formation of ordered
structures in thin films of metals supported on an elastomeric polymer,” Nature,
vol. 393, no. 6681, pp. 146-149, May, 1998.
[59] B. D. Y. Xue Feng, Yuanming Liu, Yong Wang, Canan Dagdeviren, Zhuangjian
Liu, Andrew Carlson, Jiangyu Li, Yonggang Huang, John A. Rogers, “Stretchable
Ferroelectric Nanoribbons with Wavy Configurations on Elastomeric Substrates,”
Acs Nano, vol. 5, no. 4, pp. 3326–3332, 2011.
[60] N. Bowden, W. T. S. Huck, K. E. Paul et al., “The controlled formation of ordered,
sinusoidal structures by plasma oxidation of an elastomeric polymer,” Applied
Physics Letters, vol. 75, no. 17, pp. 2557-2559, Oct, 1999.
[61] W. T. S. Huck, N. Bowden, P. Onck et al., “Ordering of spontaneously formed
buckles on planar surfaces,” Langmuir, vol. 16, no. 7, pp. 3497-3501, Apr, 2000.
[62] J. J. Stéphanie P. Lacour, Z. Suo, Sigurd Wagner, “Design and Performance of Thin
Metal Film Interconnects for Skin-Like Electronic Circuits,” Ieee Electron Device
Letters, vol. 25, no. 4, pp. 179-181, 2004.
[63] D. H. Kim, N. S. Lu, R. Ma et al., “Epidermal Electronics,” Science, vol. 333, no.
6044, pp. 838-843, Aug 12, 2011.
[64] Y. W. Su, S. D. Wang, Y. A. Huang et al., “Elasticity of Fractal Inspired
Interconnects,” Small, vol. 11, no. 3, pp. 367-373, Jan 21, 2015.
[65] H. R. Fu, S. Xu, R. X. Xu et al., “Lateral buckling and mechanical stretchability of
fractal interconnects partially bonded onto an elastomeric substrate,” Applied
Physics Letters, vol. 106, no. 9, Mar 2, 2015.
[66] Y. H. Zhang, H. R. Fu, S. Xu et al., “A hierarchical computational model for
stretchable interconnects with fractal-inspired designs,” Journal of the Mechanics
and Physics of Solids, vol. 72, pp. 115-130, Dec, 2014.
[67] M. A. Meitl, Z. T. Zhu, V. Kumar et al., “Transfer printing by kinetic control of
adhesion to an elastomeric stamp,” Nature Materials, vol. 5, no. 1, pp. 33-38, Jan,
2006.

129
[68] M. A. M. Xue Feng, Audrey M. Bowen ,Yonggang Huang ,Ralph G. Nuzzo ,John
A. Rogers, “Competing Fracture in Kinetically Controlled Transfer Printing,”
Langmuir, vol. 23, no. 25, pp. 12555–12560, 2007.
[69] J. Song, H. Jiang, Y. Huang et al., “Mechanics of stretchable inorganic electronic
materials,” Journal of Vacuum Science & Technology A, vol. 27, no. 5, pp. 1107-
1125, Sep, 2009.
[70] D. H. Kim, J. Z. Song, W. M. Choi et al., “Materials and noncoplanar mesh designs
for integrated circuits with linear elastic responses to extreme mechanical
deformations,” Proceedings of the National Academy of Sciences of the United
States of America, vol. 105, no. 48, pp. 18675-18680, Dec 2, 2008.
[71] S. Xu, Y. H. Zhang, J. Cho et al., “Stretchable batteries with self-similar serpentine
interconnects and integrated wireless recharging systems,” Nature
Communications, vol. 4, pp. 1543, Feb, 2013.
[72] E. Vogel, “Technology and metrology of new electronic materials and devices,”
Nature Nanotechnology, vol. 2, pp. 25-32, 2007.
[73] J. R. Ives, S. M. Mirsattari, and D. Jones, “Miniaturized, on-head, invasive
electrode connector integrated EEG data acquisition system,” Clinical
Neurophysiology, vol. 118, no. 7, pp. 1633-1638, Jul, 2007.
[74] P. Griss, H. K. Tolvanen-Laakso, P. Merilainen et al., “Characterization of
micromachined spiked biopotential electrodes,” Ieee Transactions on Biomedical
Engineering, vol. 49, no. 6, pp. 597-604, Jun, 2002.
[75] A. Searle, and L. Kirkup, “A direct comparison of wet, dry and insulating
bioelectric recording electrodes,” Physiological Measurement, vol. 21, no. 2, pp.
271-283, May, 2000.
[76] S. Kim, C. Laschi, and B. Trimmer, “Soft robotics: a bioinspired evolution in
robotics,” Trends in Biotechnology, vol. 31, no. 5, pp. 23-30, May, 2013.
[77] R. Pfeifer, M. Lungarella, and F. Iida, “The Challenges Ahead for Bio-Inspired
'Soft' Robotics,” Communications of the Acm, vol. 55, no. 11, pp. 76-87, Nov, 2012.
[78] A. E. H. Love, A Treatise on the Mathematical Theory of Elasticity, New York,
USA: Dover Publications, 2011.
[79] Y. J. Kang, and C. H. Yoo, “Thin-walled curved beams .1. Formulation of nonlinear
equations - Closure,” Journal of Engineering Mechanics-Asce, vol. 122, no. 5, pp.
483-484, May, 1996.
[80] V. K. Verma, “Thin-walled curved beams .1. Formulation of nonlinear equations -
Discussion,” Journal of Engineering Mechanics-Asce, vol. 122, no. 5, pp. 483-483,
May, 1996.
[81] Y. B. Yang, and S. R. Kuo, “Thin-walled curved beams .1. Formulation of
nonlinear equations,” Journal of Engineering Mechanics-Asce, vol. 122, no. 5, pp.
482-483, May, 1996.

130
[82] N. L. Liping Liu, “Variational Formulations, Instabilities and Critical Loadings of
Space Curved Beams,” International Journal of Solids and Structures, vol. 87, no.
1, pp. 48-60, 2016.
[83] T. Li, Z. G. Suo, S. P. Lacour et al., “Compliant thin film patterns of stiff materials
as platforms for stretchable electronics,” Journal of Materials Research, vol. 20,
no. 12, pp. 3274-3277, Dec, 2005.
[84] D. S. Gray, J. Tien, and C. S. Chen, “High-conductivity elastomeric electronics,”
Advanced Materials, vol. 16, no. 5, pp. 393-397, Mar 5, 2004.
[85] D. Brosteaux, F. Axisa, M. Gonzalez et al., “Design and fabrication of elastic
interconnections for stretchable electronic circuits,” Ieee Electron Device Letters,
vol. 28, no. 7, pp. 552-554, Jul, 2007.
[86] Y. Y. Hsu, M. Gonzalez, F. Bossuyt et al., “In situ observations on deformation
behavior and stretching-induced failure of fine pitch stretchable interconnect,”
Journal of Materials Research, vol. 24, no. 12, pp. 3573-3582, Dec, 2009.
[87] S. X. Yihui Zhang, Haoran Fu,Juhwan Lee,Jessica Su,Keh-Chih Hwang,John A.
Rogers and Yonggang Huang, “Buckling in serpentine microstructures and
applications in elastomer-supported ultra-stretchable electronics with high areal
coverage,” Soft Matter, vol. 9, pp. 8062-8070, 2013.
[88] H. F. Yihui Zhang, Yewang Su, Sheng Xu ,, J. A. F. Huanyu Cheng , Keh-Chih
Hwang, John A. Rogers⇑,, and b. Yonggang Huang a, c,d,⇑, “Mechanics of ultra-
stretchable self-similar serpentine interconnects,” Acta Materialia, vol. 61, no. 20,
pp. 7916-7827, 2013.
[89] K. G. W. Pijnenburg, T. Seelig, and E. van der Giessen, “Successively refined
models for crack tip plasticity in polymer blends,” European Journal of Mechanics
a-Solids, vol. 24, no. 5, pp. 740-756, Sep-Oct, 2005.
[90] S. W. Hwang, C. H. Lee, H. Y. Cheng et al., “Biodegradable Elastomers and Silicon
Nanomembranes/Nanoribbons for Stretchable, Transient Electronics, and
Biosensors,” Nano Letters, vol. 15, no. 5, pp. 2801-2808, May, 2015.
[91] S. X. Yang, Y. C. Chen, L. Nicolini et al., “"Cut-and-Paste" Manufacture of
Multiparametric Epidermal Sensor Systems,” Advanced Materials, vol. 27, no. 41,
pp. 6423-6430, Nov 4, 2015.
[92] Y. Y. Hsu, M. Gonzalez, F. Bossuyt et al., “Design and analysis of a novel fine
pitch and highly stretchable interconnect,” Microelectronics International, vol. 27,
no. 1, pp. 33-38, 2010.
[93] M. G. Yung-Yu Hsu, Frederick Bossuyt, Fabrice Axisa, Jan Vanfleteren and Ingrid
DeWolf, “The effect of pitch on deformation behavior and the stretching-induced
failure of a polymer-encapsulated stretchable circuit,” Journal of Micromechanics
and Microengineering, vol. 20, no. 7, 2010.
[94] Y. Y. Hsu, M. Gonzalez, F. Bossuyt et al., “The effects of encapsulation on

131
deformation behavior and failure mechanisms of stretchable interconnects,” Thin
Solid Films, vol. 519, no. 7, pp. 2225-2234, Jan 31, 2011.
[95] Y. Y. Hsu, M. Gonzalez, F. Bossuyt et al., “Polyimide-Enhanced Stretchable
Interconnects: Design, Fabrication, and Characterization,” Ieee Transactions on
Electron Devices, vol. 58, no. 8, pp. 2680-2688, Aug, 2011.
[96] M. G. Yung-Yu Hsu, Frederick Bossuyt, Fabrice Axisa, Jan Vanfleteren, Ingrid De
Wolf, “The effects of encapsulation on deformation behavior and failure
mechanisms of stretchable interconnects,” Thin Solid Films, vol. 519, no. 7, pp.
2225–2234, 2011.
[97] X. Huang, W. H. Yeo, Y. H. Liu et al., “Epidermal Differential Impedance Sensor
for Conformal Skin Hydration Monitoring,” Biointerphases, vol. 7, no. 51, pp. 1,
Dec, 2012.
[98] D. H. Kim, N. S. Lu, R. Ghaffari et al., “Inorganic semiconductor nanomaterials
for flexible and stretchable bio-integrated electronics,” NPG Asia Materials, vol. 4,
pp. e15, Apr, 2012.
[99] S. H. Wang, L. Lin, and Z. L. Wang, “Nanoscale Triboelectric-Effect-Enabled
Energy Conversion for Sustainably Powering Portable Electronics,” Nano Letters,
vol. 12, no. 12, pp. 6339-6346, Dec, 2012.
[100] M. Ying, A. P. Bonifas, N. S. Lu et al., “Silicon nanomembranes for fingertip
electronics,” Nanotechnology, vol. 23, no. 34, pp. 344004, Aug 31, 2012.
[101] P. Bai, G. Zhu, Z.-H. Lin et al., “Integrated Multilayered Triboelectric
Nanogenerator for Harvesting Biomechanical Energy from Human Motions,” ACS
Nano, vol. 7, no. 4, pp. 3713-3719, April, 2013, 2013.
[102] W. Wu, X. Wen, and Z. L. Wang, “Taxel-Addressable Matrix of Vertical-Nanowire
Piezotronic Transistors for Active and Adaptive Tactile Imaging,” Science, vol. 340,
no. 6135, pp. 952-957, 2013.
[103] W.-H. Yeo, Y.-S. Kim, J. Lee et al., “Multi-Functional Electronics: Multifunctional
Epidermal Electronics Printed Directly Onto the Skin (Adv. Mater. 20/2013),”
Advanced Materials, vol. 25, no. 20, pp. 2772-2772, 2013.
[104] G. H. Gelinck, H. E. A. Huitema, E. Van Veenendaal et al., “Flexible active-matrix
displays and shift registers based on solution-processed organic transistors,” Nature
Materials, vol. 3, no. 2, pp. 106-110, Feb, 2004.
[105] A. Bollero, L. Kaupmees, T. Raadik et al., “Thermal stability of sputtered
Mo/polyimide films and formation of MoSe2 and MoS2 layers for application in
flexible Cu(In,Ga)(Se,S)(2) based solar cells,” Thin Solid Films, vol. 520, no. 12,
pp. 4163-4168, Apr 2, 2012.
[106] X. X. Wang, J. Y. Zhou, L. Lei et al., “High Resolution ITO Lithography Using
Excimer Laser for Flat-Panel Display Fabrication,” Advanced Manufacturing
Technology, Pts 1-3, vol. 314-316, pp. 1910-1913, 2011.

132
[107] C. H. Moon, “The Effect of the ITO Electrode Structure on the Luminous
Characteristics of a Plasma Display Panel,” Ieee Transactions on Plasma Science,
vol. 38, no. 9, pp. 2445-2450, Sep, 2010.
[108] J. H. Lee, S. H. Sohn, J. H. Moon et al., “Characteristics of ITO Thin Films for the
Plasma Display Panel Prepared by a MF Dual Magnetron Sputtering in the Oxygen
Atmosphere,” Molecular Crystals and Liquid Crystals, vol. 499, pp. 500-506, 2009.
[109] X. J. Zhou, J. W. Xu, L. Yang et al., “Effects of tin content on structure, properties,
electrical repeatability, uniformity and stability of high sheet resistance ITO thin
films for touch panels,” Journal of Materials Science-Materials in Electronics, vol.
26, no. 9, pp. 6954-6960, Sep, 2015.
[110] S. Y. Liu, W. H. Li, Y. J. Wang et al., “One Glass Single ITO Layer Solution for
Large Size Projected-Capacitive Touch Panels,” Journal of Display Technology,
vol. 11, no. 9, pp. 725-729, Sep, 2015.
[111] C. H. Kim, W. J. Choi, S. K. Cho et al., “Fabrication of Structurally Simple Index-
Matched ITO Films Using Roll-to-Roll Sputtering for Touch Screen Panel Devices,”
Plasma Processes and Polymers, vol. 12, no. 11, pp. 1322-1327, Nov, 2015.
[112] S. H. Park, S. J. Lee, J. H. Lee et al., “Large area roll-to-roll sputtering of
transparent ITO/Ag/ITO cathodes for flexible inverted organic solar cell modules,”
Organic Electronics, vol. 30, pp. 112-121, Mar, 2016.
[113] X. Li, C. Y. Li, S. W. Hou et al., “Thickness of ITO thin film influences on
fabricating ZnO nanorods applying for dye-sensitized solar cell,” Composites Part
B-Engineering, vol. 74, pp. 147-152, Jun 1, 2015.
[114] A. Arunachalam, S. Dhanapandian, C. Manoharan et al., “Characterization of
sprayed TiO2 on ITO substrates for solar cell applications,” Spectrochimica Acta
Part a-Molecular and Biomolecular Spectroscopy, vol. 149, pp. 904-912, Oct 5,
2015.
[115] C. J. Yu, Z. Duan, P. X. Yuan et al., “Electronically Programmable, Reversible
Shape Change in Two- and Three-Dimensional Hydrogel Structures,” Advanced
Materials, vol. 25, no. 11, pp. 1541-1546, Mar 20, 2013.
[116] H. C. Ko, M. P. Stoykovich, J. Z. Song et al., “A hemispherical electronic eye
camera based on compressible silicon optoelectronics,” Nature, vol. 454, no. 7205,
pp. 748-753, Aug 7, 2008.
[117] L. Z. Xu, S. R. Gutbrod, Y. J. Ma et al., “Materials and Fractal Designs for 3D
Multifunctional Integumentary Membranes with Capabilities in Cardiac
Electrotherapy,” Advanced Materials, vol. 27, no. 10, pp. 1731-+, Mar 11, 2015.
[118] L. Z. Xu, S. R. Gutbrod, A. P. Bonifas et al., “3D multifunctional integumentary
membranes for spatiotemporal cardiac measurements and stimulation across the
entire epicardium,” Nature Communications, vol. 5, Feb, 2014.
[119] J. Kim, A. Banks, Z. Q. Xie et al., “Miniaturized Flexible Electronic Systems with

133
Wireless Power and Near-Field Communication Capabilities,” Advanced
Functional Materials, vol. 25, no. 30, pp. 4761-4767, Aug 12, 2015.
[120] J. Kim, A. Banks, H. Y. Cheng et al., “Epidermal Electronics with Advanced
Capabilities in Near-Field Communication,” Small, vol. 11, no. 8, pp. 906-912, Feb
25, 2015.
[121] M. Gonzalez, F. Axisa, F. Bossuyt et al., “Design and performance of metal
conductors for stretchable electronic circuits,” Circuit World, vol. 35, no. 1, pp. 22-
29, 2009.
[122] Y. Qi, J. Kim, T. D. Nguyen et al., “Enhanced Piezoelectricity and Stretchability in
Energy Harvesting Devices Fabricated from Buckled PZT Ribbons,” Nano Letters,
vol. 11, no. 3, pp. 1331-1336, Mar, 2011.
[123] T. Ma, Y. Wang, R. Tang et al., “Pre-patterned ZnO nanoribbons on soft substrates
for stretchable energy harvesting applications,” Journal of Applied Physics, vol.
113, no. 20, pp. 204503, 2013.
[124] Y. Qi, T. D. Nguyen, P. K. Purohit et al., "Stretchable Piezoelectric Nanoribbons
for Biocompatible Energy Harvesting," Stretchable Electronics, pp. 111-139:
Wiley-VCH Verlag GmbH & Co. KGaA, 2012.
[125] C. Peng, Z. Jia, D. Bianculli et al., “In situ electro-mechanical experiments and
mechanics modeling of tensile cracking in indium tin oxide thin films on polyimide
substrates,” Journal of Applied Physics, vol. 109, no. 10, May 15, 2011.
[126] C. Peng, Z. Jia, H. Neilson et al., “In Situ Electro-Mechanical Experiments and
Mechanics Modeling of Fracture in Indium Tin Oxide-Based Multilayer
Electrodes,” Advanced Engineering Materials, vol. 15, no. 4, pp. 250-256, Apr,
2013.
[127] S. X. Yang, B. Su, G. Bitar et al., “Stretchability of indium tin oxide (ITO)
serpentine thin films supported by Kapton substrates,” International Journal of
Fracture, vol. 190, no. 1-2, pp. 99-110, Nov, 2014.
[128] T. W. Shield, K. S. Kim, and R. T. Shield, “The Buckling of an Elastic Layer
Bonded to an Elastic Substrate in Plane-Strain (Vol 61, Pg 231, 1994),” Journal of
Applied Mechanics-Transactions of the Asme, vol. 61, no. 4, pp. 796-796, Dec,
1994.
[129] G. Gioia, and M. Ortiz, “Delamination of compressed thin films,” Advances in
Applied Mechanics, Vol 33, vol. 33, pp. 119-192, 1997.
[130] J. Liang, R. Huang, H. Yin et al., “Relaxation of compressed elastic islands on a
viscous layer,” Acta Materialia, vol. 50, no. 11, pp. 2933-2944, Jun 28, 2002.
[131] S. Goyal, K. Srinivasan, G. Subbarayan et al., “On instability-induced debond
initiation in thin film systems,” Engineering Fracture Mechanics, vol. 77, no. 8, pp.
1298-1313, May, 2010.
[132] J. Song, H. Jiang, Z. Liu et al., “Buckling of a stiff thin film on a compliant substrate

134
in large deformation,” International Journal of Solids and Structures, vol. 45, no.
10, pp. 3107-3121, May 15 2008, 2008.
[133] M. A. Brenckle, H. Y. Cheng, S. Hwang et al., “Modulated Degradation of
Transient Electronic Devices through Multilayer Silk Fibroin Pockets,” Acs
Applied Materials & Interfaces, vol. 7, no. 36, pp. 19870-19875, Sep 16, 2015.
[134] S. Il Park, D. S. Brenner, G. Shin et al., “Soft, stretchable, fully implantable
miniaturized optoelectronic systems for wireless optogenetics,” Nature
Biotechnology, vol. 33, no. 12, pp. 1280-1286, Dec, 2015.
[135] C. H. Lee, H. Kim, D. V. Harburg et al., “Biological lipid membranes for on-
demand, wireless drug delivery from thin, bioresorbable electronic implants,” Npg
Asia Materials, vol. 7, Nov, 2015.
[136] S. K. Kang, R. K. J. Murphy, S. W. Hwang et al., “Bioresorbable silicon electronic
sensors for the brain,” Nature, vol. 530, no. 7588, pp. 71-76, Feb 4, 2016.
[137] A. Koh, S. R. Gutbrod, J. D. Meyers et al., “Ultrathin Injectable Sensors of
Temperature, Thermal Conductivity, and Heat Capacity for Cardiac Ablation
Monitoring,” Advanced Healthcare Materials, vol. 5, no. 3, pp. 373-381, Feb 4,
2016.
[138] J. Rogers, Y. G. Huang, O. G. Schmidt et al., “Origami MEMS and NEMS,” Mrs
Bulletin, vol. 41, no. 2, pp. 123-129, Feb, 2016.
[139] Y. H. Zhang, R. C. Webb, H. Y. Luo et al., “Theoretical and Experimental Studies
of Epidermal Heat Flux Sensors for Measurements of Core Body Temperature,”
Advanced Healthcare Materials, vol. 5, no. 1, pp. 119-127, Jan, 2016.
[140] S. D. Wang, M. Li, J. Wu et al., “Mechanics of Epidermal Electronics,” Journal of
Applied Mechanics-Transactions of the Asme, vol. 79, no. 3, May, 2012.
[141] J. W. Jeong, W. H. Yeo, A. Akhtar et al., “Materials and Optimized Designs for
Human-Machine Interfaces Via Epidermal Electronics,” Advanced Materials, vol.
25, no. 47, pp. 6839-6846, Dec, 2013.
[142] S. T. Qiao, J. B. Gratadour, L. Wang et al., “Conformability of a Thin Elastic
Membrane Laminated on a Rigid Substrate With Corrugated Surface,” Ieee
Transactions on Components Packaging and Manufacturing Technology, vol. 5, no.
9, pp. 1237-1243, Sep, 2015.
[143] N. L. Liu Wang, “Conformability of a Thin Elastic Membrane Laminated on a Soft
Substrate With Slightly Wavy Surface,” Journal of Applied Mechanics, vol. 83, no.
4, pp. 1662-1671, 2016.
[144] H. J. Kock, K. M. Sturmer, R. Letsch et al., “Interface and Biocompatibility of
Polyethylene Terephthalate Knee Ligament Prostheses - a Histological and
Ultrastructural Device Retrieval Analysis in Failed Synthetic Implants Used for
Surgical Repair of Anterior Cruciate Ligaments,” Archives of Orthopaedic and
Trauma Surgery, vol. 114, no. 1, pp. 1-7, Dec, 1994.

135
[145] I. K. Descheerder, K. V. Wilczek, E. V. Verbeken et al., “Intraarterial
Biocompatibility of Polyethylene Terephthalate Self-Expandable Stents Implanted
in Porcine Peripheral Arteries,” Academic Radiology, vol. 2, no. 2, pp. 154-158,
Feb, 1995.
[146] H. Seitz, S. Marlovits, I. Schwendenwein et al., “The biocompatibility of
polyethylene terephthalate PET (Trevira(R) hochfest). An in vivo study on sheep
stifle joints,” Biomedizinische Technik, vol. 41, no. 6, pp. 178-182, Jun, 1996.
[147] H. Seitz, S. Marlovits, I. Schwendenwein et al., “Biocompatibility of polyethylene
terephthalate (Trevira (R) hochfest) augmentation device in repair of the anterior
cruciate ligament,” Biomaterials, vol. 19, no. 1-3, pp. 189-196, Jan-Feb, 1998.
[148] N. V. Thakor, and Y. S. Zhu, “Applications of Adaptive Filtering to Ecg Analysis
- Noise Cancellation and Arrhythmia Detection,” Ieee Transactions on Biomedical
Engineering, vol. 38, no. 8, pp. 785-794, Aug, 1991.
[149] W. Klimesch, “EEG alpha and theta oscillations reflect cognitive and memory
performance: a review and analysis,” Brain Research Reviews, vol. 29, no. 2-3, pp.
169-195, Apr, 1999.
[150] F. Rosenow, K. M. Klein, and H. M. Hamer, “Non-invasive EEG evaluation in
epilepsy diagnosis,” Expert Review of Neurotherapeutics, vol. 15, no. 4, pp. 425-
444, Apr, 2015.
[151] K. G. Jordan, “Emergency EEG and continuous EEG monitoring in acute ischemic
stroke,” Journal of Clinical Neurophysiology, vol. 21, no. 5, pp. 341-352, Sep-Oct,
2004.
[152] A. M. F. L. M. de Sa, J. M. de Seixas, J. D. Costa et al., “A principal component-
based algorithm for denoising in single channel data (PCA for denoising in single
channel data),” Measurement, vol. 60, pp. 121-128, Jan, 2015.
[153] C. Blichmann, and J. Serup, “Hydration Studies on Scaly Hand Eczema,” Contact
Dermatitis, vol. 16, no. 3, pp. 155-159, Mar, 1987.
[154] B. M. Morrison, and D. D. Scala, “Comparison of instrumental measurements of
skin hydration,” Journal of Toxicology-Cutaneous and Ocular Toxicology, vol. 15,
no. 4, pp. 305-314, 1996.
[155] P. G. Sator, J. B. Schmidt, and H. Honigsmann, “Comparison of epidermal
hydration and skin surface lipids in healthy individuals and in patients with atopic
dermatitis,” Journal of the American Academy of Dermatology, vol. 48, no. 3, pp.
352-358, Mar, 2003.
[156] K. L. E. Hon, K. Y. Wong, T. F. Leung et al., “Comparison of skin hydration
evaluation sites and correlations among skin hydration, transepidermal water loss,
SCORAD index, Nottingham eczema severity score, and quality of life in patients
with atopic dermatitis,” American Journal of Clinical Dermatology, vol. 9, no. 1,
pp. 45-50, 2008.

136
[157] J. Fantasia, J. C. Liu, and T. Chen, “Comparison of skin hydration levels among
three ethnic populations in the United States,” Journal of the American Academy of
Dermatology, vol. 62, no. 3, pp. Ab60-Ab60, Mar, 2010.
[158] P. G. Sator, J. B. Schmidt, T. Rabe et al., “Skin aging and sex hormones in women
- clinical perspectives for intervention by hormone replacement therapy,”
Experimental Dermatology, vol. 13, pp. 36-40, Dec, 2004.
[159] B. W. Tran, A. D. P. Papoiu, C. V. Russoniello et al., “Effect of Itch, Scratching
and Mental Stress on Autonomic Nervous System Function in Atopic Dermatitis,”
Acta Dermato-Venereologica, vol. 90, no. 4, pp. 354-361, 2010.
[160] S. M. Kleiner, “Water: An essential but overlooked nutrient,” Journal of the
American Dietetic Association, vol. 99, no. 2, pp. 200-206, Feb, 1999.
[161] M. Boguniewicz, N. Nicol, K. Kelsay et al., “A multidisciplinary approach to
evaluation and treatment of atopic dermatitis,” Seminars in Cutaneous Medicine
and Surgery, vol. 27, no. 2, pp. 115-127, Jun, 2008.
[162] N. Lu, C. Lu, S. Yang et al., “Highly Sensitive Skin-Mountable Strain Gauges
Based Entirely on Elastomers,” Advanced Functional Materials, vol. 22, no. 19, pp.
4044-4050, 2012.
[163] V. Arumugam, M. D. Naresh, and R. Sanjeevi, “Effect of Strain-Rate on the
Fracture-Behavior of Skin,” Journal of Biosciences, vol. 19, no. 3, pp. 307-313,
Sep, 1994.
[164] B. Liea, and K. J. Loh, “Passive Wireless Sensors for Monitoring Particle
Movement at Soil-Structure Interfaces,” Sensors and Smart Structures
Technologies for Civil, Mechanical, and Aerospace Systems 2010, vol. 7647, 2010.
[165] Y. Ikemoto, S. Suzuki, H. Okamoto et al., “Force sensor system for structural health
monitoring using passive RFID tags,” Sensor Review, vol. 29, no. 2, pp. 127-136,
2009.
[166] M. Kubo, X. F. Li, C. Kim et al., “Stretchable Microfluidic Radiofrequency
Antennas,” Advanced Materials, vol. 22, no. 25, pp. 2749-2752, Jul 6, 2010.
[167] R. Matsuzaki, and A. Todoroki, “Wireless flexible capacitive sensor based on ultra-
flexible epoxy resin for strain measurement of automobile tires,” Sensors and
Actuators a-Physical, vol. 140, no. 1, pp. 32-42, Oct 1, 2007.
[168] K. H. Shin, C. R. Moon, T. H. Lee et al., “Flexible wireless pressure sensor module,”
Sensors and Actuators a-Physical, vol. 123-24, pp. 30-35, Sep 23, 2005.
[169] M. G. A. Michael A. Fonseca (1), Jason Kroh (2) and Jason White, “Flexible
Wireless Passive Pressure Sensors For Biomedical Applications,” 2006.
[170] Greenhou.Hm, “Design of Planar Rectangular Microelectronic Inductors,” Ieee
Transactions on Parts Hybrids and Packaging, vol. Ph10, no. 2, pp. 101-109, 1974.
[171] S. S. Mohan, M. D. Hershenson, S. P. Boyd et al., “Simple accurate expressions for
planar spiral inductances,” Ieee Journal of Solid-State Circuits, vol. 34, no. 10, pp.

137
1419-1424, Oct, 1999.
[172] K. Um, and B. An, “Design of rectangular printed planar antenna via input
impedance for supporting mobile wireless communications,” Ieee 55th Vehicular
Technology Conference, Vtc Spring 2002, Vols 1-4, Proceedings, pp. 948-951,
2002.
[173] K. Phaebua, D. Torrungrueng, and C. Phongcharoenphanich, “Design of Planar
Rectangular Spiral Antennas for the Wireless Vehicle Battery Charging System,”
2013 Asia-Pacific Microwave Conference Proceedings (Apmc 2013), pp. 1172-
1174, 2013.