copyright © cengage learning. all rights reserved. 9 topics in analytic geometry
TRANSCRIPT

Copyright © Cengage Learning. All rights reserved.
9 Topics in Analytic Geometry
Copyright © Cengage Learning. All rights reserved.
9.6 Graphs of Polar Equations
3
What You Should Learn
• Graph polar equations by point plotting
• Use symmetry and zeros as sketching aids
• Recognize special polar graphs
4
Introduction
5
Introduction
In previous chapters you sketched graphs in rectangular coordinate systems. You began with the basic point-plotting method.
Then you used sketching aids such as a graphingutility, symmetry, intercepts, asymptotes, periods, and shifts.
This section approaches curve sketching in the polar coordinate system similarly.
6
Example 1 – Graphing a Polar Equation by Point Plotting
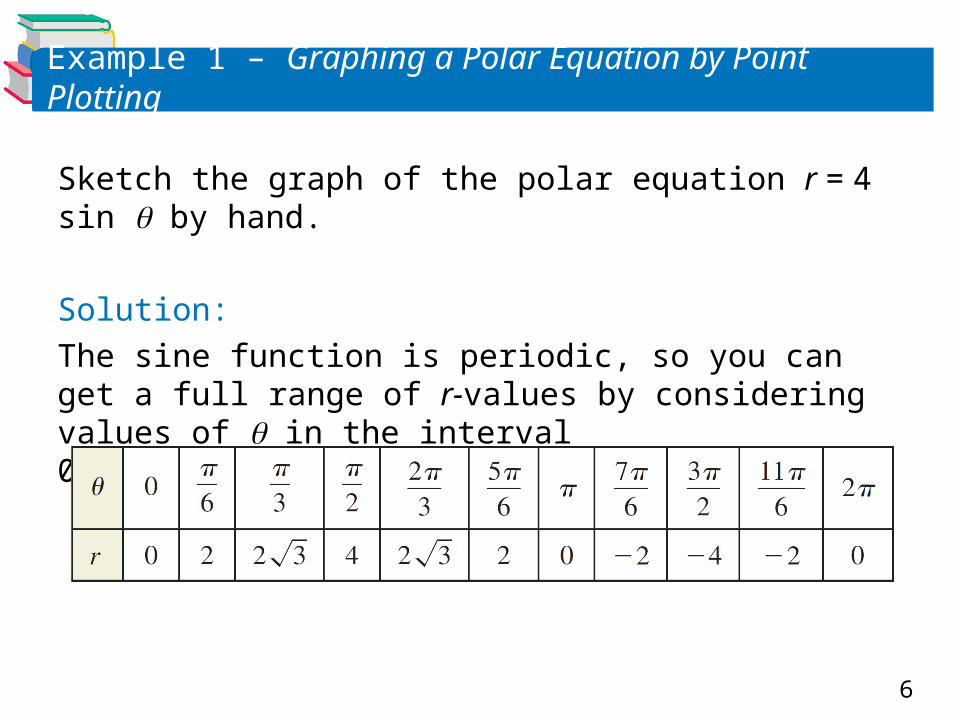
Sketch the graph of the polar equation r = 4 sin by hand.
Solution:
The sine function is periodic, so you can get a full range of r-values by considering values of in the interval 0 2, as shown in the table.
7
Example 1 – Solution
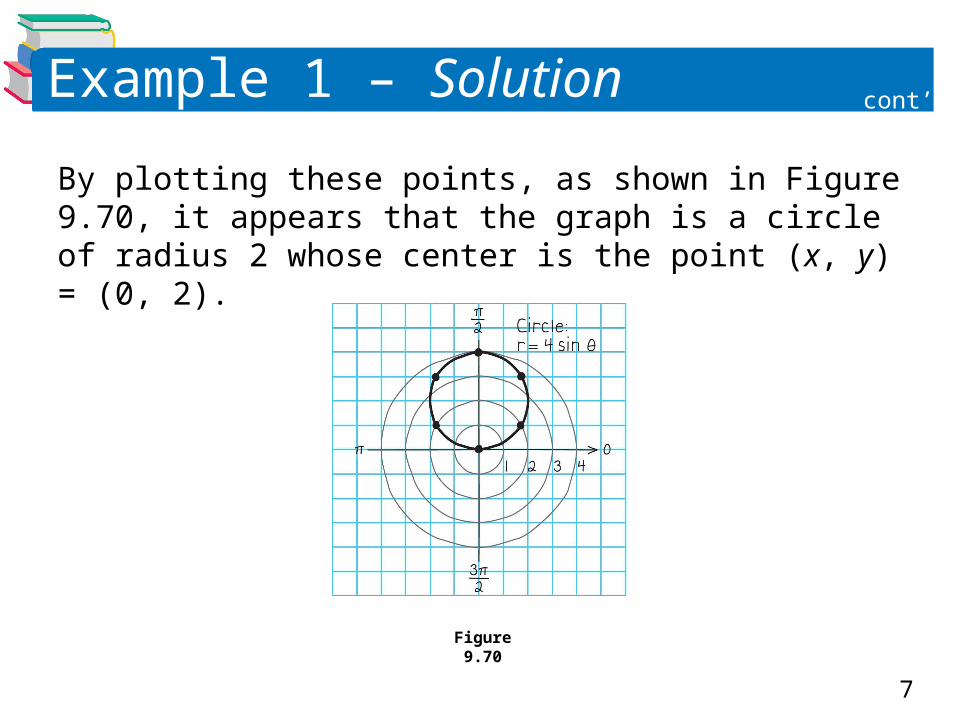
By plotting these points, as shown in Figure 9.70, it appears that the graph is a circle of radius 2 whose center is the point (x, y) = (0, 2).
Figure 9.70
cont’d
8
Symmetry and Zeros

9
Symmetry and Zeros
In Figure 9.70, note that as increases from 0 to 2 the graph is traced out twice. Moreover, note that the graph is symmetric with respect to the line = /2. Had you known about this symmetry and retracing ahead of time, you could have used fewer points.
Figure 9.70
10
Symmetry and Zeros
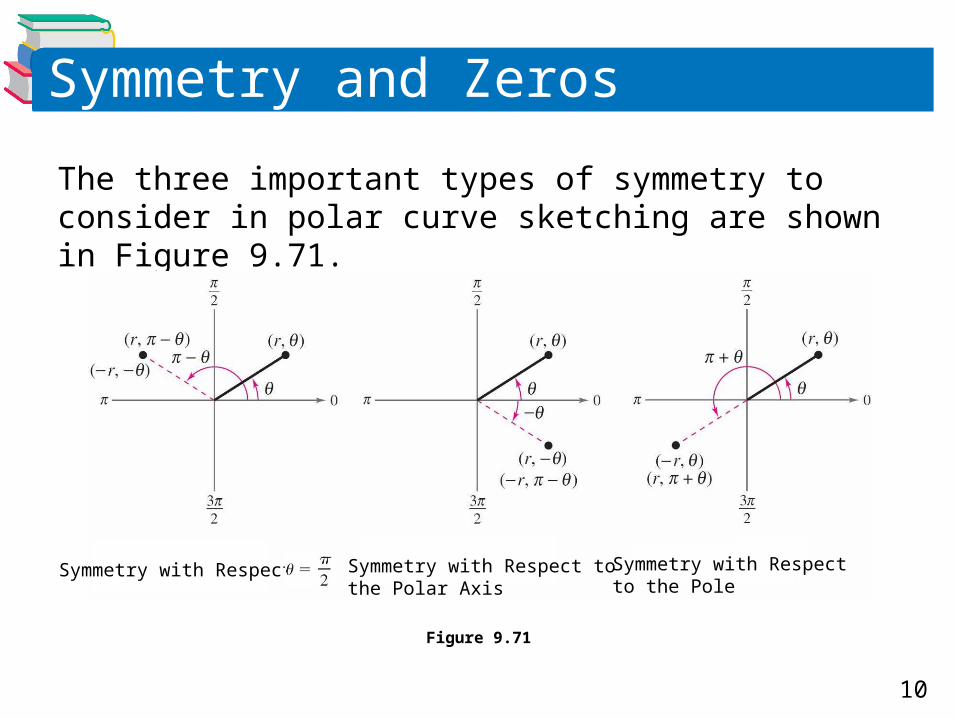
The three important types of symmetry to consider in polar curve sketching are shown in Figure 9.71.
Figure 9.71
Symmetry with Respect Symmetry with Respect to the Polar Axis
Symmetry with Respectto the Pole

11
Symmetry and Zeros
12
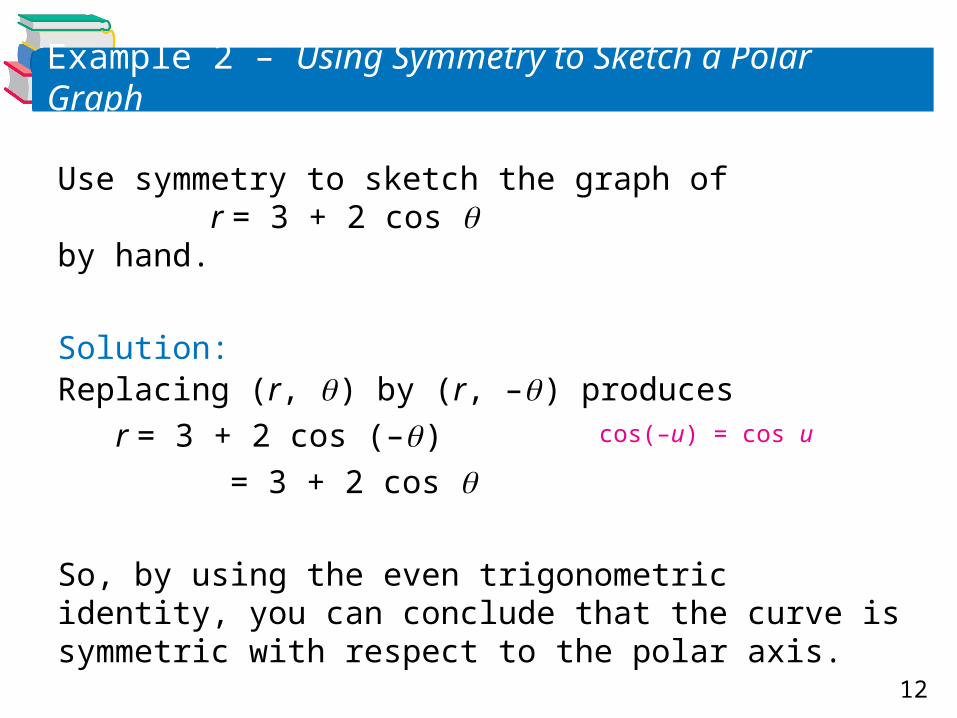
Example 2 – Using Symmetry to Sketch a Polar Graph
Use symmetry to sketch the graph of r = 3 + 2 cos by hand.
Solution:Replacing (r, ) by (r, – ) produces
r = 3 + 2 cos (– )
= 3 + 2 cos
So, by using the even trigonometric identity, you can conclude that the curve is symmetric with respect to the polar axis.
cos(–u) = cos u

13
Example 2 – Solution
Plotting the points in the table and using polar axissymmetry, you obtain the graph shown in Figure 9.72. This graph is called a limaçon.
Use a graphing utility to confirm this graph.
cont’d
Figure 9.72
14
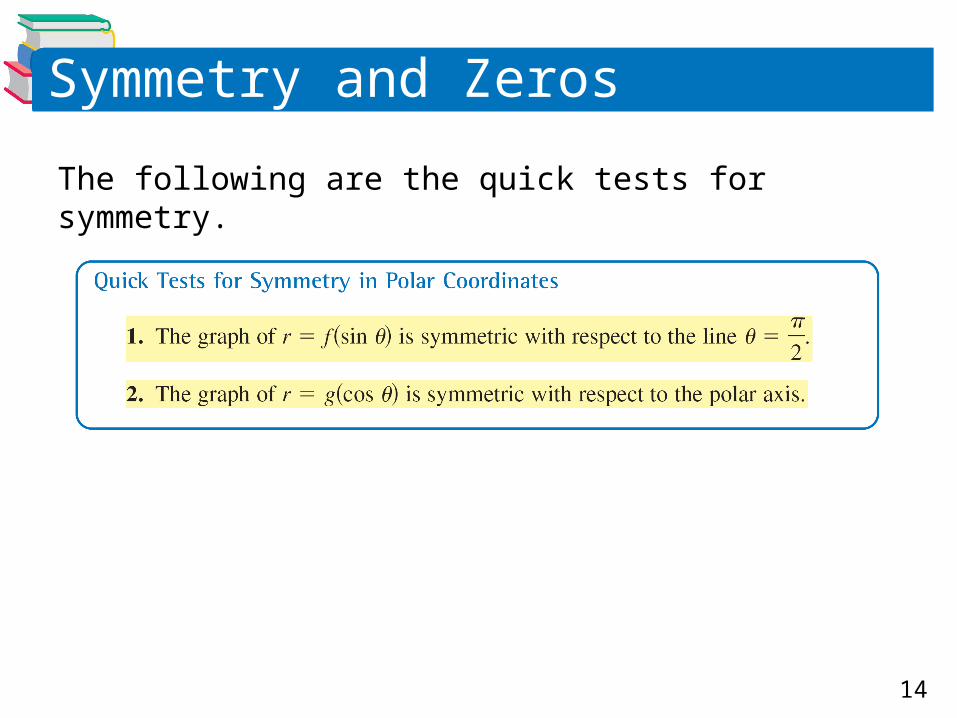
Symmetry and Zeros
The following are the quick tests for symmetry.

15
Special Polar Graphs
16
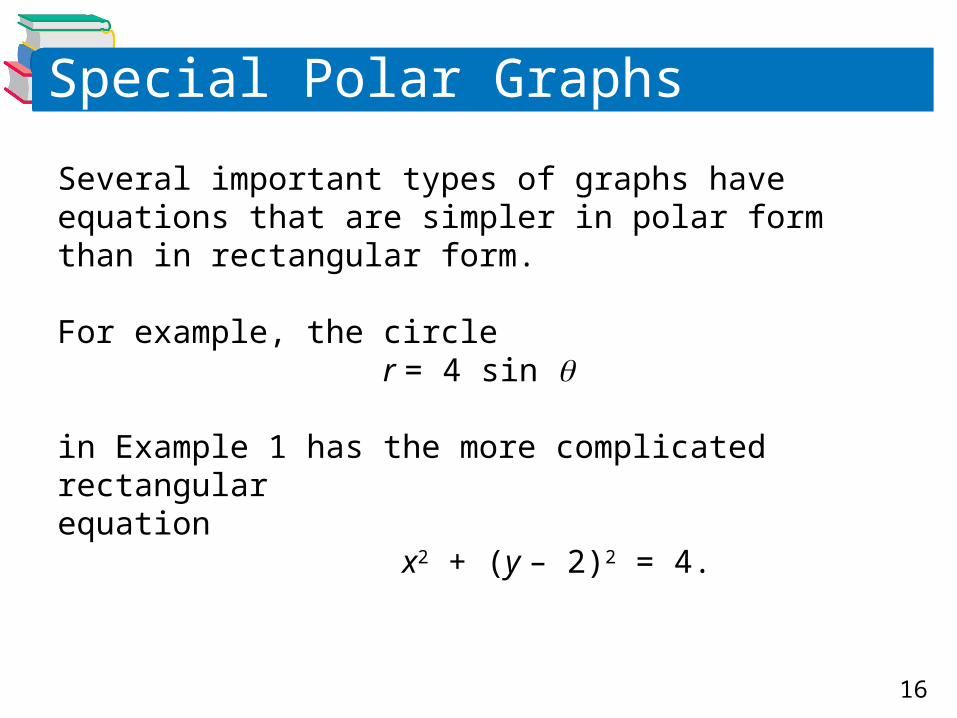
Special Polar Graphs
Several important types of graphs have equations that are simpler in polar form than in rectangular form.
For example, the circle r = 4 sin in Example 1 has the more complicated rectangularequation x2 + (y – 2)2 = 4.
17
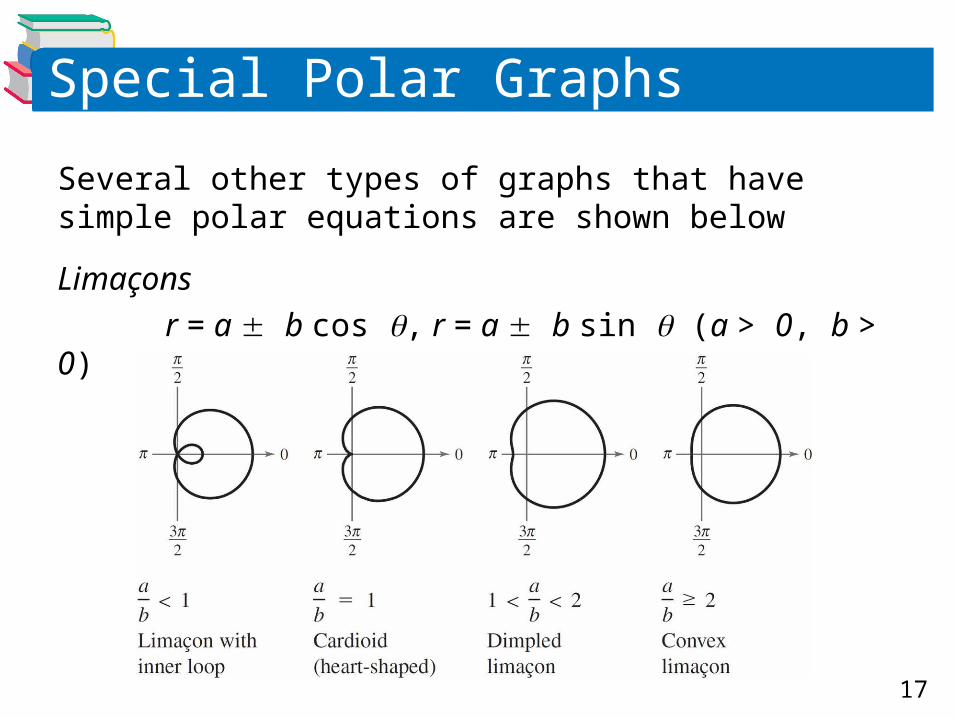
Special Polar Graphs
Several other types of graphs that have simple polar equations are shown below
Limaçons
r = a b cos , r = a b sin (a > 0, b > 0)
18
Special Polar Graphs
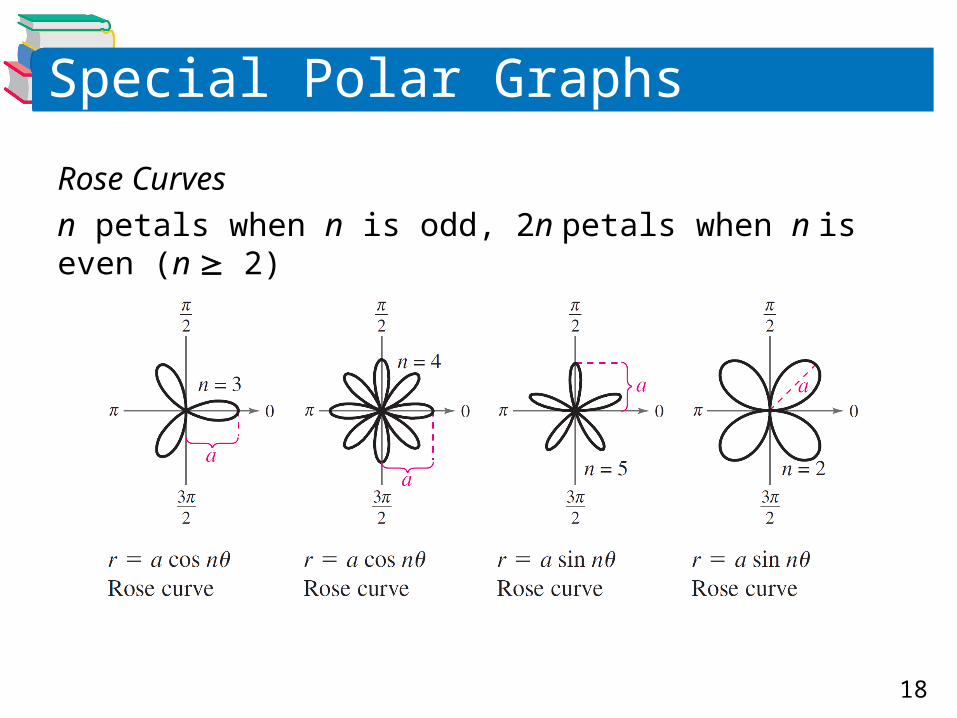
Rose Curves
n petals when n is odd, 2n petals when n is even (n 2)
19
Special Polar Graphs
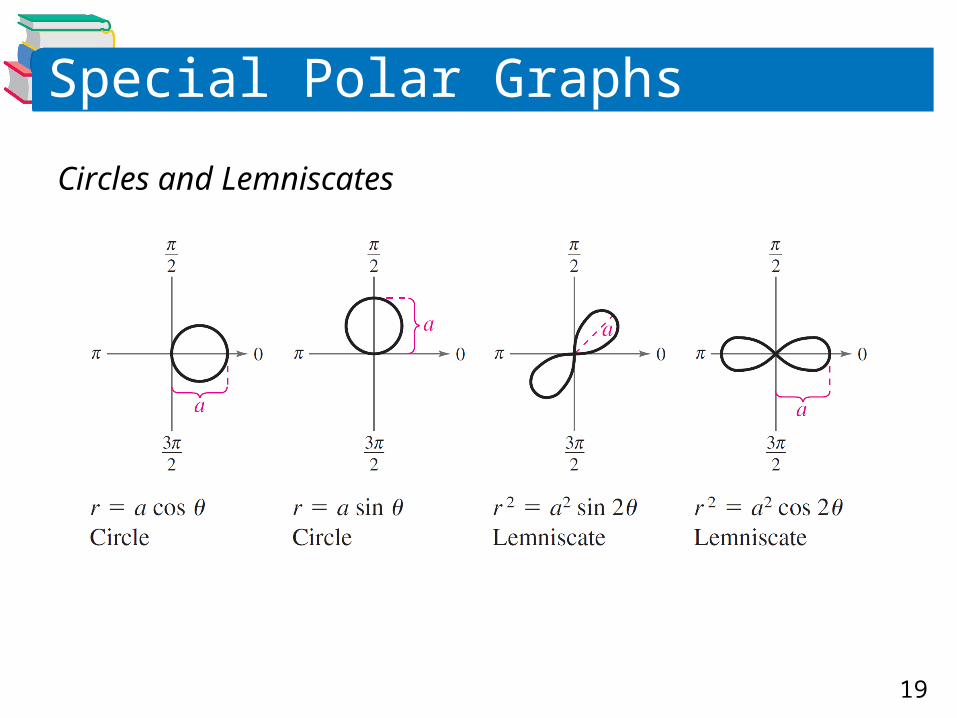
Circles and Lemniscates
20
Example 4 – Analyzing a Rose Curve
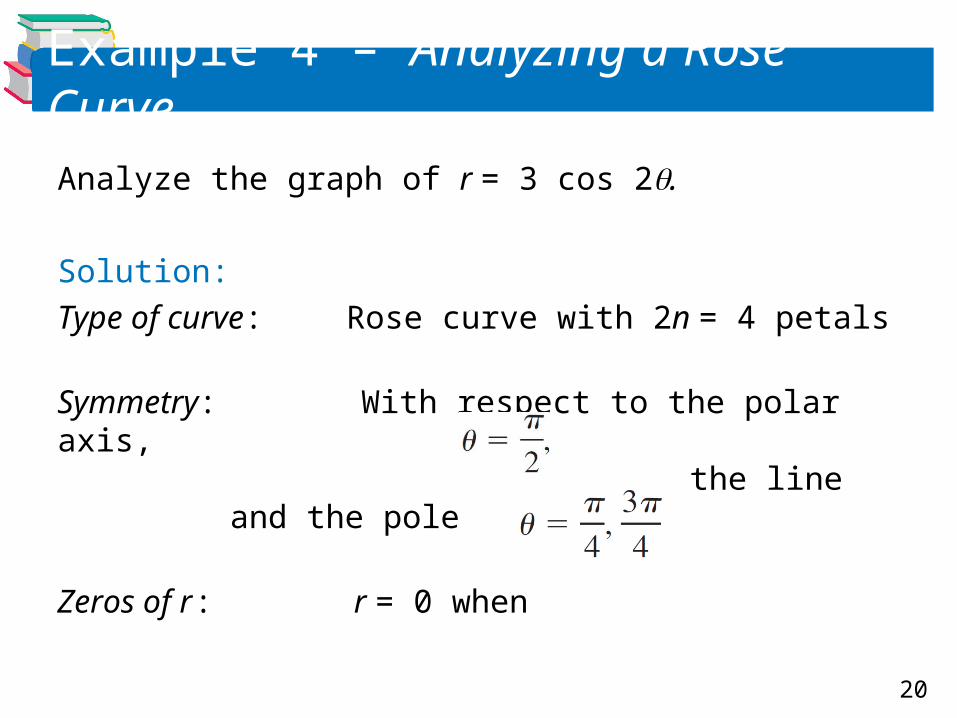
Analyze the graph of r = 3 cos 2.
Solution:
Type of curve: Rose curve with 2n = 4 petals
Symmetry: With respect to the polar axis, the line and the pole
Zeros of r : r = 0 when
21
Example 4 – Solution
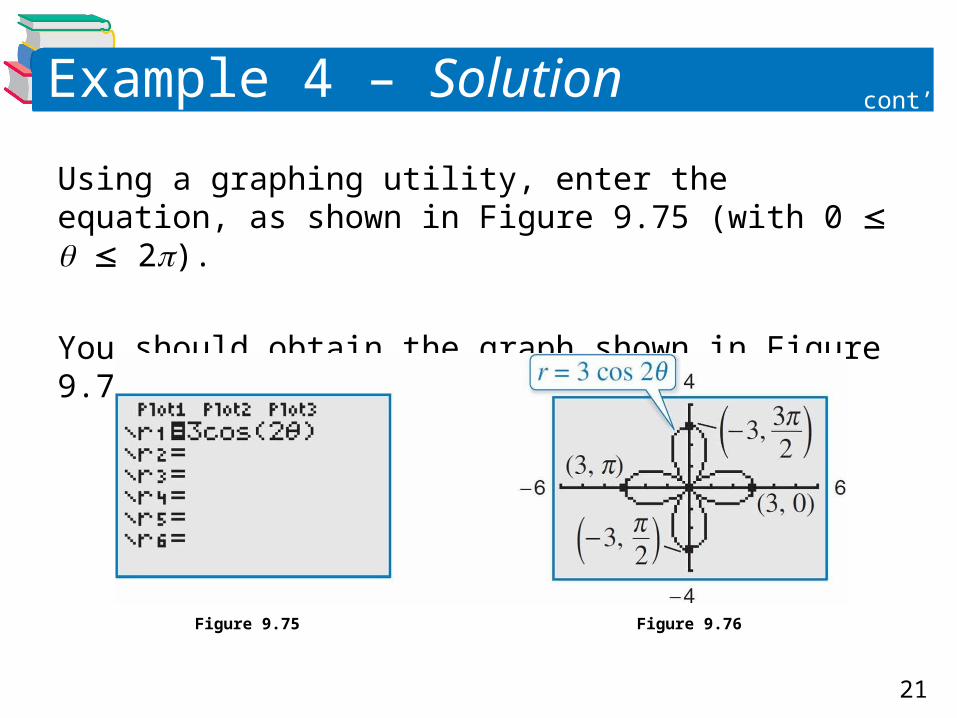
Using a graphing utility, enter the equation, as shown in Figure 9.75 (with 0 2).
You should obtain the graph shown in Figure 9.76.
Figure 9.76Figure 9.75
cont’d