copyright de beers 2004 de beers seminar to anglo american analysts 23rd september 2004
Post on 21-Dec-2015
217 views
TRANSCRIPT

Copyright De Beers 2004
De Beers Seminar toAnglo American
Analysts
23rd September 2004

Copyright De Beers 2004
Agenda
• Welcome by Nicky Oppenheimer, Chairman
• Introduction by Gary Ralfe, Managing Director
• Paddy Kell, Finance Director
• Gareth Penny, Managing Director, DTC
• Gary Ralfe, Managing Director
• Q&A
• Advertising Commercials

Copyright De Beers 2004
DebswanaGroup
Central HoldingsGroup
Anglo AmericanGroup
CentralInvestments (DBI)
Lux
DB Investments(Lux)
De Beers sa(Lux)
De BeersCentenary
(Swtizerland)
De BeersConsolidated Mines
(South Africa)
Debswana(Botswana)
Namdeb(Namibia)
DTC*(UK)
*DTC (Pty) Ltd(South Africa) wholly owned by DBCM
11% 89%
45%10% 45%
100%
100%
50% 50% 100%
100%
De Beers Group of companies

Copyright De Beers 2004
De Beers & the Diamond Industry
Size of the Diamond Business 2003
World Production of Rough ($bn)De Beers
Group+
OtherProducers
= $9.1
$3.6 $5.5
World Supply of Rough ($bn)De Beers
Group+
OtherProducers
= $10.1
$5.6 $4.5
Polished Equivalent of Supply ($bn) $16.1
Global Sales of Diamond Jewellery ($bn) $57

Copyright De Beers 2004
Change in business modelCustodianship to Leadership
Supply Control Driving Demand Growth
Utilising key assets:– Mystique of the natural diamond– Producer partnerships– Diamond knowledge and expertise– “De Beers” brand potential
With full legal compliance
Driving demandSupplier of
ChoiceDe Beers’
BrandEffective
Organisation

Copyright De Beers 2004
Privatisation - 2001
Dedicated diamond mining and marketing business
Since delisting we have:
– Liberated $2.06 billion from stocks
– Generated operating cash flow of $4.5 billion
– Reduced net gearing level from 57% to 21%
– Repaid $4.5bn acquisition facility ahead of schedule
– Refinanced on favourable terms with $2.5bn revolving facility
– Paid ordinary dividends of $838m (pref dividends $266m)

Copyright De Beers 2004
Primary strategic levers
5. Producer proposition
6. Synthetics response
7. Organisation effectiveness
1. Demand growth
2. Profitable production growth
3. Creating value through the DTC
4. Cost and working capital efficiencies
Profitability Sustainability

Copyright De Beers 2004
Paddy Kell
Finance Director
De Beers

Copyright De Beers 2004
Agenda
• Results for 6 months ended 30 Jun 2004
• Trends:• EBITDA• ROCE • ROE• Cash flow / debt• Costs
•
Looking forward
Copyright De Beers 2004
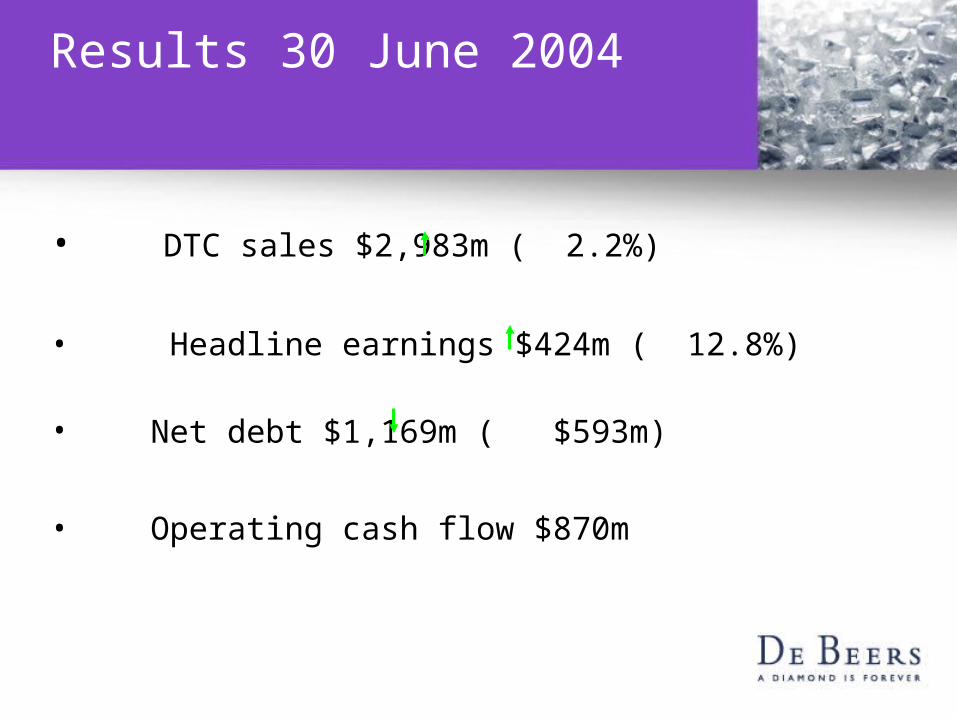
Results 30 June 2004
• DTC sales $2,983m ( 2.2%)
• Headline earnings $424m ( 12.8%)
• Net debt $1,169m ( $593m)
• Operating cash flow $870m

Copyright De Beers 2004
Headline earnings June 2003 - 2004
82
107
112 89
63
24424
376
9
68
200
250
300
350
400
450
500
550
600
650
HeadlineJune 2003
Currency Price &volume
Tradeinvestment
& otherincome
Sorting andmarketing
Financing Tax JV's Other HeadlineJune 2004
US
$ M

Copyright De Beers 2004
EBITDA
0
200
400
600
800
1000
1200
1400
1600
1800
2000
Dec-1994
Dec-1995
Dec-1996
Dec-1997
Dec-1998
Dec-1999
Dec-2000
Dec-2001
Dec-2002
Jun-2003
Dec-2003
Jun-2004
US
$ M
Total Diamond business only June
NFO/GMRappointed
Privatisation

Copyright De Beers 2004
ROCE
0.0%
5.0%
10.0%
15.0%
20.0%
25.0%
Dec-1994
Dec-1995
Dec-1996
Dec-1997
Dec-1998
Dec-1999
Dec-2000
Dec-2001
Dec-2002
Jun-2003
Dec-2003
Jun-2004
Total Diamond business only Diamond business (June)
Based on headline earnings

Copyright De Beers 2004
ROE
0.0%
5.0%
10.0%
15.0%
20.0%
25.0%
Dec-1994
Dec-1995
Dec-1996
Dec-1997
Dec-1998
Dec-1999
Dec-2000
Dec-2001
Dec-2002
Jun-2003
Dec-2003
Jun-2004
Total Diamond business only June
Based on headline earnings

Copyright De Beers 2004
Operating cash flowOperating cash flow
-500
0
500
1000
1500
2000
2500
Dec-1994
Dec-1995
Dec-1996
Dec-1997
Dec-1998
Dec-1999
Dec-2000
Dec-2001
Dec-2002
Jun-2003
Dec-2003
Jun-2004
US
$ M
Total Diamond business only Diamond business (June)

Copyright De Beers 2004
4008
3290
2572
1783 1762
1169
0
500
1000
1500
2000
2500
3000
3500
4000
4500
Dec 2001 Jun 2002 Dec 2002 Jun 2003 Dec 2003 Jun 2004 Dec 2004
US
$ M
Net Debt

Copyright De Beers 2004
Net working capital
0
1000
2000
3000
4000
5000
6000
Dec-94
Dec-95
Dec-96
Dec-97
Dec-98
Dec-99
Dec-00
Dec-01
Dec-02
Jun-03
Dec-03
Jun-04
US
$ M
December June
Including diamond stocks

Copyright De Beers 2004
Cash costs
(100)
100
300
500
700
900
1,100
1,300
1,500
1,700
2001 2002 2003 2004F
US$
M
Production costs Sorting, selling & marketingExploration & research Corporate
995878
1292
1500est

Copyright De Beers 2004
Increasing carat production…
SOUTH AFRICAN, DEBSWANA & NAMDEB OPERATIONS - DIAMOND RECOVERY
10.7 10.4 11.9 13.4
26.4 28.430.4
29.6
1.41.3
1.5 1.90.3
0.2
0.20.2
-
5
10
15
20
25
30
35
40
45
50
2001 2002 2003 2004 Forecast (Aug)
Mill
ion
sC
ara
ts
DBCM Debswana Namdeb Williamson Diamonds Limited

Copyright De Beers 2004
…together with more waste tons mined...
SOUTH AFRICAN, DEBSWANA & NAMDEB OPERATIONS - WASTE TONS MINED
51.0 52.260.9
83.9
54.260.4
62.1
66.425.5
31.5
33.6
24.4
-
-
-
1.0
-
20
40
60
80
100
120
140
160
180
2001 2002 2003 2004 Forecast (Aug)
Mill
ion
sW
aste
To
ns M
ined
DBCM Debswana Namdeb Williamson Diamonds Limited

Copyright De Beers 2004
…resulting in increased mining costs
SOUTH AFRICAN, DEBSWANA & NAMDEB OPERATIONS - WASTE TONS MINED vs US$ CASH COST PER TON
$7.53
$11.56
$3.25$4.53
-
20,000,000
40,000,000
60,000,000
80,000,000
100,000,000
120,000,000
140,000,000
160,000,000
180,000,000
2001 2002 2003 2004 Forecast (Aug)
Was
te T
on
s M
ined
-
2
4
6
8
10
12
14
16
US
$ ca
sh c
ost
per
To
n T
reat
ed
DBCM Debswana Namdeb US$ cash cost per ton treated US$ cash cost per mined
Copyright De Beers 2004
Finance focus
• Risk management, governance
• Cost of capital
• Cash flows and future capital funding
Copyright De Beers 2004
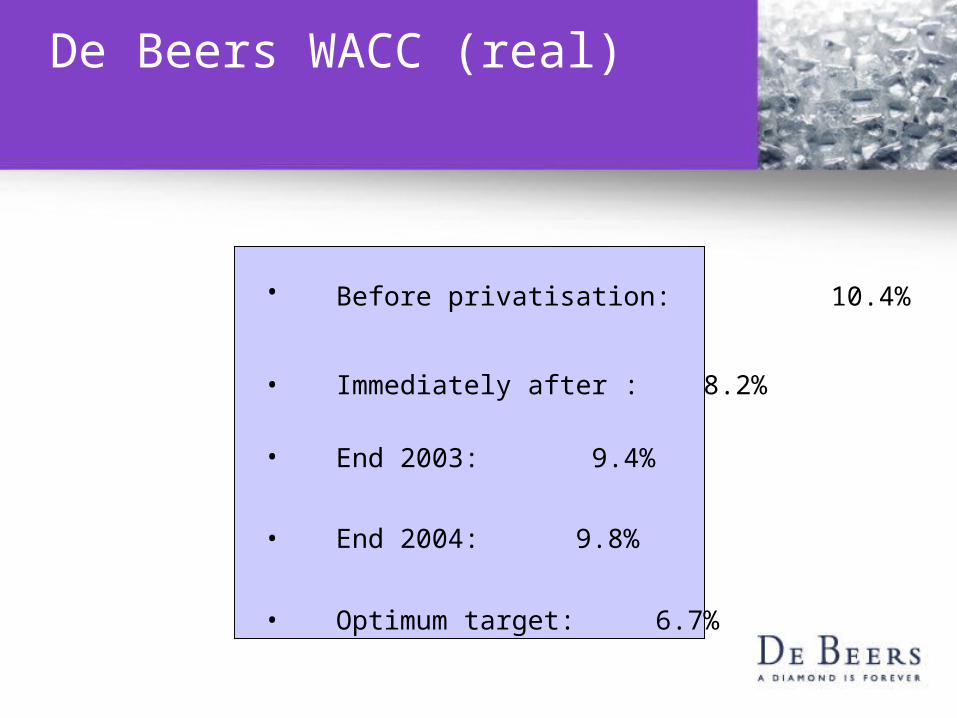
De Beers WACC (real)
• Before privatisation: 10.4%
• Immediately after : 8.2%
• End 2003: 9.4%
• End 2004: 9.8%
• Optimum target: 6.7%

Copyright De Beers 2004
Finance focus
• Risk management, governance
• Cost of capital
• Cash flows and future capital funding
Copyright De Beers 2004
De Beers Sales and Marketing
Gareth Penny
Managing Director
Diamond Trading Company
Copyright De Beers 2004
De Beers’ 1999 Strategic Plan
Driving demand
Supplier of Choice
De Beers’ Brand
Effective Organisation

Copyright De Beers 2004
Driving Demand
% Growth in World Nominal DJ Sales (CAGR)
94-98 99-03
-0.2
3.6
-1.0
0.0
1.0
2.0
3.0
4.0%

Copyright De Beers 2004
The rate of growth in World diamond jewellery sales is
increasing
(% growth US$ PWP)
% change
3%
6%
8%
0%
10%
2002 2003 H1 2004

Copyright De Beers 2004
USA
Italy
Germany
France
UK
Japan
Taiwan
Thailand
China
Gulf
India
Turkey
WORLD
LC Retail Sales Growth Est. H1 2004
Estimated H1 world retail markets up
+5.5% in LC and +8% in PWP
+8.0% PWP
19
12
7
6
5
17
1
8
6
-4
7
5.5
-3
2.5
Copyright De Beers 2004
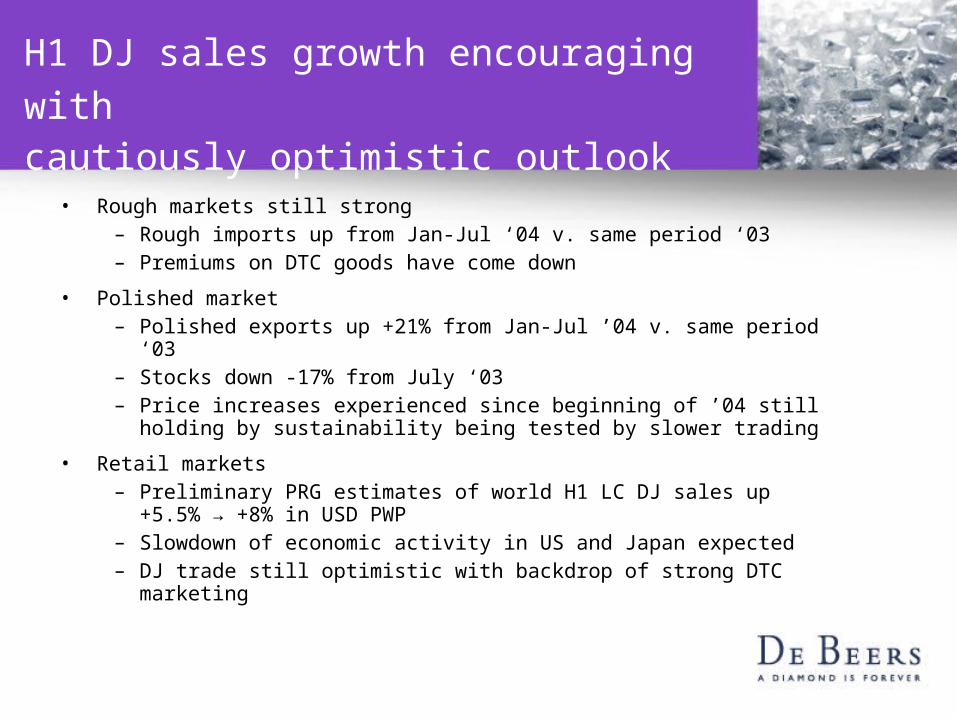
H1 DJ sales growth encouraging with cautiously optimistic outlook
• Rough markets still strong– Rough imports up from Jan-Jul ‘04 v. same period ‘03– Premiums on DTC goods have come down
• Polished market – Polished exports up +21% from Jan-Jul ’04 v. same period ‘03– Stocks down -17% from July ‘03– Price increases experienced since beginning of ’04 still holding
by sustainability being tested by slower trading
• Retail markets– Preliminary PRG estimates of world H1 LC DJ sales up +5.5%
→ +8% in USD PWP– Slowdown of economic activity in US and Japan expected – DJ trade still optimistic with backdrop of strong DTC marketing

Copyright De Beers 2004
2004 New Initiatives
Japan India ChinaUSA
Copyright De Beers 2004
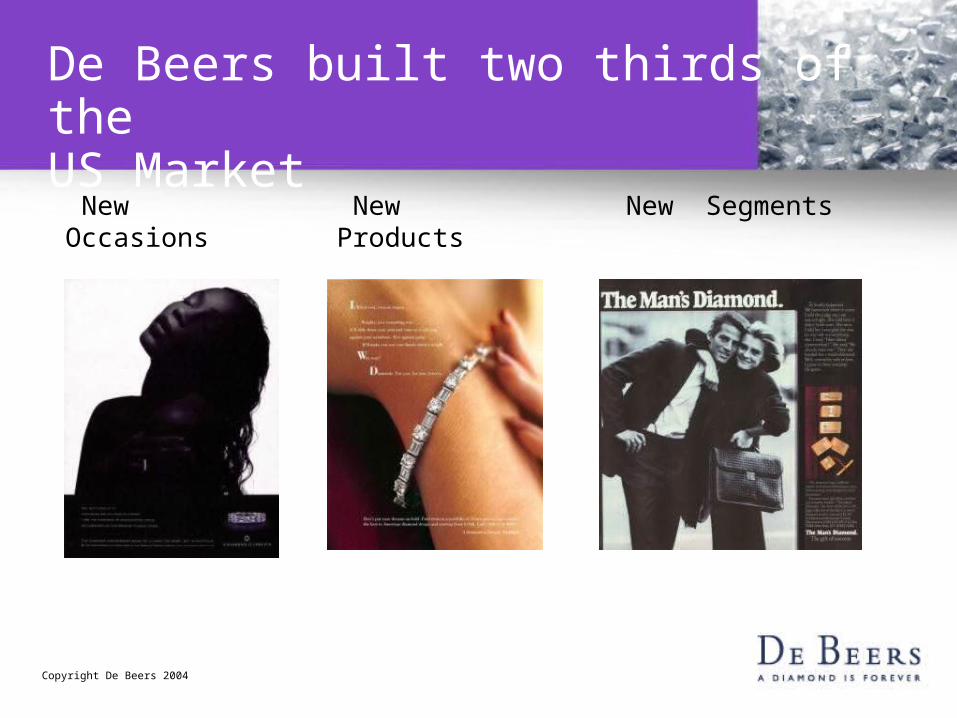
De Beers built two thirds of the US Market
New Occasions
New Segments New Products
Copyright De Beers 2004

Copyright De Beers 2004
Driving Incremental Sales
USA: Three Stone Jewellery SalesRetail Sales
0
500
1000
1500
2000
2500
3000
3500
1999 2000 2001 2002 2003
$m

Copyright De Beers 2004
Right Hand Ring advertising is a huge hit in 2004

Copyright De Beers 2004
2004 New Initiatives
Japan India ChinaUSA
Copyright De Beers 2004
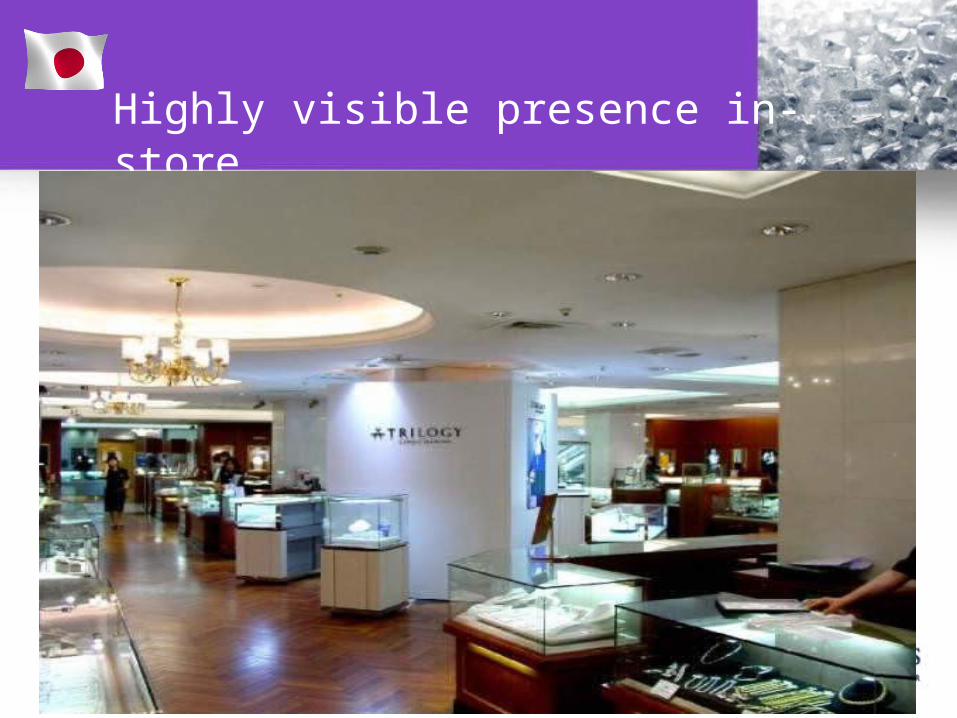
Highly visible presence in-store

Copyright De Beers 2004
Value Share and Growth Trend (12mmt)
3-stone Diamond Jewellery growing rapidly
Source : DDB
3.4 3.5 3.5 3.5 3.5 3.3 3.4 3.4 3.4 3.5 3.4 3.3 3.4 3.4 3.5 3.5 3.6 3.7 3.8 3.8 3.9 4 4.3 4.7 5 5.2 5.5 5.9
-20
-10
0
10
20
30
40
50
60
70
80
Jan-02
Feb-02
Mar-02
Apr-02
May-02
Jun-02
Jul-02
Aug-02
Sep-02
Oct-02
Nov-02
Dec-02
Jan-03
Feb-03
Mar-03
Apr-03
May-03
Jun-03
Jul-03
Aug-03
Sep-03
Oct-03
Nov-03
Dec-03
Jan-04
Feb-04
Mar-04
Apr-04
(%)
% share (3 stone) Total DJ 3 stone

Copyright De Beers 2004
2004 New Initiatives
Japan India ChinaUSA

Copyright De Beers 2004
• Nakshatra (Constellation) revitalised floral jewellery
• Launched October 2000
• Sales over $100m in 3 years. No. 1 brand in India
• Awarded status
Nakshatra Flagship

Copyright De Beers 2004
Aishwarya Rai – Brand ambassadress

Copyright De Beers 2004
2004 New Initiatives
Japan India ChinaUSA

Copyright De Beers 2004
DLJ acquisition amongst all recently married women
33%
13%
54%
43%
21%
84%
66%73%
Shanghai Beijing Guangzhou
1997
2000
2002
The DWR cultural imperative has
been quickly adopted in
China’s major cities
Source: China DWR 1997; China DCJ 2000, China DCJ 2002

Copyright De Beers 2004
1999 Strategic Plan
Driving demand
Supplier of Choice
De Beers’ Brand
Effective Organisation

Copyright De Beers 2004
StrongConsumerCampaign
Most Major
Retailers
ThreeMajor
Manufacturers
Driving demand through efficient Channels for Trilogy
DTC and Six Clients

Copyright De Beers 2004
Supplier of Choice

Copyright De Beers 2004
What Has Been Achieved….
• Commodity focus • Consumer dreams and needs focused
Pre SOC
PostSOC
• Little product differentiation • Product differentiation
• Low investment in marketing • Higher investment in marketing
• Few brands • Some recognised brands
• Luxury goods beating us • Diamonds closing the gap
• Few proprietary channels • Many proprietary channels
• Price driven • Added value driven
• Unhealthy declining industry • Healthy growth driven industry
• High stocks poor business • Low stocks good business

Copyright De Beers 2004
Major Competitors
• Luxury travel
• Luxury watches
• Hi-Tech equipment
• Luxury leather goods
• Luxury fashion

Copyright De Beers 2004
Areas of focus: Conflict Diamonds

Copyright De Beers 2004
Area of focus : Synthetics!
Firms currently producing synthetics:
•Apollo
•Gemesis

Copyright De Beers 2004
Current workstreams
• Enhance Consumer Confidence• Trade education• Diamond promotion• Detection technology• Promoting Disclosure best
practice• Vigilance• Maintaining perspective
Copyright De Beers 2004
Our Strategic Objectives
We will be focussed on:
1. Driving consumer demand2. Maintaining consumer confidence3. “Supplier of Choice” 4. “Purchaser of Choice” 5. The skills and talents of our employees6. Providing exceptional value to our
shareholders

Copyright De Beers 2004
Gary Ralfe
Managing Director
De Beers

Copyright De Beers 2004
Mining and ExplorationHistoric Performance
DE BEERS GROUPTotal Diamond production (1995 - 2003)
-
5,000
10,000
15,000
20,000
25,000
30,000
35,000
40,000
45,000
50,000
1995 1996 1997 1998 1999 2000 2001 2002 2003
Dia
mo
nd
s R
ec
ov
ere
d (
Ca
rats
00
0's
)
CAGR 7%
+ 9%+9%
Copyright De Beers 2004
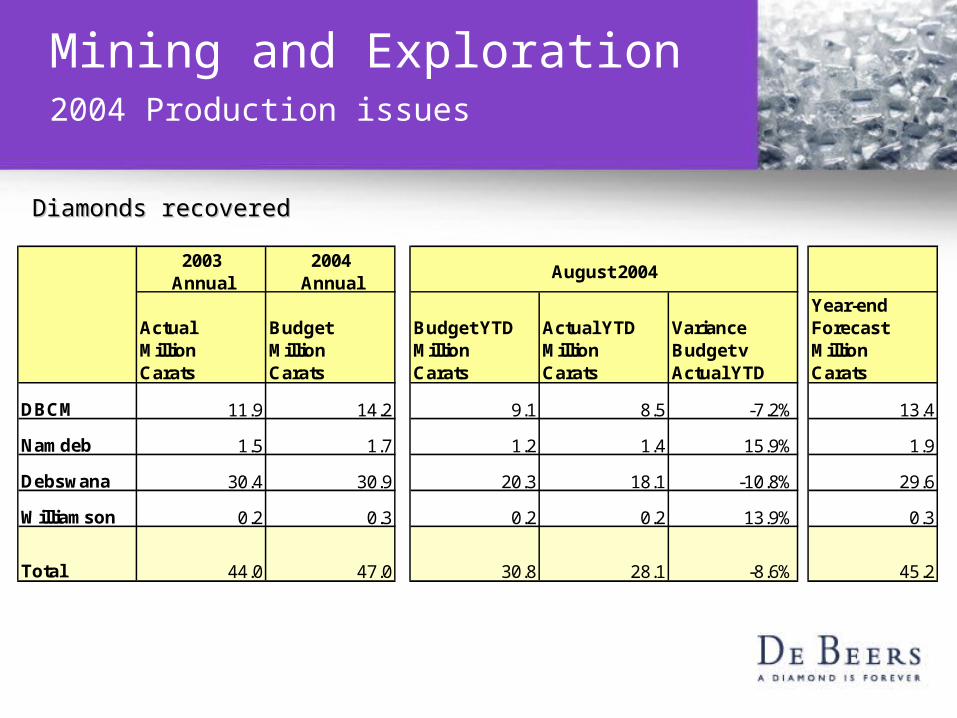
Mining and Exploration2004 Production issues
Diamonds recoveredDiamonds recovered
2003Annual
2004Annual
August 2004
ActualMillionCarats
BudgetMillionCarats
Budget YTDMillionCarats
Actual YTDMillionCarats
VarianceBudget vActual YTD
Year-endForecastMillion Carats
DBCM 11.9 14.2 9.1 8.5 -7.2% 13.4
Namdeb 1.5 1.7 1.2 1.4 15.9% 1.9
Debswana 30.4 30.9 20.3 18.1 -10.8% 29.6
Williamson 0.2 0.3 0.2 0.2 13.9% 0.3
Total 44.0 47.0 30.8 28.1 -8.6% 45.2

Copyright De Beers 2004
Continuing to Drive Supply Beyond 2004 - Production Forecast
Supply Growth 2004 - 2009
42
44
46
48
50
52
54
Car
ats
reco
vere
d -
Mil
lio
n
In the project pipeline
Projects under review
Base Case
2004 2005 2006 2007 2008 2009
Copyright De Beers 2004
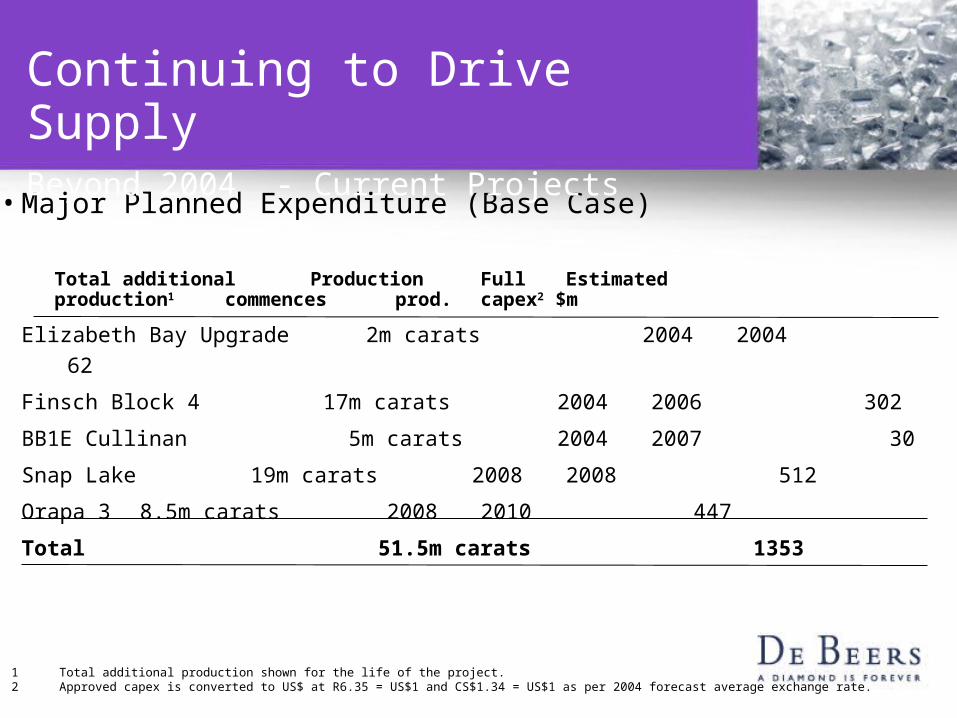
• Major Planned Expenditure (Base Case)
Total additional Production Full Estimatedproduction1 commences prod. capex2 $m
Elizabeth Bay Upgrade 2m carats 2004 2004 62
Finsch Block 4 17m carats 2004 2006 302
BB1E Cullinan 5m carats 2004 2007 30
Snap Lake 19m carats 2008 2008 512
Orapa 3 8.5m carats 2008 2010 447
Total 51.5m carats 1353
1 Total additional production shown for the life of the project. 2 Approved capex is converted to US$ at R6.35 = US$1 and CS$1.34 = US$1 as per 2004 forecast average exchange rate.
Continuing to Drive SupplyBeyond 2004 - Current Projects

Copyright De Beers 2004
Continuing to Drive SupplyBeyond 2004 - Current Projects
• Projects under review:
Total additional Production Full Estimated production1 commences prod. capex2 $m
Finsch Plant Upgrade 2m carats 2006 2007 90Victor 6m carats 2008 2008 625C-Cut Cullinan 115m carats 2009 2012-14 1291Finsch Block 5 16m carats 2009 2010 425Total 139m carats 2431
1 Total additional production shown for the life of the project. 2 Approved capex is converted to US$ at R6.35 = US$1 and CS$1.34 = US$1 as per 2004 forecast average exchange rate.

Copyright De Beers 2004
Continuing to Drive SupplyIn the project pipeline
– South Africa
• Voorspoed (production from 2007)
• Venetia– Underground (2015)
– Satellite pipes
– Botswana: multiple projects at existing mines
– Canada
• Gahcho Kué (production from 2012)

Copyright De Beers 2004
Continuing to Drive SupplyAdvanced Exploration Projects
Canadao Attawapiskat Satellites
o Forte a la Corne JV
o Knife Lake JV
o Hardy Lake JV
o Rockinghorse JV
Russia o Grib
Botswanao Jwaneng DK7
o Orapa Satellites
Guinea, Gabon, Zimbabwe, South Africa, Brazil

Copyright De Beers 2004
Mining and ExplorationSupply side challenges
• Jwaneng Lease Renewal
• Rand strength - impact on marginal mines
• Working stock levels
• De Beers market share
• Alrosa contract

Copyright De Beers 2004
DBsa
Gary Ralfe
DBsa
Nicky Oppenheimer
DTC
Gareth Penny(MD Designate)
Debswana
Blackie Marole(MD Designate)
Namdeb
IngeZaamwani
DBCM
Jonathan Oppenheimer
(MD Designate)
Louis Nchindo
DBsa
Gary Ralfe
DBsa
Nicky Oppenheimer
DTC
Gareth Penny
Debswana
Marole(MD Designate)
Namdeb
IngeZaamwani
DBCM
Jonathan OppenheimerNchindo
De Beers Group Services
Gary Ralfe
Group CFO
Paddy Kell
Group HR Director
Craig Mudge
Group IT Director
Debbie Farnaby
Group General
Counsel
Glenn Turner
Group Mining/Tech.
Services Director
Gavin Beevers
Group CFD
Ollie Oliveira
Group CFOPaddy Kell
Group HR Director
Craig Mudge
Group IT Director
Debbie Farnaby
Group General Counsel
Glenn Turner
Group Mining & Exploration Director Gavin Beevers
Strategy & Business Development Director
Ollie Oliveira
External Affairs Director
Being recruited
New Organisation

Copyright De Beers 2004
External Relations
• USA– DoJ settlement
– Civil litigation
• Angola– Arbitration settlement
• Russia– Alrosa trade agreement
Copyright De Beers 2004
External Relations
• RSA
– Transformation and Black Economic Empowerment transaction
– Diamond Amendment Bill
• Botswana
– Jwaneng Lease Renewal
• Namibia
– Renewal of sales agreement

Copyright De Beers 2004
Adjacent Businesses
• Element 6
Sales H1 2004 up 20% compared to H1 2003 to $121m
Net earnings H1 2004 more than tripled compared to H1 2003 from $4.5m to $14.6m due to
efficiency improvements
• De Beers LV
Total sales 2004 YTD $10.5m (+4% > budget)
New Chief Executive and strengthened management team
US rollout planned for 2005
Both shareholders committed to long term investment of $400m ($80.5m invested to date by De
Beers)

Copyright De Beers 2004
Primary strategic levers
5. Producer proposition
6. Synthetics response
7. Organisation effectiveness
1. Demand growth
2. Profitable production growth
3. Creating value through the DTC
4. Cost and working capital efficiencies
Profitability Sustainability

Copyright De Beers 2004
Strategic Goal
Maintain the leadership position of the De Beers Group of Companies and deliver sustainable
returns on capital in line with this position.

Copyright De Beers 2004
Q & A SESSION