cornerstone insurance plc - nigerian stock … · cornerstone insurance plc consolidated annual...
TRANSCRIPT

CORNERSTONE INSURANCE PLC
CONSOLIDATED ANNUAL REPORT AND FINANCIAL STATEMENTS 31 DECEMBER 2014

CORNERSTONE INSURANCE PLC
Consolidated Annual Report and Financial Statements For the year ended 31 December 2014
Table of Contents
Corporate information 1
Directors’ report 3
Risk management declaration 7
Statement of Directors’ Responsibilities 8 Report of the Audit Committee 9
Independent Auditors’ Report 10
Company information and significant accounting policies 11
Consolidated and Separate Statement of Financial Position 38
Consolidated and Separate Statement of Profit or Loss and other Comprehensive Income 39
Statement of Changes in Equity 40
Life Business Revenue Account 42
General Business Revenue Account 43
Takaful General Business Revenue Account 44 Takaful Life Business Revenue Account 45 Consolidated Statement of Cash Flows 47
Notes to the Financial Statements 48
Risk Management 83
Statement of value added 112
Financial summary 114

CORNERSTONE INSURANCE PLC
Consolidated Annual Report and Financial Statements For the year ended 31 December 2014
1
CORPORATE INFORMATION BOARD OF DIRECTORS Mr. Adedotun Sulaiman GROUP CHAIRMAN Mr. Richard Ikiebe VICE CHAIRMAN Mr. Ganiyu Musa GROUP MANAGING DIRECTOR/CEO Dr. Okechukwu Enelamah Mr. Oladapo Egbeyemi Alhaji Hussaini Abdulrahman Mr. Peter Ameadaji(Alternate) Mr. Paul Kokoricha Mr. Dominic Ichaba Mrs. Ndidi Okonkwo Nwuneli, MFR (Appointed 24th April, 2014) Mr. Tokunbo Bello EXECUTIVE DIRECTOR COMPANY SECRETARY/LEGAL ADVISER PAC SOLICITORS 16 Kofo Abayomi Street,
Victoria Island, Lagos.
Tel: +234-805-056-9557, +234(01)7611191, +234(01) 2701121,+234(01)8980746 REGISTERED HEAD OFFICE: 21, Water Corporation Drive, Off Ligali Ayorinde Street, Victoria Island, Lagos Tel: 01-2806500 Website: www.cornerstone.com.ng Email: [email protected] LAGOS BRANCHES: 1) 136, Lewis Street, Lagos. Tel:01-2632863,2630722,2631832(Lagos Island Office) 2) 79, Allen Avenue (Samsung House) Ikeja, Lagos. Tel: 0802306981,01-8182984 3) Polysonic Mall (2nd Floor) 42/44, Warehouse Road, Apapa, Lagos. Tel: 08033911435,07028856589 4) 191, Herbert Macaulay Street, Yaba. OTHER BRANCHES 1) NM 20, Constitution Road, Kaduna Tel:07029234155
2) 67, Aboderin Layout, Oni & Sons Area, Ring Road, Ibadan Tel:02-8735649 3) 180, Aba Express Road, Port Harcourt Tel: 07029325494, 08056938454 4) Plot 487, Adetokunbo Ademola Str., Wuse II, Abuja Tel: 09-87766611,07028415545) Suite 7, No.5, Bank Road, Kano Tel:064-913241,064-925578 6) 57, Effurun / Sapele Road, Effurun-Warri, Delta State Tel:07029066313 7) 110, Muritala Muhammed Highway, Calabar Municipality, Calabar, Cross Rivers Sta087-845147,08056938454 8) Agbeloba Building. 56, Quarry Road, Abeokuta, Ogun State. Tel:01-7363042
9) 3, Sokoto Road, Sabo Oke, Ilorin, Kwara State. Tel: 080595581032

CORNERSTONE INSURANCE PLC
Consolidated Annual Report and Financial Statements For the year ended 31 December 2014
2
SALES OUTLET: Beside Coca Cola Depot, Gbongan Road, Oshogbo, Osun State. Tel:
02-7512395 REGISTRARS: Lighthouse Registrars Limited, 2/4 Davies Street Marina, Lagos BANKERS: Access Bank Plc First Bank of Nigeria Limited Standard Chartered Bank Limited Guaranty Trust Bank Plc Wema Bank Plc United Bank For Africa Plc Citi Bank Nigeria Limited Stanbic IBTC Bank Plc First City Monument Bank Plc AUDITORS: Akintola Williams Deloitte
Chartered Accountants 235, Ikorodu Road, Ilupeju, Lagos.

CORNERSTONE INSURANCE PLC
Consolidated Annual Report and Financial Statements For the year ended 31 December 2014
3
Directors’ Report The directors are pleased to present their annual report on the affairs of Cornerstone Insurance Plc (“the Company”) and its subsidiaries (together referred to as “the Group”), together with the audited group and separate financial statements and the auditor’s report for the year ended 31 December 2014. Legal form and principal activity The Company was incorporated on 26 July 1991 as a private limited liability company and converted to a public limited company on 17 June 1997. The Company’s principal activity continues to be the provision of risk underwriting and related financial services to its customers. Such services include provision of life and non-life insurance services for both corporate and individual customers. The Company has two wholly owned subsidiaries – Cornerstone Asset Management Limited and Cornerstone Leasing and Investment Limited. Cornerstone Asset Management Limited commenced operations in 1999 and provides tailor made solutions through trusteeship, funds and asset management, portfolio management and financial advisory services. Cornerstone Leasing and Investment Limited commenced operations on 1 July 2004 and provides convenient asset acquisition options to both corporate organizations and individuals. The Company prepares consolidated financial statements. The financial results of all the subsidiaries have been consolidated in these financial statements. Operating results: The following is a summary of the operating results: Group Group Company Company Group Company
2014 2013 2014 2013 YOY % YOY % N’000 N’000 N’000 N’000 Growth Growth
Gross premium written 5,211,966 5,313,223 5,211,966 5,313,223 (2%) (2%)
Gross premium income 5,187,098 4,622,737 5,187,098 4,622,737 12% 12%
Profit before taxation 1,037,690 870,207 1,390,165 940,615 20% 48%
Taxation (91,208) (9,844) (107,819) (8,756) 819% 1131%
Profit after taxation 946,482 860,363 1,282,346 931,859 11% 38%

CORNERSTONE INSURANCE PLC
Consolidated Annual Report and Financial Statements For the year ended 31 December 2014
4
Directors’ shareholding: The directors of the Company who held office during the year together with their direct and indirect interest in the issued share capital of the Company as recorded in the register of directors shareholding and as notified by the directors for purposes of sections 275 and 276 of the Companies and Allied Matters Act and the listing requirements of the Nigeria Stock Exchange are as follows:
Number of Ordinary shares of 50 kobo each
Interest 31-Dec-14 31-Dec-13
Units Units
Adedotun Sulaiman – Chairman* Direct 2,016,214 2,016,214Peter Ameadaji – Alternate Director Direct 6,171,427 6,171,427Hussani Abdulrahaman Direct N/A N/ARahman Brothers Limited Indirect 70,378,617 70,378,617Ikiebe, O. Richard Direct 31,667,679 31,667,679Coltross Nig Ltd Indirect 13,636,300 13,636,300Raitas Limited Indirect 514,285 514,285Ichaba Dominic Direct 1,288,000 1,288,000Tonetfields Limited Indirect 1,000,000 1,000,000Egbeyemi Oladapo Direct 62,789,449 62,789,449Ladybird Investment Limited Indirect 28,600,649 28,600,649Worthwhile Ventures Limited 12,289,919Okechukwu Enelemah* N/A N/APaul Kokoricha* N/A N/ATokunbo Bello N/A N/AChristopher Kolade N/A N/AGaniyu Musa N/A N/A * These directors represent the interest of Capasure Nigeria Limited on the Board of the Company. Directors’ interest in contracts In accordance with section 277 of the Companies and Allied Matters Act of Nigeria, none of the directors have notified the Company of any declarable interests in contracts with the Company.

CORNERSTONE INSURANCE PLC
Consolidated Annual Report and Financial Statements For the year ended 31 December 2014
5
Analysis of shareholding The analysis of the distribution of the shares of the Company at the end of the financial year was as follows:
2014 Share range No of % of No of % of
Shareholders shareholders holdings holdings
1 - 500 968 3.52 260,241 0.00 501 - 1,000 1,176 4.28 1,079,151 0.01
1,001 - 5,000 7,761 28.25 28,093,869 0.32 5,001 - 10,000 5,401 19.66 46,629,040 0.55
10,001 - 20,000 3,941 14.35 64,587,168 0.73 20,001 - 50,000 4,104 14.94 146,817,137 1.66 50,001 - 100,000 2,129 7.75 173,878,982 1.97
100,001 - 500,000 1,538 5.60 343,154,692 3.89 500,001 - 1,000,000 225 0.82 181,831,037 2.06
1,000,001 and above 226 1.82 8,820,010,362 88.82 Total 28,792 100 8,820,065,764 100 Substantial interest in shares According to the register of members as at 31 December 2014, no shareholder held more than 10% of the issued share capital, except for Capasure Nigeria Limited which held 51% (2013: 51%) of the issued share capital of the Company. The free float of shares as at the year ended 2014 stands at 46.4%. Property and equipment Information relating to changes in property and equipment is given in Note 14 to the financial statements. Donations and charitable gifts The Group identifies with the aspirations of the community as well as the environment within which it operates and made charitable donations to the under-listed person amounting to N110,000 in 2014 (2013:N100,000.00) as follows: Person N Makinwa Abgede - Financial assistance for kidney transplant 100,000.00Christian Owoseni- Corporate donation 10,000.00
110,000.00 Human resources Employment of disabled persons The Group operates a non-discriminatory policy in the consideration of applications for employment, including those received from disabled persons. The Group’s policy is that the most qualified and experienced persons are recruited for appropriate job levels irrespective of an applicant’s state of origin, ethnicity, religion or physical condition. In the event of any employee becoming disabled in the course of employment, the Group is in a position to arrange appropriate training to ensure the continuous employment of such a person without subjecting him/her to any disadvantage in his/ her career development. As at 31 December 2014, the Group had no disabled persons in its employment.

CORNERSTONE INSURANCE PLC
Consolidated Annual Report and Financial Statements For the year ended 31 December 2014
6
Health, safety and welfare of employees The Group maintains business premises designed with a view to guaranteeing the safety and healthy living conditions of its employees and customers alike. Health, safety and fire drills are regularly organised to keep employees alert at all times. Employees are adequately insured against occupational hazards. In addition, the Group provides medical facilities to its employees and their immediate families at its expense. Employee involvement and training The Group encourages participation of employees in arriving at decisions in respect of matters affecting their well-being. Towards this end, the Group provides opportunities for employees to deliberate on issues affecting the Group and employees’ interest, with a view to making inputs to decisions thereon. The Group places a high premium on the development of its manpower. Consequently, the Group sponsored its employees for various training courses both in Nigeria and abroad in the year under review. Events after the reporting date There were no post balance sheet events after the reporting date which could have a material effect on the state of affairs of the Company as at 31 December 2014 and the profit for the year ended on that date that have not been adequately provided for or disclosed in the financial statements. Auditors Akintola Williams Deloitte has indicated their willingness to continue in office as auditors in accordance with Section 357(2) of the Companies and Allied Matters Act of Nigeria. BY ORDER OF THE BOARD Ifeoma Onubogu Company Secretary (PAC Solicitors) FRC/2014/NBA/0000006266 21, Water Corporation Drive Off Ligali Ayorinde Victoria - Island Lagos, Nigeria 27 February, 2015

CORNERSTONE INSURANCE PLC
Consolidated Annual Report and Financial Statements For the year ended 31 December 2014
7
Risk Management Declaration
We, the Directors on behalf of Cornerstone Insurance Plc. hereby endorse to the best of our knowledge and believe, having made appropriate enquiries that: a. The Company has instituted an operational structure aimed at adhering with National Insurance
Commission’s (NAICOM’s) guidelines in relation to establishing a risk management framework for Insurers and Reinsurers in Nigeria;
b. The Board is satisfied with the efficacy of the methods surrounding the production of financial information of the Company.
c. The Enterprise Risk Management and Internal Control structure functions are embedded in the company operational framework and are functioning effectively.
________________ _______________ Director Director

CORNERSTONE INSURANCE PLC
Consolidated Annual Report and Financial Statements For the year ended 31 December 2014
8
Statement of Directors’ Responsibilities For the preparation and approval of the Financial Statements The Directors of Cornerstone Insurance Plc are responsible for the preparation of the consolidated and separate financial statements that give a true and fair view of the financial position of the Group and Company as at 31 December 2014, and the results of its operations, statements of cash flows and changes in equity for the year ended, in compliance with International Financial Reporting Standards ("IFRS") and in the manner required by the Companies and Allied Matters Act of Nigeria, the Insurance Act CAP I17 LFN 2004 and the Financial Reporting Council of Nigeria Act. In preparing the consolidated and separate financial statements, the Directors are responsible for: • properly selecting and applying accounting policies; • presenting information, including accounting policies, in a manner that provides relevant, reliable,
comparable and understandable information; • providing additional disclosures when compliance with the specific requirements in IFRSs are insufficient
to enable users to understand the impact of particular transactions, other events and conditions on the Group and Company's financial position and financial performance; and
• making an assessment of the Group's ability to continue as a going concern. The Directors are responsible for: • designing, implementing and maintaining an effective and sound system of internal controls throughout
the Group and Company; • maintaining adequate accounting records that are sufficient to show and explain the Group's and
company's transactions and disclose with reasonable accuracy at any time the financial position of the Group and Company, and which enable them to ensure that the financial statements of the Group and Company comply with IFRS;
• maintaining statutory accounting records in compliance with the legislation of Nigeria and IFRS; • taking such steps as are reasonably available to them to safeguard the assets of the Group and
Company; and • preventing and detecting fraud and other irregularities. Going Concern: The Directors have made an assessment of the Group’s and Company’s ability to continue as a going concern and have no reason to believe the Group and Company will not remain a going concern in the year ahead. The consolidated financial statements of the Group and Company for the year ended 31 December 2014 were approved by the board of directors on 27th February 2015. On behalf of the Directors of the Group Mr. Adedotun Sulaiman Ganiyu Musa Emmanuel Otitolaiye Chairman Group Managing Director Head, Finance FRC/2013/ICAN/00000002885 FRC/2013/ICAN/0000003110 FRC/2014/ICAN/00000008524

CORNERSTONE INSURANCE PLC
Consolidated Annual Report and Financial Statements For the year ended 31 December 2014
9
Report of the Audit Committee To the Members of Cornerstone Insurance Plc In accordance with the provisions of Section 359(6) of the Companies and Allied Matters Act of Nigeria CAP C20 LFN 2004, the members of the Audit Committee of Cornerstone Insurance Plc hereby report as follows: • We have exercised our statutory functions under Section 359 (6) of the Companies and Allied Matters Act
of Nigeria and acknowledge the co-operation of management and staff in the conduct of these responsibilities.
• We are of the opinion that the accounting and reporting policies of the Group are in accordance with legal
requirements and agreed ethical practices and that the scope and planning of both the external and internal audits for the year ended 31 December 2014 were satisfactory and reinforce the Group’s internal control systems.
• We have deliberated with the external auditors, who have confirmed that necessary cooperation was
received from Management in the course of their statutory audit and we are satisfied with management’s responses thereon and with the effectiveness of the Group’s system of accounting and internal control.
Mr. Adeyemo Adejumo Chairman, Audit Committee FRC/2013/CIIN/00000003825 26 February, 2015
Members of the Audit Committee are:
1 Mr. Adeyemo Adejumo - Chairman 2 Mr. Eke Chibuzor Emmanuel Member - Shareholders representative 3 Mr. Lazarus Nnadozie Onwuka Member - Shareholders representative 4 Mr. Paul Kokoricha Member - Non Executive Director 5 Mr. Peter Ameadaji Member - Non Executive Director 6 Mrs.Ndidi Okonkwo Nwunelli(MFR) Member - Independent Non-Executive Director

CORNERSTONE INSURANCE PLC
Consolidated Annual Report and Financial Statements For the year ended 31 December 2014
10
REPORT OF THE INDEPENDENT AUDITORS TO THE MEMBERS OF
CORNERSTONE INSURANCE PLC Report on the Financial Statements We have audited the accompanying consolidated and separate financial statements of CORNERSTONE INSURANCE PLC (the company) and its subsidiaries (together referred to as “the Group”) which comprise the consolidated and separate statement of financial position as at 31 December 2014, the consolidated and separate statement of profit or loss and other comprehensive income, consolidated and separate statement of changes in equity, statement of cash flows for the year then ended, a summary of significant accounting policies and other explanatory information. Directors’ Responsibility for the Financial Statements The Directors are responsible for the preparation and fair presentation of these consolidated and separate financial statements in accordance with the International Financial Reporting Standards, the Companies and Allied Matters Act CAP C20 LFN 2004, the Insurance Act CAP I17 LFN 2004, the Financial Reporting Council of Nigeria Act 2011,and for such internal control as the Directors determine is necessary to enable the preparation of consolidated and separate financial statements that are free from material misstatement, whether due to fraud or error. Auditors’ Responsibility Our responsibility is to express an opinion on these consolidated and separate financial statements based on our audit. We conducted our audit in accordance with International Standards on Auditing. Those standards require that we comply with ethical requirements and plan and perform the audit to obtain reasonable assurance about whether the financial statements are free from material misstatement. An audit involves performing procedures to obtain audit evidence about the amounts and disclosures in the financial statements. The procedures selected depend on the auditors’ judgment, including the assessment of the risks of material misstatement of the financial statements, whether due to fraud or error. In making those risk assessments, the auditors consider internal controls relevant to the entity’s preparation and fair presentation of the financial statements in order to design audit procedures that are appropriate in the circumstances, but not for the purpose of expressing an opinion on the effectiveness of the entity’s internal control. An audit also includes evaluating the appropriateness of accounting policies used and the reasonableness of accounting estimates made by Directors, as well as evaluating the overall presentation of the financial statements. We believe that the audit evidence we have obtained is sufficient and appropriate to provide a basis for our audit opinion. Opinion In our opinion, the consolidated and separate financial statements give a true and fair view of the financial position of CORNERSTONE INSURANCE PLC and its subsidiaries as at 31 December 2014 and of its financial performance and cash flows for the year then ended in accordance with the International Financial Reporting Standards, the Companies and Allied Matters Act CAP C20 LFN 2004, the Insurance Act CAP I17 LFN 2004 and the Financial Reporting Council of Nigeria Act, 2011. Other reporting responsibilities In accordance with the Sixth Schedule of Companies and Allied Matters Act CAP C20 LFN 2004 we expressly state that:
i) We have obtained all the information and explanation which to the best of our knowledge and belief were necessary
for the purpose of our audit. ii) The Group has kept proper books of account, so far as appears from our examination of those books. iii) The consolidated and separate statement of financial position and its consolidated and separate statements of profit
or loss and other comprehensive income are in agreement with the books of account and returns
Contravention The Company contravened certain sections of NAICOM circulars and guidelines during the year, the particulars thereof and penalty paid are as disclosed in Note 43 to the financial statements. Jelili Adebisi, FCA - FRC/2013/ICAN/000000004247 For: Akintola Williams Deloitte Chartered Accountants Lagos, Nigeria April 2015
CORNERSTONE INSURANCE PLC
Consolidated Annual Report and Financial Statements For the year ended 31 December 2014
11
Group information and significant accounting policies 1.1 Reporting entity Cornerstone Insurance Plc (the Company) was incorporated on 26th July 1991 as a private limited
liability company and converted to a public limited liability company on 17 June 1997. The Company's principal activity continues to be the provision of risk underwriting and related financial services to its customers. Such service includes the provision of Life and Non-life insurance services for both corporate and individual customers.
The Company has two wholly owned subsidiaries - Cornerstone Asset Management Limited and Cornerstone Leasing and Investment Limited. Cornerstone Asset Management Limited commenced operation in 1999 and provides tailor made solutions through trusteeship, funds and assets management, portfolio management and financial advisory services. Cornerstone Leasing and Investment Limited commenced operations on 1 July 2004 and provides convenient asset acquisition options to both corporate organisations and individuals.
The financial statements of Cornerstone Insurance Plc have been prepared on a going concern basis. The directors of the group have a reasonable expectation that the group and the company have adequate resources to continue in operational existence for the foreseeable future. The consolidated annual financial statements for the year ended 31 December 2014 comprises the parent company and its subsidiaries.
1.2 Principal activities Cornerstone Insurance Plc and its subsidiaries (the Group) are engaged in various business lines
ranging from property-casualty insurance, life/health insurance, asset management and leasing. The Group’s products are classified at inception, for accounting purposes, as either Insurance
contracts or Investment contracts. A contract that is classified as insurance contract remains an insurance contract for the remainder of
its lifetime, even if the insurance risk reduces significantly during this period; unless all rights and obligations are extinguished or expire. Investment contracts can, however, be reclassified as insurance contracts after inception if insurance risk becomes significant.
1.3 Going concern These financial statements have been prepared on the going concern basis. The group has no
intention or need to reduce substantially the scope of its business operations. The management believes that the going concern assumption is appropriate for the group and company due to sufficient capital adequacy ratio and projected liquidity, based on historical experience that short-term obligations will be refinanced in the normal course of business. Liquidity ratio and continuous evaluation of current ratio of the group is carried out to ensure that there are no going concern threats to the operation of the group.
2 Application of new and revised International Financial Reporting Standards (IFRSs) 2.1 Amendments to IFRSs and the new Interpretation that is mandatorily effective for the current
year In the current year, the Group has applied a number of amendments to IFRSs and a new Interpretation
issued by the International Accounting Standards Board (IASB) that are mandatorily effective for an accounting period that begins on or after 1 January 2014.
Amendments to IFRS 10, IFRS 12 and IAS 27 Investment Entities The amendments to IFRS 10 define an investment entity and require a reporting entity that meets the
definition of an investment entity not to consolidate its subsidiaries but instead to measure its subsidiaries at fair value through profit or loss in its consolidated and separate financial statements.
To qualify as an investment entity, a reporting entity is required to:

CORNERSTONE INSURANCE PLC
Consolidated Annual Report and Financial Statements For the year ended 31 December 2014
12
Group information and significant accounting policies Amendments to IFRS 10, IFRS 12 and IAS 27 Investment Entities (Cont’d)
· Obtain funds from one or more investors for the purpose of providing them with investment management services,
· Commit to its investor(s) that its business purpose is to invest funds solely for returns from capital appreciation, investment income, or both; and
· Measure and evaluate performance of substantially all of its investments on a fair value basis. Consequential amendments have been made to IFRS 12 and IAS 27 to introduce new
disclosure requirements for investment entities. As the Group is not an investment entity (assessed based on the criteria set out in IFRS 10 as at
1 January 2014, the application of the amendments has had no impact on the disclosures or the amounts recognised in the financial statements.
2.1.1 Amendments to IAS 32 Offsetting Financial Assets and Financial Liabilities The amendments to IAS 32 clarify the requirements relating to the offset of financial assets and
financial liabilities. Specifically, the amendments clarify the meaning of ‘currently has a legally enforceable right of set-off’ and ‘simultaneous realisation and settlement’.
As the Group does not have any financial assets and financial liabilities that qualify for offset, the application of the amendments has had no impact on the disclosures or on the amounts recognised in the Group’s financial statements.
2.1.2 Amendments to IAS 36 Recoverable Amount Disclosures for Non-Financial Assets The amendments to IAS 36 remove the requirement to disclose the recoverable amount of a cash-
generating unit (CGU) to which goodwill or other intangible assets with indefinite useful lives had been allocated when there has been no impairment or reversal of impairment of the related CGU. Furthermore, the amendments introduce additional disclosure requirements applicable to when the recoverable amount of an asset or a CGU is measured at fair value less costs of disposal. These new disclosures include the fair value hierarchy, key assumptions and valuation techniques used which are in line with the disclosure required by IFRS 13 Fair Value Measurements.
The application of these amendments has had no material impact on the disclosures in the Group's financial statements.
2.1.3 Amendments to IAS 39 Novation of Derivatives and Continuation of Hedge Accounting The amendments to IAS 39 provide relief from the requirement to discontinue hedge accounting when
a derivative designated as a hedging instrument is novated under certain circumstances. The amendments also clarify that any change to the fair value of the derivative designated as a hedging instrument arising from the novation should be included in the assessment and measurement of hedge effectiveness.
The amendments require retrospectively. As the Group does not have any derivatives that are subject
to novation, the application of these amendments has had no impact on the disclosures or on the amounts recognised in the Group’s financial statements.
2.1.4 IFRIC 21 Levies The Company has applied IFRIC 21 Levies for the first time in the current year. IFRIC 21 addresses
the issue as to when to recognise a liability to pay a levy imposed by a government. The Interpretation defines a levy, and specifies that the obligating event that gives rise to the liability is the activity that triggers the payment of the levy, as identified by legislation. The Interpretation provides guidance on how different levy arrangements should be accounted for, in particular, it clarifies that neither economic compulsion nor the going concern basis of financial statements preparation implies that an entity has a present obligation to pay a levy that will be triggered by operating in a future period.
The impact of the application of this Interpretation has been included in the Statement of Profit or Loss under NAICOM levy.

CORNERSTONE INSURANCE PLC
Consolidated Annual Report and Financial Statements For the year ended 31 December 2014
13
Group information and significant accounting policies 2.2 New and revised IFRSs in issue but not yet effective The Group and Company has not applied the following new and revised IFRSs that have been issued
but are not yet effective: IFRS 9 Financial Instruments5 IFRS 15 Revenue from Contracts with Customers4 Amendments to IFRS 11 Accounting for Acquisitions of Interests in Joint Operations3 Amendments to IAS 16 and IAS 38 Clarification of Acceptable Methods of Depreciation and
Amortisation3 Amendments to IAS 16 and IAS 41 Agriculture: Bearer Plants3 Amendments to IAS 19 Defined Benefit Plans: Employee Contributions1 Amendments to IFRSs Annual Improvements to IFRSs 2010-2012 Cycle2 Amendments to IFRSs Annual Improvements to IFRSs 2011-2013 Cycle1 1. Effective for annual periods beginning on or after 1 July 2014, with earlier application permitted. 2. Effective for annual periods beginning on or after 1 July 2014, with limited exceptions. Earlier
application is permitted. 3. Effective for annual periods beginning on or after 1 January 2016, with earlier application permitted. 4. Effective for annual periods beginning on or after 1 January 2017, with earlier application permitted. 5. Effective for annual periods beginning on or after 1 January 2018, with earlier application permitted. IFRS 9 Financial Instruments IFRS 9 issued in November 2009 introduced new requirements for the classification and measurement
of financial assets. IFRS 9 was subsequently amended in October 2010 to include requirements for the classification and measurement of financial liabilities and for derecognition, and in November 2013 to include the new requirements for general hedge accounting. Another revised version of IFRS 9 was issued in July 2014 mainly to include
a) Impairment requirements for financial assets and b) limited amendments to the classification and measurement requirements by introducing a ‘fair
value through other comprehensive income’ (FVTOCI) measurement category for certain simple debt instruments.
Key requirements of IFRS 9: · All recognised financial assets that are within the scope of IAS 39 Financial Instruments: Recognition
and Measurement are required to be subsequently measured at amortised cost or fair value. Specifically, debt investments that are held within a business model whose objective is to collect the contractual cash flows, and that have contractual cash flows that are solely payments of principal and interest on the principal outstanding are generally measured at amortised cost at the end of subsequent accounting periods. Debt instruments that are held within a business model whose objective is achieved both by collecting contractual cash flows and selling financial assets, and that have contractual terms of the financial asset give rise on specified dates to cash flows that are solely payments of principal and interest on the principal amount outstanding, are measured at FVTOCI. All other debt investments and equity investments are measured at their fair value at the end of subsequent accounting periods. In addition, under IFRS 9, entities may make an irrevocable election to present subsequent changes in the fair value of an equity investment (that is not held for trading) in other comprehensive income, with only dividend income generally recognised in profit or loss. with regard to the measurement of financial liabilities designated as at fair value through profit or loss, IFRS 9 requires that the amount of change in the fair value of the financial liability that is attributable to changes in the credit risk of that liability is presented in other comprehensive income, unless the recognition of the effects of changes in the liability's credit risk in other comprehensive income would create or enlarge an accounting mismatch in profit or loss. Changes in fair value attributable to a financial liability's credit risk are not subsequently reclassified to profit or loss. Under IAS 39, the entire amount of the change in the fair value of the financial liability designated as fair value through profit or loss is presented in profit or loss.

CORNERSTONE INSURANCE PLC
Consolidated Annual Report and Financial Statements For the year ended 31 December 2014
14
Group information and significant accounting policies Key requirements of IFRS 9 (Cont’d) · In relation to the impairment of financial assets, IFRS 9 requires an expected credit loss model, as
opposed to an incurred credit loss model under IAS 39. The expected credit loss model requires an entity to account for expected credit losses and changes in those expected credit losses at each reporting date to reflect changes in credit risk since initial recognition. In other words, it is no longer necessary for a credit event to have occurred before credit losses are recognised.
· The new general hedge accounting requirements retain the three types of hedge accounting
mechanisms currently available in IAS 39. Under IFRS 9, greater flexibility has been introduced to the types of transactions eligible for hedge accounting, specifically broadening the types of instruments that qualify for hedging instruments and the types of risk components of non-financial items that are eligible for hedge accounting. In addition, the effectiveness test has been overhauled and replaced with the principle of an ‘economic relationship’. Retrospective assessment of hedge effectiveness is also no longer required. Enhanced disclosure requirements about an entity’s risk management activities have also been introduced.
The directors of the Group anticipate that the application of IFRS 9 in the future may have a material
impact on amounts reported in respect of the Group's financial assets and financial liabilities. However, it is not practicable to provide a reasonable estimate of the effect of IFRS 9 until the Group undertakes a detailed review.
IFRS 15 Revenue from Contracts with Customers In May 2014, IFRS 15 was issued which establishes a single comprehensive model for entities to use
in accounting for revenue arising from contracts with customers. IFRS 15 will supersede the current revenue recognition guidance including IAS 18 Revenue, IAS 11 Construction Contracts and the related Interpretations when it becomes effective.
The core principle of IFRS 15 is that an entity should recognise revenue to depict the transfer of
promised goods or services to customers in an amount that reflects the consideration to which the entity expects to be entitled in exchange for those goods or services. Specifically, the Standard introduces a 5-step approach to revenue recognition:
· Step 1: Identify the contract(s) with a customer · Step 2: Identify the performance obligations in the contract · Step 3: Determine the transaction price · Step 4: Allocate the transaction price to the performance obligations in the contract · Step 5: Recognise revenue when (or as) the entity satisfies a performance obligation
Under IFRS 15, an entity recognises revenue when (or as) a performance obligation is satisfied, i.e.
when ‘control’ of the goods or services underlying the particular performance obligation is transferred to the customer. Far more prescriptive guidance has been added in IFRS 15 to deal with specific scenarios.
Furthermore, extensive disclosures are required by IFRS 15. The directors of the Company anticipate that the application of IFRS 15 in the future may have a
material impact on the amounts reported and disclosures made in the Group’s financial statements. However, it is not practicable to provide a reasonable estimate of the effect of IFRS 15 until the Group performs a detailed review.

CORNERSTONE INSURANCE PLC
Consolidated Annual Report and Financial Statements For the year ended 31 December 2014
15
Group information and significant accounting policies Amendments to IFRS 11 Accounting for Acquisitions of Interests in Joint Operations The amendments to IFRS 11 provide guidance on how to account for the acquisition of a joint
operation that constitutes a business as defined in IFRS 3 Business Combinations. Specifically, the amendments state that the relevant principles on accounting for business combinations in IFRS 3 and other standards (e.g. IAS 36 Impairment of Assets regarding impairment testing of a cash generating unit to which goodwill on acquisition of a joint operation has been allocated) should be applied.
The same requirements should be applied to the formation of a joint operation if and only if an existing
business is contributed to the joint operation by one of the parties that participate in the joint operation. A joint operator is also required to disclose the relevant information required by IFRS 3 and other
standards for business combinations. The amendments to IFRS 11 apply prospectively for annual periods beginning on or after 1 January
2016. The directors of the Company do not anticipate that the application of these amendments to IFRS 11 will have a material impact on the Group's financial statements.
Amendments to IAS 16 and IAS 38 Clarification of Acceptable Methods of Depreciation and
Amortisation The amendments to IAS 16 prohibit entities from using a revenue-based depreciation method for items
of property, plant and equipment. The amendments to IAS 38 introduce a rebuttable presumption that revenue is not an appropriate basis for amortisation of an intangible asset. This presumption can only be rebutted in the following two limited circumstances:
a) When the intangible asset is expressed as a measure of revenue; or b) When it can be demonstrated that revenue and consumption of the economic benefits of the
intangible asset are highly correlated. The amendments apply prospectively for annual periods beginning on or after 1 January 2016.
Currently, the Group uses the straight-line method for depreciation and amortisation for its property, plant and equipment, and intangible assets respectively. The directors of the Company believe that the straight-line method is the most appropriate method to reflect the consumption of economic benefits inherent in the respective assets and accordingly, the directors of the Company do not anticipate that the application of these amendments to IAS 16 and IAS 38 will have a material impact on the Group’s financial statements.
Amendments to IAS 16 and IAS 41 Agriculture: Bearer Plants
The amendments to IAS 16 and IAS 41 define a bearer plant and require biological assets that meet the definition of a bearer plant to be accounted for as property, plant and equipment in accordance with IAS 16, instead of IAS 41. The produce growing on bearer plants continues to be accounted for in accordance with IAS 41.
The directors of the Company do not anticipate that the application of these amendments to IAS 16 and IAS 41 will have a material impact on the Group and Company’s financial statements as the Company is not engaged in agricultural activities.
Amendments to IAS 19 Defined Benefit Plans: Employee Contributions
The amendments to IAS 19 clarify how an entity should account for contributions made by employees or third parties to defined benefit plans, based on whether those contributions are dependent on the number of years of service provided by the employee.
For contributions that are independent of the number of years of service, the entity may either recognise the contributions as a reduction in the service cost in the period in which the related service is rendered, or to attribute them to the employees’ periods of service using the projected unit credit method; whereas for contributions that are dependent on the number of years of service, the entity is required to attribute them to the employees’ periods of service.

CORNERSTONE INSURANCE PLC
Consolidated Annual Report and Financial Statements For the year ended 31 December 2014
16
Group information and significant accounting policies Amendments to IAS 19 Defined Benefit Plans: Employee Contributions (Cont’d) The directors of the Group and Company do not anticipate that the application of these amendments
to IAS 19 will have a significant impact on the Group’s financial statements. Annual Improvements to IFRSs 2010-2012 Cycle The Annual Improvements to IFRSs 2010-2012 Cycle include a number of amendments to various
IFRSs, which are summarised below. The amendments to IFRS 2 (i) change the definitions of ‘vesting condition’ and ‘market condition’; and
(ii) add definitions for ‘performance condition’ and ‘service condition’ which were previously included within the definition of ‘vesting condition’. The amendments to IFRS 2 are effective for share-based payment transactions for which the grant date is on or after 1 July 2014.
The amendments to IFRS 3 clarify that contingent consideration that is classified as an asset or a
liability should be measured at fair value at each reporting date, irrespective of whether the contingent consideration is a financial instrument within the scope of IFRS 9 or IAS 39 or a non-financial asset or liability. Changes in fair value (other than measurement period adjustments) should be recognised in profit or loss. The amendments to IFRS 3 are effective for business combinations for which the acquisition date is on or after 1 July 2014.
The amendments to IFRS 8 (i) require an entity to disclose the judgements made by management in
applying the aggregation criteria to operating segments, including a description of the operating segments aggregated and the economic indicators assessed in determining whether the operating segments have ‘similar economic characteristics’; and (ii) clarify that a reconciliation of the total of the reportable segments’ assets to the entity’s assets should only be provided if the segment assets are regularly provided to the chief operating decision-maker.
The amendments to the basis for conclusions of IFRS 13 clarify that the issue of IFRS 13 and
consequential amendments to IAS 39 and IFRS 9 did not remove the ability to measure short- term receivables and payables with no stated interest rate at their invoice amounts without discounting, if the effect of discounting is immaterial. As the amendments do not contain any effective date, they are considered to be immediately effective.
The amendments to IAS 16 and IAS 38 remove perceived inconsistencies in the accounting for
accumulated depreciation/amortisation when an item of property, plant and equipment or an intangible asset is revalued. The amended standards clarify that the gross carrying amount is adjusted in a manner consistent with the revaluation of the carrying amount of the asset and that accumulated depreciation/amortisation is the difference between the gross carrying amount and the carrying amount after taking into account accumulated impairment losses.
The amendments to IAS 24 clarify that a management entity providing key management personnel
services to a reporting entity is a related party of the reporting entity. Consequently, the reporting entity should disclose as related party transactions the amounts incurred for the service paid or payable to the management entity for the provision of key management personnel services. However, disclosure of the components of such compensation is not required.
The directors of the Company do not anticipate that the application of these amendments will have a
significant impact on the Group’s financial statements.

CORNERSTONE INSURANCE PLC
Consolidated Annual Report and Financial Statements For the year ended 31 December 2014
17
Group information and significant accounting policies Annual Improvements to IFRSs 2011-2013 Cycle The Annual Improvements to IFRSs 2011-2013 Cycle include a number of amendments to various
IFRSs, which are summarised below. The amendments to IFRS 3 clarify that the standard does not apply to the accounting for the formation
of all types of joint arrangement in the financial statements of the joint arrangement itself. The amendments to IFRS 13 clarify that the scope of the portfolio exception for measuring the fair
value of a Company of financial assets and financial liabilities on a net basis includes all contracts that are within the scope of, and accounted for in accordance with, IAS 39 or IFRS 9, even if those contracts do not meet the definitions of financial assets or financial liabilities within IAS 32.
The amendments to IAS 40 clarify that IAS 40 and IFRS 3 are not mutually exclusive and application
of both standards may be required. Consequently, an entity acquiring investment property must determine whether:
(a) The property meets the definition of investment property in terms of IAS 40; and (b) The transaction meets the definition of a business combination under IFRS 3.
The directors of the Company do not anticipate that the application of these amendments will have a
significant impact on the Company’s financial statements. 3 SIGNIFICANT ACCOUNTING POLICIES 3.1 Statement of compliance The consolidated and separate financial statements have been prepared in accordance with
International Financial Reporting Standards ("IFRS") issued by the International Accounting Standards Board (IASB) and adopted by the Financial Reporting Council of Nigeria for the financial year starting from 1 January, 2014.
The consolidated and separate financial statements comply with the requirement of the Companies
and Allied Matters Act CAP C20 LFN 2004, Insurance Act, CAP I17 LFN 2004, the Financial Reporting Council Act, 2011 and the Guidelines issued by the National Insurance Commission to the extent that they are not in conflict with the International Financial Reporting Standards (IFRS).
3.2 Basis of preparation The consolidated and separate financial statements have been prepared on the historical cost basis
except for certain properties and financial instruments that are measured at revalued amounts or fair values, as explained in the accounting policies below. Historical cost is generally based on the fair value of the consideration given in exchange transactions except for certain investments whose valuation was based on observable input from asset managers.
3.3 Reporting currency The consolidated and separate financial statements are presented in Nigeria Naira (=N=) and are
rounded to the nearest thousand (‘000) unless otherwise stated.

CORNERSTONE INSURANCE PLC
Consolidated Annual Report and Financial Statements For the year ended 31 December 2014
18
Group information and significant accounting policies 3.4 Basis of consolidation The consolidated and separate financial statements incorporate the financial statements of the
Company and its subsidiaries. IFRS 10 changes the definition of control such that an investor has control over an investee when a) it
has power over the investee, b) it is exposed, or has rights, to variable returns from its involvement with the investee and c) has the ability to use its power to affect its returns. All three of these criteria must be met for an investor to have control over an investee. Previously, control was defined as the power to govern the financial and operating policies of an entity so as to obtain benefits from its activities.
Income and expenses of subsidiaries acquired or disposed of during the year are included in the consolidated statement of comprehensive income from the effective date of acquisition and up to the effective date of disposal, as appropriate. Total comprehensive income of subsidiaries is attributed to the owners of the Company and to the non-controlling interests even if this results in the non-controlling interests having a deficit balance.
When necessary, adjustments are made to the financial statements of subsidiaries to bring their
accounting policies in line with the Group accounting policies. All intra-group transactions, balances, income and expenses are eliminated in full on consolidation. 3.5 Changes in the Group's ownership interest in existing subsidiaries Changes in the Group's ownership interests in subsidiaries that do not result in the Group losing
control over the subsidiaries are accounted for as equity transactions. The carrying amounts of the Group's interests and the non-controlling interests are adjusted to reflect the changes in their relative interests in the subsidiaries.
Any difference between the amount by which the non-controlling interests are adjusted and the fair
value of the consideration paid or received is recognized directly in equity and attributed to owners of the Company.
When the Group loses control of a subsidiary, a gain or loss is recognized in profit or loss and is
calculated as the difference between: (i) the aggregate of the fair value of the consideration received and the fair value of any retained interest and; (ii) the previous carrying amount of the assets (including goodwill), and liabilities of the subsidiary and any non-controlling interests.
When assets of the subsidiary are carried at revalued amounts or fair values and the related
cumulative gain or loss has been recognized in other comprehensive income and accumulated in equity, the amounts previously recognized in other comprehensive income and accumulated in equity are accounted for as if the Group had directly disposed of the relevant assets (i.e. reclassified to profit or loss or transferred directly to retained earnings as specified by applicable IFRSs). The fair value of any investment retained in the former subsidiary at the date when control is lost is regarded as the fair value on initial recognition for subsequent accounting under IAS 39 Financial Instruments: Recognition and Measurement, or when applicable, the cost on initial recognition of an investment in an associate or a jointly controlled entity.
3.6 Foreign currencies In preparing the financial statements of each individual group entity, transactions in currencies other
than the entity's functional currency (foreign currencies) are recognized at the rates of exchange prevailing at the dates of the transactions. At the end of each reporting period, monetary items denominated in foreign currencies are retranslated at the rates prevailing at that date. Non-monetary items carried at fair value that are denominated in foreign currencies are retranslated at the rates prevailing at the date when the fair value was determined.
Non-monetary items that are measured in terms of historical cost in a foreign currency are not translated.
CORNERSTONE INSURANCE PLC
Consolidated Annual Report and Financial Statements For the year ended 31 December 2014
19
Group information and significant accounting policies 3.6 Foreign currencies (Cont’d) Exchange differences on monetary items are recognized in profit or loss in the period in which they
arise except for:
* Exchange differences on foreign currency borrowings relating to assets under construction for future productive use, which are included in the cost of those assets when they are regarded as an adjustment to interest costs on those foreign currency borrowings;
* Exchange differences on transactions entered into in order to hedge certain foreign currency risks (below for hedging accounting policies); and
* Exchange differences on monetary items receivable from or payable to a foreign operation for which settlement is neither planned nor likely to occur (therefore forming part of the net investment in the foreign operation), which are recognized initially in other comprehensive income and reclassified from equity to profit or loss on repayment of the monetary items.
For the purposes of presenting consolidated financial statements, the assets and liabilities of the
Group's foreign operations are translated into currency units using exchange rates prevailing at the end of each reporting period. Income and expense items are translated at the average exchange rates for the period, unless exchange rates fluctuate significantly during that period, in which case the exchange rates at the dates of the transactions are used. Exchange differences arising, if any, are recognized in other comprehensive income and accumulated in equity (attributed to non-controlling interests as appropriate).
On the disposal of a foreign operation (i.e. a disposal of the Group's entire interest in a foreign
operation, or a disposal involving loss of control over a subsidiary that includes a foreign operation, a disposal involving loss of joint control over a jointly controlled entity that includes a foreign operation, or a disposal involving loss of significant influence over an associate that includes a foreign operation), all of the exchange differences accumulated in equity in respect of that operation attributable to the owners of the Company are reclassified to profit or loss.
In addition, in relation to a partial disposal of a subsidiary that does not result in the Group losing
control over the subsidiary, the proportionate share of accumulated exchange differences are re-attributed to non-controlling interests and are not recognized in profit or loss. For all other partial disposals (i.e. partial disposals of associates or jointly controlled entities that do not result in the Group losing significant influence or joint control), the proportionate share of the accumulated exchange differences is reclassified to profit or loss.
Fair value adjustments on identifiable assets and liabilities acquired arising on the acquisition of a
foreign operation are treated as assets and liabilities of the foreign operation and translated at the rate of exchange prevailing at the end of each reporting period. Exchange differences arising are recognized in equity.
3.7 Basis of measurement These financial statements are prepared on the historical cost basis except for the following: - Available-for-sale financial assets are measured at fair value - Investment Property is measured at fair value - Assets held for trading are measured at fair value

CORNERSTONE INSURANCE PLC
Consolidated Annual Report and Financial Statements For the year ended 31 December 2014
20
Group information and significant accounting policies 3.8 Cash and cash equivalents Cash and cash equivalents include cash in hand, deposits held at call with banks and other short term
highly liquid investments with original maturities of three months or less, these assets readily convertible into known amounts of cash.
Cash and cash equivalents comprise cash at bank and in hand and short-term deposits with an
original maturity of three months or less in the statement of financial position. 3.9 Financial instruments Financial assets are classified into the following specified categories: financial assets ‘at fair value
through profit or loss' (FVTPL), ‘held-to-maturity' investments, ‘available-for-sale' (AFS) financial assets and ‘loans and receivables'. The classification depends on the nature and purpose of the financial assets and is determined at the time of initial recognition. All regular way purchases or sales of financial assets are recognized and derecognized on a trade date basis. Regular way purchases or sales are purchases or sales of financial assets that require delivery of assets within the time frame established by regulation or convention in the marketplace.
3.10 Effective interest method The effective interest method is a method of calculating the amortized cost of a debt instrument and of
allocating interest income over the relevant period. The effective interest rate is the rate that exactly discounts estimated future cash receipts (including all fees and points paid or received that form an integral part of the effective interest rate, transaction costs and other premiums or discounts) through the expected life of the debt instrument, or, where appropriate, a shorter period, to the net carrying amount on initial recognition.
Income is recognized on an effective interest basis for debt instruments other than those financial assets classified as at FVTPL.
3.11 Financial assets at fair value through profit or loss Financial assets are classified as at fair value through profit or loss when the financial asset is either
held for trading or it is designated as at FVTPL. A financial asset is classified as held for trading if:
* It has been acquired principally for the purpose of selling it in the near term; or * On initial recognition it is part of a portfolio of identified financial instruments that the Group
manages together and has a recent actual pattern of short-term profit-taking; or A financial asset other than a financial asset held for trading may be designated as at FVTPL
upon initial recognition if: * Such designation eliminates or significantly reduces a measurement or recognition
inconsistency that would otherwise arise; or * The financial asset forms part of a group of financial assets or financial liabilities or both, which
is managed and its performance is evaluated on a fair value basis, in accordance with the Group's documented risk management or investment strategy, and information about the grouping is provided internally on that basis; or
* It forms part of a contract containing one or more embedded derivatives, and IAS 39 Financial Instruments: Recognition and Measurement permits the entire combined contract (asset or liability) to be designated as at FVTPL.
Financial assets at FVTPL are stated at fair value, with any gains or losses arising on remeasurement
recognized in profit or loss. The net gain or loss recognized in profit or loss incorporates any dividend or interest earned on the financial asset and is included in the ‘other gains and losses' line item in the consolidated statement of comprehensive income/income statement.

CORNERSTONE INSURANCE PLC
Consolidated Annual Report and Financial Statements For the year ended 31 December 2014
21
Group information and significant accounting policies 3.12 Loans and receivables Loans and receivables are non-derivative financial assets with fixed or determinable payments and
fixed maturity dates that are not quoted in an active market, which the Group has the positive intent and ability to hold to maturity. Subsequent to initial recognition, held-to-maturity investments are measured at amortized cost using the effective interest method less any impairment.
3.13 Available-for-sale financial assets (AFS financial assets) AFS financial assets are non-derivatives that are either designated as available for sale or are not
classified as (a) loans and receivables, (b) held-to-maturity investments or (c) financial assets at fair value through profit or loss.
The Group also has investments in unlisted shares that are not traded in an active market but that are
also classified as AFS financial assets and stated at fair value at the end of each reporting period (because the directors consider that fair value can be reliably measured). . Changes in the carrying amount of AFS monetary financial assets relating to changes in foreign currency rates, interest income calculated using the effective interest method and dividends on available for sale equity investments are recognized in profit or loss.
Other changes in the carrying amount of available-for-sale financial assets are recognized in other
comprehensive income and accumulated under the heading of investments revaluation reserve. When the investment is disposed of or is determined to be impaired, the cumulative gain or loss previously accumulated in the investments revaluation reserve is reclassified to profit or loss.
Dividends on available for sale equity instruments are recognized in profit or loss when the Group's
right to receive the dividends is established. The fair value of AFS monetary financial assets denominated in a foreign currency is determined in
that foreign currency and translated at the spot rate prevailing at the end of the reporting period. The foreign exchange gains and losses that are recognized in profit or loss are determined based on the amortized cost of the monetary asset. Other foreign exchange gains and losses are recognized in other comprehensive income.
Available for sale equity investments that do not have a quoted market price in an active market and
whose fair value cannot be reliably measured and derivatives that are linked to and must be settled by delivery of such unquoted equity investments are measured at cost less any identified impairment losses at the end of each reporting period.
3.14 Impairment of financial assets Financial assets, other than those at fair value through profit or loss, are assessed for indicators of
impairment at the end of each reporting period. Financial assets are considered to be impaired when there is objective evidence that, as a result of one or more events that occurred after the initial recognition of the financial asset, the estimated future cash flows of the investment have been affected.
For available for sale equity investments, a significant or prolonged decline in the fair value of the
security below its cost is considered to be objective evidence of impairment. For all other financial assets, objective evidence of impairment could include:
* Significant financial difficulty of the issuer or counterparty; or * Breach of contract, such as a default or delinquency in interest or principal payments; or * It becoming probable that the borrower will enter bankruptcy or financial re-organisation; or * The disappearance of an active market for that financial asset because of financial difficulties.
CORNERSTONE INSURANCE PLC
Consolidated Annual Report and Financial Statements For the year ended 31 December 2014
22
Group information and significant accounting policies For financial assets carried at amortized cost, the amount of the impairment loss recognized is the
difference between the asset's carrying amount and the present value of estimated future cash flows, discounted at the financial asset's original effective interest rate.
For financial assets carried at cost, the amount of the impairment loss is measured as the difference between the asset's carrying amount and the present value of the estimated future cash flows discounted at the current market rate of return for a similar financial asset. Such impairment loss will not be reversed in subsequent periods.
The carrying amount of the financial asset is reduced by the impairment loss directly for all financial
assets with the exception of trade receivables, where the carrying amount is reduced through the use of an allowance account. When a trade receivable is considered uncollectible, it is written off against the allowance account.
Subsequent recoveries of amounts previously written off are credited against the allowance account.
Changes in the carrying amount of the allowance account are recognized in profit or loss. When an AFS financial asset is considered to be impaired, cumulative gains or losses previously
recognized in other comprehensive income are reclassified to profit or loss in the period. For financial assets measured at amortized cost, if, in a subsequent period, the amount of the
impairment loss decreases and the decrease can be related objectively to an event occurring after the impairment was recognized, the previously recognized impairment loss is reversed through profit or loss to the extent that the carrying amount of the investment at the date the impairment is reversed does not exceed what the amortized cost would have been had the impairment not been recognized.
In respect of AFS equity securities, impairment losses previously recognized in profit or loss are not
reversed through profit or loss. Any increase in fair value subsequent to an impairment loss is recognized in other comprehensive income and accumulated under the heading of investments revaluation reserve. In respect of AFS debt securities, impairment losses are subsequently reversed through profit or loss if an increase in the fair value of the investment can be objectively related to an event occurring after the recognition of the impairment loss.
3.15 Determination of fair value For financial instruments traded in active markets, the determination of fair values of financial assets
and financial liabilities is based on quoted market prices or dealer price quotations. This includes listed equity securities and quoted debt instruments on major exchanges. The quoted market price used for financial assets held is the current bid price.
A financial instrument is regarded as quoted in an active market if quoted prices are readily and
regularly available from an exchange, dealer, broker, industry group, pricing service or regulatory agency, and those prices represent actual and regularly occurring market transactions on an arm’s length basis. If the above criteria are not met, the market is regarded as being inactive.
For all other financial instruments, fair value is determined using valuation techniques. In these
techniques, fair values are estimated from observable data in respect of similar financial instruments, using models to estimate the present value of expected future cash flows or other valuation techniques, using inputs (for example, NIBOR, MPR etc.) existing at the dates of the statement of financial position.
The company uses widely recognised money market rates in determining fair values of non-
standardised financial instruments of lower complexity like placements, and treasury bills. These financial instruments models are generally market observable.

CORNERSTONE INSURANCE PLC
Consolidated Annual Report and Financial Statements For the year ended 31 December 2014
23
Group information and significant accounting policies 3.15 Determination of fair value (Cont’d) The carrying value less impairment provision of trade receivables and payables are assumed to
approximate their fair values. The fair value of financial liabilities for disclosure purposes is estimated by discounting the future
contractual cash flows at the current market interest rate that is available for similar financial instruments.
3.16 Derecognition of financial assets The Group derecognizes a financial asset only when the contractual rights to the cash flows from the
asset expire, or when it transfers the financial asset and substantially all the risks and rewards of ownership of the asset to another entity. If the Group neither transfers nor retains substantially all the risks and rewards of ownership and continues to control the transferred asset, the Group recognizes its retained interest in the asset and an associated liability for amounts it may have to pay.
If the Group retains substantially all the risks and rewards of ownership of a transferred financial asset,
the Group continues to recognize the financial asset and also recognizes a collateralized borrowing for the proceeds received.
On derecognition of a financial asset in its entirety, the difference between the asset's carrying amount
and the sum of the consideration received and receivable and the cumulative gain or loss that had been recognized in other comprehensive income and accumulated in equity is recognized in profit or loss.
On derecognition of a financial asset other than in its entirety (e.g. when the Group retains an option to
repurchase part of a transferred asset), the Group allocates the previous carrying amount of the financial asset between the part it continues to recognize under continuing involvement, and the part it no longer recognizes on the basis of the relative fair values of those parts on the date of the transfer. The difference between the carrying amount allocated to the part that is no longer recognized and the sum of the consideration received for the part no longer recognized and any cumulative gain or loss allocated to it that had been recognized in other comprehensive income is recognized in profit or loss. A cumulative gain or loss that had been recognized in other comprehensive income is allocated between the part that continues to be recognized and the part that is no longer recognized on the basis of the relative fair values of those parts.
3.17 Trade receivables Receivables include amounts due from agents, brokers and insurance contract holders. Receivables
arising under insurance contracts are measured on initial recognition at the fair value of the consideration received or receivable. Subsequent to initial recognition, insurance receivables are measured at amortised cost, using the effective interest rate method. The carrying value of insurance receivables is reviewed for impairment whenever events or circumstances indicate that the carrying amount may not be recoverable, with the impairment loss recorded in the income statement.
3.18 Other receivables Other receivables principally consist of prepayments, accrued income and sundry debtors and are
carried at amortised cost. 3.19.1 Reinsurance contracts The Group enters into reinsurance contracts in the normal course of business in order to limit the
potential for losses arising from certain exposures. Outwards reinsurance premiums are accounted for in the same period as the related premiums for the Direct inwards reinsurance business being reinsured.

CORNERSTONE INSURANCE PLC
Consolidated Annual Report and Financial Statements For the year ended 31 December 2014
24
Group information and significant accounting policies 3.19.2 Reinsurance Assets The Group cedes insurance risk in the normal course of business on the bases of our treaty and
facultative agreements. Reinsurance assets represent balances due from reinsurance companies. Amounts recoverable from reinsurers are estimated in a manner consistent with settled claims associated with the reinsurer’s policies and are in accordance with the related reinsurance contract.
The Group assesses its reinsurance assets for impairment at each reporting date or move frequently
when an indication of impairment arises during the reporting year. If there is objective evidence that the reinsurance asset is impaired, the Group reduces the carrying amount of the reinsurance asset to its recoverable amount and recognises that impairment loss in the income statement. The Group gathers the objective evidence that a reinsurance asset it impaired using the same process adopted for financial assets held at amortised cost. The impairment loss is calculated using the incurred loss model for these financial assets.
Premiums, losses and other amounts relating to reinsurance treaties are recognized over the period
from inception of a treaty to expiration of the related business. 3.19.2 Reinsurance Assets (Cont’d) Ceded reinsurance arrangements do not relieve the Company from its obligations to policyholders. Reinsurance assets or liabilities are derecognized when the contractual rights are extinguished or
expire or when the contract is transferred to another party. Reinsurance contracts that do not transfer significant insurance risk are accounted for directly through
the statement of financial position. These are deposit assets that are recognised based on the consideration paid less any explicit identified premiums or fees to be retained by the reinsured.
Investment income on these contracts is accounted for using the effective interest rate method when
accrued. 3.19.3 Impairment of reinsurance asset Reinsurance assets are subject to impairment testing and the carrying amount is reduced to its
recoverable amount. The impairment loss is recognised as an expense in the income statement. The asset is impaired if objective evidence is available to suggest that it is probable that the Group will not be able to collect the amounts due from reinsurers.
3.19.4 Reinsurance recoveries Reinsurance recoveries in respect of incurred but not reported (IBNR) claims are assumed to be
consistent with the historical recoveries on paid and outstanding claims, adjusted to reflect changes in the nature and extent of the Group’s reinsurance programmes. An assessment is made of the recoverability of reinsurance having regard to available data on the financial strength of the reinsurance companies.
3.19.5 Reinsurance liabilities Reinsurance liabilities comprise premiums payable for outwards reinsurance contracts and are
recognised as an expense when due. Gains or losses on buying reinsurance are recognised in income at the date of purchase and are not
amortised.

CORNERSTONE INSURANCE PLC
Consolidated Annual Report and Financial Statements For the year ended 31 December 2014
25
Group information and significant accounting policies 3.20 Deferred charges 3.20.1 Deferred acquisition costs and deferred origination costs The incremental costs directly attributable to the acquisition of new business for other participating
investment contracts are deferred by recognising an asset. For other insurance contracts, acquisition costs including both incremental acquisition costs and other indirect costs of acquiring and processing new business are deferred (deferred acquisition costs).
For investment contracts without discretionary features incremental costs directly attributable to
acquiring the contracts are deferred (deferred original costs) Where such business is reinsured the reinsurers’ share is carried forward as deferred income. Deferred acquisition costs and deferred origination costs are amortised systematically over the life of
the contracts and tested for impairment at each reporting date. Any amount not recoverable is expensed. They are derecognised when the related contracts are settled or disposed of.
3.20.2 Deferred income - Reinsurance commissions The Group recognises commissions receivable on outwards reinsurance contracts as a deferred
income and amortised over the average term of the expected premiums payable. 3.20.3 Deferred expenses- Investment management services The Group defers those incremental costs incurred during the financial period directly attributable to
securing investment contracts without discretionary participation features (DPF), under which the Group renders investment management services (to the extent that these costs can be identified separately, measured reliably and it is probable that these costs will be recovered out of future revenue margins); and amortised over the average expected period.
Incremental cost is a cost that would not have been incurred if the Group had not secured the
investment contracts without DPF. The other transaction costs are included in the financial liability in accordance with IAS 39.
For all deferred charges under an insurance contracts and investment contracts (with or without DPF),
an impairment review is performed at the end of each reporting period, or more frequently, when an indication of impairment arises. When the recoverable amount is less than the carrying amount, an impairment loss is recognised in profit or loss. The group equally assesses "future servicing rights" in order to establishing an onerous contract provision for each reporting period.
3.21 Leasing Leases are classified as finance leases whenever the terms of the lease transfer substantially all the
risks and rewards of ownership to the lessee. All other leases are classified as operating leases. 3.21.1 The Group as a lessor Amounts due from lessees under finance leases are recognized as receivables at the amount of the
Group's net investment in the leases. Finance lease income is allocated to accounting periods so as to reflect a constant periodic rate of return on the Group's net investment outstanding in respect of the leases.
Rental income from operating leases is recognized on a straight-line basis over the term of the
relevant lease. Initial direct costs incurred in negotiating and arranging an operating lease are added to the carrying amount of the leased asset and recognized on a straight-line basis over the lease term.

CORNERSTONE INSURANCE PLC
Consolidated Annual Report and Financial Statements For the year ended 31 December 2014
26
Group information and significant accounting policies 3.22.2 The Group as a lessee Assets held under finance leases are initially recognized as assets of the Group at their fair value at
the inception of the lease or, if lower, at the present value of the minimum lease payments. The corresponding liability to the lessor is included in the consolidated statement of financial position as a finance lease obligation.
Lease payments are apportioned between finance expenses and reduction of the lease obligation so
as to achieve a constant rate of interest on the remaining balance of the liability. Finance expenses are recognized immediately in profit or loss, unless they are directly attributable to qualifying assets, in which case they are capitalized in accordance with the Group's general policy on borrowing costs. Contingent rentals are recognized as expenses in the periods in which they are incurred.
Operating lease payments are recognized as an expense on a straight-line basis over the lease term,
except where another systematic basis is more representative of the time pattern in which economic benefits from the leased asset are consumed. Contingent rentals arising under operating leases are recognized as an expense in the period in which they are incurred.
In the event that lease incentives are received to enter into operating leases, such incentives are
recognized as a liability. The aggregate benefit of incentives is recognized as a reduction of rental expense on a straight-line basis, except where another systematic basis is more representative of the time pattern in which economic benefits from the leased asset are consumed.
3.22 Investment properties Investment properties are properties held to earn rentals and/or for capital appreciation (including
property under construction for such purposes). Investment properties are measured initially at cost, including transaction costs.
Subsequent to initial recognition, investment properties are measured at fair value. Gains and losses
arising from changes in the fair value of investment properties are included in profit or loss in the period in which they arise.
An investment property is derecognized upon disposal or when the investment property is permanently
withdrawn from use and no future economic benefits are expected from the disposal. Any gain or loss arising on derecognition of the property (calculated as the difference between the net disposal proceeds and the carrying amount of the asset) is included in profit or loss in the period in which the property is derecognized.
3.23 Property, plant and equipment Group occupied properties are stated in the statement of financial position at cost, less any
subsequent accumulated depreciation and subsequent accumulated impairment losses. Properties in the course of construction for production, supply or administrative purposes are carried at
cost, less any recognized impairment loss. Cost includes professional fees and, for qualifying assets, borrowing costs capitalized in accordance with the Group's accounting policy. Such properties are classified to the appropriate categories of property, plant and equipment when completed and ready for intended use.
Depreciation of these assets, on the same basis as other property assets, commences when the
assets are ready for their intended use.

CORNERSTONE INSURANCE PLC
Consolidated Annual Report and Financial Statements For the year ended 31 December 2014
27
Group information and significant accounting policies Freehold land is not depreciated. Fixtures and equipment are stated at cost less accumulated depreciation and accumulated impairment
losses. Depreciation is recognized so as to write off the cost or valuation of assets (other than freehold land and properties under construction) less their residual values over their useful lives, using the straight-line method. The estimated useful lives, residual values and depreciation method are reviewed at the end of each reporting period, with the effect of any changes in estimate accounted for on a prospective basis.
Depreciation is calculated on a straight line method to write down the cost of assets in equal
installments over their estimated useful lives, at the following annual rates: Asset Description Year Building (Property) 50 Motor Vehicles 4 Furniture and Fittings 5 Equipment 4 Plant and Machinery 5 Assets held under finance leases are depreciated over their expected useful lives on the same basis
as owned assets. However, when there is no reasonable certainty that ownership will be obtained by the end of the lease term, assets are depreciated over the shorter of the lease term and their useful lives.
An item of property, plant and equipment is derecognized upon disposal or when no future economic benefits are expected to arise from the continued use of the asset. Any gain or loss arising on the disposal or retirement of an item of property, plant and equipment is determined as the difference between the sales proceeds and the carrying amount of the asset and is recognized in profit or loss.
3.24 Intangible assets 3.24.1 Software expenditure An internally-generated intangible asset arising from the Group’s software development is recognized
if and only if all of the following conditions are met:
* The technical feasibility of completing the intangible asset so that it will be available for use or sale;
* The intention to complete the intangible asset and use or sell it; * The ability to use or sell the intangible asset; * How the intangible asset will generate probable future economic benefits; * The availability of adequate technical, financial and other resources to complete the development
and to use or sell the intangible asset; and * The ability to measure reliably the expenditure attributable to the intangible asset during its
development. The amount initially recognized for internally-generated intangible assets is the sum of the expenditure
incurred from the date when the intangible asset first meets the recognition criteria listed above. Where no internally-generated intangible asset can be recognized, development expenditure is recognized in profit or loss in the period in which it is incurred.
3.24.1 Software expenditure Subsequent to initial recognition, internally-generated intangible assets are reported at cost less
accumulated amortization and accumulated impairment losses, on the same basis as intangible assets that are acquired separately. Its estimated useful life of 3 years.

CORNERSTONE INSURANCE PLC
Consolidated Annual Report and Financial Statements For the year ended 31 December 2014
28
Group information and significant accounting policies 3.24.2 Impairment of tangible and intangible assets other than goodwill At the end of each reporting period, the Group reviews the carrying amounts of its tangible and
intangible assets to determine whether there is any indication that those assets have suffered an impairment loss. If any such indication exists, the recoverable amount of the asset is estimated in order to determine the extent of the impairment loss (if any). When it is not possible to estimate the recoverable amount of an individual asset, the Group estimates the recoverable amount of the cash-generating unit to which the asset belongs. When a reasonable and consistent basis of allocation can be identified, corporate assets are also allocated to individual cash-generating units, or otherwise they are allocated to the smallest group of cash-generating units for which a reasonable and consistent allocation basis can be identified.
3.24.3 Impairment of tangible and intangible assets other than goodwill (Cont’d) Intangible assets with indefinite useful lives and intangible assets not yet available for use are tested
for impairment at least annually, and whenever there is an indication that the asset may be impaired. Recoverable amount is the higher of fair value less costs to sell and value in use. In assessing value in
use, the estimated future cash flows are discounted to their present value using a pre-tax discount rate that reflects current market assessments of the time value of money and the risks specific to the asset for which the estimates of future cash flows have not been adjusted.
If the recoverable amount of an asset (or cash-generating unit) is estimated to be less than its carrying
amount, the carrying amount of the asset (or cash-generating unit) is reduced to its recoverable amount.
An impairment loss is recognized immediately in profit or loss, unless the relevant asset is carried at a revalued amount, in which case the impairment loss is treated as a revaluation decrease.
When an impairment loss subsequently reverses, the carrying amount of the asset (or a cash-
generating unit) is increased to the revised estimate of its recoverable amount, but so that the increased carrying amount does not exceed the carrying amount that would have been determined had no impairment loss been recognized for the asset (or cash-generating unit) in prior years. A reversal of an impairment loss is recognized immediately in profit or loss, unless the relevant asset is carried at a revalued amount, in which case the reversal of the impairment loss is treated as a revaluation increase.
3.25 Statutory deposit Statutory deposit represents a deposit of 10% of the regulatory share capital kept with the Central
Bank of Nigeria. The amount held will increase or decrease in relation to the amount of paid up share capital in issue. The cash amount held is considered to be a restricted cash balance and stated at cost.
3.26 Non-life insurance contract liabilities 3.26.1 Provision for outstanding claims and incurred but not reported (IBNR) claims Provisions for liabilities of non-life insurance contracts is made for outstanding claims and settlement
expenses incurred at the reporting date including an estimate for the cost of claims incurred but not reported (IBNR) at that date. Included in the provision is an estimate of the internal and external costs of handling the outstanding claims.
Material salvage and other recoveries including reinsurance recoveries are presented as assets. Significant delays are experienced in the notification and settlement of certain types of general
insurance claims, particularly in respect of liability business, environmental and pollution exposures, the ultimate cost of which may vary from the original assessment. Adjustments to the amounts of claims provisions established in prior years are reflected in the financial statements for the period in which the adjustments are made and disclosed separately, if material.

CORNERSTONE INSURANCE PLC
Consolidated Annual Report and Financial Statements For the year ended 31 December 2014
29
Group information and accounting policies The liability for Incurred But Not Reported (IBNR) claims is calculated at the end of the reporting
period, using a range of standard actuarial claim projection techniques, based on empirical data and current assumptions that may include a margin for adverse deviation. The liability was not discounted for time value of money; and no further provision was made for equalisation or catastrophe reserves (as prohibited by IFRS 4).
These liabilities are derecognised when the obligation to pay a claim is extinguished (i.e. expires, discharged or cancelled).
3.26.2 Provision for unearned premiums and unexpired risks The provision for unearned premiums represents that part of written premiums, gross of commission
payable to intermediaries that is estimated to be earned in subsequent periods. The change in the provision is recorded in the income statement to recognise revenue over the period of the risk.
3.26.3 Liability adequacy At each reporting date the Group performs a liability adequacy test on its insurance liabilities less
related deferred acquisition costs and intangible assets to ensure that the carrying value is adequate, using current estimates of future cash flows, taking into account the relevant investment return. If that assessment shows that the carrying amount of the liabilities is inadequate, any deficiency is recognised as an expense to the income statement initially by writing off the intangible assets and subsequently by recognising an additional liability for claims provisions or recognising a provision for unexpired risks.
The unexpired risks provision is assessed in aggregate for business classes which are managed
together. 3.26.4 Actuarial valuation of life fund This is made up of the net liabilities on all policies in force as computed at the time of the actuarial
valuation. Actuarial valuation of life fund is carried out annually for the purpose of determining the surplus or deficit at the end of the year. All deficits/surpluses arising thereon are charged/credited to the profit or loss.
3.26.5 Life insurance contract liabilities Individual life These contracts insure mainly against death. For the annual statement of accounts, the contracts are
values using a gross premium valuation, taking into account the present value of expected future premium claim and associated expense cash flow.
Group life These contracts insure against death on a group basis. These contracts are short term in nature and
are typically renewed annually. Insurance contracts with discretionary participation features Cornerstone group issues endowment contracts that provide primarily savings benefits to
policyholders but also transfer insurance risk. The benefit payable under each contract increases each year by a reversionary bonus. Bonus distribution to policyholders is at the discretion of Cornerstone’s group management.
These contracts are valued on a gross premium valuation basis.

CORNERSTONE INSURANCE PLC
Consolidated Annual Report and Financial Statements For the year ended 31 December 2014
30
Group information and significant accounting policies 3.26.6 Investment contract Receipts from investment contracts with guarantee returns (welfare scheme/deposit administration)
and other businesses that are savings related are recognised as liabilities. Interest accruing from investment of the savings is recognised in the profit or loss account (deposit administration revenue account) in the year it is earned while guaranteed interest due to depositors is recognised as expense. The net result of deposit administration revenue account is transferred to statement of profit and loss account of the group. The policy liabilities are determined by the accrued benefits of relevant policy holders.
3.27 Financial liabilities and equity instruments 3.27.1 Classification as debt or equity Debt and equity instruments issued by a group entity are classified as either financial liabilities or as
equity in accordance with the substance of the contractual arrangements and the definitions of a financial liability and an equity instrument.
3.27.2 Equity instruments An equity instrument is any contract that evidences a residual interest in the assets of an entity after
deducting all of its liabilities. Equity instruments issued by the Group are recognized at the proceeds received, net of direct issue costs. Repurchase of the Company's own equity instruments is recognized and deducted directly in equity. No gain or loss is recognized in profit or loss on the purchase, sale, issue or cancellation of the own equity instruments.
3.27.3 Compound instruments The component parts of compound instruments (convertible notes) issued by the Company are
classified separately as financial liabilities and equity in accordance with the substance of the contractual arrangements and the definitions of a financial liability and an equity instrument. Conversion option that will be settled by the exchange of a fixed amount of cash or another financial asset for a fixed number of own equity instruments is an equity instrument.
At the date of issue, the fair value of the liability component is estimated using the prevailing market
interest rate for similar non-convertible instruments. This amount is recorded as a liability on an amortized cost basis using the effective interest method until extinguished upon conversion or at the instrument's maturity date.
The conversion option classified as equity is determined by deducting the amount of the liability
component from the fair value of the compound instrument as a whole. This is recognized and included in equity, net of income tax effects, and is not subsequently re-measured. In addition, the conversion option classified as equity will remain in equity until the conversion option is exercised, in which case, the balance recognized in equity will be transferred to other equity. When the conversion option remains unexercised at the maturity date of the convertible note, the balance recognized in equity will be transferred to retained profits. No gain or loss is recognized in profit or loss upon conversion or expiration of the conversion option.
Transaction costs that relate to the issue of the convertible notes are allocated to the liability and
equity components in proportion to the allocation of the gross proceeds. Transaction costs relating to the equity component are recognized directly in equity. Transaction costs relating to the liability component are included in the carrying amount of the liability component and are amortized over the lives of the convertible notes using the effective interest method.
Once the convertible security is not convertible to fixed number of ordinary shares, it cannot be
considered a compound instrument.

CORNERSTONE INSURANCE PLC
Consolidated Annual Report and Financial Statements For the year ended 31 December 2014
31
Group information and significant accounting policies 3.27.4 Trade payable Trade payable are measured on initial recognition at the fair value and subsequent measured at
amortised cost, using the effective interest rate method. The fair value of a non-interest bearing liability is its discounted repayment amount. If the due date of the liability is less one year discounting is omitted.
3.27.4 Other payables and accruals Other payables and accruals are recognised initially at fair value and subsequently measured at
amortised cost using the effective interest method. The fair value of a non-interest bearing liability is its discounted repayment amount. If the due dateof the liability is less one year discounting is omitted.
A financial liability is derecognized when the obligation under the liability is discharged or cancelled or
expires. When an existing financial liability is replaced by another from the same lender on substantially different terms, or the terms of an existing liability, are substantially modified, such as exchange or modification is treated as a derecognition of the original liability and the recognition of a new liability, and the difference in the respective carrying amounts is recognised in the income statement. Gains and losses are recognised in the income statements when the liabilities are derecognized.
3.27.5 Trust and managed funds Trust and managed funds consist of investments held by the Group as Trust Manager on behalf of
third parties. 3.28 Financial liabilities Financial liabilities are classified as either financial liabilities ‘at FVTPL' or ‘other financial liabilities'. 3.28.1 Financial liabilities at fair value through profit or loss Financial liabilities are classified as at fair value through profit or loss when the financial liability is
either held for trading or it is designated as at fair value through profit or loss. A financial liability is classified as held for trading if:
* It has been acquired principally for the purpose of repurchasing it in the near term; or * On initial recognition it is part of a portfolio of identified financial instruments that the Group
manages together and has a recent actual pattern of short-term profit-taking; or * It is a derivative that is not designated and effective as a hedging instrument.
A financial liability other than a financial liability held for trading may be designated as at FVTPL upon initial recognition if:
* such designation eliminates or significantly reduces a measurement or recognition inconsistency
that would otherwise; or * the financial liability forms part of a group of financial assets or financial liabilities or both, which is
managed and its performance is evaluated on a fair value basis, in accordance with the Group's documented risk management or investment strategy, and information about the grouping is provided internally on that basis; or
* it forms part of a contract containing one or more embedded derivatives, and IAS 39 Financial Instruments: Recognition and Measurement permits the entire combined contract (asset or liability) to be designated as at FVTPL.
Financial liabilities at FVTPL are stated at fair value, with any gains or losses arising on
remeasurement recognized in profit or loss. The net gain or loss recognized in profit or loss incorporates any interest paid on the financial liability and is included in the ‘other gains and losses' line item in the consolidated statement of comprehensive income/income statement.
3.28.2 Other financial liabilities Other financial liabilities (including borrowings and trade and other payables) are subsequently
measured at amortized cost using the effective interest method.

CORNERSTONE INSURANCE PLC
Consolidated Annual Report and Financial Statements For the year ended 31 December 2014
32
Group information and significant accounting policies The effective interest method is a method of calculating the amortized cost of a financial liability and of
allocating interest expense over the relevant period. The effective interest rate is the rate that exactly discounts estimated future cash payments (including all fees and points paid or received that form an integral part of the effective interest rate, transaction costs and other premiums or discounts) through the expected life of the financial liability, or (where appropriate) a shorter period, to the net carrying amount on initial recognition.
3.28.3 Financial guarantee contracts A financial guarantee contract is a contract that requires the issuer to make specified payments to
reimburse the holder for a loss it incurs because a specified debtor fails to make payments when due in accordance with the terms of a debt instrument.
Financial guarantee contracts issued by the Group are initially measured at their fair values and, if not designated as at FVTPL, are subsequently measured at the higher of:
* The amount of the obligation under the contract, as determined in accordance with IAS 37
Provisions, Contingent Liabilities and Contingent Assets; and * The amount initially recognized less, where appropriate, cumulative amortization recognized in
accordance with the revenue recognition policies. 3.28.4 Derecognition of financial liabilities The Group derecognizes financial liabilities when, and only when, the Group's obligations are
discharged, cancelled or they expire. The difference between the carrying amount of the financial liability derecognized and the consideration paid and payable is recognized in profit or loss.
3.28.5 Fair value of financial instrument The fair value of non-derivative financial assets and liabilities with standard terms and conditions and
traded at an active liquid market are determined by reference to quoted market prices. Financial assets in this category include listed equities, listed debt securities and mortgages. Financial liabilities include borrowing, net asset value attributable to unit-holders and liabilities for investment contracts without Discretionary particpation features (DPF).
The fair value of other non-derivative financial assets and liabilities are determined in accordance with
generally accepted pricing models based on discounted cash flow analysis using prices from observable current market transactions and dealer quotes for similar instruments.
3.29 Provisions Provisions are recognized when the Group has a present obligation (legal or constructive) as a result
of a past event, it is probable that the Group will be required to settle the obligation, and a reliable estimate can be made of the amount of the obligation.
The amount recognized as a provision is the best estimate of the consideration required to settle the
present obligation at the end of the reporting period, taking into account the risks and uncertainties surrounding the obligation.
When a provision is measured using the cash flows estimated to settle the present obligation, its
carrying amount is the present value of those cash flows (when the effect of the time value of money is material).
When some or all of the economic benefits required to settle a provision are expected to be recovered from a third party, a receivable is recognized as an asset if it is virtually certain that reimbursement will be received and the amount of the receivable can be measured reliably.

CORNERSTONE INSURANCE PLC
Consolidated Annual Report and Financial Statements For the year ended 31 December 2014
33
Group information and significant accounting policies 3.30 Taxation Income tax expense represents the sum of the tax currently payable and deferred tax. 3.30.1 Current tax The tax currently payable is based on taxable profit for the year. Taxable profit differs from profit as
reported in the consolidated statement of comprehensive income/income statement because of items of income or expense that are taxable or deductible in other years and items that are never taxable or deductible. The Group's liability for current tax is calculated using tax rates that have been enacted or substantively enacted by the end of the reporting period.
The current taxes include: Company Income Tax at 30% of taxable profit; Education Tax at 2% of
assessable profit; Capital Gain Tax at 10% of chargeable gains; and Information Technology Development Levy at 1% of accounting profit before tax.
3.31.1 Retirement benefit costs Payments to defined contribution retirement benefit plans are recognised as an expense when
employees have rendered service entitling them to the contributions. This is done in line with the Pension Reform Act 2014, whereby the minimum rate of Pension
Contribution is 18% of monthly emolument, where 8% will be contributed by employee and 10% by employer.
3.31.2 Borrowing and finance costs Borrowing costs comprise interest payable on loans and bank overdrafts as well as commission fees
charged in respect of letters of credit. They are charged to profit or loss as incurred, except those that relate to qualifying assets. Arrangement fees in respect of financing arrangements including letters of credit are charged to borrowing costs over the life of the related facility.
After initial recognition, interest bearing loans and borrowings are subsequently measured at
amortised cost using the effective interest rate method. Gains and losses are recognised in the income statement when the liabilities are derecognised as well as through the effective interest rate (EIR) amortisation process. Amortised cost is calculated by taking into account any discount or premium on acquisition and fee or costs that is an integral part of the EIR. The EIR amortisation is included in finance cost in the income statement.
Borrowing costs directly attributable to the acquisition, construction or production of an asset
("qualifying asset") that necessarily takes a substantial period of time to get ready for use or sale are capitalized as part of the cost of the respective assets.
3.31.3 Deferred tax Deferred tax is recognized on temporary differences between the carrying amounts of assets and
liabilities in the consolidated and separate financial statements and the corresponding tax bases used in the computation of taxable profit.
Deferred tax liabilities are generally recognized for all taxable temporary differences. Deferred tax
assets are generally recognized for all deductible temporary differences to the extent that it is probable that taxable profits will be available against which those deductible temporary differences can be utilized. Such deferred tax assets and liabilities are not recognized if the temporary difference arises from goodwill or from the initial recognition (other than in a business combination) of other assets and liabilities in a transaction that affects neither the taxable profit nor the accounting profit.

CORNERSTONE INSURANCE PLC
Consolidated Annual Report and Financial Statements For the year ended 31 December 2014
34
Group information and significant accounting policies Deferred tax liabilities are recognized for taxable temporary differences associated with investments in
subsidiaries and associates, and interests in joint ventures, except where the Group is able to control the reversal of the temporary difference and it is probable that the temporary difference will not reverse in the foreseeable future.
Deferred tax assets arising from deductible temporary differences associated with such investments
and interests are only recognized to the extent that it is probable that there will be sufficient taxable profits against which to utilise the benefits of the temporary differences and they are expected to reverse in the foreseeable future.
The carrying amount of deferred tax assets is reviewed at the end of each reporting period and
reduced to the extent that it is no longer probable that sufficient taxable profits will be available to allow all or part of the asset to be recovered.
Deferred tax liabilities and assets are measured at the tax rates that are expected to apply in the
period in which the liability is settled or the asset realised, based on tax rates (and tax laws) that have been enacted or substantively enacted by the end of the reporting period. The measurement of deferred tax liabilities and assets reflects the tax consequences that would follow from the manner in which the Group expects, at the end of the reporting period, to recover or settle the carrying amount of its assets and liabilities.
3.31.4 Current and deferred tax for the year Current and deferred tax are recognized in profit or loss, except when they relate to items that are
recognized in other comprehensive income or directly in equity, in which case, the current and deferred tax are also recognized in other comprehensive income or directly in equity respectively. Where current tax or deferred tax arises from the initial accounting for a business combination, the tax effect is included in the accounting for the business combination.
3.32 Share capital and premium Shares are classified as equity when there is no obligation to transfer cash or other assets.
Incremental external costs that are directly attributable to the issue of these shares are recognised in equity, net of tax.
3.33 Contingency reserves 3.33.1 Non-life business The company maintains contingency reserves in accordance with the provision of section 21(2) of the
Insurance Act, CAP I17 LFN 2004 to cover fluctuations in securities and variations in statistical estimates at a rate equal to greater of 3% of total premium or 20% of net profits until the accumulated amount reaches the greater of the minimum paid-up capital or 50% of the net premium.
3.33.2 Life business Contingency reserves are done in accordance with the provisions of the Insurance Act, CAP II7 LFN
2004: The contingency reserve is credited with the higher of an amount equal to 1% of the gross premium or
10% of the profits. 3.34 Treasury shares Own equity instruments which are acquired (treasury shares) are deducted from equity and accounted
for at weighted average cost. No gain or loss is recognised in the income statement on the purchase, sale, issue or cancellation of the Group’s own equity instruments. Any difference between the carrying amount and the consideration is recognised in other capital reserves. Voting rights related to treasury shares are nullified for the Group and no dividends are allocated to them respectively.

CORNERSTONE INSURANCE PLC
Consolidated Annual Report and Financial Statements For the year ended 31 December 2014
35
Group information and significant accounting policies Contracts on own shares that require physical settlement of a fixed number of own shares for a fixed
consideration are classified as equity and added to or deducted from equity. Contracts on own shares that require net cash settlement or provide a choice of settlement is classified as trading instruments. Changes in the fair value are reported in the income statement.
3.35 Contingent liabilities A contingent liability is a possible obligation that arises from past event and whose existence will be
confirmed only by the occurrence or non-occurrence of one or more uncertain future events, not wholly within the control of the Group or the Group has a present obligation as a result of past events which is not recognized because it is not probable that an outflow of resources will be required to settle the obligation, or the amount cannot be reliability estimated.
3.36 Retained earnings Retained earnings are the carried forward recognized income net of expenses plus current period
profit attributable to shareholders. 3.37 Dividend Dividend distribution to the shareholders of the group is recognised in the period in which the
dividends are paid as a first interim dividend or is a second interim dividend approved by the group’s shareholders at the group’s annual general meeting.
Dividend for the year that are approved after the reporting date are dealt with as an event after the reporting date.
3.38 Premiums 3.38.1 Non-life business Written premiums for non-life (general) insurance business comprise the premiums on contracts
incepted in the financial year. Written premiums are stated gross of commissions that are payable to intermediaries and exclusive of taxes and duties on premiums.
Unearned premiums are those proportions of the premium which relate to periods of risk after the
reporting date Unearned premiums are calculated on time apportionment basis. 3.38.2 Life business Gross recurring premiums on life and investment contracts with Discretionary Participation Features
(DPF) are recognised as revenue when payable by the policyholder. For single premium business, revenue is recognised on the date on which the policy is effective.
3.38.3 Fees and commission income Fee and commission income consists primarily of Agency and brokerage commission, reinsurance and
profit commissions, policyholder administration fees and other contract fees. Reinsurance commissions receivable are deferred in the same way as acquisition costs. All other fee and commission income is recognized as the services are provided.
3.39 Insurance benefits and claims 3.39.1 Non-life business Non-life insurance claims include all claims occurring during the year, whether reported or not, related
internal and external claims handling costs that are directly related to the processing and settlement of claims, a reduction for the value of salvage and other recoveries, and any adjustments to claims outstanding from previous years.

CORNERSTONE INSURANCE PLC
Consolidated Annual Report and Financial Statements For the year ended 31 December 2014
36
Group information and significant accounting policies 3.39.2 Reinsurance claims The Group recognises reinsurance claims when the related gross insurance claims are recognised
according to the terms of the relevant contracts. 3.39.3 Life business 3.39.4 Gross benefits and claims Gross benefits and claims for life insurance contracts and for investment contracts with the
Discretionary Participatory Feature (DPF) include the cost of all claims arising during the year, including internal and external claims handling costs that are directly related to the processing and settlement of claims and policyholder bonuses declared on DPF contracts. Changes in the gross valuation of insurance and investment contract liabilities with DPF are also included. Death claims and surrenders are recorded on the basis of notifications received. Maturities and annuity payments are recorded when due
3.40 Investment income Investment income consists of dividends, interest and rent receivables, movements in amortized cost
on debt securities and other loans and receivables, realized gains and losses, and unrealized gains and losses on fair value assets.
3.40.1 Interest income Interest income is recognized in the statement of profit or loss and other comprehensive income as it
accrues and is calculated by using the effective interest rate method. Fees and commissions that are an integral part of the effective yield of the financial asset or liability are recognized as an adjustment to the effective interest rate of the instrument.
3.40.2 Dividend income Dividend income from investments is recognized when the companys’ rights to receive payment have
been established. 3.40.3 Rental income Rental income is recognized on an accrual basis. 3.40.4 Realized gains and losses Gains and losses on the sale of investments are calculated as the difference between net sales
proceeds and the original or amortized cost and are recorded on occurrence of the sale transaction. 3.40.5 Unrealised gains and losses Unrealized gains or losses represent the difference between the carrying value at the year end and the
carrying value at the previous year end or purchase value during the year, less the reversal of previously recognized unrealized gains and losses in respect of disposals during the year.
3.41 Other expenses All other operating expenses are recognized directly in profit or loss as when incurred. 3.41.1 Underwriting expenses Underwriting expenses comprise acquisition costs and other underwriting expenses. Acquisition costs
comprise all direct and indirect costs arising from the writing of insurance contracts. Examples of these costs include, but are not limited to, commission expense, supervisory levy, superintending fees and other technical expenses. Other underwriting expenses are those incurred in servicing existing policies/ contract. These expenses are charges in the accounting year in which they are incurred.

CORNERSTONE INSURANCE PLC
Consolidated Annual Report and Financial Statements For the year ended 31 December 2014
37
Group information and significant accounting policies 3.41.2 Management expenses Management expenses are expenses other than claims and underwriting expenses. They include
salaries and wages, depreciation expenses and other non-operating expenses. They are accounted for on an accrual basis.
Critical accounting judgments and key sources of estimation uncertainty In the application of the Group’s accounting policies, the directors are required to make judgments,
estimates and assumptions about the carrying amounts of assets and liabilities that are not readily apparent from other sources. The estimates and associated assumptions are based on historical experience and other factors that are considered to be relevant. Actual results may differ from these estimates.
The estimates and underlying assumptions are reviewed on an ongoing basis. Revisions to accounting
estimates are recognised in the period in which the estimate is revised if the revision affects only that period or in the period of the revision and future periods if the revision affects both current and future periods.
Critical judgments in applying the Group’s accounting policies The following are the critical judgments, apart from those involving estimations (which are dealt with
separately below), that the directors have made in the process of applying the Group’s accounting policies and that have the most significant effect on the amounts recognized in financial statements.
Product classification and contract liabilities The Group’s Non-life insurance contracts are classified as insurance contracts. As permitted by IFRS
4, assets and liabilities of these contracts are accounted for under previously applied GAAP. Key sources of estimation uncertainty. Product classification and contract liabilities (Cont’d) The key assumptions concerning the future, and other key sources of estimation uncertainty at the
reporting date, that have a significant risk of causing a material adjustment to the carrying amounts of assets and liabilities within the next financial year, are discussed below:
Valuation of liabilities of non-life insurance contracts. Estimates are made for both the expected ultimate cost of claims reported and claims incurred but not
reported (IBNR) at the balance sheet date. The estimate of IBNR is generally subject to a greater degree of uncertainty than that for reported claims. In calculating the estimated liability, the Group uses a variety of estimation techniques based upon statistical analyses of historical experience which assumes past trends can be used to project future developments.
The carrying amount for non- life insurance contract liabilities at the reporting date is N3,203 million (2013: N3,492 million), and N1,663 million for life liabilities (2013:N1,036million).
Fair value of financial instruments using valuation techniques The directors use their judgment in selecting an appropriate valuation technique. Where possible,
financial instruments are marked at prices quoted in active markets. In the current market environment, such price information is typically not available for all instruments and the group uses valuation techniques to measure such instruments. These techniques use “market observable inputs” where available, derived from similar assets in similar and active markets, from recent transaction prices for comparable items or from other observable market data. For positions where observable reference data are not available for some or all parameters the group estimates the non-market observable inputs used in its valuation models.
The carrying amount of financial assets at the reporting date is N6,519 million (2013: N5,071million).

CORNERSTONE INSURANCE PLC
Consolidated Annual Report and Financial Statements For the year ended 31 December 2014
38
Consolidated and Separate Statement of Financial Position As at 31 December, 2014
2014 2013 2014 2013 Group Group Company Company
Note N'000 N'000 N'000 N'000 ASSETS Cash and cash equivalents 5 3,077,531 3,558,740 3,425,849 3,715,242 Financial assets 6 6,519,589 5,071,987 6,490,566 4,580,031 Trade receivable 7 31,600 56,613 31,600 56,613 Receivables and prepayments 8 176,673 229,457 328,661 496,909 Other assets 8b 5,496 2,131 5,496 2,131 Reinsurance assets 9 1,701,296 2,221,541 1,701,296 2,221,541 Deferred acquisition cost 10 227,131 245,488 227,131 245,488 Investment in subsidiaries 11 - - - 59,879 Finance lease receivables 12 21,726 110,595 - - Investment properties 13 1,303,680 1,288,680 1,303,680 1,288,680 Property, plant and equipment 14 675,814 602,431 673,562 598,856 Intangible assets - Software 15 31,027 26,333 31,027 26,333 Deferred tax assets 22b 260,336 236,562 175,804 170,722 Statutory deposits 16 500,000 500,000 500,000 500,000
Total Assets 14,531,899 14,150,558 14,894,672 13,962,425
Liabilities: Investment contract liabilities 17 1,322,472 1,303,049 1,322,472 1,303,049 Insurance contract liabilities 18 4,401,107 4,528,243 4,401,107 4,528,243 Trade payables 19 175,756 518,337 175,756 518,337 Other payables 20 776,115 577,614 743,179 548,296 Trust and managed fund 21 - 199,749 - - Income tax liabilities 22 88,471 110,887 87,199 90,268 Employees retirement benefit 23 11,565 10,251 8,145 7,967
Total Liabilities 6,775,486 7,248,130 6,737,858 6,996,160
EQUITY & LIABILITIES Share capital & reserves: Share capital 24 4,410,005 4,410,005 4,410,005 4,410,005 Share premium 24a 1,947,166 1,947,166 1,947,166 1,947,166 Treasury shares 24b (48,175) (48,175) (48,175) (48,175) Contingency reserve 25a 1,348,770 1,148,801 1,348,770 1,148,801 Retained earnings 25b 98,647 (555,369) 499,048 (491,532)
Total Equity 7,756,413 6,902,428 8,156,814 6,966,265
Total Equity & Liabilities 14,531,899 14,150,558 14,894,672 13,962,425 Mr. Adedotun Sulaiman Emmanuel Otitolaiye Ganiyu Musa Chairman Head, Finance Group Managing Director FRC/2013/ICAN/00000002885 FRC/2014/ICAN/00000008524 FRC/2013/ICAN/0000003110

CORNERSTONE INSURANCE PLC
Consolidated Annual Report and Financial Statements For the year ended 31 December 2014
39
Consolidated and Separate Statement of Profit or Loss and Other Comprehensive income
31-Dec-14 31-Dec-13 31-Dec-14 31-Dec-13Group Group Company Company
Note N'000 N'000 N'000 N'000
Gross Premium written 26 5,211,966 5,313,223 5,211,966 5,313,223 Change in unearned premium 26 (24,868) (690,486) (24,868) (690,486) Premium income 5,187,098 4,622,737 5,187,098 4,622,737 Reinsurance Expenses 26 (1,838,385) (1,935,693) (1,838,385) (1,935,693)
Net premium income 26 3,348,713 2,687,044 3,348,713 2,687,044 Fees and commission income 27 252,916 236,080 252,916 236,080 Net underwriting income 3,601,629 2,923,124 3,601,629 2,923,124
Insurance claims and benefits paid- Gross (including loss adjustment expenses) 28 1,722,142 2,800,982 1,722,142 2,800,982 Insurance claims recoverable from reinsurance Companies 28 (487,997) (1,642,532) (487,997) (1,642,532) Net Claims expenses 28 1,234,145 1,158,450 1,234,145 1,158,450 Underwriting expenses - Gross 29 844,222 938,703 844,222 938,703 Deferred underwriting expenses 18,357 (113,280) 18,357 (113,280)
Net Underwriting expenses 29 862,579 825,423 862,579 825,423 Underwriting result 1,504,904 939,251 1,504,904 939,251Investment income 30 999,156 890,282 922,637 747,053 Fair value changes in investment property 13 15,000 12,900 15,000 12,900 Fair value changes in financial assets-FVTPL 30a 144,130 688,846 144,130 688,846 Net realized gain 30b - 35,966 - 36,156Other operating income 30c 872,373 46,745 891,019 45,618 Profit or (loss) from investment contract 5,745 5,475 5,745 5,475Allowance for impairment losses 31 (443,086) (126,117) (86,187) -Management expenses 32 (2,031,332) (1,573,974) (1,993,057) (1,522,676)
Results of operating activities 1,066,890 919,374 1,404,191 952,623Finance costs 33 (29,200) (49,167) (14,026) (12,008)Profit before tax 1,037,690 870,207 1,390,165 940,615
Income tax expense 34 (91,208) (9,844) (107,819) (8,756)Profit for the year from continuing operations 946,482 860,363 1,282,346 931,859
Other Comprehensive Income net of tax Items that may be reclassified subsequently to profit or loss: Changes in fair value of AFS Investments (92,497) 14,600 (91,797) 14,600Other Comprehensive Income, net of taxes (92,497) 14,600 (91,797) 14,600
Total Comprehensive Income for the year 853,985 874,963 1,190,549 946,459
Earnings Per Share (Kobo) 37 10 10 14 11

CORNERSTONE INSURANCE PLC
Consolidated Annual Report and Financial Statements For the year ended 31 December 2014
40
Consolidated Statement of Changes in Equity
Group Share Capital
Share Premium
Contingency Reserve
Retained Earnings
Treasury shares Total
N'000 N'000 N'000 N'000 N'000 N'000
At 1 January 2014 4,410,005 1,947,166 1,148,801 (555,369) (48,175) 6,902,428
Profit for the year - - - 946,482 - 946,482 Other Comprehensive Income: Changes in fair value of AFS Investments - - - (92,497) - (92,497)
Total Comprehensive Income - - - 853,985 - 853,985 Transfer to Contingency Reserve - - 199,969 (199,969) - -
At 31 December 2014 4,410,005 1,947,166 1,348,770 98,647 (48,175) 7,756,413
At 1 January 2013 4,410,005 1,947,166 975,978 (1,257,509) (48,175) 6,027,465
Profit for the year - - - 860,363 - 860,363 Other Comprehensive Income: - Changes in fair value of AFS Investments - - - 14,600 - 14,600
Total Comprehensive Income - - - 874,963 - 874,963 Transfer to Contingency Reserve - - 172,823 (172,823) - -
At 31 December 2013 4,410,005 1,947,166 1,148,801 (555,369) (48,175) 6,902,428 Treasury shares: Included in other reserves is an amount of N=48,175,000 which represent the cost of the Company's shares bought for the purpose of staff share scheme which the Company intends to operate in the future.

CORNERSTONE INSURANCE PLC
Consolidated Annual Report and Financial Statements For the year ended 31 December 2014
41
Statement of Changes in Equity
Share
Capital Share
Premium Contingency
Reserve Retained Earnings
Treasury shares Total
N'000 N'000 N'000 N'000 N'000 N'000 Company
At 1 January 2014 4,410,005 1,947,166 1,148,801 (491,532) (48,175) 6,966,265
Profit for the year - - - 1,282,346 - 1,282,346 Other Comprehensive Income: - -
Changes in fair value of AFS Investments - - - (91,797) - (91,797)
Total Comprehensive Income - - - 1,190,549 - 1,190,549 Transfer to Contingency Reserve 199,969 (199,969) - -
At 31 December 2014 4,410,005 1,947,166 1,348,770 499,048 (48,175) 8,156,814
At 1 January 2013 4,410,005 1,947,166 975,978 (1,265,168) (48,175) 6,019,806
Profit for the year - - - 931,859 - 931,859 Other Comprehensive Income: - Changes in fair value of AFS Investments - - - 14,600 - 14,600
- Total Comprehensive Income - - - 946,459 946,459
Transfer to Contingency Reserve - - 172,823 (172,823) - -
At 31 December 2013 4,410,005 1,947,166 1,148,801 (491,532) (48,175) 6,966,265

CORNERSTONE INSURANCE PLC
Consolidated Annual Report and Financial Statements For the year ended 31 December 2014
42
Life Business Revenue Account
Individual 2014 2013
Life Group
Life Total Total N' 000 N' 000 N' 000 N' 000
Gross premium written 207,032 1,182,632 1,389,664 1,499,649Changes in unearned premium - (77,075) (77,075) (85,669) Net Premium 207,032 1,105,557 1,312,589 1,413,980Reinsurance cost (5,331) (374,763) (380,094) (748,598)
Premium retained 201,701 730,794 932,495 665,382Fee and commission received 485 80,802 81,287 71,203
202, 186 811,596 1,013,782 594,179
Gross claims incurred 2,277 622,817 625,094 1,384,444Less: reinsurance recoveries (130) (72,026) (72,156) (1,052,920)
Net claims incurred 2,147 550,791 552,938 331,524
Underwriting expenses 2,136 154,065 156,201 239,465
Underwriting profit 197,903 106,740 304,643 165,596 Life Deposit Administration Revenue Account
2014 2013 Note N'000 N'000
Interest income 30 75,691 78,234
Expenses Acquisition and maintenance cost 29 37,202 40,935Guaranteed interest 29 32,744 31,824
Surplus transferred to Income statement 5,745 5,475

CORNERSTONE INSURANCE PLC
Consolidated Annual Report and Financial Statements For the year ended 31 December 2014
43
General Business revenue account
General Accident
Total Total
Motor Fire Oil and
Gas Marine 31 Dec 2014
31 Dec 2013
N' 000 N' 000 N' 000 N' 000 N' 000 N' 000 N' 000 Income Direct premium 1,244,401 605,419 767,258 718,365 382,736 3,718,178 3,735,873Inward premium 3,203 16,812 9,914 - 790 30,718 27,957Gross premium written 1,247,604 622,230 777,172 718,365 383,525 3,748,896 3,763,830(Increase)/decrease in unearned premium (17,768) (23,588) 4,868 102,660 (16,876) 49,296 (586,289)
Gross premium earned 1,229,836 598,642 782,040 821,025 366,649 3,798,192 3,177,541Outward reinsurance premium 78,785 517,637 154,651 444,457 170,779 1,366,309 1,642,569(Increase)/decrease in unexpired reinsurance cost (21,038) (8,493) 123,365 6,048 (7,901) 91,981 (455,307)Reinsurance cost 57,747 509,144 278,016 450,505 162,878 1,458,290 1,187,262
Net premium earned 1,172,089 89,498 504,024 370,520 203,771 2,339,902 1,990,279Commission earned 15,989 77,480 36,943 1,811 39,406 171,629 164,877Total income 1,188,078 166,977 540,967 372,331 243,177 2,511,531 2,155,156Expenses Gross Claims paid 420,140 224,642 385,753 264,051 235,570 1,530,116 1,195,721Increase in outstanding claims provision (82,368) (296,941) 178,667 (276,272) 25,292 (451,622) 216,787Gross claims incurred 337,772 (72,299) 564,420 (12,221) 260,862 1,078,494 1,412,508Reinsurance claims recoveries 9,863 8,285 (279,506) 30,684 (185,166) (415,840) (589,611)Net claims incurred 347,635 (64,014) 284,914 18,463 75,696 662,654 822,897
Acquisition cost 161,270 82,060 114,142 43,522 51,036 452,030 387,796Maintenance cost 107,514 54,706 76,095 29,015 34,024 301,354 258,531Underwriting expenses 268,784 136,766 190,237 72,537 85,060 753,384 646,327Total Expenses 616,419 72,752 475,151 91,000 160,756 1,416,038 1,469,224
Underwriting profit 571,659 94,225 65,816 281,331 82,421 1,095,453 685,932

CORNERSTONE INSURANCE PLC
Consolidated Annual Report and Financial Statements For the year ended 31 December 2014
44
Takaful General Business Revenue Account
General Accident
Total Total
Motor Fire
Marine 31 Dec,
2014 31 Dec
2013 N' 000 N' 000 N' 000 N' 000 N' 000 N' 000
Income Direct premium 45,726 6,179 15,202 1,686 68,792 47,035 Inward premium - - - - - - Gross premium written 45,726 6,179 15,202 1,686 68,792 47,035 (Increase)/decrease in unearned premium 1,935 261 643 71 2,911 (30,607)
Gross premium earned 47,661 6,441 15,845 1,757 71,704 16,428
Net premium earned 47,661 6,441 15,845 1,757 71,704 16,428 Total income 47,661 6,441 15,845 1,757 71,704 16,428
Expenses Gross Claims paid 15,829 - 2,682 - 18,511 3,930 Increase in outstanding claims provision Gross claims incurred 15,829 - 2,682 - 18,511 3,930 Reinsurance claims recoveries Net claims incurred 15,829 - 2,682 - 18,511 3,930
Acquisition cost 5,951 804 1,978 219 8,953 3,878 Maintenance cost - - - - - -
Underwriting expenses 5,951 804 1,978 219 8,953 3,878
Total Expenses 21,780 804 4,660 219 27,464 7,808
Underwriting profit/(loss) 25,881 5,637 11,185 1,538 44,240 8,620

CORNERSTONE INSURANCE PLC
Consolidated Annual Report and Financial Statements For the year ended 31 December 2014
45
Takaful Life Business
2014 2013 Total Total N' 000 N' 000
Income Gross premium written 291,352 181,235 Investment linked products (286,740) (178,526)
Gross premium written 4,612 2,709 Unearned premium - - Net Premium 4,612 2,709 Reinsurance cost - -
Underwriting expenses (13,989) (8,612) Underwriting profit (9,377) (5,903)

CORNERSTONE INSURANCE PLC
Consolidated Annual Report and Financial Statements For the year ended 31 December 2014
46
Consolidated and Separate Statement of Financial Position As at 31 December 2014
GROUP
NON-LIFE LIFE TAKAFUL CAML LEASING CONSOLIDATION ADJUSTMENTS Group
2014 2013 2014 2013 2014 2013 2014 2013 2014 2013 2014 2013 2014 2013N'000 N'000 N'000 N'000 N'000 N'000 N'000 N'000 N'000 N'000 N'000 N'000 N'000 N'000
ASSETS
Cash and cash equivalents 1,909,148 2,349,605 1,307,885 1,224,188 208,817 141,449 11,706 118,163 39,849 23,021 (399,875) (297,686) 3,077,531 3,558,740
Financial assets 3,555,835 2,532,383 2,794,933 1,957,005 139,796 90,643 29,014 165,789 45,642 326,568 (45,630) (402) 6,519,589 5,071,987
Trade receivable 1,472 56,613 30,128 - - - - - - - - 31,600 56,613
Receivables and prepayment 295,430 434,942 1,310,430 1,110,637 - 6,098 26,652 38,728 426 891 (1,456,277) (1,361,841) 176,672 229,457
Other Asset 5,496 2,131 5,496 2,131
Reinsurance assets 1,414,753 1,786,186 286,543 435,356 - - - - - - - - 1,701,296 2,221,541
Deferred acquisition cost 227,131 245,488 - - - - - - - - - 227,131 245,488
Investment in subsidiaries - 43,675 - 16,204 - - - - - - (59,879) - -
Finance lease receivables - - - - - - - - 21,726 110,595 - - 21,726 110,595
Investment properties 518,900 512,900 784,780 775,780 - - - - - - - - 1,303,680 1,288,680
Property, plant and equipment 647,184 567,759 20,352 23,967 6,027 7,129 - - 2,252 3,575 - - 675,814 602,431
Intangible assets 18,287 26,333 12,740 - - - - - - - - - 31,027 26,333
Deferred tax assets 2,627 62,122 173,176 108,600 - - 64,657 65,273 19,876 2,727 - (2,158) 260,336 236,562
Statutory deposits 300,000 300,000 200,000 200,000 - - - - - - - - 500,000 500,000
Total Assets 8,896,264 8,920,137 6,920,967 5,851,737 354,639 245,319 132,029 387,953 129,781 467,377 (1,901,782) (1,721,966) 14,531,899 14,150,558
Liabilities: - -
Investment contracts at fair value - 1,076,998 1,106,001 245,474 197,048 - - - - - -
1,322,472 1,303,049
Investment contract liabilities 3,202,907 3,461,635 1,170,505 1,036,001 27,695 30,607 - - - - - -
4,401,107 4,528,243
Trade Payables 117,795 505,145 57,961 13,193 - - - - - - - -
175,756 518,337
Other payables 1,793,491 1,462,605 275,781 152,503 32,039 - 4,529 361,709 607,358 483,322 (1,937,083) (1,882,522) 776,115 577,614
Trust and Managed Funds - - - - - - - - - - - 199,749 - 199,749
Income tax payable 29,424 7,384 57,773 82,883 - 7,117 966 12,326 308 1,177 - -
88,471 110,887
Deferred tax liabilities - - - - - - - - - - - -
- - Employees retirement benefit obligations 8,024 8,024 120 57 - - - 636 3,421 1,648
- -11,565 10,251
5,151,641 5,444,793 2,639,138 2,390,638 305,208 234,772 5,495 374,671 611,087 486,147 (1,937,083) (1,682,773) 6,775,486 7,248,130
Total Equity 7,756,413 6,902,428
Total Liabilities and equities 14,531,899 14,150,558

CORNERSTONE INSURANCE PLC
Consolidated Annual Report and Financial Statements For the year ended 31 December 2014
47
Consolidated Statement of Cash flows 2014 2013 2014 2013
Note Group Group Company CompanyN' 000 N' 000 N' 000 N' 000
Cash flows from operating activities:
Profit for the year 946,842 860,363 1,282,346 931,859Taxation 34 91,208 9,844 107,819 8,756
Profit before taxation 1,037,690 870,207 1,390,165 940,615Adjustments to reconcile profit after taxation to net cash flow from operating activities: Depreciation on property and equipment 14 120,057 74,745 118,649 74,717Finance cost 33 15,173 37,098 14,027 Provision for retirement benefit obligations - 32,551 - 31,627Amortization of computer software 15 14,975 13,853 14,975 13,853Increase in provision for unexpired risks 26 24,868 690,486 24,868 690,486Under provision in prior year tax 34 (52,588) - (51,801) -Allowance for impairment on receivables 31 26,308 126,117 26,308 -Allowances for impairment on loans and advances 31 341,882 Provision/(write back) for diminution in value of investments 31 - - -Allowance for impairment on subsidiary - - 59,879 -Allowances on advances under finance lease 31 74,896 (160,189) - -Dividend income 30 (462,076) (325,599) (451,916) (311,312)Fair value changes in investment property (15,000) (12,900) (15,000) (12,900)Fair value changes in Financial assets (144,130) (688,846) (144,130) (688,846)Miscellaneous income (60,246) - (78,893) -Interest income 30 (596,828) (541,629) (546,412) (471,196)Foreign exchange (gain)or loss 30 (812,126) (4,583) (812,126) (4,583)(Profit) on sale of property and equipment - (14,622) - (14,622)
Net cash flows from operating activities before changes in operating assets/liabilities (487,145) 96,690 (451,408) 247,839
(Increase)/decrease in operating assets: Fair value of AFS financial asset (92,497) - (91,797) -Trade debtors 25,013 494,586 25,013 494,586Finance lease receivables 13,972 (163,790) - -Deferred acquisition cost 18,357 (113,280) 18,357 (113,280)Receivables and prepayments 26,476 269,503 141,940 75,256Other assets (3,365) - (3,365) -Reinsurance assets 520,245 (640,205) 520,245 (745,930)
Increase/(decrease) in operating liabilities: Obligation under finance lease - (758) - (758)Outstanding claims (127,136) 874,310 (127,136) 874,310Trade payables (342,581) 341,667 (342,581) 341,667Other payables 198,501 (13,201) 194,883 (66,732)Net Investment Contract Liabilities 19,423 73,092 19,423 73,092Employee retirement benefit obligation 1,314 (60,821) 178 (61,262)Trust and managed funds (199,749) (148,386) - -
Cash (used in)/ generated from operations (429,170) 1,009,407 (96,240) 1,118,788 Income tax paid 22a (137,377) (44,257) (115,970) (27,212)
Net cash (used in)/generated by operating activities (566,547) 965,150 (212,216) 1,091,576
Cashflows from investing activities: Additions to intangible assets 15 (19,669) (3,167) (19,669) (3,167)Proceeds from sale of property and equipment 11,161 22,148 11,161 22,148Purchase of property and equipment 14 (204,600) (126,059) (204,516) (126,024)Purchase of financial assets (745,284) (876,785) (862,481) (983,675)Dividends received 30 462,076 325,599 451,916 311,311Interest received 31 596,828 541,629 546,412 471,196
Net cash (used in)/generated by investing activities 100,511 (116,635) (77,177) (308,211)
Cashflows from financing activities: Finance cost 33 (15,173) (37,098) - -
Net cash (used in)/generated by financing activities (15,173) (37,098) - -
Net increase in cash and cash equivalents (481,209) 811,418 (289,393) 783,366Cash and cash equivalents, beginning of year 3,558,740 2,747,322 3,715,242 2,931,876
Cash and cash equivalents, end of year 5 3,077,531 3,558,740 3,425,849 3,715,242

CORNERSTONE INSURANCE PLC
Consolidated Annual Report and Financial Statements For the year ended 31 December 2014
48
Notes to the consolidated financial statements
4 Operating segments IFRS 8 requires operating segments to be identified on the basis of internal reports about components
of the Group that are regularly reviewed by the Chief Executive to allocate resources to the segments and to assess their performance.
The Group’s reportable segments under IFRS 8 are therefore identified as follows:
• Non-life insurance; • Life insurance; • Halal Islamic Insurance; • Asset management; and • Cornerstone Leasing and Investment
The other segment includes corporate expenses and other activities not related to the core business
segments and which are not reportable segments due to their immateriality. Certain expenses, finance costs and taxes are not allocated across the segments.
The accounting policies of the reportable segments are the same as the Group’s accounting policies.
Segment profit represents the profit earned by each segment without allocation of central corporate expenses, certain finance costs and tax expense. This is the measure reported to the Group’s Chief Executive for the purposes of resource allocation and assessment of segment performance.

CORNERSTONE INSURANCE PLC
Consolidated Annual Report and Financial Statements For the year ended 31 December 2014
49
Notes to the consolidated financial statements
4.a The following is an analysis of the Group’s revenue and result by reportable segment in 2014
2014
Non-life Life
Halal
Takaful Assets
Mgt Cornerstone
Leasing Eliminations Consolidated N'000 N'000 N'000 N'000 N'000 N'000 N'000
Income:Gross premium income 3,748,896 1,389,664 73,406 - - - 5,211,966 Net changes in unearned premiums 49,296 (77,075) 2,911 - - (24,868) Net insurance premium income 3,798,192 1,312,589 76,317 - 5,187,098 Insurance premium ceded to reinsurers (1,458,291) (380,094) - - - (1,838,385) Changes in insurance premium ceded to reinsurers - - - - - - Net Insurance Premium ceded to reinsurers (1,458,291) (380,094) - - - - (1,838,385) Net insurance premium revenue 2,339,901 932,495 76,317 - - - 3,348,713
Fees and commission income 171,629 81,287 - - - - 252,916 - - -
Net Income 2,511,530 1,013,782 76,317 - - - 3,601,629 Insurance claims and benefits paid- Gross (including loss adjustment expenses) (1,078,538) (625,093) (18,511) - - -
(1,722,142)
Insurance claims recoverable from reinsurance Companies 415,841 72,156 - - - - 487,997
Net Claims expenses (662,697) (552,937) (18,511) - - - (1,234,145)
Underwriting expenses-Gross (735,022) (86,258) (22,942) - - - (844,222) Deferred underwriting expenses (18,357) - - - - - (18,357) Net Underwriting cost (753,379) (86,258) (22,942) - - - (862,579)

CORNERSTONE INSURANCE PLC
Consolidated Annual Report and Financial Statements For the year ended 31 December 2014
50
Notes to the consolidated financial statements
Reportable segment (Cont’d)
2014
Non-life Life
Halal
Takaful Assets Mgt Cornerstone
Leasing Eliminations Consolidated N'000 N'000 N'000 N'000 N'000 N'000 N'000
Underwriting results 1,095,453 374,587 34,863 - - 1,504,904 Investment income 570,505 326,719 25,413 91,762 30,387 (45,630) 999,156 Fair value changes in investment property 6,000 9,000 - - - - 15,000 Fair value changes in financial assets-FVTPL 69,897 73,470 763 144,130
Exchange gain 460,005 346,071 6,049 812,126 Other operating income 73,014 17,118 - 161 17,952 (47,997) 60,248
Surlus transfer from investment contract - 5,745 - - - - 5,745 2,274,874 1,152,711 67,088 91,923 48,339 (93,627) 3,541,308
Allowance for impairment on receivables (62,455) (23,733) - (700) (416,077) 59,897 (443,086) Management expenses (1,720,496) (233,233) (39,326) (4,240) (34,037) - (2,031,332) Finance costs (12,198) (1,827) - (1,839) (61,333) 47,997 (29,200) Employee benefit expenses - - - - - - Total Expenses (1,795,149) (258,793) (39,326) (6,779) (511,447) 107,876 (2,503,618)
Segment profit or loss before taxation 479,725 893,918 27,763 85,144 (463,108) 14,249 1,037,690
Taxation (88,919) (18,899) - (2,391) 19,001 - (91,208)
Segment profit or loss after tax 390,806 875,019 27,763 82,543 (444,107) 14,249 946,842
The accounting policies of the reportable segments are the same as the Group’s accounting policies.
Segment result represents the result of each segment without allocation of certain expenses, finance costs and income tax. This is the measure reported to the Group’s Chief Executive Officer for the purpose of resource allocation and assessment of segment performance.

CORNERSTONE INSURANCE PLC
Consolidated Annual Report and Financial Statements For the year ended 31 December 2014
51
Notes to the consolidated financial statements
Reportable segment (Cont’d)
4b The following is an analysis of the Group’s revenue and result by reportable segment in 2013
2013
Non-life Life Life
Halal Takaful
Assets Mgt
Cornerstone Leasing Eliminations Consolidated
N'000 N'000 N'000 N'000 N'000 N'000 N'000 Income: Gross written premiums 3,763,830 1,878,734 181,235 - - - 5,823,799 Less: Investment contracts - (379,085) (131,491) - - - (510,576) Gross premium income 3,763,830 1,499,649 49,744 - - - 5,313,223 Net changes in unearned premiums (586,289) (85,669) (18,529) - - - (690,486) Net insurance premium income 3,177,541 1,413,980 31,215 - 4,622,737 Insurance premium ceded to reinsurers (1,642,569) (748,431) - - - (2,391,000)
Changes in insurance premium ceded to reinsurers 455,307 - - - 455,307
Net Insurance Premium ceded to reinsurers (1,187,262) (748,431) - - - - (1,935,693)
Net insurance premium revenue 1,990,279 665,549 31,215 - - - 2,687,044
Fees and commission income 164,877 71,203 - - - - 236,080 - - - - - -
Net Income 2,155,156 736,752 31,215 - - - 2,923,124 Insurance claims and benefits paid- Gross (including loss adjustment expenses) (1,412,508) (1,384,443) (4,030) - - -
(2,800,981)
Insurance claims recoverable from reinsurance Companies 589,611 1,052,920 - -
1,642,531
Net Claims expenses (822,897) (331,523) (4,030) - - - (1,158,450)

CORNERSTONE INSURANCE PLC
Consolidated Annual Report and Financial Statements For the year ended 31 December 2014
52
Notes to the consolidated financial statements
Reportable segment (Cont’d)
2013
Non-life Life
Halal
Takaful Assets
Mgt Cornerstone
Leasing Eliminations Consolidated
N'000 N'000 N'000 N'000 N'000 N'000 N'000 Underwriting expenses-Gross (646,326) (239,465) (12,390) (898,182) Deferred underwriting expenses - Net Underwriting cost (646,326) (239,465) (12,390) - - - (898,182)
Underwriting results 685,933 165,764 14,795 - - - 866,492
Investment income 455,859 351,488 17,941 41,254 101,975 - 968,517 Fair value changes in investment property 12,900 12,900 Fair value changes in financial assets-FVTPL 396,453 292,393 688,846
Net Realisable gain 36,076 81 (191) 35,966 Other operating income 39,409 6,208 - 882 245 - 46,744
1,626,630 815,934 32,736 41,945 102,220 - 2,619,465
Allowance for impairment on receivables (1,217) (124,900) (126,117) Management expenses (1,336,332) (177,331) (9,013) (3,305) (47,993) (1,573,974) Finance cost (11,511) (499) (9,182) (27,976) - (49,167) Employee benefit expenses - - - - Total Expenses (1,347,843) (177,830) (9,013) (13,704) (200,869) - (1,749,258)
Segment profit or loss before taxation 278,787 638,104 23,723 28,241 (98,649) - 870,207 Taxation 59,142 (67,898) - (560) (529) (9,844) Segment profit or loss after tax 337,929 570,206 23,723 27,681 (98,778) - 860,363
Segment result represents the result of each segment without allocation of certain expenses, finance costs and income tax. This is the measure reported to the Group’s Chief Executive Officer for the purpose of resource allocation and assessment of segment performance.

CORNERSTONE INSURANCE PLC
Consolidated Annual Report and Financial Statements For the year ended 31 December 2014
53
Notes to the consolidated financial statements
4.c Revenue from major products and services The Group’s revenue from major products and services is disclosed in the segment revenue
tables. 4.d Geographical information The Group’s revenue and information about its segment net assets by geographical location are as
follows:
Revenue Net
assets
2014 2013 2014 2013 N'000 N'000 N'000 N'000 Within Nigeria 5,922,857 5,823,799 7,756,413 6,902,428 Outside Nigeria - - - - 5,922,857 5,823,799 7,756,413 6,902,428 4.e Information about major customers The Group does not derive revenue from an individual policyholder or intermediary that represents
10% or more of the groups total revenue. 5 Cash and cash equivalents Group Company 2014 2013 2014 2013 N'000 N'000 N'000 N'000 Cash 794 1,025 744 975
Short-term deposits (including demand and time deposits) 3,076,737 3,557,715 3,425,105 3,714,267
3,077,531 3,558,740 3,425,849 3,715,242
Short–term deposits are made for varying periods of between one day and three months depending on the immediate cash requirements of the Group. All deposits are subject to an average variable interest rate of 13% (2013: 13%).
The carrying amounts disclosed above reasonably approximate fair value at the reporting date.

CORNERSTONE INSURANCE PLC
Consolidated Annual Report and Financial Statements For the year ended 31 December 2014
54
Notes to the consolidated financial statements
6 Financial assets Group Company 2014 2013 2014 2013 N'000 N'000 N'000 N'000 6.a Classification – carrying
amount
Available-for-sale investments (AFS)
Carried at fair value(listed security)
528,999
121,970 520,130 112,401
Carried at fair value (unlisted security) (See note 6a(ii))
194,276
123,143
194,276
123,143
Carried at cost (unlisted securities) (See note 6a (i))
764,836
605,336 764,836 605,336
1,488,111 850,449 1,479,242 840,880 Fair value through profit or loss
(FVPT)
Unlisted securities (6a (ii) 3,845,883 3,066,842 3,891,513 2,936,024 Loans and receivables
investments carried at amortised cost (6a (iii) 1,185,595 1,154,696 1,199,811 803,127
6,519,589 5,071,987 6,490,566 4,580,031 6a(i) Details of unlisted securities
carried at cost include: CAPIC(see note i below) 665,432 468,428 665,432 468,428 Nigeria Oil & Gas Pool (NAL) 5,258 5,258 5,258 5,258 Nigeria Liability Insurance Pool 6,646 6,646 6,646 6,646 OAK Pension Limited 50,000 50,000 50,000 50,000 Sterling Assurance 37,500 37,500 37,500 37,500 HALAL TAKAFUL - 37,504 - 37,504 764,836 605,336 764,836 605,336 The above financial assets have
been assessed for impairment and there was no objective evidence that the asset is impaired.
6a(ii) Details of unlisted securities
carried at fair value includes: Fair value MTN Nigeria Communication 3,845,883 3,066,842 3,891,513 2,936,024 CONSOLIDATED BREWERIES 30,994 16,743 30,994 16,743 WAMCO Nigeria Limited 140,000 104,000 140,000 104,000 Food concepts Limited 1,200 2,400 1,200 2,400 ARM ETHICAL FUND-TAKAFUL 22,082 - 22,082 - 194,276 123,143 194,276 123,143

CORNERSTONE INSURANCE PLC
Consolidated Annual Report and Financial Statements For the year ended 31 December 2014
55
Notes to the consolidated financial statements 6a(iii) Details of loan and receivables includes: Bonds 1,030,134 748,864 1,009,989 723,863 Loans to policyHolder 109,822 79,264 109,822 79,264 Advances and LPO financing 513,638 452,685 - - 1,653,594 1,280,813 1,119,811 803,127 Impairment (467,999) (126,117) - - 1,185,595 1,154,696 1,119,811 803,127 Impairment provision 126,117 - - - At 1 January Addition during the year(note 31) 341,882 126,117 - - At 31 December 467,999 126,117 - -
i This represent the company's investment in CAPIC, a real estate investment fund

CORNERSTONE INSURANCE PLC
Consolidated Annual Report and Financial Statements For the year ended 31 December 2014
56
Notes to the consolidated financial statements
6. Financial asset (Cont’d) 6a(iii) Movement in financial assets
Opening balance Additions
Maturities and
redemptions Impairment Interest Exchange difference
Fair value gains/((loss)
Closing balance
N’000 N’000 N’000 N’000 N’000 N’000 N’000 N’000 Available-for-sale investments (AFS)
At fair value- General 55,263 252,414 - (66,096) - - - 241,581 At fair value- Life 40,773 262,228 - (66,743) - - - 236,258 At fair value- Takaful 16,365 25,926 - - - - 42,291 Subsidiary 9,569 - - (700) - - - 8,869 121,970 540,568 - (133,538) - - - - 528,999 Carried at cost General business 467,666 87,301 - - - 89,452 - 644,419 Life businesss 100,166 - - - - 20,251 - 120,417 Takaful 37,504 - (37,504) - - - - 605,336 87,301 (37,504) - - 109,703 - 764,836 Carried at fair value (see note 6a(ii) General business 106,400 - - - - 34,800 - 141,200 Life businesss 16,743 7,100 - - - 7,151 - 30,994 Takaful - 22,082 - - - - - 22,082 123,143 29,182 - - - 41,951 - 194,276 Total 850,449 657,053 (37,504) (133,538) - 151,654 - 1,488,111 LOANS AND RECEIVABLES General business 378,350 356,965 (148,124) - 13,127 41,085 - 641,403 Life businesss 313,053 - - - 702 - - 313,755 Takaful 20,411 34,421 - - - - - 54,832 Loans to policyholders 79,264 30,558 109,822 Advances and LPO financing 452,685 60,953 513,638 Subsidiary 25,000 - (5,000) - 144 - - 20,144 1,268,763 482,897 (153,124) - 13,973 41,085 - 1,653,594 Fair value through profit or General business 1,511,710 - - - - 305,625 69,897 1,887,232 Life businesss 1,407,952 130,818 - - - 325,820 73,470 1,938,060 Takaful 16,362 - - - - 3,466 763 20,591 Subsidiary 130,818 - (130,818) - - - - 3,066,842 130,818 (130,818) - - 634,911 144,130 3,845,883

CORNERSTONE INSURANCE PLC
Consolidated Annual Report and Financial Statements For the year ended 31 December 2014
57
Notes to the consolidated financial statements
6.b Carrying amount at 31 December 2014 - Group
FINANCIAL INSTRUMENTS CLASSIFICATION
BUCKETS Fair Value Amortised Cost
Available for sale
Fair value through profit or
loss Loans and
Receivables Total N'000 N'000 N'000 N'000
Debt securities - Federal Government - - - -- State Government - - 573,548 573,548- Corporate - - 456,586 456,586
- Loans to policyholders 109,822 109,822 - Advances and LPO financing 45,639 45,639
- 1,185,595 1,185,595
Equities - Listed 528,999 - 528,999- Unlisted 959,112 3,845,883 4,804,995
1,488,111 3,845,883 - 5,333,994
Total financial assets 1,488,111 3,845,883 1,185,595 6,519,589
Within one year 1,488,111 - 155,461 1,488,111More than one year - 3,845,883 1,030,134 4,876,017
1,488,111 3,845,883 1,185,595 6,519,589

CORNERSTONE INSURANCE PLC
Consolidated Annual Report and Financial Statements For the year ended 31 December 2014
58
6b. Carrying amount at 31 December 2013 - Group
Debt securities - Federal Government - - - - State Government - - 632,049 632,049 - Corporate - - 116,815 116,815
- Loans to policyholders - - 79,264 79,264 - Advances and LPO financing - - 326,568 326,568
- 1,154,696 1,154,696
Equities - Listed 121,970 - 121,970 - Unlisted 728,479 3,066,842 3,795,321
850,449 3,066,842 - 3,917,291
Total financial assets 850,449 3,066,842 1,154,696 5,071,987
Within one year 850,449 - - 850,449More than one year - 3,066,842 1,154,696 4,221,538
850,449 3,066,842 1,154,696 5,071,987

CORNERSTONE INSURANCE PLC
Consolidated Annual Report and Financial Statements For the year ended 31 December 2014
59
6b. Carrying amount at 31 December 2014 - Company FINANCIAL INSTRUMENTS CLASSIFICATION BUCKETS Fair Value Amortised Cost
Available for sale
Fair value through
profit orloss
Loans and Receivables Total
N'000 N'000 N'000 N'000 Debt securities - Federal Government - - - - - - State Government - - 573,548 573,548 - Corporate - - 436,441 436,441 '-Individual loans 109,822 109,822 '-Loans and advances - 1,119,811 - - 1,119,811 Equities - Listed 194,276 - 194,276 - Unlisted 1,284,966 3,891,513 5,176,479 1,479,242 3,891,513 - - - 5,370,755 Total financial assets 1,479,242 3,891,513 1,119,811 - - 6,490,566 Within one year 1,479,242 1,479,242 More than one year 3,891,513 1,119,811 - - 5,011,324 1,479,242 3,891,513 1,119,811 - - 6,490,566

CORNERSTONE INSURANCE PLC
Consolidated Annual Report and Financial Statements For the year ended 31 December 2014
60
FINANCIAL INSTRUMENTS CLASSIFICATION BUCKETS Fair Value Amortised Cost
Available for sale
Fair value through
profit orloss
Loans and Receivables Total
N'000 N'000 N'000 N'000 6b. Carrying amount at 31 December 2013 - Company Debt securities - Federal Government - - - - - - State Government - - 620,000 620,000 - Corporate - - 103,863 103,863 -Loans to policyholders 79,264 79,264 - 803,127 - - 803,127 Equities - Listed 112,401 - 112,401 - Unlisted 728,479 2,936,024 3,664,503 840,880 2,936,024 - - - 3,776,904 Total financial assets 840,880 2,936,024 803,127 - - 4,580,031 Within one year 840,880 840,880 More than one year 2,936,024 803,127 - - 3,739,151 840,880 2,936,024 803,127 - - 4,580,031

CORNERSTONE INSURANCE PLC
Consolidated Annual Report and Financial Statements For the year ended 31 December 2014
61
Notes to the consolidated financial statements
Group Company2014 2013 2014 2013 N'000 N'000 N'000 N'000
7 Trade RecievableDue from policyholders 1,207,354 1,232,367 1,207,354 1,232,367Allowance for impairment (1,175,754) (1,175,754) (1,175,754) (1,175,754)
31,600 56,613 31,600 56,613
7.1 Impairment provision At 1 January 1,175,754 1,175,754 1,175,754 1,175,754Addition during the year(note 31) - - - -At 31 December 1,175,754 1,175,754 1,175,754 1,175,754
All insurance receivables are designated as trade receivables and their carrying value approximate value at the statement of financial position date. The premium outstanding as at statement of position date represent balance due from brokers which has being fully received as at 31 January, 2015.
8 Receivables and prepayments Group Company
2014 2013 2014 2013 N'000 N'000 N'000 N'000
Due from Subsidiaries - 33,110 152,425 339,942Other receivables 113,517 167,306 56,809 71,845Receivables from Meristem 19,973 - 19,973 -Prepaid insurance 29,969 17,186 29,969 17,186Investment in MV Exchange 10,000 10,000 10,000 10,000Rent prepayment 35,266 23,605 35,266 23,415Other prepayments 61,577 45,571 61,577 45,571
270,302 296,778 366,019 507,959Allowance for impairment (93,629) (67,321) (37,358) (11,050)
176,673 229,457 328,661 496,909
Within one year More than one year 270,302 296,778 366,019 507,959
- - - -270,302 296,778 366,019 507,959
The carrying amount is a reasonable approximation of fair value
Group Company2014 2013 2014 2013 N'000 N'000 N'000 N'000
8.1 Impairment provision At 1 January 67,321 108,577 11,050 45,846
Addition during the year (note 31) 26,308 - 26,308 -Write back - (41,256) - (34,796)At 31 December 93,629 67,321 37,358 11,050 Loan and advances represent short tenured (30-90 days) LPO Financing advanced by our subsidiary company, Cornerstone Leasing and Investment Limited to their customers in the ordinary course of their business
8b. Other assets represents stock of stationery held by the company as at 31 December, 2014.

CORNERSTONE INSURANCE PLC
Consolidated Annual Report and Financial Statements For the year ended 31 December 2014
62
Notes to the consolidated financial statements
9 Reinsurance assets Group Company 2014 2013 2014 2013 N'000 N'000 N'000 N'000
Reinsurer share of outstanding claims- General 581,688 1,032,719 581,688 1,032,719
Reinsurer share of outstanding claims- Life 113,923 144,212 113,923 144,212Reinsurer share of Incurred but not reported 162,494 117,693 162,494 117,693
Prepaid reinsurance- General 573,072 675,421 573,072 675,421Prepaid reinsurance- Life 172,620 - 172,620 -Reinsurance share of clams paid 433,154 587,151 433,154 587,151 2,036,951 2,557,196 2,036,951 2,557,196Allowance for impairment (reinsurance receivable) (335,655) (335,655) (335,655) (335,655)
1,701,296 2,221,541 1,701,296 2,221,541
Within one year 2,036,951 2,557,196 2,036,951 2,557,196More than one year provision for Reinsurance asset - - - -
2,036,951 2,557,196 2,036,951 2,557,196 9.1 Impairment provision
At 1 January 335,655 441,380 335,655 441,380Write back - (105,725) - (105,725)At 31 December 335,655 335,655 335,655 335,655
Reinsurance assets are valued after an allowance for their recoverability and the carrying amount is a reasonable approximation of fair value. Prepaid reinsurance represents deferred portion of reinsurance cost (reinsurance portion of unearned premium).
10 Deferred acquisition Charges
Deferred acquisition costs (DAC)
2014 2013N'000 N'000
At 1 January 2014 245,488 132,208Acquisition cost paid during the year 610,097 592,761Total acquisition cost 855,585 724,969Acquisition cost amortised(charged to statement of profit or loss) (628,454) (479,481)At 31 December 2014 227,131 245,488

CORNERSTONE INSURANCE PLC
Consolidated Annual Report and Financial Statements For the year ended 31 December 2014
63
Notes to the consolidated financial statements
11 Investment in subsidiaries Company
2014 2013 N'000 N'000
Cornerstone Assets Management Limited 202,232 202,232Cornerstone Leasing & Investment limited 59,879 59,879
262,111 262,111Movement in Impairment
At 1 January (202,232) (202,232)Additions - -Disposals - -Impairment losses/gain (59,879) -
At 31 December (262,111) 202,232
- 59,879 11.1 Other Information on subsidiaries
i. Cornerstone Leasing and Investment Limited commenced operation on 1 July,2004 as part of the ultimate parent-company's strategic plan to provide world class leasing services. The company was formerly a subsidiary of Cornerstone Asset Management Limited who later in 2009 transferred its shareholding in the Company to the ultimate parent, Cornerstone Insurance Plc. Cornerstone Leasing and Investment provides convenient asset acquisition options to both corporate organisations and individuals
ii. Cornerstone Asset Management Limited commenced operation in 1999 and provides services such as trusteeship, funds and asset management, portfolio management and financial advisory. The company is in the process of being wound-up based on the approval of the Board of Directors. The effect of the liquidation will be reflected 2015 Financial statements.
iii. In 2012 Investment in Cornerstone Asset Management was fully impaired to the tune of N202 million and in 2014 Cornerstone Leasing was impaired to the tune of N59.8million, due to LPO financing PAZ OIL LTD and NAXPRO ENERGY and SHIPPING COMPANY LTD which is doubtful of recovery.
11.2 Non-controlling interest Both subsidiaries are wholly owned by Cornerstone Insurance Plc as such there is no non-
controlling interest.

CORNERSTONE INSURANCE PLC
Consolidated Annual Report and Financial Statements For the year ended 31 December 2014
64
Notes to the consolidated financial statements
12 Finance lease receivables The Group entered into finance lease arrangements for certain of its equipments and motor
vehicles. All leases are denominated in Naira. The average term of finance leases entered into is 3 years.
Amounts receivable under finance leases.
Minimum Lease
Payments
Present Value of Minimum Lease
Payments 2014 2013 2014 2013N'000 N'000 N'000 N'000
Not later than one year Later than one year and not later than 5 years 229,309 246,547 227,495 241,467Later than 5 years - - - -
229,309 246,547 227,495 241,467Less: unearned finance income (1,814) (5,080)
227,495 241,467 227,495 241,467Allowance for uncollectible lease payments - Specific allowance (205,769) (130,872) - -
21,726 110,595 227,494 241,467
Impairment Allowance At 1 January 130,872 130,872Addition during the year (note 31) 74,896 -
At 31 December 205,768 130,872
13. Investment properties
2014 2013 2014 2013N'000 N'000 N'000 N'000
At 1 January 1,288,680 1,275,780 1,288,680 1,275,780Fair value gains 15,000 12,900 15,000 12,900
At 31 December, 2014 1,303,680 1,288,680 1,303,680 1,288,680
Investment properties are stated at fair value, which has been determined based on valuations performed by Jide Taiwo & Co (Estate Surveyors and Valuers -FRC/2012/0000000000254) as at 31 December 2014. The propety is located at Plot 2 Block 2, Chief Yesufu Abiodun way, Oniru Chieftancy Estate, Victoria Island Annex, Lagos. The valuer is an industry specialist in valuing these types of investment properties. The fair value is supported by market evidence and represents the amount at which the assets could be exchanged between a knowledgeable, willing buyer and a knowledgeable, willing seller in an arm’s length transaction at the date of valuation, in accordance with standards issued by the International Valuation Standards Committee. Valuations are performed on an annual basis and the fair value gains and losses are reported in profit or loss. The investment properties are in the name of Cornerstone Insurance PLC and are not in any way encumbered.

CORNERSTONE INSURANCE PLC
Consolidated Annual Report and Financial Statements For the year ended 31 December 2014
65
Notes to the consolidated financial statements
14 Property and equipment
14a Property and equipment- Group
Property Leasehold
Improvement Motor
Vehicles Equipment Furniture & Fittings Total
Cost: N'000 N'000 N'000 N'000 N'000 N'000 At 1 January 2014 475,113 1,275 312,070 247,608 76,928 1,112,994 Additions during the year 13,145 - 120,437 49,233 21,785 204,600 Disposals during the year - - (36,049) - - (36,049) At 31 December 2014 488,258 1,275 396,458 296,841 98,713 1,281,545 Accumulated Depreciation: At 1 January 2014 74,624 1,275 185,084 206,882 42,697 510,562 Charge for the year 10,580 - 60,647 23,069 25,761 120,057 Disposals - - (24,888) - - (24,888) At 31 December 2014 85,204 1,275 220,843 229,951 68,458 605,731 Carrying Amount: At 31 December 2014 403,054 - 175,615 66,890 30,255 675,814
At 31 December 2013 400,489 - 126,986 40,726 34,231 602,431
(i) Leased motor vehicles with net book values of N1.452 million (2013: N3.195million) are
included in the above property and equipment accounts. (ii) The Group had no capital commitments as at the balance sheet date (2013: Nil). (iii) No impairment assessment was performed during the year as there was no indication of
impairment on any of the assets in use by the group. 14 b Property and equipment- Company
Property Leasehold
ImprovementMotor
Vehicles Equipment Furniture & Fittings Total
Cost: N'000 N'000 N'000 N'000 N'000 N'000 At 1 January 2014 475,113 1,275 307,143 246,773 76,901 1,107,205Additions during the year 13,145 - 120,435 49,149 21,785 204,516Disposals during the year - (36,049) - - (36,049) At 31 December, 2014 488,258 1,275 391,529 295,922 98,686 1,275,672 Accumulated Depreciation: At 1 January 2014 74,624 1,275 183,709 206,054 42,687 508,349Charge for the year 10,580 - 59,272 23,050 25,746 118,649Disposals - - (24,888) - - (24,888) At 31 December, 2014 85,204 1,275 218,093 229,104 68,433 602,110 Carrying Amount: At 31 December, 2014 403,054 - 173,436 66,818 30,253 673,562 At 31 December 2013
400,489 - 123,434 40,719 34,214 598,856

CORNERSTONE INSURANCE PLC
Consolidated Annual Report and Financial Statements For the year ended 31 December 2014
66
Notes to the consolidated financial statements
15 Intangible assets - Group/company
2014 GROUP COMPANY N'000 N'000
Cost: At 1 January 2014 73,760 73,760Additions 19,669 19,669 At 31 December, 2014 93,429 93,429
Amortisation: At 1 January 2014 47,427 47,427Charge for the year 14,975 14,975At 31 December, 2014 62,402 62,402Carrying Amount: At 31 December, 2014 31,027 31,027At 31 December 2013 26,333 26,333
16 Statutory Deposits Group Company
2013 2012 2013 2012 N'000 N'000 N'000 N'000
Deposits with CBN 500,000 500,000 500,000 500,000
Analysis: Non-Life Business 300,000 300,000 300,000 300,000Life Business 200,000 200,000 200,000 200,000
500,000 500,000 500,000 500,000
In line with section 10 (3) of the Insurance Act of Nigeria 2003, a deposit of 10% of the regulatory share capital is kept with the Central Bank of Nigeria. The amount held will increase or decrease in relation to the amount of paid up share capital in issue. The cash amount held is considered to be a restricted cash balance.
17 Investment Contract Liabilities
Group Company
2014 2013 2014 2013 N'000 N'000 N'000 N'000
Financial guarantee contracts 1,322,472 1,303,049 1,322,472 1,303,049
- At 1 January 1,303,049 1,229,957 1,303,049 1,229,957 - Addition in the period 674,877 510,576 674,877 510,576 - Withdrawals (655,454) (437,484) (655,454) (437,484)
1,322,472 1,303,049 1,322,472 1,303,049
Current 1,322,472 1,303,049 1,322,472 1,303,049 Non-current - - - -
1,322,472 1,303,049 1,322,472 1,303,049

CORNERSTONE INSURANCE PLC
Consolidated Annual Report and Financial Statements For the year ended 31 December 2014
67
Notes to the consolidated financial statements
18 Insurance contract liabilities
18.a Carrying amount
Gross Reinsurers’ asset Net 2014 2013 2014 2013 2014 2013 N'000 N'000 N'000 N'000 N'000 N'000
Life: Participating life - Life Fund 734,060 663,385 172,620 138,998 561,440 524,387 - Claims Outstanding 428,703 371,274 113,923 144,212 314,780 227,062 Annuity Fund - - - Life Fund Annuity 7,742 1,342 - - 7,742 1,342 - Claims Outstanding - - - - - -
Total life 1,170,505 1,036,001 286,543 283,210 883,962 752,791
Non-life: Outstanding claims 1,328,590 1,622,943 581,688 859,702 746,902 763,241 IBNR 333,081 248,181 162,494 151,712 170,587 96,449
1,661,671 1,871,104 744,182 1,011,414 917,489 859,690
Unearned premiums 1,541,236 1,590,531 573,072 675,421 968,164 915,110 Unexpired risks 27,695 30,607 - - 27,695 30,607
1,568,931 1,621,138 573,072 675,421 995,859 945,717
Total non-life 3,230,602 3,492,242 1,317,254 1,686,835 1,913,348 1,805,407
Total liabilities 4,401,107 4,528,243 1,603,797 1,970,045 2,797,310 2,558,198
Within one year 4,401,107 4,528,243 1,603,797 1,970,045 2,797,310 2,558,198 More than one year - - - - - -
4,401,107 4,528,243 1,603,797 1,970,045 2,797,310 2,558,198

CORNERSTONE INSURANCE PLC
Consolidated Annual Report and Financial Statements For the year ended 31 December 2014
68
Notes to the consolidated financial statements
18 Insurance contract liabilities (Cont’d)
18.b Asset Hypothecation NON-LIFE LIFE Takaful POLICY
HOLDERS ANNUITY POLICY HOLDER
Policy Holders
Share holders TOTAL
N'000 N'000 N'000 N'000 N'000 N'000 Cash and cash Equivalents 1,824,213 - 1,177,096 208,818 215,722 3,425,849
- - - - Fair value through profit and loss 283,085 - 198,369 3,410,059 3,891,513 Available for sales at (Fair value)-unlisted 28,240 - - 22,081 143,954 194,275 Available for sales at cost -unlisted 128,883 - 2,811 633,142 764,836 Available for sales at fair value -listed 241,581 - 236,258 42,292 - 520,130 Loans and receivables investment carried at amortised cost 641,403 7,742 306,013 54,831 - 1,009,989 Investment in property 441,065 - 577,244 - 285,372 1,303,680 Rensurance assets 1,701,296 - - - - 1,701,296 Deferred acquisition cost 227,131 - - - - 227,131 Property, plant and equipment - - - - 673,562 673,562 Intangible assets - Software - - - - 31,027 31,027 Deferred tax assets - - - - 175,804 175,804 Statutory deposits - - - - 500,000 500,000 Trade receivable 1,473 - 30,127 - - 31,600 Other receivable and prepayment 300,926 - 143,053 - - 443,979
5,819,297 7,742 2,670,970 328,022 6,068,641 14,894,672
18c. Asset Hypothecation of insurance funds Insurance funds are represented by the above assets.
INSURANCE FUNDS NON- LIFE Annuity LIFE Takaful TOTAL N'000 N'000 N'000 N'000
Investment contact liabilities - - 1,049,303
273,169
1,322,472
Insurance contact liabilities 3,202,907 7,742
1,162,763
27,695
4,401,106
3,202,907 7,742
2,212,066
300,864
5,723,578
18d. Basis of valuation of Annuity fund
We have adopted IFRS 4 requirements in estimating the present value(at the review date) of of the future annuity payment obligations. We value each annuity policy using a monthly
discounted cash flow method. Income of N400, 887.00 realized asset on the annuity is included
In the interest income in note 30.

CORNERSTONE INSURANCE PLC
Consolidated Annual Report and Financial Statements For the year ended 31 December 2014
69
Notes to the consolidated financial statements
18. Insurance contract liabilities (Cont’d)
Valuation Methods and Assumptions
The provision for outstanding claims, including IBNR, was determined for each line of business on both gross and net of reinsurance basis. An accident year cohort was used to group claims to study the settlement pattern. In some cases, only the year of accidents or settlement was given and hence made it impossible to identify the exact period of the year when the accident or settlement was made.
However, where such cases arose, we have assumed that the accident or settlement was made in the same year.
We have carried out our calculations using the following four (4) approaches explained below;
The Basic Chain Ladder Method (BCL): The Basic Chain Ladder method forms the basics to the reserving methods explained below. Historical incremental claims paid were grouped into accident year cohorts by class of business - representing when they were paid after their accident year e.g. a year after 2008 etc. These cohorts are called loss development triangles.
The incremental paid claims are cumulated to the valuation date and projected to their expected ultimate claim estimate. The gross claim reserve is then derived from the difference between the cumulated paid claims and the estimated ultimate claim. For the more recent under developed years, the Bornheuter Ferguson method was used as a check on the reserves that were calculated using the Basic Chain Ladder Model. The appropriate loss ratio used is normally the average of fully developed historical years
The Inflation Adjusted Chain Ladder Method (IACL): Under this method, the historical paid losses are stripped off from inflationary effects using the corresponding inflation index in each of the accident years. We then estimate loss development ratio used to project the cumulative historical paid claims to their ultimate values for each accident year. The difference between the estimated ultimate values and the cumulative historical paid clams forms the expected gross claim reserves. These are then inflated by the corresponding inflation index from payment years to the future year of payment of the outstanding claims.
We have adopted the following official inflation index below
Inflation Table
Year Inflation Index
2008 6.60%2008 15.10%2009 13.90%2010 11.80%2011 10.30%2012 12.00%2013 8.00%2014 8.30%2015 11.00%

CORNERSTONE INSURANCE PLC
Consolidated Annual Report and Financial Statements For the year ended 31 December 2014
70
CORNERSTONE INSURANCE PLC
Consolidated Annual Report and Financial Statements For the year ended 31 December 2014
71
Notes to the consolidated financial statements
18. Insurance contract liabilities (Cont’d)
The calculations are also on two bases; • By discounting the claims estimated to the valuation date at a discount rate of 14.5% p.a. • With no discounting. Expected Loss Ratio: This method is simple and gives an approximate estimate. We adopted this method as a check on our ultimate projections and also where the volume of data available is too small to be credible when using a statistical approach. Under the method, we obtained the Ultimate claims by studying the historical loss ratios, investigating any differences and using judgments to derive a loss ratio. Paid claims already emerged is then deducted for from the estimated Ultimate claims to obtain our reserves Frequency and Severity Method (Average Cost per claim). This method investigates the trend of the claim frequency and average cost per claim for each accident year. An Average of the fully run off accident years is used as a guide on the ultimate claim frequency and ultimate average cost which is then adopted for the accident years that are not fully run off. Large losses distorting the claims payment trend were excluded from all our chain ladder projections and analyzed separately using the Average Cost per claim method. Unearned Premium Reserve (UPR): We have calculated each policy’s unexpired insurance period (UPR) as the exact number of days of insurance cover available after the review date and calculated the UPR as the annualized premium * (UP)/policy duration Unexpired Risk Reserve (URR): The URR is estimated by multiplying the loss ratio by the unexpired premium (UP). This is the indication of the cost of the future claims cost and all expenses expected to be incurred in the future by the unexpired portion of existing policies. Additional Unexpired Risk Reserve (AURR): This is defined as the max (0, URR-UPR). It is the additional reserve calculated when we expect a loss to occur. Assumptions underlying the Valuation Methods • Policies are written uniformly throughout the year for each class of business. • Claims occur uniformly throughout the year for each class of business. This implies that claims occur on average halfway through year. • Our methods assume the future claims follow a regression pattern from the historical data
Hence payment patterns will be broadly similar in each accident year. The proportionate increase in the known cumulative payments from one development year to the next is used to calculate the expected cumulative payments for the future development periods. • An implicit assumption of the chain ladder is that weighted past average inflation will remain
unchanged in to the future. • We assume gross claim amount includes all related claim expenses. If this is not the case, we
will hold a separate reserve to cover claim expenses. • The UPR is calculated on the assumption that risk will occur evenly during the duration of the
policy. • Under the Average Cost per claim method, we assumed prior year 2012 are fully developed

CORNERSTONE INSURANCE PLC
Consolidated Annual Report and Financial Statements For the year ended 31 December 2014
72
Notes to the consolidated financial statements
18. Insurance contract liabilities (Cont’d)
CUMMULATIVE CLAIMS DEVELOPMENT PATTERN General Accident Incremental Chain ladder-Yearly Projections Accident year 1 2 3 4 5 6 7
N N N N N N N 2008 16,418,931 75,046,539 42,070,960 14,513,971 4,767,294 2,365,657 1,474,342 2009 39,260,547 107,669,674 20,060,848 411,167 22,902,103 4,368,037 - 2010 67,895,895 101,458,587 6,813,532 8,404,819 6,237,643 - - 2011 47,521,380 24,627,857 42,192,413 3,835,355 - - - 2012 94,120,598 108,318,730 27,902,217 - - - - 2013 47,791,778 101,889,354 - - - - - 2014 237,978,121 - - - - - -
Fire Incremental Chain ladder-Yearly Projections Accident year 1 2 3 4 5 6 7
N N N N N N N
2008 31,055,569 127,974,746 101,393,998 4,090,100 388,690 30,160 - 2009 28,361,047 93,496,860 7,614,401 793,149 233,050 - - 2010 146,459,687 88,575,477 159,795 3,079,062 193,049 - - 2011 170,910,775 11,508,226 9,534,850 2,263,873 - - - 2012 82,972,713 223,521,533 103,142,434 - - - - 2013 53,755,545 77,035,566 - - - - - 2014 52,281,397 - - - - - -
Motor Incremental Chain ladder-Yearly Projections Accident year 1 2 3 4 5 6 7
N N N N N N N
2008 16,150,472 256,408,641 8,646,410 1,773,851 2,459,756 - - 2009 147,098,188 140,121,898 33,075,560 5,863,573 - - - 2010 261,015,144 149,181,732 11,351,967 1,780,976 - - - 2011 236,773,927 77,329,273 7,647,146 427,543 - - - 2012 244,880,924 137,026,323 842,608 - - - - 2013 270,193,369 102,542,176 - - - - - 2014 325,534,238 - - - - - -
Notes to the consolidated financial statements

CORNERSTONE INSURANCE PLC
Consolidated Annual Report and Financial Statements For the year ended 31 December 2014
73
18. Insurance contract liabilities (Cont’d)
Marine Incremental Chain ladder-Yearly Projections Accident year 1 2 3 4 5 6 7
N N N N N N N
2008 3,029,957 44,133,185 2,330,969 442,346 - - - 2009 5,037,147 14,673,830 7,744,477 10,844,813 2,851,326 - - 2010 29,155,382 20,768,179 4,561,020 6,072,329 656,113 - - 2011 12,660,718 6,126,563 4,976,720 23,135,093 - - - 2012 30,116,211 24,416,214 91,088,616 - - - - 2013 29,124,153 62,852,556 - - - - - 2014 43,607,891 - - - - - -
Oil & Gas Incremental Chain ladder-Yearly Projections Accident year 1 2 3 4 5 6 7
N N N N N N N
2008 - - 1,230,949 1,942,980 - 314,095 - 2009 - 1,555,421 2,345,880 - 9,729,186 19,750 - 2010 882,205 3,516,870 - 257,627 42,444 - - 2011 38,373,156 41,800 30,990,391 176,534,700 - - - 2012 2,131,669 128,400,384 33,271,152 - - - - 2013 15,518,228 30,148,441 - - - - - 2014 6,874,494 - - - - - -
19 Trade payables Group Company
2014 2013 2014 2013 N'000 N'000 N'000 N'000
Due to policyholders -Arising out of reinsurance 175,756 518,337 175,756 518,337
Within one year 175,756 518,337 175,756 518,337More than one year - - - -
175,756 518,337 175,756 518,337

CORNERSTONE INSURANCE PLC
Consolidated Annual Report and Financial Statements For the year ended 31 December 2014
74
Notes to the consolidated financial statements
20 Other payables
Deposits received from policy holders 32,896 52,895 32,896 52,895Accrued expenses 279,719 177,649 279,719 166,458Stale cheques 140,212 113,852 140,212 113,852Payable to staff 23,651 3,058 23,651 3,058 National Housing Funds 4,817 4,860 4,817 4,860PAYE 2,923 12,911 2,923 12,465Witholding Tax 29,247 19,737 29,247 19,737Unallocated premium 110,830 142,256 110,830 142,256
Honeywell Oil and Gas ltd 37,855 - 37,855 - SO&U SAACHI 4,967 - 4,967 4,967 Ecowas Brown Card 6,059 - 6,059 6,059 Forte Asset Mgt 7,028 - 7,028 -
Other liabilities 95,911 50,396 62,975 32,715776,115 577,614 743,179 548,296
21 Trust and managed fund - 199,749 - -
Trust and managed funds consist of monies held by the Company as Trust Manager on behalf of third party financiers
22 a Income taxes Group Company 2014 2013 2014 2013 N'000 N'000 N'000 N'000
a) Per Statement of Profit or Loss and Other Comprehensive Income: Income tax based on the taxable profit/loss for the year 101,059 37,073 98,999 35,985Education tax - 1,378 - 1,378Information technology development levy (NITDA) 13,902 6,185 13,902 6,185Current tax charge/(Income) for the year 114,961 44,636 112,901 43,548Deferred taxation (23,753) (34,792) (5,082) (34,792)Income tax expense 91,208 9,844 107,819 8,756
b) Current Tax Liabilities/(Assets) as per Statement of Financial Position: At 1 January 110,887 110,508 90,268 73,932Charge for the year 114,961 44,636 112,901 43,548Payment during the year (137,377) (44,257) (115,970) (27,212)At 31 December 88,471 110,887 87,199 90,268
The charge for income tax in these financial statements is based on the provisions of the Companies Income Tax Act, CAP C21 LFN 2004 as amended and Education Tax Act, CAP E4 LFN 2004. The company does not have education tax because it does not have assessable profit.

CORNERSTONE INSURANCE PLC
Consolidated Annual Report and Financial Statements For the year ended 31 December 2014
75
Notes to the consolidated financial statements 22b Deferred Taxation Deferred income tax assets and liabilities are offset when there is a legally enforceable right to offset current
tax assets against current tax liabilities and when the deferred income taxes assets and liabilities relate to income taxes levied by the same taxation authority on either the taxable entity or different taxable entities where there is an intention to settle the balances on a net basis. The offset amounts are as follows:
Group Company 2014 2013 2014 2013 N'000 N'000 N'000 N'000
Deferred tax assets: – Deferred tax asset to be recovered after more than 12 months - - - -– Deferred tax asset to be recovered within 12 months 260,336 236,562 175,804 170,722
260,336 236,562 175,804 170,722
The net movement on the deferred income tax account is as follows:
Group Company 2014 2013 2014 2013 N'000 N'000 N'000 N'000
At 1 January 236,583 201,770 170,722 136,240Charge to profit or loss 23,753 34,792 5,082 34,792At 31 December 260,336 236,562 170,804 170,722 The charge for income tax in these financial statements is based on the provision of the Companies income Tax Act CAP C21 LFN 2004 as amended and Education Tax Act. CAP E4 LFN 2004.
23 Employees' retirement obligations
Group Company 2014 2013 2014 2013 N'000 N'000 N'000 N'000
Pensions (outstanding liability) 11,565 10,251 8,145 7,967Pension: At January 10,251 38,521 7,967 37,602Pension charge for the reporting period 44,963 32,551 42,542 31,627Payment made during the year (43,649) (60,821) (42,364) (61,262)Net Employees' Retirement Obligations 11,565 10,251 8,145 7,967 The Company operates defined contribution pension plan based on the New Pension Reform Act 2004. All pension contributions are remitted to the relevant registered PFAs
24 Share capital and share premium Issued capital comprises: 2014 2013
N'000 N'000 8,820,010,000 fully paid ordinary shares of 50k each
4,410,005 4,410,005

CORNERSTONE INSURANCE PLC
Consolidated Annual Report and Financial Statements For the year ended 31 December 2014
76
Notes to the consolidated financial statements
24a Share premium
At 31 December 2014 1,947,166 1,947,166
24b Treasury shares
At 31 December 2014 48,175 48,175
Group Company 2014 2013 2014 201325a Contingency reserves N'000 N'000 N'000 N'000
At 1 January 1,148,801 975,978 1,148,801 975,978Transfer from retained earnings 199,969 172,823 199,969 172,823
At 31 December 1,348,770 1,148,801 1,348,770 1,148,801
25b Retained earnings
At 1 January (555,369) (1,257,509) (491,532) (1,265,168)Transfer to contingency reserves (199,969) (172,823) (199,969) (172,823)Statement of Comprehensive income 853,985 874,963 1,190,549 946,459
At 31 December 98,647 (555,369) 499,048 (491,532)
25c The Directors are proposing a dividend of 2 kobo per share (2013 : Nil) which will absorb an estimated N176.4million from retained earnings.
The dividend has not been provided for and withholding tax will be deducted at the appropriate rate when payment is made.
Group Company 2014 2013 2014 2013 26 Net insurance premium income N'000 N'000 N'000 N'000
Non-life insurance premiums 3,748,896 3,763,830 3,748,896 3,763,830Life insurance premiums 1,389,664 1,499,649 1,389,664 1,499,649Halal Takaful Insurance 73,406 49,744 73,406 49,744
5,211,966 5,313,223 5,211,966 5,313,223
Change in unearned premiums* (24,868) (690,486) (24,868) (690,486)Gross earned premiums 5,187,098 4,622,737 5,187,098 4,622,737
Non-life reinsurance premiums 1,331,268 1,642,569 1,331,268 1,642,569Life reinsurance premiums 380,094 748,431 380,094 748,431
Gross written reinsurance premiums 1,711,362 2,391,000 1,711,362 2,391,000Change in reinsurance unearned premiums 127,023 (455,307) 127,023 (455,307) Reinsurers’ share of gross earned premiums** 1,838,385 1,935,693 1,838,385 1,935,693

CORNERSTONE INSURANCE PLC
Consolidated Annual Report and Financial Statements For the year ended 31 December 2014
77
Notes to the consolidated financial statements
Movement in unearned premium* At January
At January,2014 1,621,324 1,016,321 1,621,139 1,016,321
Changes in the year (52,208) 604,818
(52,208) 604,818
Changes in Life fuds 77,076 85,668 77,076 85,668
Total Charge to statement of profit or loss 24,868 690,486 24,868 690,486
At December,2014 1,568,931 1,621,139 1,568,931
1,621,139
Movement in Reinsurance cost**
At 1 January 2014 675,421 220,114 675,421 220,114
Reinsurance cost paid during the year 1,711,632 2,391,000 1,711,632 2,391,000
Total acquisition cost (a) 2,387,053 2,611,114 2,387,053 2,611,114
Reinsurance cost amortized (charged to
Statement of profit and loss) (b) (1,813,981) (1,935,693) (1,813,981) (1,935,693)
Charge to statement of profit or loss (24,404) - (24,404) -
Total charge to statement of Income (1,838,385) (1,935,693) 1,838,385 1,935,693
At 31 December, 2014 (a +b) 573,072 675,421 573,072 675,072
Notes to the consolidated financial statements
27 Fee and commission income
Reinsurance commissions and profit commission
252,916
236,080
252,916
236,080
28 Net Claims expenses
2014
Gross paid
Movement in outstanding
claims Total Reinsurance's
share Net N'000 N'000 N'000 N'000 N'000
Life business 567,664 57,429 625,094 72,156 552,937 Non-life business 1,287,971 (209,433) 1,078,537 415,841 662,697 Takaful 18,511 - 18,511 - 18,511
1,874,146 (152,004) 1,722,142 487,997 1,234,145

CORNERSTONE INSURANCE PLC
Consolidated Annual Report and Financial Statements For the year ended 31 December 2014
78
2013
Gross
Movement in
outstanding claims Total
Reinsurance's share Net
N'000 N'000 N'000 N'000 N'000 Life business 1,459,042 (74,598) 1,384,444 1,052,920 331,524 Non-life business 1,154,095 258,413 1,412,508 589,612 822,896 Takaful 4,030 - 4,030 - 4,030
2,617,167 183,815 2,800,982 1,642,532 1,158,450 29 Underwriting Expenses (Fees, commissions and other acquisition expenses)
Group Company 2014 2013 2014 2013 N'000 N'000 N'000 N'000 Acquisition cost- General 480,961 447,766 480,961 447,766Acquisition cost- Life 81,922 108,742 81,922 108,742Acquisition cost- Takaful 22,942 11,163 22,942 11,163 585,825 567,671 585,825 567,671 Maintenance cost- General 241,134 297,223 241,134 297,223Maintenance cost- Life 17,263 73,809 17,263 73,809 844,222 938,703 844,222 938,703Deposit Administration Acquisition cost- deposit administration 24,272 25,090 24,272 25,090Maintenance- deposit administration 12,930 15,845 12,930 15,845 37,202 40,935 37,202 40,935Guaranteed interest 32,744 31,824 32,744 31,824 Changes in deferred underwriting expenses
18,357
(113,280) 18,357 (113,280)
932,526 898,182 932,526 898,182

CORNERSTONE INSURANCE PLC
Consolidated Annual Report and Financial Statements For the year ended 31 December 2014
79
Notes to the consolidated financial statements
Group Company
2014 2013 2014 2013 N'000 N'000 N'000 N'000 30 Investment income
Dividend income 462,076 325,599 451,916 311,312Interest income 521,137 463,395 470,451 392,961Others 15,943 101,288 - 42,780
999,156 890,282 922,367 747,053
Interest income-Deposit Administration 75,691 78,234 75,691 78,234
1,074,847 968,516 998,328 825,287
30a IAS 39 requires fair value changes for financial assets carried at fair value through profit or loss to be recocgnised in the profit or loss account. Financial instrument designated as FVTPL by the Company relates to NGN 3,892million(2013 NGN 2,919million)investment in MTN shares -see note 6a(ii) of financial statement Fair value changes for the year ended 31 December 2014 recognised in the profit or loss account amounted to NGN 144,130,000(2013 NGN 688,846,000. Fair value were determined by reference to market observable data under IFRS 13 Level 2 fair value hierarchy.
Group Company 2014 2013 2014 2013 N'000 N'000 N'000 N'000
30b Gain/Loss on disposal of financial assets - 35,966 - 36,156 30c Other operating income Exchange gain 812,126 - 812,126 - Miscellaneous income 40,180 4,583 78,893 4,583 Other operating income 20,067 42,162 - 41,035 872,373 46,745 891,019 45,618 31 Allowance for impairment losses Allowance on premium and other
receivables - Life Business - - - -
Allowance on premium and other receivables - non-life Business - - - -
Allowance on quoted equities - - - - Allowance on investment in subsidiary - - 59,879 Allowance on finance lease 74,896 - - - Allowance on receivables 26,308 - Allowance on loans and advances 341,882 126,117 26,308 -
- - 443,086 126,117 86,187 -
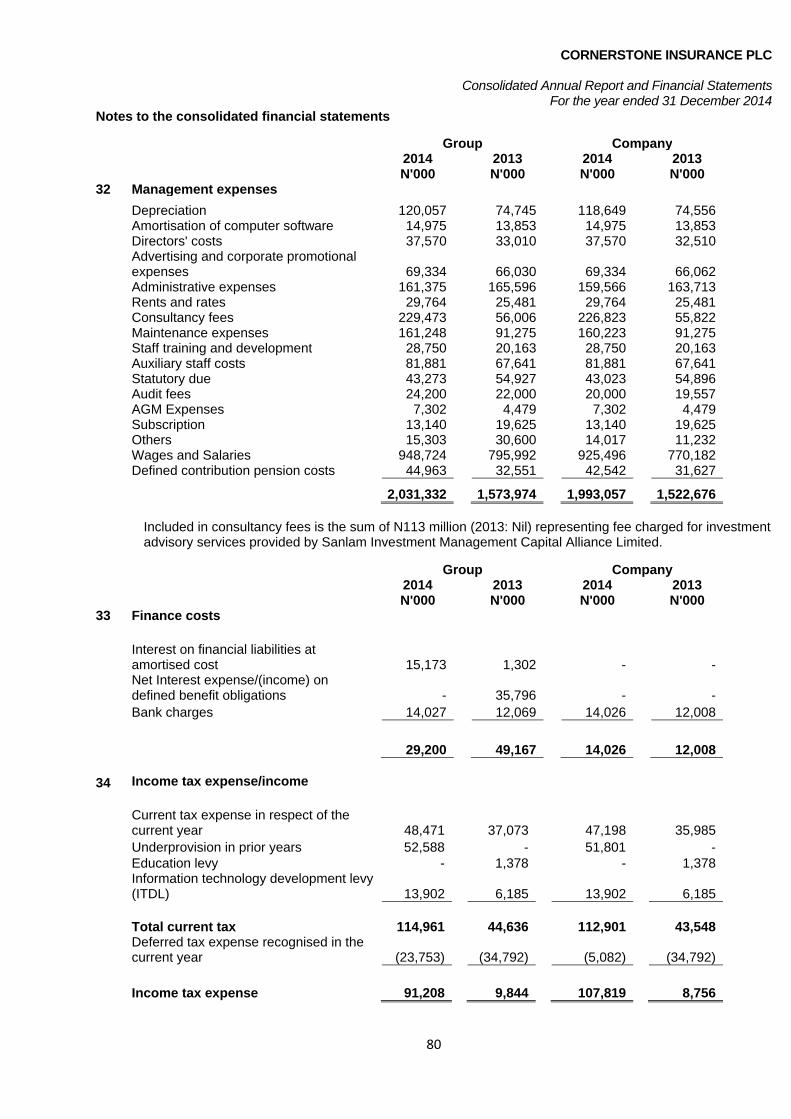
CORNERSTONE INSURANCE PLC
Consolidated Annual Report and Financial Statements For the year ended 31 December 2014
80
Notes to the consolidated financial statements
Group Company 2014 2013 2014 2013 N'000 N'000 N'000 N'000
32 Management expenses Depreciation 120,057 74,745 118,649 74,556 Amortisation of computer software 14,975 13,853 14,975 13,853 Directors' costs 37,570 33,010 37,570 32,510 Advertising and corporate promotional
expenses 69,334 66,030 69,334 66,062 Administrative expenses 161,375 165,596 159,566 163,713 Rents and rates 29,764 25,481 29,764 25,481 Consultancy fees 229,473 56,006 226,823 55,822 Maintenance expenses 161,248 91,275 160,223 91,275 Staff training and development 28,750 20,163 28,750 20,163 Auxiliary staff costs 81,881 67,641 81,881 67,641 Statutory due 43,273 54,927 43,023 54,896 Audit fees 24,200 22,000 20,000 19,557 AGM Expenses 7,302 4,479 7,302 4,479 Subscription 13,140 19,625 13,140 19,625 Others 15,303 30,600 14,017 11,232 Wages and Salaries 948,724 795,992 925,496 770,182 Defined contribution pension costs 44,963 32,551 42,542 31,627
2,031,332 1,573,974 1,993,057 1,522,676 Included in consultancy fees is the sum of N113 million (2013: Nil) representing fee charged for investment
advisory services provided by Sanlam Investment Management Capital Alliance Limited. Group Company
2014 2013 2014 2013 N'000 N'000 N'000 N'000
33 Finance costs
Interest on financial liabilities at amortised cost 15,173 1,302 - -
Net Interest expense/(income) on defined benefit obligations - 35,796 - -
Bank charges 14,027 12,069 14,026 12,008
29,200 49,167 14,026 12,008 34 Income tax expense/income
Current tax expense in respect of the current year 48,471 37,073 47,198 35,985Underprovision in prior years 52,588 - 51,801 -Education levy - 1,378 - 1,378Information technology development levy (ITDL) 13,902 6,185 13,902 6,185
Total current tax 114,961 44,636 112,901 43,548Deferred tax expense recognised in the current year (23,753) (34,792) (5,082) (34,792)
Income tax expense 91,208 9,844 107,819 8,756

CORNERSTONE INSURANCE PLC
Consolidated Annual Report and Financial Statements For the year ended 31 December 2014
81
Notes to the consolidated financial statements
2014 2013 N'000 N'000 35 Profit for the year
Profit for the year has been arrived at after charging
Net foreign exchange losses/(gains) 812,126 37,066 Depreciation of property and equipment 120,057 72,915Amortisation of intangible assets 14,975 14,041 Staff costs – salaries and pension 993,688 678,506Auditors’ remuneration 24,200 22,000 Impairment on receivables 436,708 331,153NAICOM Levy 43,273 35,928
36 Share-based payments Employee share option plan of the Company Details of the employee share option plan of the Company: The Group has a share option scheme for executives and senior employees of the Company and its
subsidiaries. In accordance with the terms of the scheme, as approved by shareholders at a previous annual general meeting, executives and senior employees with more than five years’ service with the Group may be granted options to purchase ordinary shares.
Each employee share option converts into one ordinary share of the Company on exercise. No amounts
are paid or payable by the recipient on receipt of the option. The options carry neither rights to dividends nor voting rights. Options may be exercised at any time from the date of vesting to the date of their expiry.
As at 31 December 2014, no staff of the group had exercised the options. 37 Earnings per share
The earnings and weighted average number of ordinary shares used in the calculation of basic earnings per share are as follows:
Group Company 2014 2013 2014 2013 kobo kobo kobo kobo
Earnings per share- basic & diluted 10 10 14 11

CORNERSTONE INSURANCE PLC
Consolidated Annual Report and Financial Statements For the year ended 31 December 2014
82
Notes to the consolidated financial statements
37. Earnings per share (Cont’d)
37.1 Basic/diluted earnings per share The earnings and weighted average number of ordinary shares used in the calculation of basic earnings per share are as follows.
2014 2013 2014 2013 N'000 N'000 N'000 N'000 Profit for the year attributable to owners of the Company
853,985
874,963
1,190,549
946,459
Earnings used in the calculation of basic earnings per share
853,985
874,963
1,190,549
946,459
Profit for the year from discontinued operations used in the calculation of basic earnings per share from discontinued operations
-
-
-
-
Others -
-
-
-
Earnings used in the calculation of basic earnings per share from continuing operations
853,985
874,963
1,190,549
946,459
Diluted earnings provides a measure of the interest of each ordinary share in the performance of an entity while giving effect to all dilutive potential ordinary shares outstanding during a period. There exist no potential ordinary share of the company outstanding during the year ended 31 December, 2014 and the comparative year, consequently diluted and basic earnings per share are the same.
2014 2013 Weighted average number of ordinary shares for the purpose of basic earnings per share (‘000)
8,820,010 8,820,010
Treasury shares (‘000) (96,350) (96,350)
8,723,660 8,723,660 38 Litigation contingencies and claims
Contingent liabilities
There are litigations against the group as at 31 December, 2014 amounting to N442,237,000 (31
December 2013: N162,289,000).The directors believe based on legal advice and current available information, that the outcome would result from proceedings will not have material adverse effect on the financial position of the Group. Consequently, no provision has being made in these financial statements.
39 Related parties
Balances and transactions between the Company and its subsidiaries, which are related parties of the Company, have been eliminated on consolidation and are not disclosed in this note. Details of transactions between the Group and other related parties are disclosed below
Notes to the consolidated financial statements
40 Transactions with related parties

CORNERSTONE INSURANCE PLC
Consolidated Annual Report and Financial Statements For the year ended 31 December 2014
83
The group enters into transactions with its subsidiaries and its key management personnel in the normal course of business. The transactions with related parties are made at normal market prices and conducted at arms length.
2014 2013Sales of: N'000 N'000 Insurance and investment contracts to subsidiaries - -Insurance and investment contracts to key management personnel 6,586 3,557
-Subsidiaries 137 256,910 6,723 260,467
The Group considered the outstanding balances at the reporting date is unsecured and non-interest bearing. The settlements will involve physical delivery of cash. In relation to the balances with related parties, there was no allowance for impairments on receivables at the end of the reporting period and no bad debt expense in the year (2013:nil)
2014 2013 N'000 N'000 41.2 Loans from and payables to related parties are as follows
Loans from related parties -Subsidiaries - 1,371 - 1,371
42 Compensation of key management personnel
Key management personnel of the Group include all directors, executive and non-executive, senior management.
The summary of compensation of key management personnel for the year is as follows:
2014 2013 N'000 N'000
Salaries 310,865 270,318Fees 28,500 26,500Post-employment pension benefits 23,664 33,014
Total compensation to key management personnel 363,029 329,832 Directors cost
Salaries and wages 84,672 52,059Pension cost 10,682 6,588
Directors cost 95,354 58,647
Notes to the consolidated financial statements
42.1 Employees remuneration
The number of employees whose emoluments, excluding allowances within the following ranges were:

CORNERSTONE INSURANCE PLC
Consolidated Annual Report and Financial Statements For the year ended 31 December 2014
84
Group Company2014 2013 2014 2013
Number Number Number NumberN N
500,000 - 1,500,000 6 6 6 6 1,500,001 - 2,500,000 26 51 26 51 2,500,001 3,500,000 47 41 47 41
3,500,001 - 4,500,000 32 38 32 38 4,500,001 - 5,500,000 29 12 29 12 5,500,001 - 6,500,000 10 12 10 126,500,001 - 7,500,000 6 5 6 5
7,500,001 - 8,500,000 11 8 11 7 8,500,001 - 9,500,000 7 - 6 -
9,500,001 - 10,500,000 4 4 4 4 10,500,001 and above 10 5 9 4
188 182 186 180
43 Contraventions
The company contravened the following NAICOM regulation: Particulars Description Penalty Section 1.17 of NAICOM Operation Guidelines
Late submission of second quarter Anti-money laundering and Combating Financing of Terrorism returns
N1,140,000
44 Events after reporting period
There are no event after the reporting period that could have had a material effect on the state of affair of the company as at 31 December 2014 which have not been adequately provided for or disclosed.
45 Approval of financial statements
The financial statements were approved by the board of directors and authorised for issue on 27 February, 2015
46 Enterprise Risk Management
Overview The Group’s enterprise risk management (ERM) programmer comprises of an instituted structure designed to manage a myriad of uncertainties (threats) and equally explore opportunities in enhancing the Group’s performance standards. The Group’s ERM practice involves a cross-functional and multi-dimensional approach to corporate risk management. This characteristically involves a strong corporate governance structure that facilitates the establishment of a risk management unit, which has been charged with the function of identifying uncertainties (risks and opportunities) that may impact on corporate objectives (ISO: 31000), and assessing its impact using the RAG (Red, Amber and Green) rating methodology. The overall oversight function of the risk management function remains critical to ensuring the Group attains its expected performance standards.
Notes to the consolidated financial statements
46 Enterprise Risk Management (Cont’d)
The Group’s risk context delineates the scope of the risk management process and sets the standards against which risks will be assessed in accordance with the group’s primary organizational objective of attaining to be the leading insurance based financial services group that transforms.

CORNERSTONE INSURANCE PLC
Consolidated Annual Report and Financial Statements For the year ended 31 December 2014
85
The Group clearly understand the uncertainties inherent in accepting insurance risks and how such risks potentially impact achievement of business objectives if left undefined. It is to this end that the Group’s ethics, philosophy and risk culture are embodied in our integrated risk management and control function. Risk Philosophy, Culture and Objectives Risk Management Philosophy The key elements of Group’s risk management philosophy are as follows: • The Group considers sound risk management as the foundation of a long lasting financial institution. • The Group shall continue to adopt a holistic and integrated approach to risk management. • Risk officers shall be empowered to perform their duties professionally and independently without
undue interference. • Risk management shall be governed by policies which are well defined and clearly communicated
Group-wide. • Risk management represents a shared responsibility. Therefore, the Group aims to build a shared-
perspective on risks that is grounded on consensus; • Risk-related issues are taken into consideration in all business decisions. The Group shall strive to
maintain a conservative balance between risk and revenue considerations.
Risk Culture • The Board and senior management set the tone-at-the-top, by promoting a responsible approach to
risk in order to ensure that the long term survival and reputation of the Group is not jeopardized in a bid to achieve set objectives.
• The primary responsibility for risk management and control function is fully vested in the Board which in turn shall delegate such to Senior Management;
• The Group’s management shall promote risk awareness and risk management practice across the enterprise.
• The Group advocates risk event reporting and whistle blowing, in the quest to gain greater insights into mistakes and near-misses.
• The Group maintains a firm obligation to ethical principles, which is replicated in the ethical profile of individuals and the application of ethics and the significance of wider stakeholder stances in decision making.
Risk Management Oversight - Three Lines of Defense Model The three (3) lines of defence approach to effective risk management function and control to promote an integrated culture of risk sensitivity and accountability of key risk owners across the Group. The model enables the Group’s risk management and control function delegate and coordinate essential risk management functions across the designated lines of defence, within a systematic and integrated process.
Notes to the consolidated financial statements
Risk Management Oversight - Three Lines of Defense Model (Cont’d) The three (3) lines of defence are depicted in the diagram below:

CORNERSTONE INSURANCE PLC
Consolidated Annual Report and Financial Statements For the year ended 31 December 2014
86
The Three Lines of Defense Risk Management and Internal Control Integrated Framework The ERM and internal control framework of the Group derives its functionality from the Committee of Sponsoring Organizations of the Treadway Commission (COSO) Enterprise Risk Management – Integrated Framework. The framework highlights the nucleus of the enterprise risk management process, the synergy of operations amongst the board of directors, management and other personnel across the enterprise. The Group’s ERM/internal control integrated framework primarily consists of the following five (5) constituents in accordance with best practices: • Control environment • Risk assessment • Control activities • Information & communication • Monitoring Control Environment The Group’s control environment refers to established standards and structures that provide a foundation for the risk management /internal control functions to thrive across the Group. The board of directors and senior management institutes the tone at the top regarding the importance of internal control. Furthermore, the control environment comprises our five (5) corporate values of integrity, empathy, professionalism, innovation and team spirit that exhibit the Group’s commitment to essential values. These values therefore, provide the necessary advantages that enable management establish the mode of business operation and the board of directors effectively executes its independent oversight functions by setting the tone at the top. Similarly the operating and corporate governance structure, establishment of standards of conduct, enforcement of accountability through structures and authorities etc. represents critical success factors responsible for the thriving risk management culture within the Group thus far.
Notes to the consolidated financial statements
Risk Assessment Risk assessment involves an iterative method of identifying and evaluating risks that could enhance opportunities and/or mitigate threats that emanates across the enterprise. e.g. from department, division inclusive of subsidiaries capable of impacting the Group’s objectives. Designated risk champions are charged with the responsibility of risk identification/reporting, while the ERM unit conducts an evaluation and assessment of risk identified, with the intention of developing action plans for implementation and
• Ownership and management of risks on a day-to-day basis• Adherence to instituted risk and control process
1st LineRisk Owners
• Oversees the entire risk management process• Develop processes and controls to manage risks• Offer supervisory capabilities and training on risk management
processes
2nd LineRisk Management
• Provide independent assurance in accordance with instituted standards of performance as contained in the operations of the 1st and 2nd lines of defence
3rd LineInternal Audit

CORNERSTONE INSURANCE PLC
Consolidated Annual Report and Financial Statements For the year ended 31 December 2014
87
assess the effectiveness thereof. Risk assessment reports are presented at the quarterly board meetings of the Financial Performance and Enterprise Risk Management Committee. Similarly, matters within the remit of the Audit committee are assessed. These committees have the responsibility to assesses changes that significantly impact the system of risk management and internal control and develop responsive control measures that impact on the avoidance / mitigation of risks within the Group’s acceptable levels. Control Activities Control activities are actions instituted through internal practices that help safeguard the implementation of Group’s directives to mitigate risks exposures and/or promote business opportunities that may possibly influence the achievement of corporate strategic objectives. Control activities are entity-specific and are performed at all levels across of the Group at various stages within business processes and over the technology environment. Information and Communication The Group firmly appreciates that management of information is critical for the enterprise to proficiently implement internal control functions and as such Management judicious develop and utilize information having its origins from internal and/or external sources to underpin the current internal control system. Monitoring The current corporate governance structure necessitates the Group to evaluate the efficacies of; its policies and procedures, adherence to its internal control/risk management measures and communicates inherent/potential deficiencies in a timely manner to the authorities responsible for taking risk-based corrective actions, including senior management and board committees, as apt. Reputational Risk Management The Group maintains a zero tolerance policy against all unethical behaviors. Furthermore, the Group’s corporate values continually promote a responsible approach to avoiding/mitigating reputational risks and ensure that the long term survival and brand image of the Group is not jeopardized. Operational Risk Management Operational risks represent risk of losses that emanate from inadequate or failed internal processes, people and systems or from external events. The Group’s ERM framework recognizes external risks, legal and compliance risks and financial crime risks e.g. Anti-Money Laundry (AML) and Combating Financing of Terrorism (CFT) are inclusive in the Operational risk (OR) profile description. The Group recognizes the pervasiveness of several types of operational risks in our business process, hence policies and tools have been instituted to ensure that resultant impact are kept as-low-as-reasonably-practicable (ALARP). Some of these processes are: Risk Control Self Assessment The risk control self-assessment tool constitutes a potent operational risk management tool employed by the Group to manage operational risks on a monthly basis, using a combination probability and impact measurements. Risk officers (Cornerstone Risk Officers) working in designated departments are primarily responsible for risk identification- in line with our 1st line of defence model, assessment, proffering action plans for implement and determining the efficacies of these plans as deemed fit, in order to mitigate risk exposures.
Notes to the consolidated financial statements
Occupational Health and Safety Management System The Group reviewed its Occupational Health and Safety Management System (OHSAS) design, in order to meet the requirements of the international standard for OHSAS 1800:2007. This approach was in accordance with the Group’s policy on Zero tolerance against occupational health and safety risks. Examples of these Instituted policies include: emergency preparedness and response procedures, hazard identification, incident investigation and reporting of non-conformity standards, conduct of fire drills, record keeping on Loss Time Injury (LTI) and Loss Time Incident Frequency (LTIF). Furthermore, employees are adequately insured against occupational hazards. In addition, the Group provides medical facilities to its employees and their immediate families at its expense. Outlook

CORNERSTONE INSURANCE PLC
Consolidated Annual Report and Financial Statements For the year ended 31 December 2014
88
The focal point of our future strategy of managing broad risk categories which include but may not be limited to: market, credit, liquidity, operational, insurance, reputational, legal and compliance risks; significantly rests with instituting a structured approach to embedding a robust risk management mechanism aimed at driving performance standards, day-to-day operations, corporate culture and decision making process in order to safeguard and engender values for all stakeholders in the ever dynamic insurance market space fraught with a principal concern- management of uncertainties.
47 Capital management The Group objective with respect to capital management is to maintain a capital based that structured to exceed regulatory requirement and to best utilize capital allocations. Insurance industry regulation measure the financial strength of Non-Life using a solvency margin model. Generally NAICOM expect insurer to comply with capital adequacy requirement. The regulatory capital (as required under insurance Acts 2003 and NAICOM Guideline) within the Group have been maintained and preserved over the reporting periods. The Solvency Margin Requirement The regulatory capital (as required under Insurance Act 2003 and NAICOM Guideline) within the Group have been maintained and preserved over the reporting periods. The section defines solvency Margin of Non-life insurer as the difference between the admissible assets and liabilities and this shall not be less than 15% of Net premium income(Gross premium Income less reinsurance premium paid) or the minimum capital base (N3billion)whichever is higher. Minimum Capital requirement During the year, the company has consistently exceeded the minimum capital requirement

CORNERSTONE INSURANCE PLC
Consolidated Annual Report and Financial Statements For the year ended 31 December 2014
89
The table below show solvency margin computation for life Non-life as at 31 December 2014.
N'000 N'000 Admissible Assets Cash and cash Equivalent 247,768 Treasury bills and Government bonds 213,910 Placement with Financial institutions 1,473,760 Corporate bonds 427,493 Ordinary and Preference share 241,581 Staff prepayment 37,375 Receivable from subsidiary 32,039 Trade receivables 1,473 Reinsurance Assets 1,414,753 Other receivables and prepayments 124,575 Deferred acquisition cost 227,131 Investment in properties 518,900 Financial Assets 2,672,851 Land and Buildings 162,074 Property,Plant &Equipment;excluding Land and Bulding 485,110 Total Admissible Assets 8,280,793Insurance Contract Liabilities 3,202,907 Trade payables 117,795 Other payables 1,793,491 Retirement benefit obligation 8,024 Tax payable 29,424 Total Admissible Liabilities 5,151,641 Gross solvency Margin 3,129,152
Solvency margin at year end 1` 129,152
48 Financial risk management
The Group monitors and manages the financial risks relating to the operations of the Group through internal risk reports which analyse exposures by degree and magnitude of risks. These risks include market risk (currency risk, interest rate risk and price risk), credit risk and liquidity risk.
The Group may seek to minimise the effects of these risks by using derivative financial instruments to
hedge risk exposures. The Group does not enter into or trade financial instruments, including derivative financial instruments, for
speculative purposes. 48.a Valuation bases
Fair value is the amount for which an asset could be exchanged or liability being settled between
knowledgeable, willing parties in an arms length transaction. Fair values are determined at prices quoted in active markets. In the current environment, such price
information is typically not available for all instruments and the Group applies valuation techniques to measure such instruments. These valuation techniques make maximum use of market observable data but in some cases management estimate other than observable market inputs within the valuation model. There is no standard model and different assumptions would generate different results.
Fair values are subject to a control framework designed to ensure that input variables and output are
assessed independent of the risk taker. These inputs and outputs are reviewed and approved by a valuation committee. The Group has minimal exposure to financial assets which are valued at other than quoted prices in an active market.
Notes to the consolidated financial statements

CORNERSTONE INSURANCE PLC
Consolidated Annual Report and Financial Statements For the year ended 31 December 2014
90
The table below shows financial assets carried at fair value through profit or loss by valuation method.
2014 2013 N'000 N'000
Quoted prices in active markets (level 1) 3,845,883 844,503Valuation technique: Market observable data (level 2) Other than observable market data (level 3) - 585,004
3,845,883 1,429,507
Fair value measurements recognised in the consolidated statement of financial position. The following table provides an analysis of financial instruments that are measured subsequent to initial recognition at fair value, grouped into Levels 1 to 3 based on the degree to which the fair value is observable. • Level 1 fair value measurements are those derived from quoted prices (unadjusted) in active markets
for identical assets or liabilities. • Level 2 fair value measurements are those derived from inputs other than quoted prices included
within Level 1 that are observable for the asset or liability, either directly (i.e. as prices) or indirectly (i.e. derived from prices).
• Level 3 fair value measurements are those derived from valuation techniques that include inputs for
the asset or liability that are not based on observable market data (unobservable inputs).

CORNERSTONE INSURANCE PLC
Consolidated Annual Report and Financial Statements For the year ended 31 December 2014
91
Notes to the consolidated financial statements
Fair value Hierarchy 2014
FINANCIAL ASSETS Level 1 Level 2 Level 3 Total N'000 N'000 N'000 N'000
Financial Assets at FVTPL: Equity Shares - 3,845,883 - 3,845,883Bonds/Debentures - - - -Redeemable Notes - - - -
- 3,845,883 - 3,845,883
Financial Assets at AFS: Equity Shares 528,999 959,112 1,488,111Bonds/Debentures - - - -Redeemable Notes - - - -
528,999 959,112 - 1,488,111
Financial Assets -Loan and receivables: Bonds 1,030,134 - - 1,030,134Loan to individuals 109,822 - - 109,822Loans and advances 45,639 45,643 1,139,956 45,639 - 1,185,595
Total Financial Assets at fair value 1,668,995 4,850,634 - 6,519,589
FINANCIAL LIABILITIES Level 1 Level 2 Level 3 Total N N N N
Financial Liabilities at FVTPL: Derivative financial liabilities - - - -Bonds/Debentures - - - -Other derivative financial liabilities - - -
- - - - -
Financial Liabilities at Amortised Cost: Bank Loans - - - -Bank Overdrafts - - - -Bonds/Debentures - - -
- - - - -
Total Financial Liabilities - - - -

CORNERSTONE INSURANCE PLC
Consolidated Annual Report and Financial Statements For the year ended 31 December 2014
92
Notes to the consolidated financial statements
Fair value Hierarchy
2013 FINANCIAL ASSETS Level 1 Level 2 Level 3 Total
N'000 N'000 N'000 N'000Financial Assets at FVTPL: Equity Shares - 3,066,842 - 3,066,842Bonds/Debentures - - -Redeemable Notes - - - -
- 3,066,842 - 3,066,842
Financial Assets at AFS Equity Shares
Bonds/Debentures 121,970 728,479 - 850,449Redeemable Notes - -
121,970 728,479 - 850,449
Financial Assets -Loan and receivables:
Bonds/Debentures 748,864 748,864Loan to Policyholders 79,264 79,264Loans and advances 326,568 326,568 748,864 79,264 326,568 1,154,696
Total Financial Assets 870,834 3,874,585 326,568 5,071,987
FINANCIAL LIABILITIES Level 1 Level 2 Level 3 Total
N N N N Financial Liabilities at Amortised Cost: Bank Loans - - - -Bank Overdrafts - - - -Bonds/Debentures - - - -
- - - -
Total Financial Liabilities - - -
-
49 Market risk Market risk is the risk of adverse financial impact as a consequence of market movements such as
currency exchange rates, interest rates and other price changes. Market risk arises due to fluctuations in both the value of assets held and the value of liabilities.
The Group has established policies and procedures in order to manage market risk.
Notes to the consolidated financial statements

CORNERSTONE INSURANCE PLC
Consolidated Annual Report and Financial Statements For the year ended 31 December 2014
93
Foreign currency risk management The Group undertakes certain transactions denominated in foreign currencies. Hence, exposures to
exchange rate fluctuations arise. The Group has minimal exposure to currency risk as the Group’s financial assets are primarily matched to
the same currencies as its insurance and investment contract liabilities. As a result, foreign exchange risk arises from other recognised assets and liabilities denominated in other currencies.
Carrying amounts of the Group’s foreign currency denominated assets and liabilities: 2014
Naira Sterling Euro US dollars Others Total N'000 N'000 N'000 N'000 N'000 N'000
Assets - 1,895 10,108 4,981,190 - 4,993,193Liabilities - - - - - -
- 1,895 10,108 4,981,190 - 4,993,193
2013 Naira Sterling Euro US dollars Others TotalN'000 N'000 N'000 N'000 N'000 N'000
Assets -
3,478 7,595
429,455
-
440,528
Liabilities -
- - -
-
- -
3,478
7,595
429,455
-
440,528
Foreign currency sensitivity analysis The following table details the Group’s sensitivity to a 10% increase and decrease in the Sterling against the relevant foreign currencies. A 10% sensitivity rate is used when reporting foreign currency risk internally to key management personnel and represents management’s assessment of the reasonably possible change in foreign exchange rates. For each sensitivity the impact of change in a single factor is shown, with other assumptions unchanged.
2014 Naira Sterling Euro US dollars Total N'000 N'000 N'000 N'000 N'000
10% increase Pre tax profit Shareholders’ equity - 2,085 11,119 5,479,309 5,492,51210% decrease Pre tax profit Shareholders’ equity - 1,706 9,097 4,483,071 4,493,874
2013 Naira Sterling Euro US dollars TotalN'000 N'000 N'000 N'000 N'000
10% increase Pre tax profit Shareholders’ equity
973,287
4,628
5,543
7,633
991,091
10% decrease Pre tax profit Shareholders’ equity
796,325
3,786
4,536
6,245
810,892
Notes to the consolidated financial statements
The Group’s method for sensitivity to currency rate fluctuations has not changed significantly over the year
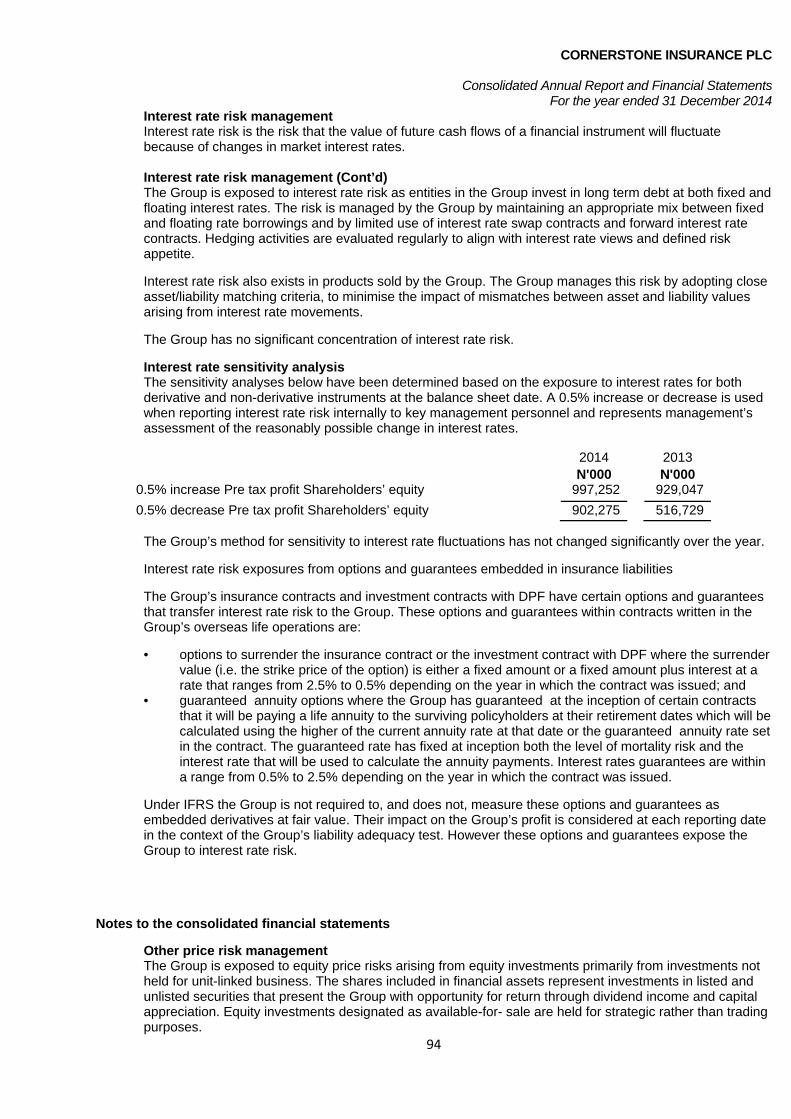
CORNERSTONE INSURANCE PLC
Consolidated Annual Report and Financial Statements For the year ended 31 December 2014
94
Interest rate risk management Interest rate risk is the risk that the value of future cash flows of a financial instrument will fluctuate because of changes in market interest rates. Interest rate risk management (Cont’d) The Group is exposed to interest rate risk as entities in the Group invest in long term debt at both fixed and floating interest rates. The risk is managed by the Group by maintaining an appropriate mix between fixed and floating rate borrowings and by limited use of interest rate swap contracts and forward interest rate contracts. Hedging activities are evaluated regularly to align with interest rate views and defined risk appetite. Interest rate risk also exists in products sold by the Group. The Group manages this risk by adopting close asset/liability matching criteria, to minimise the impact of mismatches between asset and liability values arising from interest rate movements. The Group has no significant concentration of interest rate risk. Interest rate sensitivity analysis The sensitivity analyses below have been determined based on the exposure to interest rates for both derivative and non-derivative instruments at the balance sheet date. A 0.5% increase or decrease is used when reporting interest rate risk internally to key management personnel and represents management’s assessment of the reasonably possible change in interest rates.
2014 2013 N'000 N'000
0.5% increase Pre tax profit Shareholders’ equity 997,252 929,0470.5% decrease Pre tax profit Shareholders’ equity 902,275 516,729
The Group’s method for sensitivity to interest rate fluctuations has not changed significantly over the year. Interest rate risk exposures from options and guarantees embedded in insurance liabilities The Group’s insurance contracts and investment contracts with DPF have certain options and guarantees that transfer interest rate risk to the Group. These options and guarantees within contracts written in the Group’s overseas life operations are: • options to surrender the insurance contract or the investment contract with DPF where the surrender
value (i.e. the strike price of the option) is either a fixed amount or a fixed amount plus interest at a rate that ranges from 2.5% to 0.5% depending on the year in which the contract was issued; and
• guaranteed annuity options where the Group has guaranteed at the inception of certain contracts that it will be paying a life annuity to the surviving policyholders at their retirement dates which will be calculated using the higher of the current annuity rate at that date or the guaranteed annuity rate set in the contract. The guaranteed rate has fixed at inception both the level of mortality risk and the interest rate that will be used to calculate the annuity payments. Interest rates guarantees are within a range from 0.5% to 2.5% depending on the year in which the contract was issued.
Under IFRS the Group is not required to, and does not, measure these options and guarantees as embedded derivatives at fair value. Their impact on the Group’s profit is considered at each reporting date in the context of the Group’s liability adequacy test. However these options and guarantees expose the Group to interest rate risk.
Notes to the consolidated financial statements
Other price risk management The Group is exposed to equity price risks arising from equity investments primarily from investments not held for unit-linked business. The shares included in financial assets represent investments in listed and unlisted securities that present the Group with opportunity for return through dividend income and capital appreciation. Equity investments designated as available-for- sale are held for strategic rather than trading purposes.

CORNERSTONE INSURANCE PLC
Consolidated Annual Report and Financial Statements For the year ended 31 December 2014
95
The Group has no significant concentration of price risk. Equity price sensitivity analysis The sensitivity analyses set out below show the impact of a 10% increase and decrease in the value of equities on profit before tax and shareholders’ equity based on the exposure to equity price risk at the reporting date.
2014 2013N'000 N'000
10% increase Pre tax profit Shareholders’ equity 1,044,740 973,28710% decrease Pre tax profit Shareholders’ equity 854,787 796,326
The Group’s method for sensitivity to equity prices has not changed significantly from the prior year. The Group’s method for sensitivity to equity prices has not changed significantly from the prior year. 50 Credit risk Credit risk refers to the risk that a counterparty will default on its contractual obligations resulting in
financial loss to the Group. The key areas of exposure to credit risk for the Group are in relation to its investment portfolio, reinsurance programmer and to a lesser extent amounts due from policyholders and intermediaries.
The Group has adopted a policy of only dealing with creditworthy counterparties and obtaining sufficient
collateral where appropriate, as a means of mitigating the risk of financial loss from defaults. The Group only transacts with entities that are rated the equivalent to investment grade and above.
This information is supplied by independent rating agencies where available and if not available the Group
uses other publicly available financial information and its own trading records to rate its major policyholders and reinsurers.
The Group’s exposure and the credit ratings of its counterparties are continuously monitored and the
aggregate value of transactions concluded is spread amongst approved counterparties. Credit exposure is controlled by counterparty limits that are reviewed and approved by the risk management committee annually.
Receivables consist of a large number of policyholders, spread across diverse industries and geographical
areas. Ongoing credit evaluation is performed on the financial condition of accounts receivable. The Group does not have any significant credit risk exposure to any single counterparty or any group of
counterparties. Concentration of credit did not exceed 5% of gross monetary assets at any time during the year. The credit risk on liquid funds and derivative financial instruments is limited because the counterparties are banks with high credit-ratings assigned by international credit-rating agencies.
Notes to the consolidated financial statements
50 Credit risk (Cont’d) The Group writes unit-linked business where the policyholder bears the investment risk on the assets held.
The shareholders’ risk is limited to the extent that income arising from asset management charges is based on the value of those assets.
Except as detailed in the following table, the carrying amount of financial assets and reinsurance assets
recorded in the financial statements, which is net of impairment losses, represents the Group’s maximum exposure to credit risk without taking account of the value of any collateral obtained:

CORNERSTONE INSURANCE PLC
Consolidated Annual Report and Financial Statements For the year ended 31 December 2014
96
Maximum credit risk
2014 2013 N'000 N'000
Letters of credit provided by banks on behalf of reinsurers Nil Nil
The following table shows aggregated credit risk exposure for assets with external credit ratings. The majority of debt securities are investment grade and the Group has very limited exposure to sub-prime
or alt-A. Reinsurance assets are reinsurers’ share of outstanding claims and IBNR and reinsurance receivables.
They are allocated below on the basis of ratings for claims paying ability. Loans and receivables from policyholders, agents and intermediaries generally do not have a credit rating.

CORNERSTONE INSURANCE PLC
Consolidated Annual Report and Financial Statements For the year ended 31 December 2014
97
Notes to the consolidated financial statements
Credit risk (Cont’d)
Unit-linked assets are excluded from this analysis.
2014
AAA
AA A BBB Not rated Carrying Amount
N'000 N'000 N'000 N'000 N'000 N'000 Debt securities - Federal Government - - - - - - - State Government - 520,000 - - - 520,000 - Corporate - - 485,192 - - 485,192 Loans and receivables - Corporate Loans - - - - - - - Individual Loans 109,822 - - - - 109,822 - LPO and Advances - - - - 45,639 45,639 - Mutual Funds/Unit Trusts - - - - - - Reinsurance Receivables - - - - 955,604 955,604 Reinsurance Assets - - - - 745,692 745,692 Insurance receivables - - 31,600 - 31,600 Tenor Deposits (> 90 days) 500,000 - - - - 500,000 Cash and cash equivalents 607,748 - 2,469,782 - - 3,077,531
1,217,570 520,000 2,986,575 1,746,939 - 6,471,080

CORNERSTONE INSURANCE PLC
Consolidated Annual Report and Financial Statements For the year ended 31 December 2014
98
Notes to the consolidated financial statements
Credit risk (Cont’d)
2013
AAA
AA A BBB Not rated Carrying Amount
N'000 N'000 N'000 N'000 N'000 N'000 Debt securities - Federal Government - - - - - - - State Government - 520,000 133,532 - - 653,532 - Corporate - - 80,226 - - 80,226 Loans and receivables - Corporate Loans - - - - - - - Individual Loans 79,264 - - - - 79,264 - LPO and Advances - - - - 326,528 326,528 - Mutual Funds/Unit Trusts - - - - - - Reinsurance Receivables - - - - - - Reinsurance Assets - 251,496 1,294,624 - 675,421 2,221,541 Insurance receivables - - 56,613 - - 56,613 Tenor Deposits (> 90 days) 500,000 - - - 500,000 Cash and cash equivalents 694,951 - 2,863,789 - - 3,558,740
1,274,251 771,496 4,428,784 - 1,001,989 7,476,484
The following table shows the carrying value of assets that are neither past due nor impaired, the ageing of assets that are past due but not impaired and assets that have been impaired. Unit linked assets are excluded from this analysis.

CORNERSTONE INSURANCE PLC
Consolidated Annual Report and Financial Statements For the year ended 31 December 2014
99
Notes to the consolidated financial statements
Credit risk (Cont’d)
2014 Neither
past due nor
impaired
Past due less than 30 days
Past due 31 to 90 days
Past due more than
90 days
past due
and impaired
Carrying Amount
N'000 N'000 N'000 N'000 N'000 N'000 Debt securities - Federal Government - - - - - - - State Government 520,000 - - - - 520,000 - Corporate 485,192 - - - - 485,192 Loans and receivables - Corporate Loans - - - - - - - Individual Loans 109,822 - - - - 109,822 - LPO and Advances 45,643 - - - - 45,639 - Mutual Funds/Unit Trusts - - - - - - Reinsurance Receivables - - - - - - Reinsurance Assets - - 1,701,296 - - 1,701,296 Insurance receivables - 31,600 - - - 31,600 Tenor Deposits (> 90 days) - - - - - - Cash and cash equivalents 3,077,531 - - - - 3,077,531
- 4,238,188 31,600 1,701,296 - - 5,971,080
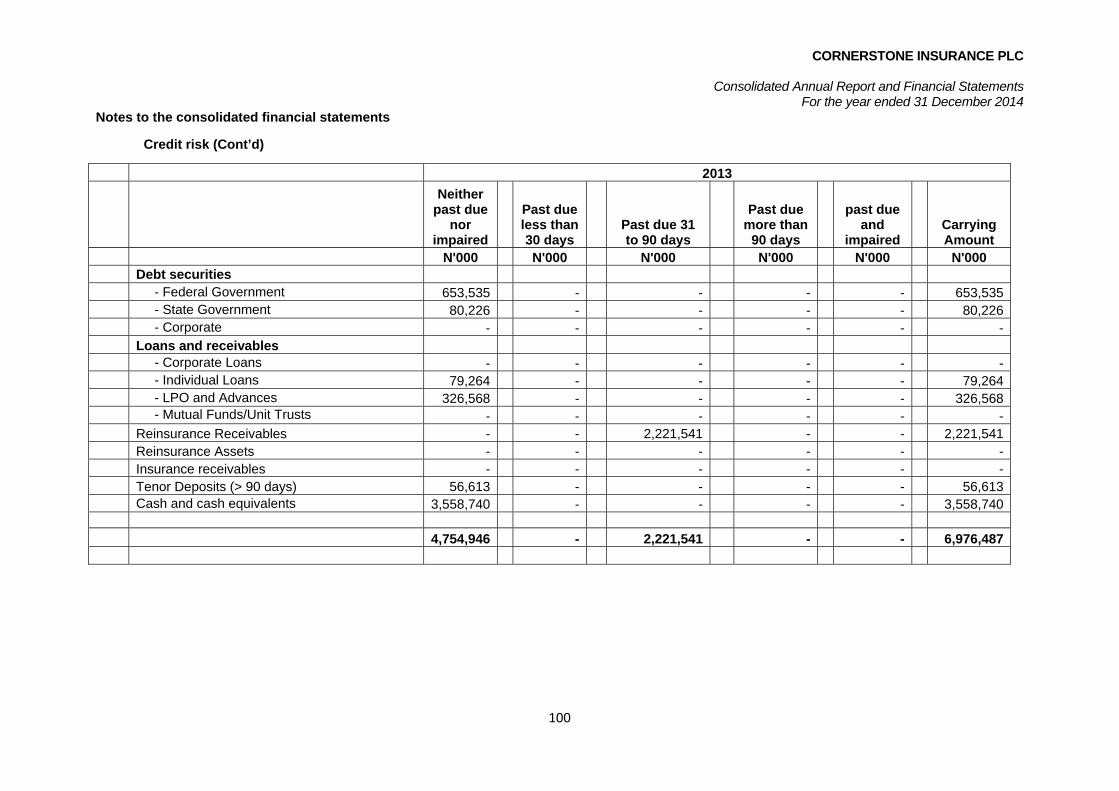
CORNERSTONE INSURANCE PLC
Consolidated Annual Report and Financial Statements For the year ended 31 December 2014
100
Notes to the consolidated financial statements
Credit risk (Cont’d)
2013Neither
past due nor
impaired
Past due less than 30 days
Past due 31 to 90 days
Past due more than
90 days
past due
and impaired
Carrying Amount
N'000 N'000 N'000 N'000 N'000 N'000 Debt securities - Federal Government 653,535 - - - - 653,535 - State Government 80,226 - - - - 80,226 - Corporate - - - - - - Loans and receivables - Corporate Loans - - - - - - - Individual Loans 79,264 - - - - 79,264 - LPO and Advances 326,568 - - - - 326,568 - Mutual Funds/Unit Trusts - - - - - - Reinsurance Receivables - - 2,221,541 - - 2,221,541 Reinsurance Assets - - - - - - Insurance receivables - - - - - - Tenor Deposits (> 90 days) 56,613 - - - - 56,613 Cash and cash equivalents 3,558,740 - - - - 3,558,740
4,754,946 - 2,221,541 - - 6,976,487

CORNERSTONE INSURANCE PLC
Consolidated Annual Report and Financial Statements For the year ended 31 December 2014
101
Notes to the consolidated financial statements
51 Liquidity risk Liquidity risk is the risk that the Group cannot meet its obligations associated with financial liabilities as they fall due. The Group has adopted an appropriate liquidity risk management framework for the management of the Group’s liquidity requirements. The Group
manages liquidity risk by maintaining banking facilities and reserve borrowing facilities by continuously monitoring forecast and actual cash flows and matching the maturity profiles of assets and liabilities. The Group is exposed to liquidity risk arising from clients on its insurance and investment contracts. In respect of catastrophic events there is liquidity risk from a difference in timing between claim payments and recoveries thereon from reinsurers.
Liquidity management ensures that the Group has sufficient access to funds necessary to cover insurance claims, surrenders, withdrawals and
maturing liabilities. In practice, most of the Group’s assets are marketable securities which could be converted in to cash when required.
2014 < 1
month 1 - 3
months 3 - 12
months 1 - 5
years > 5
years Total
N'000 N'000 N'000 N'000 N'000 N'000 Insurance contract liabilities - - Life 136,095 64,292 102,058 68,829 371,274 - Non-life 20,925 127,852 1,513,516 203,024 5,786 1,871,103 Investment contract liabilities - With DPF - - - - - - - Without DPF - - - - - - Unallocated divisible surplus - - - - - - Borrowings - - - - - - Derivative liabilities - - - - - - Trade and other liabilities - - - - - -
157,020 192,144 1,615,574 271,853 5,786 - 2,242,377

CORNERSTONE INSURANCE PLC
Consolidated Annual Report and Financial Statements For the year ended 31 December 2014
102
Notes to the consolidated financial statements
51 Liquidity risk (Cont’d)
2013
< 1 month 1 - 3 months
3 - 12 months
1 - 5 years > 5 years Total
N'000 N'000 N'000 N'000 N'000 N'000 Insurance contract liabilities - - Life 136,095 64,292 102,058 68,829 371,274 - Non-life 20,925 127,852 1,513,516 203,024 5,786 1,871,103 Investment contract liabilities - - With DPF - - - - - - - Without DPF - - - - - - Unallocated divisible surplus - - - - - - Borrowings - - - - - - Derivative liabilities - - - - - - Trade and other liabilities - - - - - -
157,020 192,144 1,615,574 271,853 5,786 2,242,377
The following table details the Group’s expected maturity for its non-derivative assets. The tables below have been drawn up based on the undiscounted contractual maturities of the assets including interest that will be earned on those assets except where the Group anticipates that the cash flow will occur in a different period.
Unit-linked assets and reinsurers’ share of unearned premiums are excluded from this analysis.

CORNERSTONE INSURANCE PLC
Consolidated Annual Report and Financial Statements For the year ended 31 December 2014
103
Notes to the consolidated financial statements
51 Liquidity risk (Cont’d)
2014
< 1 month 1 - 3 months
3 - 12 months 1 - 5 years > 5 years Total
N'000 N'000 N'000 N'000 N'000 N'000 Debt securities
- Federal Government - - - - - - State Government - - - 520,000 - 520,000 - Corporate - - - 485,192 - 485,192 Loans and receivables - Corporate Loans - - - - - - - Individual Loans - - - 109,822 - 109,822 - LPO and Advances - - - 45,639 - 45,639 - Mutual Funds/Unit Trusts - - - - - - Reinsurance Receivables - 955,604 - - - 955,604 Reinsurance Assets - 745,692 - - - 745,692 Insurance receivables 31,600 - - - - 31,600 Tenor Deposits (> 90 days) - - - - 500,000 500,000 Cash and cash equivalents 607,748 2,848,974 - - - 3,077,531
-639,748 4,171,078 - 1,160,657 500,000 6,471,080

CORNERSTONE INSURANCE PLC
Consolidated Annual Report and Financial Statements For the year ended 31 December 2014
104
Notes to the consolidated financial statements
51 Liquidity risk (Cont’d)
2013
< 1 month 1 - 3 months
3 - 12 months 1 - 5 years > 5 years Total
N'000 N'000 N'000 N'000 N'000 N'000 Debt securities - Federal Government - - - - - - - State Government - - - 653,535 - 653,535 - Corporate - - - 80,226 - 80,226 Loans and receivables - Corporate Loans - - - - - - - Individual Loans - - - 79,264 - - - LPO and Advances - - - - - - - Mutual Funds/Unit Trusts - - - - - - Reinsurance Receivables - 2,221,541 - - - 2,221,541 Reinsurance Assets - - - - - - Insurance receivables 56,613 - - - - 56,613 Tenor Deposits (> 90 days) - - - - 500,000 500,000 Cash and cash equivalents 694,951 2,863,789 - - - 3,558,740
751,564 5,085,330 - 1,139,593 500,000 - 7,476,487
Although the Group has access to financing facilities, the Group expects to meet its other obligations from operating cash flows and proceeds of maturing financial assets.

CORNERSTONE INSURANCE PLC
Consolidated Annual Report and Financial Statements For the year ended 31 December 2014
105
Notes to the consolidated financial statements
Liquidity Gap Analysis
2014
< 1 month 1 - 3 months
3 - 12 months 1 - 5 years > 5 years Total
N'000 N'000 N'000 N'000 N'000 N'000 Financial & Insurance Assets 607,748 3,704,947 1,005,192 500,000 5,817,888 Financial & Insurance Liabilities (157,020) (192,144) (1,615,574) (271,853) (5,786) (2,242,377) Gap 450,728 3,512,803 (1,615,574) 733,339 494,214 3,575,511
2013
< 1 month 1 - 3 months
3 - 12 months 1 - 5 years > 5 years Total
N'000 N'000 N'000 N'000 N'000 N'000 Financial & Insurance Assets 694,951 5,282,401 - 713,350 500,000 7,190,702 Financial & Insurance Liabilities (157,020) (192,144) (1,615,574) (271,853) (5,786) (2,242,377) Gap 537,931 5,090,257 (1,615,574) 441,497 494,214 - 4,948,325
52 Insurance risk management The Group accepts insurance risk through its insurance contracts and certain investments contracts where it assumes the risk of loss from persons or
organisations that are directly subject to the underlying loss. The Group is exposed to the uncertainty surrounding the timing, frequency and severity of claims under these contracts.
The Group manages its risk via its underwriting and reinsurance strategy within an overall risk management framework. Pricing is based on
assumptions which have regard to trends and past experience. Exposures are managed by having documented underwriting limits and criteria. Reinsurance is purchased to mitigate the effect of potential loss to the Group from individual large or catastrophic events and also to provide access to specialist risks and to assist in managing capital. Reinsurance policies are written with approved reinsurers on either a proportional or excess of loss treaty basis.
Regulatory capital is also managed (though not exclusively) by reference to the insurance risk to which the Group is exposed.

CORNERSTONE INSURANCE PLC
Consolidated Annual Report and Financial Statements For the year ended 31 December 2014
106
Notes to the consolidated financial statements
53 Non-life insurance The Group writes property, liability and motor risks primarily over a twelve month duration. The
most significant risks arise from natural disasters, climate change and other catastrophes (i.e. high severity, low frequency events). A concentration of risk may also arise from a single insurance contract issued to a particular demographic type of policyholder, within a geographical location or to types of commercial business. The relative variability of the outcome is mitigated if there is a large portfolio of similar risks.
The concentration of non-life insurance by the location of the underlying risk is summarised below
by reference to liabilities. Gross Reinsurance Net
2014 2013 2014 2013 2014 2013N'000 N'000 N'000 N'000 N'000 N'000
- Within Nigeria 3,748,896 3,763,830 1,458,290 1,187,262 2,290,606 2,576,568 - Outside Nigeria - - - - - -
3,748,896 3,763,830 1,458,290 1,187,262 2,290,606 2,576,568
The concentration of non-life insurance by type of contract is summarised below by reference to liabilities.
Gross Reinsurance Net 2014 2013 2014 2013 2014 2013N'000 N'000 N'000 N'000 N'000 N'000
Property 552,159 651,888 248,822 330,822 303,337 321,066Motor 337,772 487,526 (9,863) 66,442 347,635 421,084Liability 72,299 183,669 (8,285) 156,498 80,584 27,171Others 260,862 89,425 185,166 35,848 75,696 53,577
1,223,092 1,412,508 415,840 589,610 807,252 822,898
Assumptions and sensitivities
The risks associated with the non-life insurance contracts are complex and subject to a number of variables which complicate quantitative sensitivity analysis. The Group uses several statistical and actuarial techniques based on past claims development experience. This includes indications such as average claims cost, ultimate claims numbers and expected loss ratios. The key methods used by the Group for estimating liabilities are:
• chain ladder • expected loss ratio • benchmarking; and • Bornhuetter-Ferguson
Included within the insurance contract liabilities are provisions for asbestos and environmental
related claims arising from policies written many years ago. The Group has minimal exposure to these risks, the exposure of which is determined by the number of claims filed and the Court process.
The Group considers that the liability for non-life insurance claims recognised in the balance sheet is adequate. However, actual experience will differ from the expected outcome.

CORNERSTONE INSURANCE PLC
Consolidated Annual Report and Financial Statements For the year ended 31 December 2014
107
Notes to the consolidated financial statements
54 Claims development tables
The following tables show the development of claims over a period of time on both a gross and net of reinsurance basis. In 2012, in the year of adoption of IFRS, only 5 years were required to be disclosed. This will be increased in each succeeding year, until 8 - 10 years of information is presented. The top half of the table shows how the estimates of total claims for each accident year develop over time. The lower half of the table reconciles the cumulative claims to the amount appearing in the Statement of Financial Position.
The cumulative claims estimates and payments for each accident year are translated into Nigerian Naira at the year rates that applied at the end of each accident year.
2014 Analysis of claims development – Gross Analysis of claims development – Gross
Paid - All Accident year/Dev 1 2 3 4 5 6 7
N'000 N'000 N'000 N'000 N'000 N'000 N'000
2008 57,910,450.81 455,749,898.24 147,528,991.25 18,876,037.25 6,799,767.64 2,218,349.40 1,361,349.94 2009 192,938,481.04 323,058,371.22 62,099,080.06 15,993,484.46 24,871,796.87 4,033,275.37 - 2010 463,860,262.95 332,115,780.20 20,434,208.31 17,904,802.02 6,543,679.22 - - 2011 437,422,432.89 106,778,498.81 60,303,663.75 27,388,608.23 - - - 2012 403,652,183.46 473,029,104.42 219,665,730.60 - - - - 2013 371,171,152.22 324,400,318.92 - - - - - 2014 622,533,937.72 - - - - - -

CORNERSTONE INSURANCE PLC
Consolidated Annual Report and Financial Statements For the year ended 31 December 2014
108
Notes to the consolidated financial statements
54 Claims development tables (Cont’d)
Dev years/Acc years 2008 2009 2010 2011 2012 2013 2014 0 57,910,450.81 192,938,481.04 463,860,262.95 437,422,432.89 403,652,183.46 371,171,152.22 622,533,937.72 1 455,749,898.24 323,058,371.22 332,115,780.20 106,778,498.81 473,029,104.42 324,400,318.92 - 2 147,528,991.25 62,099,080.06 20,434,208.31 60,303,663.75 219,665,730.60 - - 3 18,876,037.25 15,993,484.46 17,904,802.02 27,388,608.23 - - - 4 6,799,767.64 24,871,796.87 6,543,679.22 - - - - 5 2,218,349.40 4,033,275.37 - - - - - 6 1,361,349.94 - - - - - - Cummulative Paid 690,444,844.53 622,994,489.03 840,858,732.69 631,893,203.68 1,096,347,018.48 695,571,471.14 622,533,937.72 Ultimate Claims 690,444,844.53 625,768,533.19 847,339,745.10 647,182,445.21 1,160,568,976.84 889,659,445.56 2,001,350,667.51 O/S - 2,774,044.16 6,481,012.41 15,289,241.53 64,221,958.36 194,087,974.42 1,378,816,729.79 Total 1,661,670,960.68
Reinsurance Accident year/Dev 1 2 3 4 5 6 7
N000 N000 N000 N000 N000 N000 N000 2008 - 179,968,688.36 108,669,981.15 15,205,411.79 5,029,659.33 2,447,272.32 - 2009 39,842,963.25 152,140,700.34 33,068,240.94 16,669,707.13 4,487,532.73 2,022,867.48 - 2010 185,471,238.62 141,778,157.62 17,905,577.56 10,364,447.21 924,121.20 - - 2011 221,830,466.72 42,639,283.05 22,312,753.28 16,115,334.36 - - - 2012 204,052,924.46 281,601,114.46 268,682,468.56 - - - - 2013 94,647,947.46 101,189,549.43 - - - - - 2014 104,465,663.21 - - - - - -

CORNERSTONE INSURANCE PLC
Consolidated Annual Report and Financial Statements For the year ended 31 December 2014
109
Notes to the consolidated financial statements
54 Claims development tables (Cont’d)
Dev years/Acc years 2008 2009 2010 2011 2012 2013 2014
N'000 N'000 N'000 N'000 N'000 N'000 N'000 1 179,968,688.36 152,140,700.34 141,778,157.62 42,639,283.05 281,601,114.46 101,189,549.43 - 2 108,669,981.15 33,068,240.94 17,905,577.56 22,312,753.28 268,682,468.56 - - 3 15,205,411.79 16,669,707.13 10,364,447.21 16,115,334.36 - - - 4 5,029,659.33 4,487,532.73 924,121.20 - - - - 5 2,447,272.32 2,022,867.48 - - - - - 6 - - - - - - -
Cummulative Paid 311,321,012.95 248,232,011.87 356,443,542.21 302,897,837.41 754,336,507.49 195,837,496.89 104,465,663.21 Ultimate Claims 311,321,012.95 248,232,011.87 358,020,168.93 307,638,477.69 791,531,209.29 339,679,691.18 661,293,771.56 O/S - - 1,576,626.72 4,740,640.28 37,194,701.81 143,842,194.29 556,828,108.35 Total 744,182,271.45
Net Accident year/Dev 1 2 3 4 5 6 7
N000 N000 N000 N000 N000 N000 N000 2008 57,910,450.81 275,781,209.88 38,859,010.10 3,670,625.46 1,770,108.31 228,922.92 1,361,349.94 2009 153,095,517.79 170,917,670.88 29,030,839.12 676,222.67 20,384,264.14 2,010,407.89 - 2010 278,389,024.33 190,337,622.57 2,528,630.75 7,540,354.81 5,619,558.02 - - 2011 215,591,966.17 64,139,215.76 37,990,910.47 11,273,273.86 - - - 2012 199,599,258.99 191,427,989.96 49,016,737.96 - - - - 2013 276,523,204.76 223,210,769.49 - - - - - 2014 518,068,274.51 - - - - - -

CORNERSTONE INSURANCE PLC
Consolidated Annual Report and Financial Statements For the year ended 31 December 2014
110
Notes to the consolidated financial statements
54 Claims development tables (Cont’d)
Net Dev years/Acc years 2008 2009 2010 2011 2012 2013 2014
N000 N000 N000 N000 N000 N000 N000 0 57,910,450.81 153,095,517.79 278,389,024.33 215,591,966.17 199,599,258.99 276,523,204.76 518,068,274.51 1 275,781,209.88 170,917,670.88 190,337,622.57 64,139,215.76 191,427,989.96 223,210,769.49 - 2 38,859,010.10 29,030,839.12 2,528,630.75 37,990,910.47 49,016,737.96 - - 3 3,670,625.46 676,222.67 7,540,354.81 11,273,273.86 - - - 4 1,770,108.31 20,384,264.14 5,619,558.02 - - - - 5 228,922.92 2,010,407.89 - - - - - 6 1,361,349.94 - - - - - -
Cummulative Paid 379,123,831.58 374,762,477.16 484,415,190.48 328,995,366.27 342,010,510.99 499,733,974.25 518,068,274.51 Ultimate Claims 379,123,831.58 377,536,521.32 489,319,576.17 339,543,967.52 369,037,767.54 549,979,754.38 1,340,056,895.95 O/S - 2,774,044.16 4,904,385.70 10,548,601.25 27,027,256.55 50,245,780.13 821,988,621.44 Total 917,488,689

CORNERSTONE INSURANCE PLC
Consolidated Annual Report and Financial Statements For the year ended 31 December 2014
111
Notes to the consolidated financial statements
55 Life insurance and investment contracts with DPF The Group writes life, pensions and annuities business with or without discretionary participating features. The most significant risks arise from mortality, persistency, longevity, morbidity, expense variations and investment returns.
Concentration of risk may arise from geographic regions, epidemics, accumulation of risks and market risk. The concentration of life insurance and investment contracts with DPF by location of the underlying risk is summarised below by reference to liabilities.
Gross Reinsurance Net
2014 2013 2014 2013 2013 N000 N000 N000 N000 N000
Life insurance: - Within Nigeria 1,499,649 1,477,218 751,218 544,540 932,678- Outside Nigeria - - - - -
1,499,649 1,477,218 751,218 544,540 932,678
Investment contracts with DPF: - Within Nigeria 1,303,049 1,229,957 1,303,049 - 1,229,957- Outside Nigeria - - - - -
1,303,049 1,229,957 1,303,049 - 1,229,957
The concentration of life insurance and investment contracts with DPF by type of contract is summarised below by reference to liabilities.
Gross Reinsurance Net
2014 2013 2014 2013 2013 N000 N000 N000 N000 N000
Protection 1,472,226 1,453,728 723,795 544,540 909,188Pensions - - - - -Annuities - - - - -Healthcare - - - - -Others 27,423 23,490 27,423 - 23,490
- - - - -Life insurance 1,499,649 1,477,218 751,218 544,540 932,678 Assumptions and sensitivities The risks associated with the life insurance and investment contracts with DPF are complex and subject to a number of variables which complicate quantitative sensitivity analysis. The key assumptions in quantifying these liabilities include mortality, persistency, longevity, morbidity, expense variations, investment return and discount rates. Some results of sensitivity testing are set out below showing the impact on profit before tax and shareholders’ equity before and after reinsurance. For each sensitivity the impact of a change in a single factor is shown, with other assumptions unchanged.

CORNERSTONE INSURANCE PLC
Consolidated Annual Report and Financial Statements For the year ended 31 December 2014
112
Notes to the consolidated financial statements
55 Life insurance and investment contracts with DPF (Cont’d)
Sensitivity of liabilities to changes in long term valuation assumptions 31 December 2014
N'000m Base Interest
rate +1%Interest
rate -1%Expenses
+10%Expenses
-10%
Expense Inflation
+2%
Expense Inflation
-2%Lapses
+10%Lapses -
10%Mortality
+5%Mortality
-5%
Individual Traditional 123,106 120,271 126,162 127,236 119,039 124,726 121,579 n/a n/a 124,099 122,192 Individual Investment Linked 1,259,283 1,259,283 1,259,283 1,259,283 1,259,283 1,259,283 1,259,283 n/a n/a 1,259,283 1,259,283
Group DA 27,963 27,963 27,963 27,963 27,963 27,963 27,963 n/a n/a 27,963 27,963
Group Credit Life 37,077 37,077 37,077 37,077 37,077 37,077 37,077 37,077 37,077
Group Life – UPR 232,139 232,139 232,139 232,139 232,139 232,139 232,139 n/a n/a 232,139 232,139
Group Life – IBNR 245,991 245,991 245,991 245,991 245,991 245,991 245,991 n/a n/a 245,991 245,991
Additional reserves 102,545 102,533 102,556 102,710 102,379 102,561 102,528 n/a n/a 102,589 102,500
Reinsurance (172,606) (172,564) (172,652) (172,668) (172,545) (172,631) (172,583) n/a n/a (172,621) (172,593)
Net liability 1,855,498 1,852,694 1,858,520 1,859,732 1,851,326 1,857,111 1,853,977 n/a n/a 1,856,521 1,854,554
% change in liability - -0.2% 0.2% 0.2% -0.2% 0.1% -0.1% n/a n/a 0.1% -0.1%
Summary Base Interest
rate +1%Interest
rate -1%Expenses
+10%Expenses
-10%
Expense Inflation
+2%
Expense Inflation -
2%Lapses
+10%Lapses -
10%Mortality
+5%Mortality
-5%
Individual 1,484,934 1,482,087 1,488,001 1,489,230 1,480,701 1,486,570 1,483,390 n/a n/a 1,485,971 1,483,975
Group 370,564 370,607 370,519 370,502 370,625 370,540 370,587 n/a n/a 370,550 370,578
Net liability 1,855,498 1,852,694 1,858,520 1,859,732 1,851,326 1,857,111 1,853,977 n/a n/a 1,856,521 1,854,554
% change in liability - -0.2% 0.2% 0.2% -0.2% 0.1% -0.1% n/a n/a 0.1% -0.1%
All sensitivities were carried out independently

CORNERSTONE INSURANCE PLC
Consolidated Annual Report and Financial Statements For the year ended 31 December 2014
113
COMPANY STATEMENT OF VALUE ADDED
2014 % 2013 % GROSS PREMIUM WRITTEN N'000 N'000 Local 5,211,966 5,313,223 Foreign - -
Other Income Local 2,133,906 1,844,887 Foreign - -
7,354,872 7,099,951 Bought in Material and Services: Local (3,954,231) (4,610,052) Foreign Value Added 3,391,640 100 2,489,899 100
Applied as follows:
Employees Salaries and other Employees benefits 1,974,623 58 1,460,128 74
Government Taxation 107,819 3 8,756 -
-Retention and Expansion Depreciation and amortization 118,649 4 74,556 4Contingency Reserve 199,969 6 172,823 6Retained Profit for the year 990,580 29 773,636 16
3,391,640 100 2,489,899 100

CORNERSTONE INSURANCE PLC
Consolidated Annual Report and Financial Statements For the year ended 31 December 2014
114
GROUP STATEMENT OF VALUE ADDED
2014 % 2013 % N'000 N'000 GROSS PREMIUM WRITTEN Local 5,211,966 5,313,223 Foreign - -
Other Income Local 2,285,575 1,916,294 Foreign - -
7,495,541 7,229,517 Bought in Material and Services: Local (3,954,231) (4,610,052) Foreign Value Added 3,541,310 100 2,619,465 100
Applied as follows:
Employees Salaries and other Employees benefits 1,940,477 55 1,548,396 59
Government Taxation 91,208 3 9,844 -
Retention and Expansion Depreciation and amortization 120,057 3 74,745 3Impairment on debtors 443,086 12 126,117 5Contingency Reserve 199,969 6 172,823 5Retained Profit for the year 743,516 21 687,540 28
3,541,310 100 2,619,465 100
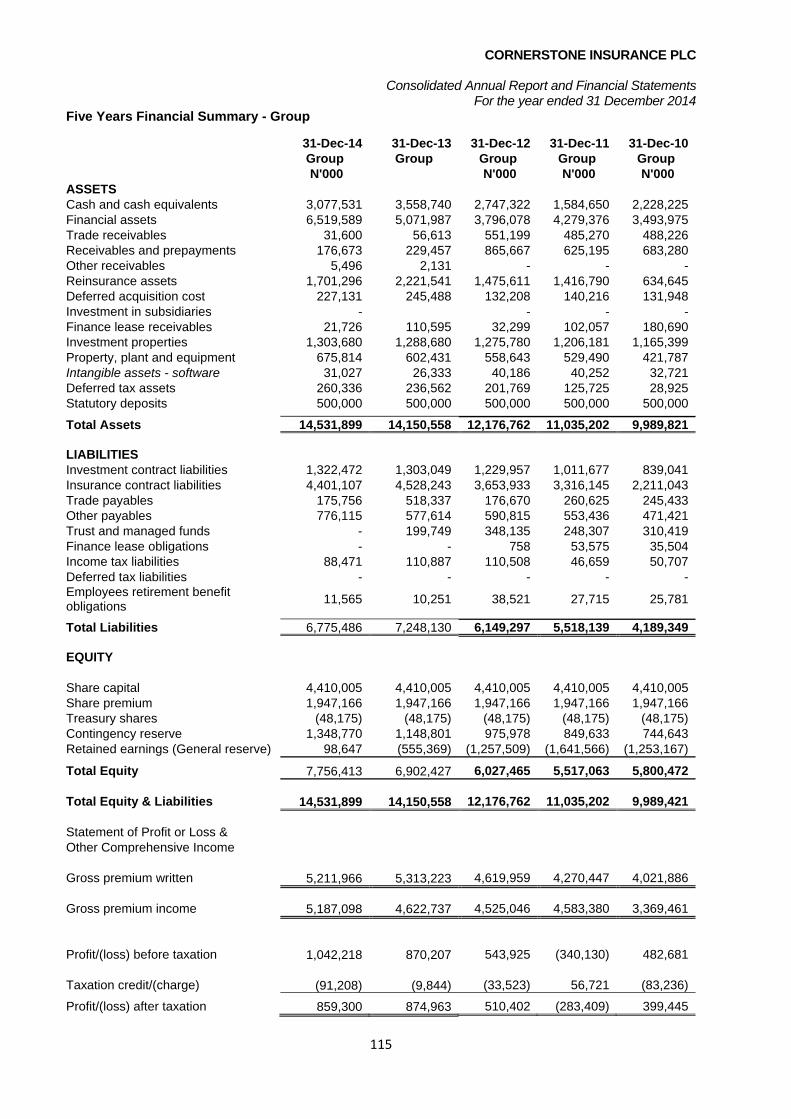
CORNERSTONE INSURANCE PLC
Consolidated Annual Report and Financial Statements For the year ended 31 December 2014
115
Five Years Financial Summary - Group
31-Dec-14 31-Dec-13 31-Dec-12 31-Dec-11 31-Dec-10 Group Group Group Group Group N'000 N'000 N'000 N'000
ASSETS Cash and cash equivalents 3,077,531 3,558,740 2,747,322 1,584,650 2,228,225 Financial assets 6,519,589 5,071,987 3,796,078 4,279,376 3,493,975 Trade receivables 31,600 56,613 551,199 485,270 488,226 Receivables and prepayments 176,673 229,457 865,667 625,195 683,280 Other receivables 5,496 2,131 - - - Reinsurance assets 1,701,296 2,221,541 1,475,611 1,416,790 634,645 Deferred acquisition cost 227,131 245,488 132,208 140,216 131,948 Investment in subsidiaries - - - - Finance lease receivables 21,726 110,595 32,299 102,057 180,690 Investment properties 1,303,680 1,288,680 1,275,780 1,206,181 1,165,399 Property, plant and equipment 675,814 602,431 558,643 529,490 421,787 Intangible assets - software 31,027 26,333 40,186 40,252 32,721 Deferred tax assets 260,336 236,562 201,769 125,725 28,925 Statutory deposits 500,000 500,000 500,000 500,000 500,000
Total Assets 14,531,899 14,150,558 12,176,762 11,035,202 9,989,821
LIABILITIES Investment contract liabilities 1,322,472 1,303,049 1,229,957 1,011,677 839,041 Insurance contract liabilities 4,401,107 4,528,243 3,653,933 3,316,145 2,211,043 Trade payables 175,756 518,337 176,670 260,625 245,433 Other payables 776,115 577,614 590,815 553,436 471,421 Trust and managed funds - 199,749 348,135 248,307 310,419 Finance lease obligations - - 758 53,575 35,504 Income tax liabilities 88,471 110,887 110,508 46,659 50,707 Deferred tax liabilities - - - - - Employees retirement benefit obligations 11,565 10,251 38,521 27,715 25,781
Total Liabilities 6,775,486 7,248,130 6,149,297 5,518,139 4,189,349
EQUITY
Share capital 4,410,005 4,410,005 4,410,005 4,410,005 4,410,005 Share premium 1,947,166 1,947,166 1,947,166 1,947,166 1,947,166 Treasury shares (48,175) (48,175) (48,175) (48,175) (48,175) Contingency reserve 1,348,770 1,148,801 975,978 849,633 744,643 Retained earnings (General reserve) 98,647 (555,369) (1,257,509) (1,641,566) (1,253,167)
Total Equity 7,756,413 6,902,427 6,027,465 5,517,063 5,800,472
Total Equity & Liabilities 14,531,899 14,150,558 12,176,762 11,035,202 9,989,421
Statement of Profit or Loss & Other Comprehensive Income
Gross premium written 5,211,966 5,313,223 4,619,959 4,270,447 4,021,886
Gross premium income 5,187,098 4,622,737 4,525,046 4,583,380 3,369,461
Profit/(loss) before taxation 1,042,218 870,207 543,925 (340,130) 482,681
Taxation credit/(charge) (91,208) (9,844) (33,523) 56,721 (83,236)
Profit/(loss) after taxation 859,300 874,963 510,402 (283,409) 399,445

CORNERSTONE INSURANCE PLC
Consolidated Annual Report and Financial Statements For the year ended 31 December 2014
116
Five- Years Financial Summary - Company
31-Dec-14 31-Dec-13 31-Dec-12 31-Dec-11 31-Dec-10 Company Company Company Company Company
N'000 N'000 N'000 N'000 N'000 ASSETS Cash and cash equivalents 3,425,849 3,715,242 2,931,876 2,146,026 2,615,505 Financial assets 6,490,566 4,580,031 3,530,347 3,814,929 3,185,054 Trade receivables 31,600 56,613 551,199 485,270 488,226 Receivables and prepayments 328,661 496,909 618,764 349,750 575,701 Other assets 5,496 2,131 - - - Reinsurance assets 1,701,296 2,221,541 1,475,611 1,416,790 634,645 Deferred acquisition cost 227,131 245,488 132,208 140,216 131,948 Investment in subsidiaries - 59,879 59879 30827 30827 Investment properties 1,303,680 1,288,680 1,275,780 1,206,181 1,165,399 Property, plant and equipment 673,562 598,856 555,907 524,731 417,449 Intangible assets - software 31,027 26,333 40,186 40,252 32,473 Deferred tax assets 175,804 170,722 135,929 27,580 Statutory deposits 500,000 500,000 500,000 500,000 500,000
Total Assets 14,894,672 13,962,425 11,807,686 10,682,552 9,777,227
LIABILITIES Investment contract liabilities 1,322,472 1,303,049 1,229,957 1,011,677 839,041 Insurance contract liabilities 4,401,107 4,528,243 3,653,933 3,316,145 2,211,043 Trade payables 175,756 518,337 176,670 260625 242,477 Other payables 743,179 548,296 615,028 384,483 431,495 Finance lease obligations 758 53,575 35,504 Income tax liabilities 87,199 90,268 73,932 42,507 45,394 Deferred tax liabilities - - - 52471 Employees retirement benefit obligations 8,145 7,967 37,602 27,715 25,781
Total Liabilities 6,737,858 6,996,160 5,787,880 5,096,727 3,883,206
EQUITY
Share capital 4,410,005 4,410,005 4,410,005 4,410,005 4,410,005 Share premium 1,947,166 1,947,166 1,947,166 1,947,166 1,947,166 Treasury shares (48,175) (48,175) (48,175) (48,175) (48,175) Contingency reserve 1,348,770 1,148,801 975,978 849,633 744,643 Retained earnings (General reserve) 499,048 (491,532) (1,265,168) (1,572,804) (1,159,618)
Total Equity 8,156,814 6,966,265 6,019,806 5,585,825 5,894,021
Total Equity & Liabilities 14,894,672 13,962,425 11,807,686 10,682,552 9,777,227
Statement of Profit or Loss & Other Comprehensive Income
Gross premium written 5,211,966 5,313,223 4,619,959 4,270,447 4,021,886
Gross premium income 5,187,098 4,622,737 4,525,046 4,583,380 3,369,461
Profit/(loss) before taxation 1,390,165 940,615 399,654 (350,101) 300,777
Taxation credit/(charge) (107,819) (8,756) 34,327 41,905 (82,582)
Profit/(loss) after taxation 1,190,549 946,459 433,981 (308,196) 218,195

CORNERSTONE INSURANCE PLC
Consolidated Annual Report and Financial Statements For the year ended 31 December 2014
117