corporate restructuring and wage dynamics - hec · pdf filecorporate restructuring and wage...
TRANSCRIPT

Corporate Restructuring and Wage Dynamics
John C. Dencker [email protected]
217-333-2383
Chichun Fang [email protected]
217-265-0954
School of Labor and Employment Relations University of Illinois at Urbana-Champaign
504 East Armory Avenue Champaign, IL 61820
Draft: April 30, 2010 Please do not cite without permission from authors
1
Corporate Restructuring and Wage Dynamics
ABSTRACT
Scholarly interest in understanding the role that corporate restructuring plays in the well-known
increase in wage inequality in recent decades has been growing, yet theory specifying how and
why restructuring influences inequality remains underdeveloped, and empirical evidence
examining wage patterns resulting from such firm level transformations has been sparse. We
seek to fill in critical gaps in knowledge in this area by developing a framework to assess effects
of two key types of restructuring—reductions in force (RIF), and the transformation of
compensation and performance management systems—on wage dynamics. We argue that both
types of restructuring transformed internal labor market (ILM) structures, thereby substantially
altering the wage patterns characteristic of these institutions, and ultimately leading to increased
inequality within and across occupational groups. We assess our predictions using twenty-five
years of personnel records from a Fortune 500 energy sector firm. Our results indicate that the
effects of ILMs on wages shifted following restructuring, as returns to seniority declined, and as
market forces had a stronger effect on starting salaries, particularly for blue-collar workers. As a
result, wage inequality increased dramatically for blue collar employees, yet less so for white
collar employees. We conclude by discussing implications of our study for research on
organizations, labor markets, and wage inequality.
2
Scholarly interest in understanding the significant increase in wage inequality in the U.S. since
1980s has generated a wealth of research on the origins of this phenomenon (e.g. Kim and
Sakamoto 2008; Mouw and Kalleberg 2010a). Yet, there exist a number of critical gaps in
knowledge in this area (Morris and Western 1999), such as the role that firms play in this
process,. One promising avenue of research to fill in these gaps is to examine the effects of
corporate restructuring on wage setting (cf. Kim and Sakamoto 2008), a common feature of the
corporate economy in recent decades (cf. Cappelli et al. 1997). However, theory specifying how
and why restructuring influences inequality remains underdeveloped. In addition, with the
exception of important research examining how firms manage effects of transformation
processes on wages (Fernandez, 2001), empirical evidence examining wage patterns resulting
from restructuring is sparse.
Gaps in knowledge of the effects of restructuring on wage inequality trace in no small
part to the wide variety of changes occurring during this widespread transformation process.
Thus, a challenge for scholars is to not only identify, but also specify, how different types of
restructuring influenced earnings. In particular, an important issue in linking different forms of
restructuring forms to wage inequality is to specify the mechanisms by which earnings are
transformed. We argue that one way of doing so is to assess how restructuring transformed
ILMs, and, in turn, the wage patterns characteristics of these institutional arrangements.
We focus on two common restructuring initiatives, namely corporate reductions in force
(RIF), and the transformation in compensation and performance management systems (cf.
Cappelli et al., 1997). First RIF eroded the employment protection offered by internal labor
markets (ILMs), arguably making wages more dependent on market forces (cf. Cappelli 2000;
Sørensen 2000). As a result, stable patterns of wages such as cohort effects (path dependencies

3
in effect of starting salary on current salary) should be transformed as entry level wages are
brought in line with external wages. Second, transformations in HR systems increased the
degree to which an employee’s pay depended on his or her performance. Thus, restructuring
efforts seeking to increase the variable component of pay should have a non-trivial effect on
wage patterns such as returns to seniority, as firm’s sought to increase the extent to which they
rewarded an employee’s performance.
We maintain that both forms of restructuring should have differential wage effects across
key occupational groups (i.e., blue-collar workers, white-collar clerical workers, and white-collar
managers), resulting in an increase in wage inequality within and between these groups. This is
so because the factors leading to the creation of ILMs differ for these different employee groups.
In this way, we seek to shed light on mixed evidence surrounding the nature of wage inequality
within and across occupations (cf. Kim and Sakamoto 2008; Mouw and Kalleberg 2010b).
We analyze our claims using data from personnel files of a Fortune 500 energy sector
firm for the period 1969 to 1993, as well as with evidence from internal corporate documents and
interviews with human resource managers in the firm. Our study offers a unique insight into the
effects of restructuring on wage inequality. It spans a periods of stability and change in ILMs,
includes multiple forms of restructuring, and allows us to analyze at a more fine grained level the
mechanisms influencing wage inequality within and across occupational groups.
The remainder of this article is structured as follows. We begin by highlighting the
determinants of ILMs for the occupational groups that we study, and discuss wage patterns
characteristic of these labor market structures. We then provide evidence on effects of two main
forms of restructuring—RIF and the transformation of a firm’s performance management and
reward systems, practices, and policies—on ILMs, and indicate how these changes should

4
influence several common types of wage patterns, and ultimately wage inequality. After
providing information on our data and methods, we present and discuss our results.
INTERNAL LABOR MARKETS AND WAGE PATTERNS
Prior to the onset of corporate restructuring, the employment relationship was strongly
influenced by ILMs—sets of rules and processes whereby employment and wage decisions were
made within firms rather than through a reliance on the external market (Doeringer and Piore
1971). In ILMs, employees were buffered from market competition with employment separation
decisions being the right of the employee rather than a firm (Sørensen and Kalleberg 1981).
Thus, the employment relationship between an employee and a firm was long lasting.
At a broad level, determinants of ILMs can be seen as differing according to the
occupational group to which an employee belonged. For blue-collar workers, unions played the
key role in the creation of ILMs. Unions gave their members a voice in the actions of firms, and
importantly, provided protection against layoffs and economic turbulence (Freeman and Medoff
1984). For example, layoffs were largely temporary, with more senior workers the last to be laid
off, and the first to be recalled, and unions provided supplemental benefits to workers who were
let go (Kochan, Katz and McKersie 1994). By contrast, for white collar managers, ILMs arose in
part from the investment of a firm and its employees in their human capital, resulting in a
specific asset unique to the relationship between a manager and the firm (cf. Becker 1994;
Williamson 1985), and for white collar clerical workers, both unions and human capital provided
job security characteristic of ILMs.
Wage patterns for employees in ILMs also differed by occupation. Through collective
bargaining, unions provided blue-collar workers with above market wages (e.g., Kochan, Katz

5
and McKersie 1994), with spill-over effects that increased the welfare of workers in non-union
settings (e.g., Budd 2005; Hirsch and Addison 1986). In addition, in firms where unions were
absent, the threat of unionization motivated firms to provide high enough wages to deflect union
organization drives (Kochan, Katz and McKersie 1994). In effect, unionism created a highly
formalized contract that linked workers and obligations to their jobs. A particular wage rate was
attached to each specific job, with unions controlling career income by setting up seniority rules
that allocate the job vacancies in the firm hierarchy for internal promotion (Budd 2005; Kochan,
Katz and McKersie 1994). Moreover, unions minimized wage inequality among their members.
For white collar managers, a firm relied less on the external market to adjust wages and
productivity, as it instead employed incentive systems to motivate managers (Sørensen 1994).
These systems promised future rewards to ensure that managers remained attached to a firm for
the duration of their careers, and that employees put forth the effort sought by the firm. Thus,
the employment relationship resembled a deferred compensation contract, with the wage of a
manager growing at a faster rate over time than productivity (Lazear 1979).
White collar managers also experienced a greater amount of wage inequality than did
blue-collar workers, in no small measure due to the many different hierarchical job structures in
ILMs. In these structures, pay was generally attached to the job, and was increasing in
increasing level, particularly at the top of the hierarchy (cf. Baker et al, 1994b). In addition, an
employee’s wages were a function not only of his or her ability to move up the organizational
job ladder, but also to earn salary increases within a given job. Although performance was a key
factor influencing rates of promotion (Lazear and Rosen 1981; Rosenbaum 1979) and salary
increases, due to a lack of variance in measures of employee productivity and differences in
factors influencing promotion rates in job levels, the link between performance and pay was
6
often limited at best (Foulkes 1980), with available evidence suggesting that pay rose at a greater
rate with time in a job than did performance (cf. Gibbs 1995; Medoff and Abraham 1980). Thus,
wage differences within cohorts were often limited.
As we discuss below, the influence of ILMs has been weakened through a sequence of
deregulation initiatives and organizational changes ( Card 1986; Hendricks 1994; Peoples 1998;
Cappelli 1992; Cascio, Young and Morris 1997). As a result, employees become exposed to
external market conditions (Cappelli et al. 1997; Eriksson and Werwatz 2005; Lazear and Oyer
2004), and firms became more inclined to reward high performing employees (Cappelli et al.
1997; Mitchell 1989; Zenger 1992)—with both factors changing the role of a firm in dynamic
employment relationships, shaping the wage distribution and influencing the way in which a firm
influences wage inequality.
CORPORATE RESTRUCTURING AND WAGES
Corporate restructuring refers to a process that affects workers at all levels of industrial and
postindustrial organizations (Frenkel 2003). It involves the positive language of reducing costs,
increasing profits, improving product and service quality, increasing share price, and responding
quickly to opportunities (Hirsch and De Soucey 2006). Due to corporate restructuring,
traditional career models such as long-term employment and job security are less common
(Cappelli et al. 1997; Cornfield, Campbell and McCammon 2001; Kochan, Katz and McKersie
1994; Newman 1988; Newman 1993; Osterman et al. 2001), as “new economy” employment
models redefine career paths, risks, and networks (Dobbin 2004; Hirsch and De Soucey 2006).
Beginning in the early 1980s, restructuring was often triggered by corporate raiders who
sought to increase profits through hostile takeovers (Hirsch 1986; Shleifer and Summers 1998).

7
Because corporate raiders were little concerned about the negative reputation stemming from
defaulting on a deferred compensation contract (Useem 1996), once they bought a company,
they installed new managers who would not uphold implicit contracts of previous management
(Shleifer and Summers 1998). Thus, there were strong market pressures on firms to minimize
labor costs by changing the employment relationship. Although these pressures were restricted
somewhat by the late 1980s, as advocates from managers and other societal groups prompted
states to enact anti-takeover legislation (cf. Jensen 1993), the pace of restructuring increased in
ensuing years as institutional investors pressured firms to increase organizational efficiency
(Useem 1996). These pressures too had important effects on the employment relationship, for
instance by changing the way that employees were evaluated and rewarded.
Corporate restructuring has been widespread, with most large firms engaging in multiple
extensive changes in organizations such as reductions in force and reorganizations of their
compensation and performance management systems (Cappelli et al. 1997; Cascio, Young and
Morris 1997). These changes were driven by a number of not yet fully understood factors (cf.
Baumol, Blinder and Wolff 2003; Cappelli 2000). For example, demand shifts stemming from
increased foreign competition and the availability of new forms of technology pressured firms to
make extensive changes to the way they operated, often by reducing the size of their workforces
in order to lower labor costs and increase their competitiveness (Baumol, Blinder and Wolff
2003). Yet, evidence suggests that these factors are insufficient to fully account for the nature
and extent of restructuring in recent decades, with the proximate causes often varying over time.
As a result of restructuring efforts such as RIF and the reorganization of compensation
and performance management systems, the employment relationship has become riskier for
employees along several dimensions. Firms engaging in RIF eliminated guarantees of protection
8
against layoff, making continued employment a function of market rather than non-market
factors (cf. Cappelli 1992), as firms had greater flexibility in replacing an employee if they could
find a more productive one at a given wage rate in the external market. Thus a firm would no
longer promise long-term employment and job security to all of its workers; instead, employment
outcome varied dramatically by types of employees and amounts of human capital (cf. Cappelli
2000; Cappelli et al. 1997; Cascio, Young and Morris 1997; Farber 2008; Freeman 2007;
Hamermesh 1989; Lepak and Snell 1999; Osterman 1987; Rosenbaum 1984; Youndt et al.
1996).1 In effect, RIF increased the degree to which market forces penetrated a firm, and
decreased the degree to which a firm relied on internal arrangements to link employee
productivity and wages (Sørensen 1994).
By transforming performance management and compensation systems, firms
dramatically altered the way they linked wages and productivity. In particular, firms made pay
more variable (i.e., more dependent on performance, and less dependent on seniority) (cf.
Cappelli et al. 1997). This transformation took a number of forms, such as the implementation
of bonus-based systems that decreased the recurring component of take-home pay. That is, since
a bonus was a one-time payment for performance in a given period of time (typically a year),
employees were forced to re-earn their wages in a given year. In some occasions, bonus is used
as a substitute to promotion (and hence salary increase), and such bonus-promotion tradeoff is
more likely when there is no vacancy in the higher level (cf. Dencker 2009). Firms also
transformed their performance management systems extensively. For instance, firms sought to
motivate managers to spend more time on appraisal, in an effort to reduce performance inflation
common in many ILMs (cf. Baker 1990).
1 A firm might prefer to retain “core” employees whose human capital is unique and valuable (Lepak and Snell 1999) and reward them using performance pay systems rather than seniority-based pay schemes (Osterman 1987).

9
In the following subsections, we highlight whether and how both forms of restructuring
that we study—RIF and transformations in compensation and performance management systems,
practices, and policies—alter multiple types of wage patterns characteristic of ILMs, namely
cohort and tenure effects of wages, returns to seniority, and starting wages.
Cohort and Tenure Effects
A key wage pattern in ILMs is that starting salaries have a strong effect on future earnings, a
phenomenon often referred to as a cohort effect. For instance, a study of employees in a large
service firm over a twenty year period showed that the discrepancy in entry wages of two
adjacent cohorts persisted after 15 years of tenure (Baker, Gibbs and Holmstrom 1994b).
Following changes in a firm’s compensation and performance management systems,
though, we expect that the link between starting salary and current salary should decline,
particular for white collar managers. First, although a firm benefits from relying on market
forces, some employees will be better off (e.g., more productive employees should command
higher wages, leading to greater salary increases). Second, this effect should be magnified by
changes to a firm’s compensation and performance management system. In firms employing a
forced performance distribution, as long as measured performance has an influence on salary,
there should be greater dispersion of earnings across employees than before.
We expect that cohort effects for blue-collar workers, by contrast, will be less influenced
by corporate restructuring. For example, unions tend to resist the implementation of pay for
performance systems. Thus, path dependencies in starting salaries might decline at a less rapid
rate for these workers relative to white collar workers.

10
Returns to Seniority
Wages can increase with seniority (tenure) for several reasons, such as the accumulation of firm-
specific human capital (Becker 1975), attaining a higher position in firm hierarchy (Lazear 1995;
Lazear and Rosen 1981), or a deferred compensation system which rewards employees with
increased wages over time as an incentive to remain attached to a firm (Gibbons and Waldman
1999; Gibbons and Waldman 2006). In the absence of dramatic institutional changes, the tenure
effect should apply to all employees no matter when an employee enters the firm and when the
wage data is recorded, provided that the hiring pattern is consistent so the likelihood of being
promoted does not vary much by year.
Due to changes in performance management systems, however, returns to seniority
should decrease, as firms replace their previous tenure-based systems with ones that reward them
primarily for their performance. Similar to the path dependency in starting salaries, the effect of
restructuring on returns to seniority should differ by employee type. For instance, many
restructuring initiatives were directed at salaried workers such as managers. In the reorganized
HR systems, managers were motivated to spend greater amounts of time evaluating subordinates,
and to attempt to minimize prior problems such as inflation in rankings where, for example,
significantly more than half of employees were evaluated as being “above average” (cf. Baker,
1990). Thus, with the desire to make pay more variable, firms would seek to reduce the extent to
which wage increases were dependent on time in a job and/or firm.
In contrast to white collar workers, blue-collar workers should be less influenced by
changes in compensation and performance management systems. For example, these workers
are often paid on an hourly basis, and traditionally were not evaluated on performance due in
part to union pressures to prevent the use of such systems. However, ultimately, returns to

11
seniority might decline for these workers depending on the extent to which they are easily
replaced by less expensive workers on the external market. Nevertheless, we expect that returns
to seniority for blue-collar workers should decline less than for white collar workers.
Starting Salaries
With the decline of labor market institutions such as ILMs, market forces play an increasingly
important role in wage determination. Firms will compete for “salaried” or “core” employees
and will replace “industrial” or “alliance” employees with less expensive replacements whenever
possible (cf. Lepak and Snell 1999; Osterman 1987). To decrease labor costs while preserving
the wages and benefits of current workers, firms might also adapt the “two-tiered” wage system
and compensate new employees at a much lower level than old ones (cf. Cappelli and Sherer
1990; Lee and Martin 1996; Martin and Peterson 1987; McFarlin and Frone 1990).
As a result of the increased incidence of market forces on the employment relationship,
starting salaries of employees should change to reflect those in the external market, albeit in
different ways for different groups. The above-market wages obtained by unions for most of
their members (with spill-over effects for other workers), meant that a firm could replace a blue-
collar worker with a less expensive one from the external market. Thus, starting wages of these
employees should decline following the onset of RIF. That is, once market forces penetrate a
firm’s boundaries, a firm can more easily replace a worker with a relatively less expensive one at
a given level of productivity.
For other employees, the effect of restructuring on starting wages is a bit less clear,
although there are some notions to draw on in this regard. As noted, due to firm-specific human
capital (and or to the existence of deferred compensation contracts), the starting salaries of white
12
collar employees would be lower than the wage they could receive on the external market (with
the implicit promise that these employees would receive an above market wage over time). Thus,
if market forces penetrate a firm’s boundaries to a greater extent due to RIF, starting salaries of
white collar employees in theory should increase relative to pre-RIF periods.
Wage Inequality
Given the predicted changes in wage patterns resulting from corporate restructuring, we argue
that wage inequality should increase for all types of worker groups throughout corporate
restructuring, albeit for different reasons. For blue collar workers, wage in equality will grow
partly because of a decline in starting salary and a two-tiered wage system. For white collar
clericals and managers, we expect wage inequality to increase because of bonus awards and pay
for performance compensation. For instance, Lemieux, MacLeod and Parent (2009) suggest that
firms increased wage inequality through employing pay-for-performance compensation schemes.
Using data from Panel Study of Income Dynamics (PSID) and National Longitudinal Study of
Youth (NLSY), they argue that adoption of pay-for-performance compensation explains around
24% of the growth in wage inequality in the U.S. between late 1970s and early 1990s.
Summary
We argue that the ILM is weakened through corporate restructuring processes, which in turn
influences wage outcomes in the following ways: (1) cohort and tenure effects should still persist,
(2) returns to seniority should decrease, (3) market forces should have increasing impacts on
starting salaries, and (4) wage inequality should increase

13
ORGANIZATIONAL SETTING
We analyze data obtained from confidential longitudinal personnel files of a Fortune 500 energy
sector firm for the period 1969 to 1993. We also provide information collected from internal
corporate documents and semi-structured interviews conducted with several of the firm’s HR
managers. Like most other large firms in the same time period (e.g., Baker, Gibbs and
Holmstrom 1994a; Baker, Gibbs and Holmstrom 1994b), the firm had an ILM composed of
hierarchically-ranked salary grade levels (SGLs) to which jobs and salaries were attached
(Gerhart and Rynes 2003; Spilerman and Petersen 1999). Non-exempt employees (clerical,
secretarial, and support staff) were in SGL 1 through 9, and exempt workers (managers and
professionals) were in SGL 7 through 24. Roughly 25% of employees were paid on hourly basis
and were not a part of the SGL system. We use the terms “white collar clericals”, “white collar
managers” and “blue collar workers” to denote these three broad categories, respectively.2 Top
managers, such as CEOs and vice presidents, were considered to be “above” the SGL system and
are not included in our analyses.
Table 1 shows the descriptive statistics that summarize the employee characteristics.
Employees in the firm that we study were paid relatively well. For those who were paid by
hours, mean hourly wages were two to three times higher than federal minimum wages at any
time in our data. The average union coverage was not high; around 15% blue collar workers
were covered by a labor union in any given year.3
2 An employee hired as an hourly worker could be promoted to a white collar clerical later in the career, so could a white collar clerical become a white collar manager. Neither the salary grade level system nor job requirements attached to each level were significantly changed through the time of study. 3 This number might be underestimated for two reasons. First, we only have union status “at censoring”, that is, when the employee is censored from the data. This should underestimate the union coverage since it is not uncommon that unions are decertified during 1980s. If employees belonged to a union that is decertified later, we will not be able to capture their union coverage. Second, there are roughly one-third of hourly workers in our data

14
-----------------------------
Insert table 1 about here
-----------------------------
Corporate Restructuring in the Firm
Like other firms in the 1980s and 1990s, the firm we study restructured multiple times, doing so
by undertaking several RIF and reorganizations of its human resource management systems,
practices, and policies (Cascio, Young and Morris 1997). Although the firm was not an industry
leader in the implementation of the different restructuring events, it tended to take these actions
at roughly the same time frame as its competitors did.
The first major restructuring occurred in the early to mid 1980s, when the firm
implemented an incentive pay program for its managerial workforce. This program allowed
managers to award subordinates with non-recurring bonuses (that is, the bonus was transitory in
that it did not result in an increase in a manager’s base pay). According to internal documents
from the firm, bonuses were to be based on individual performance, reserved for high performer,
and provided to qualified managers at the end of a calendar year.
The firm undertook two waves of RIF during the 1980s and early 1990s, with significant
cutbacks during each wave. The first RIF occurred in the mid 1980s, several years after it
implemented its bonus-pay system, and during a time of hostile takeover activity in its industry.
The firm was not taken over in this period, although as was the case in mature industries in this
period, a number of its competitors were (Ussem and Cappelli 1997). The second RIF occurred
in the early 1990s during a period when institutional investors sought to exert their increasing
having missing information about union coverage. These employees might have been covered by unions, but we count them as non-union members in order to obtain a conservative unionization effect on employment outcomes.
15
power by pressuring firms to change the way they were managed, and subsequent to regulatory
changes limiting takeovers.
In the interim between RIF, the firm transformed its reward system from one in which
pay was based on seniority in a job to one in which pay was contingent on an employee’s
performance relative to similar employees. In the new system, performance objectives were
designed to be measurable, attainable, relevant, and consistent across raters. This new system
was similar to other firms’ systems at the time: the firm sent senior managers to other firms to
study the system based changes that they made, and hired consultants to help design and
implement the system. As part of the change, performance records were eliminated soon after
pay decisions were made. According to the firm, this decision was enacted in order to minimize
potential bias in future performance rankings, in that prior performance in theory would be less
likely to be taken into account in measuring current performance.
DATA, MEASURES, AND METHODS
Data Set
The firm provided career records of a 25% random sample of U.S. employees between 1969 and
1993. Only employees hired after 1969 are included in our analysis in order to avoid potential
bias caused by left censoring due to incomplete career information of employees hired before
1968 (Petersen 1995). We only include full time employees in our analysis.
In the original data set provided by the firm, a new record is added whenever there is a
“career change” (such as hiring, salary change, promotion, demotion, transfer, etc.) for each
employee. To transform the data into a yearly panel, we keep only the last one record for each
employee in each year. Although we delete all records but the last one for each employee in any
16
given year, all information regarding promotion, demotion, and bonus awarded occurred during
the year are preserved. Hence, we have a “snapshot” of all employees in the firm in the end of
each year (Gibbs and Hendricks 2004). We perform our analysis based on these end-of-year
“snapshots” rather than event histories that could possibly occur at any given time during the
year. Our final sample includes a total number of 22,187 employees: 6,773 blue collar workers
(34,808 employee-year records), 10,099 white collar clericals (46,173 records), and 8,517 white
collar managers (67,276 records). An employee who experiences changes in occupation types
(for example, being promoted from a blue collar worker to a white collar clerical) is counted in
all the types that he or she ever belongs to. Thus, the summed number of employees in each
occupation type (6,773+10,099+8,517) is large than total numbers of employees (22,187).
Dependent Variable
We examine wage patterns and wage distributions over the twenty-five year period of the sample,
and hence, wage is the major dependent variable of interest. Provided in the data are the nominal
annual wages. Since the level of annual wage depends on both the level of hourly wage and the
number of hours worked for those who are paid on hourly basis, we only include full time
employees in our study to eliminate labor supply effect, otherwise an employee can have a low
annual wage because of either a low hourly wage or fewer hours of working. In order to make
wage distributions observed at different time comparable, all wage data are deflated to 2007 U.S.
Dollars. We also take the logarithm transformation of wage when necessary.
17
Independent Variables
In order to assess effects of corporate restructuring on wage patterns and inequality, we created a
dummy variable that represents the entire restructuring period relative to pre-restructuring years
(coded 1 if the observation year occurred at any point in time following the implementation of
the firm’s bonus pay system). Due to confidentiality agreements, we are unable to provide the
specific year in which the different events occurred, but do highlight the timing of the different
restructuring events relative to other years.
We also create several measures to capture effects of the occupations on wages and wage
inequality. In particular, we create two dummy measures that represent white collar clericals and
white collar managers (coded 1 if an employee belonged to a specific occupation and 0 if not).
Control Variables
We control for demographic, organizational, and human capital variables common in studies of
employment outcomes in large firms (cf. DiPrete 1987; Elvira 2001; Gibbs 1995; Gibbs and
Hendricks 2004; Lin 2005; Petersen and Saporta 2004; Podony and Baron 1997; Spilerman and
Petersen 1999): tenure in a job level, age, education, occupation, tenure in the firm, SGL, race,
sex, division occupied, starting wage, starting salary grade level, and rate of promotions between
hiring and the year of observation. We also control for the hazard of employment separation as
described below.
Age, tenure (and its squared term), and tenure in a job (and its squared term) are time
varying and updated in each year. Dummy variables for different education levels (high school
graduates, college graduates, and post-secondary) are generated with high school dropouts being
omitted in the regression. Gender is coded one for female employees and zero for male
18
employees. Race was coded one for minority (i.e. non-white) employees, and zero otherwise.
Additionally, since union coverage might influence the relative strength of bargaining powers
between employees and employers, we include the union coverage in each year as a dummy
variable.
We created a measure for the HR function based on an examination of many different job
titles, with the coding validated by several colleagues and HR practitioners. This measure was
coded one if the manager belonged to the HR function, and zero otherwise. We controlled for
effects of the different divisions in the firm with five dummy variables: one for the firm’s main
corporate office (the omitted case), a unique dummy for each of the firm’s three main divisions
(e.g., production), and a fifth dummy that contained several tertiary divisions.
We also consider how an employee’s performance influences his or her wage. As noted,
the firm eliminated all records of these evaluations. We thus consider several performance
proxies. Following Gibbs (1995), we argue that performance rises with time in a job before
declining, particularly for employees who have been in a job for many years and thus hold out
little hope for a promotion. We also control for whether an employee had ever been demoted
during her career and for the rate of promotion of the employee over her career. In supplemental
analyses, we examine a lagged measure of whether an employee received a bonus. These
performance proxies are time-varying, and updated in each year. Furthermore, we also try to
“restore” an employee’s performance evaluation from the data. Although the performance
evaluation records have been discarded, we know that wages are related to performance as well
as individual characteristics such as education, job level, and tenure. By regressing wages on all
individual characteristics observable in the data and estimating the regression residuals, we
19
obtain an estimate of performance evaluation contaminated with measurement errors.4 This
imputed measure is also used as a proxy for performance evaluation.
Finally, to correct for the potential selection bias due to job matching or employment
turnover, we control for likelihood of departure in a year whereby we first modeled a
multinomial employment separation measure—coded one if an employee retired from the firm,
two if an employee departed the firm because of resignation or being laid off, discharged, or
terminated in a given year, and zero otherwise—from which we generated a predicted likelihood
of employment separation that was included as a control measure using various approaches (Ahn
and Powell 1993; Castilla 2005; Castilla 2008; Lee and Maddala 1985; Phillips 2001).5
Preliminary analysis shows our results from different procedures are similar no matter which set
of predicted likelihood we use, so we opt for the competing risks Cox proportional hazard model
(e.g., Castilla 2008) as it is more commonly used in sociological literature.
Methods
We use various methods to analyze our data, and give an overview of the quantitative techniques
we use here and explain the details when we present the results. We use graphic presentations to
illustrate the change in wage patterns within the firm over time. Fixed-effect models similar to
those suggested in Topel (1991) are used to verify the change in the firm’s compensation system.
4 Note that wage can be expressed as an equation of individual characteristics, performance, and a random component. By regressing wages on individual characteristics, we can obtain residuals in this new regression as performance plus the random component in the original wage equation. 5 We tried two strategies to generate the predicted likelihood of separation: a two-step logistic regression model (Ahn and Powell 1993; Lee and Maddala 1985) and a competing risks Cox model (Castilla 2008; Phillips 2001). Both strategies have advantages and shortcomings. As an extension of the conventional Heckman two-step model to correct for sample selection bias, the method proposed in Ahn and Powell (1993) uses a multinomial logit model in the first step to allow more than 2 outcomes in the selection equation. In our analysis, although an employee either left the firm or not during the data period, different reasons of separation (retirement, resignation, layoff, discharge, etc.) might be the results of very different wage patterns and career types, and it is more appropriate to distinguish various reasons of separation/turnover rather than counting them all together as a single type of separation.

20
Finally, the effect of corporate restructuring on wage inequality is estimated using a semi-
parametric variance decomposition method introduced in DiNardo, Fortin and Lemieux (1996).
We follow the strategies in Baker, Gibbs, and Holmstrom (1994b) to test for cohort
effects. Similar procedures for firm-level data analysis have been widely adopted in previous
studies (Gibbs and Hendricks 2004; Lin 2005). We verify the changes in the firm’s
compensation system using fixed effect estimations similar to the two-step strategy in Topel
(1991). That is, returns to tenure and returns to performance are estimated using a model in
which employee-job level fixed effects are added. Hence, we only focus the returns to job tenure
within the same salary grade level, regardless of firm tenure. We adopt this strategy to eliminate
potential bias in our estimation caused by other factors that can possibly alternative the
relationship between tenure and wages (see Altonji and Williams 2005 for a review).
A semi-parametric variance decomposition method proposed in DiNardo, Fortin and
Lemieux (1996) is also used to assess how restructuring changed the wage distribution, and
hence wage inequality, within the firm. Compared to Oaxaca decomposition (Oaxaca 1973),
which assumes that the effect of treatment (in this case firm restructuring) is constant across the
whole wage distribution, the method we use allows different treatment effects across different
segments of the wage distribution. This enables us to assess different effects of firm restructuring
at various points across the wage distribution.
RESULTS
We begin by providing some graphic descriptions of wage patterns over time. Figures 1 through
3 replicate figure 2 in Baker, Gibbs, and Holmstrom (1994b) and show the group wage patterns
of each cohort that entered since 1969. The solid baseline in each graph connects the mean
21
starting wage of the cohort entered in each year. There is a different line deviating from the
baseline every year, each of these lines indicates the year-by-year mean wages of that specific
cohort. For example, the top-most dashed line in figure 2 indicates the year-by-year mean wages
of white collar clericals who entered the firm in 1969.
------------------------------------------
Insert figures 1, 2, and 3 about here
------------------------------------------
Two observations emerge from an inspection of figures 1 through 3. First, there is a
significant cohort effect, as huge discrepancies existed among cohorts who entered the firm in
different years. A more notable trend is the decrease in entry wages for blue collar workers
between the late-1970s and mid-1980s. Second, there is also a tenure effect, shown by the nearly
parallel wage profiles of cohorts entered at different years, especially for white collar employees.
A formal test of cohort and tenure effect is provided is provided in a subsequent section.
Figure 1 also shows a significant trend of decreasing starting salaries for blue collar
workers. To further explore the impact of restructuring on starting salary, we follow the
literature in the effect of deregulation on wage outcomes (e.g., Hendricks 1994; Peoples 1998)
and use external wage data to show what the wage patterns would have been if there were no
corporate restructuring in the firm that we study. We use the 1969-1993 wage series in
manufacturing industry from Current Employment Statistics (CES).
--------------------------------------
Insert figures 4 and 5 about here
--------------------------------------
22
It is clear in figure 4 that mean wage patterns for all three occupations (blue collar
workers, white collar clericals, and white collar managers) were pretty stable in the 1970s.
However, blue collar workers experienced a real wage decrease in the 1980s, while white collar
clericals and managers experienced real wage increases. On the other hand, CES wage series
somewhat decreased in the 1970s and declined significantly in the 1980s. It suggests that blue
collar workers suffered from wage loss while white collar employees gained from restructuring.
The contrast in figure 5 is even more dramatic. When the CES wage series is plotted
along with starting salaries of blue collar workers over time, starting salary of blue collar
workers declined much faster than the overall wage level in manufacturing industry.6 It is
evident that corporate restructuring drove the starting salary downward for blue collar workers,
which has huge implications on wage inequality within the firm.
------------------------------------------
Insert figures 6, 7, and 8 about here
------------------------------------------
Figures 6 through 8 give a graphic presentation of wage dispersion by occupational
group. The 10th, 30th, 50th, 70th, and 90th wages percentiles in each year are shown in each graph.
Overall, the lower tail inequality (the difference between the 50th and 10th percentiles) increased
dramatically for blue collar workers. Both upper tail (the difference between the 90th and 50th
percentiles) and lower tail inequality increased at similar paces for white collar clericals. For
white collar managers, upper tail inequality increased faster than the lower tail side, which is
consistent with the observations in Lemieux, MacLeod and Parent (2009).
6 The CES series does not decline as much partly because it contains all workers in manufacturing industries, not only new-hired workers.
23
In order to show more clearly the changes in inequality within and across groups (how
wage dispersion varied over time), in figures 9 and 10 we provide the relative change of the 50-
10 wage differential, and the 90-50 wage differential. Figure 9 plots the ratio of 50th to 10th wage
percentiles throughout 25 years, with the ratio in 1969 normalized to one for each occupation of
worker. It is clear that 50-10 wage differential increased over time for all three occupations,
especially for the blue collar workers (mostly due to decreasing starting salaries, also see figures
1 and 6). Figure 10 plots the ratios of 90th to 50th wage percentiles in a similar manner. The
ratios for white collar clericals and managers increased over time at similar magnitudes of
respective 50-10 ratios. The ratios for blue collar workers are more variable.
----------------------------------------
Insert figures 9 and 10 about here
----------------------------------------
Cohort and Tenure Wage Effects within the Firm
We test cohort effects for three types of employees separately (blue collar, white collar clericals,
white collar managers). We first cluster the employees who entered the firm in the same year
and have the same firm tenure as one group and look at the mean wages of each group. It is
expected that the group wage can be influenced by when the group entered the firm (cohort
effect), how long the group has stayed with the firm (tenure effect), and in which year the wage
is recorded (year effect). It is a well-know problem that it is impossible to statistically test these
three effects separately, since any two of these three variables (entering year, firm tenure, and
year of observation) can jointly decide the other. For example, if we observe the wage in 1990
of a cohort who entered in 1980, this cohort must have stayed with the firm for 10 years. And

24
hence, a regression equation with wages as the dependent variable and entering year, firm tenure
and year of observation as the independent variables is not identifiable. Alternatively, we follow
a similar strategy as the one in Baker, Gibbs and Holmstrom (1994b) to impose a parametric
constraint for the tenure effect to eliminate the perfect multicollinearity among entering year,
firm tenure, and year of observation (cf. Yang and Land 2008; Yang et al. 2008). The results are
shown in table 2.
-----------------------------
Insert table 2 about here
-----------------------------
In model 1, group wages are regressed on tenure dummies and year of observation
dummies. In model 2, we remove all tenure dummies and add polynomials of firm tenure
sequentially (linear, quadratic, cubic, etc.) until model 1 is no longer statistically different from
model 2.7 In the final step, cohort dummies are add to model 2, and the regression results are
shown in model 3. Since tenure is controlled without using the full set of tenure dummies, the
perfect multicollinearity problem is eliminated and model 3 is identifiable. Model 3 is
significantly different when tested against model 2 for all three types of workers, implying a
statistically significant cohort effect. When the employees entered the firm will impact their
wage levels, everything else being equal. Combining with the significant polynomial of tenure
terms in model 2, we conclude that both cohort and tenure influence wages at the group level.
7 Unlike the linear trend of the tenure effect found in Baker, Gibbs and Holmstrom (1994b), we fit our wage data with both linear and quadratic terms of tenure for white collar workers, and all linear, quadratic, and cubic terms are used to fit the tenure trend for blue collar workers (see table 2). Consequently, model 2 for three types of workers is slightly different. Model 2 hence controls for both year and tenure effects as model 1 but uses a polynomial trend for tenure effect rather than a full set of tenure dummy variables.

25
Effects of the Transformation of the Firm’s Performance Management System
A challenge in estimating changes in the firm’s performance management system on returns to
seniority is that such returns are difficult to estimate (Altonji and Shakotko 1987; Altonji and
Williams 1993; Altonji and Williams 2005; Topel 1991).8 Since we include employee-job level
fixed effects, only the returns to job tenure are identifiable in our model. To assess the change in
the returns to seniority and other factors, we add the interaction terms between dummy variable
indicating records observed after firm restructuring and the variables of interest (job tenure,
squared term of job tenure, etc.)
Fixed effect estimation results for blue collar workers are shown in table 3. Model 1 is
the baseline model. A dummy variable that indicates records observed after the year of
compensation policy change is added in model 2. Two interaction terms are added in model 3,
while another two interaction terms are added in model 4. Coefficients on these interaction
terms indicate how returns to seniority, the rate of promotion, and imputed performance change
following restructuring. Models 3 and 4 both show a consistent result that returns to job tenure
decrease after restructuring. In model 4, positive coefficients on two newly added terms indicate
the returns to rate of promotion and imputed performance increase after the implementation of
8 While returns to seniority are believed to be positive, the magnitude is hard to estimate. Altonji and Shakotko (1987) proposed a model where the returns to seniority is decomposed into returns to “true” seniority and returns to job matching. They argued that ordinary least square (OLS) estimate of returns to seniority without controlling for individual heterogeneity can be upward biased because good job matches tend to last longer than bad matches, and OLS estimates of returns to seniority hence include both returns to seniority and returns to matching. To correct for the bias, they proposed an instrumental variable approach to isolate the effect of seniority on wages from the effect of job matching. Topel (1991), in turn, claimed that Altonji and Shakotko might over-correct the bias and proposed a two-step first difference estimator. Altonji and Williams (2005) revisited the literature and concluded that the direction and magnitude of bias depend on the error structure of the data and is an empirical question. According to Altonji and Shakotko (1987), it is very likely that the returns to seniority in our data would be much higher than the population mean in the U.S. labor market. Due to the nature of our data, employees with longer tenure have more observations than those with short tenure. If people with longer tenure tend to have better job matches, the overall returns to job matching (which is not observable and will be attributed to returns to seniority in an OLS model) may be high. We hence adopt a similar strategy as the one used in Topel (1991) and include employee-job level fixed effect in our model. Consequently, we look at the returns to seniority within a job level to avoid any spurious correlations between wages and firm tenure across salary grade levels.

26
the new compensation policy. More surprisingly, model 4 suggests the returns to job tenure
decrease by around 60% under the new compensation policy (returns to job tenure is 0.0181 and
the coefficient on the interaction term is negative 0.0103; returns to the squared term of job
tenure is negative 0.0009 while the coefficient on the respective interaction is 0.0006). While the
relationships between wages and job tenure remains curvilinear with a decreasing return to job
tenure, its magnitude decreases significantly. Similar comparisons of coefficients in model 4
also suggest that the returns to rate of promotion and the returns to imputed performance both
increase by more than 500%. We hence conclude that the change in the firm’s performance
management system had a huge impact on the factors that explain wage attainment.
-----------------------------------------
Insert tables 3, 4, and 5 about here
-----------------------------------------
Tables 4 and 5 show the estimations for white collar clericals and white collar managers.
The results show that returns to seniority decrease and returns to the rate of promotion and
imputed performance increase. The magnitudes of changes are not as big as those for blue collar
workers, partly because there are specific wage ranges for each salary grade level that restrict the
fluctuation of wages within the same level.9
Although the above estimating strategy yields better estimates of returns to seniority, the
inclusion of employee-job level fixed effects obscures the impact of changing compensation
9 As a robustness check, we also perform our analysis on another more restricted sample, in which only employees who were hired before the onset restructuring and were still employed after the change of compensation system are included. Including employees hired both before and after restructuring in the analysis may lead to potential selection bias since a performance-based compensation system attracts very different types of employees than a fixed rate or a seniority-based one (Lazear 1995). By looking at employees who “experienced” the restructuring, we can separately identify the effects of restructuring and changing working characteristics. Regression results using this restricted sample are largely consistent with what we conclude above, where returns to tenures decreases by one third to a half after corporate restructuring.

27
policies on wages across employees. For example, the skill-biased technological change (SBTC)
argument suggests that technological developments in 1980s may have various levels of
influences on job performance depending on the type of job performed and the level of
technology reliance (c.f. Card and DiNardo 2002; DiNardo and Pischke 1997; Fernandez 2001;
Krueger 1993). Since the type of job does not vary within an employee-job level match, the
impacts of changing performance manage system on various job types can only be estimated
without employee-job level fixed effects.
The raw data provided by the firm has very detailed information on job titles, which can
be used to infer the type of job performed. Most of the jobs in this firm fall into 4 broad
categories of occupation in 2000 U.S. Census occupation codes: “management occupations”
(including operation managers, administrative services managers, marketing and sales managers,
financial managers, human resource managers, engineering managers, etc.), “business operations
and finance specialists” (including purchasing agents, claim adjusters, cost estimators, human
resource, management analysts, accountants, budget analysts, financial analysts, etc.), “computer
and mathematical occupations” (including computer scientists and system analysts, computer
programmers, computer software engineers, database administrators, network and computer
system administrators, etc.), and “production operations” (including most of the engineering,
machinery operations, and refinery jobs in the firm).
We rely on these broad occupation categories to assess whether changes in performance
management systems induced different wage outcomes in these occupations. The results are
shown in table 6. In order to eliminate wage variations not caused by the change in performance
management system, only employees who are hired before the onset of restructuring and are still
with the firm at the end of restructuring are included in this set of analyses.
28
Model 1 is an ordinary least square regression of log real salary on a set of control
variables on individual and job characteristics (only coefficients on key control variables are
listed in the table). Consistent with our earlier results, overall salary decreased after the onset of
corporate restructuring. A post-restructuring dummy variable and the interactions between post-
restructuring dummy and tenure (both job tenure and job tenure squared) are added in model 2;
again it confirms that returns to seniority decreased after restructuring. Also, consistent with our
earlier results, overall salary decreased after the onset of corporate restructuring. Interactions
between post-restructuring dummy and dummy variables of three “job types” (management,
business and finance, and computer) are added in model 3. The result indicates that, comparing
to engineers and production workers which accounts for around 50% of the work force within
the firm, employees in management, business, and computer jobs received a higher wage
premium after the restructuring. This suggests that the impacts of changing performance
management system are different across job types, as some people benefit more from the
evolution of information technology in 1980s. Such results are also consistent with the finding
that within-group component of wage inequality increased in 1980s.
Finally, three-way interactions among post-restructuring dummy, job tenure, and job
types are added in model 4. A significant coefficient on a three-way interaction indicates that the
degree of decreasing returns to seniority is different for a specific job type. And our results
suggest that employees in business and management jobs experienced less decreasing returns to
seniority than employees in other jobs in post-restructuring jobs. Note that, since the magnitude
of the coefficients on three-way interactions do not exceed the those on the interactions between
post restructuring dummy and job tenure, our conclusion that overall returns to seniority

29
decreased after corporate restructuring still holds and is not weakened by the significance of
three-way interactions.
-------------------------------------
Insert tables 6 and 7 about here
-------------------------------------
One potential problem of this strategy is, nevertheless, that employees naturally became
older after they experienced restructuring. For example, the literature has shown that returns to
seniority may decrease for older workers, mostly due to decreasing employee productivity and
employer learning (cf. Altonji and Pierret 2001; Gibbons and Waldman 1999; Gibbons and
Waldman 2006; Lazear 1979; Lazear 1995). Hence, the decreasing returns to seniority that we
observe can be a result of restructuring and changing compensation policy or simply because
employees became older. A natural test is to re-estimate the models in table 6 using employees
who were hired and quit before the restructuring, since restructuring should have no impact on
them. The results of such robustness test are shown in table 7. We use all the pre-restructuring
employees and “pretend” that there were a restructuring during that period. Such “counterfeit”
restructuring should not have any impact on wage patterns and wage distribution, and indeed all
interaction terms become insignificant. Consequently, the results that we report in table 6 do
capture the impacts of changing performance management system and compensation policies.10
Effect of Corporate Restructuring on Wage Inequality
10 The same strategy of robustness check can be applied on three occupations separately, in other words, we can also re-estimate the models in tables 3 through 5 using a “counterfeit” restructuring similar to the one in table 7. We did so and indeed found the changes in seniority became insignificant. Results are available upon request.
30
In order to separate the effect of the broad restructuring period on the wage distribution from
those of other factors, we ask the question “what would the pre-restructuring wage distribution
have been had employee characteristics attained the post-restructuring level.”11 A semi-
parametric approach (DiNardo, Fortin and Lemieux 1996, henceforth DFL) is used to construct a
“counterfactual” pre-restructuring wage distribution in which each individual employee is
weighted in a way that overall employee characteristics, such as age, gender, race, schooling,
tenure, and union coverage, resemble those in the post-restructuring level. Such a
“counterfactual” distribution is then compared to the actual post-restructuring wage distribution
to obtain the pure effect of restructuring on wages. Hence, the discrepancy between the
“counterfactual” and the actual distributions can be interpreted as the change in wage distribution
due to factors other than employee characteristics.
-----------------------------------------------
Insert figures 11, 12, and 13 about here
-----------------------------------------------
Figures 11 through 13 graphically show the results of DFL decomposition. We use the
wage distribution in 1981 as the “pre-restructuring” distribution and the one in 1990 as the “post-
restructuring” one. The selection of timing is somewhat arbitrary, and we choose 1981 and 1990
as the starting and end points of the whole process of corporate restructuring, which took place in
1980s. Using other start points (such as 1980 or 1982) and ending points (1989 or 1991) yield
similar results.
There are three panels in each graph: the dashed line in the top-left panel denotes the
actual 1981 real wage distribution, and the solid line in the same panel denotes a “weighted” real
11 This question can be asked in an alternative way as “what the post-restructuring wage distribution would have been had employee characteristics remained at the post-restructuring level”. This, however, only influences which distribution is weighted and will not alter the final result.
31
wage distribution, which is the distribution that would have prevailed if the employee
characteristics in 1981 were the same as those in 1990. The solid line in top-right panel is the
same as the solid line in top-left panel, and the dashed line is the actual real wage distribution in
1990. Finally, the difference of the two lines in top-right panel is shown in the bottom-left panel.
If there is no difference in the two lines in the top-right panel, a horizontal line at zero should be
observed in the bottom-left panel; this means employees across the whole wage distribution are
paid in the same way in 1981 and 1990 conditional on their characteristics. However, we do not
observe a straight line in the bottom-left panel in figure 11.
We observe some positive difference when the logarithm of real wage is around ten
(equivalent to $22,026 in 2007 Dollars) and eleven (equivalent to $59, 874 in 2007 Dollars), and
we observe some negative difference when logarithm of real wage is between ten and eleven.
This indicates, conditional on worker characteristics, fewer people are paid between $22,026 and
$59,874 (in 2007 Dollars) in 1990 compared to 1981; more people are paid around $22,026 and
around $59,874 in 1990 than in 1981. Briefly, the wage distribution in 1990 is more polarized
than in 1981, holding employee characteristics constant.
Similar inspections in the bottom-left panels of figures 12 and 13 suggest the wage
distributions for white collar workers are more skewed to the left in 1990 than in 1981—the firm
is more likely to pay a higher wage than a lower wage to white collar workers when employee
and job characteristics are held constant. Since wages are measured in logarithm forms here,
such a “shift” in compensation scheme also indicates increases in wage inequality. Moreover,
the discrepancy between weighted 1981 and actual 1990 distributions is larger for white collar
managers (figure 12) than for white collar clericals (figure 13), implying the change in
compensation system that inclines to reward top performers impacted white collar managers
32
more than white collar clericals. Overall, the change of wage patterns for white collar workers
under the semi-parametric decomposition show similar mechanisms as the well-documented
skill-biased technological change (Autor, Katz and Krueger 1998; Fernandez 2001). After
corporate restructuring, wage inequality increased for all types of employees.
DISCUSSION
We examine the role of the firm’s compensation practices in influencing wage patterns, wage
distributions, and wage inequality. We find significant cohort and tenure effects. Employees
entered the firm in different years receive very different wages. Conditional on entering wages,
wage growth follow similar patterns no matter when the employees entered the firm. Also,
starting salaries for blue collar workers were increasingly influenced by external market forces.
The returns to seniority decreased by one-third to one-half after corporate restructuring than
before, as the firm introduced the performance-based compensation system. Employees in
management, business and finance, and computer-related jobs also experienced better wage
outcomes after restructuring than their colleagues in engineering and operation, suggesting that
employees in certain occupations may have benefited more from the changing performance
management system.
A semi-parametric strategy was used to compare wage distribution before and after
corporate restructuring and implementation of performance-based compensation system. Holding
individual backgrounds and job characteristics consistent, higher wage earners were more likely
to be paid even higher after restructuring. The effect of restructuring on low wage earners differ
by types of employees—lower-paid blue collar employees were paid even lower after
33
restructuring, while the whole wage distribution shifted rightward with a flatter upper tail for
white collar employees. In brief, wage inequality increased after restructuring.
Overall, our findings indicate that corporate restructuring reduced effects of labor market
structures on wages, such as those related to starting wages of blue collar employees. These
patterns help to explain why wage inequality began to increase in the early 1980s. In particular,
our findings show a considerable decline in starting wages of hourly employees throughout the
1980s, a general increase in starting salaries for white collar managers for part of this time
frame—and stagnant wages for white collar clericals.
Our findings have a number of important implications for research on inequality,
organizations, and labor markets. For instance, they reveal that a non-trivial percentage of the
increase in wage inequality from the 1980s onward was due to the elimination of labor market
structures, especially those related to the barriers between employees and the external labor
market—that is, an ILM—and transformations in rules governing wage setting. In other words,
absent the erosion of these structures, wage inequality arguably would have been lower.
Our findings also shed light on debates about efficiency wages and inter-industry wage
differentials (cf. Krueger and Summers 1988). That is, the firm we studied reduced starting
wages for blue collar employees, while maintaining or increasing starting salaries for SGL (white
collar) employees. Moreover, results suggest that the firm did not limit wage inequality within
cohort and employee groups as in the past. Both of these outcomes are consistent with findings
that industries previously characterized by high wages for all employee groups, as was the case
in the industry of the firm we studied, experienced a decline in real wages. Thus, our findings
suggest that notions of equity within organizations have eroded in recent decades, and raise
important concerns regarding generational and occupational differences in work outcomes.

34
Our results are consistent with economic accounts such as the recent study by Lemieux,
MacLeod, and Parent (2009) who find that pay-for-performance systems account for roughly
one-fourth of the growth in variance in male wages from the late 1970s to the early 1990s.
However, they counter recent claims of labor economists that cohort effects (i.e., the staying
power of starting salary on current salary over periods of time) trace to task-specific human
capital (Gibbons and Waldman 2006), rather than to institutional effects such as seniority based
payment practices.
Because the findings reported in this article stem from one large firm, there may be
questions regarding potential generalizability. Several factors reduce these concerns. First,
results are largely similar to findings from other large firms in the 1970s (cf. Lazear 1992;
Petersen and Saporta 2004). Second, like most large firms, the firm we studied restructured
multiple times (cf. Cascio, Young and Morris 1997), and relied on external advice from
consultants on the design and implementation of restructuring initiatives, as well as from senior
managers sent to other firms to examine best practices for restructuring. Third, it is important to
note that organizational theory has frequently been advanced and tested with single-firm
evidence (cf. Fernandez, 2001). Fourth, our study is a response to the call to conduct firm-level
studies in order to better understand the organizational-level mechanisms in wage determination;
and hence, we position our study largely as a compliment, rather than a substitute, to the
literature. Finally, as noted, we do not have records of employee performance, which would
provide additional insight into the determinants of wage inequality within the firm. However, we
have attempted to overcome this limitation by using performance proxies and imputing
performance, and our results do seem to be robust.

35
CONCLUSION
We address how corporate restructuring in 1980s reframed employment relationships and
reshaped wage patterns, with a specific focus on the changes in firm-level wage inequality. Our
findings suggest that job and wage structures within the firm hierarchy continued to play a key
role in employee earnings, as cohort and tenure wage effects persisted throughout the firm
restructuring period. However, their effects were weakened through RIF and the transformation
in performance management and compensation system, especially with respect to returns to
seniority. Hence, while some internal labor market features were preserved throughout the
restructuring period, we also observe a more polarized wage structure as the firm was more
inclined to reward high performers and pay new hires at lower wages. We argue that such
changes in the firm’s compensation policy led to an increase in wage inequality within the firm.
Our study helps to fill in the critical knowledge gaps in the literature on wage inequality
by describing the previously understudied roles of firm restructuring, and the transformation of
compensation policies on increasing inequality, highlighting the underlying process in doing so.
We position our study as a complement to the literature on inequality: the literature and current
study have mostly focused on economy-wide antecedents of increasing wage inequality such as
skill-biased technological change and occupation, while we assess the change in inequality from
a firm-level point of view in order to indentify the process that led to the changing wage
structure in 1980s. This is also a response to the call of firm-level studies in the recent
sociological literature of wage inequality. While firm level studies like ours unavoidably may
have to face the question of generalizability, some of our results are consistent with the findings
in other studies, and we believe our study can shed light on other important facets of increasing
wage inequality.

36
REFERENCES
Ahn, Hyuntaik, and James L. Powell. 1993. "Semiparametric Estimation of Censored Selection
Models with a Nonparametric Selection Mechanism." Journal of Economics 58:3-29.
Altonji, Joseph G., and Charles R. Pierret. 2001. "Employer Learning and Statistical
Discrimination." Quarterly Journal of Economics 116:313-350.
Altonji, Joseph G., and Robert A. Shakotko. 1987. "Do Wages Rise with Job Seniority?" Review
of Economic Studies 54:437-459.
Altonji, Joseph G., and Nicholas Williams. 1993. "Using Wage Growth Models to Estimate the
Returns to Experience, Seniority, and Mobility Wage Growth." Pp. 327-355 in Labor
Demand and Equilibrium Wage Formation, edited by J. C. van Ours, G. A. Pfann, and G.
Ridder. New York, NY: Elsevier.
—. 2005. "Do Wages Rise with Job Seniority? A Reassessment." Industrial and Labor Relations
Review 58:370-397.
Autor, David H., Lawrence F. Katz, and Melissa Kearney. 2008. "Trends in U.S. Wage
Inequality: Revising the Revisionists." The Review of Economics and Statistics 90:300-
323.
Autor, David H., Lawrence F. Katz, and Alan B. Krueger. 1998. "Computing Inequality: Have
Computers Changed the Labor Market?" Quarterly Journal of Economics 113:1169-1213.
Baker, George P. 1990. "Pay for Performances: Causes and Consequences." Journal of Applied
Corporate Finance 3:50-61.
Baker, George P., Michael Gibbs, and Bengt Holmstrom. 1994a. "The Internal Economics of the
Firm: Evidence from Personnel Data " Quarterly Journal of Economics 109:881-919.
—. 1994b. "The Wage Policy of a Firm." Quarterly Journal of Economics 109:921-955.

37
Baumol, William J., Alan S. Blinder, and Edward N. Wolff. 2003. Downsizing in America:
Reality, Causes, and Consequences. New York, NY: Russell Sage Foundation.
Becker, Gary S. 1975. Human Capital. New York, NY: Columbia University Press.
—. 1994. Human Capital: A Theoretical and Empirical Analysis with Special Reference to
Education. Chicago, IL: University of Chicago Press.
Borjas, George J., and Valerie Ramey. 1995. "Foreign Competition, Market Power and Wage
Inequality." Quarterly Journal of Economics 110:1075-1110.
Budd, John W. 2005. Labor Relations: Striking a Balance. New York, NY: McGraw-Hill Irwin.
Cappelli, Peter. 1992. "Examining Managerial Displacement." Academy of Management Journal
35:203-217.
—. 2000. "Examining the Incidence of Downsizing and Its Effect on Establishment
Performance." NBER Working Paper #7742.
Cappelli, Peter, Laurie Bassi, Harry C. Katz, David Knoke, Paul Osterman, and Michael Useem
(Eds.). 1997. Change at Work. New York, NY: Oxford University Press.
Cappelli, Peter, and Peter D. Sherer. 1990. "Assessing Worker Attitudes under a Two-Tier Wage
Plan." Industrial and Labor Relations Review 43:225-244.
Card, David. 1986. "The Impact of Deregulation on the Employment and Wages of Airline
Mechanics." Industrial and Labor Relations Review 39:527-538.
Card, David, and John E. DiNardo. 2002. "Skill-Biased Technological Change and Rising Wage
Inequality: Some Problems and Puzzles." Journal of Labor Economics 20:733-783.
Cascio, Wayne F., Clifford E. Young, and James R. Morris. 1997. "Financial Consequences of
Employment-Change Decisions in Major U.S. Corporations." Academy of Management
Journal 40:1175-1189.
38
Castilla, Emilio J. 2005. "Social Networks and Employee Performance in a Call Center."
American Journal of Sociology 110:1243-1283.
—. 2008. "Gender, Race, and Meritocracy in Organizational Careers." American Journal of
Sociology 133:1479-1526.
Chay, Kenneth Y., and David S. Lee. 2000. "Changes in Relative Wages in 1980: Returns to
Observed and Unobserved Skills and Black-White Wage Differentials." Journal of
Econometrics 99:1-38.
Cornfield, Daniel B., Karen E. Campbell, and Dr. Holly J. McCammon. 2001. Working in
Restructured Workplaces: Challenges and New Directions for the Sociology of Work.
Thousand Oaks, CA: Sage.
Dencker, John C. 2009. "Relative Bargaining Power, Corporate Restructuring, and Managerial
Promotion." Administrative Science Quarterly 54:453-485.
DiNardo, John E., Nicole M. Fortin, and Thomas Lemieux. 1996. "Labor Market Institutions and
the Distribution of Wages, 1973-1992: A Semiparametric Approach." Econometrica
64:1001-1044.
DiNardo, John E., and Joern-Steffen Pischke. 1997. "The Returns to Computer Use Revisited:
Have Pencils Changed the Wage Structure Too?" Quarterly Journal of Economics
112:291-303.
DiPrete, Thomas A. 1987. "Horizontal and Vertical Mobility in Organizations." Administrative
Science Quarterly 32:422-444.
—. 2007. "What Has Sociology to Contribute to the Study of Inequality Trends? A Historical
and Comparative Perspective." American Behavioral Scientist 50:603-618.
Dobbin, Frank. 2004. The Sociology of the Economy. New York, NY: Russell Sage Foundation.
39
Doeringer, Peter B., and Michael J. Piore. 1971. Internal Labor Markets and Manpower Analysis.
Lexington, MA: Heath.
Elvira, Marta M. 2001. "Pay Me Now or Pay Me Later: Analyzing the Relationship Between
Bonus and Promotion Incentives." Work and Occupations 28:346-370.
Eriksson, Tor, and Axel Werwatz. 2005. "The Prevalence of Internal Labor Markets-- New
Evidence from Panel Data." International Journal of Economics Research 2:1-20.
Farber, Henry. 2008. "Job Loss and the Decline in Job Security in the United States." Working
Paper No. 520 Industrial Relations Section, Princeton University.
Fernandez, Roberto M. 2001. "Skill-Biased Technological Change and Wage Inequality:
Evidence from a Plant Retooling." American Journal of Sociology 107:273-320.
Fortin, Nicole M., and Thomas Lemieux. 1997. "Institutional Changes and Rising Wage
Inequality: Is There a Linkage?" Journal of Economic Perspectives 11:75-96.
Foulkes, Fred K. 1980. Personnel Policies in Large Nonunion Companies. Englewood Cliffs, NJ:
Prentice-Hall.
Freeman, Richard B. 2007. America Works. New York, NY: Russell Sage Foundation.
Freeman, Richard B., and James L. Medoff. 1984. What Do Unions Do? New York, NY: Basic
Books.
Frenkel, Stephen J. 2003. "The Embedded Character of Workplace Relations." Work and
Occupations 30:135-153.
Gerhart, Barry, and Sarah Rynes. 2003. Compensation: Theory, Evidence and Strategic
Implications. Thousand Oaks, CA: Sage Publications.
Gibbons, Robert, and Michael Waldman. 1999. "A Theory of Wage and Promotion Dynamics
inside Firms." Quarterly Journal of Economics 114:1321-1358.
40
—. 2006. "Enriching a Theory of Wage and Promotion Dynamics inside Firms." Journal of
Labor Economics 24:59-107.
Gibbs, Michael J. 1995. "Incentive Compensation in a Corporate Hierarchy." Journal of
Accounting and Economics 19:247-277.
Gibbs, Michael J., and Wallace Hendricks. 2004. "Are Formal Salary Systems a Veil?"
Industrial and Labor Relations Review 25:71-93.
Hamermesh, Daniel S. 1989. "What Do We Know About Worker Displacement in the U.S.?"
Industrial Relations 28:51 - 59.
Hendricks, Wallace. 1994. "Deregulation and Labor Earnings." Journal of Labor Research
15:207-234.
Hirsch, Barry T., and John T. Addison. 1986. The Economic Analysis of Unions: New
Approaches and Evidence. Winchester, MA: Allen & Unwin.
Hirsch, Paul M. 1986. "From Ambushes to Golden Parachutes: Corporate Takeovers as an
Instance of Cultural Framing and Institutional Integration." American Journal of
Sociology 91:800-837.
Hirsch, Paul M., and Michaela De Soucey. 2006. "Organizational Restructuring and Its
Consequences: Rhetorical and Structural." Annual Review of Sociology 32:171-189.
Jensen, Michael C. 1993. "The Modern Industrial Revolution, Exit, and the Failure of Internal
Control Systems." Journal of Finance 68:831-880.
Juhn, Chinhui, Kevin M. Murphy, and Brooks Pierce. 1993. "Wage Inequality and the Rise in
Return to Skill." Journal of Political Economy 101:410-442.

41
Kalleberg, Arne L., and Ted Mouw. 2006. "Occupations and the Structure of Wage Inequality in
the United States." in American Sociological Association Annual Meeting. Montreal,
Canada.
Katz, Lawrence F., and David H. Autor. 1999. "Changes in the Wage Structure and Earnings
Inequality." in Handbook of Labor Economics, edited by Orley Ashenfelter and David
Card. New York, NY: Elsevier.
Katz, Lawrence F., and Kevin M. Murphy. 1992. "Changes in Relative Wages, 1963-1987:
Supply and Demand Factors." Quarterly Journal of Economics 107:35-78.
Kim, ChangHwan, and Arthur Sakamoto. 2008. "The Rise of Intra-Occupational Wage
Inequality in the United States, 1983 to 2002." American Sociological Review 73:129-157.
Kochan, Thomas A., Harry C. Katz, and Robert B. McKersie. 1994. The Transformation of
American Industrial Relations. Ithaca, NY: Cornell University Press.
Krueger, Alan B. 1993. "How Computers Have Changed the Wage Structure: Evidence from
Microdata 1984-1989." Quarterly Journal of Economics 108:33-60.
Krueger, Alan B., and Lawrence H. Summers. 1988. "Efficiency Wages and the Interindustry
Wage Structure." Econometrica 56:259-293.
Lazear, Edward P. 1979. "Why Is There Mandatory Retirement?" Journal of Political Economy
87:1261-1284.
—. 1992. "The Job as a Concept." in Performance Management, Evaluation, and Incentives,
edited by Jr. William J. Bruns. Boston, MA: Harvard Business School Press.
—. 1995. Personnel Economics. Cambridge, MA: The MIT Press.
Lazear, Edward P., and Paul Oyer. 2004. "Internal and External Labor Markets: A Personnel
Economics Approach." Labour Economics 11:527-554.
42
Lazear, Edward P., and Sherwin Rosen. 1981. "Rand-Order Tournaments as Optimum Labor
Contracts." Journal of Political Economy 89:841-864.
Lee, Lung-Fei, and G. S. Maddala. 1985. "Sequential selection rules and selectivity in discrete
choice econometric models." Econometric Methods and Applications 3:311-329.
Lee, Raymond T., and James E. Martin. 1996. "When a Gain Comes at a Price: Pay Attitudes
after Changing Tier Status." Industrial Relations 35:218-226.
Lemieux, Thomas. 2006. "Increasing Residual Wage Inequality: Composition Effects, Noisy
Data, or Rising Demand for Skill?" American Economic Review 96:461-498.
—. 2008. "The Changing Nature of Wage Inequality " Journal of Population Economics 21:21-
48.
Lemieux, Thomas, W. Bentley MacLeod, and Daniel Parent. 2009. "Performance Pay and Wage
Inequality." Quarterly Journal of Economics 74:1-49.
Lepak, David P., and Scott A. Snell. 1999. "The Human Resource Architecture: Toward a
Theory of Human Capital Allocation and Development." Academy of Management
Review 24:31-48.
Levine, David I., Dale Belman, Gary Charness, Erica L. Groshen, and K. C. O'Shaughnessy.
2002. How New Is the "New Employment Contract"? Kalamazoo, MI: W.E. Upjohn
Institute for Employment Research.
Lin, Ming-Jen. 2005. "Opening Black Box: The Internal Labor Market of Company X."
Industrial Relations 44:659-706.
Martin, James E., and Melanie M. Peterson. 1987. "Two-Tier Wage Structures: Implication for
Equity Theory." Academy of Management Journal 30:297-315.

43
McFarlin, Dean B., and Michael R. Frone. 1990. "A Two-Tier Wage Structure in a Nonunion
Firm." Industrial Relations 29:145-154.
Mitchell, Daniel J. B. 1989. "Wage Pressures and Labor Shortages: The 1960s and 1980s."
Brookings Papers on Economic Activity 1989:191-232.
Morris, Martina, Annette D. Bernhardt, and Mark S. Handcock. 1994. "Economic Inequality:
New Methods for New Trends." American Sociological Review 59:205-219.
Morris, Martina, and Bruce Western. 1999. "Inequality in Earnings at the Close of the Twentieth
Century." Annual Review of Sociology 25:623-657.
Mouw, Ted, and Arne L. Kalleberg. 2010a. "Do Changes in Job Mobility Explain the Growth of
Wage Inequality among Men in the United States, 1977-2005?" Forthcoming, Social
Forces.
—. 2010b. "Occupations and the Structure of Wage Inequality in the United States, 1980s-
2000s." Forthcoming, American Sociological Review.
Murphy, Kevin M., and Finis Welch. 1992. "The Structure of Wages." Quarterly Journal of
Economics 107:285-326.
Newman, Katherine S. 1988. Falling from Grace: The Experience of Downward Mobility in the
American Middle Class. New York, NY: Free Press.
—. 1993. Declining Fortunes: The Withering of the American Dream. New York, NY: Basic
Books.
Oaxaca, Ronald. 1973. "Male-Female Wage Differentials in Urban Labor Market." International
Economic Review 14:693-709.
Osterman, Paul. 1987. "Choice of Employment Systems in Internal Labor Markets." Industrial
Relations 26:46-67.
44
Osterman, Paul, Thomas A. Kochan, Richard M. Locke, and Michael J. Piore. 2001. Working in
America. Cambridge, MA: The MIT Press.
Peoples, James. 1998. "Deregulation and the Labor Market." Journal of Economic Perspectives
12:111-130.
Petersen, Trond. 1995. "Analysis of Event Histories." Pp. 453-517 in Handbook of Statistical
Modeling for the Social and Behavioral Sciences, edited by Gerhard Arminger, Clifford
C. Clogg, and Michael E. Sobel. New York: Plenum Press.
Petersen, Trond, and Ishak Saporta. 2004. "The Opportunity Structure for Discrimination."
American Journal of Sociology 109:852-901.
Phillips, Damon Jeremy. 2001. "The Promotion Paradox: Organizational Mortality and Life
Chances in Silicon Valley Law Firms, 1946-1996." American Journal of Sociology
106:1058-1098.
Podony, Joel M., and James N. Baron. 1997. "Resources and Relationships: Social Networks and
Mobility in the Workplace." American Sociological Review 62:673-693.
Rosenbaum, James E. 1979. "Tournament Mobility: Career Patterns in a Corporation."
Administrative Science Quarterly 24:220-241.
—. 1984. Career Mobility in a Corporate Hierarchy. New York, NY: Academic.
Shleifer, Andrei, and Lawrence H. Summers. 1998. "Breach of Trust in Hostile Takeovers." in
Corporate Takeovers: Causes and Consequences, edited by Alan J. Auerbach. Chicago,
IL: University of Chicago Press.
Sørensen, Aage B. 1994. "Firms, Wages, and Incentives." Pp. 504-528 in Handbook of Economic
Sociology, edited by Neil J. Smelser and Richard Swedberg. Princeton, NJ: Russell Sage.
45
—. 2000. "Toward a Sounder Basis for Class Analysis." American Journal of Sociology
105:1523-1571.
Sørensen, Aage B., and Arne L. Kalleberg. 1981. "An Outline of a Theory for the Matching of
Persons to Jobs." in Sociological Perspectives on Labor Markets, edited by Ivar Berg.
New York, NY: Academic Press.
Spilerman, Seymour, and Trond Petersen. 1999. "Organizational Structure, Determinants of
Promotion, and Gender Differences in Attainment." Social Science Research 28:203-227.
Topel, Robert H. 1991. "Specific Capital, Mobility, and Wages: Wage Rise with Job Seniority."
Journal of Political Economy 99:43-79.
Useem, Michael. 1996. Investor Capitalism: How Money Managers Are Changing the Face of
Corporate America. New York, NY: Basic Books.
Useem, Michael, and Peter Cappelli. 1997. "The Pressures to Restructure Employment." in
Change at Work, edited by Peter Cappelli, Laurie Bassi, Harry C. Katz, David Knoke,
Paul Osterman, and Michael Useem. New York, NY: Oxford University Press.
Weeden, Kim A. 2002. "Why Do Some Occupations Pay More then Others? Social Closure and
Earnings Inequality." American Journal of Sociology 108:55-101.
Weeden, Kim A., Young-Mi Kim, Matthew DiCarlo, and David B. Grusky. 2007. "Social Class
and Earnings Inequality." American Behavioral Scientist 50:702-736.
Williamson, Oliver E. 1985. The Economic Institution of Capitalism. New York, NY: Free Press.
Yang, Yang, and Kenneth C. Land. 2008. "Age-Period-Cohort Analysis of Repeated Cross-
Section Surveys: Fixed or Random Effects?" Sociological Methods and Research 36:297-
326.

46
Yang, Yang, Sam Schulhofer-Wohl, Wenjiang J. Fu, and Kenneth C. Land. 2008. "The Intrinsic
Estimator for Age-Period-Cohort Analysis: What It Is and How to Use It." American
Journal of Sociology 113:1697-1736.
Youndt, Mark A., Scott A. Snell, James W. Dean, and David P. Lepak. 1996. "Human Resource
Management, Manufacturing Strategy, and Firm Performance." Academy of Management
Journal 39:836-866.
Zenger, Todd R. 1992. "Why Do Employers Only Reward Extreme Performance? Examining
the Relationships among Performance, Pay, and Turnover." Administrative Science
Quarterly 37:198-219.
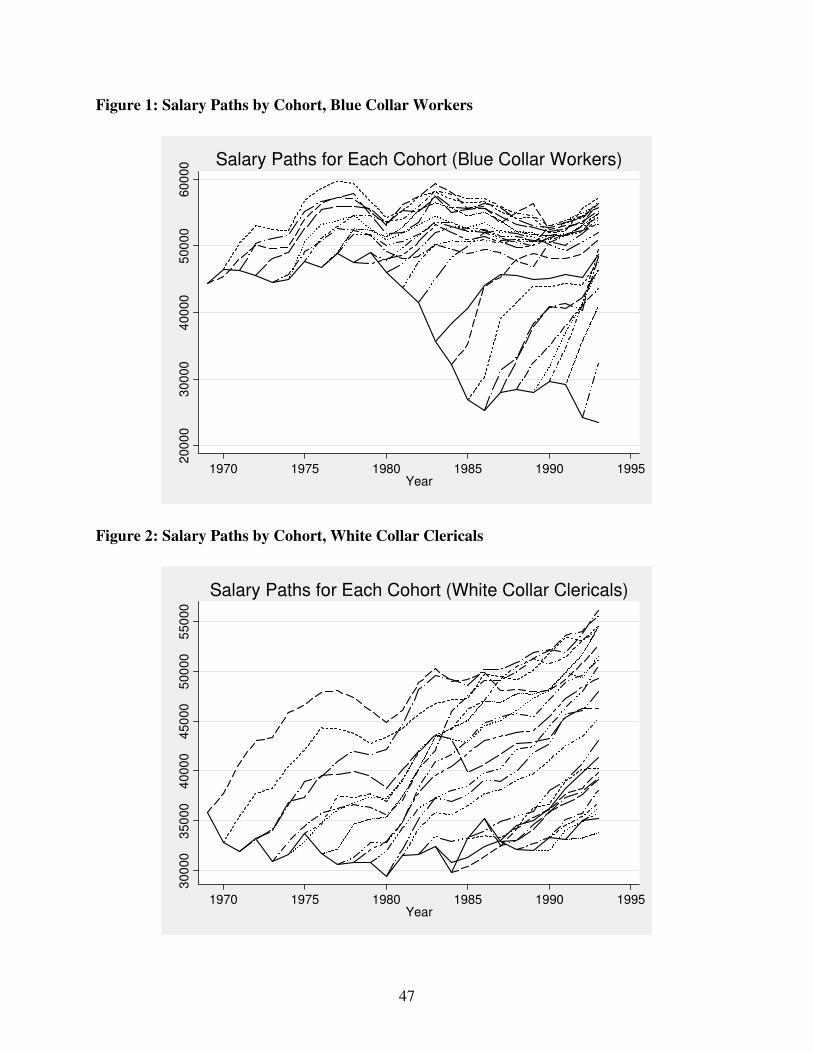
47
Figure 1: Salary Paths by Cohort, Blue Collar Workers
200
00
300
00
400
00
500
00
600
00
1970 1975 1980 1985 1990 1995Year
Salary Paths for Each Cohort (Blue Collar Workers)
Figure 2: Salary Paths by Cohort, White Collar Clericals
300
00
350
00
4000
04
50
00
500
00
550
00
1970 1975 1980 1985 1990 1995Year
Salary Paths for Each Cohort (White Collar Clericals)

48
Figure 3: Salary Paths by Cohort, White Collar Managers
600
00
800
00
100
00
01
20
00
0
1970 1975 1980 1985 1990 1995Year
Salary Paths for Each Cohort (White Collar Managers)
Figure 4: Comparison of Industry-Firm Wage Patterns
200
00
400
00
600
00
8000
010
000
0R
ea
l A
nn
ual W
age
s
1970 1975 1980 1985 1990 1995Age
CES Manufaturing Blue Collar Workers
White Collar Clericals Wite Collar Managers
Comparison between External and Firm Wage Data
Wage Patterns, 1969-1993
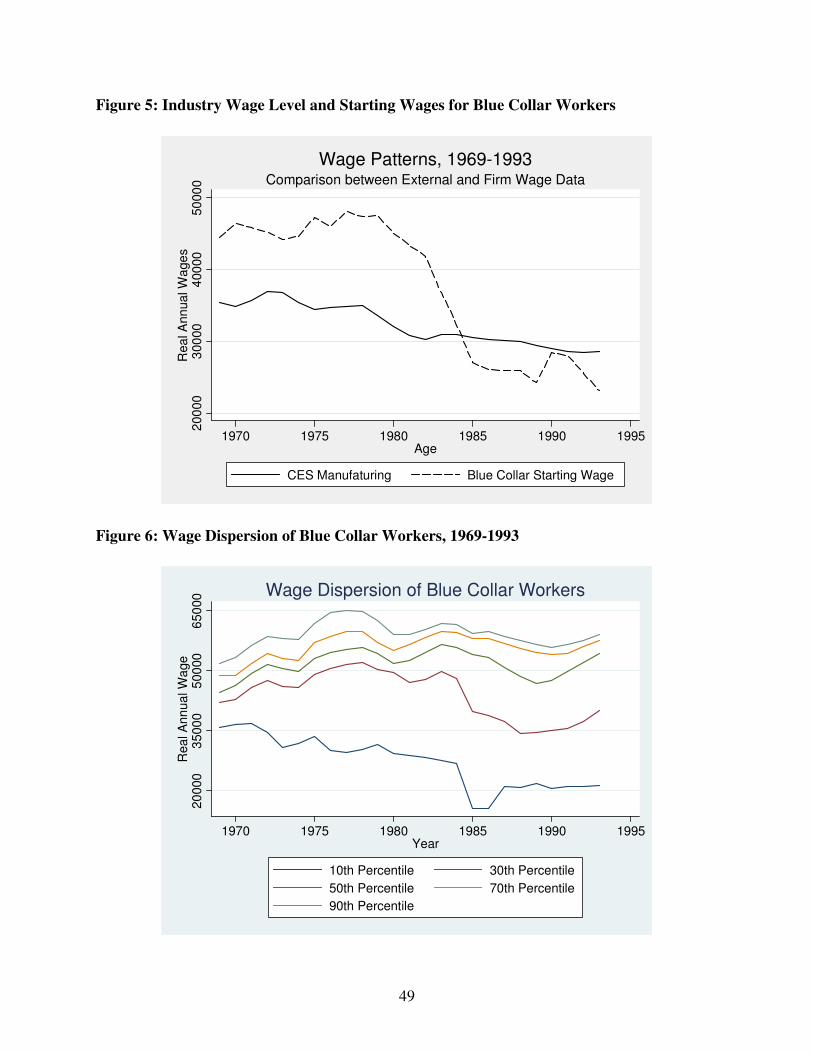
49
Figure 5: Industry Wage Level and Starting Wages for Blue Collar Workers
200
00
300
00
400
00
50
00
0R
ea
l A
nn
ua
l W
age
s
1970 1975 1980 1985 1990 1995Age
CES Manufaturing Blue Collar Starting Wage
Comparison between External and Firm Wage Data
Wage Patterns, 1969-1993
Figure 6: Wage Dispersion of Blue Collar Workers, 1969-1993
20
000
3500
05
00
00
650
00
Rea
l A
nn
ua
l W
age
1970 1975 1980 1985 1990 1995Year
10th Percentile 30th Percentile
50th Percentile 70th Percentile
90th Percentile
Wage Dispersion of Blue Collar Workers
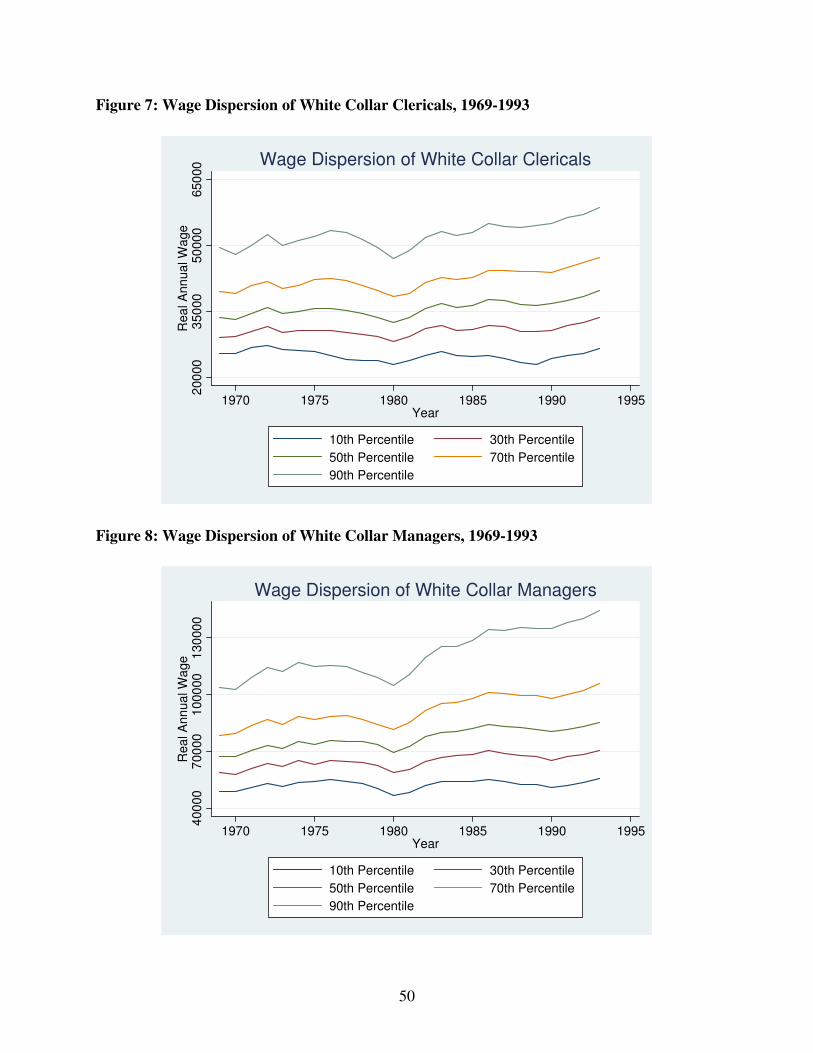
50
Figure 7: Wage Dispersion of White Collar Clericals, 1969-1993
200
00
350
00
50
000
650
00
Rea
l A
nn
ua
l W
age
1970 1975 1980 1985 1990 1995Year
10th Percentile 30th Percentile
50th Percentile 70th Percentile
90th Percentile
Wage Dispersion of White Collar Clericals
Figure 8: Wage Dispersion of White Collar Managers, 1969-1993
400
00
700
00
1000
00
130
000
Rea
l A
nn
ua
l W
age
1970 1975 1980 1985 1990 1995Year
10th Percentile 30th Percentile
50th Percentile 70th Percentile
90th Percentile
Wage Dispersion of White Collar Managers

51
Figure 9: Relative Change of 50-10 Wage Differential over Time, All Employees
.51
1.5
22
.53
3.5
44
.5R
ela
tive 5
0-1
0 R
atio
1970 1975 1980 1985 1990 1995Year
Blue Collar Workers White Collar Clericals
White Collar Managers
50-10 ratio in 1969 is normalized to 1 for each occupational grooup.
Relative Change of 50-10 Wage Differential
Figure 10: Relative Change of 90-50 Wage Differential over Time, All Employees
.51
1.5
Rela
tive 9
0-5
0 R
atio
1970 1975 1980 1985 1990 1995Year
Blue Collar Workers White Collar Clericals
White Collar Managers
90-50 ratio in 1969 is normalized to 1 for each occupational grooup.
Relative Change of 90-50 Wage Differential
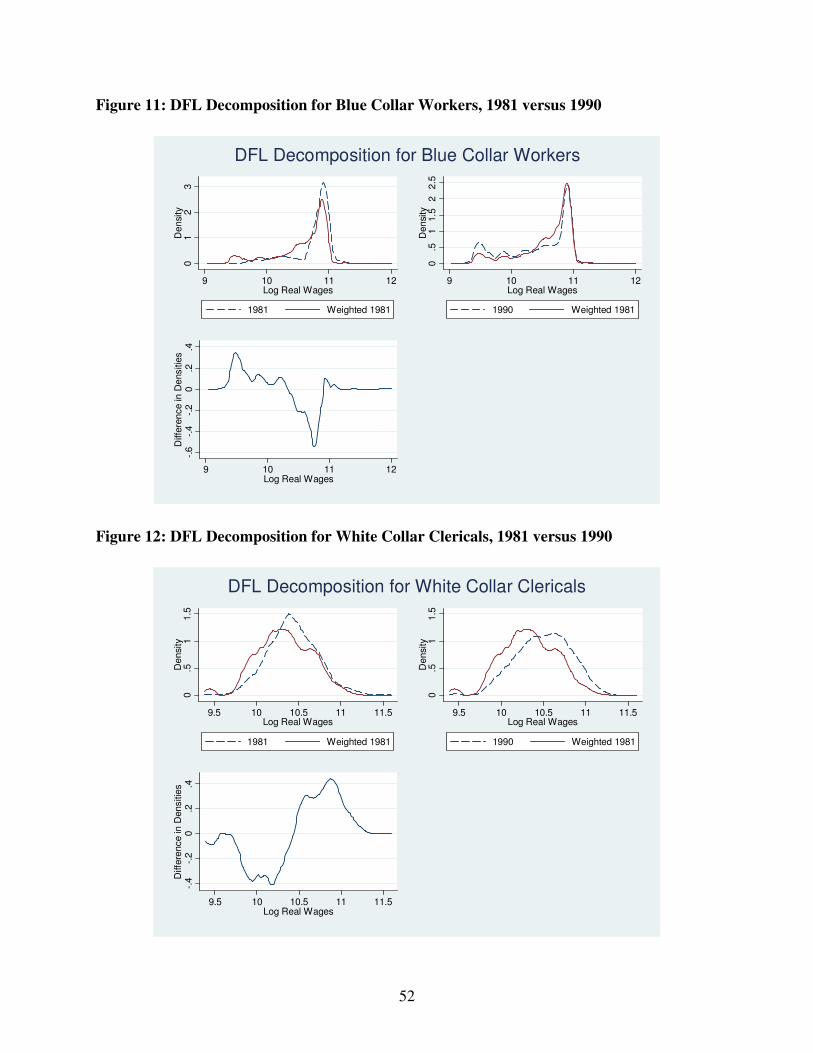
52
Figure 11: DFL Decomposition for Blue Collar Workers, 1981 versus 1990
01
23
Densi
ty
9 10 11 12Log Real Wages
1981 Weighted 1981
0.5
11.5
22.5
Densi
ty
9 10 11 12Log Real Wages
1990 Weighted 1981
-.6
-.4
-.2
0.2
.4D
iffe
rence in D
ensitie
s
9 10 11 12Log Real Wages
DFL Decomposition for Blue Collar Workers
Figure 12: DFL Decomposition for White Collar Clericals, 1981 versus 1990
0.5
11.5
Density
9.5 10 10.5 11 11.5Log Real Wages
1981 Weighted 1981
0.5
11.5
Density
9.5 10 10.5 11 11.5Log Real Wages
1990 Weighted 1981
-.4
-.2
0.2
.4D
iffe
rence in D
ensitie
s
9.5 10 10.5 11 11.5Log Real Wages
DFL Decomposition for White Collar Clericals
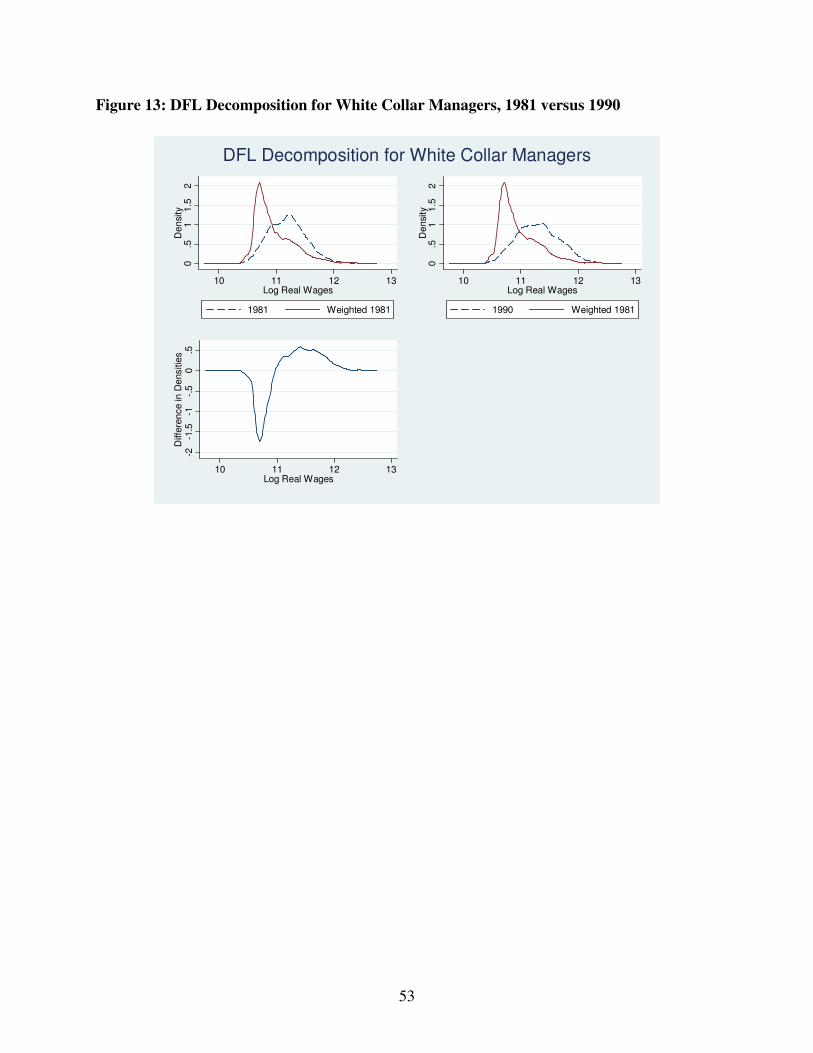
53
Figure 13: DFL Decomposition for White Collar Managers, 1981 versus 1990
0.5
11.5
2D
ensi
ty
10 11 12 13Log Real Wages
1981 Weighted 1981
0.5
11.5
2D
ensi
ty
10 11 12 13Log Real Wages
1990 Weighted 1981
-2-1
.5-1
-.5
0.5
Diffe
rence in D
ensitie
s
10 11 12 13Log Real Wages
DFL Decomposition for White Collar Managers

54
Table 1: Descriptive Statistics
Blue Collar Workers White Collar Clericals White Collar Managers Year Real
Wage Tenure (Year)
Age Real Wage
Tenure (Year)
Age Real Wage
Tenure (Year)
Age
1969 $44,072 0.62 42 $35,426 0.60 31 $73,869 0.62 40 1970 $45,630 1.13 42 $35,177 1.16 31 $73,926 1.38 39 1971 $49,870 1.81 41 $38,045 1.81 32 $80,341 2.22 39 1972 $50,899 2.51 41 $38,551 2.43 32 $82,410 3.01 39 1973 $51,593 3.01 39 $38,121 2.60 31 $82,533 3.60 39 1974 $49,960 3.27 36 $37,681 2.70 31 $85,092 3.96 38 1975 $53,014 3.57 35 $38,302 3.28 31 $82,517 4.63 37 1976 $54,422 3.73 34 $38,825 3.56 31 $84,393 4.85 37 1977 $54,279 3.86 33 $37,856 3.78 31 $83,222 5.20 36 1978 $55,512 4.21 33 $37,690 3.92 31 $83,174 5.42 35 1979 $59,398 4.33 33 $36,807 4.01 31 $80,569 5.58 35 1980 $50,749 4.41 32 $34,915 3.91 31 $75,768 5.49 34 1981 $50,319 4.53 33 $35,607 3.86 31 $78,053 5.47 34 1982 $51,019 5.03 33 $37,660 4.43 32 $83,540 5.96 34 1983 $51,510 5.73 34 $38,589 5.05 32 $86,327 6.72 35 1984 $49,928 6.19 35 $37,648 5.52 33 $86,503 7.62 35 1985 $46,155 6.17 34 $37,691 5.85 34 $87,692 8.02 36 1986 $45,417 6.69 35 $38,739 6.68 34 $89,830 8.84 36 1987 $44,816 7.06 35 $38,551 7.05 35 $89,264 9.35 36 1988 $43,748 7.08 35 $38,212 6.55 35 $89,406 9.43 37 1989 $43,179 7.44 36 $37,822 6.49 35 $88,416 9.49 37 1990 $43,446 7.74 36 $38,620 6.71 35 $88,265 9.70 37 1991 $44,140 8.36 37 $39,557 6.95 36 $90,218 10.06 37 1992 $45,180 9.14 38 $40,189 7.70 37 $91,902 10.79 38 1993 $46,207 9.32 39 $40,894 7.83 37 $93,341 11.04 38
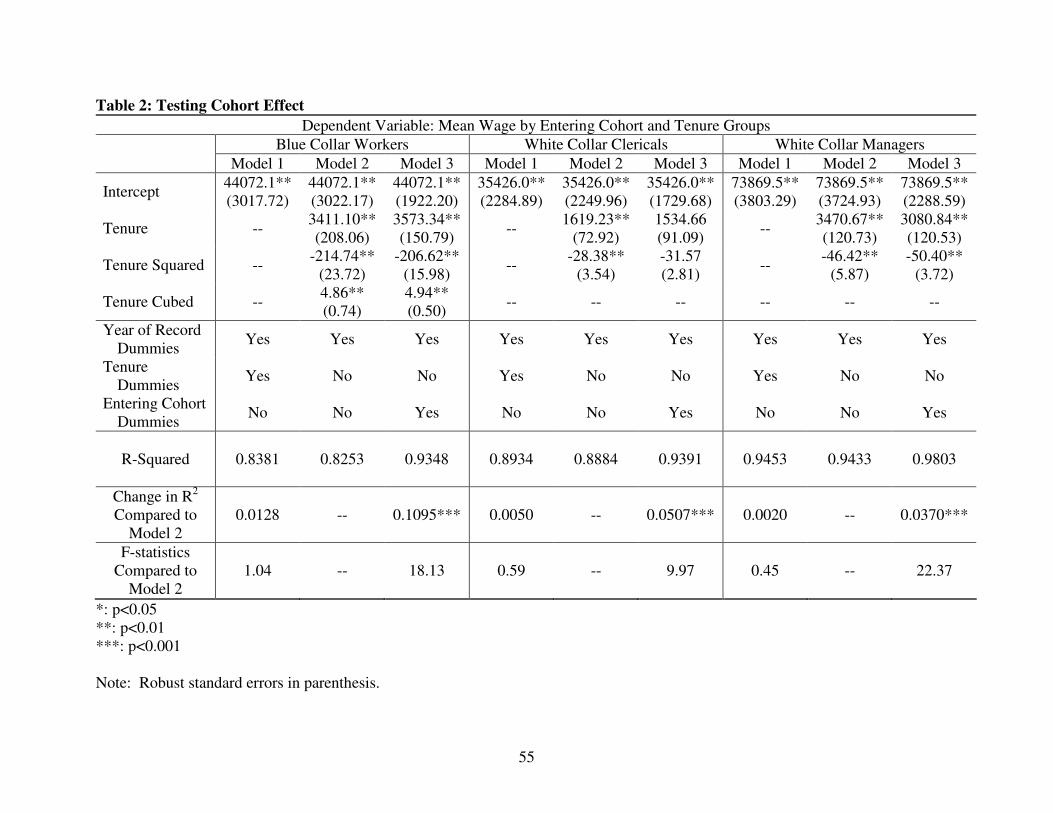
55
Table 2: Testing Cohort Effect
Dependent Variable: Mean Wage by Entering Cohort and Tenure Groups Blue Collar Workers White Collar Clericals White Collar Managers
Model 1 Model 2 Model 3 Model 1 Model 2 Model 3 Model 1 Model 2 Model 3
Intercept 44072.1** (3017.72)
44072.1** (3022.17)
44072.1** (1922.20)
35426.0** (2284.89)
35426.0** (2249.96)
35426.0** (1729.68)
73869.5** (3803.29)
73869.5** (3724.93)
73869.5** (2288.59)
Tenure -- 3411.10** (208.06)
3573.34** (150.79)
-- 1619.23**
(72.92) 1534.66 (91.09)
-- 3470.67** (120.73)
3080.84** (120.53)
Tenure Squared -- -214.74**
(23.72) -206.62**
(15.98) --
-28.38** (3.54)
-31.57 (2.81)
-- -46.42**
(5.87) -50.40**
(3.72)
Tenure Cubed -- 4.86** (0.74)
4.94** (0.50)
-- -- -- -- -- --
Year of Record Dummies
Yes Yes Yes Yes Yes Yes Yes Yes Yes
Tenure Dummies
Yes No No Yes No No Yes No No
Entering Cohort Dummies
No No Yes No No Yes No No Yes
R-Squared
0.8381 0.8253 0.9348 0.8934 0.8884 0.9391 0.9453 0.9433 0.9803
Change in R2 Compared to
Model 2 0.0128 -- 0.1095*** 0.0050 -- 0.0507*** 0.0020 -- 0.0370***
F-statistics Compared to
Model 2 1.04 -- 18.13 0.59 -- 9.97 0.45 -- 22.37
*: p<0.05 **: p<0.01 ***: p<0.001 Note: Robust standard errors in parenthesis.
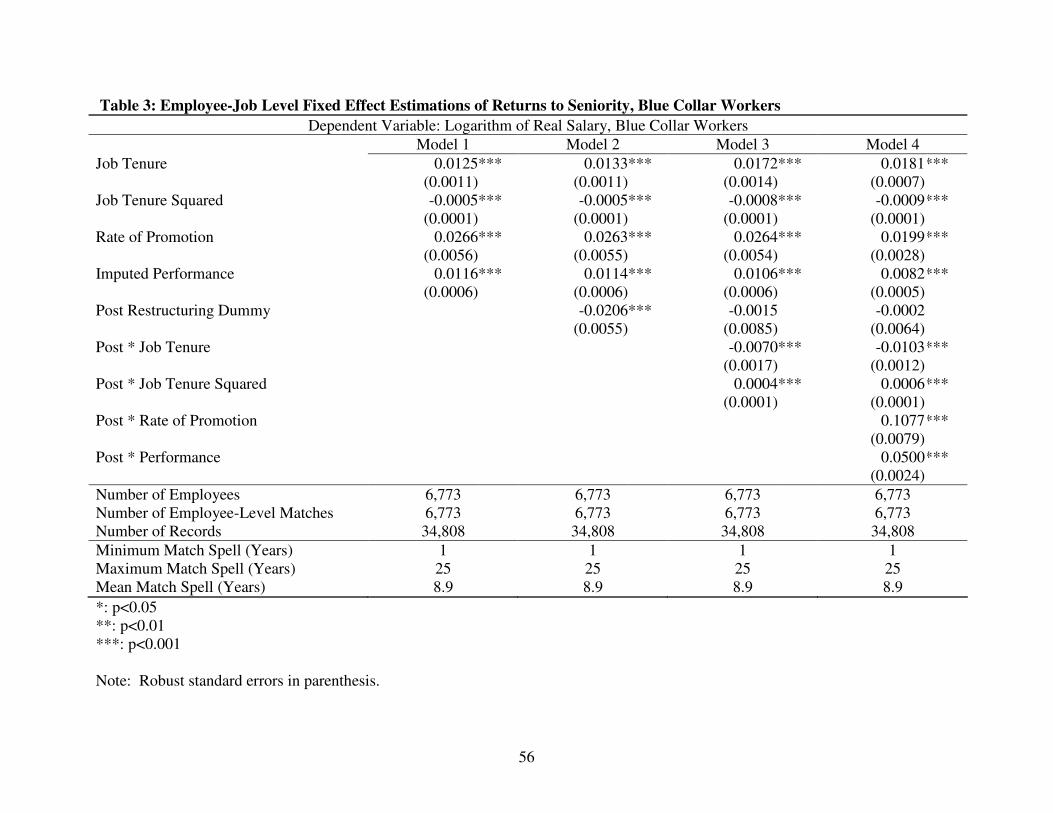
56
Table 3: Employee-Job Level Fixed Effect Estimations of Returns to Seniority, Blue Collar Workers
Dependent Variable: Logarithm of Real Salary, Blue Collar Workers Model 1 Model 2 Model 3 Model 4
Job Tenure 0.0125(0.0011)
*** 0.0133(0.0011)
*** 0.0172(0.0014)
*** 0.0181 (0.0007)
***
Job Tenure Squared -0.0005(0.0001)
*** -0.0005(0.0001)
*** -0.0008(0.0001)
*** -0.0009 (0.0001)
***
Rate of Promotion 0.0266(0.0056)
*** 0.0263(0.0055)
*** 0.0264(0.0054)
*** 0.0199 (0.0028)
***
Imputed Performance 0.0116(0.0006)
*** 0.0114(0.0006)
*** 0.0106(0.0006)
*** 0.0082 (0.0005)
***
Post Restructuring Dummy -0.0206(0.0055)
*** -0.0015(0.0085)
-0.0002 (0.0064)
Post * Job Tenure -0.0070(0.0017)
*** -0.0103 (0.0012)
***
Post * Job Tenure Squared 0.0004(0.0001)
*** 0.0006 (0.0001)
***
Post * Rate of Promotion 0.1077 (0.0079)
***
Post * Performance
0.0500 (0.0024)
***
Number of Employees 6,773 6,773 6,773 6,773 Number of Employee-Level Matches 6,773 6,773 6,773 6,773 Number of Records 34,808 34,808 34,808 34,808
Minimum Match Spell (Years) 1 1 1 1 Maximum Match Spell (Years) 25 25 25 25 Mean Match Spell (Years) 8.9 8.9 8.9 8.9
*: p<0.05 **: p<0.01 ***: p<0.001 Note: Robust standard errors in parenthesis.
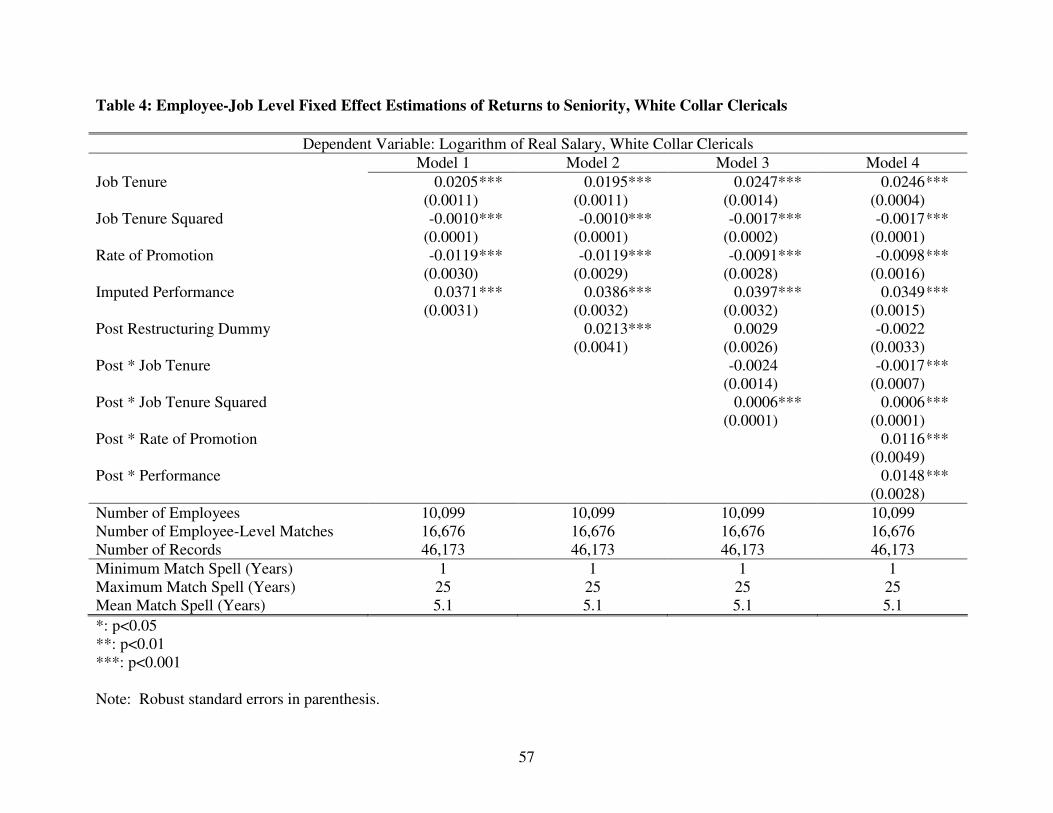
57
Table 4: Employee-Job Level Fixed Effect Estimations of Returns to Seniority, White Collar Clericals
Dependent Variable: Logarithm of Real Salary, White Collar Clericals Model 1 Model 2 Model 3 Model 4
Job Tenure 0.0205(0.0011)
*** 0.0195(0.0011)
*** 0.0247(0.0014)
*** 0.0246 (0.0004)
***
Job Tenure Squared -0.0010(0.0001)
*** -0.0010(0.0001)
*** -0.0017(0.0002)
*** -0.0017 (0.0001)
***
Rate of Promotion -0.0119(0.0030)
*** -0.0119(0.0029)
*** -0.0091(0.0028)
*** -0.0098 (0.0016)
***
Imputed Performance 0.0371(0.0031)
*** 0.0386(0.0032)
*** 0.0397(0.0032)
*** 0.0349 (0.0015)
***
Post Restructuring Dummy 0.0213(0.0041)
*** 0.0029(0.0026)
-0.0022 (0.0033)
Post * Job Tenure -0.0024(0.0014)
-0.0017 (0.0007)
***
Post * Job Tenure Squared 0.0006(0.0001)
*** 0.0006 (0.0001)
***
Post * Rate of Promotion 0.0116 (0.0049)
***
Post * Performance
0.0148 (0.0028)
***
Number of Employees 10,099 10,099 10,099 10,099 Number of Employee-Level Matches 16,676 16,676 16,676 16,676 Number of Records 46,173 46,173 46,173 46,173
Minimum Match Spell (Years) 1 1 1 1 Maximum Match Spell (Years) 25 25 25 25 Mean Match Spell (Years) 5.1 5.1 5.1 5.1
*: p<0.05 **: p<0.01 ***: p<0.001 Note: Robust standard errors in parenthesis.

58
Table 5: Employee-Job Level Fixed Effect Estimations of Returns to Seniority, White Collar Managers
Dependent Variable: Logarithm of Real Salary, White Collar Managers Model 1 Model 2 Model 3 Model 4
Job Tenure 0.0247(0.0009)
*** 0.0242(0.0008)
*** 0.0295(0.0010)
*** 0.0295 (0.0004)
***
Job Tenure Squared -0.0009(0.0001)
*** -0.0009(0.0001)
*** -0.0014(0.0001)
*** -0.0014 (0.0001)
***
Rate of Promotion -0.0233(0.0004)
*** -0.0229(0.0042)
*** -0.0199(0.0039)
*** -0.0210 (0.0019)
***
Imputed Performance 0.0145(0.0008)
*** 0.0147(0.0008)
*** 0.0147(0.0008)
*** 0.0119 (0.0004)
***
Post Restructuring Dummy 0.0077(0.0029)
*** 0.0088(0.0018)
*** -0.0028 (0.0042)
Post * Job Tenure -0.0059(0.0010)
*** -0.0048 (0.0005)
***
Post * Job Tenure Squared 0.0006(0.0001)
*** 0.0006 (0.0001)
***
Post * Rate of Promotion 0.0238 (0.0042)
***
Post * Performance
0.0083 (0.0008)
***
Number of Employees 8,517 8,517 8,517 8,517 Number of Employee-Level Matches 20,906 20,906 20,906 20,906 Number of Records 67,276 67,276 67,276 67,276
Minimum Match Spell (Years) 1 1 1 1 Maximum Match Spell (Years) 25 25 25 25 Mean Match Spell (Years) 3.2 3.2 3.2 3.2
*: p<0.05 **: p<0.01 ***: p<0.001 Note: Robust standard errors in parenthesis.

59
Table 6: The Effect of Corporate Restructuring, All Workers
Dependent Variable: Logarithm of Real Salary, All Workers Model 1 Model 2 Model 3 Model 4
Tenure 0.0381(0.0013)
*** 0.0485(0.0015)
*** 0.0494(0.0015)
*** 0.0482 (0.0015)
***
Tenure Squared -0.0000(0.0000)
-0.0001(0.0000)
* -0.0001(0.0000)
** -0.0000 (0.0000)
Job Tenure 0.0005(0.0001)
*** 0.0007(0.0001)
*** 0.0006(0.0001)
*** 0.0006 (0.0001)
***
Job Tenure Squared -0.0001(0.0000)
*** -0.0001(0.0000)
*** -0.0001(0.0000)
*** -0.0001 (0.0000)
***
Management 0.0069(0.0047)
0.0033(0.0046)
-0.0113(0.0049)
* -0.0115 (0.0049)
*
Business -0.0070(0.0066)
-0.0058(0.0065)
-0.0187(0.0067)
** -0.0191 (0.0067)
**
Computer -0.0580(0.0152)
*** -0.0501(0.0145)
** -0.0733(0.0155)
*** -0.0735 (0.0155)
***
Post Restructuring Dummy -0.1042(0.0059)
*** -0.1332(0.0064)
*** -0.1235 (0.0077)
***
Post * Job Tenure -0.0003(0.0001)
*** -0.0002(0.0001)
* -0.0006 (0.0001)
***
Post * Job Tenure Squared 0.0001(0.0000)
*** 00001(0.0000)
*** 0.0001 (0.0000)
***
Post * Management 0.0460(0.0048)
*** -0.2359 (0.0352)
***
Post * Business 0.0395(0.0063)
*** -0.0782 (0.0523)
Post * Computer 0.0686(0.0142)
*** -0.0164 (0.1343)
Post * Job Tenure * Management 0.0004 (0.0002)
*
Post * Job Tenure * Business 0.0013 (0.0003)
***
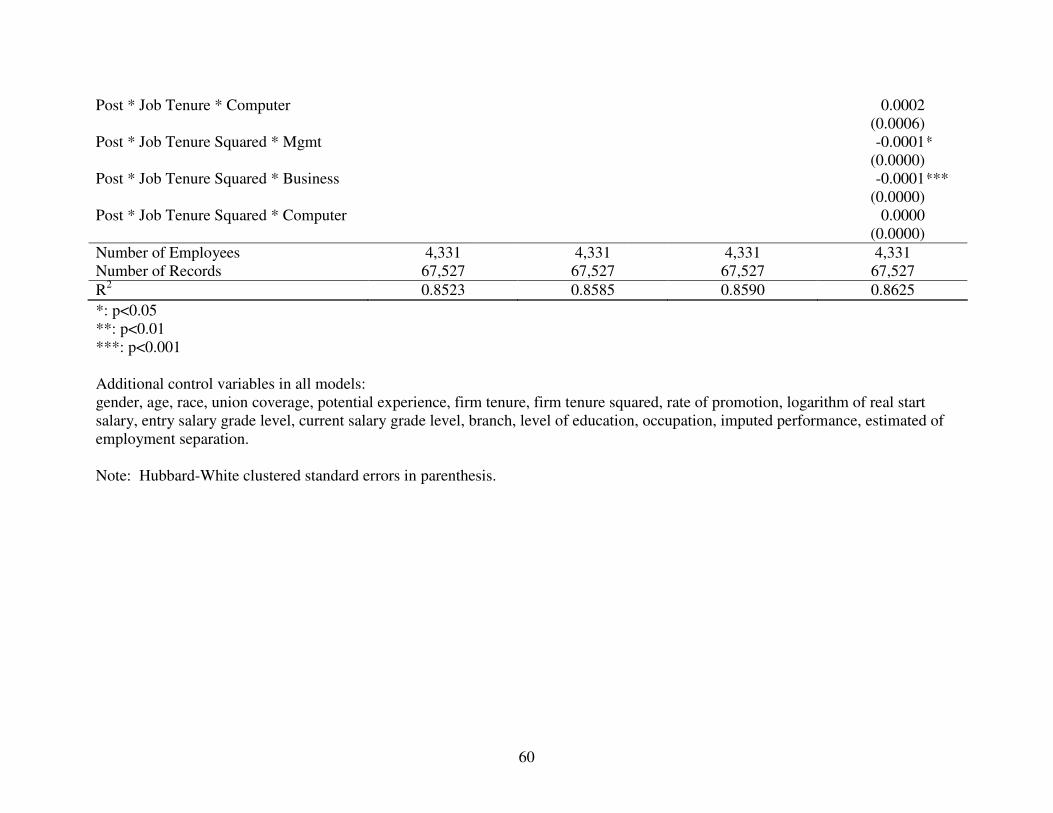
60
Post * Job Tenure * Computer 0.0002 (0.0006)
Post * Job Tenure Squared * Mgmt -0.0001 (0.0000)
*
Post * Job Tenure Squared * Business -0.0001 (0.0000)
***
Post * Job Tenure Squared * Computer 0.0000 (0.0000)
Number of Employees 4,331 4,331 4,331 4,331 Number of Records 67,527 67,527 67,527 67,527
R2 0.8523 0.8585 0.8590 0.8625
*: p<0.05 **: p<0.01 ***: p<0.001 Additional control variables in all models: gender, age, race, union coverage, potential experience, firm tenure, firm tenure squared, rate of promotion, logarithm of real start salary, entry salary grade level, current salary grade level, branch, level of education, occupation, imputed performance, estimated of employment separation. Note: Hubbard-White clustered standard errors in parenthesis.

61
Table 7: The Effect of “Counterfeit” Corporate Restructuring as a Robustness Check, All Workers
Dependent Variable: Logarithm of Real Salary, All Workers Model 1 Model 2 Model 3 Model 4
Tenure 0.0561(0.0030)
*** 0.0550(0.0029)
*** 0.0545(0.0029)
*** 0.0565 (0.0028)
***
Tenure Squared -0.0006(0.0001)
*** -0.0005(0.0001)
*** -0.0005(0.0001)
*** -0.0006 (0.0001)
***
Job Tenure 0.0002(0.0001)
* 0.0001(0.0001)
0.0001(0.0001)
0.0002(0.0002)
Job Tenure Squared -0.0001(0.0000)
*** -0.0000(0.0000)
-0.0000(0.0000)
-0.0000(0.0000)
Management 0.0022(0.0061)
0.0023(0.0061)
0.0004(0.0005)
-0.0014 (0.0056)
Business -0.0147(0.0115)
-0.0148(0.0115)
-0.0094(0.0106)
-0.0116 (0.0105)
Computer -0.0375(0.0289)
-0.0371(0.0290)
-0.0293(0.0254)
-0.0300 (0.0256)
Post Restructuring Dummy 0.0070(0.0088)
0.0144(0.0098)
-0.0021 (0.0106)
Post * Job Tenure 0.0001(0.0001)
0.0000(0.0001)
0.0000(0.0001)
Post * Job Tenure Squared -0.0000(0.0000)
-0.0000(0.0000)
-0.0000(0.0000)
Post * Management 0.0034(0.0086)
0.0396 (0.0373)
Post * Business -0.0087(0.0180)
0.1724 (0.1053)
Post * Computer -0.0131(0.0232)
0.1617 (0.1651)
Post * Job Tenure * Management 0.0001 (0.0002)
Post * Job Tenure * Business -0.0007 (0.0004)
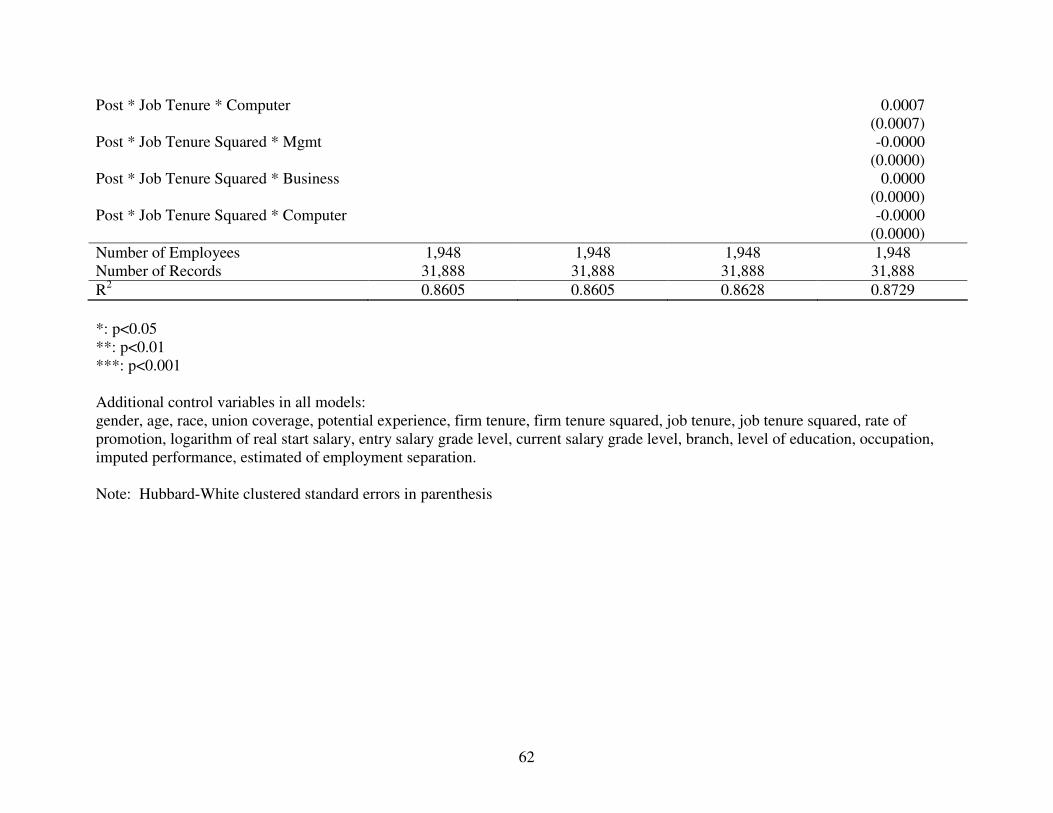
62
Post * Job Tenure * Computer 0.0007 (0.0007)
Post * Job Tenure Squared * Mgmt -0.0000 (0.0000)
Post * Job Tenure Squared * Business 0.0000 (0.0000)
Post * Job Tenure Squared * Computer -0.0000 (0.0000)
Number of Employees 1,948 1,948 1,948 1,948 Number of Records 31,888 31,888 31,888 31,888
R2 0.8605 0.8605 0.8628 0.8729
*: p<0.05 **: p<0.01 ***: p<0.001 Additional control variables in all models: gender, age, race, union coverage, potential experience, firm tenure, firm tenure squared, job tenure, job tenure squared, rate of promotion, logarithm of real start salary, entry salary grade level, current salary grade level, branch, level of education, occupation, imputed performance, estimated of employment separation. Note: Hubbard-White clustered standard errors in parenthesis