corporate social responsibility as a defense against
TRANSCRIPT
RE S EARCH ART I C L E
Corporate social responsibility as a defense againstknowledge spillovers: Evidence from the inevitabledisclosure doctrine
Caroline Flammer1 | Aleksandra Kacperczyk2
1Boston University, Questrom School of Business,Strategy and Innovation, Boston, Massachusetts2London Business School, Strategy andEntrepreneurship, London, UK
CorrespondenceCaroline Flammer, Questrom School of Business,Boston University, 595 Commonwealth Avenue,Office 634A, Boston, MA 02215.Email: [email protected]
Research Summary: We examine whether companiesrespond to the threat of knowledge leakage by strategi-cally increasing their engagement in corporate socialresponsibility (CSR). To obtain exogenous variation inthe threat of knowledge leakage, we exploit a naturalexperiment provided by the rejection of the inevitable dis-closure doctrine (IDD) by several U.S. states. Using adifference-in-differences methodology we find that, fol-lowing the rejection of the IDD, companies significantlyincrease their CSR. Our proposed rationale is that CSRhelps mitigate knowledge leakage by (i) reducingemployees' propensity to join a rival firm, and(ii) reducing employees' propensity to disclose the firm'svaluable knowledge even if they join a rival firm. Evi-dence from a laboratory experiment, an online experiment,and a survey of knowledge workers is supportive of thesearguments.Managerial Summary: We study the role of CSR in com-panies' response to the threat of knowledge leakage—amajor managerial challenge that has important implica-tions for firms' innovation and competitiveness. We usethree different research designs (an analysis of companies'CSR policies in response to an increased threat of knowl-edge leakage; a survey of knowledge workers; and anexperiment conducted both online and in a laboratory set-ting). The results show that CSR is perceived to mitigatethe threat of knowledge leakage. In particular, (i) CSRreduces knowledge workers' propensity to join rival firms(i.e., they are less likely to “walk”) and, even if they do,(ii) CSR reduces their propensity to disclose the firm'svaluable knowledge to their new employer (i.e., they areless likely to “talk”).
Received: 2 May 2017 Revised: 22 February 2019 Accepted: 3 March 2019
DOI: 10.1002/smj.3025
Strat Mgmt J. 2019;1–25. wileyonlinelibrary.com/journal/smj © 2019 John Wiley & Sons, Ltd. 1

KEYWORDS
corporate social responsibility, difference-in-differences,inevitable disclosure doctrine, knowledge spillovers,trade secrets
1 | INTRODUCTION
A firm's ability to innovate and adapt to changes in the business environment is essential for firm sur-vival and for sustaining a competitive advantage (e.g., Eisenhardt & Martin, 2000; Helfat et al.,2007; Teece, Pisano, & Shuen, 1997). As such, employee know-how is a key source of sustainablecompetitive advantage (e.g., Barney, 1991; Hall, 1993). Yet it also represents a major managerialchallenge, as employees with valuable knowledge are the most likely ones to walk out the door(Coff, 1997; Ganco, Ziedonis, & Agarwal, 2015; Kacperczyk, 2012; Kacperczyk & Balachandran,2018), taking their valuable knowledge with them to join rival firms or create new ventures. Thismay lead to interfirm knowledge spillovers, resulting in a potential leakage of a firm's proprietaryknowledge to rivals (Agarwal, Ganco, & Ziedonis, 2009; Almeida & Kogut, 1999; Rosenkopf &Almeida, 2003). Given that these spillovers may undermine a firm's competitive advantage(Campbell, Ganco, Franco, & Agarwal, 2012), understanding how firms respond to such threats is ofcentral importance to strategic management, innovation, and entrepreneurship (for a review, seeAgarwal, Gambardella, & Olson, 2014).1
Despite its importance, the relationship between the risk of losing knowledge to rivals and firm strategyis not well understood. The focus of scholarly attention has been on legal barriers and financial incentives(e.g., Agarwal et al., 2009; Carnahan, Agarwal, & Campbell, 2012; Ganco et al., 2015; Gilson, 1999;Kim &Marschke, 2005; Marx, 2011; Marx et al., 2009), but much less is known about nonpecuniary incen-tives and their role in mitigating the threat of knowledge appropriation by competitors. This study advancesthe extant literature by identifying one such strategic response: a firm's engagement in corporate socialresponsibility (CSR), defined as attention to the interests of nonfinancial stakeholders (Freeman, 1984).2
We propose that firms counter the threat of knowledge leakage by strategically increasing theirengagement in CSR. The underlying arguments are that CSR helps mitigate knowledge leakage intwo ways: (i) by reducing knowledge workers' propensity to join a rival firm (i.e., they are less likelyto “walk” out the door), and (ii) by reducing knowledge workers' propensity to disclose the firm'svaluable knowledge even if they join a rival firm (i.e., they are less likely to “talk”).
We substantiate these arguments by conducting a large-scale survey of knowledge workers. Themajority of respondents agreed that CSR helps retain valuable knowledge in these two ways—that is,(i) CSR practices decrease knowledge workers' willingness to join a rival firm, and (ii) even if they
1A “knowledge spillover” refers to a situation where knowledge is created by one agent and used by another agent withoutproper compensation for the knowledge producer. In principle, it could be that the previous employer may have paid theemployee less in the expectation of such leakage. In keeping with the literature on inventor mobility (e.g., Agarwal et al., 2009;Marx, Strumsky, & Fleming, 2009), we abstract away from this nuance.2As such, CSR includes any corporate initiative pertaining to the firm's stakeholders, that is, “any group or individual who canaffect or is affected by the achievement of an organization's purpose” (Freeman, 1984: 53)—such as employees, customers, theenvironment, and the community at large—and hence is not limited to philanthropic initiatives. For a similar definition see, forexample, Barnett and Salomon (2006), Flammer and Bansal (2017), and Graves and Waddock (2000).
2 FLAMMER AND KACPERCZYK
do, CSR practices decrease the risk that they disclose the firm's valuable knowledge to the newemployer. Overall, this survey provides supportive evidence for the arguments underlying our predic-tion that firms anticipate the benefits of CSR for knowledge workers, and use CSR as a strategic toolto counter the threat of knowledge appropriation by rivals.
We then examine whether companies increase their CSR in response to the threat of knowledge spill-overs. From an empirical perspective, it is difficult to establish a causal link between the threat of knowl-edge spillovers and firms' strategic use of CSR. For example, a negative relationship between firms' CSRpractices and the risk of knowledge spillovers may be spurious if such a relationship is driven byunobserved firm characteristics that affect both a firm's propensity to increase CSR and its exposure toknowledge spillovers. This concern is especially acute as firm-level attributes such as managerial talent,while difficult to observe, are likely to drive both a firm's investments in stakeholder initiatives and knowl-edge workers' propensity to disclose proprietary knowledge to rivals. Accordingly, leveraging a researchdesign that provides a clean causal estimate is central to ruling out alternative explanations.
To overcome this empirical challenge, we exploit a quasi-natural experiment provided by thestaggered rejection of the inevitable disclosure doctrine by several U.S. states between 1991 and2013. This doctrine prevents employees with valuable know-how from working for a competitor inthe immediate future, as they would inevitably disclose their current employer's trade secrets. Byfocusing on the rejection of the inevitable disclosure doctrine—which weakens the protection of afirm's proprietary knowledge—we are able to test whether companies strategically react to anincreased threat of knowledge spillovers by increasing their CSR.
Using a difference-in-differences methodology, we find that following the rejection of the inevitabledisclosure doctrine, companies significantly increased their CSR, as measured by the Kinder,Lydenberg, and Domini (KLD) index of CSR performance. This result holds for various types ofCSR—including employee-related CSR, as well as CSR related to the environment and society at large.These findings withstand a large number of robustness checks. Overall, our results are consistent withthe argument that CSR is used as a strategic tool to counter the threat of knowledge leakage.
Finally, we supplement our findings with evidence obtained from two experimental vignette stud-ies, one conducted in a laboratory setting, and another conducted on the online labor-sourcing plat-form Amazon Mechanical Turk. In both experiments, we randomly assigned subjects to hypotheticalemployers that either engaged or did not engage in CSR practices. Subjects were then told that theymoved to a rival firm and faced the decision of whether to disclose their previous employer's valuableknowledge (in the form of a client list). We find that subjects exposed to the CSR treatment(i.e., their previous employer engaged in CSR) were significantly less likely to disclose proprietaryknowledge to their new employer. This lends additional support to our argument that CSR reducesemployees' propensity to disclose the firm's valuable knowledge upon joining a rival firm.
This study integrates and contributes to several streams of literature. In particular, it highlights anovel mechanism—corporate social responsible practices—that firms use as a defense against knowl-edge leakage. Moreover, by documenting that the threat of knowledge leakage induces firms toincrease their CSR, our study sheds light on an unexplored antecedent of CSR.
2 | HYPOTHESIS DEVELOPMENT
2.1 | Strategic importance of preventing knowledge leakage
The strategy literature has long argued that the ability to innovate and adapt to changes in the busi-ness environment is critical for firm survival and for sustaining a competitive advantage
FLAMMER AND KACPERCZYK 3

(e.g., Eisenhardt & Martin, 2000; Flammer & Ioannou, 2018; Helfat et al., 2007; Teece et al., 1997).Moreover, and in the spirit of the resource-based view of the firm, achieving and sustaining a compet-itive advantage critically depends on the firm's ability to protect its valuable and rare resources fromimitation by competing firms (e.g., Barney, 1991; Mahoney & Pandian, 1992). As such, a firm'semployee know-how is a key source of sustained competitive advantage (e.g., Hall, 1993). Thisknow-how is particularly valuable if it is firm-specific as it is not tradable or applicable outside thefocal firm, making it difficult for competing firms to imitate (Coff, 1997; Dierickx & Cool, 1989;Grant, 1996; Kogut & Zander, 1992).
Yet, employee know-how that is also of value to competing companies offers no such protectiveshield, as employees with valuable knowledge can walk out the door to join a rival firm or create anew venture (Coff, 1997; Ganco et al., 2015; Kacperczyk, 2012, 2013; Starr, Balasubramanian, &Sakakibara, 2018), taking their knowledge away from the focal firm to the new employer. Moreover,competing firms may actively poach employees with valuable knowledge to gain access to the focalfirm's knowledge sources and technological expertise (Businessweek, 2000; Rao & Drazin, 2002;Stern & James, 2016). Both can have dire consequences for the focal firm as they facilitate techno-logical knowledge transfer (e.g., Agarwal et al., 2014; Almeida & Kogut, 1999; Rosenkopf &Almeida, 2003; Song, Almeida, & Wu, 2003) and enhance the rival firm's product innovation(Rao & Drazin, 2002). In sum, the departure of employees whose know-how is also valuable to com-peting companies—whether rival established firms or entrepreneurial ventures—increases the risk ofknowledge leakage and represents a significant threat to the company's competitiveness (Campbell,Ganco, et al., 2012; Wezel, Cattani, & Pennings, 2006). Accordingly, understanding how firmsrespond to the threat of knowledge leakage lies at the core of strategic management.
2.2 | Companies' strategic responses to the threat of knowledge leakage
The managerial challenge of countering the threat of knowledge leakage has spurred a large literaturein management, economics, and psychology. But despite this long research inquiry, little is knownabout whether firms engage in CSR to counter the risk of knowledge leakage. First, the majority ofstudies has focused on institutional factors—such as the inevitable disclosure doctrine, noncompetecovenants, and patent enforcement. This line of research suggests that institutional barriers play animportant role in reducing the threat of knowledge appropriation by rival firms (e.g., Agarwal et al.,2009; Ganco et al., 2015; Gilson, 1999; Kim & Marschke, 2005; Marx, 2011; Marx et al., 2009;Png & Samila, 2015; Starr, Ganco, & Campbell, 2018). Another line of research focuses on firm'suse of pecuniary incentives to prevent the loss of valuable knowledge (e.g., Carnahan et al., 2012).3
Finally, a burgeoning literature suggests that firms use nonpecuniary incentives in order to manageknowledge workers. In particular, Gambardella, Khashabi, and Panico (2015) and Gambardella, Pan-ico, and Valentini (2015) highlight the role of autonomy in incentivizing knowledge workers. Relat-edly, Stern (2004) shows that scientists are less sensitive to monetary incentives, and are even willingto forgo monetary benefits for the discretion in choosing which research projects to pursue.
We complement this body of literature by examining the role of relationship-based initiatives—such as social responsible practices—and propose that firms strategically engage in CSR as a defenseagainst the risk of knowledge appropriation by rival firms. Specifically, we argue that firms respondto an increased threat of knowledge leakage by improving their CSR practices, as such practices are
3For a discussion of the limitations of pecuniary incentives, see Akerlof and Kranton (2005), Gibbons (1998), Larkin andPierce (2015), Prendergast (1999).
4 FLAMMER AND KACPERCZYK

likely to enhance knowledge workers' loyalty and reduce their propensity to disclose valuable knowl-edge even if they move to a rival firm. In the following, we elaborate on these arguments.
2.3 | The two-fold effect of CSR on knowledge workers: decrease in “walking” and “talking”
In this section, we argue that CSR has a two-fold effect: it mitigates the risk of knowledge leakage byreducing knowledge workers' propensity to (i) join a rival firm (i.e., they are less likely to “walk” outthe door), and (ii) disclose the firm's valuable knowledge even if they join a rival firm (i.e., they areless likely to “talk”). Moreover, these effects can operate directly through employee-centered CSR,and indirectly through initiatives focused on other stakeholders (e.g., local communities and thenatural environment).
2.3.1 | CSR and knowledge workers' propensity to “walk”We first turn our attention to the effect of CSR on the risk that knowledge workers leave for a com-petitor. There is accumulated evidence by now that, by engaging in CSR, firms can reduceemployees' concerns and improve the overall reputation of the firm as a workplace. Indeed, recentsurveys suggest that the perception of a firm's CSR practices—such as higher environmental manage-ment and product standards, philanthropic activities, global citizenship, etc.—is a key driver of howindividuals feel about a company and strongly influences their willingness to work for it (Forbes,2013; McKinsey, 2009; Reputation Institute, 2015; World Economic Forum, 2003).4 In addition tothese reputational benefits, CSR can spur knowledge creation and innovation, as it promotes a securework environment that is conducive to experimentation and enhances the satisfaction of employeesand other stakeholders (Flammer & Kacperczyk, 2016). This likely augments the firm's attractivenessas an innovative workplace for knowledge workers, and attenuates competitors' ability to poachemployees and appropriate valuable know-how.
Relatedly, we argue that CSR practices allow knowledge workers to have a positive impact onsociety and the natural environment, thereby enhancing knowledge workers' propensity to stay withtheir current employer. In line with this argument, Bode, Singh, and Rogan (2015) and Carnahan,Kryscynski, and Olson (2017) show that firms that engage their employees in social impact projectsand pro bono work are better able to retain them.5 Beside engaging employees directly in socialinitiatives—which has been the focus of the extant literature (e.g., Bode et al., 2015; Carnahan et al.,2017)—employers can also allow knowledge workers to have an indirect impact on society and thenatural environment (e.g., by sourcing from suppliers that comply with fair labor standards, usingrenewable energy for their production processes, developing environmental-friendly technologies,offering business solutions to underserved communities, promoting social inclusion and a fair workenvironment, etc.). As such, we argue that CSR (with respect to a wide set of stakeholders) allowsknowledge workers to have direct and indirect social and environmental impact from which they
4Several senior executives commented on the growing interest that top graduates are showing in their company's social prac-tices and values. For example, Vernon Ellis of Accenture stated that “young people increasingly want to be associated with anorganization that is making a difference in the wider world. And many also want to use their skills in making a contributionthemselves.” Jim Copeland, former CEO of Deloitte, further comments that “[a]ttracting and retaining high caliber profes-sionals is imperative, making our responsibility to our people even more important. The best professionals in the world want towork in organizations in which they can thrive. And, they want to work for companies that exhibit good corporate citizenship”(World Economic Forum, 2003, p. 19).5Moreover, evidence from the previous literature suggests that firms that engage employees in philanthropic activities and areperceived as being fair and caring are better able to attract employees (e.g., Albinger & Freeman, 2000; Greening & Turban,2000; Turban & Greening, 1996).
FLAMMER AND KACPERCZYK 5
may derive intangible benefits.6 Considering the sensitivity of knowledge workers to intangible bene-fits (e.g., Gambardella, Panico, & Valentini, 2015; Stern, 2004), we expect that—all else equal—these intangible benefits improve knowledge workers' overall appreciation of their current employerand hence positively influence knowledge workers' decision to stay with the firm, thereby decreasingthe risk of knowledge leakage.
2.3.2 | CSR and knowledge workers' propensity to “talk”While the previous arguments focused on firms' efforts to mitigate employees' propensity to “walk,”little is known on how to prevent employees from disclosing their previous employer's valuableknowledge upon joining a rival firm. The question of how to decrease employees' propensity to“talk” is especially important when it comes to knowledge workers given that (i) knowledge workershave access to the firm's valuable knowledge, and (ii) their interfirm mobility is higher compared toregular employees (e.g., Ganco et al., 2015; Marx et al., 2009). Therefore, shielding against knowl-edge leakage also requires that firms reduce knowledge workers' propensity to disclose valuableknowledge in case they do join a competitor.7
We argue that CSR practices offer such a strategic tool—that is, a tool that helps reduce knowl-edge workers' willingness to “talk”—because they enhance workers' social ties and identificationwith the firm.8 The argument that CSR may strengthen knowledge workers' identification with thefirm echoes well with the extant literature. In particular, prior work argues that employees infer fromfirms' CSR engagement whether the managers and the organization are fair-minded on an individual,group, and universal level (Aguilera, Rupp, Williams, & Ganapathi, 2007) and evaluate whether thefirm's attitudes fit with individuals' identity (Kim, Lee, Lee, & Kim, 2010). If they fit, then employeesdevelop a sense of belonging and their actions align with organizational interests as reflected in, forexample, stronger organizational commitment and improved citizenship behavior (Flammer & Luo,2017; Rupp, Ganapathi, Aguilera, & Williams, 2006). Conversely, if they do not fit, then employeesmay separate from their employer and sort into firms that match with their own identity. In this vein,empirical evidence suggests that by managing employee relations and group demography, companiesare able to foster social integration and job satisfaction (Dimarco, 1975; Jackson et al., 1991;O'Reilly, Caldwell, & Barnett, 1989; O'Reilly & Chatman, 1986). Moreover, in controversial indus-tries, employees show greater organizational trust and identification with their company if it engagesin environmental-friendly efforts (De Roeck & Delobbe, 2012). Overall, these studies suggest thatCSR practices can strengthen employees' social ties and identification with the firm. Accordingly, weexpect that CSR practices strengthen knowledge workers' identification with the firm and, as a result,reduce their willingness to undermine their previous employer.
Furthermore, a large body of work in organizational psychology suggests that employees' organi-zational justice perception can influence their trust and other individual behaviors towards the organi-zation (Colquitt, Conlon, Wesson, Porter, & Ng, 2001). In this vein, we posit that good corporate
6Employee-related CSR initiatives—similar to pecuniary benefits—provide direct benefits to employees. In contrast, CSR ini-tiatives targeted towards other stakeholders do not offer direct benefits but may nevertheless provide indirect, intangible bene-fits to employees.7In contrast, other employees do not have access to a firm's trade secrets and hence keeping them from talking is of lesserimportance. This may explain why the extant CSR literature has focused on employee retention as opposed to the knowledgeitself and, more specifically, knowledge workers' propensity to “talk” after parting from their previous employer.8Note that the arguments provided in this section are interrelated, as the previous two arguments—CSR improving (i) the firm'sreputation and (ii) knowledge workers' impact on society and the natural environment—can contribute to employees' identifica-tion with the firm (thereby decreasing the propensity to “talk”). Similarly, stronger identification with the firm can enhanceknowledge workers' propensity to stay at their current employer (thereby decreasing the propensity to “walk”).
6 FLAMMER AND KACPERCZYK

citizenship towards the firm's wider set of stakeholders likely improves knowledge workers' generaljustice perception and strengthens their ethical behavior towards the organization, decreasing theirwillingness to undermine the previous employer by leaking its valuable knowledge to the newemployer.
In sum—and in contrast to direct employee benefits (such as pecuniary benefits) and other manage-ment practices that aim at preventing knowledge leakage—we expect that firms' CSR initiativesstrengthen knowledge workers' loyalty in terms of both the “walking” and “talking.” First, CSR initiativesallow knowledge workers to derive intangible benefits from having (direct and indirect) impact on societyand the natural environment, which in turn decreases their propensity to walk out the door. Second, evenif they choose to do so—which is common among knowledge workers—their former employer's goodcorporate citizenship towards society strengthens knowledge workers' identification with the firm andtheir ethical decision-making. Accordingly, we expect that, when firms engage in CSR, knowledgeworkers are less likely to disclose the firm's valuable knowledge even if they join a rival firm.9
2.4 | Survey evidence
To substantiate the above arguments, we conduct a large-scale survey of knowledge workers. See theOnline Appendix S1 (Appendix A. Survey of knowledge workers) for details on the survey designand precise wording of the questions.
For all survey questions, we asked respondents to agree or disagree with the proposed statements,using a standard 6-point Likert scale ranging from Strongly Disagree (= 1) to Strongly Agree (= 6).Table 1 summarizes the responses to our questions.10 Panel (A) provides the responses to the prelimi-nary questions. First, nearly all survey respondents (83%) stated that they are currently working or havepreviously worked as employees with access to a firm's trade secrets.11 Moreover, 98% of respondentsagreed that it is important for a firm to put in place practices that aim to retain workers with access to afirm's trade secrets, with a mean response of 5.3 out of 6. The mean is statistically different from theneutral mid-point response of 3.5 at all conventional significance levels (p = 0.000).
Panel (B) then reports the answers to the questions about whether respondents view CSR as ameans of reducing knowledge spillovers. First, 95% agreed that socially-responsible practices canenhance knowledge workers' appreciation of their current employment (with a mean response of 5.0out of 6), and 93% agreed that socially responsible practices can improve the firm's ability to retainknowledge workers (with a mean response of 4.9 out of 6). Moreover, respondents generally agreedthat CSR practices help differentiate the company from other firms (91% with a mean response of4.6); improve the overall reputation of the company (97% with a mean response of 5.0); allowemployees to have a positive impact on society and the natural environment (92% with a meanresponse of 4.9); and help strengthen workers' loyalty to the company (89% with a mean response of4.7). Importantly, the majority of participants (64% with a mean response of 3.9) agreed that CSRpractices decrease the risk that knowledge workers disclose a firm's unique and valuable knowledgeeven if they choose to leave the company and work for the rival firm. For all these responsesthe mean was statistically different from the neutral mid-point response of 3.5 at all conventionalsignificance levels (p = 0.000).
9Moreover, knowledge workers' reluctance to talk will likely discourage competing firms from poaching and hiring them in thefirst place. As such, the fact that the workers are less likely to talk might decrease their propensity to walk. This, in turn, likelyfurther enhances the effectiveness of CSR as a defense mechanism against knowledge leakage.10Respondent characteristics are provided in Table A1 (Appendix S1).11For this reason, we refer to this survey as a survey of “knowledge workers.” The results are similar if we exclude the 17%respondents who reported not having access to trade secrets.
FLAMMER AND KACPERCZYK 7

Finally, Panel (C) reports the answers to questions pertaining to a hypothetical scenario, in whichrespondents were told that a legislative change was about to increase the threat of knowledge spill-overs. The respondents agreed that, in order to counter the threat of knowledge spillovers, they would(a) increase nonsalary work/life benefits (91% with a mean response of 4.7); (b) offer more authority
TABLE 1 Alumni survey
p-Value p-Value
Mean Median SD % Agree(mean vs.mid-point)
(% agreevs. 50%)
Panel (A): Preliminary questions
Had access to trade secrets (yes/no) — — — 82.7% — 0.000
Important to retain workers with access totrade secrets
5.3 (out of 6) 5 0.78 97.9% 0.000 0.000
Panel (B): General questions: In general, CSR …… enhances knowledge workers'
appreciation of their current employment5.0 (out of 6) 5 0.91 95.0% 0.000 0.000
… improves the firm's ability to retainknowledge workers
4.9 (out of 6) 5 0.98 92.6% 0.000 0.000
… helps differentiate the company fromother employers
4.6 (out of 6) 5 0.98 90.5% 0.000 0.000
… improves the overall reputation of thecompany as a workplace
5.0 (out of 6) 5 0.83 96.8% 0.000 0.000
… allows employees to have a positiveimpact on society and the naturalenvironment
4.9 (out of 6) 5 0.99 92.4% 0.000 0.000
… helps strengthen workers' loyalty to thecompany
4.7 (out of 6) 5 1.08 88.8% 0.000 0.000
… decreases the risk that knowledgeworkers disclose a firm's unique andvaluable knowledge such as trade secretseven if they choose to leave the companyto work for a rival firm
3.9 (out of 6) 4 1.28 63.8% 0.000 0.000
Panel (C): Hypothetical scenarios: To mitigate the threat ofknowledge spillovers, I would …
… increase nonsalary work/life benefits(e.g., flex time, child care, etc.)
4.7 (out of 6) 5 1.04 90.7% 0.000 0.000
… offer more authority and employeeinvolvement
4.9 (out of 6) 5 0.95 93.4% 0.000 0.000
… improve the firm's policies to supportminorities and other underrepresentedgroups
4.1 (out of 6) 4 1.20 74.7% 0.000 0.000
… improve the work environment 4.6 (out of 6) 5 1.00 88.3% 0.000 0.000
… provide the opportunity to devote someof the work time to environmental/socialinitiatives
4.1 (out of 6) 4 1.15 74.4% 0.000 0.000
… increase the firm's engagement in localcommunities
4.0 (out of 6) 4 1.14 70.0% 0.000 0.000
… increase the firm's efforts to be eco-friendly
3.9 (out of 6) 4 1.14 68.8% 0.000 0.000
… improve firm relations with customers 4.6 (out of 6) 5 1.10 86.3% 0.000 0.000
Notes. Agreement is measured on a 6-point Likert scale ranging from Strongly Disagree (= 1) to Strongly Agree (= 6). “p-value (meanvs. mid-point)” indicates whether the mean is significantly higher than the neutral mid-point of 3.5; “p-value (% agree vs. 50%)” indi-cates whether the percentage of respondents agreeing with the statement is significantly higher than 50%. The precise wording of thequestions is provided in Appendix A of Online Appendix S1.
8 FLAMMER AND KACPERCZYK

and employee involvement (93% with a mean response of 4.9); (c) improve the firm's policies to sup-port minorities (75% with a mean response of 4.1); (d) improve the work environment in terms ofhealth safety, recreational facilities, sports, and wellness offerings (88% with a mean response of4.6); (e) provide employees with the opportunity to devote some of their work time toenvironmental/social initiatives (74% with a mean response of 4.1); (f) increase the firm's engage-ment in local communities (70% with a mean response of 4.0); (g) increase the firm's efforts to beeco-friendly (69% with a mean response of 3.9); and (h) improve the firm's relations with customers(86%; with a mean response of 4.6). Again, we note that for all these responses, the mean was statisti-cally different from the neutral mid-point response of 3.5 at all conventional significance levels(p = 0.000).
Overall, the survey evidence is consistent with the arguments proposed above: CSR practices areperceived to mitigate the threat of knowledge leakage in two ways—knowledge workers are lessinclined to join rival firms and, even if they do, they are less likely to disclose the firm's valuableknowledge to their new employer.12 The evidence further indicates that a broad set of CSR policies(not just employee-related CSR programs) are perceived to be effective.
2.5 | Corporate social responsibility as strategic response to the threat of knowledge leakage
The above arguments—along with the survey evidence—suggest that CSR practices mitigate the riskof knowledge leakage in two ways: (i) knowledge workers are less likely to join a rival firm(i.e., they are less likely to “walk”), and (ii) even if they do, they are less likely to disclose the firm'svaluable knowledge to their new employer (i.e., they are less likely to “talk”). Hence, when the riskof knowledge spillovers increases, we expect companies to strategically increase their engagement inCSR practices.
A key assumption underlying this prediction is that managers recognize the value of CSR in miti-gating knowledge leakage. As discussed above, this assumption is supported by the survey results—respondents recognize the two-fold effect that CSR practices have on knowledge workers' behavior,and see the firm's CSR engagement (with respect to a wide set of stakeholders) as a way to addressthe risk of knowledge leakage.
It is this two-fold effect on knowledge workers' loyalty that sets CSR apart from other manage-ment practices, which also aim to prevent knowledge leakage to rival firms. Numerous practices—such as increasing the legal protection of intellectual property through patenting (Kim & Marschke,2005), establishing a reputation for toughness in patent enforcement (Agarwal et al., 2009), signingnoncompete agreements (Marx, 2011; Marx et al., 2009), and enhancing pecuniary incentives(Carnahan et al., 2012; Kacperczyk & Balachandran, 2018)—allow firms to reduce knowledge spill-overs through decreased mobility of knowledge workers. Yet, as discussed above, many knowledgeworkers still leave for rival firms, and interfirm mobility tends to be higher among those whoseknow-how is also valuable to competing companies (e.g., Ganco et al., 2015; Marx et al., 2009).Therefore, shielding against knowledge spillovers also requires that firms reduce employees' propen-sity to disclose valuable knowledge in case they do join a competitor. Unlike other tools, CSR prac-tices mitigate such disclosure risk by enhancing knowledge workers' identification with the firm andtheir ethical behavior towards the organization, thereby decreasing the risk that they would disclosethe firm's valuable knowledge upon joining a competitor. Moreover, CSR programs are firm-specificand arguably less easily imitable by other companies than pecuniary incentives, thus allowing the
12All results are similar if we restrict the sample to respondents who indicated that they currently work in a managing role(CEO, executive, or manager—about 59% of the respondents) and hence have the actual ability to implement CSR policies.
FLAMMER AND KACPERCZYK 9

focal firm to align knowledge workers' interests with organizational goals without directly allocatingrents to their workers. Accordingly, based on the above arguments, we expect firms to increase theirCSR in response to an increased threat of knowledge leakage.13
Hypothesis (H1). Companies respond to an increase in the threat of knowledge leakage by increas-ing their corporate social engagement.
3 | DATA AND METHODOLOGY
3.1 | Data and variable definitions
3.1.1 | Inevitable disclosure doctrine
Empirically, it is difficult to estimate how the threat of knowledge spillovers affects companies'decisions to invest in CSR. For instance, one could regress companies' CSR on some measure ofexposure to knowledge spillovers. Yet, such regression is subject to a classic endogeneity problem,that is, unobservable firm characteristics may drive a spurious relationship between the two. Forexample, it could be that management quality—which is difficult to observe—drives both CSRdecisions and knowledge workers' propensity to disclose valuable firm knowledge. To rule outsuch alternative explanations, it is necessary to leverage a research design that provides exogenousshifts in the threat of knowledge spillovers—such exogenous shifts would allow us to estimate thecausal effect of the threat of knowledge spillovers on firms' strategic use of CSR. The specificsource of exogenous variation we exploit in this paper is the rejection of the inevitable disclosuredoctrine.
The inevitable disclosure doctrine prevents employees with valuable know-how from working for acompetitor in the immediate future, as they would “inevitably disclose” their current employer's tradesecrets. As such, the inevitable disclosure doctrine provides employers with a strong mechanism toreduce knowledge spillovers by decreasing interfirm mobility of knowledge workers (e.g., Castellaneta,Conti, & Kacperczyk, 2016; Gilson, 1999; Png & Samila, 2015), as the mere possibility of trade secretdisclosure is sufficient for this doctrine to apply (i.e., no actual disclosure needs to have occurred).Appendix B of Online Appendix S1 describes the institutional background underlying the doctrine.
In this study, we focus on the rejection of the inevitable disclosure doctrine by U.S. states. Thisrejection occurs when a state court rules that the doctrine is not enforceable in the state. By rejectingthe doctrine, states remove an important mobility restriction for workers with valuable knowledge,and hence facilitate knowledge appropriation by rivals. Since the rejection of the inevitable disclosuredoctrine does not reflect any firm's strategic decision, it offers plausibly exogenous variation in afirm's exposure to knowledge spillovers. This allows us to test whether companies react to anincreased threat of knowledge spillovers by strategically increasing their CSR engagement. By theyear 2013 (the end of our sample), a total of 14 states in the U.S. had rejected the inevitable disclo-sure doctrine. Table A2 (of Online Appendix S1) lists all 14 states along with the rejection years (and
13Naturally, this assumes that the firm's response is not fully impaired by organizational rigidities. In this vein, while we con-jecture that companies respond to the increased risk of knowledge leakage by increasing their engagement in CSR practices,we note that imperfect information flow and coordination within the organization may cause some delay in responding. Thiscould explain why the increase in CSR comes with a 12–24 months lag in the dynamic analysis (for details, see Table 2 andFigure A1 in Online Appendix S1, which we discuss in the Results section).
10 FLAMMER AND KACPERCZYK
the relevant cases). This list is adapted from Kahnke, Bundy, and Liebman (2008) and Kahnke andBundy (2013), and is updated with recent court rulings.14
3.1.2 | Data sources and sample selection
To construct our sample, we merge the KLD database with Standard & Poor's Compustat. The KLDdatabase contains annual ratings of companies' social and environmental performance from 1991onward; Compustat contains accounting information and additional firm-level information (such asindustry classification, state of location, etc.) for U.S. public companies. We exclude observationswith missing accounting information, as well as companies located outside of the United States.Using these selection criteria, we obtain a final sample of 30,216 firm-year observations from 1991to 2013.
3.1.3 | Dependent variable
The CSR data are obtained from the KLD database. KLD is an independent social choice investmentadvisory firm that compiles ratings on the extent to which companies address the needs of their stake-holders. For each stakeholder group, strengths and concerns are measured to evaluate positive andnegative aspects of corporate actions towards stakeholders. These ratings are compiled from multipledata sources, including annual questionnaires sent to companies' investor relations offices, firms'financial statements, annual and quarterly reports, general press releases, government surveys, andacademic publications (see KLD, 2010). KLD ratings are widely used in CSR studies (see Chatterji,Durand, Levine, & Touboul, 2016).
We construct the composite KLD-index by summing up the number of KLD strengths withrespect to employees, customers, the natural environment, and communities.15 In the analysis, wealso consider subindices based on specific stakeholder groups.
One caveat of the KLD-index—and, more generally, any CSR rating—is that it is subject to mea-surement error, as it is difficult to accurately measure CSR (e.g., Chatterji et al., 2016; Chatterji,Levine, & Toffel, 2009; Delmas & Blass, 2010). This measurement error is unlikely to bias ourresults, though—intuitively, there is no reason to expect a systematic relationship between measure-ment error in the KLD-index and state courts' rejection of the inevitable disclosure doctrine. In addi-tion, in auxiliary analysis, we show that our results are robust if we use Thomson Reuters' ASSET4index of social and environmental performance in lieu of the KLD-index, thereby following Chatterjiet al.'s (2016) advice to use more than one measure of CSR to minimize potential issues of measure-ment error.
3.1.4 | Control variables
In our analysis, we control for a set of firm-level characteristics that may affect a firm's social engage-ment, all of which are obtained from Compustat. Size is the natural logarithm of the book value oftotal assets. Return on assets (ROA) is the ratio of operating income before depreciation to the bookvalue of total assets. Tobin's Q is the ratio of the market value of total assets (obtained as the bookvalue of total assets plus the market value of common stock minus the sum of the book value of com-mon stock and balance sheet deferred taxes) to the book value of total assets. Leverage is the ratio of
14We are grateful to lawyers Randall Kahnke, Kerry Bundy, and Ken Liebman from the trade secret practice of Faegre BakerDaniels LLP for sharing their insights on the inevitable disclosure doctrine. Note that a 15th state, Louisiana, rejected the inevi-table disclosure doctrine in 1967. This rejection year precedes our sample period and hence is not pertinent to our analysis.15In addition to CSR strengths, the KLD database also contains a list of CSR weaknesses, labeled “concerns.” Accordingly, analternative approach is to construct a “net” KLD-index by subtracting the number of concerns from the number of strengths. Inrobustness checks, we show that our results are similar if we use this net KLD-index instead.
FLAMMER AND KACPERCZYK 11

debt (long-term debt plus debt in current liabilities) to the book value of total assets. Cash holdings isthe ratio of cash and short-term investments to the book value of total assets. To mitigate the impactof outliers, all ratios are winsorized at the 1st and 99th percentiles of their empirical distribution.
3.1.5 | Summary statistics
In Table A3 (Online Appendix S1), we present descriptive statistics for the main variables used inthis paper, as well as the corresponding correlation matrix. We note the positive correlation betweenthe KLD-index and firm size (51.1%), which underlines the need to control for size in ourregressions.
3.2 | Methodology
3.2.1 | Difference-in-differences
To examine whether firms increase their CSR following the rejection of the inevitable disclosure doc-trine, we use a difference-in-differences methodology based on the 14 treatments listed in Table A2(Online Appendix S1). Our methodology follows Bertrand and Mullainathan's (2003) application ofthe difference-in-differences methodology in the presence of staggered treatments at the state level.Specifically, we estimate the following regression:
KLDit=αi+αj×αt+αr×αt+β× IDDst+γ0Xit+εit , ð1Þ
where i indexes firms; t indexes years; j indexes 2-digit SIC industries; s indexes states of location;r indexes Census regions; αi are firm fixed effects; αj × αt are industry by year fixed effects; and αr ×αt are region by year fixed effects, respectively.16 KLD is the dependent variable of interest. IDD isthe “treatment dummy”—that is, a dummy variable that equals one if the company is located in astate that has rejected the inevitable disclosure doctrine by year t.17,18 X is the vector of control vari-ables, which includes size, ROA, Tobin's Q, leverage, and cash holdings. ε is the error term. Theregression is estimated by Ordinary Least Squares (OLS). We account for serial correlation of theerror term by clustering SEs at the state of location. The coefficient of interest is β, which measuresthe effect of the rejection of the inevitable disclosure doctrine on firms' CSR. Hypothesis 1 predictsthat β should be positive and significant.
In regression (1), αi accounts for unobserved heterogeneity at the firm level. (Note that state fixedeffects are subsumed by the firm fixed effects and hence need not be included.) The inclusion of αj ×αt accounts for industry trends that may correlate with the treatment. Similarly, the inclusion of αr ×αt account for any regional trend (e.g., regional economic booms) that may correlate with the rejec-tion of the inevitable disclosure doctrine.19 Finally, the controls account for differences in terms of
16For the mapping of states to Census regions, see U.S. Census Bureau (1994, pp. 6–24).17The inevitable disclosure doctrine applies at the state of location (as opposed to the state of incorporation). To proxy for thestate of location, we use the state of headquarters' location provided in Compustat. Doing so raises two measurement issues.First, Compustat only records the state of location for the latest available year and hence does not account for headquarters relo-cations. Second, the state of headquarters' location is an imperfect measure of employees' location—if some of the company'sfacilities are located in a different state, then employees at those facilities are subject to a different legal regime. In robustnesschecks, we address these measurement issues by using the data of Garcia and Norli (2012) on the state-level operations of com-panies based on their 10-K filings. Following the approach of Flammer and Luo (2017), we then show that our results arerobust if we restrict the sample to the subset of firms that have at least 80% of their operations in the state in question (“geo-graphically concentrated firms”).18Note that the control group includes all states that have not rejected the IDD—that is, it includes states that have not ruled onthe IDD, as well as states that have ruled in favor. In robustness checks, we consider several variations of the control group.19Note that we cannot include state by year fixed effects since the treatment is at the state-year level.
12 FLAMMER AND KACPERCZYK

size, profitability (ROA), investment opportunities (Tobin's Q) and financing (leverage and cashholdings).
Our identification strategy can be illustrated with a simple example. Suppose we want to measurethe effect of Maryland's 2004 rejection of the inevitable disclosure doctrine on firms' CSR practices.We would compute the difference in the KLD-index post-2004 versus pre-2004 for companieslocated in Maryland (“treated firms”). Yet, other events may have happened around 2004, potentiallyinfluencing firms' social engagement. For example, there may have been an economy-wide boom thattranslates into higher profits and hence more resources available to invest in CSR after 2004. Toaccount for such contemporaneous effects, we use a control group. For example, we could look atfirms located in Pennsylvania (“control firms”) and compute the corresponding difference in theKLD-index post-2004 versus pre-2004 (Pennsylvania did not reject the doctrine). Computing the dif-ference between these two differences provides an estimate of the effect of Maryland's 2004 rejectionof the inevitable disclosure doctrine on the KLD-index, controlling for contemporaneous changes inthe KLD-index that are due to changes in economic conditions. The difference between this exampleand our regression specification is that the latter accounts for the fact that the rejection of the inevita-ble disclosure doctrine is staggered over time across states. It follows that the composition of boththe treatment and control groups changes over time as more states are progressively treated.
Our identification strategy needs to satisfy two requirements to be valid. First, the treatment(i.e., the rejection of the IDD) needs to bring about relevant changes in the threat of knowledge spill-overs (relevance condition). Second, the treatment needs to be exogenous with respect to CSR (exclu-sion restriction). In Appendix C of Online Appendix S1, we discuss both requirements in detail.
4 | RESULTS
Main results. The main results are presented in columns (1)–(3) of Table 2. In all regressions, thedependent variable is the KLD-index. In column (1), the regression includes the treatment dummy(IDD), as well as firm and year fixed effects. In column (2), we also include industry × year andregion × year fixed effects. In column (3), we further include control variables. As can be seen, thecoefficient of the treatment dummy is positive and significant in all three specifications. More specifi-cally, it lies between 0.167 and 0.258 and is always significant at the 5% level (p-values rangingbetween 0.012 and 0.041). This implies that the rejection of the inevitable disclosure doctrine leadsto a CSR increase by about 0.17–0.26 KLD strengths. This effect is quite sizeable. Since the averagenumber of KLD strengths is 1.357 (and the SD 2.208, see Table A3 in Online Appendix S1), itimplies that companies increase their CSR by 13–19% following the rejection of the inevitable disclo-sure doctrine (corresponding to an increase by 8–12% of a SD). Overall, these findings indicate thatfirms respond to the increased threat of knowledge spillovers by increasing their social engagement,which lends support to Hypothesis 1.
Dynamics. In column (4), we inspect the dynamics of the treatment effect. To do so, we replacethe treatment dummy with a set of four dummy variables indicating the year prior to the treatment(IDD (−1)), the year of the treatment (IDD (0)), the first year after the treatment (IDD (1)), and twoor more years after the treatment (IDD (2+)). As is shown, the coefficient of IDD (−1) is small andinsignificant, which confirms that there is no pre-existing trend in the data. The coefficient of IDD(0) is insignificant as well, that is, there is no effect in the year of the treatment either. In fact, asshown by the positive and significant coefficient of IDD (1), it is only in the first year after the treat-ment that the effect becomes large and significant. This suggests that it takes about 12 to 24 monthsfor the increased threat of knowledge spillovers to translate into improved CSR practices. Finally, the
FLAMMER AND KACPERCZYK 13

coefficient of IDD (2+) remains large and significant, which indicates that the increased threat ofknowledge spillovers has a long-lasting effect on companies' social engagement.20
Stakeholder groups. In columns (5)–(7), we decompose the KLD-index into three subindices per-taining to (i) employees, (ii) environment and communities, and (iii) customers (i.e., product respon-sibility). We find that all three subindices increase following the treatment, suggesting thatcompanies use a broad range of CSR practices to mitigate the threat of knowledge spillovers. Morespecifically, the effect is large and significant for employees (coefficient of 0.085, p-value = 0.065)
TABLE 2 Main results
KLD-index KLD-index KLD-index
Dependent variable KLD-index (employees)(environment andcommunity) (customers)
(1) (2) (3) (4) (5) (6) (7)
IDD 0.258 0.167 0.171 0.085 0.075 0.011
(0.126) (0.070) (0.068) (0.046) (0.035) (0.011)
IDD (−1) −0.008
(0.060)
IDD (0) 0.022
(0.072)
IDD (1) 0.175
(0.092)
IDD (2+) 0.285
(0.098)
Size 0.174 0.177 0.136 0.013 0.025
(0.076) (0.075) (0.048) (0.031) (0.007)
ROA 0.079 0.081 0.138 −0.057 −0.003
(0.140) (0.142) (0.101) (0.067) (0.025)
Tobin's Q −0.028 −0.027 −0.008 −0.023 0.004
(0.017) (0.017) (0.015) (0.007) (0.003)
Leverage 0.187 0.188 0.066 0.095 0.026
(0.114) (0.114) (0.068) (0.057) (0.027)
Cash 0.444 0.450 0.173 0.233 0.039
(0.145) (0.145) (0.103) (0.063) (0.021)
Year fixed effects Yes – – – – – –
Firm fixed effects Yes Yes Yes Yes Yes Yes Yes
Industry × year fixed effects No Yes Yes Yes Yes Yes Yes
Region × year fixed effects No Yes Yes Yes Yes Yes Yes
R2 0.750 0.777 0.778 0.778 0.746 0.683 0.558
Observations 30,216 30,216 30,216 30,216 30,216 30,216 30,216
Notes. SEs (clustered at the state level) are reported in parentheses.
20In Figure A1 (Online Appendix S1), we illustrate the dynamics of the treatment effect by plotting the average KLD-index inthe treatment group minus the average KLD-index in the control group 3 years before and after the rejection of the inevitabledisclosure doctrine (the 95% confidence interval is reported within dashed lines). As can be seen, the pattern in Figure A1(Online Appendix S1) mirrors the pattern in column (4) of Table 2—there is no pre-trend, the effect comes with a lag of 12 to24 months, and it is somewhat persistent over time.
14 FLAMMER AND KACPERCZYK

as well as the environment and communities (coefficient of 0.075, p-value = 0.032), while it is some-what smaller for customers (coefficient of 0.011, p-value = 0.317).
ASSET4. In Table A4 (Online Appendix S1), we re-estimate our baseline specification usingThomson Reuters' ASSET4 ratings (in lieu of the KLD-index).21 ASSET4 rates companies alongthree dimensions (“pillars”): environmental issues, social issues, and corporate governance. In theanalysis, we use the first two ratings (environment score, social score), along with the compositescore that combines both ratings (composite score). As is shown, both the environment and socialscores (as well as the composite score) increase significantly following the rejection of the inevitabledisclosure doctrine, consistent with our findings based on KLD data.22 In Table A5 (Online Appen-dix S1), we further refine this analysis by splitting environment score and social score into the under-lying ten ASSET4 categories. Again, the results mirror those we obtained with the KLD data—theincrease is large for the ASSET4 categories pertaining to employees (columns (1)–(4)), communitiesand society (columns (5)–(6)) and the environment (columns (8)–(10)), while it is somewhat smallerfor customers (column (7)).23 Overall, this finer analysis confirms that companies use several CSRlevers in response to the threat of knowledge spillovers (not just employee-related CSR).
Alternative explanations. The results in Table 2 show that companies respond to the treatment byincreasing their CSR, consistent with our arguments that CSR helps mitigate knowledge spillovers.There are other potential explanations, though. First, it could be that—due to the higher mobility ofknowledge workers induced by the rejection of the IDD—companies find it less attractive to allocateresources to R&D and employee training. Instead, they would reallocate these resources to other pro-jects such as CSR, which could explain our results. Nevertheless, we find no evidence in support ofthis alternative. As discussed above, in Table A5 (Online Appendix S1), we find that the ASSET4component “workforce: training and development” increases (as opposed to decreases) following thetreatment. Moreover, in Table A6 (Online Appendix S1), we re-estimate our baseline specificationusing R&D as dependent variable, defined as the ratio of R&D expenditures to sales (column (1))and the ratio of R&D expenditures to total assets (column (2)), both winsorized at the 1st and 99thpercentiles of their empirical distribution. We find no significant change in R&D spending followingthe treatment.24 Second, it could be that companies increase CSR in order to attract new knowledgeworkers, in addition to retaining existing workers and preventing knowledge spillovers. Both areclosely related—arguably, if CSR is effective at retaining workers and preventing knowledge spill-overs, it may also be effective in attracting knowledge workers. In the next section, we conduct twoexperiments that provide direct evidence of the effectiveness of CSR to prevent knowledge spill-overs. Hence, our results are unlikely to merely capture the “attracting new workers” role of CSR.
21Note that the sample drops to 5,112 firm-year observations due to the less comprehensive coverage of ASSET4, which startsin 2002 and covers fewer U.S. firms than the KLD data.22ASSET4 ratings range from 0 to 100. The average social score is 50.8. Hence, the point estimate of 4.0 (p-value = 0.043)corresponds to an increase in the social score by 8.7%. Similarly, the average environment score is 46.1. Accordingly, the pointestimate of 3.1 (p-value = 0.055) corresponds to an increase in the environment score by 6.7%.23The coefficient of IDD is significant for all four employee categories (workforce: diversity and opportunities; workforce:employment quality; workforce: health and safety; workforce: training and development) with p-values ranging from 0.006 to0.087; it is significant for society: community (p-value = 0.096) and marginally insignificant for society: human rights(p-value = 0.115); it is insignificant for customer: product responsibility (p-value = 0.300); it is significant for environment:emission reduction and environment: resource reduction (with p-values of 0.059 and 0.052, respectively), and insignificant forenvironment: product innovation (p-value = 0.211).24This need not imply that the rejection of the IDD does not affect innovation. In fact, Contigiani, Hsu, and Barankay (2018)show that the (citation-weighted) patent count decreases following the rejection of the IDD. Taken together, these results sug-gest that, while companies maintain their R&D budgets, they are less effective in converting their R&D into successful patents.
FLAMMER AND KACPERCZYK 15

Robustness and extensions. Supplemental analyses are provided in the Online Appendix S1. InAppendix D (and Table A7), we present a series of robustness checks.25 In Appendix E (andTables A8 and A9), we explore the heterogeneity in the treatment effect.26
5 | EXPERIMENTAL EVIDENCE
The results presented so far show that companies respond to the threat of knowledge spillovers byincreasing their CSR engagement. As discussed above, our proposed rationale is that CSR helps miti-gate knowledge spillovers by (i) reducing employees' propensity to join a rival firm, and (ii) reducingemployees' propensity to disclose the firm's valuable knowledge even if they join a rival firm. In thissection, we describe two experiments (a laboratory experiment and an online experiment) that shedlight on the latter.
5.1 | Experiment design
We conducted two experimental vignette studies.27 The first one was conducted in the BehavioralLab of Boston University's Questrom School of Business. A total of 585 students participated in thislab experiment. The second one was conducted using the online labor-sourcing platform AmazonMechanical Turk. A total of 459 online workers currently employed in the U.S. and holding at least abachelor degree participated in this online experiment.
The same script was used in both experiments. At the beginning, participants received a mes-sage describing their current employer. To obtain variation in the employer's engagement in CSR,we used four different variations of the employer's description, which we randomly assigned to theparticipants. We used two control groups and two treatment groups. The first control groupreceived a generic company description with no reference to CSR (“baseline”). Both treatmentgroups received the same company description as in the baseline, but with supplemental informa-tion describing the company's CSR engagement. For the first treatment group, the CSR engagementwas in terms of employees, while for the second treatment group it was in terms of the environmentand communities. Finally, to account for the fact that, compared to the baseline, the treatmentgroups received more information, we used a second control group in which we supplemented thebaseline company description with additional generic company information (such that the lengthand format of the supplemental generic information was similar to that of the supplemental CSRinformation used in the treatment groups). This second control group allowed us to rule out the pos-sibility that our results may capture “more information” as opposed to “CSR information.” See
25In particular, we show that our results are robust (i) if we include a large set of time-varying state-level controls (capturingchanges in the state's pro-social values, changes in local economic conditions, and regulatory changes such as the adoption ofthe Uniform Trade Secret Act (UTSA)); (ii) if we use alternative control groups; (iii) if we restrict the sample to the eventuallytreated companies (to mitigate the possibility of unobserved differences between treated and control firms); (iv) if we restrictthe sample to geographically concentrated companies; (v) if we use alternative techniques to account for serial correlation; and(vi) if we use the “net” KLD-index that accounts for CSR concerns.26We find that the treatment effect is stronger when the risk of knowledge spillover is higher. Specifically, we observe a largertreatment effect for companies that (i) operate in states that have weaker enforcement of non-compete agreements (based onStarr's (2018) enforceability index), (ii) are located closer to innovation hubs, as well as companies operating in industries thatare (iii) more R&D intensive, (iv) more competitive, and (v) have more attractive investment opportunities.27A vignette study indicates a hypothetical situation to which research participants respond, thereby revealing their perceptions,values, social norms, or impressions of events. Experimental vignette studies are widely used in the social and behavioral sci-ences to assess attitudes, behaviors, and related constructs when experimental manipulation is unethical or impractical.
16 FLAMMER AND KACPERCZYK

Table A10 (Online Appendix S1) for the phrasing of the four messages, as well as the completescript of the experiment.
In addition to the employer's description, all participants were told that “for this employer youwere part of a small team that had developed an extensive client list (Client List A)—of current andprospective clients—that is used for direct marketing purposes globally […] this client list is veryvaluable to the company and is a well-kept trade secret.” The participants were further informed thattheir employer undertook considerable efforts to protect the client list (see Table A10 in OnlineAppendix S1 for details). Subjects were then told that they moved to a competitor in early 2018.Compared to the previous employer, the new employer was described as having a relatively short cli-ent list (Client List B). Participants were asked to launch a direct marketing campaign for the newemployer by reaching out to current and potential clients. Participants were presented with threechoices: they could email (1) Client List A, (2) Client List B, or (3) Client Lists A and B. Participantswho selected “Client List B” were choosing not to disclose their previous employer's trade secret,whereas participants who selected either of the other two options were choosing to disclose their pre-vious employer's valuable knowledge to the new employer. Finally, at the end of the experiment, weasked participants to answer an open-ended question (“Please explain your choice”) in order to elicitthe reason underlying their choice.
5.2 | Results
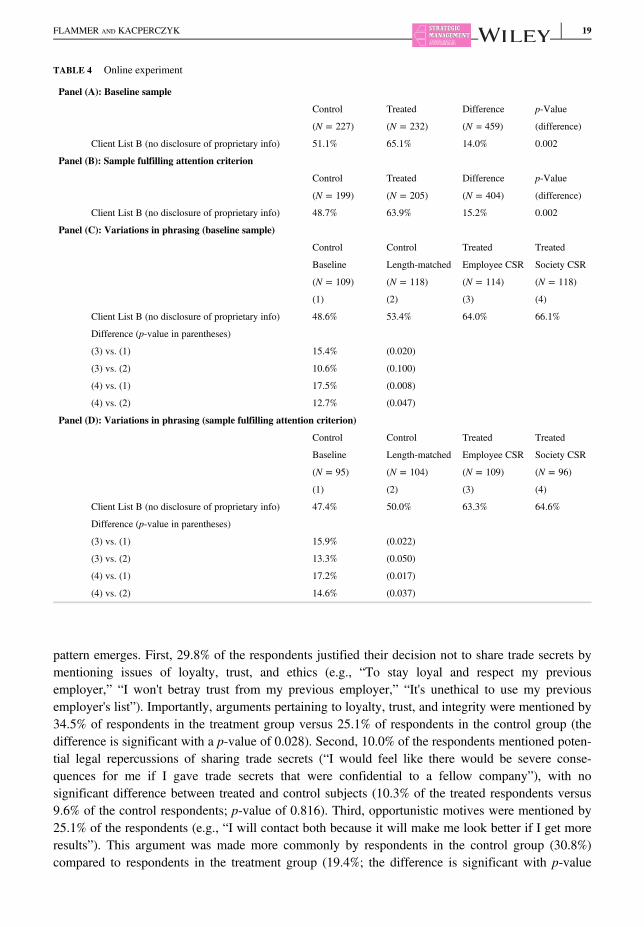
The results are presented in Table 3 (laboratory experiment) and Table 4 (online experiment). InPanel (A) of both tables, we compare the treated participants (pooling both treatment groups) ver-sus the control participants (pooling both control groups).28 In the lab experiment, we found that39.5% of the treated subjects clicked on “Client List B,” compared to 29.2% of the control sub-jects. The difference (10.3%) is significant at conventional statistical levels (p-value = 0.009).Similarly, in the online experiment, we found that 65.1% of the treated subjects clicked on “Cli-ent List B,” compared to 51.1% of the control subjects. The difference (14.0%) is again statisti-cally significant (p-value = 0.002). These findings are consistent with our argument that CSRreduces employees' propensity to disclose the firm's valuable knowledge upon joining acompetitor.
One potential concern is that subjects may not devote the necessary attention—for example,participants may quickly browse through the text and pick an arbitrary answer—which wouldattenuate our results. To mitigate this issue, in Panel (B) of Tables 3 and 4, we restrict the sam-ples to subjects who were more likely to pay attention. For the laboratory experiment, wefocused on subjects whose time spent on the survey was above the median across all respon-dents (“attention criterion”). For the online experiment, we focused on subjects who passed anattention check—specifically, subjects who correctly remembered the firm's CSR engagement(or lack thereof ), when asked at the end of the survey. We find that our results are indeed stron-ger in these subsamples.
In Panels (C) and (D) we repeat the analysis of Panels (A) and (B), respectively, decomposingthe treatment and control groups into the four subgroups described above. A caveat of this analysisis that we have fewer observations per subgroup, which reduces the power of our tests. Neverthe-less, we find that our results are generally robust regardless of which subgroups we consider—thepercentage of participants choosing “Client List B” is always higher for treated participants
28The randomization ensures that there is no systematic difference between treatment and control groups. To assess the ran-domization, we confirmed that participants' characteristics were balanced across groups.
FLAMMER AND KACPERCZYK 17
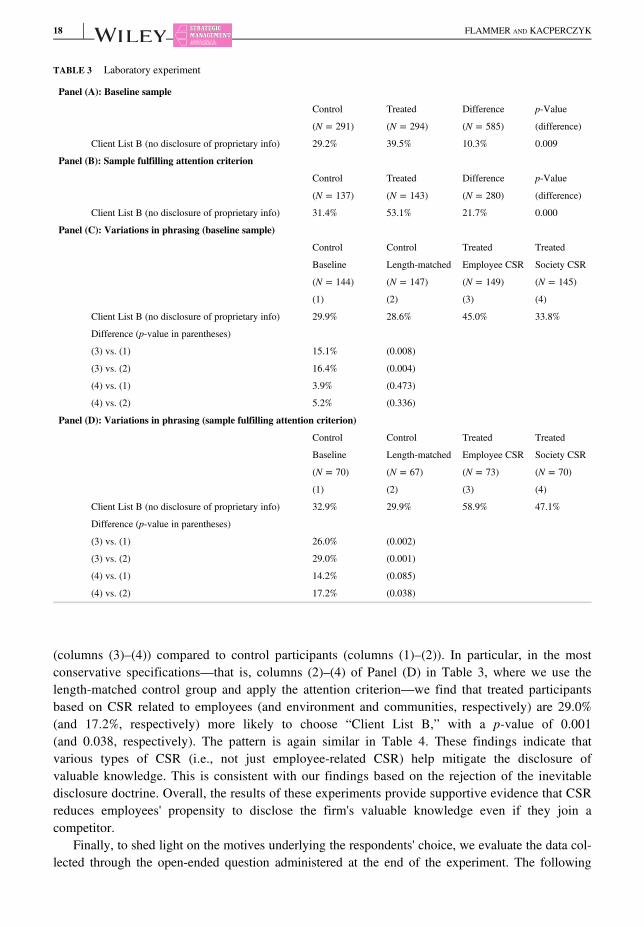
(columns (3)–(4)) compared to control participants (columns (1)–(2)). In particular, in the mostconservative specifications—that is, columns (2)–(4) of Panel (D) in Table 3, where we use thelength-matched control group and apply the attention criterion—we find that treated participantsbased on CSR related to employees (and environment and communities, respectively) are 29.0%(and 17.2%, respectively) more likely to choose “Client List B,” with a p-value of 0.001(and 0.038, respectively). The pattern is again similar in Table 4. These findings indicate thatvarious types of CSR (i.e., not just employee-related CSR) help mitigate the disclosure ofvaluable knowledge. This is consistent with our findings based on the rejection of the inevitabledisclosure doctrine. Overall, the results of these experiments provide supportive evidence that CSRreduces employees' propensity to disclose the firm's valuable knowledge even if they join acompetitor.
Finally, to shed light on the motives underlying the respondents' choice, we evaluate the data col-lected through the open-ended question administered at the end of the experiment. The following
TABLE 3 Laboratory experiment
Panel (A): Baseline sample
Control Treated Difference p-Value
(N = 291) (N = 294) (N = 585) (difference)
Client List B (no disclosure of proprietary info) 29.2% 39.5% 10.3% 0.009
Panel (B): Sample fulfilling attention criterion
Control Treated Difference p-Value
(N = 137) (N = 143) (N = 280) (difference)
Client List B (no disclosure of proprietary info) 31.4% 53.1% 21.7% 0.000
Panel (C): Variations in phrasing (baseline sample)
Control Control Treated Treated
Baseline Length-matched Employee CSR Society CSR
(N = 144) (N = 147) (N = 149) (N = 145)
(1) (2) (3) (4)
Client List B (no disclosure of proprietary info) 29.9% 28.6% 45.0% 33.8%
Difference (p-value in parentheses)
(3) vs. (1) 15.1% (0.008)
(3) vs. (2) 16.4% (0.004)
(4) vs. (1) 3.9% (0.473)
(4) vs. (2) 5.2% (0.336)
Panel (D): Variations in phrasing (sample fulfilling attention criterion)
Control Control Treated Treated
Baseline Length-matched Employee CSR Society CSR
(N = 70) (N = 67) (N = 73) (N = 70)
(1) (2) (3) (4)
Client List B (no disclosure of proprietary info) 32.9% 29.9% 58.9% 47.1%
Difference (p-value in parentheses)
(3) vs. (1) 26.0% (0.002)
(3) vs. (2) 29.0% (0.001)
(4) vs. (1) 14.2% (0.085)
(4) vs. (2) 17.2% (0.038)
18 FLAMMER AND KACPERCZYK
pattern emerges. First, 29.8% of the respondents justified their decision not to share trade secrets bymentioning issues of loyalty, trust, and ethics (e.g., “To stay loyal and respect my previousemployer,” “I won't betray trust from my previous employer,” “It's unethical to use my previousemployer's list”). Importantly, arguments pertaining to loyalty, trust, and integrity were mentioned by34.5% of respondents in the treatment group versus 25.1% of respondents in the control group (thedifference is significant with a p-value of 0.028). Second, 10.0% of the respondents mentioned poten-tial legal repercussions of sharing trade secrets (“I would feel like there would be severe conse-quences for me if I gave trade secrets that were confidential to a fellow company”), with nosignificant difference between treated and control subjects (10.3% of the treated respondents versus9.6% of the control respondents; p-value of 0.816). Third, opportunistic motives were mentioned by25.1% of the respondents (e.g., “I will contact both because it will make me look better if I get moreresults”). This argument was made more commonly by respondents in the control group (30.8%)compared to respondents in the treatment group (19.4%; the difference is significant with p-value
TABLE 4 Online experiment
Panel (A): Baseline sample
Control Treated Difference p-Value
(N = 227) (N = 232) (N = 459) (difference)
Client List B (no disclosure of proprietary info) 51.1% 65.1% 14.0% 0.002
Panel (B): Sample fulfilling attention criterion
Control Treated Difference p-Value
(N = 199) (N = 205) (N = 404) (difference)
Client List B (no disclosure of proprietary info) 48.7% 63.9% 15.2% 0.002
Panel (C): Variations in phrasing (baseline sample)
Control Control Treated Treated
Baseline Length-matched Employee CSR Society CSR
(N = 109) (N = 118) (N = 114) (N = 118)
(1) (2) (3) (4)
Client List B (no disclosure of proprietary info) 48.6% 53.4% 64.0% 66.1%
Difference (p-value in parentheses)
(3) vs. (1) 15.4% (0.020)
(3) vs. (2) 10.6% (0.100)
(4) vs. (1) 17.5% (0.008)
(4) vs. (2) 12.7% (0.047)
Panel (D): Variations in phrasing (sample fulfilling attention criterion)
Control Control Treated Treated
Baseline Length-matched Employee CSR Society CSR
(N = 95) (N = 104) (N = 109) (N = 96)
(1) (2) (3) (4)
Client List B (no disclosure of proprietary info) 47.4% 50.0% 63.3% 64.6%
Difference (p-value in parentheses)
(3) vs. (1) 15.9% (0.022)
(3) vs. (2) 13.3% (0.050)
(4) vs. (1) 17.2% (0.017)
(4) vs. (2) 14.6% (0.037)
FLAMMER AND KACPERCZYK 19

= 0.005). Finally, the remaining respondents (35.1%) provided miscellaneous information that couldnot be coded in an informative way.29,30
Overall, the answers to the open-ended question indicate that loyalty, trust, and ethics (along witha reluctance to engage in opportunistic behavior) played a key role in the treated respondents' unwill-ingness to share trade secrets with the future employer. These findings are consistent with our argu-ment that CSR reduces employees' propensity to disclose the firm's valuable knowledge upon joininga competitor.31
6 | DISCUSSION AND CONCLUSION
How do firms respond to the threat of knowledge spillovers? Answering this question is at the coreof strategic management and has important implications for innovation, entrepreneurship, and strate-gic human capital. While the limelight of scholarly attention has been on legal mechanisms and pecu-niary tools, a firm's strategic engagement in relationship-based practices as a defense againstknowledge spillovers has remained largely unexplored. Our study aims to make ground on thisquestion.
We propose that, when exposed to an increased threat of knowledge spillovers, firms strategicallyincrease their CSR as a defense. The rationale is two-fold: employees of firms with higher CSR areless inclined to join rival firms (i.e., they are less likely to “walk” out the door) and, even if they do,they are less likely to disclose the firm's valuable knowledge to their new employer (i.e., they are lesslikely to “talk”).
Our empirical strategy involves several steps, as we triangulate survey, observational, and experi-mental data. First, we conduct a large-scale survey of knowledge workers to substantiate our argu-ments that CSR practices are perceived to mitigate the threat of knowledge spillovers by reducingknowledge workers' propensity to (i) join rival firms, and (ii) disclose the firm's valuable knowledgeeven if they join a rival firm.
We then leverage observational data to examine whether companies respond to the threat ofknowledge spillovers by increasing their CSR. Specifically, we exploit a quasi-natural experimentprovided by the rejection of the inevitable disclosure doctrine by several U.S. states. Since the doc-trine prevents employees with valuable know-how from working for a competitor in the immediatefuture, its rejection leads to an increase in the risk of knowledge spillovers. Accordingly, by focusingon the rejection of the inevitable disclosure doctrine, we are able to test whether companies strategi-cally increase their CSR in response to the increased threat of knowledge spillovers. Consistent withour prediction, we find that companies react to the rejection of the inevitable disclosure doctrine bysignificantly increasing their engagement in CSR. This suggests that CSR is used as a defense tocounter the risk of knowledge spillovers.
Finally, we supplement our findings by conducting two experimental vignette studies: a labora-tory experiment and an online experiment. In these experiments, we randomly assigned subjects to
29Two coders assessed the responses obtained through open-ended questions. The inter-rater reliability was high (Cohen'skappa = 0.83).30The above statistics refer to the online experiment. A similar pattern emerges from the lab experiment, but with a higher frac-tion of miscellaneous responses.31We caution that our experiments are subject to important limitations. First—and this is a common caveat of experiments—business school students and online workers need not be representative of the universe of knowledge workers, which may limitthe external validity of the findings. Second, our evidence is based on a vignette study and therefore, relies on hypotheticalemployers (as opposed to the participants' actual employers).
20 FLAMMER AND KACPERCZYK
hypothetical employers that either engaged or did not engage in CSR. Subjects then joined a rivalfirm and faced the decision of whether to disclose their previous employer's proprietary knowledge.We find that employees whose previous employer engaged in CSR were less likely to disclose theirprevious employer's valuable knowledge. This provides direct evidence that CSR reducesemployees' propensity to disclose the firm's valuable knowledge even if they choose to join arival firm.
To the best of our knowledge, our study is the first to examine whether companies respond to theincreased threat of knowledge spillovers by increasing their CSR. As such, this study contributes tothe academic literature in several ways. First, it relates to the large body of work in management, eco-nomics, and psychology that examines how companies address the threat of losing valuable know-how. In particular, a vibrant literature studies the impact of legal mechanisms—such as noncompetecovenants, patent enforcement, and the inevitable disclosure doctrine—on employee mobility, knowl-edge spillovers, and imitation by rival firms (e.g., Agarwal et al., 2009; Ganco et al., 2015; Kim &Marschke, 2005; Marx, 2011; Marx et al., 2009; Png & Samila, 2015). Absent such legal tools, how-ever, companies need to find alternative ways to alleviate the threat of knowledge spillovers. Ourstudy expands the existing literature and indicates that firms use CSR as a strategic management toolto mitigate the risk of knowledge spillovers.
Second, by identifying a management practice—specifically, firms' social responsible practices—that does not rely on pecuniary incentives to manage knowledge workers, we contribute to the literatureon employee governance (e.g., Gubler, Larkin, & Pierce, 2016; Larkin & Pierce, 2015; Wang, He, &Mahoney, 2009). In contrast to relationship-based practices, pecuniary incentives have been widelystudied in the literature, with many scholars (e.g., Akerlof & Kranton, 2005; Gibbons, 1998; Larkin &Pierce, 2015; Prendergast, 1999) pointing at the drawbacks of pecuniary incentives and the need to gobeyond them.
Third, our paper is related to the few but notable studies that examine how specific CSR practicesaffect employee behavior. In particular, Burbano (2016) shows that online workers are willing to set-tle for lower wages if their employer has a long tradition of charitable giving. Similarly, Bode et al.(2015) and Bode and Singh (2018) show that management consultants at a global consulting com-pany are less likely to leave the company, and more willing to accept a pay cut, respectively, if theyare given the opportunity to engage in pro bono work. Relatedly, Flammer (2015a) and Flammer andLuo (2017) show that CSR has a positive influence on employees' productivity. Our paper contrib-utes to this literature by examining the relationship between firms' CSR practices and their efforts toprevent knowledge appropriation by rivals—it shows that firms react to an increased risk of knowl-edge spillovers by strategically increasing their CSR as a defense. Our results further suggest thatCSR helps mitigate knowledge spillovers in two ways: (i) by reducing knowledge workers' propen-sity to join a rival firm, and (ii) by reducing knowledge workers' propensity to disclose the firm'svaluable knowledge even if they choose to join a rival firm.
Fourth, and more broadly, we contribute to the literature on the internal and external drivers ofCSR activities, such as regulatory institutions (e.g., Fabrizio, 2012; Flammer, 2015b; Kacperczyk,2009), the community (e.g., Tilcsik & Marquis, 2013), activists (e.g., Baron & Diermeier, 2007;McDonnell & King, 2013), and shareholders (e.g., Flammer, 2015a). Our study contributes to thisline of work by highlighting a novel antecedent of CSR: the risk of losing proprietary knowledge.
Finally, our findings have important managerial implications as failing to retain employees withvaluable knowledge can lead to interfirm knowledge spillovers (Agarwal et al., 2009; Almeida &Kogut, 1999; Rosenkopf & Almeida, 2003), declines in explorative and path-breaking R&D projects(Conti, 2014), and may ultimately undermine the competitive advantage of the focal firm (Campbell,Coff, & Kryscynski, 2012). As such, our findings indicate that managers of companies exposed to
FLAMMER AND KACPERCZYK 21

the threat of knowledge spillovers may find it worthwhile to devote enough resources to the designof CSR policies.
ACKNOWLEDGEMENTS
We thank lawyers Randall Kahnke, Kerry Bundy, and Ken Liebman from the trade secret practice ofFaegre Baker Daniels LLP for sharing their insights on the inevitable disclosure doctrine. We alsothank Andrea Fosfuri (the editor), two anonymous reviewers, Alfonso Gambardella, Olga Hawn, JiaoLuo, Daniel Matisoff, Mary-Hunter McDonnell, George Serafeim, Jasjit Singh, Deepak Somaya,Ithai Stern, as well as seminar participants at Bocconi University, Boston University, Columbia GSB,Washington University in St. Louis (Olin), Wharton, the 2016 Academy of Management AnnualMeeting, 2016 Alliance for Research on Corporate Sustainability Conference, 2016 LBS Organiza-tions with Purpose Conference, 2016 Strategic Management Society Annual Conference, and the2015 Wharton People and Organizations Conference for helpful comments. We are gratefulto �yvind Norli for sharing his data on the location of publicly traded companies. Both authorscontributed equally.
REFERENCES
Agarwal, R., Gambardella, A., & Olson, D. M. (2014). Employee mobility and entrepreneurship. Strategic Management Journal Vir-tual Special Issue, 37(13), E11–E21.
Agarwal, R., Ganco, M., & Ziedonis, R. H. (2009). Reputations for toughness in patent enforcement: Implications for knowledge spill-overs via inventor mobility. Strategic Management Journal, 30(13), 1349–1374.
Aguilera, R. V., Rupp, D. E., Williams, C. A., & Ganapathi, J. (2007). Putting the S back in corporate social responsibility: A multi-level theory of social change in organizations. Academy of Management Review, 32(3), 836–863.
Akerlof, G. A., & Kranton, R. E. (2005). Identity and the economics of organizations. Journal of Economic Perspectives, 19(1), 9–32.Albinger, H. S., & Freeman, S. J. (2000). Corporate social performance and attractiveness as an employer to different job seeking
populations. Journal of Business Ethics, 28(3), 243–253.Almeida, P., & Kogut, B. (1999). Localization of knowledge and the mobility of engineers in regional networks. Management Science,
45(7), 905–917.Barnett, M. L., & Salomon, R. M. (2006). Beyond dichotomy: The curvilinear relationship between social responsibility and financial
performance. Strategic Management Journal, 27(11), 1101–1122.Barney, J. (1991). Firm resources and sustained competitive advantage. Journal of Management, 17(1), 99–120.Baron, D. P., & Diermeier, D. (2007). Strategic activism and nonmarket strategy. Journal of Economics and Management Strategy, 16
(3), 599–634.Bertrand, M., & Mullainathan, S. (2003). Enjoying the quiet life? Corporate governance and managerial preferences. Journal of Politi-
cal Economy, 111(5), 1043–1075.Bode, C., & Singh, J. (2018). Taking a hit to save the world: Employee participation in a corporate social initiative. Strategic Manage-
ment Journal, 39(4), 1003–1030.Bode, C., Singh, J., & Rogan, M. (2015). Corporate social initiatives and employee retention. Organization Science, 26(6),
1702–1720.Burbano, V. C. (2016). Social responsibility messages and worker wage requirements: Field experimental evidence from online labor
marketplaces. Organization Science, 27(4), 1010–1028.Businessweek. (2000, 16 July). The dark side of the Valley. Businessweek.Campbell, B. A., Coff, R., & Kryscynski, D. (2012). Rethinking sustained competitive advantage from human capital. Academy of
Management Review, 37(3), 376–395.Campbell, B. A., Ganco, M., Franco, A. M., & Agarwal, R. (2012). Who leaves, where to, and why worry? Employee mobility, entre-
preneurship and effects on source firm performance. Strategic Management Journal, 33(1), 65–87.Carnahan, S., Agarwal, R., & Campbell, B. A. (2012). Heterogeneity in turnover: The effect of relative compensation dispersion of
firms on the mobility and entrepreneurship of extreme performers. Strategic Management Journal, 33(12), 1411–1430.Carnahan, S., Kryscynski, D., & Olson, D. (2017). When does corporate social responsibility reduce employee turnover? Evidence
from attorneys before and after 9/11. Academy of Management Journal, 60(5), 1932–1962.Castellaneta, F., Conti, R., & Kacperczyk, A. (2016). Money secrets: How do trade secrets affect firm value? Evidence from a quasi-
natural experiment. Strategic Management Journal, 38(4), 834–853.
22 FLAMMER AND KACPERCZYK
Chatterji, A. K., Durand, R., Levine, D. I., & Touboul, S. (2016). Do ratings of firms converge? Implications for managers, investorsand strategy researchers. Strategic Management Journal, 37(8), 1597–1614.
Chatterji, A. K., Levine, D. I., & Toffel, M. W. (2009). How well do social ratings actually measure corporate social responsibility?Journal of Economics and Management Strategy, 18(1), 125–169.
Coff, R. W. (1997). Human assets and management dilemmas: Coping with hazards on the road to resource-based theory. Academy ofManagement Review, 22(2), 374–402.
Colquitt, J. A., Conlon, D. E., Wesson, M. J., Porter, C. O. L. H., & Ng, K. Y. (2001). Justice at the millennium: A meta-analyticreview of 25 years of organizational justice research. Journal of Applied Psychology, 86(3), 425–445.
Conti, R. (2014). Do non-competition agreements lead firms to pursue risky R&D projects? Strategic Management Journal, 35(8),1230–1248.
Contigiani, A., Hsu, D. H., & Barankay, I. (2018). Trade secrets and innovation: Evidence from the “inevitable disclosure” doctrine.Strategic Management Journal, 39(11), 2921–2942.
De Roeck, K., & Delobbe, N. (2012). Do environmental CSR initiatives serve organizations' legitimacy in the oil industry? Exploringemployees' reactions through organizational identification theory. Journal of Business Ethics, 110(4), 397–412.
Delmas, M. A., & Blass, V. D. (2010). Measuring corporate environmental performance: The trade-offs of sustainability ratings. Busi-ness Strategy and the Environment, 19(4), 245–260.
Dierickx, I., & Cool, K. (1989). Asset stock accumulation and sustainability of competitive advantage. Management Science, 35(12),1504–1510.
Dimarco, N. (1975). Life style, work group structure, compatibility, and job satisfaction. Academy of Management Journal, 18(2),313–322.
Eisenhardt, K. M., & Martin, J. A. (2000). Dynamic capabilities: What are they? Strategic Management Journal, 21(10/11),1105–1121.
Fabrizio, K. R. (2012). The effect of regulatory uncertainty on investment: Evidence from renewable energy generation. Journal ofLaw, Economics, and Organization, 29(4), 765–798.
Flammer, C. (2015a). Does corporate social responsibility lead to superior financial performance? A regression discontinuity approach.Management Science, 61(11), 2549–2568.
Flammer, C. (2015b). Does product market competition foster corporate social responsibility? Evidence from trade liberalization. Stra-tegic Management Journal, 36(10), 1469–1485.
Flammer, C., & Bansal, P. (2017). Does long-term orientation create value? Evidence from a regression discontinuity. Strategic Man-agement Journal, 38(9), 1827–1847.
Flammer, C., & Ioannou, I. (2018). To save or to invest? Strategic management during the financial crisis (Working paper). Boston,MA: Boston University.
Flammer, C., & Kacperczyk, A. (2016). The impact of stakeholder orientation on innovation: Evidence from a natural experiment.Management Science, 62(7), 1982–2001.
Flammer, C., & Luo, J. (2017). Corporate social responsibility as an employee governance tool: Evidence from a quasi-experiment.Strategic Management Journal, 38(2), 163–183.
Forbes. (2013, 2 October). The companies with the best CSR reputations. Forbes.Freeman, R. E. (1984). Strategic management: A stakeholder approach (pitman series in business and public policy). Marshfield, MA:
Pitman.Gambardella, A., Khashabi, P., & Panico, C. (2015). Micro-organization of innovative projects; delegation and the direction of innova-
tive output (Working paper). Bocconi University.Gambardella, A., Panico, C., & Valentini, G. (2015). Strategic incentives to human capital. Strategic Management Journal, 36(1),
37–52.Ganco, M., Ziedonis, R. H., & Agarwal, R. (2015). More stars stay, but the brightest ones still leave: Job hopping in the shadow of
patent enforcement. Strategic Management Journal, 36(5), 659–685.Garcia, D., & Norli, O. (2012). Geographic dispersion and stock returns. Journal of Financial Economics, 106(3), 547–565.Gibbons, R. (1998). Incentives in organizations. Journal of Economic Perspectives, 12(4), 115–132.Gilson, R. J. (1999). The legal infrastructure of high technology industrial districts: Silicon Valley, route 128, and covenants not to
compete. New York University Law Review, 74(3), 575–629.Grant, R. M. (1996). Toward a knowledge-based theory of the firm. Strategic Management Journal, 17(Winter Special Issue),
109–122.Graves, S. B., & Waddock, S. A. (2000). Beyond built to last... stakeholder relations in “built-to-last” companies. Business and Society
Review, 105(4), 393–418.Greening, D. W., & Turban, D. B. (2000). Corporate social performance as a competitive advantage in attracting a quality workforce.
Business and Society, 39(3), 254–280.Gubler, T., Larkin, I., & Pierce, L. (2016). Motivational spillovers from awards: Crowding out in a multitasking environment. Organi-
zation Science, 27(2), 286–303.Hall, R. (1993). A framework linking intangible resources and capabilities to sustainable competitive advantage. Strategic Management
Journal, 14(8), 607–618.
FLAMMER AND KACPERCZYK 23
Helfat, C. E., Finkelstein, S., Mitchell, W., Peteraf, M. A., Singh, H., Teece, D. J., & Winter, S. G. (2007). Dynamic capabilities:Understanding strategic change in organizations. Malden, MA: Blackwell.
Jackson, S. E., Brett, J. F., Sessa, V. I., Cooper, D. M., Julin, J. A., & Peyronnin, K. (1991). Some differences make a difference: Indi-vidual dissimilarity and group heterogeneity as correlates of recruitment, promotions, and turnover. Journal of Applied Psychology,76(5), 675–689.
Kacperczyk, A. (2009). With greater power comes greater responsibility: Takeover protections and corporate attention to stakeholders.Strategic Management Journal, 30(3), 261–285.
Kacperczyk, A. (2012). Opportunity structures in established firms: Entrepreneurship versus intrapreneurship in mutual funds. Admin-istrative Science Quarterly, 57(3), 484–521.
Kacperczyk, A. (2013). Social influence and entrepreneurship: The effect of university peers on entrepreneurial entry. OrganizationScience, 24(3), 664–683.
Kacperczyk, A., & Bachalandran, C. (2018). Vertical and horizontal wage dispersion and mobility outcomes: Evidence from the Swed-ish microdata. Organization Science, 29(1), 17–38.
Kahnke, R. E., & Bundy, K. L. (2013). The secrets to winning trade secret cases. New York, NY: Thomson Reuters Westlaw.Kahnke, R. E., Bundy, K. L., & Liebman, K. A. (2008). Doctrine of inevitable disclosure. Minneapolis, MN: Faegre and Benson LLP.Kim, H. R., Lee, M., Lee, H. T., & Kim, N. M. (2010). Corporate social responsibility and employee-company identification. Journal
of Business Ethics, 95(4), 557–569.Kim, J., & Marschke, G. (2005). Labor mobility of scientists, technological diffusion, and the firm's patenting decision. RAND Journal
of Economics, 36(2), 298–317.KLD. (2010). How to use KLD stats & ESG ratings definitions. Boston, MA: RiskMetrics Group.Kogut, B., & Zander, U. (1992). Knowledge of the firm, combinative capabilities, and the replication of technology. Organization Sci-
ence, 3(3), 383–397.Larkin, I., & Pierce, L. (2015). Compensation and employee misconduct: The inseparability of productive and counterproductive
behavior in firms. In D. Palmer, R. Greenwood, & K. Smith-Crowe (Eds.), Organizational wrongdoing (pp. 1–27). Cambridge,MA: Cambridge University Press.
Mahoney, J. T., & Pandian, J. R. (1992). The resource-based view within the conversation of strategic management. Strategic Manage-ment Journal, 13(5), 363–380.
Marx, M. (2011). The firm strikes back: Non-compete agreements and the mobility of technical professionals. American SociologicalReview, 76(5), 695–712.
Marx, M., Strumsky, D., & Fleming, L. (2009). Mobility, skills, and the Michigan non-compete experiment. Management Science, 55(6), 875–889.
McDonnell, M. H., & King, B. (2013). Keeping up appearances: Reputational threat and impression management after social move-ment boycotts. Administrative Science Quarterly, 58(3), 387–419.
McKinsey. (2009). Valuing social responsibility programs. McKinsey on Finance, 32, 11–18.O'Reilly, C. A., Caldwell, D. F., & Barnett, W. P. (1989). Work group demography, social integration, and turnover. Administrative
Science Quarterly, 34(1), 21–37.O'Reilly, C. A., & Chatman, J. (1986). Organizational commitment and psychological attachment: The effects of compliance, identifi-
cation, and internalization on prosocial behavior. Journal of Applied Psychology, 71(3), 492–499.Png, I. P. L., & Samila, S. (2015). Trade secrets law and mobility: Evidence from “inevitable disclosure” (Working paper). Singapore:
National University of Singapore.Prendergast, C. (1999). The provision of incentives in firms. Journal of Economic Literature, 37(1), 7–63.Rao, H., & Drazin, R. (2002). Overcoming resource constraints on product innovation by recruiting talent from rivals: A study of the
mutual fund industry, 1986-94. Academy of Management Review, 45(3), 491–507.Reputation Institute. (2015). The global RepTrak 100: The World's Most reputable companies. New York, NY: Reputation Institute.Rosenkopf, L., & Almeida, P. (2003). Overcoming local search through alliances and mobility. Management Science, 49(6), 751–766.Rupp, D. E., Ganapathi, J., Aguilera, R. V., & Williams, C. A. (2006). Employee reactions to corporate social responsibility: An orga-
nizational justice framework. Journal of Organizational Behavior, 27(4), 537–543.Song, J., Almeida, P., & Wu, G. (2003). Learning-by-hiring: When is mobility more likely to facilitate interfirm knowledge transfer?
Management Science, 49(4), 351–365.Starr, E. P. (2018). Consider this: Training, wages, and the enforceability of covenants not to compete. Industrial and Labor Relations
Review forthcoming.Starr, E. P., Balasubramanian, N., & Sakakibara, M. (2018). Screening spinouts? How noncompete enforceability affects the creation,
growth, and survival of new firms. Management Science, 64(2), 552–572.Starr, E. P., Ganco, M., & Campbell, B. A. (2018). Strategic human capital management in the context of cross-industry and within-
industry mobility frictions. Strategic Management Journal, 39(8), 2226–2254.Stern, I., & James, S. D. (2016). Whom are you promoting? Positive voluntary public disclosures and executive turnover. Strategic
Management Journal, 37(7), 1413–1430.Stern, S. (2004). Do scientists pay to be scientists? Management Science, 50(6), 835–853.Teece, D. J., Pisano, G., & Shuen, A. (1997). Dynamic capabilities and strategic management. Strategic Management Journal, 18(7),
509–533.
24 FLAMMER AND KACPERCZYK
Tilcsik, A., & Marquis, C. (2013). Punctuated generosity: How mega-events and natural disasters affect corporate philanthropy inU.S. communities. Administrative Science Quarterly, 58(1), 111–148.
Turban, D. B., & Greening, D. W. (1996). Corporate social performance and organizational attractiveness to prospective employees.Academy of Management Journal, 40(3), 658–672.
U.S. Census Bureau. (1994). Geographic areas reference manual. Washington, DC: U.S. Department of Commerce.Wang, H. C., He, J., & Mahoney, J. T. (2009). Firm-specific knowledge resources and competitive advantage: The roles of economic-
and relationship-based employee governance mechanisms. Strategic Management Journal, 30(12), 1265–1285.Wezel, F. C., Cattani, G., & Pennings, J. M. (2006). Competitive implications of interfirm mobility. Organization Science, 17(6),
691–709.World Economic Forum. (2003). Responding to the leadership challenge: Findings of a CEO survey on global corporate citizenship.
Cologny, Switzerland: World Economic Forum.
SUPPORTING INFORMATION
Additional supporting information may be found online in the Supporting Information section at theend of this article.
How to cite this article: Flammer C, Kacperczyk A. Corporate social responsibility as adefense against knowledge spillovers: Evidence from the inevitable disclosure doctrine. StratMgmt J. 2019;1–25. https://doi.org/10.1002/smj.3025
FLAMMER AND KACPERCZYK 25
1
ONLINE APPENDIX FOR
CORPORATE SOCIAL RESPONSIBILITY AS A DEFENSE AGAINST KNOWLEDGE
SPILLOVERS: EVIDENCE FROM THE INEVITABLE DISCLOSURE DOCTRINE
CAROLINE FLAMMER Questrom School of Business
Boston University [email protected]
ALEKSANDRA KACPERCZYK Strategy and Entrepreneurship Area
London Business School [email protected]
2
Appendix A. Survey of knowledge workers
Survey design
We surveyed alumni from Boston University (BU) and the Massachusetts Institute of Technology
(MIT).1 We distributed the survey electronically to the alumni and received 1,257 responses (759
from the BU survey and 498 from the MIT survey, corresponding to a response rate of about 7%
at each institution). Although our sample is unlikely to be perfectly representative, we have no
reason to expect the sample to be biased toward respondents that are favorably inclined toward
CSR initiatives. Respondent characteristics are provided in Table A1. In particular, we note that a
large fraction of respondents work in industries that are knowledge-intensive—e.g., information
technology (19%), finance (18%), pharmaceuticals (11%), consulting (10%), consumer products
(7%), aerospace (6%), energy (4%), and several others.
An important concern in survey design is the possibility of social desirability bias, or the
tendency of participants to present themselves in a socially acceptable way (Maccoby and
Maccoby, 1954; Nederhof, 1985). In our case, social desirability bias may motivate the
respondents to express favorable opinions about CSR initiatives. We mitigated this concern in two
ways. First, we administered the survey in an anonymous manner and informed the respondents
that their identity would remain undisclosed. Second, we implemented the technique of “indirect
questioning,” which has been shown to reduce social desirability bias (e.g., Fisher, 1993). Rather
than asking participants about their own behavior, we asked them about the general use of CSR as
a means of reducing knowledge spillovers. Moreover, we presented the respondents with a
1 The sampling frame of the BU survey includes all alumni from the Questrom School of Business (and the former School of Management) who graduated by 2016 and are based in the U.S.; the sampling frame of the MIT survey includes all alumni from the Sloan School of Management who graduated between 1980-2015 and are based in the U.S. The responses were very similar across both schools.

3
hypothetical scenario and asked them to make decisions regarding CSR. Specifically, participants
were told that a legislative change was about to increase the threat of knowledge spillovers. Faced
with this increased threat, respondents had to assess the effectiveness of CSR initiatives in helping
reduce knowledge spillovers.
For all survey questions, we asked the respondents to agree or disagree with the proposed
statements, using a standard 6-point Likert scale ranging from Strongly Disagree (= 1) to
Strongly Agree (= 6).
Survey questions
The goal of this survey is to better understand how to prevent employees with access to a firm’s valuable and unique knowledge from leaving to other firms and disclosing this knowledge to competitors. The insights of this research have important implications for human resource management and innovation. The survey will take about 5 minutes. Your participation is highly valued. All responses are anonymous and will be kept strictly confidential. The information provided will be used only for the purposes of this research.
Please answer the questions based on what is/was typical for you as a manager/employee.
1. Have you ever worked as an employee with access to a firm’s trade secrets? By trade secrets, we mean knowledge and information that is valuable to the firm and is not shared with competitors. For example, a firm’s trade secrets include (but are not limited to) research and development processes, chemical formulas, manufacturing techniques, product design, technical data, customer lists, business leads, marketing strategies, pricing schedules, and sales techniques. (yes/no)
2. Please state whether you agree or disagree with the following statements (use 6-point Likert scale to measure agree/disagree):
“In general, it is important for a firm to put in place practices that aim to retain workers with access to a firm’s trade secrets (i.e., knowledge workers).”
“In general, socially-responsible practices can enhance knowledge workers’ appreciation of their current employment.”
“In general, socially-responsible practices can improve firm’s ability to retain their knowledge workers.”
4
3. Please state whether you agree or disagree with the following statements (use 6-point Likert scale to measure agree/disagree):
“In general, improving a firm’s socially-responsible practices might help retain knowledge workers because:
a. … it helps better differentiate the company from other employers.”
b. … it helps improve the overall reputation of the company as a workplace.”
c. … it allows employees to have a positive (direct or indirect) impact on society and the natural environment and hence helps improve how knowledge workers feel about the job they are doing.”
d. … it helps strengthen knowledge workers’ loyalty to the company (e.g., by fostering interpersonal relationships among employees, appealing to their general justice perception, and by enhancing employees’ identification with the firm).”
4. Please state whether you agree or disagree with the following statement (use 6-point Likert scale to measure agree/disagree):
“In general, improving a firm’s socially-responsible practices might strengthen knowledge workers’ loyalty and prevent them from disclosing a firm’s unique and valuable knowledge such as trade secrets even if they choose to leave the company to work for a rival firm.”
5. Please consider the hypothetical scenario below:
Suppose that you are a manager of a firm that heavily relies on knowledge workers. A legislative change is about to make it easier for employees to switch employers. As a result, you worry that your employees might join a rival firm and disclose your valuable knowledge to competitors.
Please state whether you agree or disagree with the following statements (use 6-point Likert scale to measure agree/disagree):
“In an attempt to mitigate this threat, you will likely:
a. … increase non-salary work/life benefits (e.g., flex time, maternity policy, child care, health benefits, retirement benefits, etc.).”
b. … offer more authority, employee involvement in decision-making, learning and advancement opportunities, and/or other forms of career development to knowledge workers.”
c. … improve the firm’s policies to support minorities, LGBT (lesbian, gay, bisexual, and transgender), women, and other underrepresented groups among employees.”
d. … improve the firm’s work environment in terms of health, safety, recreational facilities, sports and wellness offerings, etc.”

5
e. … provide knowledge workers with the opportunity to devote some of their worktime to environmental initiatives, and/or other ways to have a positive impact on society and the natural environment.”
f. … increase the firm’s engagement in local communities (e.g., through charitable donations).”
g. … increase the firm’s efforts to be eco-friendly (e.g., green the workspace with plants, improve the firm’s environmental footprint, increase efforts in green tech development, or increase efforts in other sustainable practices).”
h. … improve firm relations with customers (e.g., improve product quality, develop innovative products, offer products and services that benefit economically disadvantaged customers, improve customer service, etc.).”
6. Please provide the following information:
a. What is your age?
25 or under 26-35 36-45 46-55 56-65 Over 65
b. What industry do you work in? _______________________
c. What is your current job function? (e.g., manager, consultant) _______________________
Appendix B. The inevitable disclosure doctrine—institutional background
The inevitable disclosure doctrine prevents employees with valuable know-how from working for
a competitor in the immediate future as they would “inevitably disclose” their current employer’s
trade secrets. A “trade secret” is information or knowledge—which may include a formula, pattern,
compilation, program, device, method, technique, or process—that is i) not generally known; ii)
cannot be easily figured out by those who want to know it; iii) derives actual or potential economic
value (because it is not broadly known); and iv) requires reasonable efforts to keep it from
becoming broadly known (see, e.g., Kahnke and Bundy, 2013).2 Trade secrets can range from
2 See Uniform Trade Secrets Act §1(4), 14 U.L.A. 619 (1985) for the legal definition of a trade secret.

6
high-tech information (such as chemical formulas, manufacturing techniques, product design, and
technical data) to relatively low-tech information (such as client lists, business leads, marketing
strategies, pricing schedules, and sales techniques) and account for a substantive part of firms’
intangible assets (Thomas, 2014). On average, trade secrets are estimated to make up two-thirds
of the value of firms’ intangible assets, and up to 80% for companies in knowledge-intensive
sectors. In absolute terms, this translates into an estimated $5 trillion worth of trade secrets for
publicly traded U.S. companies (U.S. Chamber of Commerce, 2014). Precisely because of their
value, trade secrets are prone to misappropriation, which most often involves insiders—typically
employees or contractors—who are given access to sensitive information (The Economist, 2013).
The rise of computer technology, ubiquity of cell phones, and the Internet have made
misappropriating trade secrets easier and, conversely, increased the managerial difficulty of
keeping trade secrets safe (Thomas, 2014). Indeed, researchers have found that the value of trade
secrets is particularly high in industries where the rate of inter-firm mobility is high (Castellaneta,
Conti, and Kacperczyk, 2017).
A number of legal tools aim to mitigate the risk of trade secret disclosure and imitation by
rival firms: U.S. patent law, the Uniform Trade Secret Act, non-compete covenants, and the
doctrine of inevitable disclosure.3 The latter, much like a non-compete covenant, severely restricts
the mobility of employees in order to protect companies from unintended knowledge spillovers
and economic losses. Yet, unlike non-compete covenants and other legal tools, the inevitable
disclosure doctrine does not require i) a specific contract signed by employees, nor ii) an actual
misappropriation of confidential information. The mere possibility of trade secret disclosure is
3 By its very nature, information disclosed in a published patent is not a secret anymore. Yet, patent law grants the patent holder the exclusive right to exclude others from making, using, importing, and selling the patented innovation for a limited period of time (see United States Code Title 35 U.S.C.A. § 154(a)).
7
sufficient for this doctrine to apply.
In inevitable disclosure cases, courts issue an injunction prohibiting the employee from
going to work for a competitor. The case in point is PepsiCo, Inc. v. Redmond, 54 F.3d 1262 (7th
Cir. 1995):
While in upper management at PepsiCo, Redmond signed a confidentiality agreement but not a non-compete agreement. After he left PepsiCo for a similar job at Quaker, PepsiCo sought to enjoin him from assuming his duties or divulging trade secrets, which concerned mainly strategic sales, marketing, logistics and financial information. Considering the similarity of positions, competitive landscape, timing of departure, and Redmond’s previous work conduct, the court ruled that Redmond’s new employment “would inevitably lead him to disclose trade secrets.” (See, e.g., Kahnke and Bundy (2013) for further details.)
As this case illustrates, the inevitable disclosure doctrine provides employers with a legal
tool to prevent employees from working for another company without proving that the individual
disclosed any trade secret or even threatened to do so. As such, this doctrine provides employers
with a mechanism to severely restrict knowledge workers’ mobility and hence knowledge
spillovers (e.g., Gilson, 1999; Kahnke and Bundy, 2013; Png and Samila, 2015).
Appendix C. Validity of the identification strategy
Our identification strategy needs to satisfy two requirements to be valid: the relevance condition
and the exclusion restriction. First, the treatment (i.e., the rejection of the IDD) needs to trigger
relevant changes in the threat of knowledge spillovers. Second, the treatment needs to be
exogenous with respect to CSR. In the following, we discuss both requirements.
Relevance condition
To satisfy the relevance condition, the rejection of the IDD needs to bring about relevant changes
in the risk of knowledge spillovers. Extant literature suggests that this is indeed the case (e.g.,
Gilson, 1999; Kahnke and Bundy, 2013; Png and Samila, 2015). In particular, Png and Samila

8
(2015) show that companies located in states that have rejected the inevitable disclosure doctrine
experience a 10% increase in mobility of knowledge workers. This effect is comparable to—in
fact, slightly stronger than—the effect of the rejection of non-compete agreements on knowledge
workers’ mobility. For example, Marx, Strumsky, and Fleming (2009) find an 8% increase in
inventors’ mobility following Michigan’s rejection of non-compete agreements. Overall, this
indicates that the rejection of the inevitable disclosure doctrine triggers a substantial increase in
knowledge workers’ mobility and the threat of knowledge spillovers.
Exclusion restriction
Our identification strategy assumes that the rejection of the inevitable disclosure doctrine is
exogenous with respect to firms’ CSR practices. In the following, we discuss potential
identification concerns and how our difference-in-differences specification helps address them.
Lobbying. A potential concern is that firms may lobby for the rejection of the inevitable
disclosure doctrine, and hence the treatment would reflect a firm’s choice. For instance, if firms
that are considerate of their stakeholders’ interests—that is, firms with high CSR—tend to
(successfully) pressure courts to reject the doctrine, then our results would be driven by reverse
causation. Nevertheless, this concern is mitigated for the following reasons. First, we search for
qualitative evidence that would be indicative of this possibility. In particular, we search the Lexis-
Nexis database for press releases mentioning that social responsible firms actively advocated the
rejection of the doctrine. Not surprisingly, we find no such evidence. Second, to further rule out
potential reverse causality concerns, we examine the dynamics of the treatment effect. If reverse
causation explains our results, then we would expect that the rejection of the inevitable disclosure
doctrine has a positive and significant “effect” already before the rejection occurs. However, we
find no evidence for such pre-existing trends. Changes in CSR appear only after (not before or

9
contemporaneous with) the rejection of the doctrine (see the results section).
Unobserved differences between treated and control firms. Another potential concern is
that treated and control firms may differ along unobservable characteristics, and that these
differences may correlate with both CSR decisions and states’ rejection of the inevitable disclosure
doctrine. Nevertheless, this concern is unlikely to explain our results, for several reasons. First, as
discussed above, we find no evidence of pre-existing trends. This suggests that treated and control
firms are on similar trends prior to the treatment. Second, the inclusion of region by year fixed
effects mitigates the potential concern that omitted local trends may confound our results. Third,
to further address this point, we re-estimate our baseline regression including a large set of (time-
varying) state-level controls that capture i) changes in the state’s pro-social values, ii) changes in
local economic conditions, and iii) other regulatory changes. We find that our results are robust
(see Appendix D). Fourth, given the staggered nature of the treatments, the eventually treated firms
are first in the control group, and only later in the treatment group (i.e., once they have been
treated). This feature allows us to re-estimate our difference-in-differences specification using only
the eventually treated firms—which means that the control group consists only of firms that are
eventually treated (for a similar test see, e.g., Bertrand and Mullainathan, 2003; Flammer and
Kacperczyk, 2016). When re-estimating our baseline specification using only the eventually
treated firms, we find that our results are again robust (see Appendix D).
Appendix D. Robustness
Table A7 presents various robustness checks that are variants of the specification used in column
(3) of Table 2 (henceforth “baseline specification”). In the following, we describe each of them.
State-level controls. In our baseline specification, the inclusion of firm fixed effects—
which, by construction, absorb state fixed effects—ensures that our results are not driven by fixed
10
differences across states. That being said, it could still be the case that time-varying differences
across states affect our results. This concern is mitigated by the inclusion of region × year fixed
effects, which account for unobservable trends at the regional level. Yet, Census regions are
broader than states and need not account for more granular trends at the state-year level. To
alleviate this issue, in column (1) of Table A7, we include a large set of (time-varying) state-level
controls that could potentially correlate with both the rejection of the IDD and CSR policies. First,
we include variables that capture changes in the state’s pro-social values—specifically, we control
for i) income inequality (the top 10% income share) at the state level and ii) a set of three indicator
variables for the state’s political lean (Democrat, Republican, split).4 Second, we include variables
that capture changes in the state’s economic conditions—i) changes in state-level GDP and ii)
changes in the state-level unemployment rate.5 Third, we include variables that capture other legal
changes that may coincide with the timing of the IDD and also affect CSR—specifically, we
account for changes in i) antitakeover legislation, ii) banking deregulation, and iii) the enforcement
of non-competes.6 As can be seen, our results change little when we include all these controls.
Accounting for the Uniform Trade Secret Act (UTSA). In column (2) of Table A7, we
account for the staggered introduction of the Uniform Trade Secret Act (UTSA) at the state level.
The UTSA strengthened the protection of trade secrets by dropping the requirement that the
information be business-related and in continuous use, and by defining misappropriation to include
mere acquisition of the secret (Png, 2017). To account for the adoption of UTSA, we extend the
4 The data on income inequality are obtained from the World Top Incomes Database. The data on states’ political lean are obtained from the National Conference of State Legislatures. 5 The data on state-level GDP growth are obtained from the U.S. Bureau of Economic Analysis. State-level unemployment rates are obtained from the U.S. Bureau of Labor Statistics. 6 The list of antitakeover laws (business combination laws) is obtained from Karpoff and Wittry (2018). The list of bank deregulation laws is obtained from Amore, Schneider, and Zaldokas (2013). For each set of legislations, we include a dummy variable equal to one if a law has been passed in the state. To control for the enforcement of non-competes, we include the Starr (2018) index described in Appendix E.

11
set of state-level controls by including an indicator variable equal to one if the state has adopted
the UTSA by the year in question.7 As is shown, our results are robust to this inclusion.
Alternative control groups. In our baseline specification, the control group includes all
states that have not rejected the IDD—i.e., it includes i) states that have not ruled on the IDD, and
i) states that have ruled in favor. In columns (3) and (4) of Table A7, we show that our results are
robust if the control group is restricted to states that have not ruled (column (3)) and states that
have ruled in favor (column (4)), respectively.8 As is shown, the treatment effect is positive and
significant in either specification. The point estimate is 0.153 (p-value = 0.019) in column (3), and
0.164 (p-value = 0.019) in column (4).
Eventually treated companies. As discussed in Appendix C, a potential concern is that
unobserved differences between treated and control firms may affect our results. To address this
issue, we take advantage of the staggering of the treatments and re-estimate our baseline
specification using only the subsample of eventually treated firms. As can be seen from column
(5) of Table A7, our estimate of the treatment effect remains similar, which implies that our
findings are not driven by unobserved differences between firms located in treated and control
states.
Geographically concentrated firms. The inevitable disclosure doctrine applies in the state
in which the employee works, whereas our analysis is based on the state in which the company’s
headquarters is located. As discussed in the methodology section, this raises two measurement
issues. First, Compustat only records the most recent state of headquarters’ location. Second, the
7 The list of UTSA by state and year is obtained from Table 1 of Png (2017, p. 180). We supplement Png’s list (which is up to year 2010) with New Jersey and Texas who adopted the UTSA in 2012 and 2013, respectively. 8 We identify states that adopt the IDD using the compilation of Kahnke, Bundy, and Liebman (2008). Note that their compilation ends in 2008, yet we find that no other state has adopted the IDD in the later part of our sample (2009-2013).

12
state of headquarters’ location is an imperfect measure of employees’ location for companies that
have operations outside of their headquarters’ state. This measurement error is likely to attenuate
our estimate of the treatment effect. To address this issue, we use the data of Garcia and Norli
(2012) on the state-level operations of companies based on their 10-K filings. Specifically, we
follow the approach of Flammer and Luo (2017) and identify a subset of “geographically
concentrated firms,” that is, firms with at least 80% of their operations in a given state. We then
re-estimate our baseline specification using this subsample of firms. As is shown in column (6) of
Table A7, our results also hold in this subsample. As expected, the point estimate is larger than in
the full sample.
Serial correlation. In their assessment of the difference-in-differences methodology,
Bertrand, Duflo, and Mullainathan (2004) recommend that standard errors be clustered at the
dimension of the treatment. Accordingly, in our baseline specification, we cluster standard errors
at the state of location. In column (7) of Table A7, we consider an alternative method proposed by
Bertrand et al. (2004): block bootstrapping. The difference to standard bootstrapping is that instead
of drawing single observations, we draw entire groups (“blocks”) of observations. The idea, which
is similar to clustering, is to preserve the existing correlation structure within each block while
using the independence across blocks to consistently estimate standard errors. In analogy to our
clustering approach, we construct blocks at the state level. Specifically, we construct 100 bootstrap
samples by drawing with replacement states of location. For each bootstrap sample, we estimate
our baseline specification and store the coefficients. The standard errors are then calculated based
on the empirical distribution of these 100 sets of coefficients. As is shown, the significance level
is very similar to before.

13
Accounting for CSR concerns. In column (8) of Table A7, we re-estimate our baseline
specification using the “net” KLD-index (i.e., the number of KLD strengths net of the number of
KLD concerns) instead of the KLD-index based on the number of KLD strengths. As can be seen,
the point estimate is similar to our baseline estimate in Table 2.
Appendix E. Cross-sectional heterogeneity
Our main results show that companies respond to an exogenous increase in the threat of knowledge
spillovers by increasing their CSR. In this section, we complement this analysis by showing that
the response is stronger when the risk of knowledge spillover is higher. We consider five different
dimensions.
First, the risk of knowledge spillovers is likely lower in states that strongly enforce non-
compete agreements. Such agreements restrict employees’ ability to leave their current employer
and hence reduce the threat of knowledge spillovers. Second, the risk of knowledge spillovers is
likely higher for companies located in close proximity to innovation hubs, as the geographic
agglomeration of firms can lead to increased interactions between firms and their knowledge
workers, resulting in increased knowledge spillovers (e.g., Almeida and Kogut, 1999; Mariani et
al., 2015). Finally, the risk of knowledge spillovers is likely higher in i) R&D-intensive industries,
ii) competitive industries, and iii) industries with better investment opportunities—that is,
industries where the ability to innovate and retain knowledge is key to competitiveness and
survival. In the following, we describe how we measure each of these five characteristics.
Contingencies
Enforceability of non-compete agreements. Following Starr (2018) and Starr, Ganco, and
Campbell (2018), we measure the extent to which states enforce non-compete agreements by using
Starr’s (2018) index of enforceability of non-compete agreements at the state level (non-compete
14
index).9
Proximity to innovation hubs. To measure the proximity to innovation hubs, we compute
the great-circle distance between the ZIP code of the company’s headquarters (from Compustat)
and the fifteen innovation hubs identified by Booz Allen (see Booz Allen, 2016, p. 11)—San
Francisco, Seattle, Austin, Boston, Raleigh, San Diego, Los Angeles, Salt Lake City, Houston,
Denver, Pittsburgh, Washington DC, Minneapolis, Phoenix, and Dallas. The great-circle distance
is the shortest distance between any two points on the surface of a sphere and is obtained from the
formula:
r × arcos [sin(λi) × sin(λhub) + cos(λi) × cos(λhub) × cos(θi – θhub)],
where λi (θi) is the latitude (longitude) of the ZIP code of company i’s headquarters, and λhub (θhub)
is the latitude (longitude) of the centroid of the innovation hub, respectively. We match ZIP codes
to longitudes and latitudes using the “zipcode” file of the SAS software. We approximate the
latitude and longitude of each innovation hub by taking the average latitude and longitude of all
ZIP codes pertaining to the innovation hub’s city. We then compute proximity to innovation hub
as the ratio of one divided by the distance to the closest innovation hub.
R&D intensity. We construct a measure of R&D intensity at the industry level by
computing the average ratio of R&D expenses to total assets across all Compustat firms in the
same 3-digit SIC industry (R&D intensity).
Product market competition. We measure industry concentration by using the Herfindahl-
Hirschman Index (HHI) of industry concentration at the 3-digit SIC level. HHI is defined as the
9 The Starr index is a refinement of the index of Bishara (2011) that assigns a score between 0 to 10 on seven dimensions of non-compete enforceability at the state level, and aggregates the individual dimensions using subjectively chosen weights. The Starr index improves upon Bishara’s weighting scheme by using confirmatory factor analysis on the seven scores to generate weights that capture the importance of the various dimensions of non-compete enforceability. The data are obtained from Table B1 of Starr (2018, p. 51). Note that the index is available for 1991 and 2009. To fill in the missing years, we use the index from the latest available year (i.e., we fill in the 1992-2008 values with the 1991 index and the 2010-2013 values with the 2009 index).
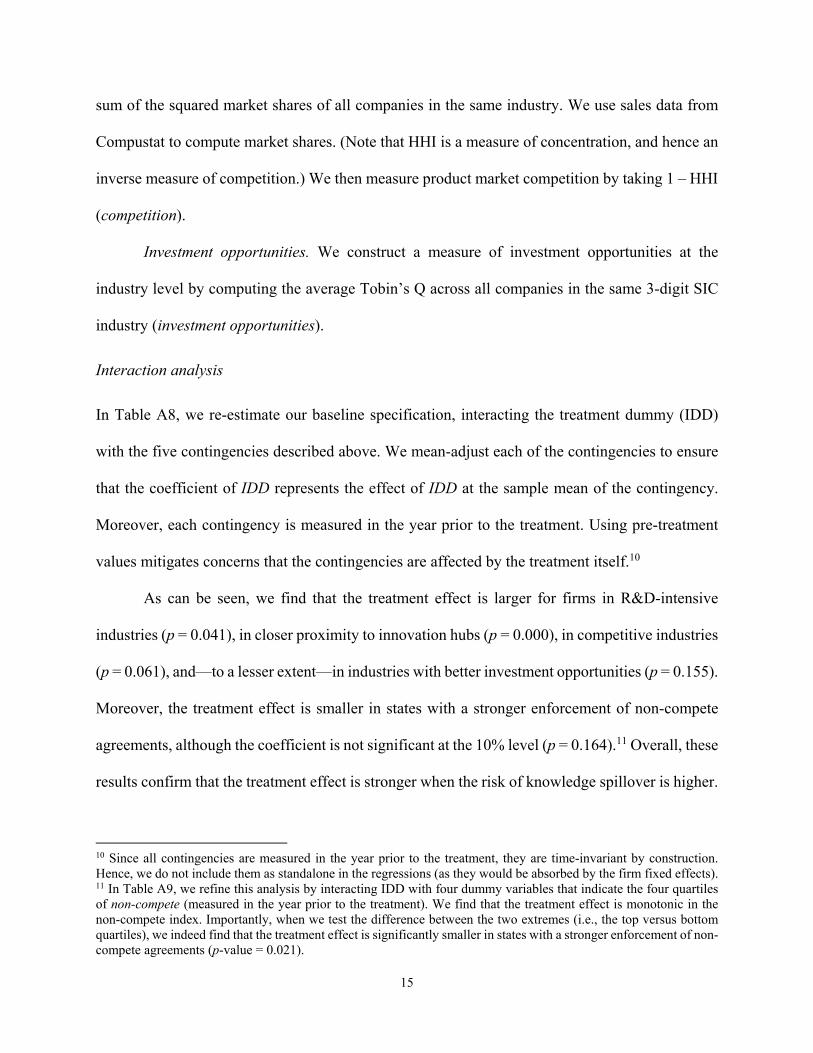
15
sum of the squared market shares of all companies in the same industry. We use sales data from
Compustat to compute market shares. (Note that HHI is a measure of concentration, and hence an
inverse measure of competition.) We then measure product market competition by taking 1 – HHI
(competition).
Investment opportunities. We construct a measure of investment opportunities at the
industry level by computing the average Tobin’s Q across all companies in the same 3-digit SIC
industry (investment opportunities).
Interaction analysis
In Table A8, we re-estimate our baseline specification, interacting the treatment dummy (IDD)
with the five contingencies described above. We mean-adjust each of the contingencies to ensure
that the coefficient of IDD represents the effect of IDD at the sample mean of the contingency.
Moreover, each contingency is measured in the year prior to the treatment. Using pre-treatment
values mitigates concerns that the contingencies are affected by the treatment itself.10
As can be seen, we find that the treatment effect is larger for firms in R&D-intensive
industries (p = 0.041), in closer proximity to innovation hubs (p = 0.000), in competitive industries
(p = 0.061), and—to a lesser extent—in industries with better investment opportunities (p = 0.155).
Moreover, the treatment effect is smaller in states with a stronger enforcement of non-compete
agreements, although the coefficient is not significant at the 10% level (p = 0.164).11 Overall, these
results confirm that the treatment effect is stronger when the risk of knowledge spillover is higher.
10 Since all contingencies are measured in the year prior to the treatment, they are time-invariant by construction. Hence, we do not include them as standalone in the regressions (as they would be absorbed by the firm fixed effects). 11 In Table A9, we refine this analysis by interacting IDD with four dummy variables that indicate the four quartiles of non-compete (measured in the year prior to the treatment). We find that the treatment effect is monotonic in the non-compete index. Importantly, when we test the difference between the two extremes (i.e., the top versus bottom quartiles), we indeed find that the treatment effect is significantly smaller in states with a stronger enforcement of non-compete agreements (p-value = 0.021).
16
References
Almeida P, Kogut B. 1999. Localization of knowledge and the mobility of engineers in regional networks. Management Science 45(7): 905–917.
Amore MD, Schneider C, Zaldokas A. 2013. Credit supply and corporate innovation. Journal of Financial Economics 109(3): 835–855.
Bertrand M, Duflo E, Mullainathan S. 2004. How much should we trust differences-in-differences estimates? Quarterly Journal of Economics 119(1): 249–275.
Bertrand M, Mullainathan S. 2003. Enjoying the quiet life? Corporate governance and managerial preferences. Journal of Political Economy 111(5): 1043–1075.
Bishara ND. 2011. Fifty ways to leave your employer: relative enforcement of noncompete agreements, trends, and implications for employee mobility policy. University of Pennsylvania Journal of Business Law 13(3): 751–795.
Booz Allen. 2016. Booz Allen’s Innovation Hub Engagement Strategy. Booz Allen Hamilton Inc.: McLean, VA.
Castellaneta F, Conti R, Kacperczyk A. 2017. Money secrets: how does trade secret legal protection affect firm market value? Evidence from the uniform trade secret act. Strategic Management Journal 38(4): 834–853.
Fisher RJ. 1993. Social desirability bias and the validity of indirect questioning. Journal of Consumer Research 20(2): 303‒315.
Flammer C, Kacperczyk A. 2016. The impact of stakeholder orientation on innovation: evidence from a natural experiment. Management Science 62(7): 1982–2001.
Flammer C, Luo J. 2017. Corporate social responsibility as an employee governance tool: evidence from a quasi-experiment. Strategic Management Journal 38(2): 163–183.
Garcia D, Norli O. 2012. Geographic dispersion and stock returns. Journal of Financial Economics 106(3): 547–565.
Gilson RJ. 1999. The legal infrastructure of high technology industrial districts: Silicon Valley, Route 128, and covenants not to compete. New York University Law Review 74(3): 575‒629.
Kahnke RE, Bundy KL. 2013. The Secrets to Winning Trade Secret Cases. Thomson Reuters Westlaw: New York, NY.
Kahnke RE, Bundy KL, Liebman KA. 2008. Doctrine of Inevitable Disclosure. Faegre and Benson LLP: Minneapolis, MN.
Karpoff JM, Wittry MD. 2018. Institutional and legal context in natural experiments: the case of state antitakeover laws. Journal of Finance 73(2): 657–714.
Maccoby EE, Maccoby N. 1954. The interview: a tool of social science. Lindzey G, ed. Handbook of Social Psychology (Addison-Wesley: Cambridge, MA), 449–487.
Mariani M, Feldman MP, Harhoff D, Gambardella A. 2015. On the benefits of geographic proximity for knowledge spillovers. Working paper, Bocconi University, Milan.
Marx M, Strumsky D, Fleming L. 2009. Mobility, skills, and the Michigan non-compete experiment. Management Science 55(6): 875‒889.
Nederhof AJ. 1985. Methods of coping with social desirability bias: a review. European Journal of Social Psychology 15(3): 263‒280.

17
Png IPL. 2017. Secrecy and patents: theory and evidence from the Uniform Trade Secrets Act. Strategy Science 2(3): 176–193.
Png IPL, Samila S. 2015. Trade secrets law and mobility: evidence from “inevitable disclosure”. Working paper, National University of Singapore, Singapore.
Starr EP. 2018. Consider this: training, wages, and the enforceability of covenants not to compete. Industrial and Labor Relations Review, forthcoming.
Starr EP, Ganco M, Campbell BA. 2018. Strategic human capital management in the context of cross-industry and within-industry mobility frictions. Strategic Management Journal 39(8): 2226‒2254.
The Economist. 2013. Intellectual property: can you keep a secret? 16 March. Thomas JR. 2014. The role of trade secrets in innovation policy. Congressional Research Service
Report 7-5700. U.S. Chamber of Commerce. 2014. The Case for Enhanced Protection of Trade Secrets in the
Trans-Pacific Partnership Agreement. U.S. Chamber of Commerce: Washington, DC.
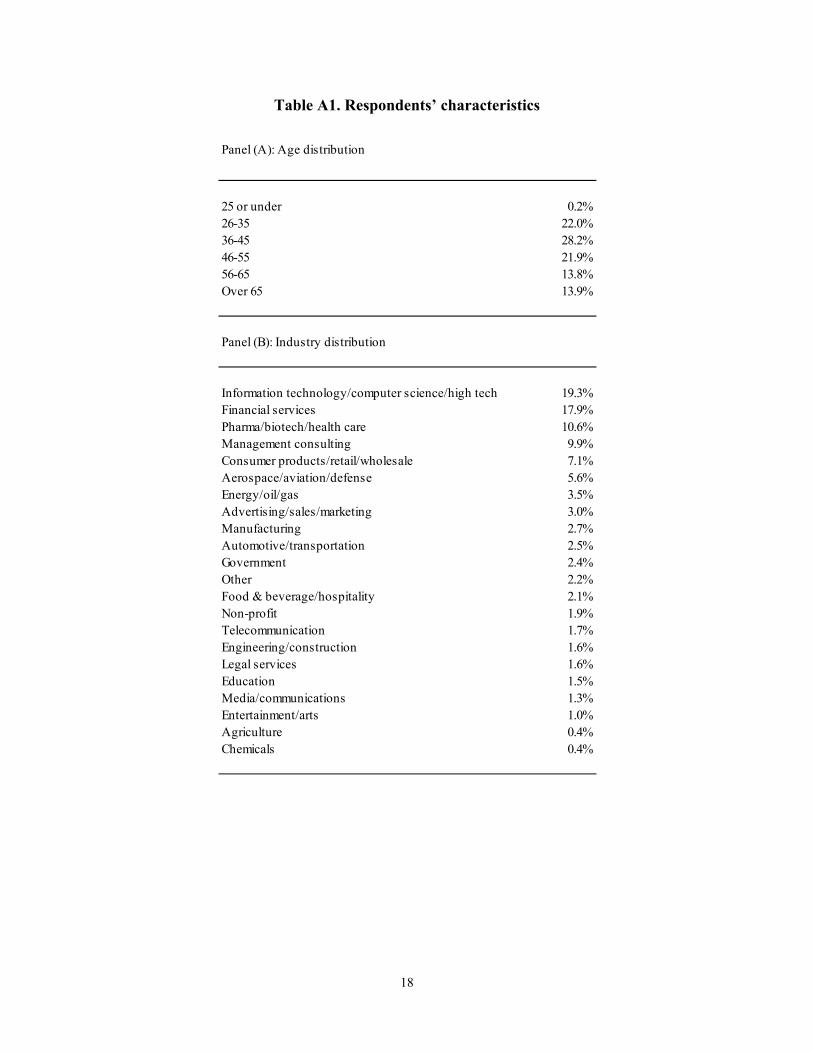
18
Table A1. Respondents’ characteristics
Panel (A): Age distribution
25 or under 0.2%26-35 22.0%36-45 28.2%46-55 21.9%56-65 13.8%Over 65 13.9%
Panel (B): Industry distribution
Information technology/computer science/high tech 19.3%Financial services 17.9%Pharma/biotech/health care 10.6%Management consulting 9.9%Consumer products/retail/wholesale 7.1%Aerospace/aviation/defense 5.6%Energy/oil/gas 3.5%Advertising/sales/marketing 3.0%Manufacturing 2.7%Automotive/transportation 2.5%Government 2.4%Other 2.2%Food & beverage/hospitality 2.1%Non-profit 1.9%Telecommunication 1.7%Engineering/construction 1.6%Legal services 1.6%Education 1.5%Media/communications 1.3%Entertainment/arts 1.0%Agriculture 0.4%Chemicals 0.4%

19
Table A2. Rejection of the inevitable disclosure doctrine (IDD)
State Year Case
Arkansas 2009 Cellco Partnership v. Langston , No. 4:09CV00928 JMM (W.D. Ark. 2009)California 2002 Whyte v. Schlage Lock Co. , No. G028382 (Ct. of App. of California 2002) Florida 2001 Del Monte Fresh Produce Co. v. Dole Food Co. , Inc., 148 F. Supp. 2d 1322 (S.D. Fla. 2001) Georgia 2013 Holton v. Physician Oncology Servs., LP , No. S13A0012, 2013 WL 1859294 (Ga. 2013)Maryland 2004 LeJeune v. Coin Acceptors, Inc. , 381 Md. 288 (Md. 2004).Massachusetts 2012 U.S. Elec. Servs. v. Schmidt , Civil Action No. 12-10845-DJC (U.S. Dist. CT. for the Dist. of Mass. 2012)Michigan 2002 CMI Int’l, Inc. v. Intermet Int’l Corp. , 649 N.W.2d 808, 812 (Mich. Ct. App. 2002)New Hampshire 2010 Allot Communications v. Cullen , 10-E-0016 (N.H. Merrimack Superior Ct. 2010) New Jersey 2012 SCS Healthcare Marketing, LLC v. Allergan USA , Inc., N.J. Super. Unpub. LEXIS 2704 (N.J. Sup. Ct. Ch. Div. 2012)New York 2009 American Airlines, Inc. v. Imhof , U.S. Dist. LEXIS 46750 (S.D.N.Y. 2009) Ohio 2008 Hydrofarm, Inc. v. Orendorff , Ohio App. LEXIS 5717 (Ohio App. Ct. 2008)Virginia 1999 Government Technology Services, Inc. v. Intellisys Technology Corp. , 51 Va. Cir. 55 (Va. Cir. Ct. 1999)Washington 2012 Amazon.com, Inc. v. Powers , Case No. C12-1911RAJ (W.D. Wash. 2012)Wisconsin 2009 Clorox Co. v. SC Johnson & Son Inc. , 2:09-cv-00408-JPS (U.S. District Court, Eastern District of Wisconsin 2009)
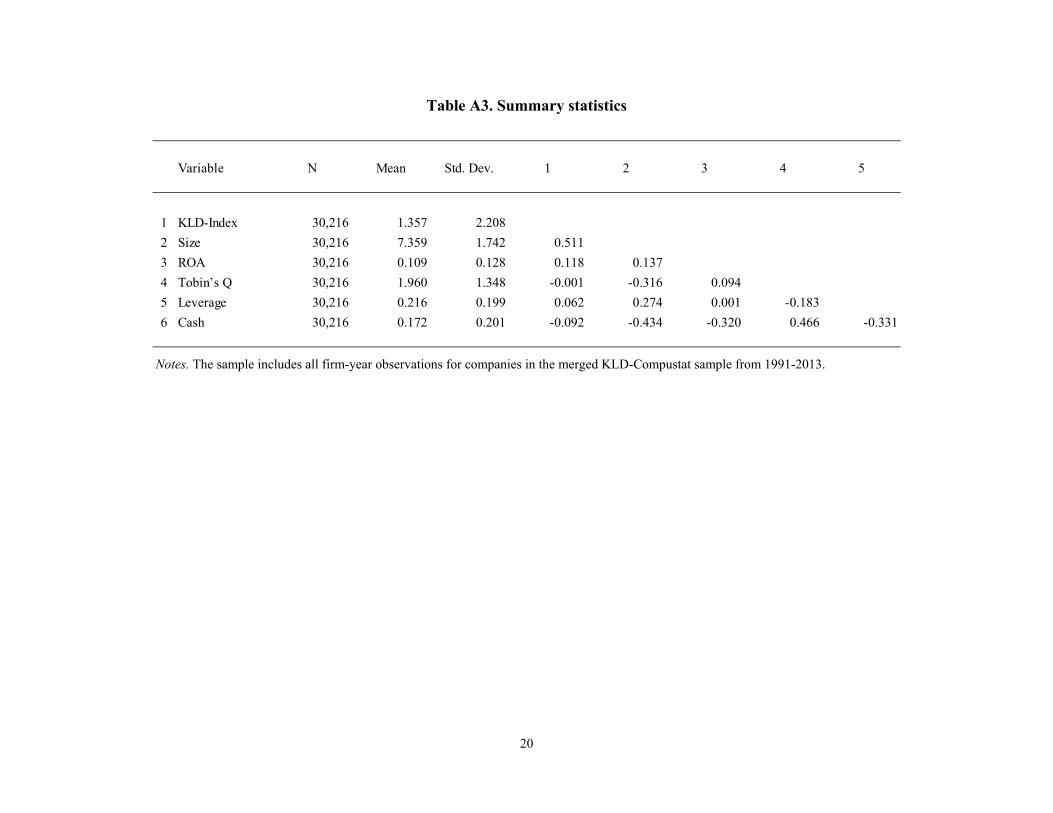
20
Table A3. Summary statistics
Notes. The sample includes all firm-year observations for companies in the merged KLD-Compustat sample from 1991-2013.
Variable N Mean Std. Dev. 1 2 3 4 5
1 KLD-Index 30,216 1.357 2.208
2 Size 30,216 7.359 1.742 0.511
3 ROA 30,216 0.109 0.128 0.118 0.137
4 Tobin’s Q 30,216 1.960 1.348 -0.001 -0.316 0.094
5 Leverage 30,216 0.216 0.199 0.062 0.274 0.001 -0.183
6 Cash 30,216 0.172 0.201 -0.092 -0.434 -0.320 0.466 -0.331

21
Table A4. ASSET4 ratings
Notes. Standard errors (reported in parentheses) are clustered at the state level.
Dependent variable
ASSET4 score ASSET4 score ASSET4 score(composite) (social) (environment)
(1) (2) (3)
IDD 3.512 3.958 3.066(1.496) (1.954) (1.599)
Size 4.297 4.327 4.266(1.157) (1.301) (1.387)
ROA 9.081 7.894 10.268(5.288) (6.028) (6.669)
Tobin’s Q 0.966 1.504 0.427(0.473) (0.534) (0.620)
Leverage 7.316 7.481 7.151(5.849) (5.331) (7.283)
Cash 0.743 7.580 -6.094(3.632) (3.514) (4.800)
Firm fixed effects Yes Yes YesIndustry × year fixed effects Yes Yes YesRegion × year fixed effects Yes Yes Yes
R-squared 0.869 0.832 0.842Observations 5,112 5,112 5,112
ASSET4 score

22
Table A5. ASSET4 components
Notes. Standard errors (reported in parentheses) are clustered at the state level.
Dependent variable
Workforce Workforce Workforce Workforce Society Society Customer Environment Environment Environmentdiversity and employment health and training and community human rights product emission product resourceopportunities quality safety development responsibility reduction innovation reduction
(1) (2) (3) (4) (5) (6) (7) (8) (9) (10)
IDD 3.190 3.922 3.476 4.614 3.210 2.925 1.859 2.917 1.907 3.300(1.865) (1.429) (1.780) (1.725) (1.929) (1.855) (1.794) (1.547) (1.523) (1.700)
Size 3.214 3.321 2.938 4.257 4.275 5.299 2.250 3.528 3.836 4.098(1.056) (1.098) (1.152) (1.175) (1.443) (1.314) (1.463) (1.405) (1.398) (1.363)
ROA 2.597 6.979 7.394 12.379 3.692 12.329 4.097 9.346 11.146 7.970(6.308) (4.865) (5.223) (6.488) (6.488) (6.914) (4.124) (6.602) (5.869) (7.037)
Tobin’s Q 1.139 0.843 1.556 1.183 1.381 2.124 0.996 0.282 0.515 0.466(0.485) (0.553) (0.500) (0.590) (0.524) (0.553) (0.416) (0.626) (0.576) (0.633)
Leverage 6.087 5.422 12.267 5.270 4.943 2.866 7.886 7.357 6.612 6.876(5.012) (4.937) (5.354) (4.490) (5.359) (4.631) (5.831) (7.372) (6.747) (7.097)
Cash 4.399 6.966 7.477 6.648 5.376 7.552 5.252 -5.484 -6.693 -4.304(3.750) (3.160) (3.894) (3.326) (3.716) (3.134) (3.984) (4.289) (4.934) (5.183)
Firm fixed effects Yes Yes Yes Yes Yes Yes Yes Yes Yes YesIndustry × year fixed effects Yes Yes Yes Yes Yes Yes Yes Yes Yes YesRegion × year fixed effects Yes Yes Yes Yes Yes Yes Yes Yes Yes Yes
R-squared 0.824 0.837 0.795 0.808 0.826 0.783 0.830 0.847 0.831 0.837Observations 5,112 5,112 5,112 5,112 5,112 5,112 5,112 5,112 5,112 5,112
Components of ASSET4 environment scoreComponents of ASSET4 social score

23
Table A6. R&D expenditures
Notes. Standard errors (reported in parentheses) are clustered at the state level.
Dependent variable R&D / sales R&D / assets
(1) (2)
IDD 0.0025 0.0017(0.0019) (0.0012)
Size 0.0026 -0.0114(0.0019) (0.0040)
ROA -0.1238 -0.0175(0.0204) (0.0083)
Tobin’s Q 0.0064 0.0050(0.0010) (0.0006)
Leverage -0.0023 -0.0068(0.0078) (0.0045)
Cash -0.0140 -0.0256(0.0074) (0.0048)
Firm fixed effects Yes YesIndustry × year fixed effects Yes YesRegion × year fixed effects Yes Yes
R-squared 0.940 0.924Observations 13,635 13,691
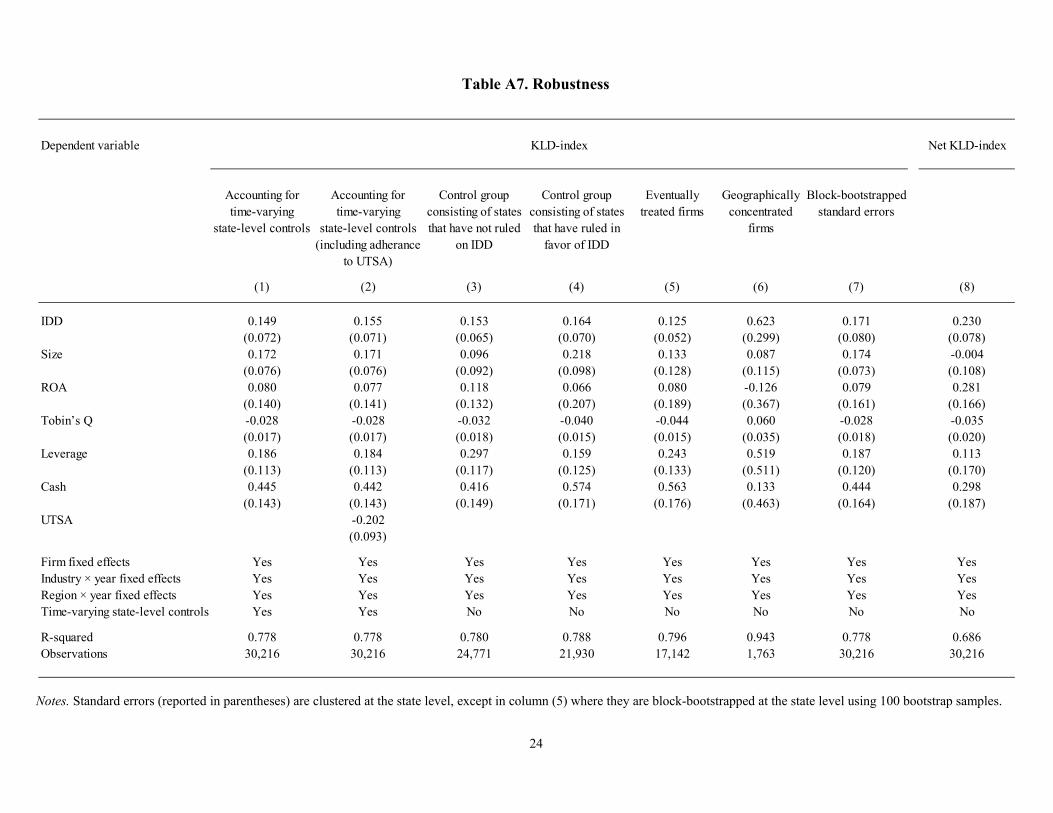
24
Table A7. Robustness
Notes. Standard errors (reported in parentheses) are clustered at the state level, except in column (5) where they are block-bootstrapped at the state level using 100 bootstrap samples.
Dependent variable Net KLD-index
Accounting for Accounting for Control group Control group Eventually Geographically Block-bootstrappedtime-varying time-varying consisting of states consisting of states treated firms concentrated standard errors
state-level controls state-level controls that have not ruled that have ruled in firms(including adherance on IDD favor of IDD
to UTSA)
(1) (2) (3) (4) (5) (6) (7) (8)
IDD 0.149 0.155 0.153 0.164 0.125 0.623 0.171 0.230(0.072) (0.071) (0.065) (0.070) (0.052) (0.299) (0.080) (0.078)
Size 0.172 0.171 0.096 0.218 0.133 0.087 0.174 -0.004(0.076) (0.076) (0.092) (0.098) (0.128) (0.115) (0.073) (0.108)
ROA 0.080 0.077 0.118 0.066 0.080 -0.126 0.079 0.281(0.140) (0.141) (0.132) (0.207) (0.189) (0.367) (0.161) (0.166)
Tobin’s Q -0.028 -0.028 -0.032 -0.040 -0.044 0.060 -0.028 -0.035(0.017) (0.017) (0.018) (0.015) (0.015) (0.035) (0.018) (0.020)
Leverage 0.186 0.184 0.297 0.159 0.243 0.519 0.187 0.113(0.113) (0.113) (0.117) (0.125) (0.133) (0.511) (0.120) (0.170)
Cash 0.445 0.442 0.416 0.574 0.563 0.133 0.444 0.298(0.143) (0.143) (0.149) (0.171) (0.176) (0.463) (0.164) (0.187)
UTSA -0.202(0.093)
Firm fixed effects Yes Yes Yes Yes Yes Yes Yes YesIndustry × year fixed effects Yes Yes Yes Yes Yes Yes Yes YesRegion × year fixed effects Yes Yes Yes Yes Yes Yes Yes YesTime-varying state-level controls Yes Yes No No No No No No
R-squared 0.778 0.778 0.780 0.788 0.796 0.943 0.778 0.686Observations 30,216 30,216 24,771 21,930 17,142 1,763 30,216 30,216
KLD-index
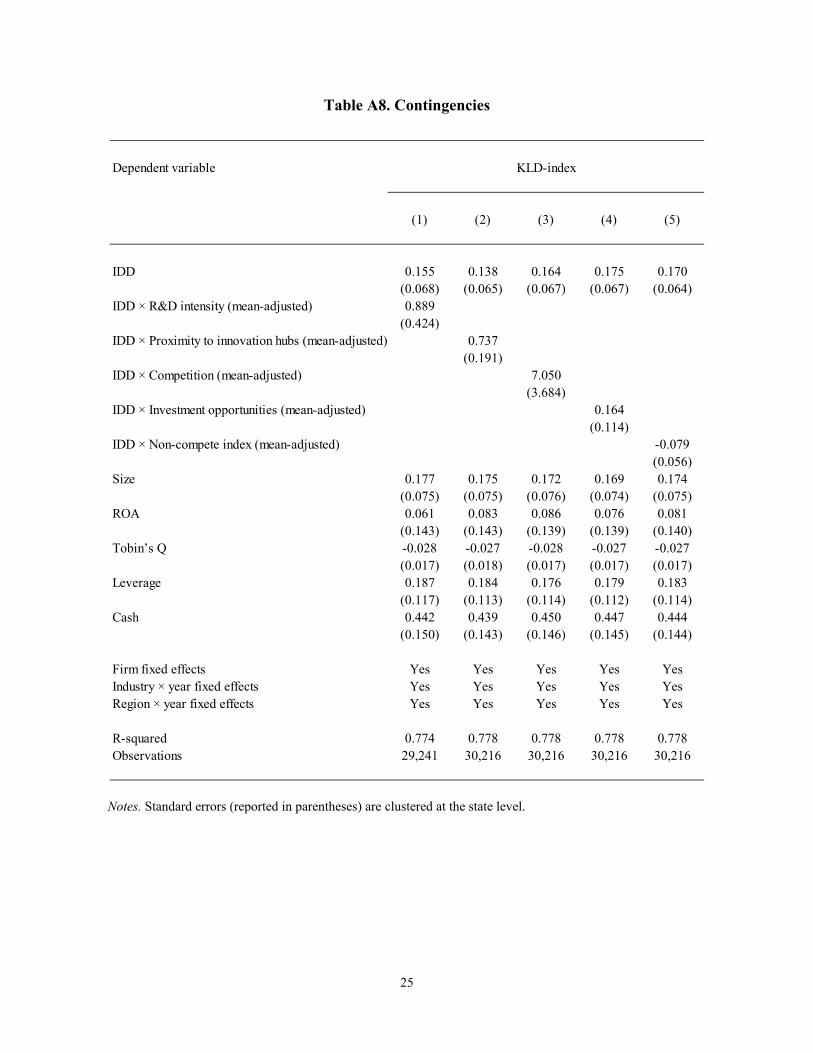
25
Table A8. Contingencies
Notes. Standard errors (reported in parentheses) are clustered at the state level.
Dependent variable
(1) (2) (3) (4) (5)
IDD 0.155 0.138 0.164 0.175 0.170(0.068) (0.065) (0.067) (0.067) (0.064)
IDD × R&D intensity (mean-adjusted) 0.889(0.424)
IDD × Proximity to innovation hubs (mean-adjusted) 0.737(0.191)
IDD × Competition (mean-adjusted) 7.050(3.684)
IDD × Investment opportunities (mean-adjusted) 0.164(0.114)
IDD × Non-compete index (mean-adjusted) -0.079(0.056)
Size 0.177 0.175 0.172 0.169 0.174(0.075) (0.075) (0.076) (0.074) (0.075)
ROA 0.061 0.083 0.086 0.076 0.081(0.143) (0.143) (0.139) (0.139) (0.140)
Tobin’s Q -0.028 -0.027 -0.028 -0.027 -0.027(0.017) (0.018) (0.017) (0.017) (0.017)
Leverage 0.187 0.184 0.176 0.179 0.183(0.117) (0.113) (0.114) (0.112) (0.114)
Cash 0.442 0.439 0.450 0.447 0.444(0.150) (0.143) (0.146) (0.145) (0.144)
Firm fixed effects Yes Yes Yes Yes YesIndustry × year fixed effects Yes Yes Yes Yes YesRegion × year fixed effects Yes Yes Yes Yes Yes
R-squared 0.774 0.778 0.778 0.778 0.778Observations 29,241 30,216 30,216 30,216 30,216
KLD-index
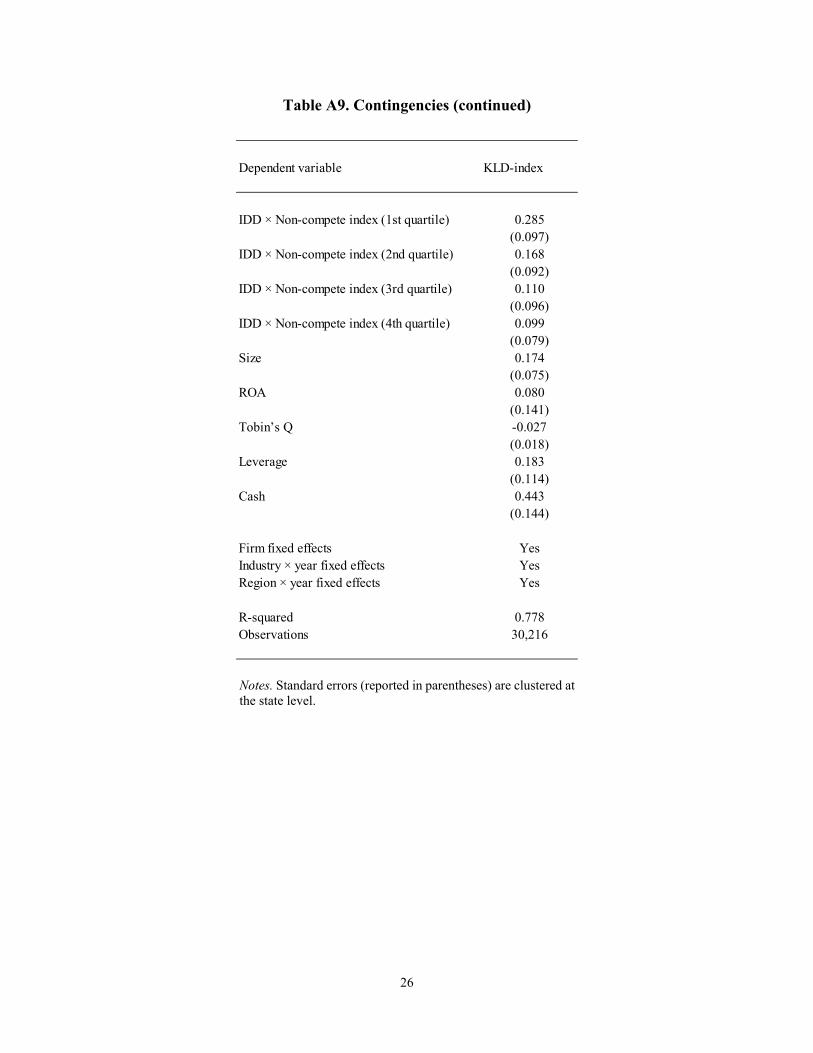
26
Table A9. Contingencies (continued)
Notes. Standard errors (reported in parentheses) are clustered at the state level.
Dependent variable KLD-index
IDD × Non-compete index (1st quartile) 0.285(0.097)
IDD × Non-compete index (2nd quartile) 0.168(0.092)
IDD × Non-compete index (3rd quartile) 0.110(0.096)
IDD × Non-compete index (4th quartile) 0.099(0.079)
Size 0.174(0.075)
ROA 0.080(0.141)
Tobin’s Q -0.027(0.018)
Leverage 0.183(0.114)
Cash 0.443(0.144)
Firm fixed effects YesIndustry × year fixed effects YesRegion × year fixed effects Yes
R-squared 0.778Observations 30,216
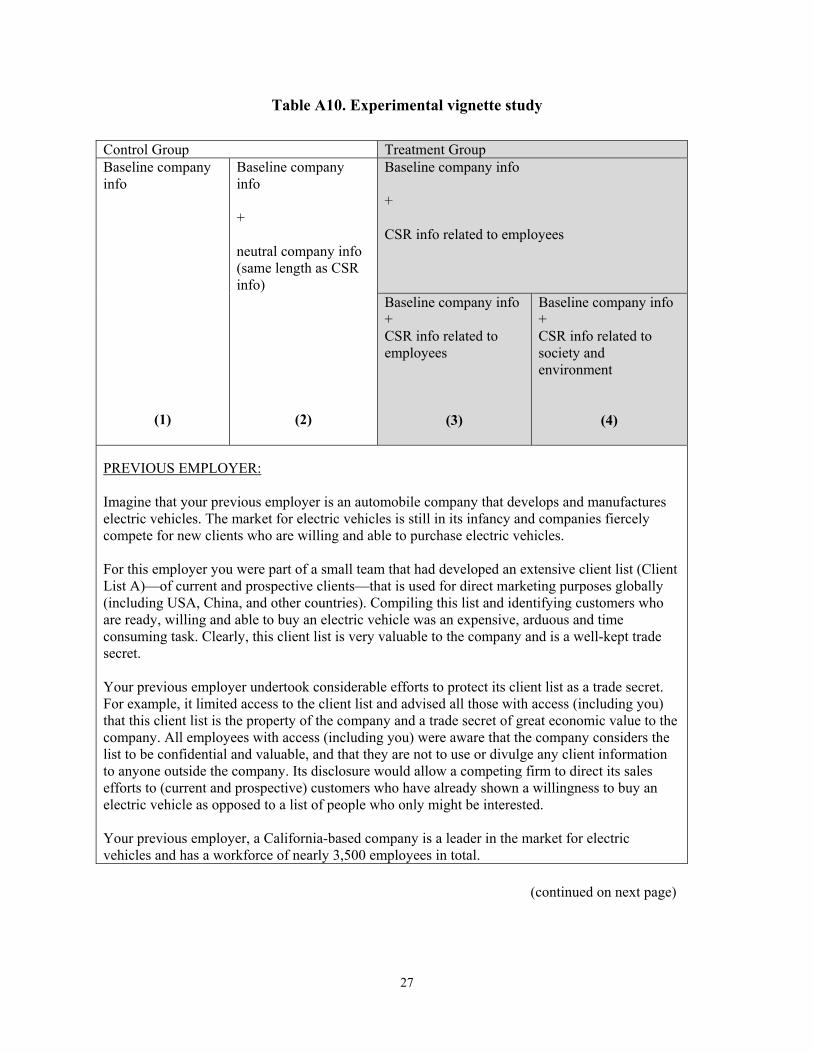
27
Table A10. Experimental vignette study
Control Group Treatment Group Baseline company info
(1)
Baseline company info + neutral company info (same length as CSR info)
(2)
Baseline company info + CSR info related to employees Baseline company info + CSR info related to employees
(3)
Baseline company info + CSR info related to society and environment
(4)
PREVIOUS EMPLOYER: Imagine that your previous employer is an automobile company that develops and manufactures electric vehicles. The market for electric vehicles is still in its infancy and companies fiercely compete for new clients who are willing and able to purchase electric vehicles. For this employer you were part of a small team that had developed an extensive client list (Client List A)—of current and prospective clients—that is used for direct marketing purposes globally (including USA, China, and other countries). Compiling this list and identifying customers who are ready, willing and able to buy an electric vehicle was an expensive, arduous and time consuming task. Clearly, this client list is very valuable to the company and is a well-kept trade secret. Your previous employer undertook considerable efforts to protect its client list as a trade secret. For example, it limited access to the client list and advised all those with access (including you) that this client list is the property of the company and a trade secret of great economic value to the company. All employees with access (including you) were aware that the company considers the list to be confidential and valuable, and that they are not to use or divulge any client information to anyone outside the company. Its disclosure would allow a competing firm to direct its sales efforts to (current and prospective) customers who have already shown a willingness to buy an electric vehicle as opposed to a list of people who only might be interested. Your previous employer, a California-based company is a leader in the market for electric vehicles and has a workforce of nearly 3,500 employees in total.
(continued on next page)

28
Most recently, it has published a detailed report on the company’s product portfolio and growth strategy. For example, it highlights its plan to enter the Chinese market—the fastest growing market for electric vehicles. A key reason for this strong growth is the aim of the Chinese government to drastically reduce its carbon emissions.
Most recently, the company was ranked among the best places to work for. For example, it was praised for offering shared governance, for encouraging employee involvement and autonomy. Furthermore, it strongly supports minorities, and offers superior learning and advancement opportunities, work/life benefit programs (e.g., flextime), and overall a safe and healthy work environment.
Most recently, the company was ranked among the best places to work for. For example, it was praised for providing its employees the opportunity to devote some of their worktime to environmental and social initiatives. Furthermore, the company matches any of its employees’ donations made to support the community and protect the environment.
Click on “continue” on the bottom of this page once you are done reading your previous employer’s company info.
NEW EMPLOYER: In early 2018, you moved to a different city for family reasons. You have found a similar job at a competitor firm. Compared to your previous employer, your new employer is a young player in the field with a relatively short client list (Client List B). With the aim to grow its business, it tasked you to conduct a marketing campaign and to reach out to (current and potential) clients. Whom will you contact? * Client List A * Client List B * Client Lists A and B Please explain your choice.
Thank you for your participation.

29
Figure A1. Evolution of the KLD-index around the rejection of the IDD
Notes. The vertical axis plots the average KLD-index in the treatment group minus the average KLD-index in the control group three years before and after the treatments (95% confidence interval within dashed lines). “Treatments” refer to the rejection of the inevitable disclosure doctrine in the treated states listed in Table A2. The horizontal axis plots the years relative to the treatment (“year 0” refers to the year of the treatment, “year 1” is the year after the treatment, etc.).
-0.20
0.00
0.20
0.40
0.60
0.80
1.00
-3 -2 -1 0 1 2 3
Difference in KLD-index (treatment vs. control groups)
95% confidence interval