correlation - cboe | cboe options exchange correlation (definition) 3 pairwise, portfolio-weighted...
TRANSCRIPT
For Financial Professionals. Not for Public Distribution. PROPRIETARY. Permission to reprint or distribute any content from this presentation requires the written approval of S&P Dow Jones Indices. 1
Interpreting Global and U.S. Correlations
CORRELATION

For Financial Professionals. Not for Public Distribution. PROPRIETARY. Permission to reprint or distribute any content from this presentation requires the written approval of S&P Dow Jones Indices.
AGENDA
2
• Overview of correlation in major markets
• Motivate relationship between correlation and volatility
• Outline derivation of vol / correlation dependence
• Introduce dispersion as the complement to volatility
• Implications, particularly correlation as a measure of fragility
• Consequences of changes in dispersion via equity factors
• Brief remarks on benchmarking dispersion
For Financial Professionals. Not for Public Distribution. PROPRIETARY. Permission to reprint or distribute any content from this presentation requires the written approval of S&P Dow Jones Indices.
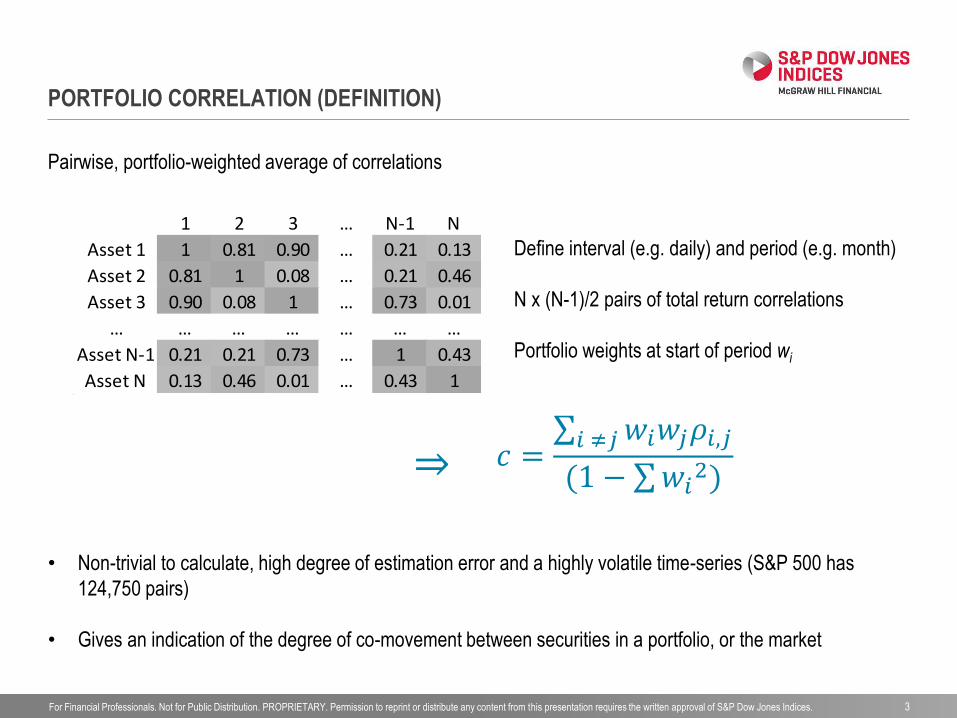
PORTFOLIO CORRELATION (DEFINITION)
3
Pairwise, portfolio-weighted average of correlations
1 2 3 … N-1 N
Asset 1 1 0.81 0.90 … 0.21 0.13
Asset 2 0.81 1 0.08 … 0.21 0.46
Asset 3 0.90 0.08 1 … 0.73 0.01
… … … … … … …
Asset N-1 0.21 0.21 0.73 … 1 0.43
Asset N 0.13 0.46 0.01 … 0.43 1
Define interval (e.g. daily) and period (e.g. month)
N x (N-1)/2 pairs of total return correlations
Portfolio weights at start of period wi
𝑐 = 𝑤𝑖𝑤𝑗𝜌𝑖,𝑗𝑖 ≠𝑗
(1 − 𝑤𝑖2)
• Non-trivial to calculate, high degree of estimation error and a highly volatile time-series (S&P 500 has
124,750 pairs)
• Gives an indication of the degree of co-movement between securities in a portfolio, or the market

For Financial Professionals. Not for Public Distribution. PROPRIETARY. Permission to reprint or distribute any content from this presentation requires the written approval of S&P Dow Jones Indices.
0%
10%
20%
30%
40%
50%
60%
70%
80%
90%
100%
No
v 1
98
9
No
v 1
99
0
No
v 1
99
1
No
v 1
99
2
No
v 1
99
3
No
v 1
99
4
No
v 1
99
5
No
v 1
99
6
No
v 1
99
7
No
v 1
99
8
No
v 1
99
9
No
v 2
00
0
No
v 2
00
1
No
v 2
00
2
No
v 2
00
3
No
v 2
00
4
No
v 2
00
5
No
v 2
00
6
No
v 2
00
7
No
v 2
00
8
No
v 2
00
9
No
v 2
01
0
No
v 2
01
1
No
v 2
01
2
No
v 2
01
3
No
v 2
01
4
S&P 500 Average Pairwise Correlation (Month)
12M Trailing Average
CORRELATION IN U.S. LARGE CAPS
4
S&P 500 monthly correlation and 12m trailing average, Nov 1989– August 2015
0.68 - August 2015
Source: S&P Dow Jones Indices. Past performance is no guarantee of future results.
For Financial Professionals. Not for Public Distribution. PROPRIETARY. Permission to reprint or distribute any content from this presentation requires the written approval of S&P Dow Jones Indices.
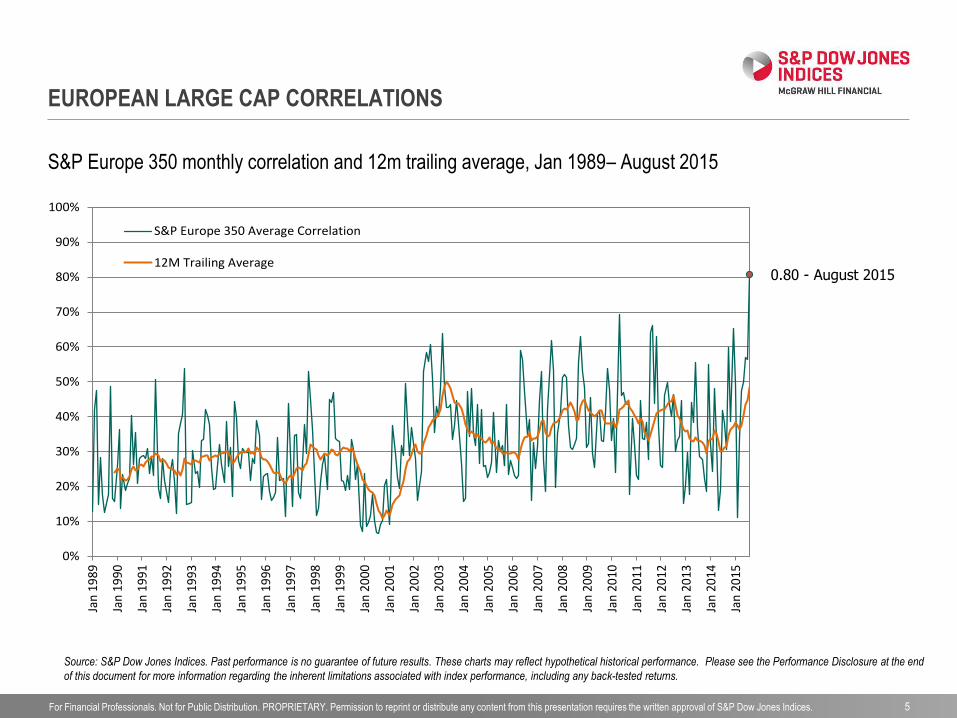
EUROPEAN LARGE CAP CORRELATIONS
5
0%
10%
20%
30%
40%
50%
60%
70%
80%
90%
100%
Jan
1989
Jan
1990
Jan
1991
Jan
1992
Jan
1993
Jan
1994
Jan
1995
Jan
1996
Jan
1997
Jan
1998
Jan
1999
Jan
2000
Jan
2001
Jan
2002
Jan
2003
Jan
2004
Jan
2005
Jan
2006
Jan
2007
Jan
2008
Jan
2009
Jan
2010
Jan
2011
Jan
2012
Jan
2013
Jan
2014
Jan
2015
S&P Europe 350 Average Correlation
12M Trailing Average0.80 - August 2015
Source: S&P Dow Jones Indices. Past performance is no guarantee of future results. These charts may reflect hypothetical historical performance. Please see the Performance Disclosure at the end
of this document for more information regarding the inherent limitations associated with index performance, including any back-tested returns.
S&P Europe 350 monthly correlation and 12m trailing average, Jan 1989– August 2015
For Financial Professionals. Not for Public Distribution. PROPRIETARY. Permission to reprint or distribute any content from this presentation requires the written approval of S&P Dow Jones Indices.
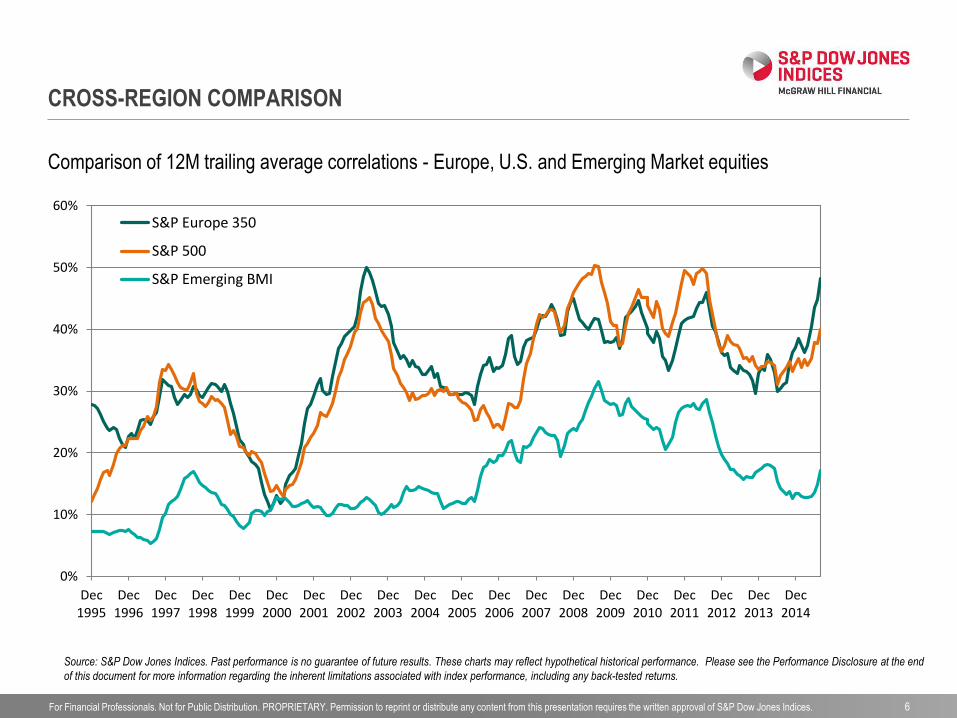
CROSS-REGION COMPARISON
6
Comparison of 12M trailing average correlations - Europe, U.S. and Emerging Market equities
Source: S&P Dow Jones Indices. Past performance is no guarantee of future results. These charts may reflect hypothetical historical performance. Please see the Performance Disclosure at the end
of this document for more information regarding the inherent limitations associated with index performance, including any back-tested returns.
0%
10%
20%
30%
40%
50%
60%
Dec1995
Dec1996
Dec1997
Dec1998
Dec1999
Dec2000
Dec2001
Dec2002
Dec2003
Dec2004
Dec2005
Dec2006
Dec2007
Dec2008
Dec2009
Dec2010
Dec2011
Dec2012
Dec2013
Dec2014
S&P Europe 350
S&P 500
S&P Emerging BMI

For Financial Professionals. Not for Public Distribution. PROPRIETARY. Permission to reprint or distribute any content from this presentation requires the written approval of S&P Dow Jones Indices.
CORRELATION AND VOLATILITY
7
S&P 500 Monthly correlation and volatility comparison: Oct 1989 – Aug 2015
Source: S&P Dow Jones Indices. Past performance is no guarantee of future results.
0%
10%
20%
30%
40%
50%
60%
70%
80%
90%
Oct
-89
Sep
-90
Aug
-91
Jul-9
2
Jun-
93
May
-94
Apr
-95
Mar
-96
Feb
-97
Jan-
98
Dec
-98
Nov
-99
Oct
-00
Sep
-01
Aug
-02
Jul-0
3
Jun-
04
May
-05
Apr
-06
Mar
-07
Feb
-08
Jan-
09
Dec
-09
Nov
-10
Oct
-11
Sep
-12
Aug
-13
Jul-1
4
Jun-
15
S&P 500 Correlation
S&P 500 R Volatility (Ann.)

For Financial Professionals. Not for Public Distribution. PROPRIETARY. Permission to reprint or distribute any content from this presentation requires the written approval of S&P Dow Jones Indices.
CORRELATION AND VOLATILITY – HISTORICAL
8
Levels and changes in realized S&P 500 volatility and correlations, Oct 1989 – Aug 2015
Source: S&P Dow Jones Indices. Past performance is no guarantee of future results.
0%
10%
20%
30%
40%
50%
60%
70%
80%
90%
0% 20% 40% 60% 80% 100%
Vo
lati
lity
Lev
el
Correlation Level
Levels
-100%
-50%
0%
50%
100%
150%
200%
250%
300%
-100% 0% 100% 200% 300%
% C
han
ge
In V
ola
tilit
y (M
on
th)
% Change in Correlation (Month)
Changes
For Financial Professionals. Not for Public Distribution. PROPRIETARY. Permission to reprint or distribute any content from this presentation requires the written approval of S&P Dow Jones Indices.
CORRELATION’S RELATIONSHIP TO VOL (PLAN OF ATTACK)
9
• Interpret / derive correlation in terms of market and individual risk
• Introduce dispersion, as missing piece of the puzzle
• Equations and their real-world accuracy (example)
• Consequences
For Financial Professionals. Not for Public Distribution. PROPRIETARY. Permission to reprint or distribute any content from this presentation requires the written approval of S&P Dow Jones Indices.
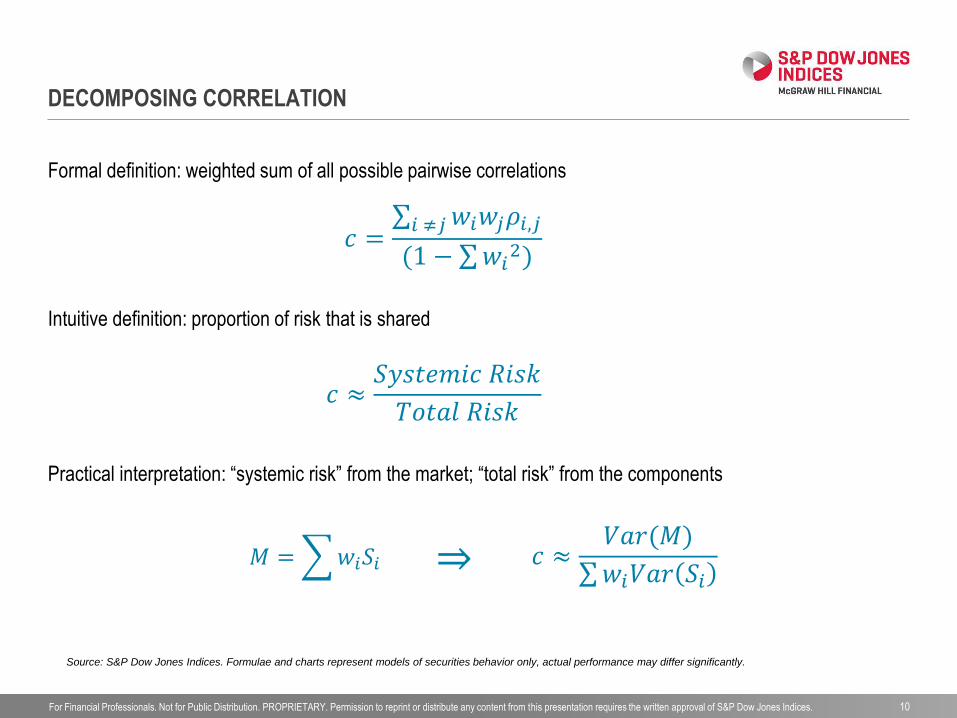
DECOMPOSING CORRELATION
10
Formal definition: weighted sum of all possible pairwise correlations
𝑐 = 𝑤𝑖𝑤𝑗𝜌𝑖,𝑗𝑖 ≠𝑗
(1 − 𝑤𝑖2)
Intuitive definition: proportion of risk that is shared
𝑐 ≈𝑆𝑦𝑠𝑡𝑒𝑚𝑖𝑐 𝑅𝑖𝑠𝑘
𝑇𝑜𝑡𝑎𝑙 𝑅𝑖𝑠𝑘
Practical interpretation: “systemic risk” from the market; “total risk” from the components
𝑐 ≈𝑉𝑎𝑟(𝑀)
𝑤𝑖𝑉𝑎𝑟 𝑆𝑖 𝑀 = 𝑤𝑖𝑆𝑖
Source: S&P Dow Jones Indices. Formulae and charts represent models of securities behavior only, actual performance may differ significantly.

For Financial Professionals. Not for Public Distribution. PROPRIETARY. Permission to reprint or distribute any content from this presentation requires the written approval of S&P Dow Jones Indices.
DECOMPOSING COMPONENT VARIANCE AS MARKET + ?
11
Standard decomposition of stocks as market + error
𝑆𝑖,𝑡 = 𝑀𝑡 + 𝜖𝑖,𝑡
𝑤𝑖𝑉𝑎𝑟 𝑆𝑖 = 𝑉𝑎𝑟 𝑀𝑡 + 𝑤𝑖𝑉𝑎𝑟 𝜖𝑖,𝑡 + (𝐶𝑜𝑣𝑎𝑟𝑖𝑎𝑛𝑐𝑒 𝑡𝑒𝑟𝑚𝑠)
Some basic algebra1 shows that the covariance terms cancel out to leave:
𝑤𝑖𝑉𝑎𝑟 𝑆𝑖 = 𝑉𝑎𝑟 𝑀𝑡 + 𝑤𝑖𝑉𝑎𝑟 𝜖𝑖,𝑡
… but is there an obvious (familiar) way to interpret the final term?
1) See e.g. S&P Dow Jones Indices – “At the Intersection of Diversification, Volatility and Correlation”, April 2014. Formulae and charts represent models of securities behavior only, actual
performance may differ significantly.
Leads to decomposition of variance:

For Financial Professionals. Not for Public Distribution. PROPRIETARY. Permission to reprint or distribute any content from this presentation requires the written approval of S&P Dow Jones Indices. 12
KEY CONCEPT: DISPERSION OR SINGLE-PERIOD CROSS-VARIATION
80%
85%
90%
95%
100%
105%
110%
115%
120%
125%
130%
29
-No
v-1
3
03
-De
c-1
3
07
-De
c-1
3
11
-De
c-1
3
15
-De
c-1
3
19
-De
c-1
3
23
-De
c-1
3
27
-De
c-1
3
31
-De
c-1
3
December 2013
80%
85%
90%
95%
100%
105%
110%
115%
120%
125%
130%
28
-Se
p-
01
02
-Oct
-01
06
-Oct
-01
10
-Oct
-01
14
-Oct
-01
18
-Oct
-01
22
-Oct
-01
26
-Oct
-01
30
-Oct
-01
Pri
ce R
etu
rn
October 2001
-21% -15% -9% -3% 3% 9% 15% 21%
V
XOM
AXP
MMM
KO
HD
UNH
TRV
VZ
JNJ
-21% -15% -9% -3% 3% 9% 15% 21%
INTC
C
HPQ
AA
JPM
PG
XOM
CAT
MTLQQ
MRK
Source: S&P Dow Jones Indices. Past performance is no guarantee of future results.
For Financial Professionals. Not for Public Distribution. PROPRIETARY. Permission to reprint or distribute any content from this presentation requires the written approval of S&P Dow Jones Indices.
0% 6% 12% 18% 24% 30% 36% 42%
INTC
MSFT
HD
HPQ
JNJ
EK
JPM
KO
AXP
XOM
IBM
HON
MTLQQ
MCD
T
Difference from Index (%)
-21% -15% -9% -3% 3% 9% 15% 21%
INTC
MSFT
HD
HPQ
JNJ
EK
JPM
KO
AXP
XOM
IBM
HON
MTLQQ
MCD
T
Change (%)
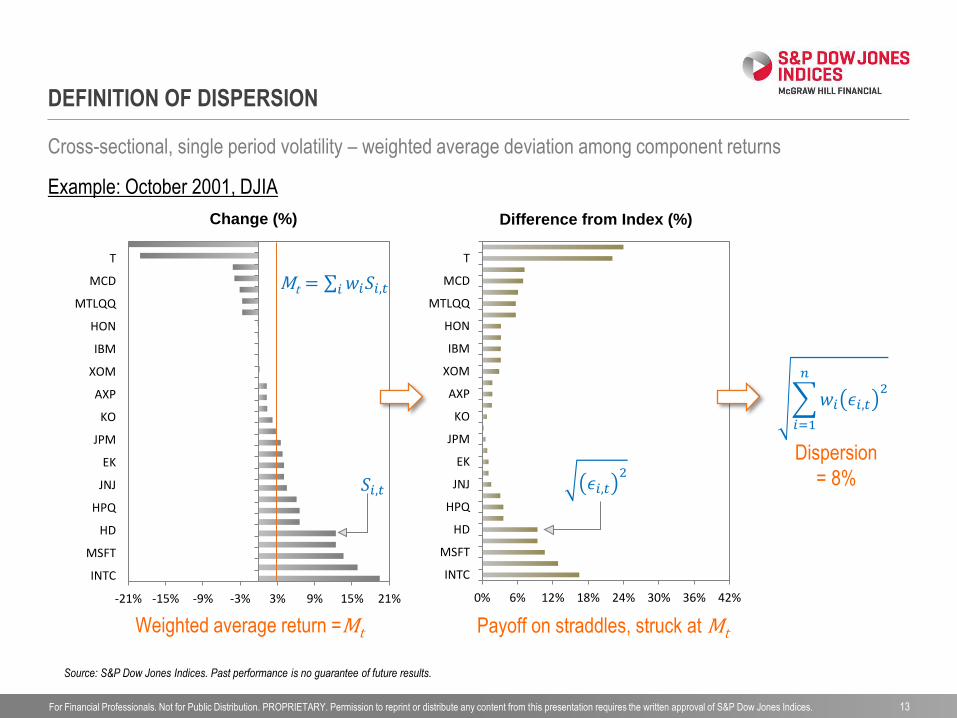
DEFINITION OF DISPERSION
13
Cross-sectional, single period volatility – weighted average deviation among component returns
Mt = 𝑤𝑖𝑆𝑖,𝑡𝑖
Weighted average return =Mt Payoff on straddles, struck at Mt
𝜖𝑖,𝑡2 𝑆𝑖,𝑡
𝑤𝑖 𝜖𝑖,𝑡2
𝑛
𝑖=1
Dispersion
= 8%
Source: S&P Dow Jones Indices. Past performance is no guarantee of future results.
Example: October 2001, DJIA
For Financial Professionals. Not for Public Distribution. PROPRIETARY. Permission to reprint or distribute any content from this presentation requires the written approval of S&P Dow Jones Indices.
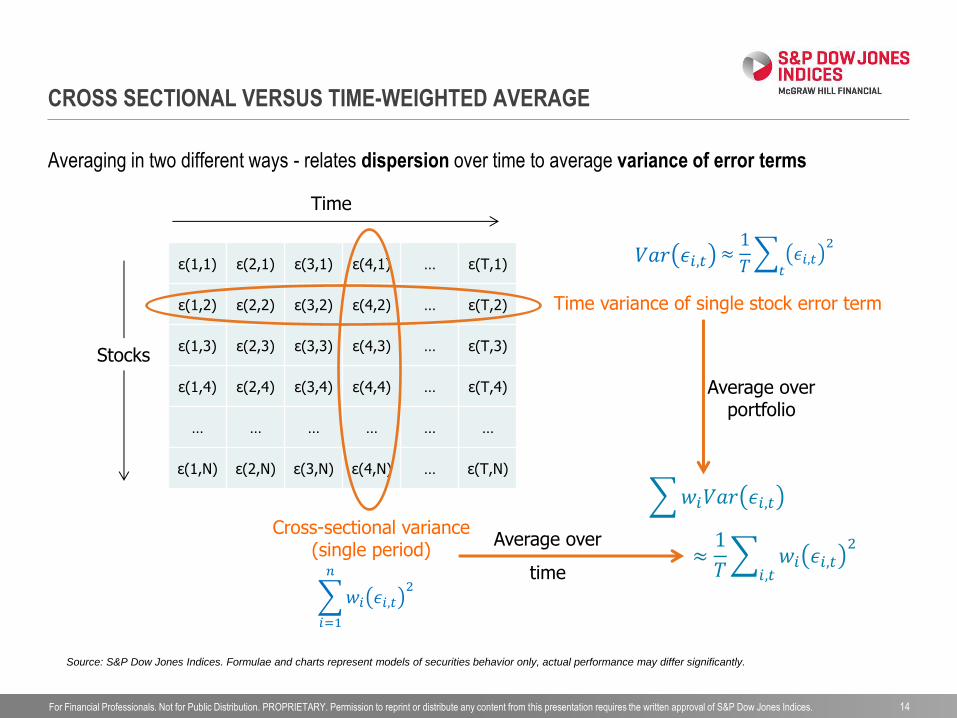
CROSS SECTIONAL VERSUS TIME-WEIGHTED AVERAGE
14
ɛ(1,1) ɛ(2,1) ɛ(3,1) ɛ(4,1) … ɛ(T,1)
ɛ(1,2) ɛ(2,2) ɛ(3,2) ɛ(4,2) … ɛ(T,2)
ɛ(1,3) ɛ(2,3) ɛ(3,3) ɛ(4,3) … ɛ(T,3)
ɛ(1,4) ɛ(2,4) ɛ(3,4) ɛ(4,4) … ɛ(T,4)
… … … … … …
ɛ(1,N) ɛ(2,N) ɛ(3,N) ɛ(4,N) … ɛ(T,N)
Average over
time
Stocks
Cross-sectional variance (single period)
Time variance of single stock error term
Averaging in two different ways - relates dispersion over time to average variance of error terms
𝑤𝑖𝑉𝑎𝑟 𝜖𝑖,𝑡
≈1
𝑇 𝜖𝑖,𝑡
2
𝑡
Average over portfolio
𝑤𝑖 𝜖𝑖,𝑡2
𝑛
𝑖=1
Time
Source: S&P Dow Jones Indices. Formulae and charts represent models of securities behavior only, actual performance may differ significantly.
≈1
𝑇 𝑤𝑖 𝜖𝑖,𝑡
2
𝑖,𝑡
𝑉𝑎𝑟 𝜖𝑖,𝑡

For Financial Professionals. Not for Public Distribution. PROPRIETARY. Permission to reprint or distribute any content from this presentation requires the written approval of S&P Dow Jones Indices.
… BACK TO CORRELATION
15
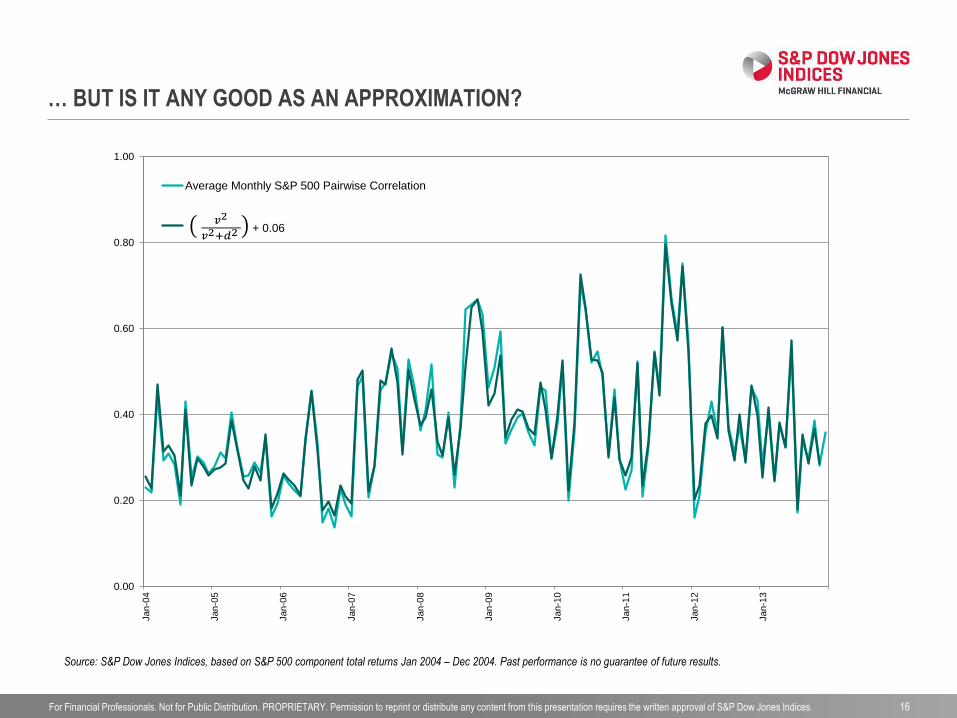
Bringing it all together, the portfolio-weighted average pairwise correlation is approximated by
𝑐 ≈ 𝑣2
𝑣2+𝑑2
which also implies:
(1 − 𝑐) ≈ 𝑑2
𝑣2+𝑑2
where
• c is average pairwise correlation
• v is market volatility
• d is (root-mean-square) average dispersion
… this gives a powerful perspective of the interaction of correlation, volatility and dispersion
Source: S&P Dow Jones Indices. Formulae and charts represent models of securities behavior only, actual performance may differ significantly.
For Financial Professionals. Not for Public Distribution. PROPRIETARY. Permission to reprint or distribute any content from this presentation requires the written approval of S&P Dow Jones Indices.
… BUT IS IT ANY GOOD AS AN APPROXIMATION?
16
0.00
0.20
0.40
0.60
0.80
1.00Jan
-04
Jan
-05
Jan
-06
Jan
-07
Jan
-08
Jan
-09
Jan
-10
Jan
-11
Jan
-12
Jan
-13
Average Monthly S&P 500 Pairwise Correlation
+ 0.06
Source: S&P Dow Jones Indices, based on S&P 500 component total returns Jan 2004 – Dec 2004. Past performance is no guarantee of future results.
For Financial Professionals. Not for Public Distribution. PROPRIETARY. Permission to reprint or distribute any content from this presentation requires the written approval of S&P Dow Jones Indices.
0.0
0.5
1.0
1.5
2.0
2.5
3.0
3.5
4.0
4.5
5.0
Val
ue
of
Co
rrel
atio
n M
ult
iplie
r
Correlation
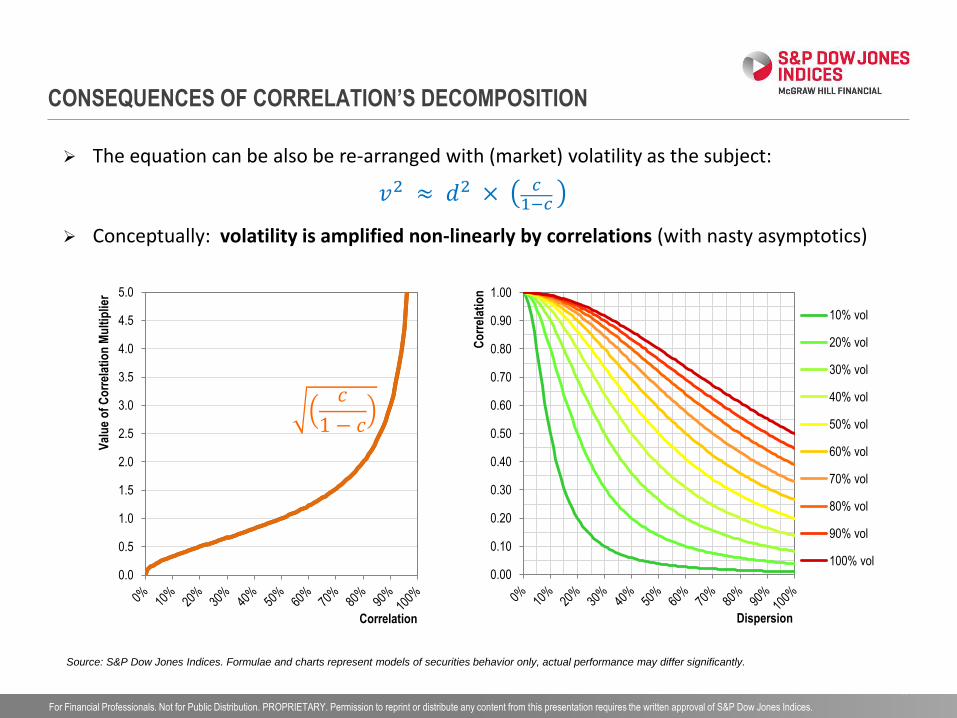
CONSEQUENCES OF CORRELATION’S DECOMPOSITION
17
The equation can be also be re-arranged with (market) volatility as the subject:
𝑣2 ≈ 𝑑2 × 𝑐1−𝑐
Conceptually: volatility is amplified non-linearly by correlations (with nasty asymptotics)
0.00
0.10
0.20
0.30
0.40
0.50
0.60
0.70
0.80
0.90
1.00
Co
rrel
atio
n
Dispersion
10% vol
20% vol
30% vol
40% vol
50% vol
60% vol
70% vol
80% vol
90% vol
100% vol
𝑐
1 − 𝑐
Source: S&P Dow Jones Indices. Formulae and charts represent models of securities behavior only, actual performance may differ significantly.
For Financial Professionals. Not for Public Distribution. PROPRIETARY. Permission to reprint or distribute any content from this presentation requires the written approval of S&P Dow Jones Indices.
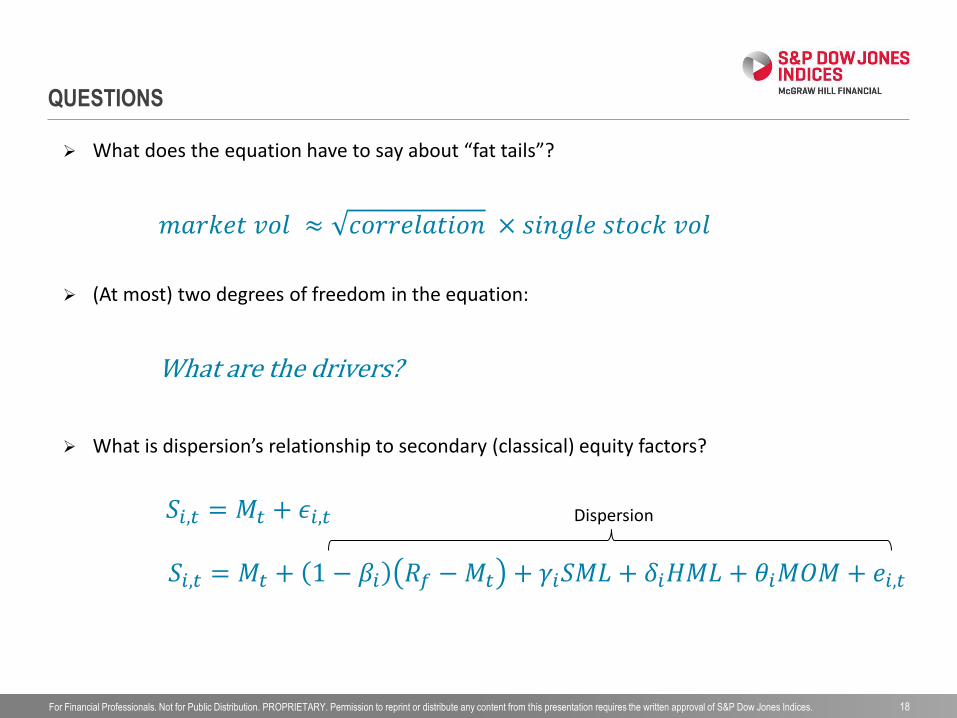
QUESTIONS
18
What does the equation have to say about “fat tails”?
𝑚𝑎𝑟𝑘𝑒𝑡 𝑣𝑜𝑙 ≈ 𝑐𝑜𝑟𝑟𝑒𝑙𝑎𝑡𝑖𝑜𝑛 × 𝑠𝑖𝑛𝑔𝑙𝑒 𝑠𝑡𝑜𝑐𝑘 𝑣𝑜𝑙
(At most) two degrees of freedom in the equation:
What are the drivers?
What is dispersion’s relationship to secondary (classical) equity factors?
𝑆𝑖,𝑡 = 𝑀𝑡 + 𝜖𝑖,𝑡
𝑆𝑖,𝑡 = 𝑀𝑡 + 1 − 𝛽𝑖 𝑅𝑓 −𝑀𝑡 + 𝛾𝑖𝑆𝑀𝐿 + 𝛿𝑖𝐻𝑀𝐿 + 𝜃𝑖𝑀𝑂𝑀 + 𝑒𝑖,𝑡
Dispersion
For Financial Professionals. Not for Public Distribution. PROPRIETARY. Permission to reprint or distribute any content from this presentation requires the written approval of S&P Dow Jones Indices.
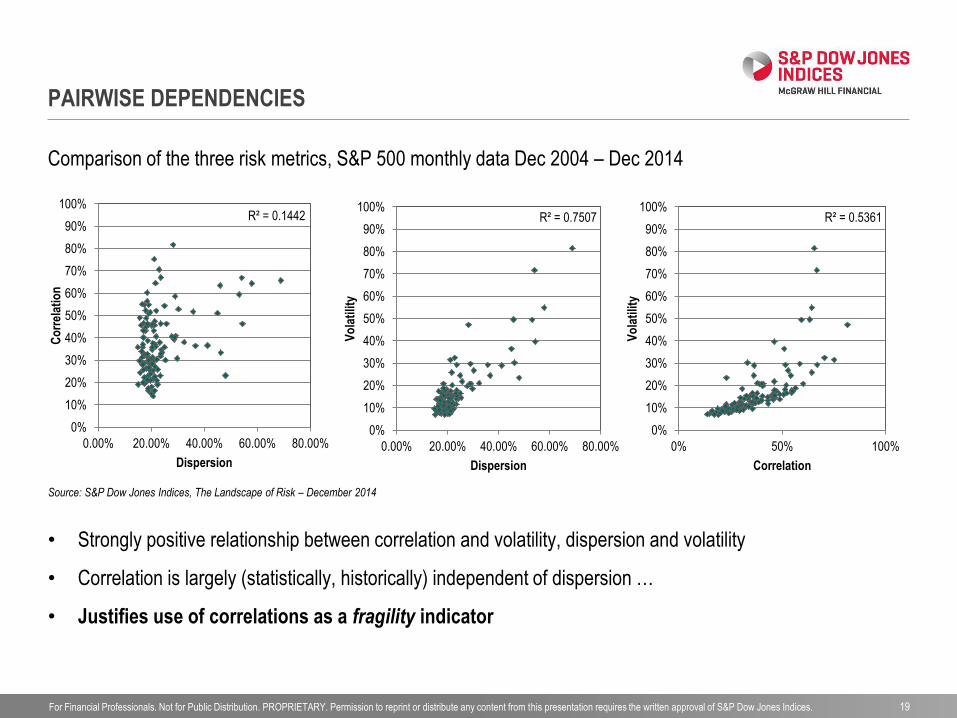
PAIRWISE DEPENDENCIES
19
Source: S&P Dow Jones Indices, The Landscape of Risk – December 2014
R² = 0.1442
0%
10%
20%
30%
40%
50%
60%
70%
80%
90%
100%
0.00% 20.00% 40.00% 60.00% 80.00%
Co
rrel
atio
n
Dispersion
R² = 0.5361
0%
10%
20%
30%
40%
50%
60%
70%
80%
90%
100%
0% 50% 100%
Vo
lati
lity
Correlation
R² = 0.7507
0%
10%
20%
30%
40%
50%
60%
70%
80%
90%
100%
0.00% 20.00% 40.00% 60.00% 80.00%
Vo
lati
lity
Dispersion
Comparison of the three risk metrics, S&P 500 monthly data Dec 2004 – Dec 2014
• Strongly positive relationship between correlation and volatility, dispersion and volatility
• Correlation is largely (statistically, historically) independent of dispersion …
• Justifies use of correlations as a fragility indicator

For Financial Professionals. Not for Public Distribution. PROPRIETARY. Permission to reprint or distribute any content from this presentation requires the written approval of S&P Dow Jones Indices.
DISPERSION AND CLASSICAL FACTORS
20
• Expect dispersion to relate (fairly simply) to rewards from stock-picking skill
• Intuitive relationship with momentum (esp. relative)
• Derived relationship with returns rebalancing (esp. equal weight portfolios)
• Contraction of dispersion in valuations is one cause of value-stock outperformance

For Financial Professionals. Not for Public Distribution. PROPRIETARY. Permission to reprint or distribute any content from this presentation requires the written approval of S&P Dow Jones Indices.
ASIDE: U.S. EQUITY MANAGERS & DISPERSION
Source: S&P Dow Jones Indices’ SPIVA scorecards (“S&P Index Versus Active”). Data for 2007 are to March end; all other years are full calendar years. Charts are provided for
illustrative purposes. Past performance is no guarantee of future results.
Annual Interquartile Range of U.S. Large-Cap Active Funds vs. S&P 500 Average Monthly Dispersion
“Good” managers performed better in relative terms when dispersion was high
0%
2%
4%
6%
8%
10%
12%
2003 2004 2005 2006 2007 2008 2009 2010 2011 2012 2013
Per
cen
t
Performance Spread: top quartile to bottom quartile funds S&P 500 average monthly dispersion

For Financial Professionals. Not for Public Distribution. PROPRIETARY. Permission to reprint or distribute any content from this presentation requires the written approval of S&P Dow Jones Indices.
DISPERSION AND REBALANCING/MOMENTUM
22
Illustrative purposes only. Source: S&P Dow Jones Indices.
• “Reversion to the mean” should accompany a tightening of dispersion among stock
performances, while widening performance differentials could accompany momentum effects
• Appropriate time horizons defined by rebalance frequency:
3 months: “short term” dispersion (rebalancing frequency of EQW)
6 - 9 months: Period of rebalancing effect
“Long term” dispersion

For Financial Professionals. Not for Public Distribution. PROPRIETARY. Permission to reprint or distribute any content from this presentation requires the written approval of S&P Dow Jones Indices.
MOMENTUM & REBALANCING
23
• Equal Weight and Momentum have directly opposing outperformance
12M Outperformance (TR) Outperformance Accumulation
Source: S&P Dow Jones Indices as of March 2015. All index performances are total return in EUR, outperformance shown with respect to the S&P Europe 350 total return index. Past
performance is no guarantee of future results. These charts may reflect hypothetical historical performance. Please see the Performance Disclosure at the end of this document for
more information regarding the inherent limitations associated with index performance, including any back-tested returns.
-10%
0%
10%
20%
30%
40%
50%
Sep 2
001
Sep 2
002
Sep 2
003
Sep 2
004
Sep 2
005
Sep 2
006
Sep 2
007
Sep 2
008
Sep 2
009
Sep 2
010
Sep 2
011
Sep 2
012
Sep 2
013
Sep 2
014
S&P Europe 350 Equal Weight
S&P Europe 350 Momentum
R² = 0.3634
-20%
-15%
-10%
-5%
0%
5%
10%
15%
20%
-10% 0% 10% 20%S
&P
Eur
ope
350
Mom
entu
m 1
2M
Out
perf
orm
ance
S&P Europe 350 Equal Weight 12M Outperformance
For Financial Professionals. Not for Public Distribution. PROPRIETARY. Permission to reprint or distribute any content from this presentation requires the written approval of S&P Dow Jones Indices.
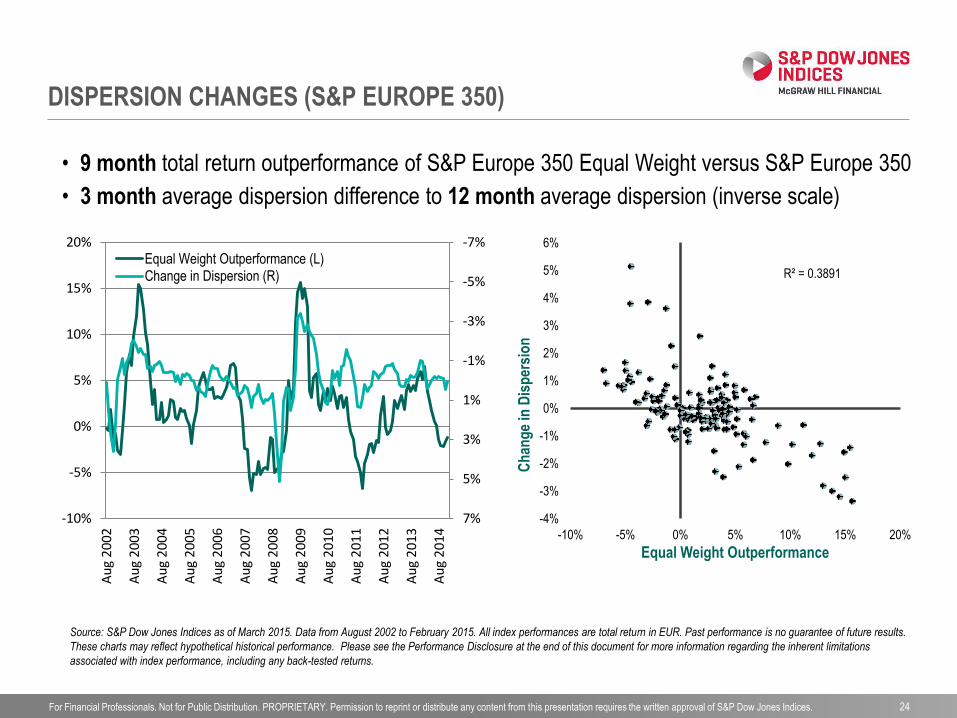
DISPERSION CHANGES (S&P EUROPE 350)
24
• 9 month total return outperformance of S&P Europe 350 Equal Weight versus S&P Europe 350
• 3 month average dispersion difference to 12 month average dispersion (inverse scale)
Source: S&P Dow Jones Indices as of March 2015. Data from August 2002 to February 2015. All index performances are total return in EUR. Past performance is no guarantee of future results.
These charts may reflect hypothetical historical performance. Please see the Performance Disclosure at the end of this document for more information regarding the inherent limitations
associated with index performance, including any back-tested returns.
-7%
-5%
-3%
-1%
1%
3%
5%
7%-10%
-5%
0%
5%
10%
15%
20%
Au
g 2
002
Au
g 2
003
Au
g 2
004
Au
g 2
005
Au
g 2
006
Au
g 2
007
Au
g 2
008
Au
g 2
009
Au
g 2
010
Au
g 2
011
Au
g 2
012
Au
g 2
013
Au
g 2
014
Equal Weight Outperformance (L)Change in Dispersion (R) R² = 0.3891
-4%
-3%
-2%
-1%
0%
1%
2%
3%
4%
5%
6%
-10% -5% 0% 5% 10% 15% 20%C
han
ge
in D
isp
ersi
on
Equal Weight Outperformance
For Financial Professionals. Not for Public Distribution. PROPRIETARY. Permission to reprint or distribute any content from this presentation requires the written approval of S&P Dow Jones Indices.
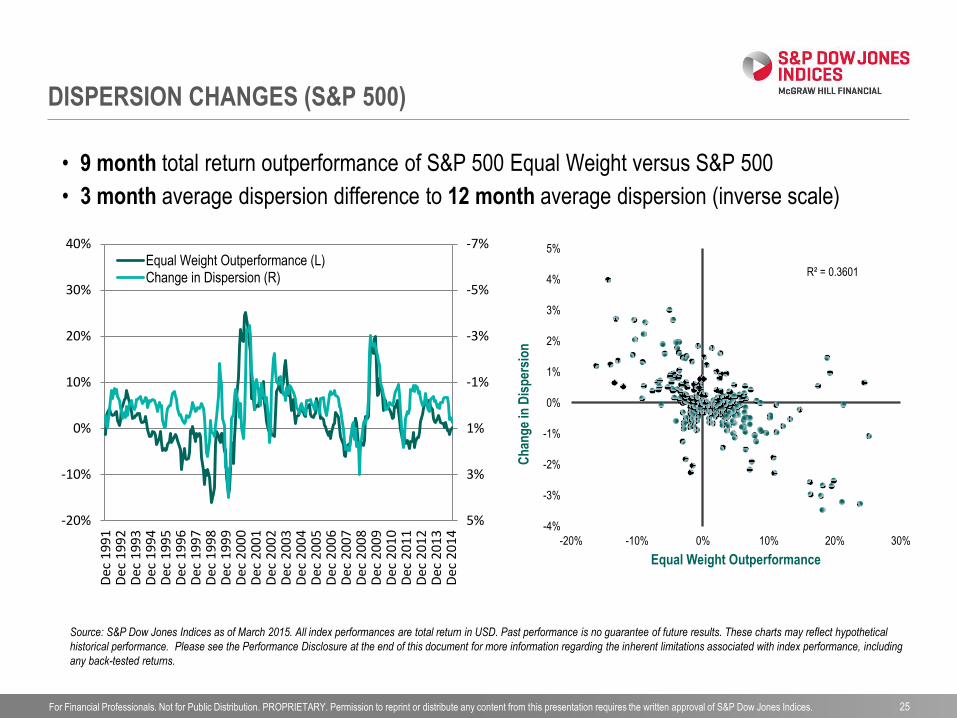
DISPERSION CHANGES (S&P 500)
25
• 9 month total return outperformance of S&P 500 Equal Weight versus S&P 500
• 3 month average dispersion difference to 12 month average dispersion (inverse scale)
-7%
-5%
-3%
-1%
1%
3%
5%-20%
-10%
0%
10%
20%
30%
40%
Dec
199
1D
ec 1
992
Dec
199
3D
ec 1
994
Dec
199
5D
ec 1
996
Dec
199
7D
ec 1
998
Dec
199
9D
ec 2
000
Dec
200
1D
ec 2
002
Dec
200
3D
ec 2
004
Dec
200
5D
ec 2
006
Dec
200
7D
ec 2
008
Dec
200
9D
ec 2
010
Dec
201
1D
ec 2
012
Dec
201
3D
ec 2
014
Equal Weight Outperformance (L)Change in Dispersion (R) R² = 0.3601
-4%
-3%
-2%
-1%
0%
1%
2%
3%
4%
5%
-20% -10% 0% 10% 20% 30%
Ch
ang
e in
Dis
per
sio
n
Equal Weight Outperformance
Source: S&P Dow Jones Indices as of March 2015. All index performances are total return in USD. Past performance is no guarantee of future results. These charts may reflect hypothetical
historical performance. Please see the Performance Disclosure at the end of this document for more information regarding the inherent limitations associated with index performance, including
any back-tested returns.

For Financial Professionals. Not for Public Distribution. PROPRIETARY. Permission to reprint or distribute any content from this presentation requires the written approval of S&P Dow Jones Indices.
DISPERSION AND VALUE
26
• Intuition: dispersion in valuations (e.g. P/E ratios) is related to dispersion in prices
• Suggests: increasing dispersion favours growth, while decreasing dispersion favours value
• S&P’s original value/growth series weights by market cap: mitigating size and rebalance effects
0%
100%
200%
300%
400%
500%
600%
700%
800%
Mar
1994
Mar
1995
Mar
1996
Mar
1997
Mar
1998
Mar
1999
Mar
2000
Mar
2001
Mar
2002
Mar
2003
Mar
2004
Mar
2005
Mar
2006
Mar
2007
Mar
2008
Mar
2009
Mar
2010
Mar
2011
Mar
2012
Mar
2013
Mar
2014
Mar
2015
S&P 500 Value
S&P 500 Growth
S&P 500
Source: S&P Dow Jones Indices as of March 2015. All index performances are total return in USD. Past performance is no guarantee of future results.
For Financial Professionals. Not for Public Distribution. PROPRIETARY. Permission to reprint or distribute any content from this presentation requires the written approval of S&P Dow Jones Indices.
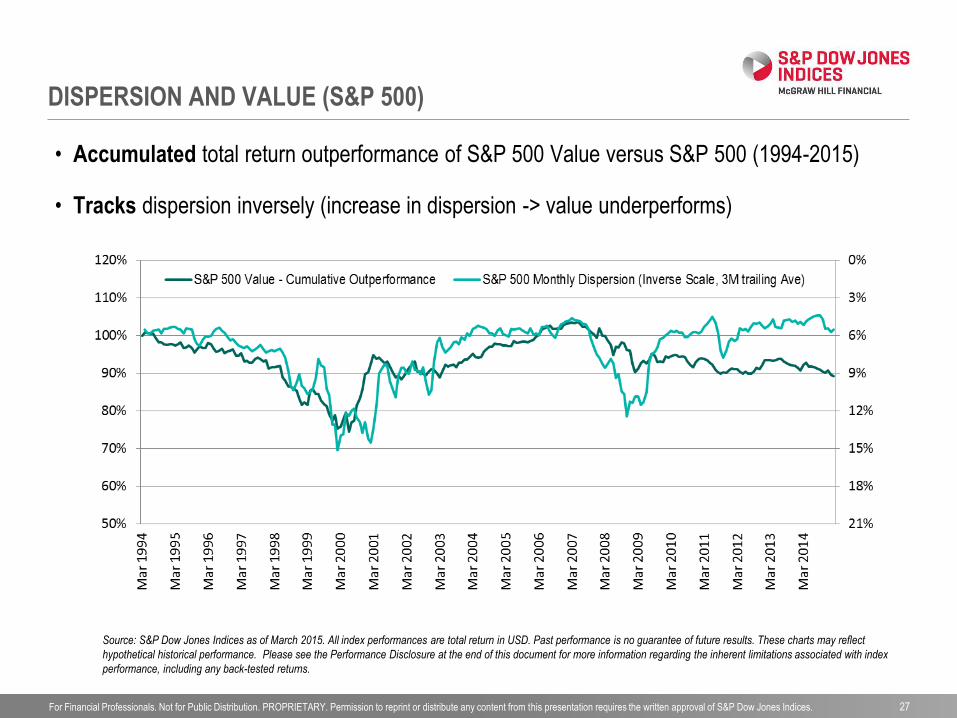
DISPERSION AND VALUE (S&P 500)
27
• Accumulated total return outperformance of S&P 500 Value versus S&P 500 (1994-2015)
• Tracks dispersion inversely (increase in dispersion -> value underperforms)
Source: S&P Dow Jones Indices as of March 2015. All index performances are total return in USD. Past performance is no guarantee of future results. These charts may reflect
hypothetical historical performance. Please see the Performance Disclosure at the end of this document for more information regarding the inherent limitations associated with index
performance, including any back-tested returns.
For Financial Professionals. Not for Public Distribution. PROPRIETARY. Permission to reprint or distribute any content from this presentation requires the written approval of S&P Dow Jones Indices.
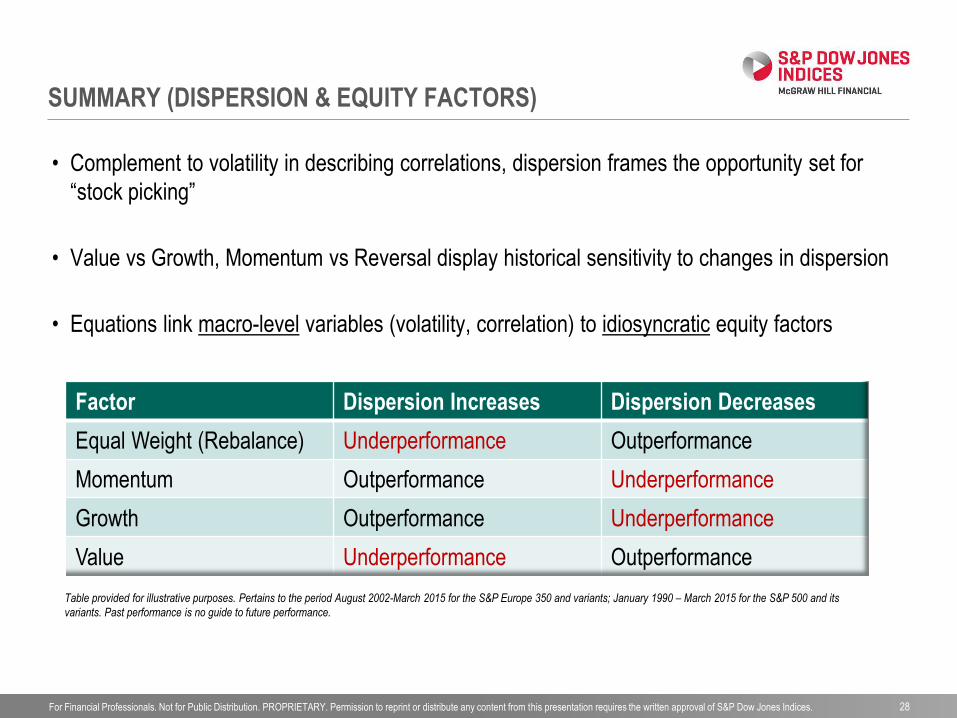
SUMMARY (DISPERSION & EQUITY FACTORS)
28
Factor Dispersion Increases Dispersion Decreases
Equal Weight (Rebalance) Underperformance Outperformance
Momentum Outperformance Underperformance
Growth Outperformance Underperformance
Value Underperformance Outperformance
Table provided for illustrative purposes. Pertains to the period August 2002-March 2015 for the S&P Europe 350 and variants; January 1990 – March 2015 for the S&P 500 and its
variants. Past performance is no guide to future performance.
• Complement to volatility in describing correlations, dispersion frames the opportunity set for
“stock picking”
• Value vs Growth, Momentum vs Reversal display historical sensitivity to changes in dispersion
• Equations link macro-level variables (volatility, correlation) to idiosyncratic equity factors

For Financial Professionals. Not for Public Distribution. PROPRIETARY. Permission to reprint or distribute any content from this presentation requires the written approval of S&P Dow Jones Indices.
TRADING DISPERSION (BRIEF INTRO)
29
• Via single stock vs index options & variance
d2 ≈ Ave Single Stock var – Index var (mkt-weighted)
• Nothing special about the “market” weighting used to derive the correlation equations,
tradeable as long as options exist on the basket & components:
Stocks vs Index Size vs Broad Global Sectors
Stocks vs Sector U.S. vs Global Other Assets
Sectors vs Index Spread trades Currencies
• Benchmark similar to VIX®, providing market-implied dispersion, is feasible, if not
simple.
For Financial Professionals. Not for Public Distribution. PROPRIETARY. Permission to reprint or distribute any content from this presentation requires the written approval of S&P Dow Jones Indices.
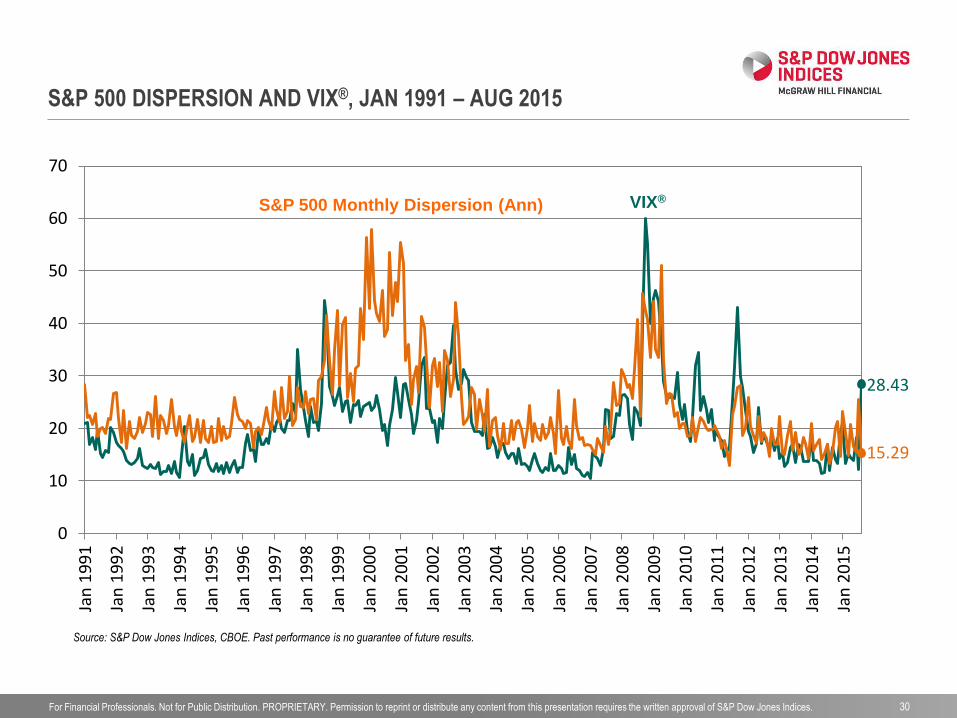
28.43
15.29
0
10
20
30
40
50
60
70
Jan
19
91
Jan
19
92
Jan
19
93
Jan
19
94
Jan
19
95
Jan
19
96
Jan
19
97
Jan
19
98
Jan
19
99
Jan
20
00
Jan
20
01
Jan
20
02
Jan
20
03
Jan
20
04
Jan
20
05
Jan
20
06
Jan
20
07
Jan
20
08
Jan
20
09
Jan
20
10
Jan
20
11
Jan
20
12
Jan
20
13
Jan
20
14
Jan
20
15
30
S&P 500 Monthly Dispersion (Ann) VIX®
S&P 500 DISPERSION AND VIX®, JAN 1991 – AUG 2015
Source: S&P Dow Jones Indices, CBOE. Past performance is no guarantee of future results.

For Financial Professionals. Not for Public Distribution. PROPRIETARY. Permission to reprint or distribute any content from this presentation requires the written approval of S&P Dow Jones Indices.
PERFORMANCE DISCLOSURE
31
The S&P 500 Equal Weight Index was launched on Jan. 9, 2003. S&P Europe 350 Momentum Index was launched on Nov 18, 2014. The S&P Europe 350 Index was launched on
Oct 7, 1998. The S&P Europe 350 Equal Weight Index was launched on Jan. 21, 2014. The S&P Emerging BMI was launched on Dec 31, 1997. All information on each index
presented prior to the launch date is back-tested. Back-tested performance is not actual performance, but is hypothetical. The back-test calculations are based on the same
methodology that was in effect when each index was officially launched. Complete index methodology details are available at www.spdji.com. It is not possible to invest directly in
an index.
S&P Dow Jones Indices defines various dates to assist our clients in providing transparency on their products. The First Value Date is the first day for which there is a calculated
value (either live or back-tested) for a given index. The Base Date is the date at which the Index is set at a fixed value for calculation purposes. The Launch Date designates the
date upon which the values of an index are first considered live: index values provided for any date or time period prior to the index’s Launch Date are considered back-tested. S&P
Dow Jones Indices defines the Launch Date as the date by which the values of an index are known to have been released to the public, for example via the company’s public
website or its datafeed to external parties. For Dow Jones-branded indicates introduced prior to May 31, 2013, the Launch Date (which prior to May 31, 2013, was termed “Date of
introduction”) is set at a date upon which no further changes were permitted to be made to the index methodology, but that may have been prior to the Index’s public release date.
Past performance of the Index is not an indication of future results. Prospective application of the methodology used to construct the Index may not result in performance
commensurate with the back-test returns shown. The back-test period does not necessarily correspond to the entire available history of the Index. Please refer to the methodology
paper for the Index, available at www.spdji.com for more details about the index, including the manner in which it is rebalanced, the timing of such rebalancing, criteria for additions
and deletions, as well as all index calculations.
Another limitation of using back-tested information is that the back-tested calculation is generally prepared with the benefit of hindsight. Back-tested information reflects the
application of the index methodology and selection of index constituents in hindsight. No hypothetical record can completely account for the impact of financial risk in actual trading.
For example, there are numerous factors related to the equities, fixed income, or commodities markets in general which cannot be, and have not been accounted for in the
preparation of the index information set forth, all of which can affect actual performance.
The Index returns shown do not represent the results of actual trading of investable assets/securities. S&P Dow Jones Indices LLC maintains the Index and calculates the Index
levels and performance shown or discussed, but does not manage actual assets. Index returns do not reflect payment of any sales charges or fees an investor may pay to
purchase the securities underlying the Index or investment funds that are intended to track the performance of the Index. The imposition of these fees and charges would cause
actual and back-tested performance of the securities/fund to be lower than the Index performance shown. As a simple example, if an index returned 10% on a US $100,000
investment for a 12-month period (or US $10,000) and an actual asset-based fee of 1.5% was imposed at the end of the period on the investment plus accrued interest (or US
$1,650), the net return would be 8.35% (or US $8,350) for the year. Over a three year period, an annual 1.5% fee taken at year end with an assumed 10% return per year would
result in a cumulative gross return of 33.10%, a total fee of US $5,375, and a cumulative net return of 27.2% (or US $27,200).

For Financial Professionals. Not for Public Distribution. PROPRIETARY. Permission to reprint or distribute any content from this presentation requires the written approval of S&P Dow Jones Indices.
GENERAL DISCLAIMER
32
Copyright © 2015 by S&P Dow Jones Indices LLC, a part of McGraw Hill Financial. All rights reserved. S&P, S&P 500, S&P MidCap 400, S&P SmallCap 600, S&P GSCI, S&P Europe 350, S&P
Composite1500 and STANDARD & POOR’S are registered trademarks of Standard & Poor’s Financial Services LLC (“S&P”), a subsidiary of McGraw Hill Financial, Inc. Dow Jones is a registered
trademark of Dow Jones Trademark Holdings LLC (“Dow Jones”). Trademarks have been licensed to S&P Dow Jones Indices LLC. Redistribution, reproduction and/or photocopying in whole or in
part are prohibited without written permission. This document does not constitute an offer of services in jurisdictions where S&P Dow Jones Indices LLC, Dow Jones, S&P or their respective affiliates
(collectively “S&P Dow Jones Indices”) do not have the necessary licenses. All information provided by S&P Dow Jones Indices is impersonal and not tailored to the needs of any person, entity or
group of persons. S&P Dow Jones Indices receives compensation in connection with licensing its indices to third parties. Past performance of an index is not a guarantee of future results.
It is not possible to invest directly in an index. Exposure to an asset class represented by an index is available through investable instruments based on that index. S&P Dow Jones Indices does not
sponsor, endorse, sell, promote or manage any investment fund or other investment vehicle that is offered by third parties and that seeks to provide an investment return based on the performance of
any index. S&P Dow Jones Indices makes no assurance that investment products based on the index will accurately track index performance or provide positive investment returns. S&P Dow Jones
Indices LLC is not an investment advisor, and S&P Dow Jones Indices makes no representation regarding the advisability of investing in any such investment fund or other investment vehicle. A
decision to invest in any such investment fund or other investment vehicle should not be made in reliance on any of the statements set forth in this document. Prospective investors are advised to
make an investment in any such fund or other vehicle only after carefully considering the risks associated with investing in such funds, as detailed in an offering memorandum or similar document
that is prepared by or on behalf of the issuer of the investment fund or other vehicle. Inclusion of a security within an index is not a recommendation by S&P Dow Jones Indices to buy, sell, or hold
such security, nor is it considered to be investment advice. Closing prices for S&P US benchmark indices and Dow Jones US benchmark indices are calculated by S&P Dow Jones Indices based on
the closing price of the individual constituents of the index as set by their primary exchange. Closing prices are received by S&P Dow Jones Indices from one of its third party vendors and verified by
comparing them with prices from an alternative vendor. The vendors receive the closing price from the primary exchanges.
These materials have been prepared solely for informational purposes based upon information generally available to the public and from sources believed to be reliable. No content contained in
these materials (including index data, ratings, credit-related analyses and data, research, valuations, model, software or other application or output therefrom) or any part thereof (Content) may be
modified, reverse-engineered, reproduced or distributed in any form or by any means, or stored in a database or retrieval system, without the prior written permission of S&P Dow Jones Indices. The
Content shall not be used for any unlawful or unauthorized purposes. S&P Dow Jones Indices and its third-party data providers and licensors (collectively “S&P Dow Jones Indices Parties”) do not
guarantee the accuracy, completeness, timeliness or availability of the Content. S&P Dow Jones Indices Parties are not responsible for any errors or omissions, regardless of the cause, for the
results obtained from the use of the Content. THE CONTENT IS PROVIDED ON AN “AS IS” BASIS. S&P DOW JONES INDICES PARTIES DISCLAIM ANY AND ALL EXPRESS OR IMPLIED
WARRANTIES, INCLUDING, BUT NOT LIMITED TO, ANY WARRANTIES OF MERCHANTABILITY OR FITNESS FOR A PARTICULAR PURPOSE OR USE, FREEDOM FROM BUGS, SOFTWARE
ERRORS OR DEFECTS, THAT THE CONTENT’S FUNCTIONING WILL BE UNINTERRUPTED OR THAT THE CONTENT WILL OPERATE WITH ANY SOFTWARE OR HARDWARE
CONFIGURATION. In no event shall S&P Dow Jones Indices Parties be liable to any party for any direct, indirect, incidental, exemplary, compensatory, punitive, special or consequential damages,
costs, expenses, legal fees, or losses (including, without limitation, lost income or lost profits and opportunity costs) in connection with any use of the Content even if advised of the possibility of such
damages.
S&P Dow Jones Indices keeps certain activities of its business units separate from each other in order to preserve the independence and objectivity of their respective activities. As a result, certain
business units of S&P Dow Jones Indices may have information that is not available to other business units. S&P Dow Jones Indices has established policies and procedures to maintain the
confidentiality of certain non-public information received in connection with each analytical process.
In addition, S&P Dow Jones Indices provides a wide range of services to, or relating to, many organizations, including issuers of securities, investment advisers, broker-dealers, investment banks,
other financial institutions and financial intermediaries, and accordingly may receive fees or other economic benefits from those organizations, including organizations whose securities or services
they may recommend, rate, include in model portfolios, evaluate or otherwise address.
CBOE, CBOE Volatility Index and VIX are registered trademarks of Chicago Board Options Exchange, Incorporated (CBOE). CBOE has granted S&P Dow Jones Indices a license to use the VIX
methodology to create a variety of volatility indices.

For Financial Professionals. Not for Public Distribution. PROPRIETARY. Permission to reprint or distribute any content from this presentation requires the written approval of S&P Dow Jones Indices. 33
THANK YOU
Tim Edwards