correlation of the real-time particulate matter emissions ... · pdf fileicat grant no. 06-02:...
TRANSCRIPT
ICAT Grant No. 06-02: FINAL REPORT
CORRELATION OF the REAL-TIME PARTICULATE MATTER EMISSIONS MEASUREMENTS of a ESP REMOTE SENSING DEVICE (RSD) and a DEKATI
ELECTRONIC TAILPIPE SENSOR (ETaPS) with GRAVIMETRICALLY MEASURED PM from a TOTAL
EXHAUST DILUTION TUNNEL SYSTEM
Principal Investigators:
Mridul Gautam, Ph.D. (304) 293-5913 (voice), (304) 293-7498 (fax)
Department of Mechanical and Aerospace Engineering West Virginia University Donald Stedman, Ph.D.
(303) 871-2580 (voice) (303) 871-2587 (fax) Department of Chemistry University of Denver
Co-Principal Investigators:
WVU: Daniel Carder, Benjamin Shade, Nigel Clark, Gregory Thompson, Scott Wayne
DU: Gary Bishop, Brent Schuchmann, Dan Pope ESP: Niranjan Vescio, Gary Full, Peter McClintock, Drew Rau
Prepared for:
John Collins California Air Resources Board
Sacramento, CA 95814
Prepared by: Donald H. Stedman
March 26, 2010
Conducted under a grant by the California Air Resources Board of the California Environmental
Protection Agency
The statements and conclusions in this report are those of the grantee and not necessarily those of the California Air Resources Board. The mention of commercial products, their source, or their use in
connection with material reported herein is not to be construed as actual or implied endorsement of such products.
2
Acknowledgments This study owes thanks to the California Air Resources Board, the Innovative Clean Air Technologies, the University of Denver and West Virginia University for their time, effort, advisement, and monetary contributions. This study also thanks ESP and Dekati Ltd. for supplying the instruments used in the testing phase. This report was submitted under Innovative Clean Air Technologies grant number 06-02 from the California Air Resources Board.
3
Table of Contents Abstract ................................................................................................. 5 Introduction........................................................................................... 6 Innovative Technology .......................................................................... 6 Summary ............................................................................................... 7 1. Introduction and Experimental ....................................................... 9
1.1. Mounting an ETaPS on a Modern Truck .................................................................... 10 1.2. Experiments at the WVU facility in WV ...................................................................... 11
2. Preliminary ETaPS Results from Denver ..................................... 13
2.1. Power line Interference ................................................................................................. 16 2.2. ETaPS versus RSD Data ............................................................................................... 20
3. ETaPS Data from West Virginia.................................................... 21
3.1. Post 2007 Results ........................................................................................................... 25 3.2. Post 2007 Results Excluding the 2008 Volvo B ............................................................ 26 3.3. 2008 Volvo B Outlier..................................................................................................... 31 3.4. Pre 2007 and Post 2007 Results 14 of the 15 trucks (excluding 2008 Volvo B) ........... 32 3.5. ETaPS VS CO2 ............................................................................................................. 37 3.6. Integral ETaPS VS Integral TEOM ............................................................................. 41 3.7. RSD VS Gravimetric .................................................................................................... 42 3.8. Power line Interference on ETaPS output baseline ..................................................... 45 3.9. ETaPS, UV and IR Precision ........................................................................................ 47 3.10 Emissions Data Collected................................................................................................ 51
4. Test Vehicles..................................................................................... 51 Status of Technology............................................................................ 51 Appendix A .......................................................................................... 52 List of Figures 1.1 RSD Distributions of DPF and non-DPF Trucks…………………………………....... 8 1.2 Mounting ETaPS on Modern Truck…………………………………………………. 10 1.3 Mounting ETaPS on Modern Truck……………………...…………………….……. 10 1.4 Map of Westover, WV………………………………………………………………… 12 2.1 ETaPS on Diesel Caterpillar……………………………...……………………….….. 13 2.2 ETaPS readings of Caterpillar...................................................................................... 14 2.3 ETaPS on Winnebago…………………………………...…………………….………. 14 2.4 ETaPS on Winnebago…………………………………...…………………….………. 15 2.5 ETaPS readings of Winnebago………………………...…………………….……….. 15
4
2.6 Power line Interference on ETaPS...………………………………………….……… 16 2.7 ETaPS readings for three runs of one truck………………………………………… 17 2.8 ETaPS Signals of Four DPF Trucks…………………………………………………. 18 2.9 DPF equipped Penske Truck…………………………………………………………. 18 2.10 Penske Dyno Cruise Test……………………………………………………………… 19 2.11 Penske Dyno Step Test……………………………………………………...………… 19 2.12 ETaPS vs. UV smoke………………………………………………………………….. 21 3.1 Pictures of Setup………………………………………………………………………. 24 3.2 Post 2007 Vehicle Results……………………………………………………………... 25 3.3 Post 2007 Vehicle Results……………………………………………………………... 26 3.4 Post 2007 Vehicle Results……………………………………………………………... 27 3.5 Post 2007 Vehicle Results……………………………………………………………... 28 3.6 2008 Volvo B Outlier...................................................................................................... 31 3.7 Results for All Trucks.....………………………………………………………….…... 32 3.8 Results by Vehicle Type………………………………………………………….……. 33 3.9 Results by Driving Cycle................................................................................................ 35 3.10 CO2 Comparison............................................................................................................. 38 3.11 CO2 Comparison............................................................................................................. 39 3.12 CO2 Comparison............................................................................................................. 40 3.13 ETaPS vs. TEOM............................................................................................................ 41 3.14 RSD vs. Gravimetric....................................................................................................... 42 3.15 Histogram of RSD Readings.......................................................................................... 44 3.16 Normalized Histogram of RSD Readings..................................................................... 45 3.17 Shielding Effects on ETaPS Readings........................................................................... 46 3.18 ETaPS vs. Gravimetric Variability by Vehicle............................................................ 48 3.19 ETaPS vs. Gravimetric Variability by Cycle............................................................... 49 3.20 ETaPS Variability on DPF Trucks................................................................................ 49 3.21 IR Smoke vs. Gravimetric.............................................................................................. 50 3.22 UV Smoke vs. Gravimetric............................................................................................. 50 A1 UDDS Cycle..................................................................................................................... 58 A2 Cruise Cycle..................................................................................................................... 59 A3 Acceleration Cycle.......................................................................................................... 60
List of Tables 3.1 Number of runs for each test vehicle……………………………..………….……….. 22 3.2 Averaged data for each test vehicle………………………………..……….………… 23 4.1 Vehicle Test Weights....................................................................................................... 51 A1 Summary of Tested ICAT Vehicles............................................................................... 52 A2 Complete Emissions table for all vehicles..................................................................... 53 A3 All RSD Smoke Readings............................................................................................... 56
5
Abstract
The University of Denver spent six weeks in West Virginia measuring diesel particles from 15 heavy duty diesel trucks with an Electrical Tailpipe Particle Sensor (ETaPS) and correlating the results with a RSD 4600 (supplied by ESP) and a gravimetric filter from a chassis dynamometer. The ETaPS is an electrical charger, placed directly in raw exhaust, and measures particles based on their active surface area. The use of a diesel particle filter (DPF) was implemented in three different ways. Five trucks were installed with a functioning DPF, five trucks were installed with bypassed DPF to simulate a failing DPF, and the last five trucks had no DPF. The University of Denver found that ETaPS (volt*sec/mile also Vs/mi) correlates well with to gravimetric readings (gm/mile) except for one truck. Probably the expected disagreement with semi-volatiles indicated by high HC readings from said truck. Functioning DPFs produce typical ETaPS readings of 2volt*sec/mile while readings of 20volt*sec/mile, or more, indicate either a failing DPF or an absent DPF. An ETaPS can be mounted on a real truck and be ready to drive in real-world conditions in ten minutes or less. Any outdoors testing with an ETaPS must be in a shielded environment as there is significant interference from other power sources (i.e. power lines, and transformers). RSD smoke factor readings above 0.15 (1.5gm of soot/kg of fuel) certainly indicate a malfunctioning DPF.
6
Introduction
This is the final submission providing the results and conclusions towards ICAT grant number 06-02. The sections herein describe the testing process of the ETaPS as an in-use diesel inspection technology and its correlations are determined to RSD and gravimetric tests. The sensitivity of the instrument was found to be adequate to distinguish DPF from even minor DPF failures. Interference problems are also discussed.
Innovative Technology
The Electric Tailpipe Particle Sensor (ETaPS) measures particulate matter in raw exhaust by measuring the current loss in a corona as the particles pass through. The ETaPS reports an analog signal (0-10V) proportional to the surface area of the particles. This technology has unique applications in the field of detection and classification of high emitting PM HDDVs. Since the ETaPS is placed in the raw exhaust, no additional equipment is needed. It is small, light-weight and inexpensive compared to the standard methods of emission testing for HDDVs (i.e. dynamometer testing). This study shows that, under optimum conditions, the ETaPS can fully discriminate between HDDVs with functioning DPF systems and HDDVs with simulated failed DPF systems where the gravimetric tests could not fully discriminate.
7
ICAT Project Summary This ICAT project involved comparing particle mass (PM) emission measurements from a commercially available Remote Sensing Device (RSD; Environmental Systems Products RSD4600), a commercially available Exhaust Tailpipe Particle Sensor (ETaPS; Dekati Finland), and a federal reference method gravimetric filter measurements on Heavy Duty Diesel Vehicles (HDDV). A system was developed to easily field mount and dismount a wide range oxygen sensor and the ETaPS together with its air pump, power supply, 110V generator and data acquisition system. The oxygen sensor provides an indirect measure of load/fuel use, and the ETaPS provides a measure of PM. The ETaPS was mounted directly in the exhaust flow without tailpipe connections or shielding because this “open” arrangement provides the most rapid mounting capability. Preliminary tests conducted at University of Denver were promising. The ETaPS system and the RSD4600 were moved to the West Virginia University’s (WVU) HDDV dynamometer facility in Westover WV for collection of gravimetric filter measurements. Testing at WVU was conducted in two phases. Phase 1 involved five HDDV vehicles without diesel Particulate Filters (DPF): four truck tractors and one bus. The ETaPS system and oxygen sensor were easily mounted on each test vehicles and the vehicles were driven past the RSD just outside the dynamometer facility using several different driving modes, speeds and loads. The ETaPS gave generally large signals, as expected since these were not DPF-equipped vehicles, but the signals were more variable than expected. These vehicles were next tested on the dynamometer over several different cycles (three UDDS, three cruises and one acceleration cycle each) with the ETaPS monitoring the exhaust stream just upstream of the dilution tunnel entrance. Complete exhaust gas measurements, a gravimetric result and continuous Tapered Element Oscillating Microbalance (TEOM) data were obtained by WVU. In Phase 2, ten additional vehicle configurations were subjected to the same test program described above. The ten configurations included five DPF-equipped, modern HDDV (four tractors and one bus), and the same five HDDV equipped with a partial DPF bypass to simulate a partial DPF failure. Investigation of the variability in outdoor ETaPS signals showed that overhead power lines were interfering with the ETaPS in its truck-mounted, open configuration. The data from outdoor ETaPS comparisons with RSD had to be discarded. When the ETaPS is installed inside the pipe connector supplied by Dekati, the interference is prevented. However, this was not discovered until after outdoor tests were completed. The available data to analyze consisted of the dynamometer ETaPS, oxygen and gravimetric data and the outdoor RSD readings, but no outdoor ETaPS. The ETaPS-gravimetric comparison shows that all cycles for DPF equipped trucks average about 1Vs/mi. ETaPS readings for bypassed and older truck cycles vary with truck and driving mode, ranging from 8 to 390 Vs/mi, typically about 100Vs/mi. The ETaPS results correlate with the HDDV gravimetric results. Regression of dynamometer ETaPS data against gravimetric mass gave a correlation r2 of 0.64 with intercept forced through zero. A correlation of 0.80 was obtained (97 data points) when one outlier truck was removed. ETaPS readings showed a difference in signal by a factor of 5 between DPF equipped trucks and non-DPF trucks, demonstrating that ETaPS can detect DPF failure. The outlier truck that did not fit this
8
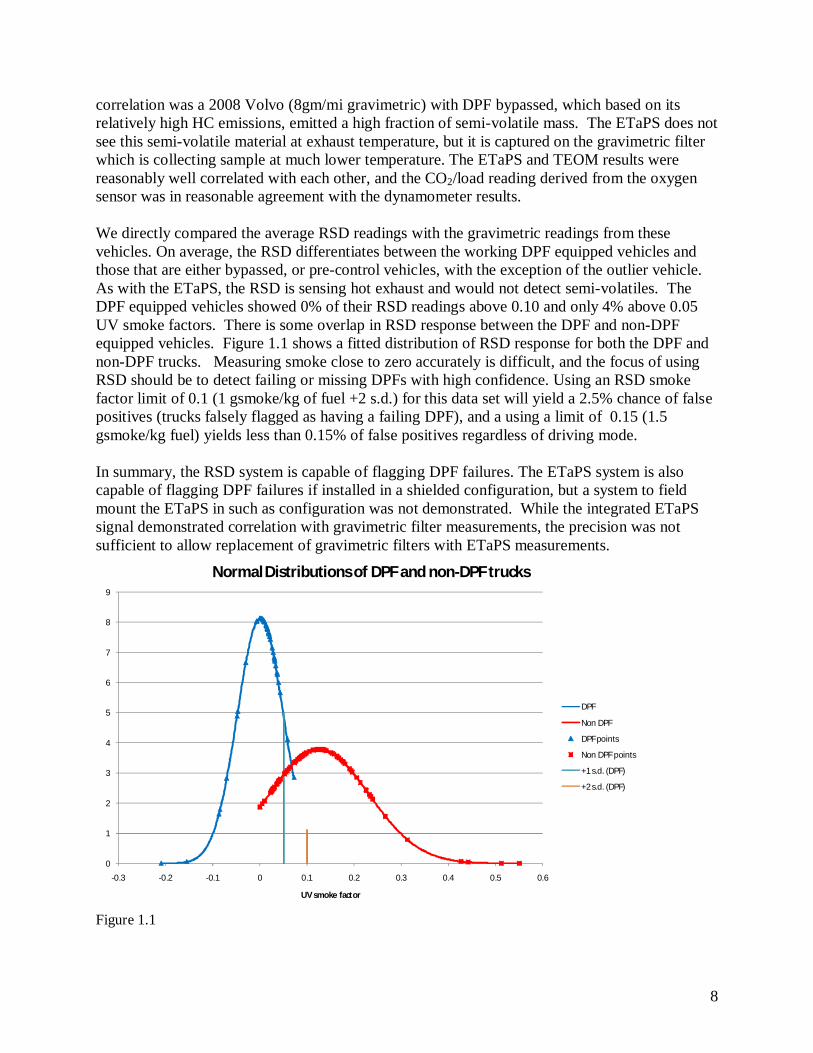
correlation was a 2008 Volvo (8gm/mi gravimetric) with DPF bypassed, which based on its relatively high HC emissions, emitted a high fraction of semi-volatile mass. The ETaPS does not see this semi-volatile material at exhaust temperature, but it is captured on the gravimetric filter which is collecting sample at much lower temperature. The ETaPS and TEOM results were reasonably well correlated with each other, and the CO2/load reading derived from the oxygen sensor was in reasonable agreement with the dynamometer results. We directly compared the average RSD readings with the gravimetric readings from these vehicles. On average, the RSD differentiates between the working DPF equipped vehicles and those that are either bypassed, or pre-control vehicles, with the exception of the outlier vehicle. As with the ETaPS, the RSD is sensing hot exhaust and would not detect semi-volatiles. The DPF equipped vehicles showed 0% of their RSD readings above 0.10 and only 4% above 0.05 UV smoke factors. There is some overlap in RSD response between the DPF and non-DPF equipped vehicles. Figure 1.1 shows a fitted distribution of RSD response for both the DPF and non-DPF trucks. Measuring smoke close to zero accurately is difficult, and the focus of using RSD should be to detect failing or missing DPFs with high confidence. Using an RSD smoke factor limit of 0.1 (1 gsmoke/kg of fuel +2 s.d.) for this data set will yield a 2.5% chance of false positives (trucks falsely flagged as having a failing DPF), and a using a limit of 0.15 (1.5 gsmoke/kg fuel) yields less than 0.15% of false positives regardless of driving mode. In summary, the RSD system is capable of flagging DPF failures. The ETaPS system is also capable of flagging DPF failures if installed in a shielded configuration, but a system to field mount the ETaPS in such as configuration was not demonstrated. While the integrated ETaPS signal demonstrated correlation with gravimetric filter measurements, the precision was not sufficient to allow replacement of gravimetric filters with ETaPS measurements.
Figure 1.1
0
1
2
3
4
5
6
7
8
9
-0.3 -0.2 -0.1 0 0.1 0.2 0.3 0.4 0.5 0.6
UV smoke factor
Normal Distributions of DPF and non-DPF trucks
DPF
Non DPF
DPF points
Non DPF points
+1 s.d. (DPF)
+2 s.d. (DPF)
9
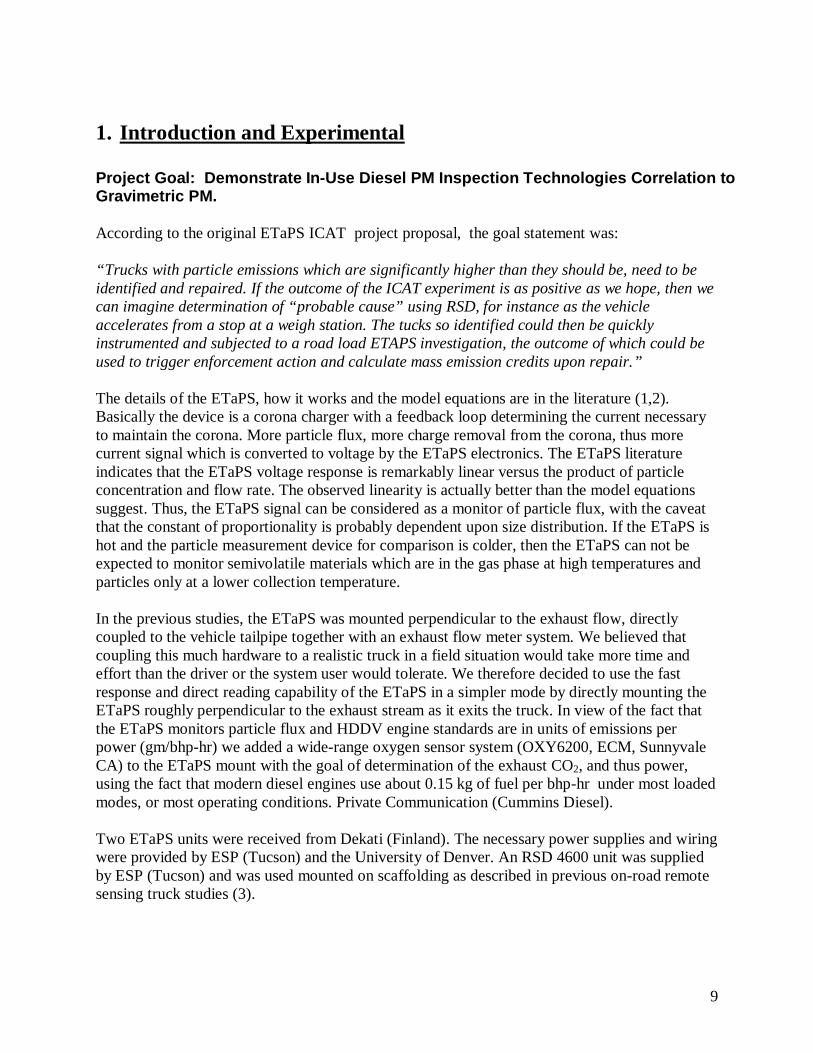
1. Introduction and Experimental Project Goal: Demonstrate In-Use Diesel PM Inspection Technologies Correlation to Gravimetric PM. According to the original ETaPS ICAT project proposal, the goal statement was: “Trucks with particle emissions which are significantly higher than they should be, need to be identified and repaired. If the outcome of the ICAT experiment is as positive as we hope, then we can imagine determination of “probable cause” using RSD, for instance as the vehicle accelerates from a stop at a weigh station. The tucks so identified could then be quickly instrumented and subjected to a road load ETAPS investigation, the outcome of which could be used to trigger enforcement action and calculate mass emission credits upon repair.” The details of the ETaPS, how it works and the model equations are in the literature (1,2). Basically the device is a corona charger with a feedback loop determining the current necessary to maintain the corona. More particle flux, more charge removal from the corona, thus more current signal which is converted to voltage by the ETaPS electronics. The ETaPS literature indicates that the ETaPS voltage response is remarkably linear versus the product of particle concentration and flow rate. The observed linearity is actually better than the model equations suggest. Thus, the ETaPS signal can be considered as a monitor of particle flux, with the caveat that the constant of proportionality is probably dependent upon size distribution. If the ETaPS is hot and the particle measurement device for comparison is colder, then the ETaPS can not be expected to monitor semivolatile materials which are in the gas phase at high temperatures and particles only at a lower collection temperature. In the previous studies, the ETaPS was mounted perpendicular to the exhaust flow, directly coupled to the vehicle tailpipe together with an exhaust flow meter system. We believed that coupling this much hardware to a realistic truck in a field situation would take more time and effort than the driver or the system user would tolerate. We therefore decided to use the fast response and direct reading capability of the ETaPS in a simpler mode by directly mounting the ETaPS roughly perpendicular to the exhaust stream as it exits the truck. In view of the fact that the ETaPS monitors particle flux and HDDV engine standards are in units of emissions per power (gm/bhp-hr) we added a wide-range oxygen sensor system (OXY6200, ECM, Sunnyvale CA) to the ETaPS mount with the goal of determination of the exhaust CO2, and thus power, using the fact that modern diesel engines use about 0.15 kg of fuel per bhp-hr under most loaded modes, or most operating conditions. Private Communication (Cummins Diesel). Two ETaPS units were received from Dekati (Finland). The necessary power supplies and wiring were provided by ESP (Tucson) and the University of Denver. An RSD 4600 unit was supplied by ESP (Tucson) and was used mounted on scaffolding as described in previous on-road remote sensing truck studies (3).

10
An important parameter of the RSD 4600 is the UV smoke response which monitors UV opacity at 230 nm in ratio to CO2 absorption from the exhaust. The system has been set up in such a way that a soot emission of 10g/kg of fuel (1% by mass) gives rise to a UV smoke factor reading of 1.0. Recent on-road RSD studies in California (4) have shown that the RSD 4600 reported IR smoke readings (IR opacity at 3.9 microns relative to exhaust CO2) are on average about 1.7 times larger than the UV smoke factor reported when observing a realistic fleet of HDDV. 1.1. Mounting an ETaPS on a Modern Truck Figures 1.2 and 1.3 shows typical ETaPS mounts on an older and on a modern DPF equipped truck.
Make: PETEModel: 385Year: 2000
This is a 5 inch diameter exhaust pipe curved back and to the right side of the cab of the truck. The ETaPS is connected to a rotatable hinge allowing for multiple angles ranging from vertical to horizontal alignment. The orange padding is a vest so the exhaust pipe would not get scratched. This protection is used because the trucks are new vehicles in a showroom lot. Suitable insulated padding is on order for on-road use. There is a supporting telescopic pole to accommodate for varying distances.
Figure 1.2 shows the ETaPS mounted on the tailpipe of a 2000 MY Peterbilt tractor. The orange cloth was used to protect the vehicle (for sale in a dealer lot) from scratches.
Make: PETEModel: 379 EXHDYear: 2006
This is a 7 inch diameter exhaust pipe with the ETaPS unit in the horizontal alignment. All the same connections are in place from the previous truck.
Figure 1.3 shows the same ETaPS on a 7” exhaust stack from a DPF equipped 2006 MY Peterbilt
11
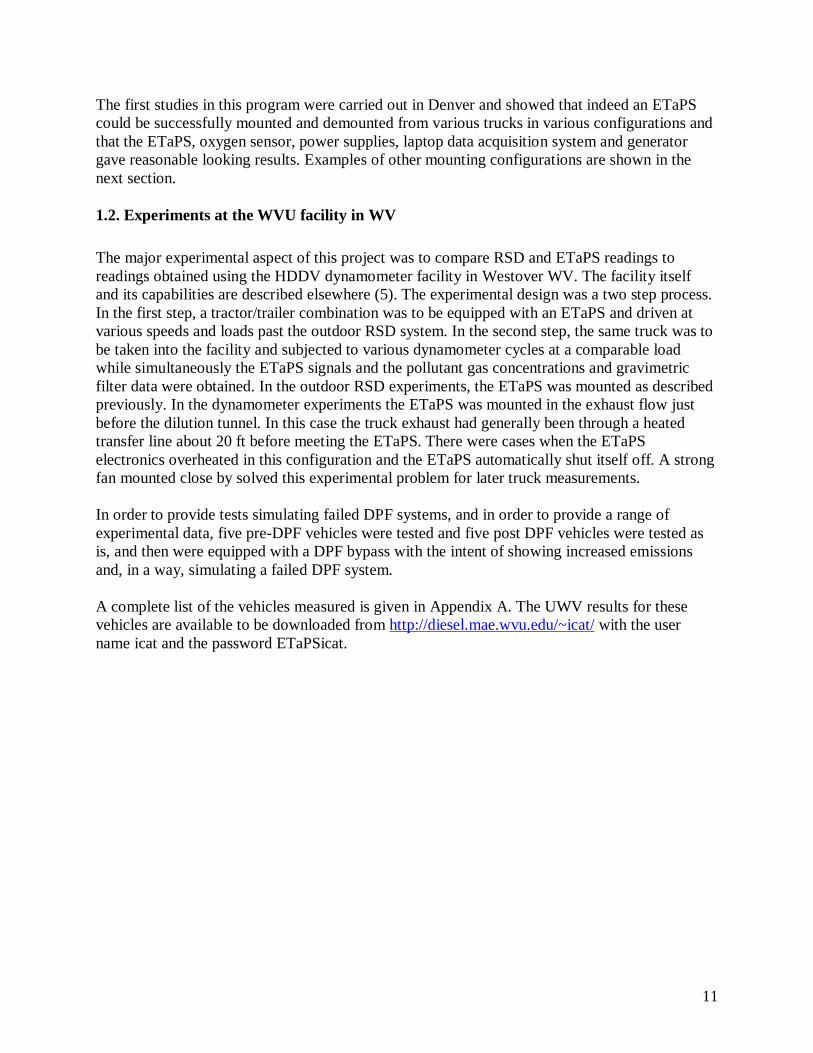
The first studies in this program were carried out in Denver and showed that indeed an ETaPS could be successfully mounted and demounted from various trucks in various configurations and that the ETaPS, oxygen sensor, power supplies, laptop data acquisition system and generator gave reasonable looking results. Examples of other mounting configurations are shown in the next section. 1.2. Experiments at the WVU facility in WV The major experimental aspect of this project was to compare RSD and ETaPS readings to readings obtained using the HDDV dynamometer facility in Westover WV. The facility itself and its capabilities are described elsewhere (5). The experimental design was a two step process. In the first step, a tractor/trailer combination was to be equipped with an ETaPS and driven at various speeds and loads past the outdoor RSD system. In the second step, the same truck was to be taken into the facility and subjected to various dynamometer cycles at a comparable load while simultaneously the ETaPS signals and the pollutant gas concentrations and gravimetric filter data were obtained. In the outdoor RSD experiments, the ETaPS was mounted as described previously. In the dynamometer experiments the ETaPS was mounted in the exhaust flow just before the dilution tunnel. In this case the truck exhaust had generally been through a heated transfer line about 20 ft before meeting the ETaPS. There were cases when the ETaPS electronics overheated in this configuration and the ETaPS automatically shut itself off. A strong fan mounted close by solved this experimental problem for later truck measurements. In order to provide tests simulating failed DPF systems, and in order to provide a range of experimental data, five pre-DPF vehicles were tested and five post DPF vehicles were tested as is, and then were equipped with a DPF bypass with the intent of showing increased emissions and, in a way, simulating a failed DPF system. A complete list of the vehicles measured is given in Appendix A. The UWV results for these vehicles are available to be downloaded from http://diesel.mae.wvu.edu/~icat/ with the user name icat and the password ETaPSicat.
12
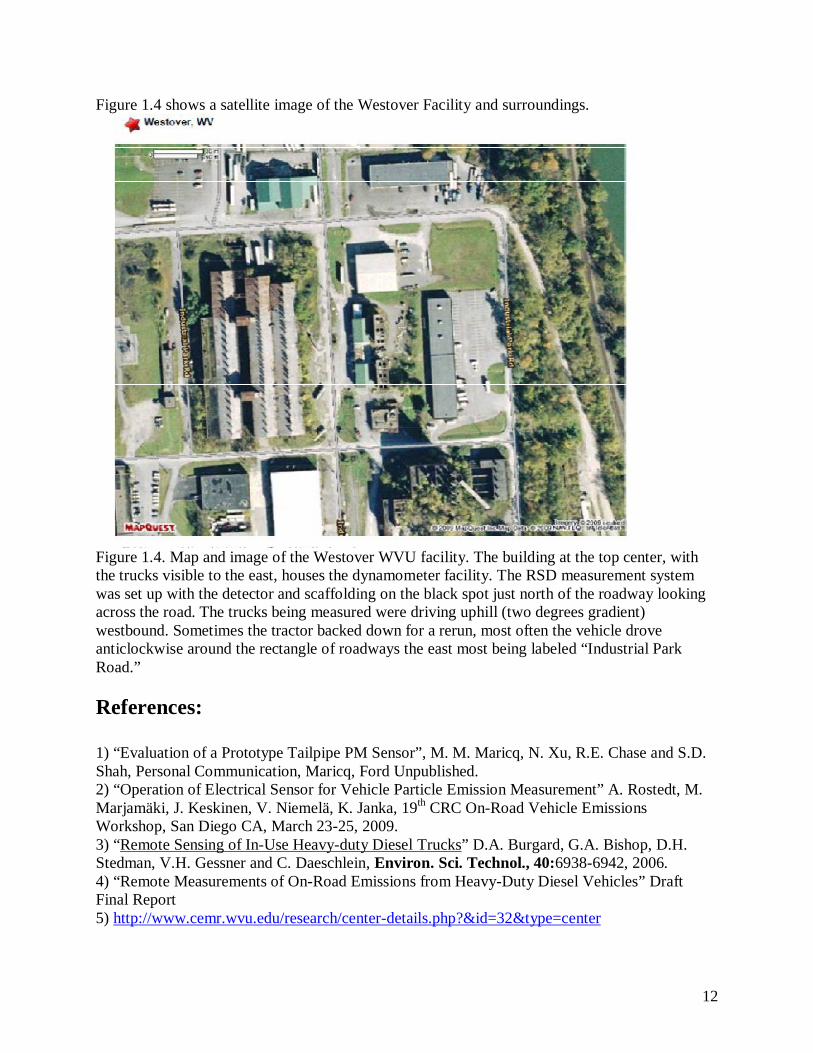
Figure 1.4 shows a satellite image of the Westover Facility and surroundings.
Figure 1.4. Map and image of the Westover WVU facility. The building at the top center, with the trucks visible to the east, houses the dynamometer facility. The RSD measurement system was set up with the detector and scaffolding on the black spot just north of the roadway looking across the road. The trucks being measured were driving uphill (two degrees gradient) westbound. Sometimes the tractor backed down for a rerun, most often the vehicle drove anticlockwise around the rectangle of roadways the east most being labeled “Industrial Park Road.” References: 1) “Evaluation of a Prototype Tailpipe PM Sensor”, M. M. Maricq, N. Xu, R.E. Chase and S.D. Shah, Personal Communication, Maricq, Ford Unpublished. 2) “Operation of Electrical Sensor for Vehicle Particle Emission Measurement” A. Rostedt, M. Marjamäki, J. Keskinen, V. Niemelä, K. Janka, 19th CRC On-Road Vehicle Emissions Workshop, San Diego CA, March 23-25, 2009. 3) “Remote Sensing of In-Use Heavy-duty Diesel Trucks” D.A. Burgard, G.A. Bishop, D.H. Stedman, V.H. Gessner and C. Daeschlein, Environ. Sci. Technol., 40:6938-6942, 2006. 4) “Remote Measurements of On-Road Emissions from Heavy-Duty Diesel Vehicles” Draft Final Report 5) http://www.cemr.wvu.edu/research/center-details.php?&id=32&type=center
13
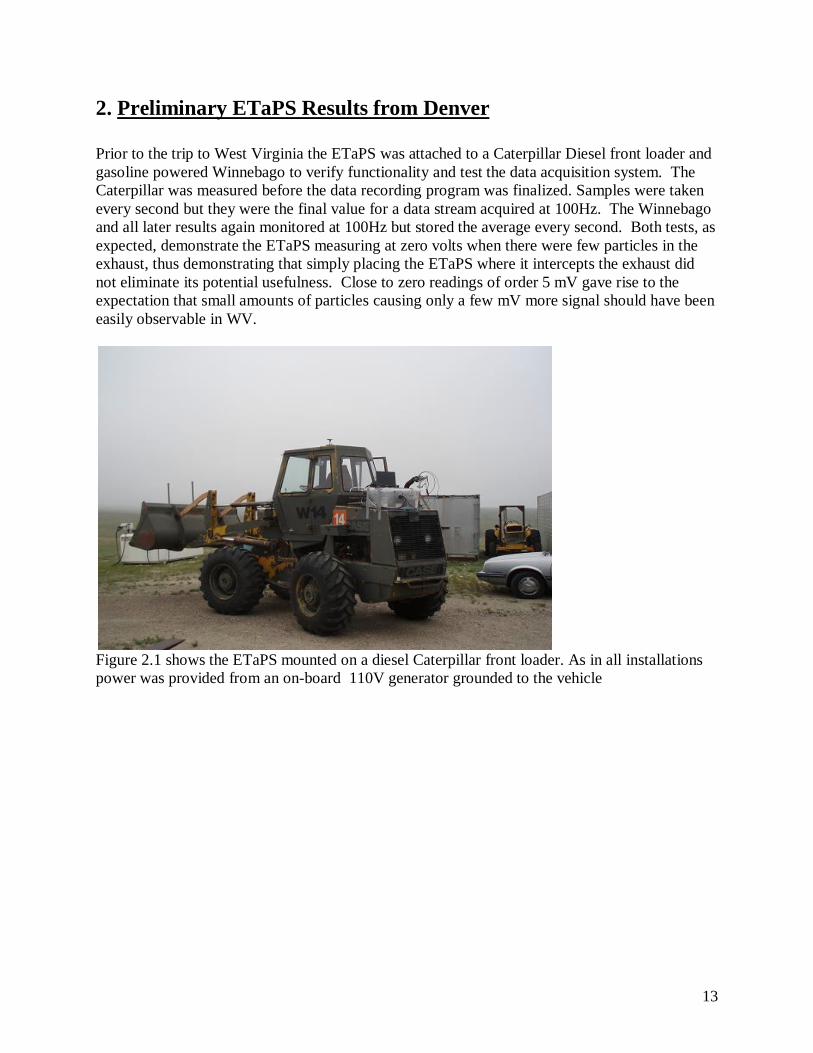
2. Preliminary ETaPS Results from Denver Prior to the trip to West Virginia the ETaPS was attached to a Caterpillar Diesel front loader and gasoline powered Winnebago to verify functionality and test the data acquisition system. The Caterpillar was measured before the data recording program was finalized. Samples were taken every second but they were the final value for a data stream acquired at 100Hz. The Winnebago and all later results again monitored at 100Hz but stored the average every second. Both tests, as expected, demonstrate the ETaPS measuring at zero volts when there were few particles in the exhaust, thus demonstrating that simply placing the ETaPS where it intercepts the exhaust did not eliminate its potential usefulness. Close to zero readings of order 5 mV gave rise to the expectation that small amounts of particles causing only a few mV more signal should have been easily observable in WV.
Figure 2.1 shows the ETaPS mounted on a diesel Caterpillar front loader. As in all installations power was provided from an on-board 110V generator grounded to the vehicle
14
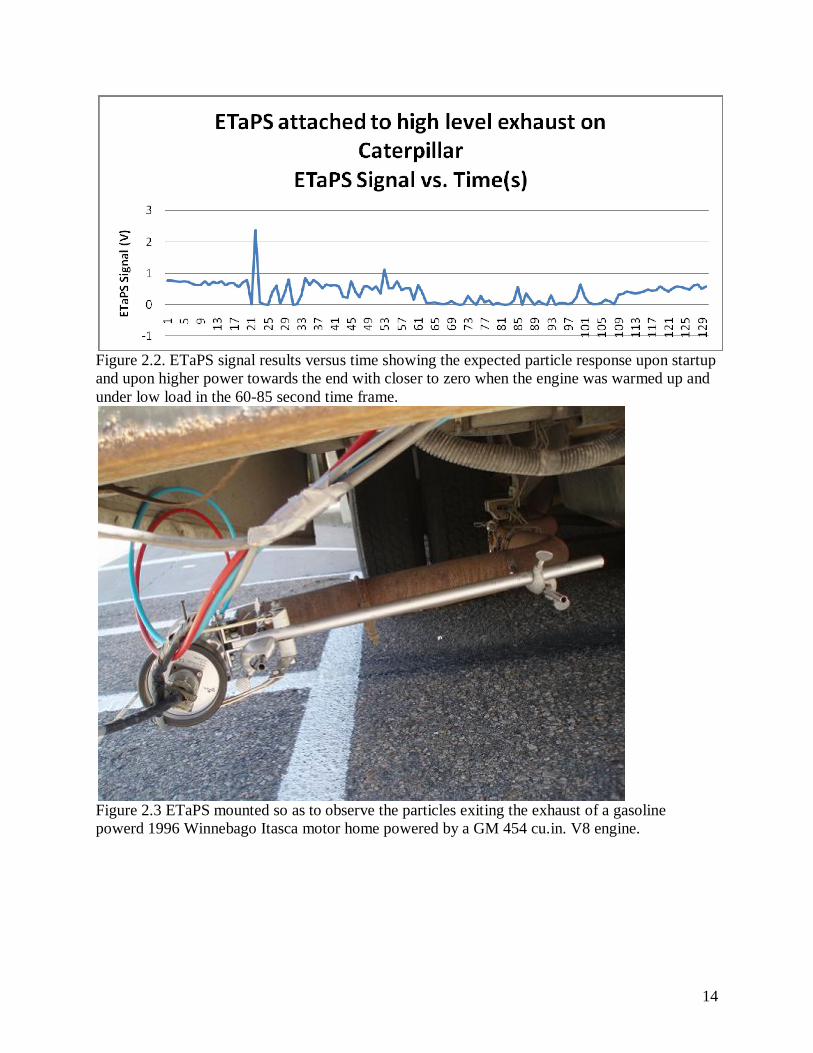
Figure 2.2. ETaPS signal results versus time showing the expected particle response upon startup and upon higher power towards the end with closer to zero when the engine was warmed up and under low load in the 60-85 second time frame.
Figure 2.3 ETaPS mounted so as to observe the particles exiting the exhaust of a gasoline powerd 1996 Winnebago Itasca motor home powered by a GM 454 cu.in. V8 engine.
15
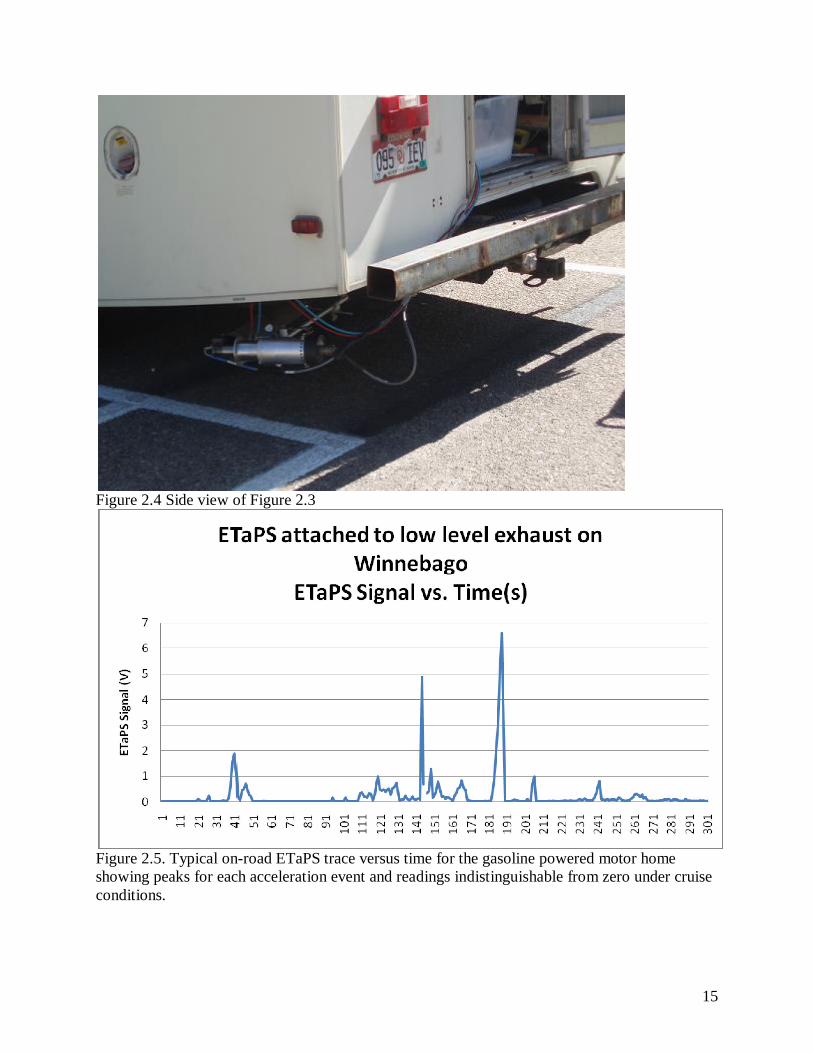
Figure 2.4 Side view of Figure 2.3
Figure 2.5. Typical on-road ETaPS trace versus time for the gasoline powered motor home showing peaks for each acceleration event and readings indistinguishable from zero under cruise conditions.
16
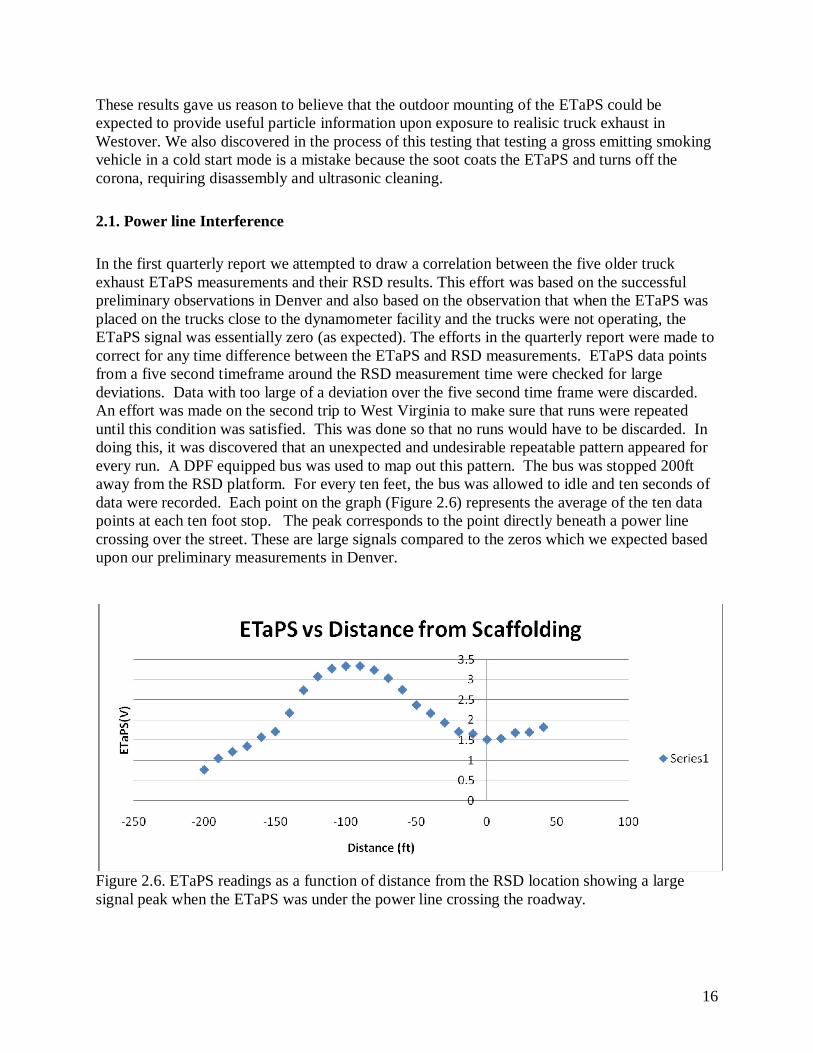
These results gave us reason to believe that the outdoor mounting of the ETaPS could be expected to provide useful particle information upon exposure to realisic truck exhaust in Westover. We also discovered in the process of this testing that testing a gross emitting smoking vehicle in a cold start mode is a mistake because the soot coats the ETaPS and turns off the corona, requiring disassembly and ultrasonic cleaning. 2.1. Power line Interference In the first quarterly report we attempted to draw a correlation between the five older truck exhaust ETaPS measurements and their RSD results. This effort was based on the successful preliminary observations in Denver and also based on the observation that when the ETaPS was placed on the trucks close to the dynamometer facility and the trucks were not operating, the ETaPS signal was essentially zero (as expected). The efforts in the quarterly report were made to correct for any time difference between the ETaPS and RSD measurements. ETaPS data points from a five second timeframe around the RSD measurement time were checked for large deviations. Data with too large of a deviation over the five second time frame were discarded. An effort was made on the second trip to West Virginia to make sure that runs were repeated until this condition was satisfied. This was done so that no runs would have to be discarded. In doing this, it was discovered that an unexpected and undesirable repeatable pattern appeared for every run. A DPF equipped bus was used to map out this pattern. The bus was stopped 200ft away from the RSD platform. For every ten feet, the bus was allowed to idle and ten seconds of data were recorded. Each point on the graph (Figure 2.6) represents the average of the ten data points at each ten foot stop. The peak corresponds to the point directly beneath a power line crossing over the street. These are large signals compared to the zeros which we expected based upon our preliminary measurements in Denver.
Figure 2.6. ETaPS readings as a function of distance from the RSD location showing a large signal peak when the ETaPS was under the power line crossing the roadway.
17
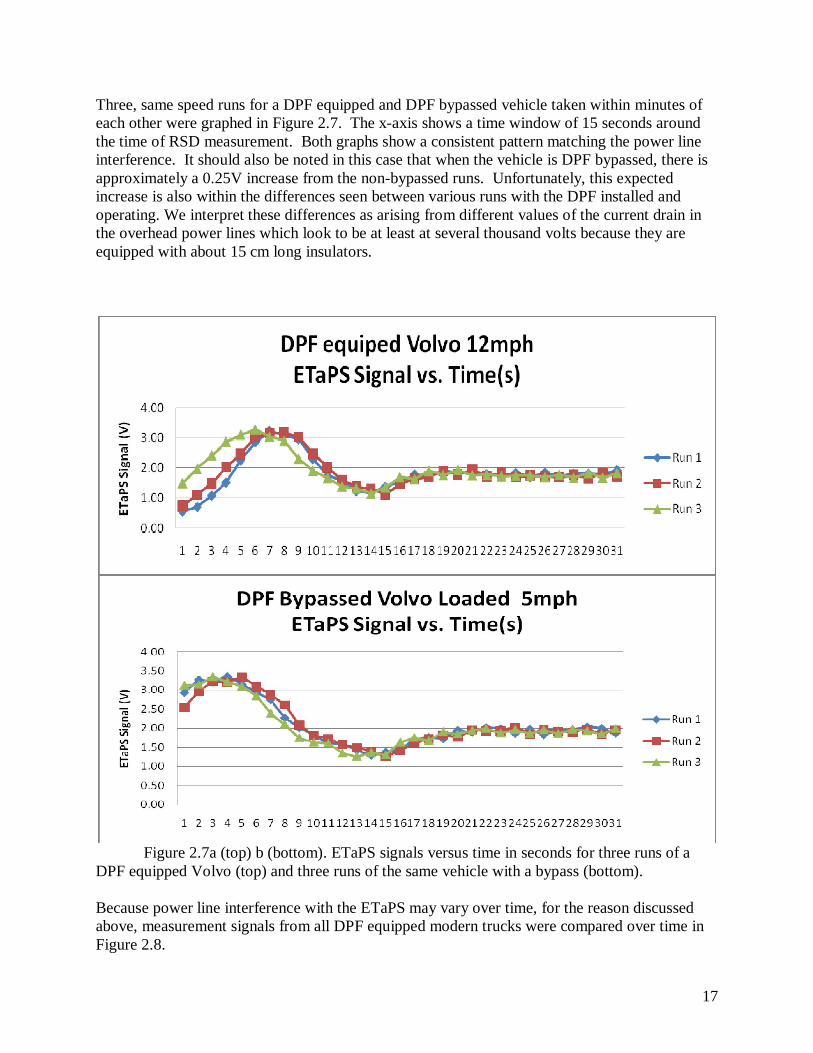
Three, same speed runs for a DPF equipped and DPF bypassed vehicle taken within minutes of each other were graphed in Figure 2.7. The x-axis shows a time window of 15 seconds around the time of RSD measurement. Both graphs show a consistent pattern matching the power line interference. It should also be noted in this case that when the vehicle is DPF bypassed, there is approximately a 0.25V increase from the non-bypassed runs. Unfortunately, this expected increase is also within the differences seen between various runs with the DPF installed and operating. We interpret these differences as arising from different values of the current drain in the overhead power lines which look to be at least at several thousand volts because they are equipped with about 15 cm long insulators.
Figure 2.7a (top) b (bottom). ETaPS signals versus time in seconds for three runs of a DPF equipped Volvo (top) and three runs of the same vehicle with a bypass (bottom). Because power line interference with the ETaPS may vary over time, for the reason discussed above, measurement signals from all DPF equipped modern trucks were compared over time in Figure 2.8.
18
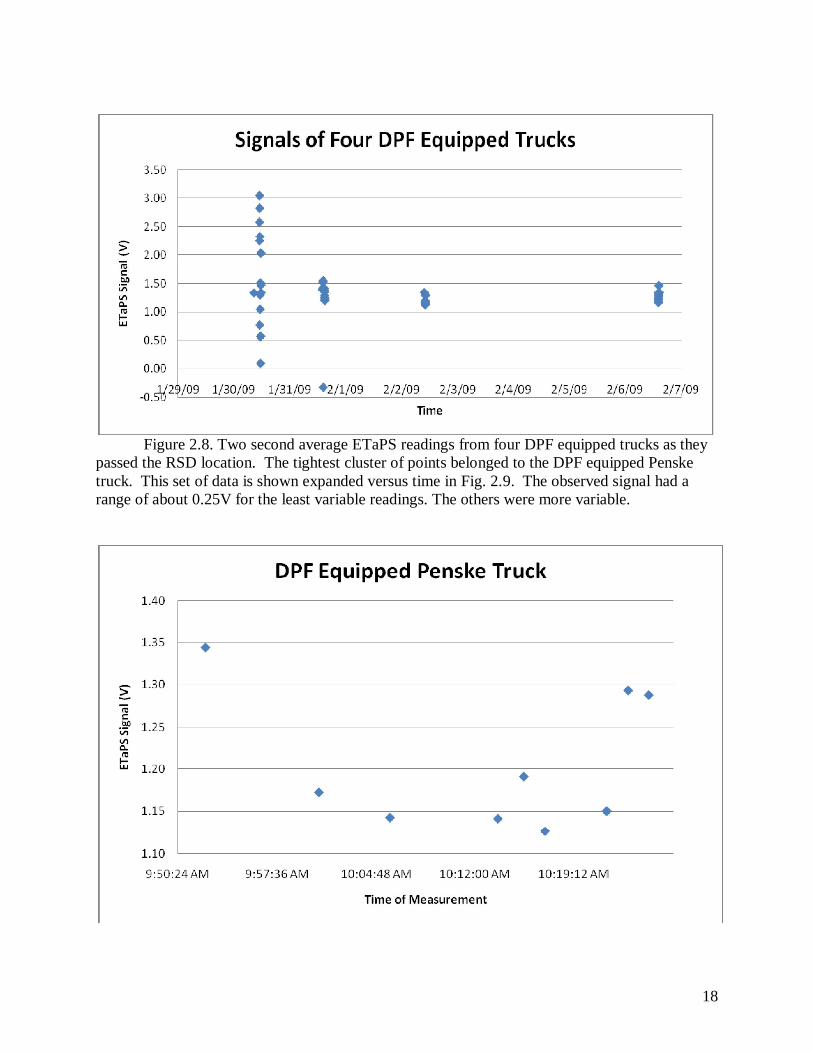
Figure 2.8. Two second average ETaPS readings from four DPF equipped trucks as they passed the RSD location. The tightest cluster of points belonged to the DPF equipped Penske truck. This set of data is shown expanded versus time in Fig. 2.9. The observed signal had a range of about 0.25V for the least variable readings. The others were more variable.
19
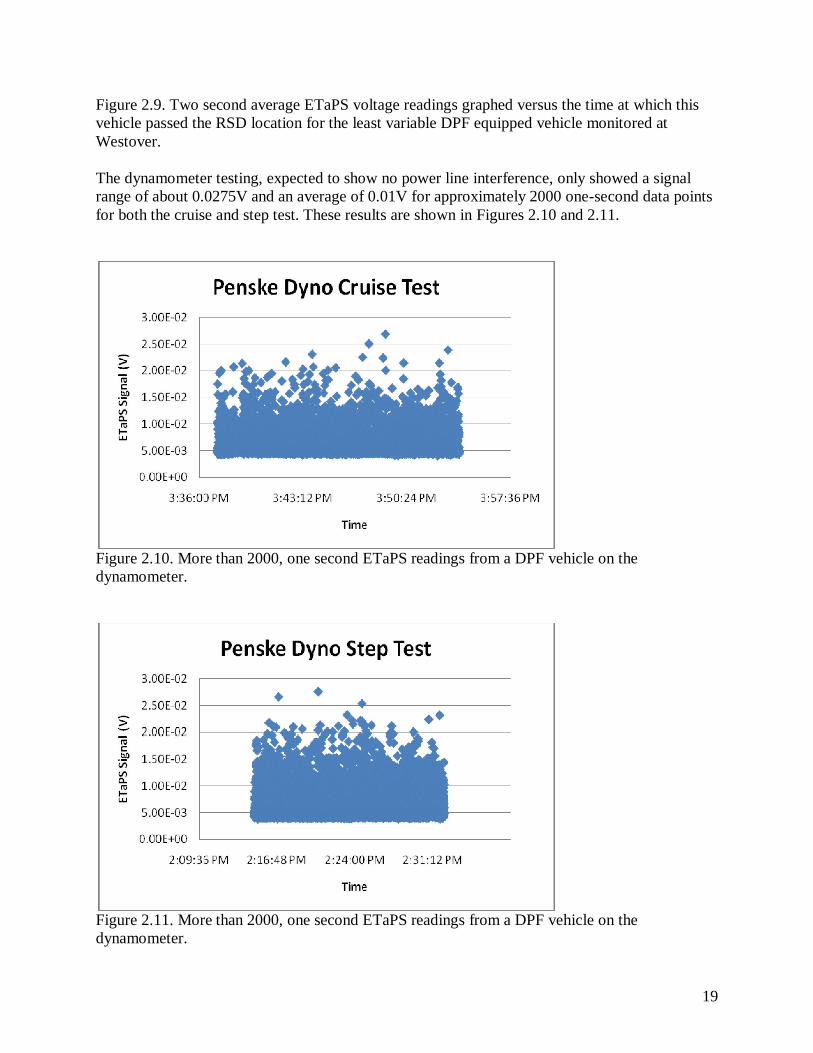
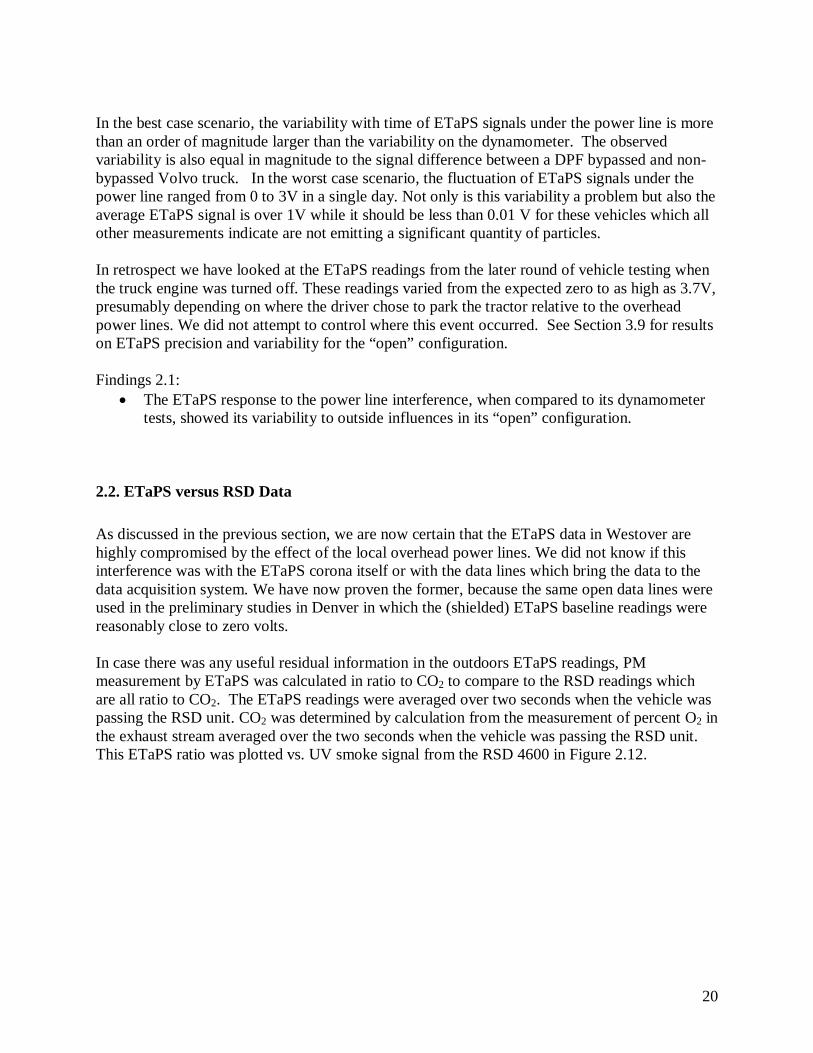
Figure 2.9. Two second average ETaPS voltage readings graphed versus the time at which this vehicle passed the RSD location for the least variable DPF equipped vehicle monitored at Westover. The dynamometer testing, expected to show no power line interference, only showed a signal range of about 0.0275V and an average of 0.01V for approximately 2000 one-second data points for both the cruise and step test. These results are shown in Figures 2.10 and 2.11.
Figure 2.10. More than 2000, one second ETaPS readings from a DPF vehicle on the dynamometer.
Figure 2.11. More than 2000, one second ETaPS readings from a DPF vehicle on the dynamometer.
20
In the best case scenario, the variability with time of ETaPS signals under the power line is more than an order of magnitude larger than the variability on the dynamometer. The observed variability is also equal in magnitude to the signal difference between a DPF bypassed and non-bypassed Volvo truck. In the worst case scenario, the fluctuation of ETaPS signals under the power line ranged from 0 to 3V in a single day. Not only is this variability a problem but also the average ETaPS signal is over 1V while it should be less than 0.01 V for these vehicles which all other measurements indicate are not emitting a significant quantity of particles. In retrospect we have looked at the ETaPS readings from the later round of vehicle testing when the truck engine was turned off. These readings varied from the expected zero to as high as 3.7V, presumably depending on where the driver chose to park the tractor relative to the overhead power lines. We did not attempt to control where this event occurred. See Section 3.9 for results on ETaPS precision and variability for the “open” configuration. Findings 2.1:
The ETaPS response to the power line interference, when compared to its dynamometer tests, showed its variability to outside influences in its “open” configuration.
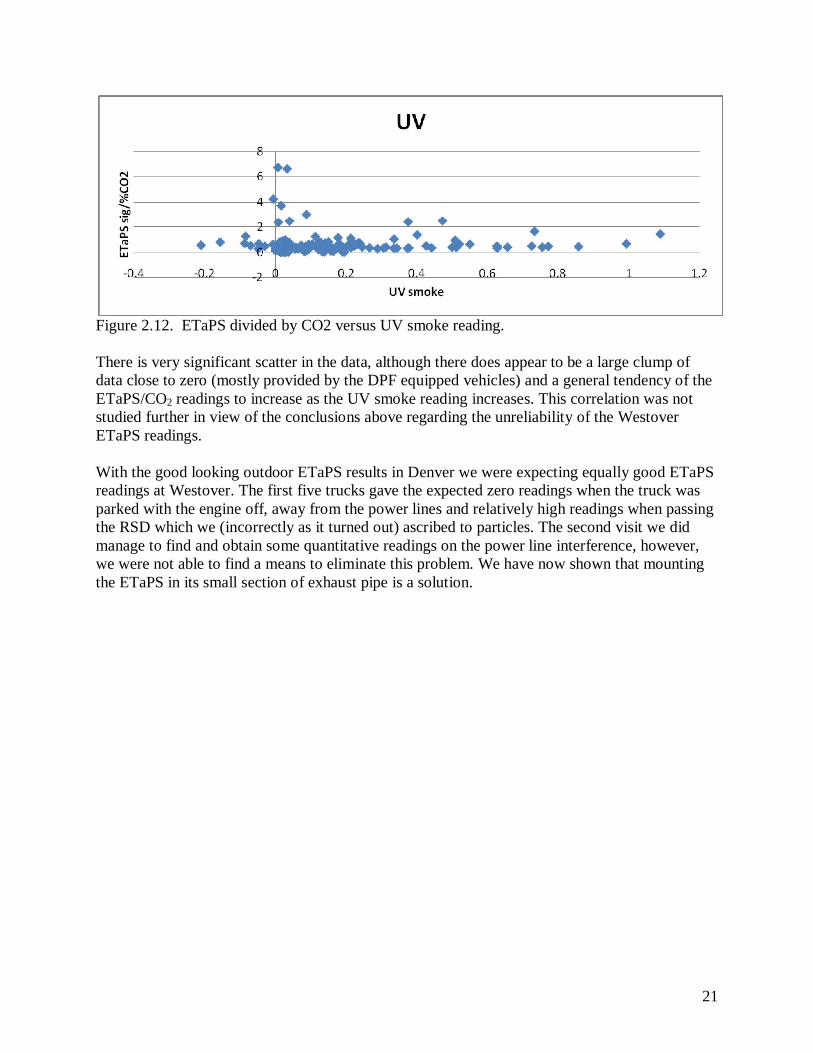
2.2. ETaPS versus RSD Data As discussed in the previous section, we are now certain that the ETaPS data in Westover are highly compromised by the effect of the local overhead power lines. We did not know if this interference was with the ETaPS corona itself or with the data lines which bring the data to the data acquisition system. We have now proven the former, because the same open data lines were used in the preliminary studies in Denver in which the (shielded) ETaPS baseline readings were reasonably close to zero volts. In case there was any useful residual information in the outdoors ETaPS readings, PM measurement by ETaPS was calculated in ratio to CO2 to compare to the RSD readings which are all ratio to CO2. The ETaPS readings were averaged over two seconds when the vehicle was passing the RSD unit. CO2 was determined by calculation from the measurement of percent O2 in the exhaust stream averaged over the two seconds when the vehicle was passing the RSD unit. This ETaPS ratio was plotted vs. UV smoke signal from the RSD 4600 in Figure 2.12.
21
Figure 2.12. ETaPS divided by CO2 versus UV smoke reading. There is very significant scatter in the data, although there does appear to be a large clump of data close to zero (mostly provided by the DPF equipped vehicles) and a general tendency of the ETaPS/CO2 readings to increase as the UV smoke reading increases. This correlation was not studied further in view of the conclusions above regarding the unreliability of the Westover ETaPS readings. With the good looking outdoor ETaPS results in Denver we were expecting equally good ETaPS readings at Westover. The first five trucks gave the expected zero readings when the truck was parked with the engine off, away from the power lines and relatively high readings when passing the RSD which we (incorrectly as it turned out) ascribed to particles. The second visit we did manage to find and obtain some quantitative readings on the power line interference, however, we were not able to find a means to eliminate this problem. We have now shown that mounting the ETaPS in its small section of exhaust pipe is a solution.
22
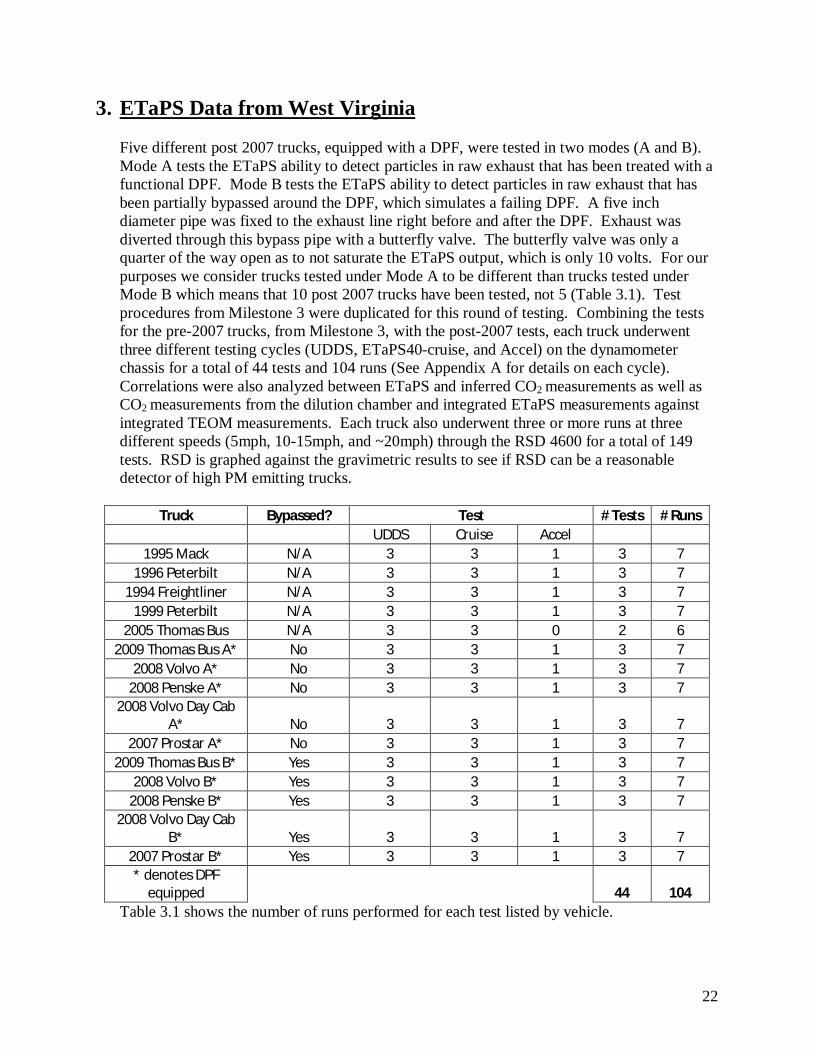
3. ETaPS Data from West Virginia Five different post 2007 trucks, equipped with a DPF, were tested in two modes (A and B). Mode A tests the ETaPS ability to detect particles in raw exhaust that has been treated with a functional DPF. Mode B tests the ETaPS ability to detect particles in raw exhaust that has been partially bypassed around the DPF, which simulates a failing DPF. A five inch diameter pipe was fixed to the exhaust line right before and after the DPF. Exhaust was diverted through this bypass pipe with a butterfly valve. The butterfly valve was only a quarter of the way open as to not saturate the ETaPS output, which is only 10 volts. For our purposes we consider trucks tested under Mode A to be different than trucks tested under Mode B which means that 10 post 2007 trucks have been tested, not 5 (Table 3.1). Test procedures from Milestone 3 were duplicated for this round of testing. Combining the tests for the pre-2007 trucks, from Milestone 3, with the post-2007 tests, each truck underwent three different testing cycles (UDDS, ETaPS40-cruise, and Accel) on the dynamometer chassis for a total of 44 tests and 104 runs (See Appendix A for details on each cycle). Correlations were also analyzed between ETaPS and inferred CO2 measurements as well as CO2 measurements from the dilution chamber and integrated ETaPS measurements against integrated TEOM measurements. Each truck also underwent three or more runs at three different speeds (5mph, 10-15mph, and ~20mph) through the RSD 4600 for a total of 149 tests. RSD is graphed against the gravimetric results to see if RSD can be a reasonable detector of high PM emitting trucks.
Truck Bypassed? Test # Tests # Runs UDDS Cruise Accel
1995 Mack N/A 3 3 1 3 7 1996 Peterbilt N/A 3 3 1 3 7
1994 Freightliner N/A 3 3 1 3 7 1999 Peterbilt N/A 3 3 1 3 7
2005 Thomas Bus N/A 3 3 0 2 6 2009 Thomas Bus A* No 3 3 1 3 7
2008 Volvo A* No 3 3 1 3 7 2008 Penske A* No 3 3 1 3 7
2008 Volvo Day Cab A* No 3 3 1 3 7
2007 Prostar A* No 3 3 1 3 7 2009 Thomas Bus B* Yes 3 3 1 3 7
2008 Volvo B* Yes 3 3 1 3 7 2008 Penske B* Yes 3 3 1 3 7
2008 Volvo Day Cab B* Yes 3 3 1 3 7
2007 Prostar B* Yes 3 3 1 3 7 * denotes DPF
equipped 44 104 Table 3.1 shows the number of runs performed for each test listed by vehicle.
23
Truck MY DPF PM ES2 UV Mack 1995 N/A 0.266 84.3 0.258
Peterbilt 1996 N/A 0.449 306 0.213 Freightliner 1994 N/A 0.297 243 0.559
Peterbilt 1999 N/A 0.469 295 0.145 Thomas Bus 2005 N/A 0.350 222 0.200
Thomas Bus A 2009 Non-
Bypassed 0.006 1.01 N/A
Volvo A 2008 Non-
Bypassed 0.008 1.37 0.018
Penske A 2008 Non-
Bypassed 0.007 0.94 0.021 Volvo Day Cab
A 2008 Non-
Bypassed 0.007 0.80 0.017
Prostar A 2007 Non-
Bypassed 0.012 0.85 -0.081 Thomas Bus B 2009 Bypassed 0.150 133 N/A
Volvo B 2008 Bypassed 1.106 92.6 0.037 Penske B 2008 Bypassed 0.070 118. 0.080
Volvo Day Cab B 2008 Bypassed 0.074 47.00 0.031
Prostar B 2007 Bypassed 0.168 105 0.132
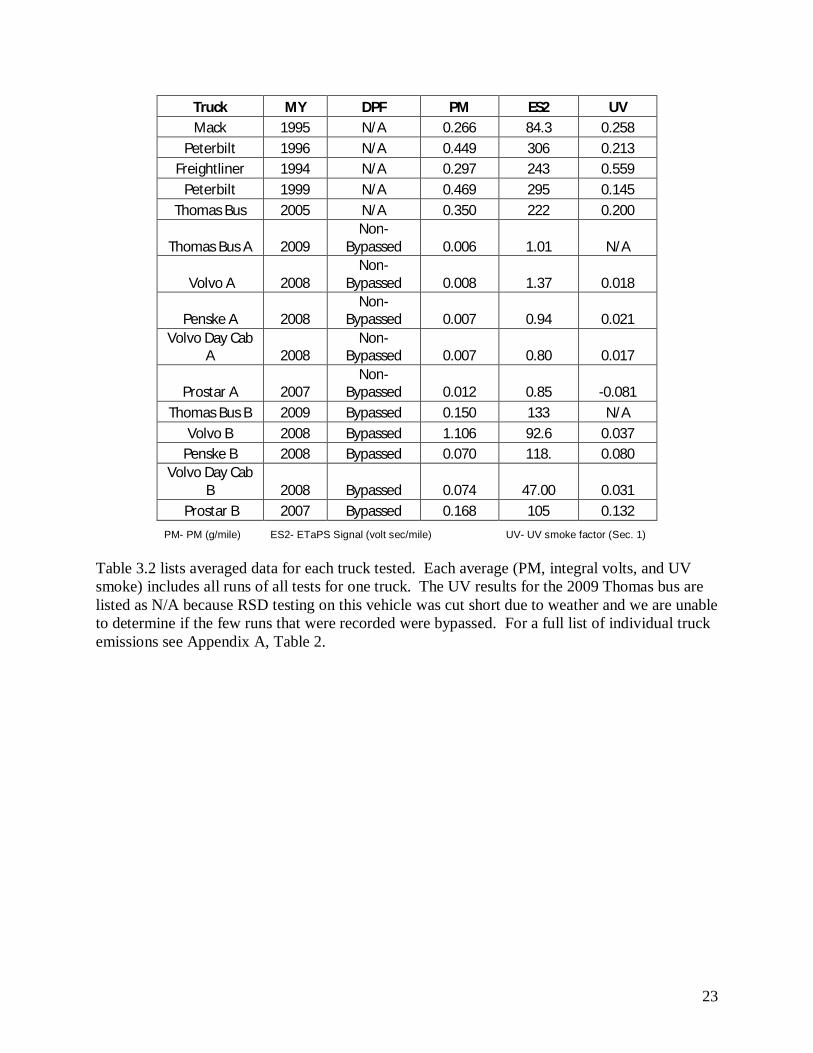
PM- PM (g/mile) ES2- ETaPS Signal (volt sec/mile) UV- UV smoke factor (Sec. 1) Table 3.2 lists averaged data for each truck tested. Each average (PM, integral volts, and UV smoke) includes all runs of all tests for one truck. The UV results for the 2009 Thomas bus are listed as N/A because RSD testing on this vehicle was cut short due to weather and we are unable to determine if the few runs that were recorded were bypassed. For a full list of individual truck emissions see Appendix A, Table 2.
24
ETaPS in hot, raw exhaust before CVS dilution tunnel.
RSD setup outside WVU testing facility.
Current setup of ETaPS on an elevated exhaust pipe.
2008 Volvo day cab on dynamometer with insulated pipe.
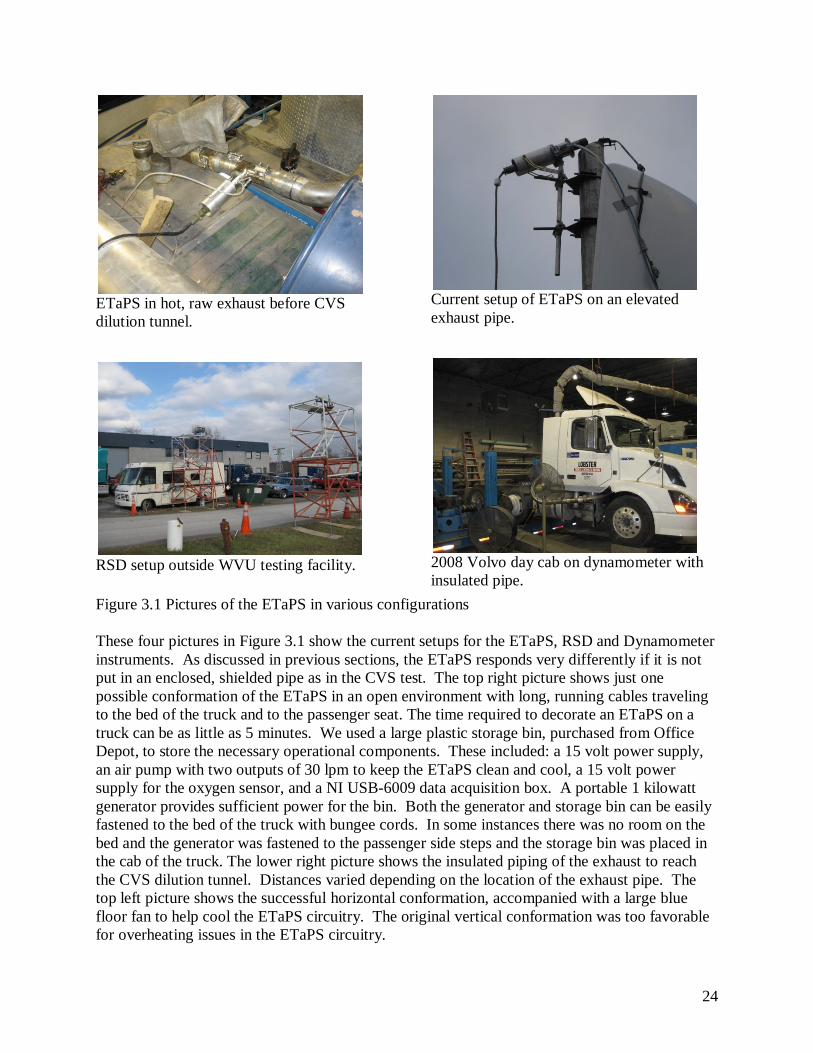
Figure 3.1 Pictures of the ETaPS in various configurations
These four pictures in Figure 3.1 show the current setups for the ETaPS, RSD and Dynamometer instruments. As discussed in previous sections, the ETaPS responds very differently if it is not put in an enclosed, shielded pipe as in the CVS test. The top right picture shows just one possible conformation of the ETaPS in an open environment with long, running cables traveling to the bed of the truck and to the passenger seat. The time required to decorate an ETaPS on a truck can be as little as 5 minutes. We used a large plastic storage bin, purchased from Office Depot, to store the necessary operational components. These included: a 15 volt power supply, an air pump with two outputs of 30 lpm to keep the ETaPS clean and cool, a 15 volt power supply for the oxygen sensor, and a NI USB-6009 data acquisition box. A portable 1 kilowatt generator provides sufficient power for the bin. Both the generator and storage bin can be easily fastened to the bed of the truck with bungee cords. In some instances there was no room on the bed and the generator was fastened to the passenger side steps and the storage bin was placed in the cab of the truck. The lower right picture shows the insulated piping of the exhaust to reach the CVS dilution tunnel. Distances varied depending on the location of the exhaust pipe. The top left picture shows the successful horizontal conformation, accompanied with a large blue floor fan to help cool the ETaPS circuitry. The original vertical conformation was too favorable for overheating issues in the ETaPS circuitry.
25
3.1. Post 2007 Results
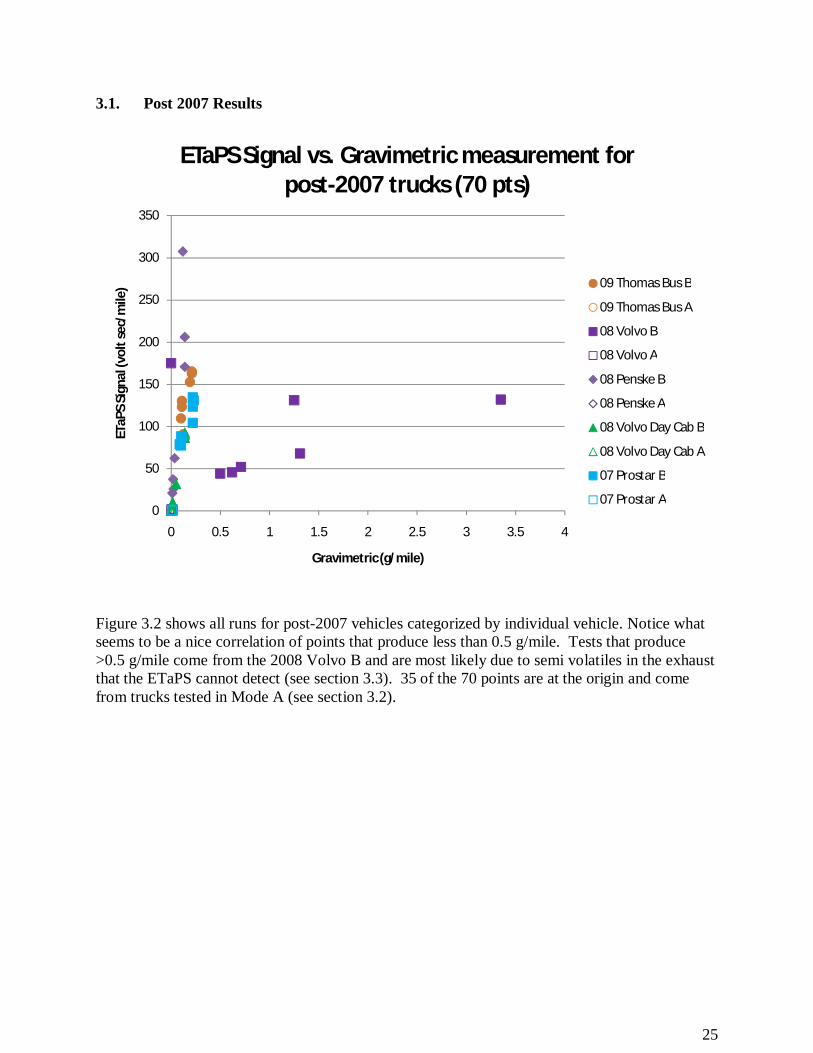
Figure 3.2 shows all runs for post-2007 vehicles categorized by individual vehicle. Notice what seems to be a nice correlation of points that produce less than 0.5 g/mile. Tests that produce >0.5 g/mile come from the 2008 Volvo B and are most likely due to semi volatiles in the exhaust that the ETaPS cannot detect (see section 3.3). 35 of the 70 points are at the origin and come from trucks tested in Mode A (see section 3.2).
0
50
100
150
200
250
300
350
0 0.5 1 1.5 2 2.5 3 3.5 4
ETaP
S Si
gnal
(vol
t sec
/mile
)
Gravimetric (g/mile)
ETaPS Signal vs. Gravimetric measurement for post-2007 trucks (70 pts)
09 Thomas Bus B
09 Thomas Bus A
08 Volvo B
08 Volvo A
08 Penske B
08 Penske A
08 Volvo Day Cab B
08 Volvo Day Cab A
07 Prostar B
07 Prostar A
26
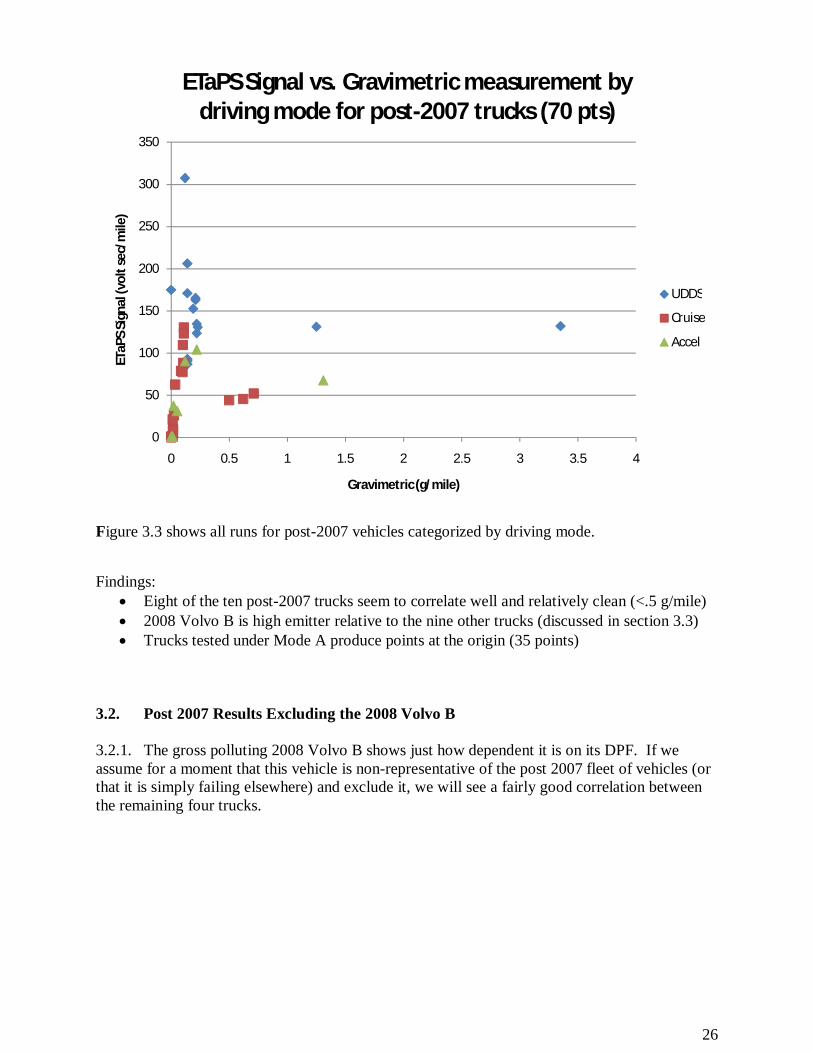
Figure 3.3 shows all runs for post-2007 vehicles categorized by driving mode.
Findings:
Eight of the ten post-2007 trucks seem to correlate well and relatively clean (<.5 g/mile) 2008 Volvo B is high emitter relative to the nine other trucks (discussed in section 3.3) Trucks tested under Mode A produce points at the origin (35 points)
3.2. Post 2007 Results Excluding the 2008 Volvo B 3.2.1. The gross polluting 2008 Volvo B shows just how dependent it is on its DPF. If we assume for a moment that this vehicle is non-representative of the post 2007 fleet of vehicles (or that it is simply failing elsewhere) and exclude it, we will see a fairly good correlation between the remaining four trucks.
0
50
100
150
200
250
300
350
0 0.5 1 1.5 2 2.5 3 3.5 4
ETaP
S Si
gnal
(vol
t sec
/mile
)
Gravimetric (g/mile)
ETaPS Signal vs. Gravimetric measurement by driving mode for post-2007 trucks (70 pts)
UDDS
Cruise
Accel
27
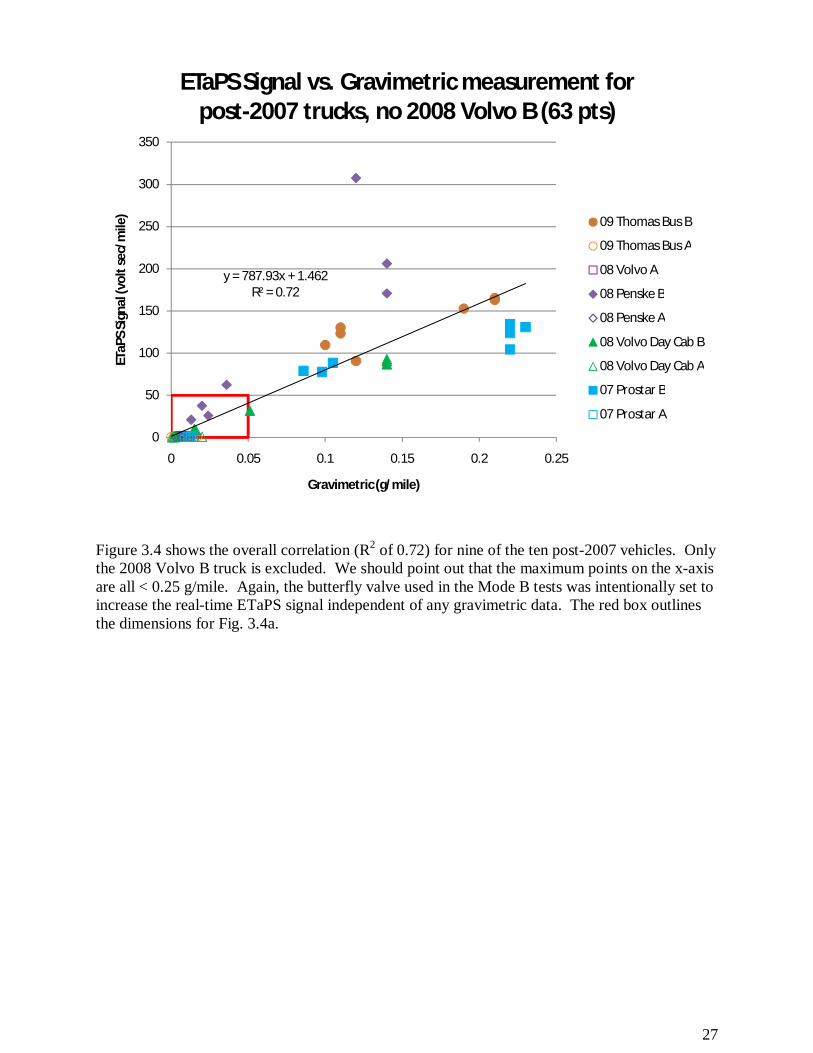
Figure 3.4 shows the overall correlation (R2 of 0.72) for nine of the ten post-2007 vehicles. Only the 2008 Volvo B truck is excluded. We should point out that the maximum points on the x-axis are all < 0.25 g/mile. Again, the butterfly valve used in the Mode B tests was intentionally set to increase the real-time ETaPS signal independent of any gravimetric data. The red box outlines the dimensions for Fig. 3.4a.
y = 787.93x + 1.462R² = 0.72
0
50
100
150
200
250
300
350
0 0.05 0.1 0.15 0.2 0.25
ETaP
S Si
gnal
(vol
t sec
/mile
)
Gravimetric (g/mile)
ETaPS Signal vs. Gravimetric measurement for post-2007 trucks, no 2008 Volvo B (63 pts)
09 Thomas Bus B
09 Thomas Bus A
08 Volvo A
08 Penske B
08 Penske A
08 Volvo Day Cab B
08 Volvo Day Cab A
07 Prostar B
07 Prostar A
28
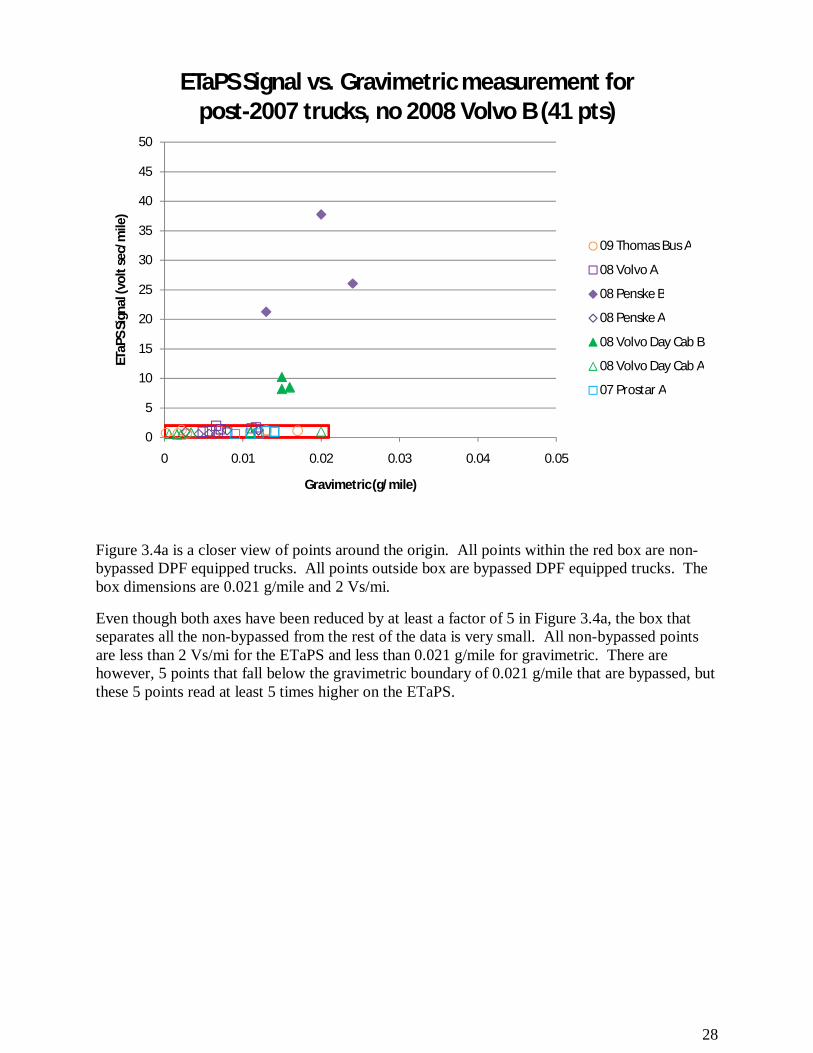
Figure 3.4a is a closer view of points around the origin. All points within the red box are non-bypassed DPF equipped trucks. All points outside box are bypassed DPF equipped trucks. The box dimensions are 0.021 g/mile and 2 Vs/mi.
Even though both axes have been reduced by at least a factor of 5 in Figure 3.4a, the box that separates all the non-bypassed from the rest of the data is very small. All non-bypassed points are less than 2 Vs/mi for the ETaPS and less than 0.021 g/mile for gravimetric. There are however, 5 points that fall below the gravimetric boundary of 0.021 g/mile that are bypassed, but these 5 points read at least 5 times higher on the ETaPS.
0
5
10
15
20
25
30
35
40
45
50
0 0.01 0.02 0.03 0.04 0.05
ETaP
S Si
gnal
(vol
t sec
/mile
)
Gravimetric (g/mile)
ETaPS Signal vs. Gravimetric measurement for post-2007 trucks, no 2008 Volvo B (41 pts)
09 Thomas Bus A
08 Volvo A
08 Penske B
08 Penske A
08 Volvo Day Cab B
08 Volvo Day Cab A
07 Prostar A
29
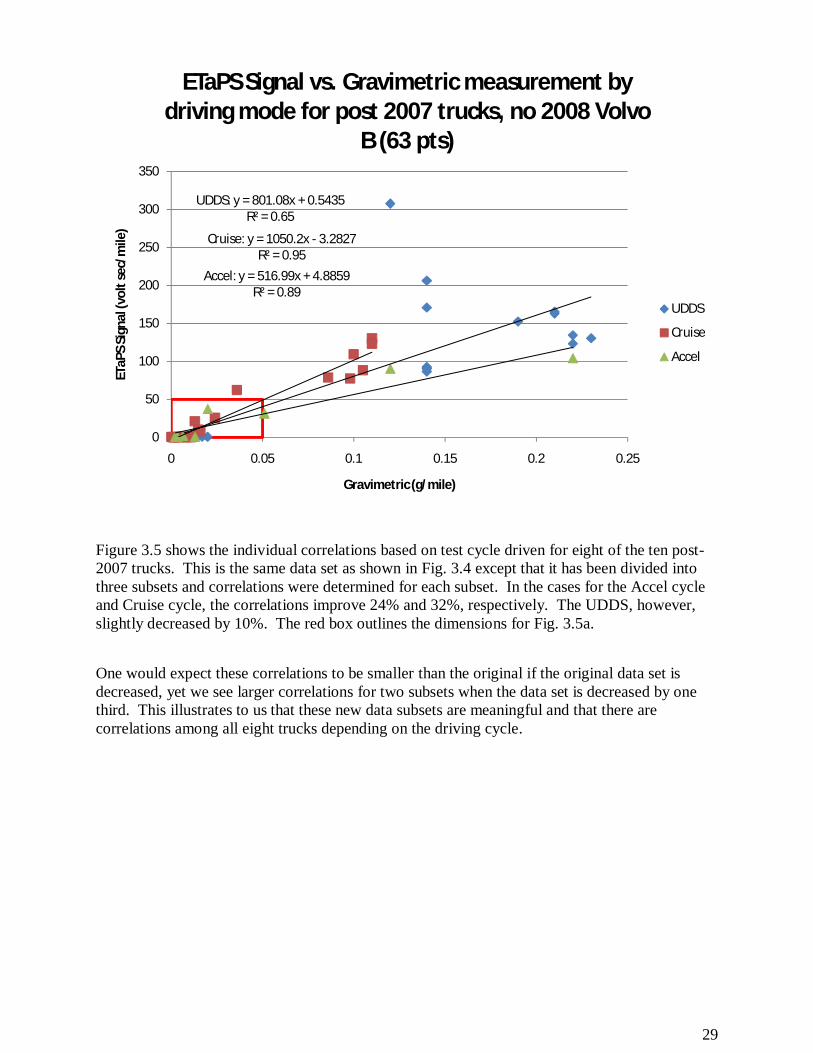
Figure 3.5 shows the individual correlations based on test cycle driven for eight of the ten post-2007 trucks. This is the same data set as shown in Fig. 3.4 except that it has been divided into three subsets and correlations were determined for each subset. In the cases for the Accel cycle and Cruise cycle, the correlations improve 24% and 32%, respectively. The UDDS, however, slightly decreased by 10%. The red box outlines the dimensions for Fig. 3.5a.
One would expect these correlations to be smaller than the original if the original data set is decreased, yet we see larger correlations for two subsets when the data set is decreased by one third. This illustrates to us that these new data subsets are meaningful and that there are correlations among all eight trucks depending on the driving cycle.
UDDS: y = 801.08x + 0.5435R² = 0.65
Cruise: y = 1050.2x - 3.2827R² = 0.95
Accel: y = 516.99x + 4.8859R² = 0.89
0
50
100
150
200
250
300
350
0 0.05 0.1 0.15 0.2 0.25
ETaP
S Si
gnal
(vol
t sec
/mile
)
Gravimetric (g/mile)
ETaPS Signal vs. Gravimetric measurement by driving mode for post 2007 trucks, no 2008 Volvo
B (63 pts)
UDDS
Cruise
Accel
30
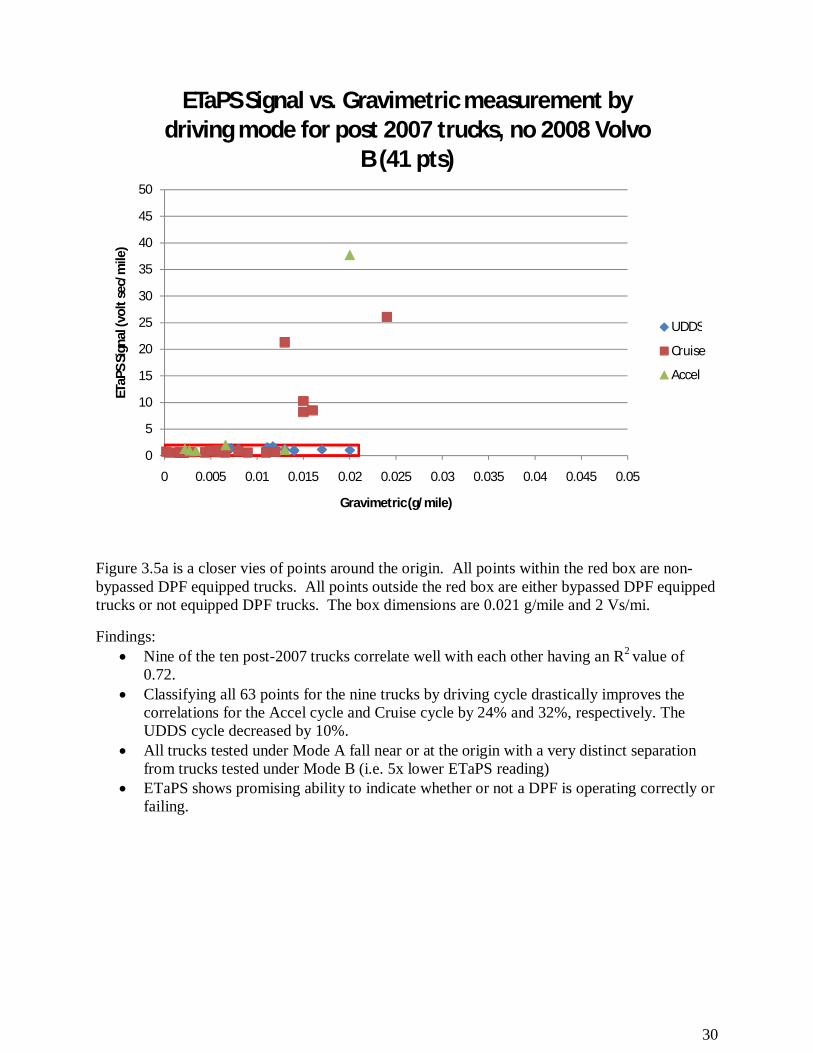
Figure 3.5a is a closer vies of points around the origin. All points within the red box are non-bypassed DPF equipped trucks. All points outside the red box are either bypassed DPF equipped trucks or not equipped DPF trucks. The box dimensions are 0.021 g/mile and 2 Vs/mi.
Findings: Nine of the ten post-2007 trucks correlate well with each other having an R2 value of
0.72. Classifying all 63 points for the nine trucks by driving cycle drastically improves the
correlations for the Accel cycle and Cruise cycle by 24% and 32%, respectively. The UDDS cycle decreased by 10%.
All trucks tested under Mode A fall near or at the origin with a very distinct separation from trucks tested under Mode B (i.e. 5x lower ETaPS reading)
ETaPS shows promising ability to indicate whether or not a DPF is operating correctly or failing.
0
5
10
15
20
25
30
35
40
45
50
0 0.005 0.01 0.015 0.02 0.025 0.03 0.035 0.04 0.045 0.05
ETaP
S Si
gnal
(vol
t sec
/mile
)
Gravimetric (g/mile)
ETaPS Signal vs. Gravimetric measurement by driving mode for post 2007 trucks, no 2008 Volvo
B (41 pts)
UDDS
Cruise
Accel
31
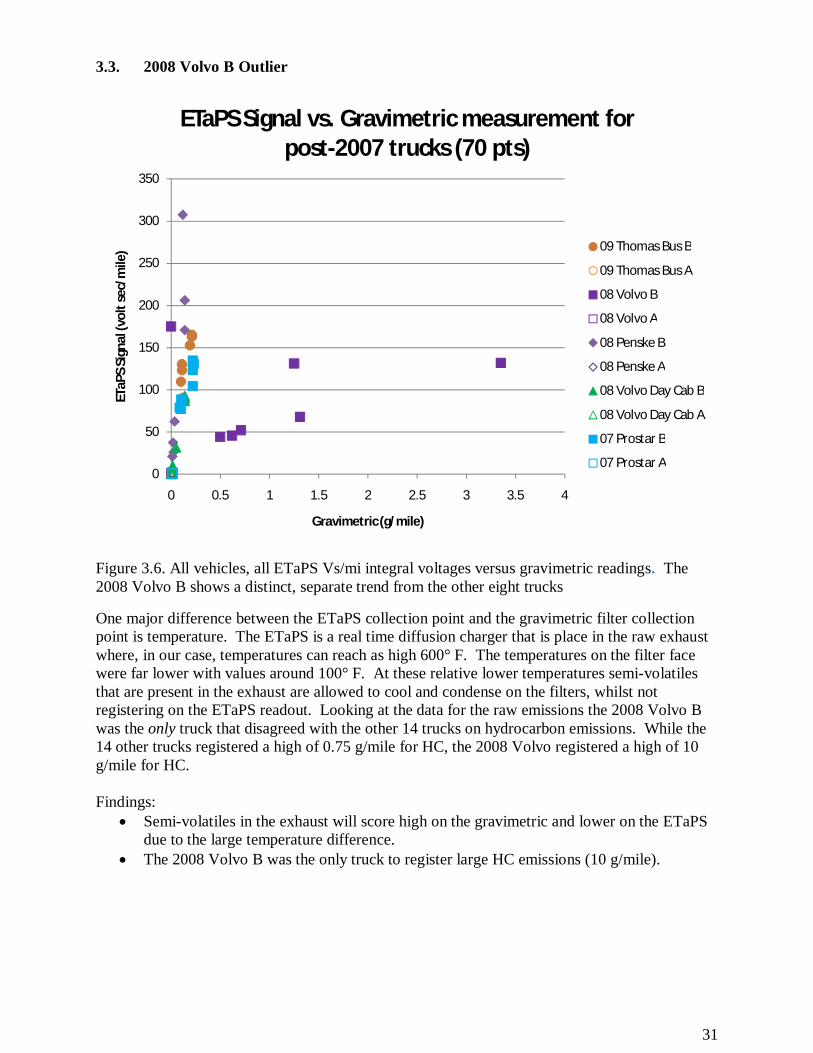
3.3. 2008 Volvo B Outlier
Figure 3.6. All vehicles, all ETaPS Vs/mi integral voltages versus gravimetric readings. The 2008 Volvo B shows a distinct, separate trend from the other eight trucks
One major difference between the ETaPS collection point and the gravimetric filter collection point is temperature. The ETaPS is a real time diffusion charger that is place in the raw exhaust where, in our case, temperatures can reach as high 600° F. The temperatures on the filter face were far lower with values around 100° F. At these relative lower temperatures semi-volatiles that are present in the exhaust are allowed to cool and condense on the filters, whilst not registering on the ETaPS readout. Looking at the data for the raw emissions the 2008 Volvo B was the only truck that disagreed with the other 14 trucks on hydrocarbon emissions. While the 14 other trucks registered a high of 0.75 g/mile for HC, the 2008 Volvo registered a high of 10 g/mile for HC. Findings:
Semi-volatiles in the exhaust will score high on the gravimetric and lower on the ETaPS due to the large temperature difference.
The 2008 Volvo B was the only truck to register large HC emissions (10 g/mile).
0
50
100
150
200
250
300
350
0 0.5 1 1.5 2 2.5 3 3.5 4
ETaP
S Si
gnal
(vol
t sec
/mile
)
Gravimetric (g/mile)
ETaPS Signal vs. Gravimetric measurement for post-2007 trucks (70 pts)
09 Thomas Bus B
09 Thomas Bus A
08 Volvo B
08 Volvo A
08 Penske B
08 Penske A
08 Volvo Day Cab B
08 Volvo Day Cab A
07 Prostar B
07 Prostar A
32
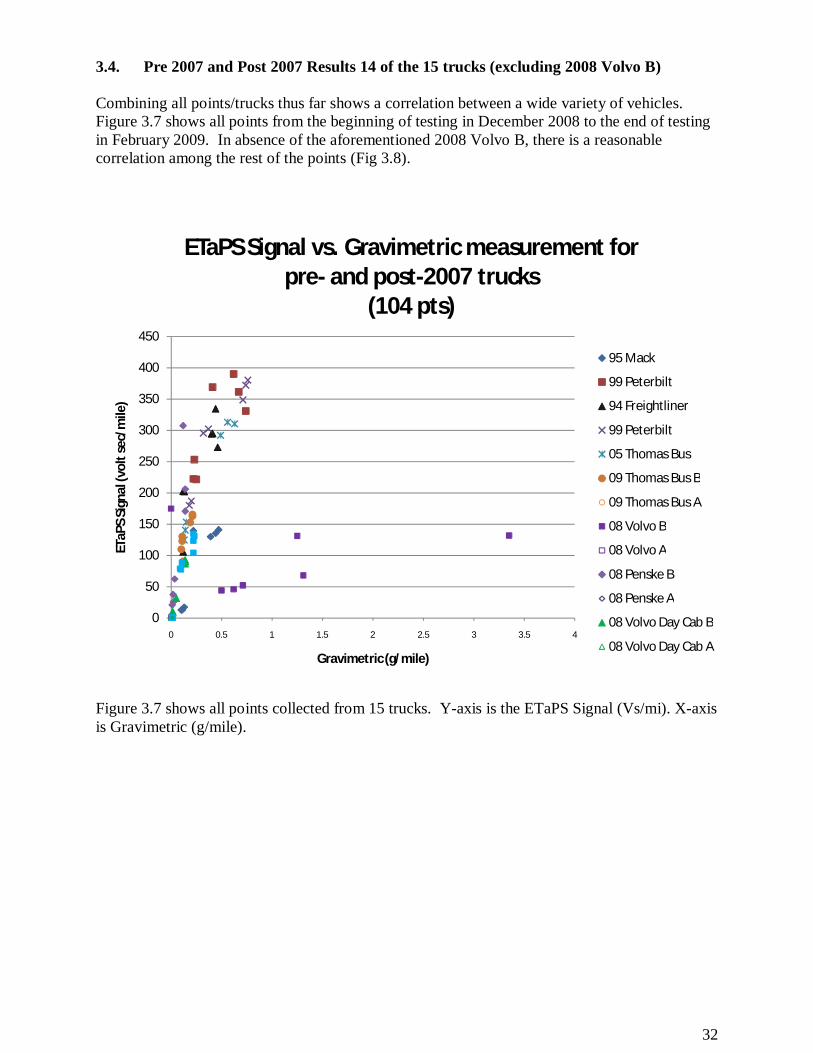
3.4. Pre 2007 and Post 2007 Results 14 of the 15 trucks (excluding 2008 Volvo B) Combining all points/trucks thus far shows a correlation between a wide variety of vehicles. Figure 3.7 shows all points from the beginning of testing in December 2008 to the end of testing in February 2009. In absence of the aforementioned 2008 Volvo B, there is a reasonable correlation among the rest of the points (Fig 3.8).
Figure 3.7 shows all points collected from 15 trucks. Y-axis is the ETaPS Signal (Vs/mi). X-axis is Gravimetric (g/mile).
0
50
100
150
200
250
300
350
400
450
0 0.5 1 1.5 2 2.5 3 3.5 4
ETaP
S Si
gnal
(vol
t sec
/mile
)
Gravimetric (g/mile)
ETaPS Signal vs. Gravimetric measurement for pre- and post-2007 trucks
(104 pts)
95 Mack
99 Peterbilt
94 Freightliner
99 Peterbilt
05 Thomas Bus
09 Thomas Bus B
09 Thomas Bus A
08 Volvo B
08 Volvo A
08 Penske B
08 Penske A
08 Volvo Day Cab B
08 Volvo Day Cab A

33
Figure 3.8 shows a decent overall correlation of 0.80 for all tests (excluding the 2008 Volvo B).
There are a total of 97 data points plotted in Figure 3.8. More than one third (41) of these points are located within the red box outlined near the origin. This red box is enlarged in Figure 3.8a to show where exactly any trucks tested under Mode A would fall compared to trucks tested under Mode B. Of the 41 points in the red box all 35 runs corresponding to a functional DPF system fall right at the origin. The remaining 6 points are trucks with bypassed DPF systems that are still burning fairly clean according to the gravimetric results.
y = 537.46x + 21.904R² = 0.80
0
50
100
150
200
250
300
350
400
450
500
0 0.1 0.2 0.3 0.4 0.5 0.6 0.7 0.8
ETaP
S Si
gnal
(vol
t sec
/mile
)
Gravimetric (g/mile)
ETaPS Signal vs. Gravimetric measurement for pre- and post-2007 trucks, no 2008 Volvo B (97 pts)
95 Mack
99 Peterbilt
94 Freightliner
99 Peterbilt
05 Thomas Bus
09 Thomas Bus B
09 Thomas Bus A
08 Volvo A
08 Penske B
08 Penske A
08 Volvo Day Cab B
08 Volvo Day Cab A
07 Prostar B
07 Prostar A
34
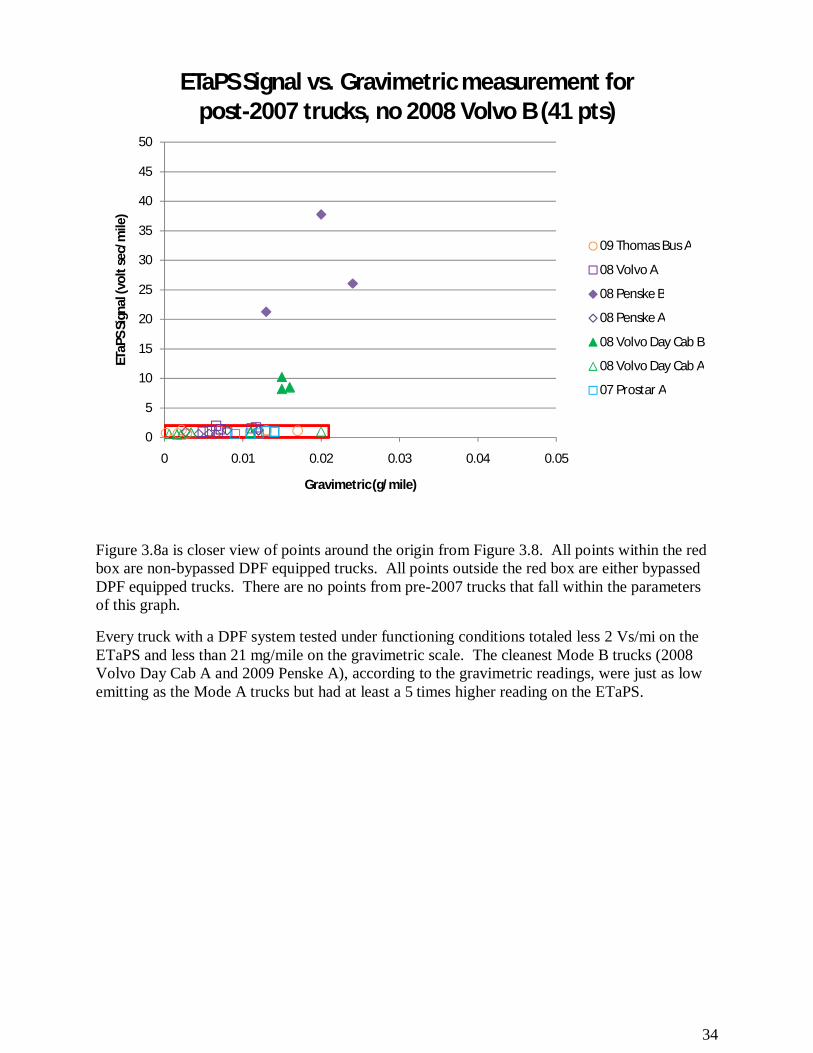
Figure 3.8a is closer view of points around the origin from Figure 3.8. All points within the red box are non-bypassed DPF equipped trucks. All points outside the red box are either bypassed DPF equipped trucks. There are no points from pre-2007 trucks that fall within the parameters of this graph.
Every truck with a DPF system tested under functioning conditions totaled less 2 Vs/mi on the ETaPS and less than 21 mg/mile on the gravimetric scale. The cleanest Mode B trucks (2008 Volvo Day Cab A and 2009 Penske A), according to the gravimetric readings, were just as low emitting as the Mode A trucks but had at least a 5 times higher reading on the ETaPS.
0
5
10
15
20
25
30
35
40
45
50
0 0.01 0.02 0.03 0.04 0.05
ETaP
S Si
gnal
(vol
t sec
/mile
)
Gravimetric (g/mile)
ETaPS Signal vs. Gravimetric measurement for post-2007 trucks, no 2008 Volvo B (41 pts)
09 Thomas Bus A
08 Volvo A
08 Penske B
08 Penske A
08 Volvo Day Cab B
08 Volvo Day Cab A
07 Prostar A
35
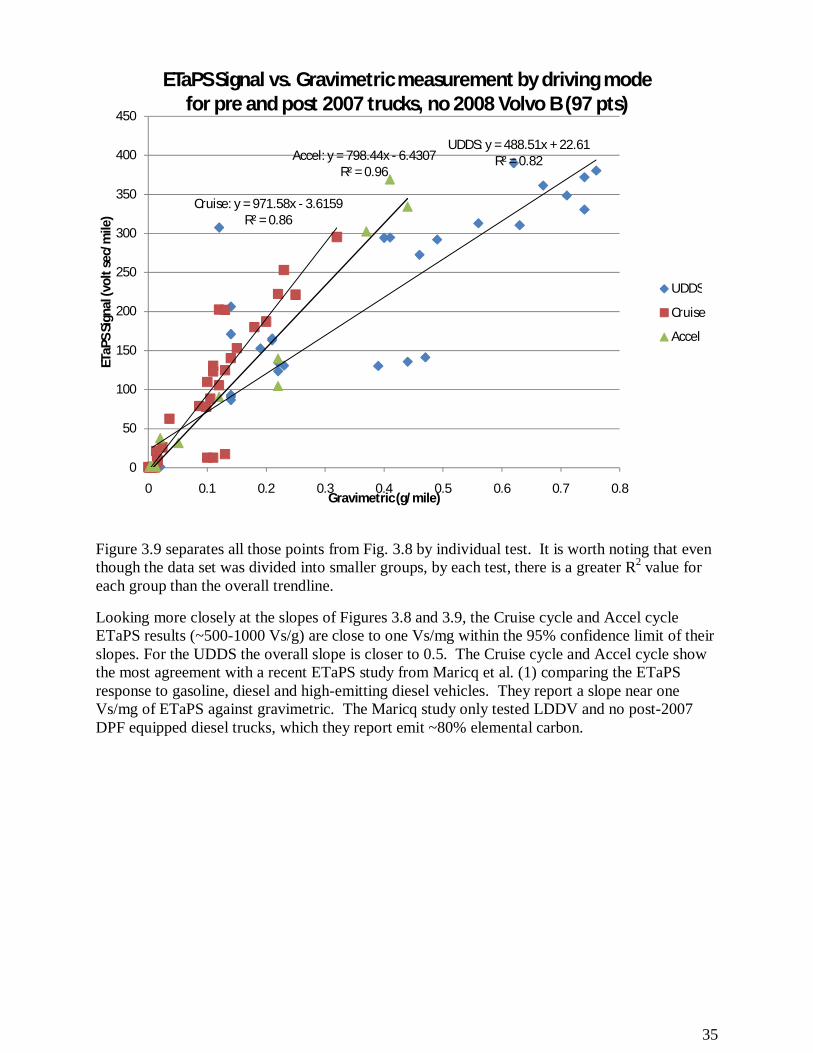
Figure 3.9 separates all those points from Fig. 3.8 by individual test. It is worth noting that even though the data set was divided into smaller groups, by each test, there is a greater R2 value for each group than the overall trendline.
Looking more closely at the slopes of Figures 3.8 and 3.9, the Cruise cycle and Accel cycle ETaPS results (~500-1000 Vs/g) are close to one Vs/mg within the 95% confidence limit of their slopes. For the UDDS the overall slope is closer to 0.5. The Cruise cycle and Accel cycle show the most agreement with a recent ETaPS study from Maricq et al. (1) comparing the ETaPS response to gasoline, diesel and high-emitting diesel vehicles. They report a slope near one Vs/mg of ETaPS against gravimetric. The Maricq study only tested LDDV and no post-2007 DPF equipped diesel trucks, which they report emit ~80% elemental carbon.
UDDS: y = 488.51x + 22.61R² = 0.82
Cruise: y = 971.58x - 3.6159R² = 0.86
Accel: y = 798.44x - 6.4307R² = 0.96
0
50
100
150
200
250
300
350
400
450
0 0.1 0.2 0.3 0.4 0.5 0.6 0.7 0.8
ETaP
S Si
gnal
(vol
t sec
/mile
)
Gravimetric (g/mile)
ETaPS Signal vs. Gravimetric measurement by driving mode for pre and post 2007 trucks, no 2008 Volvo B (97 pts)
UDDS
Cruise
Accel
36
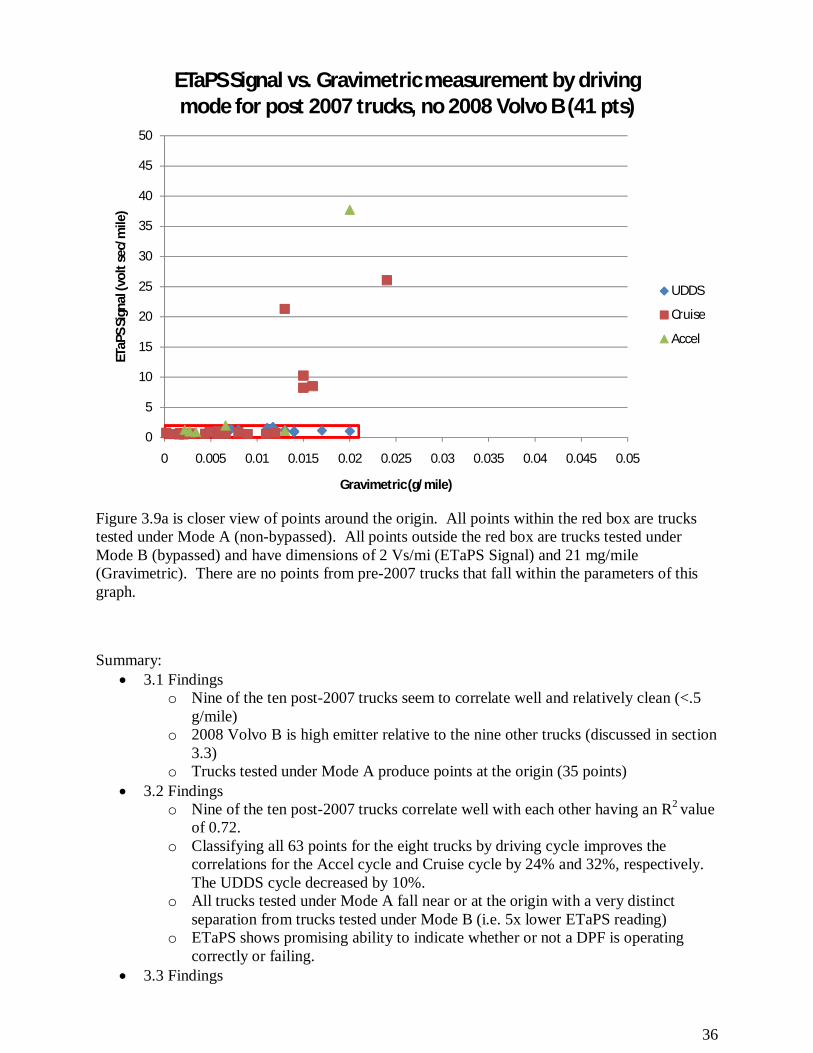
Figure 3.9a is closer view of points around the origin. All points within the red box are trucks tested under Mode A (non-bypassed). All points outside the red box are trucks tested under Mode B (bypassed) and have dimensions of 2 Vs/mi (ETaPS Signal) and 21 mg/mile (Gravimetric). There are no points from pre-2007 trucks that fall within the parameters of this graph.
Summary:
3.1 Findings o Nine of the ten post-2007 trucks seem to correlate well and relatively clean (<.5
g/mile) o 2008 Volvo B is high emitter relative to the nine other trucks (discussed in section
3.3) o Trucks tested under Mode A produce points at the origin (35 points)
3.2 Findings o Nine of the ten post-2007 trucks correlate well with each other having an R2 value
of 0.72. o Classifying all 63 points for the eight trucks by driving cycle improves the
correlations for the Accel cycle and Cruise cycle by 24% and 32%, respectively. The UDDS cycle decreased by 10%.
o All trucks tested under Mode A fall near or at the origin with a very distinct separation from trucks tested under Mode B (i.e. 5x lower ETaPS reading)
o ETaPS shows promising ability to indicate whether or not a DPF is operating correctly or failing.
3.3 Findings
0
5
10
15
20
25
30
35
40
45
50
0 0.005 0.01 0.015 0.02 0.025 0.03 0.035 0.04 0.045 0.05
ETaP
S Si
gnal
(vol
t sec
/mile
)
Gravimetric (g/mile)
ETaPS Signal vs. Gravimetric measurement by driving mode for post 2007 trucks, no 2008 Volvo B (41 pts)
UDDS
Cruise
Accel
37
o Semi-volatiles in the exhaust will score high on the gravimetric and lower on the ETaPS due to the large temperature difference.
o The 2008 Volvo B was the only truck to register large HC emissions (10 g/mile). 3.4 Findings
o Combining pre-2007 points with post-2007 points increases the overall correlation to 0.80 for 14 of 15 trucks
o Dividing the data set (97 pts) by test cycle increases the original correlation by 7.5%, 20%, and 2.5% for Cruise, Accel and UDDS, respectively.
o Good slope agreement of one Vs/mg compared to Maricq study for Cruise and Accel cycles (97 points)
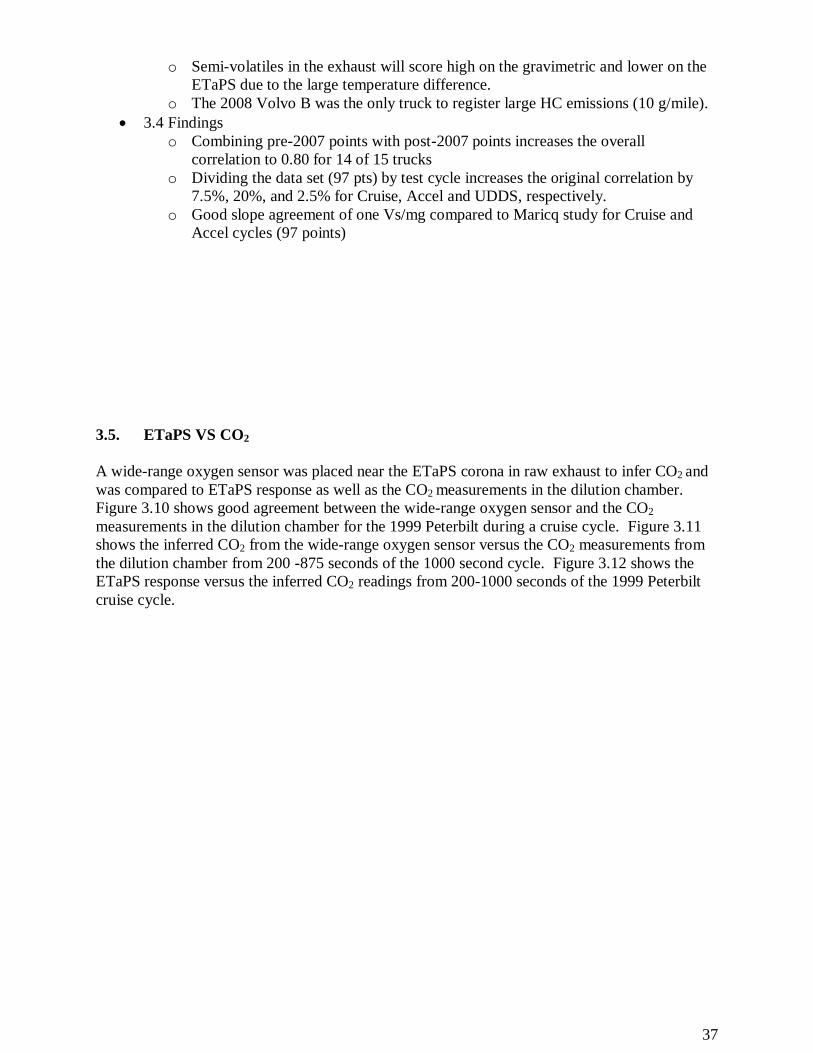
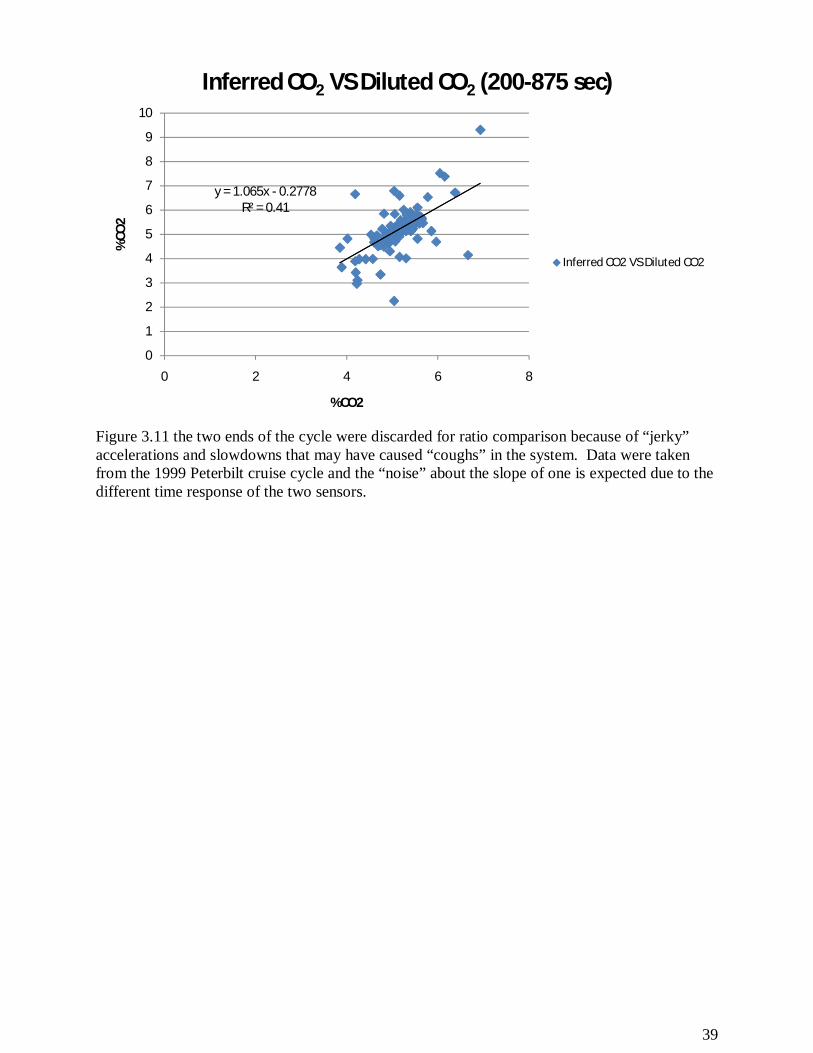
3.5. ETaPS VS CO2 A wide-range oxygen sensor was placed near the ETaPS corona in raw exhaust to infer CO2 and was compared to ETaPS response as well as the CO2 measurements in the dilution chamber. Figure 3.10 shows good agreement between the wide-range oxygen sensor and the CO2 measurements in the dilution chamber for the 1999 Peterbilt during a cruise cycle. Figure 3.11 shows the inferred CO2 from the wide-range oxygen sensor versus the CO2 measurements from the dilution chamber from 200 -875 seconds of the 1000 second cycle. Figure 3.12 shows the ETaPS response versus the inferred CO2 readings from 200-1000 seconds of the 1999 Peterbilt cruise cycle.
38
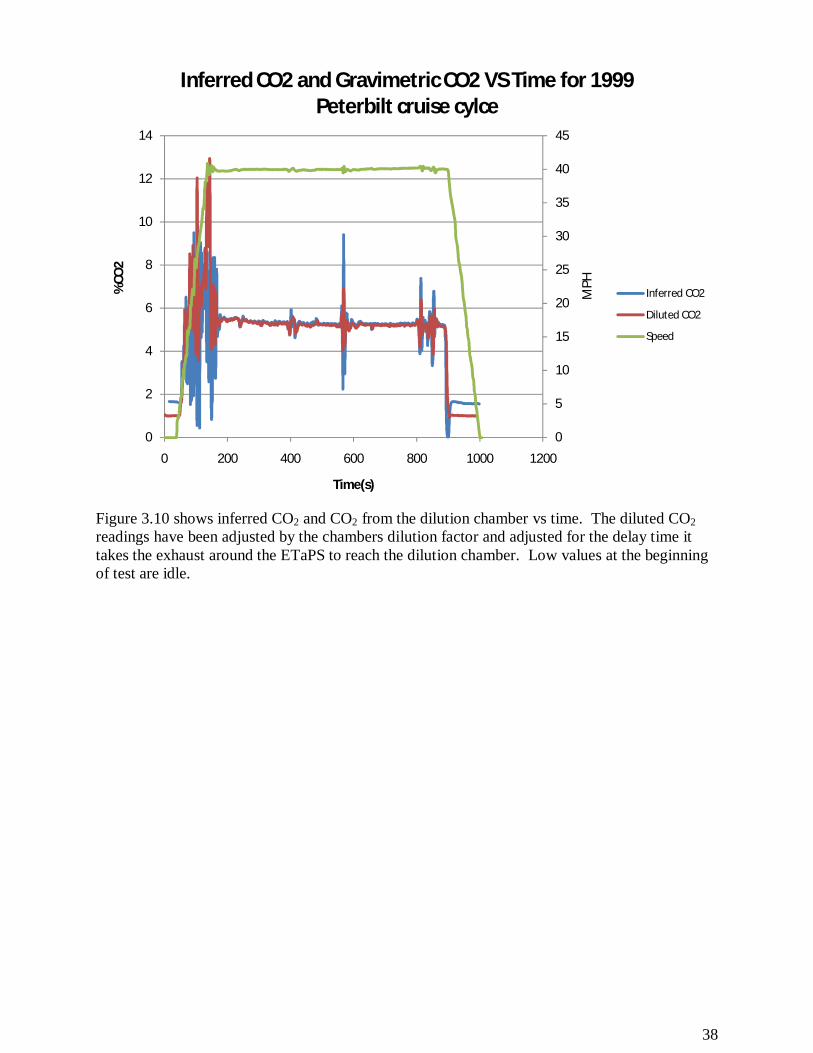
Figure 3.10 shows inferred CO2 and CO2 from the dilution chamber vs time. The diluted CO2 readings have been adjusted by the chambers dilution factor and adjusted for the delay time it takes the exhaust around the ETaPS to reach the dilution chamber. Low values at the beginning of test are idle.
0
5
10
15
20
25
30
35
40
45
0
2
4
6
8
10
12
14
0 200 400 600 800 1000 1200
MPH%CO
2
Time(s)
Inferred CO2 and Gravimetric CO2 VS Time for 1999 Peterbilt cruise cylce
Inferred CO2
Diluted CO2
Speed
39
Figure 3.11 the two ends of the cycle were discarded for ratio comparison because of “jerky” accelerations and slowdowns that may have caused “coughs” in the system. Data were taken from the 1999 Peterbilt cruise cycle and the “noise” about the slope of one is expected due to the different time response of the two sensors.
y = 1.065x - 0.2778R² = 0.41
0
1
2
3
4
5
6
7
8
9
10
0 2 4 6 8
%CO
2
%CO2
Inferred CO2 VS Diluted CO2 (200-875 sec)
Inferred CO2 VS Diluted CO2
40
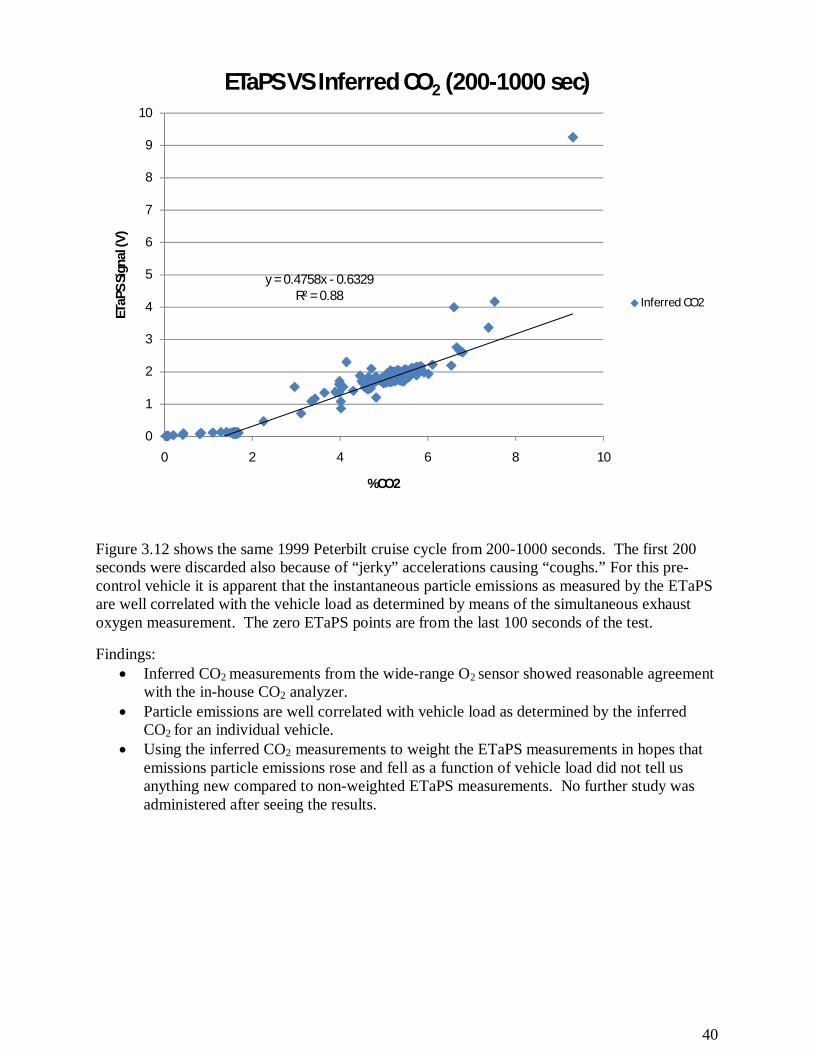
Figure 3.12 shows the same 1999 Peterbilt cruise cycle from 200-1000 seconds. The first 200 seconds were discarded also because of “jerky” accelerations causing “coughs.” For this pre-control vehicle it is apparent that the instantaneous particle emissions as measured by the ETaPS are well correlated with the vehicle load as determined by means of the simultaneous exhaust oxygen measurement. The zero ETaPS points are from the last 100 seconds of the test.
Findings: Inferred CO2 measurements from the wide-range O2 sensor showed reasonable agreement
with the in-house CO2 analyzer. Particle emissions are well correlated with vehicle load as determined by the inferred
CO2 for an individual vehicle. Using the inferred CO2 measurements to weight the ETaPS measurements in hopes that
emissions particle emissions rose and fell as a function of vehicle load did not tell us anything new compared to non-weighted ETaPS measurements. No further study was administered after seeing the results.
y = 0.4758x - 0.6329R² = 0.88
0
1
2
3
4
5
6
7
8
9
10
0 2 4 6 8 10
ETaP
S Si
gnal
(V)
%CO2
ETaPS VS Inferred CO2 (200-1000 sec)
Inferred CO2
41
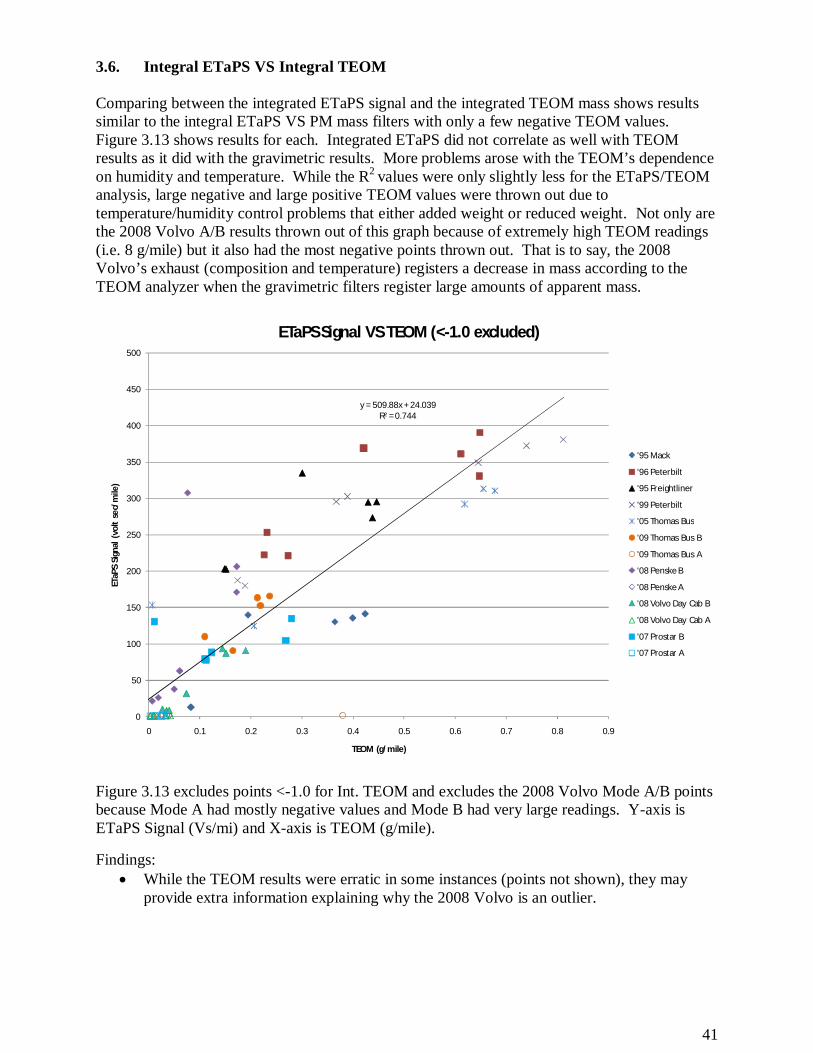
3.6. Integral ETaPS VS Integral TEOM Comparing between the integrated ETaPS signal and the integrated TEOM mass shows results similar to the integral ETaPS VS PM mass filters with only a few negative TEOM values. Figure 3.13 shows results for each. Integrated ETaPS did not correlate as well with TEOM results as it did with the gravimetric results. More problems arose with the TEOM’s dependence on humidity and temperature. While the R2 values were only slightly less for the ETaPS/TEOM analysis, large negative and large positive TEOM values were thrown out due to temperature/humidity control problems that either added weight or reduced weight. Not only are the 2008 Volvo A/B results thrown out of this graph because of extremely high TEOM readings (i.e. 8 g/mile) but it also had the most negative points thrown out. That is to say, the 2008 Volvo’s exhaust (composition and temperature) registers a decrease in mass according to the TEOM analyzer when the gravimetric filters register large amounts of apparent mass.
Figure 3.13 excludes points <-1.0 for Int. TEOM and excludes the 2008 Volvo Mode A/B points because Mode A had mostly negative values and Mode B had very large readings. Y-axis is ETaPS Signal (Vs/mi) and X-axis is TEOM (g/mile).
Findings: While the TEOM results were erratic in some instances (points not shown), they may
provide extra information explaining why the 2008 Volvo is an outlier.
y = 509.88x + 24.039R² = 0.744
0
50
100
150
200
250
300
350
400
450
500
0 0.1 0.2 0.3 0.4 0.5 0.6 0.7 0.8 0.9
ETaP
S Si
gnal
(vo
lt s
ec/m
ile)
TEOM (g/mile)
ETaPS Signal VS TEOM (<-1.0 excluded)
'95 Mack
'96 Peterbilt
'95 Freightliner
'99 Peterbilt
'05 Thomas Bus
'09 Thomas Bus B
'09 Thomas Bus A
'08 Penske B
'08 Penske A
'08 Volvo Day Cab B
'08 Volvo Day Cab A
'07 Prostar B
'07 Prostar A
42
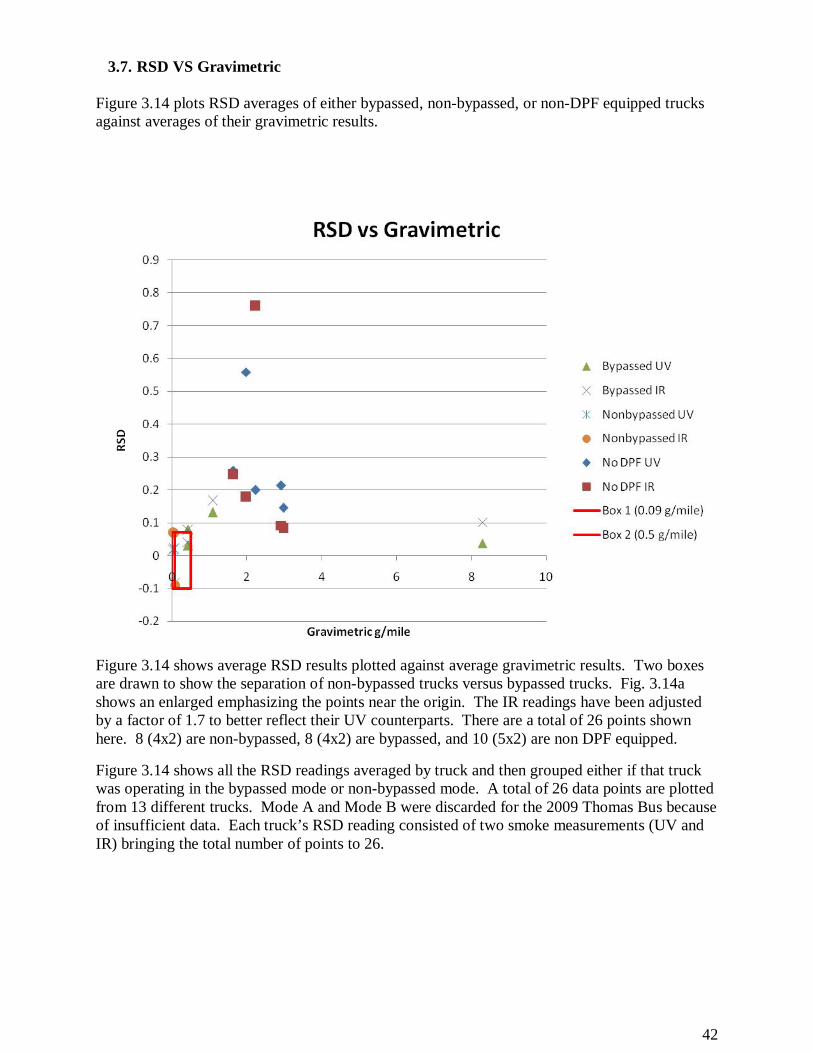
3.7. RSD VS Gravimetric
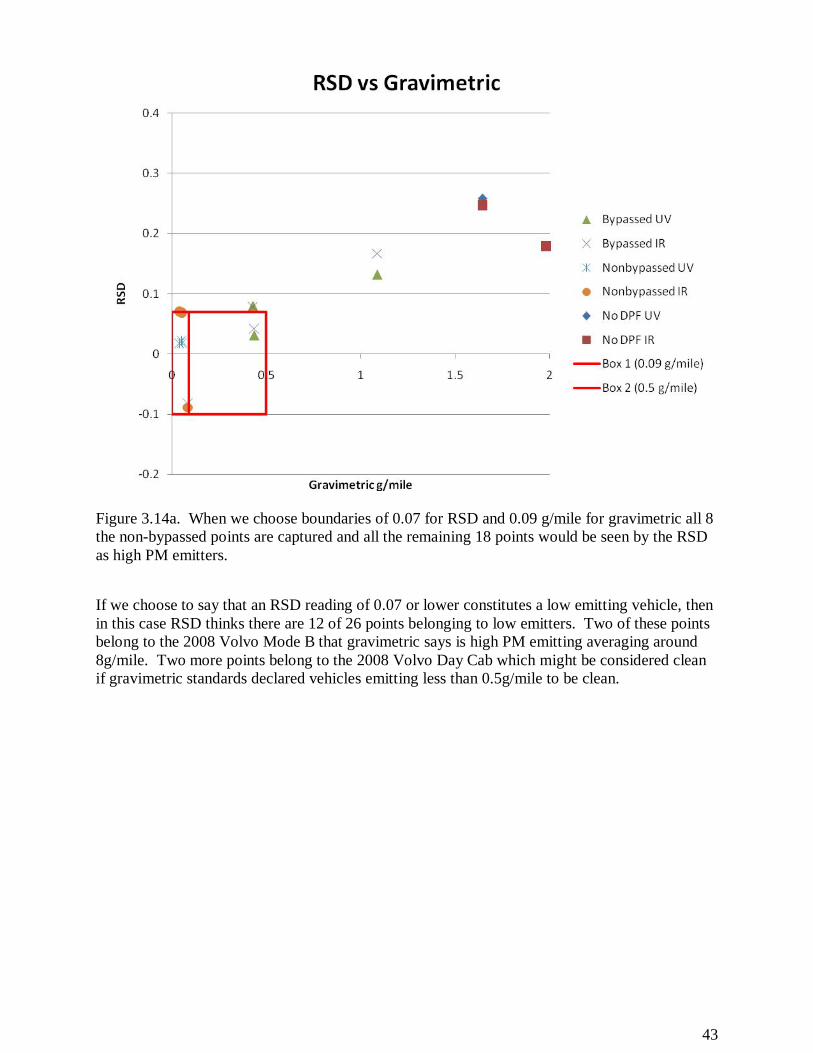
Figure 3.14 plots RSD averages of either bypassed, non-bypassed, or non-DPF equipped trucks against averages of their gravimetric results.
Figure 3.14 shows average RSD results plotted against average gravimetric results. Two boxes are drawn to show the separation of non-bypassed trucks versus bypassed trucks. Fig. 3.14a shows an enlarged emphasizing the points near the origin. The IR readings have been adjusted by a factor of 1.7 to better reflect their UV counterparts. There are a total of 26 points shown here. 8 (4x2) are non-bypassed, 8 (4x2) are bypassed, and 10 (5x2) are non DPF equipped.
Figure 3.14 shows all the RSD readings averaged by truck and then grouped either if that truck was operating in the bypassed mode or non-bypassed mode. A total of 26 data points are plotted from 13 different trucks. Mode A and Mode B were discarded for the 2009 Thomas Bus because of insufficient data. Each truck’s RSD reading consisted of two smoke measurements (UV and IR) bringing the total number of points to 26.
43
Figure 3.14a. When we choose boundaries of 0.07 for RSD and 0.09 g/mile for gravimetric all 8 the non-bypassed points are captured and all the remaining 18 points would be seen by the RSD as high PM emitters.
If we choose to say that an RSD reading of 0.07 or lower constitutes a low emitting vehicle, then in this case RSD thinks there are 12 of 26 points belonging to low emitters. Two of these points belong to the 2008 Volvo Mode B that gravimetric says is high PM emitting averaging around 8g/mile. Two more points belong to the 2008 Volvo Day Cab which might be considered clean if gravimetric standards declared vehicles emitting less than 0.5g/mile to be clean.

44
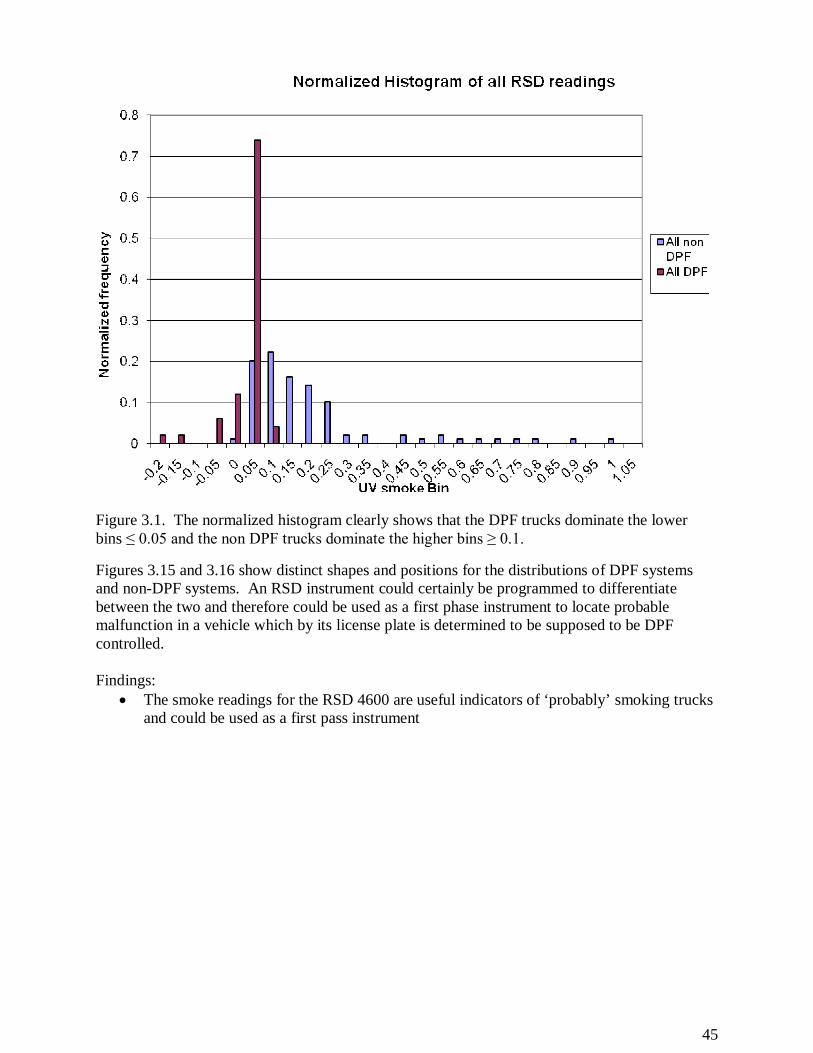
Figure 3.15 is a histogram showing the frequency of all 149 individual UV smoke readings categorized by DPF (non-bypassed) or non DPF (bypassed and not DPF equipped) trucks.
Figure 3.15 Notice the different distribution shapes as well as the position of each group. While there is some overlap between the two groups around 0.05 and 0.1, all the DPF readings abruptly halt going from 0.05 to 0.1 and the bulk of the non DPF readings in those same two bins are our attempts to create a failing DPF. The majority of the non DPF readings were in bins 0.15 and above. There were no DPF smoke readings in these same bins.
It should be noted that the where the DPF and non-DPF distributions seem to overlap there are zero UV readings from trucks with non-equipped DPF systems in the 0.05 bin and only 5 UV readings from trucks with non-equipped DPF systems in the 0.1 bin. These two bins together have 42 UV readings total. The remaining 37 UV readings are from intentionally bypassed post-2007 trucks that are still burning quite clean. Figure 3.16 shows the normalized histogram distribution for the individual UV smoke readings.
45
Figure 3.1. The normalized histogram clearly shows that the DPF trucks dominate the lower bins ≤ 0.05 and the non DPF trucks dominate the higher bins ≥ 0.1.
Figures 3.15 and 3.16 show distinct shapes and positions for the distributions of DPF systems and non-DPF systems. An RSD instrument could certainly be programmed to differentiate between the two and therefore could be used as a first phase instrument to locate probable malfunction in a vehicle which by its license plate is determined to be supposed to be DPF controlled. Findings:
The smoke readings for the RSD 4600 are useful indicators of ‘probably’ smoking trucks and could be used as a first pass instrument
46
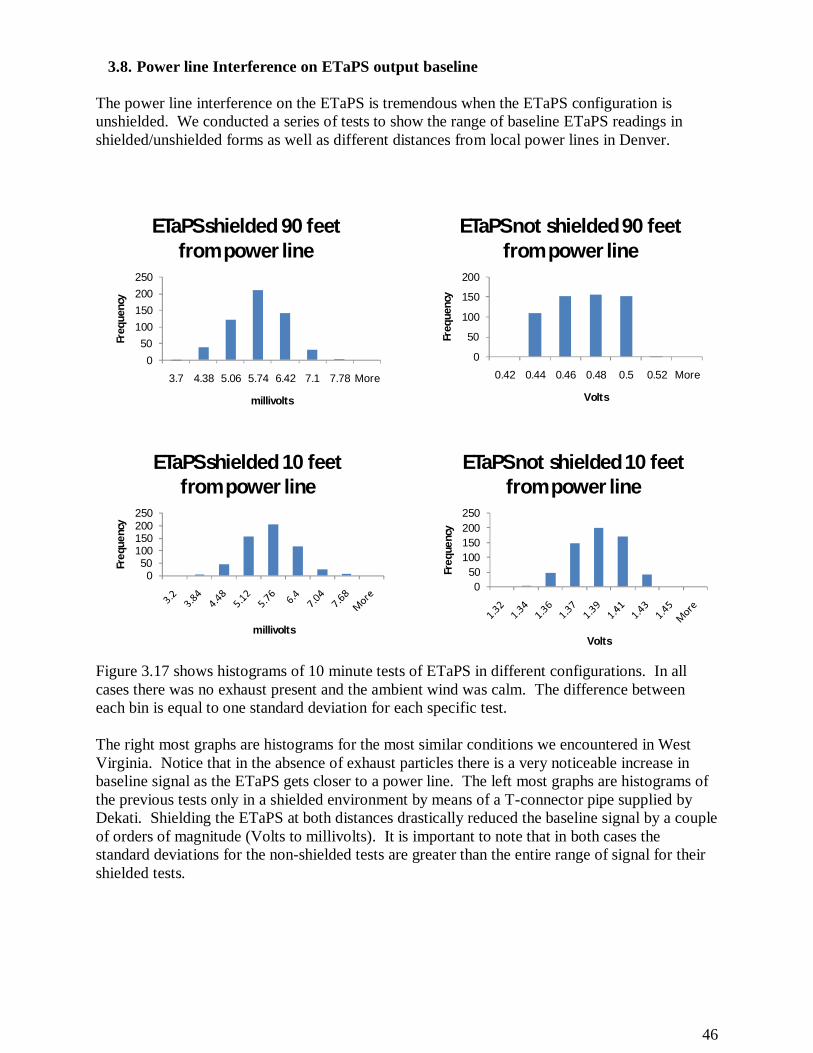
3.8. Power line Interference on ETaPS output baseline The power line interference on the ETaPS is tremendous when the ETaPS configuration is unshielded. We conducted a series of tests to show the range of baseline ETaPS readings in shielded/unshielded forms as well as different distances from local power lines in Denver.
Figure 3.17 shows histograms of 10 minute tests of ETaPS in different configurations. In all cases there was no exhaust present and the ambient wind was calm. The difference between each bin is equal to one standard deviation for each specific test. The right most graphs are histograms for the most similar conditions we encountered in West Virginia. Notice that in the absence of exhaust particles there is a very noticeable increase in baseline signal as the ETaPS gets closer to a power line. The left most graphs are histograms of the previous tests only in a shielded environment by means of a T-connector pipe supplied by Dekati. Shielding the ETaPS at both distances drastically reduced the baseline signal by a couple of orders of magnitude (Volts to millivolts). It is important to note that in both cases the standard deviations for the non-shielded tests are greater than the entire range of signal for their shielded tests.
0
50
100
150
200
0.42 0.44 0.46 0.48 0.5 0.52 More
Freq
uenc
y
Volts
ETaPS not shielded 90 feet from power line
0
50
100
150
200
250
3.7 4.38 5.06 5.74 6.42 7.1 7.78 More
Freq
uenc
y
millivolts
ETaPS shielded 90 feet from power line
050
100150200250
Freq
uenc
y
millivolts
ETaPS shielded 10 feet from power line
050
100150200250
Freq
uenc
y
Volts
ETaPS not shielded 10 feet from power line
47
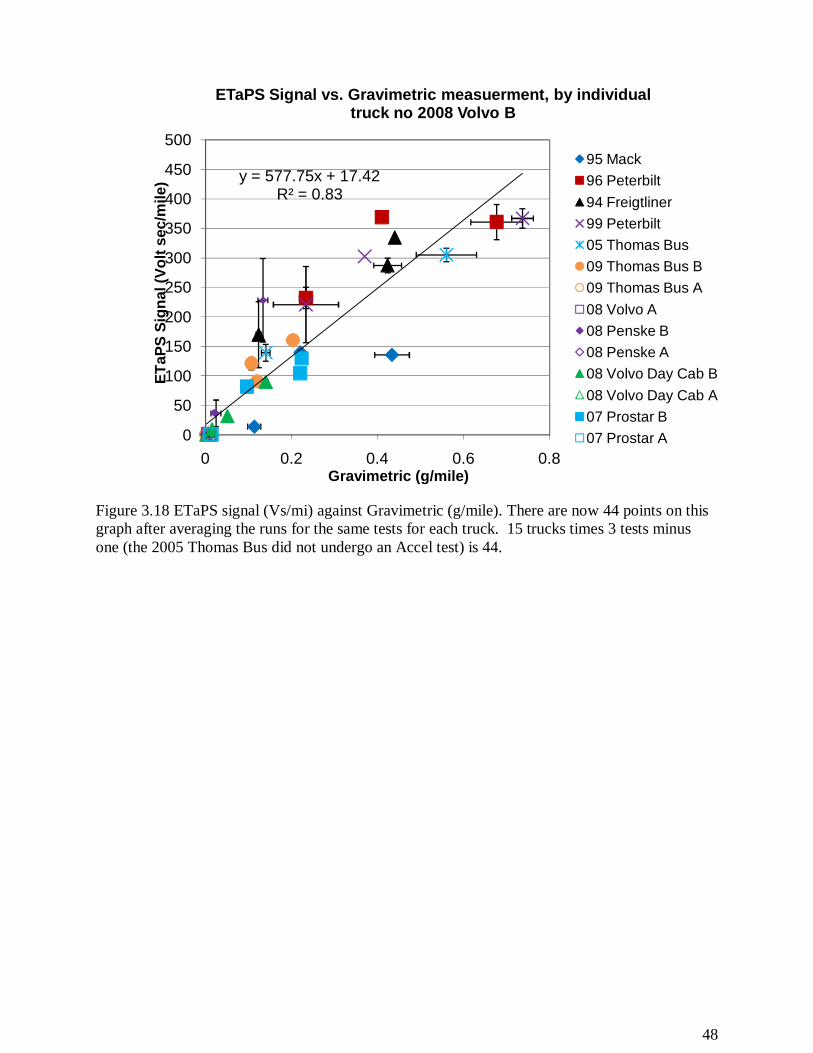
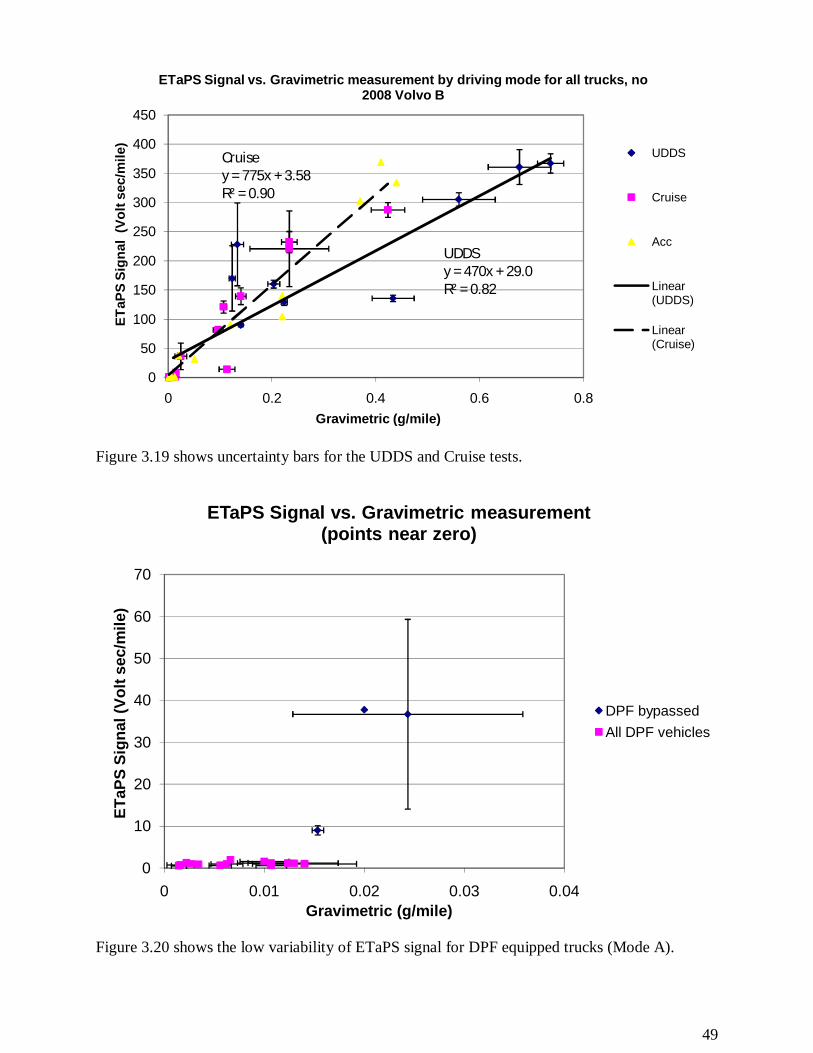
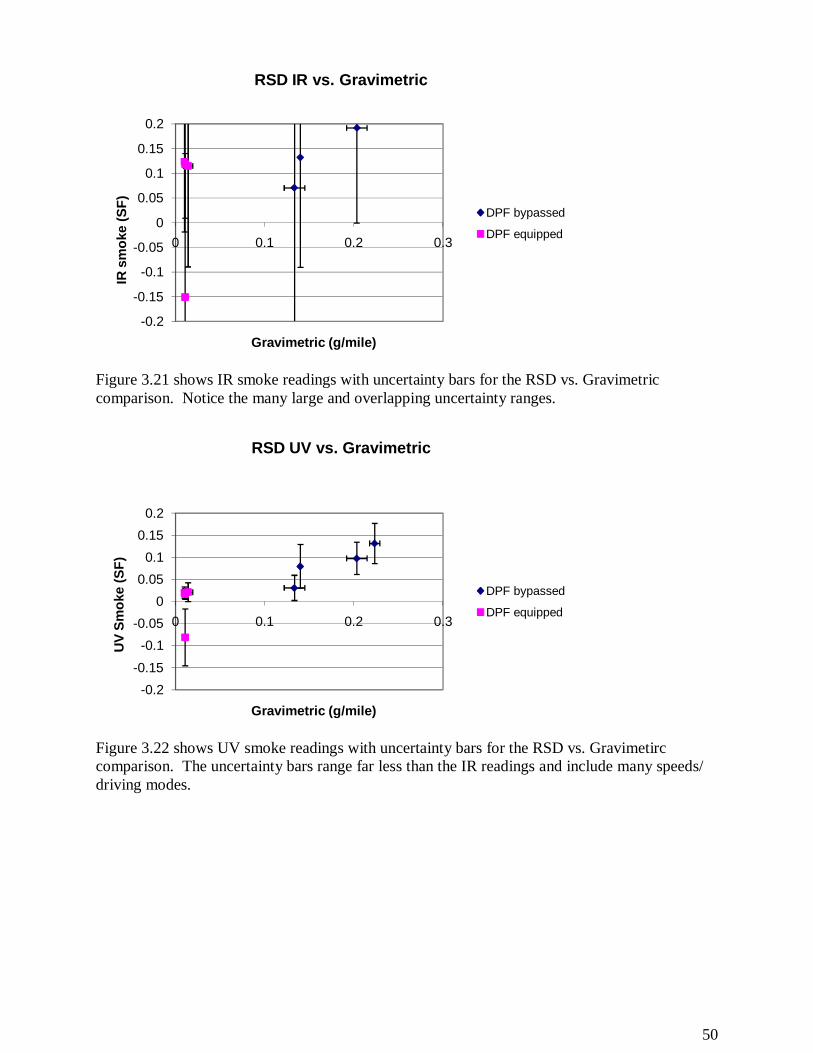
3.9. ETaPS, UV and IR Precision Without a standard, constant emission source the precision of the ETaPS can not be directly determined. However, when the same truck undertakes the same cycle three times, the range of results is a conservative measure of the ETaPS precision because some of the variability certainly arises from the vehicle/driver rather then the instrument. Figures 3.18 – 3.22 are an attempt to show the variability of the ETaPS signal using the standard deviations for the three runs done for each test. The Accel test has only one run and therefore will show no uncertainty bars. The overall correlation increases slightly from 0.80 to 0.83 when runs from the same test are averaged for each truck. Figure 3.19 separates all points by driving mode. No trendline is given for the Accel cycle because it is the same data set as previous graphs and only the points for the UDDS and the Cruise tests have been averaged. The ETaPS instrument noise for the following comparisons has been calculated to be less than or equal to 40 mVs/mi. for a DPF equipped vehicle whose total readings average less than 1 Vs/mi. and are always below 2 Vs/mi in all tests. This precision was determined from a truck tested under Mode A where particles are not present and confirmed with gravimetric results. This is very small compared with the larger uncertainty lines shown for some non-DPF trucks. The uncertainty present, with some points, represents the highly variable nature of the individual runs for each test. Figure 3.20 shows the low variability for the Mode A tested trucks near the origin with clear separation from a few Mode B tested trucks. Looking at the higher ETaPS readings in these graphs and in Appendix A, from bypassed and older trucks, the average readings vary from 8-390Vs/mi, typically nearer 100 Vs/mi with an instrument precision certainly better that 6% of the reading. Figure 3.21 shows the same uncertainty for the IR and Figure 3.22 shows uncertainty for UV smoke readings in the RSD vs. Gravimetric comparisons. A clear distinction can be seen as the variability for the IR is very large while the UV uncertainty is smaller.
48
Figure 3.18 ETaPS signal (Vs/mi) against Gravimetric (g/mile). There are now 44 points on this graph after averaging the runs for the same tests for each truck. 15 trucks times 3 tests minus one (the 2005 Thomas Bus did not undergo an Accel test) is 44.
y = 577.75x + 17.42R² = 0.83
0
50
100
150
200
250
300
350
400
450
500
0 0.2 0.4 0.6 0.8
ETaP
S Si
gnal
(Vol
t sec
/mile
)
Gravimetric (g/mile)
ETaPS Signal vs. Gravimetric measuerment, by individual truck no 2008 Volvo B
95 Mack 96 Peterbilt 94 Freigtliner 99 Peterbilt 05 Thomas Bus 09 Thomas Bus B09 Thomas Bus A08 Volvo A08 Penske B08 Penske A08 Volvo Day Cab B08 Volvo Day Cab A07 Prostar B07 Prostar Acorr
49
Figure 3.19 shows uncertainty bars for the UDDS and Cruise tests.
Figure 3.20 shows the low variability of ETaPS signal for DPF equipped trucks (Mode A).
0
50
100
150
200
250
300
350
400
450
0 0.2 0.4 0.6 0.8
ETaP
S Si
gnal
(Vo
lt se
c/m
ile)
Gravimetric (g/mile)
ETaPS Signal vs. Gravimetric measurement by driving mode for all trucks, no 2008 Volvo B
UDDS
Cruise
Acc
Linear (UDDS)
Linear (Cruise)
Cruisey = 775x + 3.58R² = 0.90
UDDSy = 470x + 29.0R² = 0.82
0
10
20
30
40
50
60
70
0 0.01 0.02 0.03 0.04
ETaP
S Si
gnal
(Vol
t sec
/mile
)
Gravimetric (g/mile)
ETaPS Signal vs. Gravimetric measurement (points near zero)
DPF bypassedAll DPF vehicles
50
Figure 3.21 shows IR smoke readings with uncertainty bars for the RSD vs. Gravimetric comparison. Notice the many large and overlapping uncertainty ranges.
Figure 3.22 shows UV smoke readings with uncertainty bars for the RSD vs. Gravimetirc comparison. The uncertainty bars range far less than the IR readings and include many speeds/ driving modes.
-0.2
-0.15
-0.1
-0.05
0
0.05
0.1
0.15
0.2
0 0.1 0.2 0.3
IR s
mok
e (S
F)
Gravimetric (g/mile)
RSD IR vs. Gravimetric
DPF bypassed
DPF equipped
-0.2-0.15
-0.1-0.05
00.05
0.10.15
0.2
0 0.1 0.2 0.3
UV
Smok
e (S
F)
Gravimetric (g/mile)
RSD UV vs. Gravimetric
DPF bypassed
DPF equipped
51
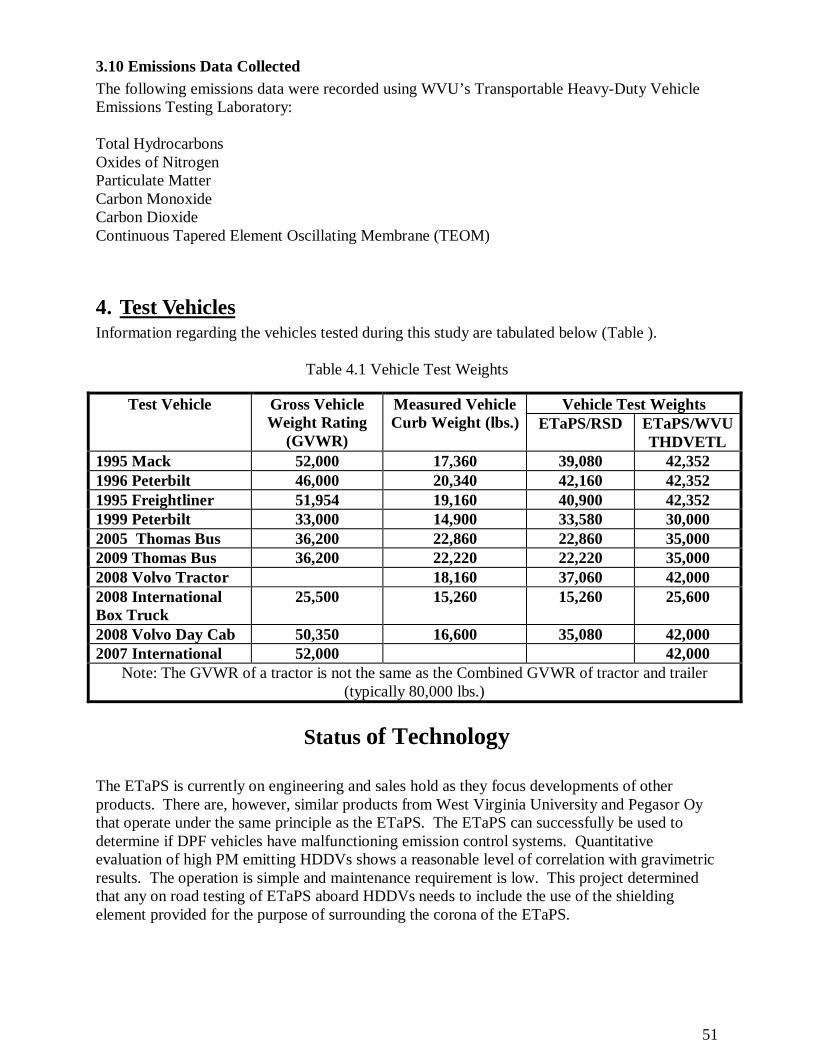
3.10 Emissions Data Collected The following emissions data were recorded using WVU’s Transportable Heavy-Duty Vehicle Emissions Testing Laboratory: Total Hydrocarbons Oxides of Nitrogen Particulate Matter Carbon Monoxide Carbon Dioxide Continuous Tapered Element Oscillating Membrane (TEOM)
4. Test Vehicles Information regarding the vehicles tested during this study are tabulated below (Table ).
Table 4.1 Vehicle Test Weights
Test Vehicle Gross Vehicle Weight Rating
(GVWR)
Measured Vehicle Curb Weight (lbs.)
Vehicle Test Weights ETaPS/RSD ETaPS/WVU
THDVETL 1995 Mack 52,000 17,360 39,080 42,352 1996 Peterbilt 46,000 20,340 42,160 42,352 1995 Freightliner 51,954 19,160 40,900 42,352 1999 Peterbilt 33,000 14,900 33,580 30,000 2005 Thomas Bus 36,200 22,860 22,860 35,000 2009 Thomas Bus 36,200 22,220 22,220 35,000 2008 Volvo Tractor 18,160 37,060 42,000 2008 International Box Truck
25,500 15,260 15,260 25,600
2008 Volvo Day Cab 50,350 16,600 35,080 42,000 2007 International 52,000 42,000
Note: The GVWR of a tractor is not the same as the Combined GVWR of tractor and trailer (typically 80,000 lbs.)
Status of Technology
The ETaPS is currently on engineering and sales hold as they focus developments of other products. There are, however, similar products from West Virginia University and Pegasor Oy that operate under the same principle as the ETaPS. The ETaPS can successfully be used to determine if DPF vehicles have malfunctioning emission control systems. Quantitative evaluation of high PM emitting HDDVs shows a reasonable level of correlation with gravimetric results. The operation is simple and maintenance requirement is low. This project determined that any on road testing of ETaPS aboard HDDVs needs to include the use of the shielding element provided for the purpose of surrounding the corona of the ETaPS.
52
Appendix A
Program Summary This study has focused on the emissions evaluation of 15 heavy-duty vehicle configurations over four different driving cycles: three dynamometer cycles and one test track cycle. Each vehicle configuration was tested on-road concurrently with RSD and ETaPS, as well as on WVU’s chassis dynamometer, with simultaneous ETaPS measurements, in order to correlate PM mass emissions. Per WVU’s telecom with ESP (Niranjan Vescio), CARB (John Collins), and University of Denver (Don Stedman) the following test vehicle configurations were selected.
1. Five vehicles (pre-2007 model year) without diesel particulate filters (DPFs) were tested in the initial phase of the study.
2. An additional five vehicles (post-2007 model year) that were equipped with a DPF and/or an oxidation catalyst were tested during the second phase of the study.
3. For each of the post-2007 vehicles (five), the exhaust system was modified by installing a bypass loop around the aftertreatment system. The amount of bypass was controlled to alter the exhaust stream PM concentration downstream of the aftertreatment system in order to simulate a DPF failure, as well as attempt to quantify the low-level sensitivity/performance of the ETaPS.
4. Each vehicle was tested on the following dynamometer driving cycles: a. UDDS (three replicates) – 15 trucks, 45 runs b. Steady State (three replicates) called the ETaPS 40 cycle – 15 trucks, 45 runs c. ETaPS acceleration cycle – 15 trucks, 14 runs (no Accel data for 2005 Thomas
Bus). 5. In addition, 15 vehicles were tested by driving them on a test track through a RSD 4600
(ESP device) a. Acceleration cycle (Loaded/Unloaded, 3-4 different speeds, Mode A/B) – 15
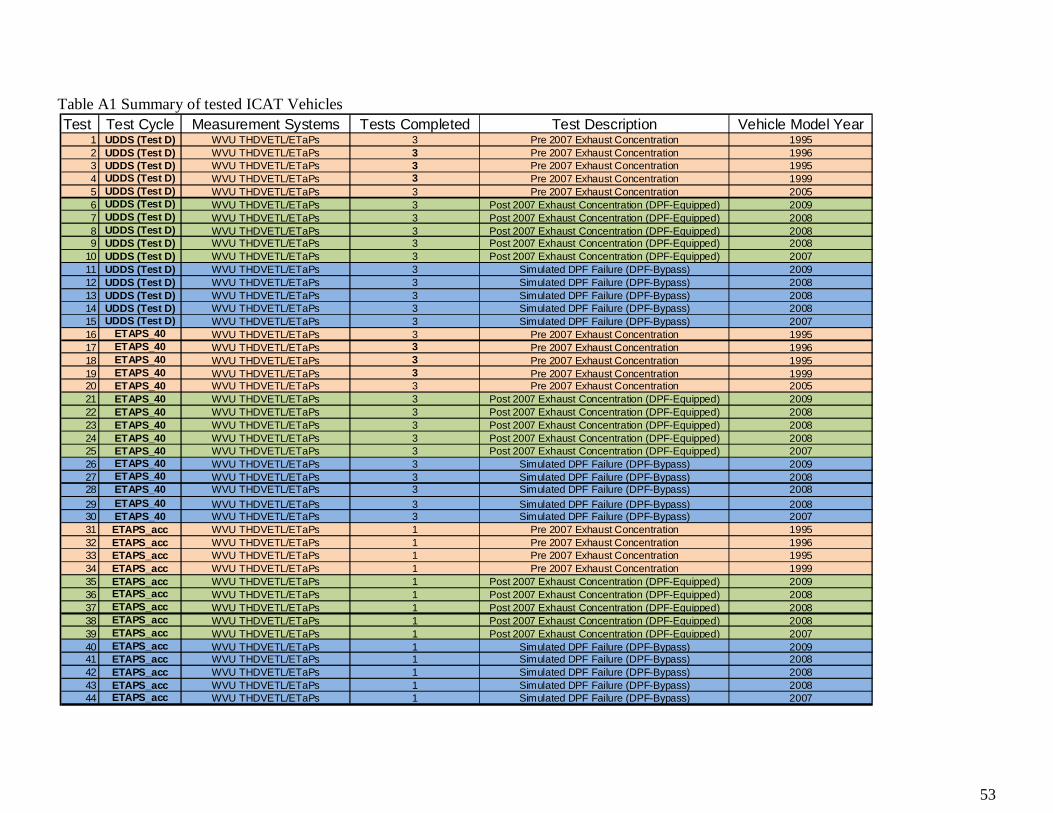
trucks, 149 runs The above test plan resulted in a total of 44 test configurations. WVU conducted chassis dynamometer tests on three different cycles instead of only one. We found that evaluating multiple post-2007 vehicles did not yield significantly different exhaust characteristics, in particular the PM emissions; hence, the correlation study between ETaPS and the chassis dynamometer data would have been rather futile. However, running a vehicle on different cycles produced exhaust streams of relatively different characteristics, thereby providing for a meaningful demonstration study of the ETaPS and its comparison against the gravimetric measurements and the TEOM. A summary of the vehicle tests is included as Table A1. A complete list of results is included in Table A2.
53
Table A1 Summary of tested ICAT Vehicles
Test Test Cycle Measurement Systems Tests Completed Test Description Vehicle Model Year1 UDDS (Test D) WVU THDVETL/ETaPs 3 Pre 2007 Exhaust Concentration 19952 UDDS (Test D) WVU THDVETL/ETaPs 3 Pre 2007 Exhaust Concentration 19963 UDDS (Test D) WVU THDVETL/ETaPs 3 Pre 2007 Exhaust Concentration 19954 UDDS (Test D) WVU THDVETL/ETaPs 3 Pre 2007 Exhaust Concentration 19995 UDDS (Test D) WVU THDVETL/ETaPs 3 Pre 2007 Exhaust Concentration 20056 UDDS (Test D) WVU THDVETL/ETaPs 3 Post 2007 Exhaust Concentration (DPF-Equipped) 20097 UDDS (Test D) WVU THDVETL/ETaPs 3 Post 2007 Exhaust Concentration (DPF-Equipped) 20088 UDDS (Test D) WVU THDVETL/ETaPs 3 Post 2007 Exhaust Concentration (DPF-Equipped) 20089 UDDS (Test D) WVU THDVETL/ETaPs 3 Post 2007 Exhaust Concentration (DPF-Equipped) 2008
10 UDDS (Test D) WVU THDVETL/ETaPs 3 Post 2007 Exhaust Concentration (DPF-Equipped) 200711 UDDS (Test D) WVU THDVETL/ETaPs 3 Simulated DPF Failure (DPF-Bypass) 200912 UDDS (Test D) WVU THDVETL/ETaPs 3 Simulated DPF Failure (DPF-Bypass) 200813 UDDS (Test D) WVU THDVETL/ETaPs 3 Simulated DPF Failure (DPF-Bypass) 200814 UDDS (Test D) WVU THDVETL/ETaPs 3 Simulated DPF Failure (DPF-Bypass) 200815 UDDS (Test D) WVU THDVETL/ETaPs 3 Simulated DPF Failure (DPF-Bypass) 200716 ETAPS_40 WVU THDVETL/ETaPs 3 Pre 2007 Exhaust Concentration 199517 ETAPS_40 WVU THDVETL/ETaPs 3 Pre 2007 Exhaust Concentration 199618 ETAPS_40 WVU THDVETL/ETaPs 3 Pre 2007 Exhaust Concentration 199519 ETAPS_40 WVU THDVETL/ETaPs 3 Pre 2007 Exhaust Concentration 199920 ETAPS_40 WVU THDVETL/ETaPs 3 Pre 2007 Exhaust Concentration 200521 ETAPS_40 WVU THDVETL/ETaPs 3 Post 2007 Exhaust Concentration (DPF-Equipped) 200922 ETAPS_40 WVU THDVETL/ETaPs 3 Post 2007 Exhaust Concentration (DPF-Equipped) 200823 ETAPS_40 WVU THDVETL/ETaPs 3 Post 2007 Exhaust Concentration (DPF-Equipped) 200824 ETAPS_40 WVU THDVETL/ETaPs 3 Post 2007 Exhaust Concentration (DPF-Equipped) 200825 ETAPS_40 WVU THDVETL/ETaPs 3 Post 2007 Exhaust Concentration (DPF-Equipped) 200726 ETAPS_40 WVU THDVETL/ETaPs 3 Simulated DPF Failure (DPF-Bypass) 200927 ETAPS_40 WVU THDVETL/ETaPs 3 Simulated DPF Failure (DPF-Bypass) 200828 ETAPS_40 WVU THDVETL/ETaPs 3 Simulated DPF Failure (DPF-Bypass) 200829 ETAPS_40 WVU THDVETL/ETaPs 3 Simulated DPF Failure (DPF-Bypass) 200830 ETAPS_40 WVU THDVETL/ETaPs 3 Simulated DPF Failure (DPF-Bypass) 200731 ETAPS_acc WVU THDVETL/ETaPs 1 Pre 2007 Exhaust Concentration 199532 ETAPS_acc WVU THDVETL/ETaPs 1 Pre 2007 Exhaust Concentration 199633 ETAPS_acc WVU THDVETL/ETaPs 1 Pre 2007 Exhaust Concentration 199534 ETAPS_acc WVU THDVETL/ETaPs 1 Pre 2007 Exhaust Concentration 199935 ETAPS_acc WVU THDVETL/ETaPs 1 Post 2007 Exhaust Concentration (DPF-Equipped) 200936 ETAPS_acc WVU THDVETL/ETaPs 1 Post 2007 Exhaust Concentration (DPF-Equipped) 200837 ETAPS_acc WVU THDVETL/ETaPs 1 Post 2007 Exhaust Concentration (DPF-Equipped) 200838 ETAPS_acc WVU THDVETL/ETaPs 1 Post 2007 Exhaust Concentration (DPF-Equipped) 200839 ETAPS_acc WVU THDVETL/ETaPs 1 Post 2007 Exhaust Concentration (DPF-Equipped) 200740 ETAPS_acc WVU THDVETL/ETaPs 1 Simulated DPF Failure (DPF-Bypass) 200941 ETAPS_acc WVU THDVETL/ETaPs 1 Simulated DPF Failure (DPF-Bypass) 200842 ETAPS_acc WVU THDVETL/ETaPs 1 Simulated DPF Failure (DPF-Bypass) 200843 ETAPS_acc WVU THDVETL/ETaPs 1 Simulated DPF Failure (DPF-Bypass) 200844 ETAPS_acc WVU THDVETL/ETaPs 1 Simulated DPF Failure (DPF-Bypass) 2007
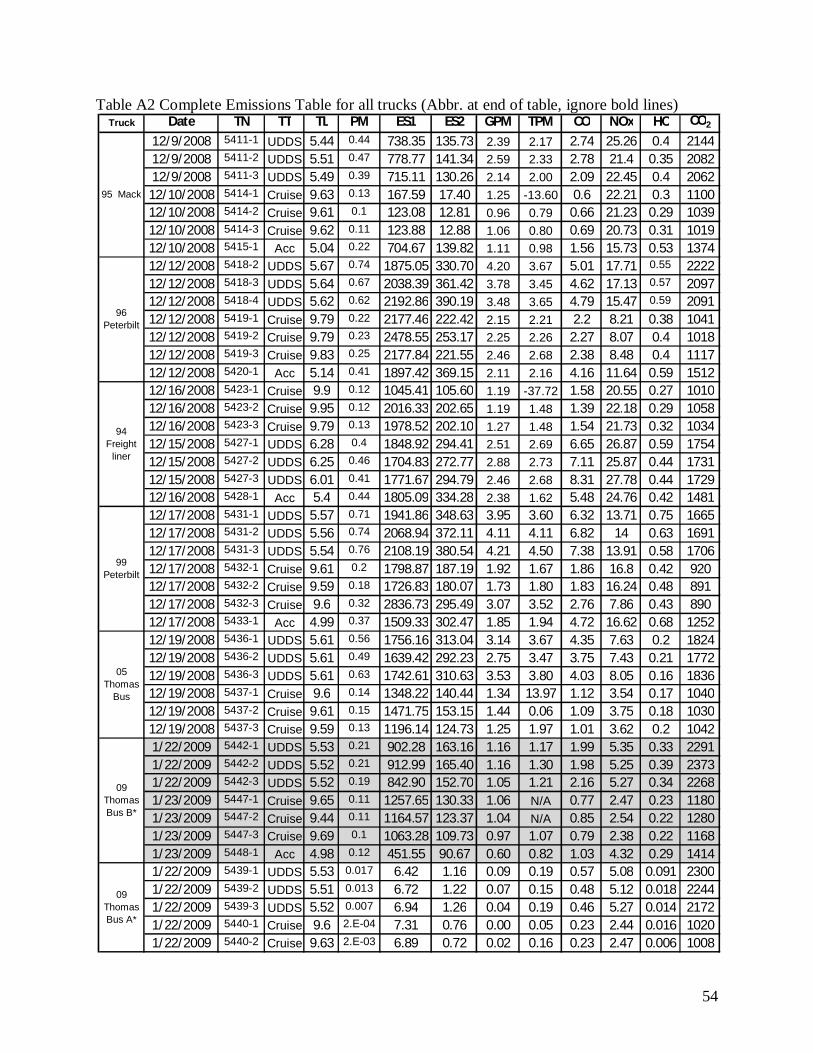
54
Table A2 Complete Emissions Table for all trucks (Abbr. at end of table, ignore bold lines)
Truck Date TN TT TL PM ES1 ES2 GPM TPM CO NOx HC CO2
12/9/2008 5411-1 UDDS 5.44 0.44 738.35 135.73 2.39 2.17 2.74 25.26 0.4 214412/9/2008 5411-2 UDDS 5.51 0.47 778.77 141.34 2.59 2.33 2.78 21.4 0.35 208212/9/2008 5411-3 UDDS 5.49 0.39 715.11 130.26 2.14 2.00 2.09 22.45 0.4 2062
12/10/2008 5414-1 Cruise 9.63 0.13 167.59 17.40 1.25 -13.60 0.6 22.21 0.3 110012/10/2008 5414-2 Cruise 9.61 0.1 123.08 12.81 0.96 0.79 0.66 21.23 0.29 103912/10/2008 5414-3 Cruise 9.62 0.11 123.88 12.88 1.06 0.80 0.69 20.73 0.31 101912/10/2008 5415-1 Acc 5.04 0.22 704.67 139.82 1.11 0.98 1.56 15.73 0.53 137412/12/2008 5418-2 UDDS 5.67 0.74 1875.05 330.70 4.20 3.67 5.01 17.71 0.55 222212/12/2008 5418-3 UDDS 5.64 0.67 2038.39 361.42 3.78 3.45 4.62 17.13 0.57 209712/12/2008 5418-4 UDDS 5.62 0.62 2192.86 390.19 3.48 3.65 4.79 15.47 0.59 209112/12/2008 5419-1 Cruise 9.79 0.22 2177.46 222.42 2.15 2.21 2.2 8.21 0.38 104112/12/2008 5419-2 Cruise 9.79 0.23 2478.55 253.17 2.25 2.26 2.27 8.07 0.4 101812/12/2008 5419-3 Cruise 9.83 0.25 2177.84 221.55 2.46 2.68 2.38 8.48 0.4 111712/12/2008 5420-1 Acc 5.14 0.41 1897.42 369.15 2.11 2.16 4.16 11.64 0.59 151212/16/2008 5423-1 Cruise 9.9 0.12 1045.41 105.60 1.19 -37.72 1.58 20.55 0.27 101012/16/2008 5423-2 Cruise 9.95 0.12 2016.33 202.65 1.19 1.48 1.39 22.18 0.29 105812/16/2008 5423-3 Cruise 9.79 0.13 1978.52 202.10 1.27 1.48 1.54 21.73 0.32 103412/15/2008 5427-1 UDDS 6.28 0.4 1848.92 294.41 2.51 2.69 6.65 26.87 0.59 175412/15/2008 5427-2 UDDS 6.25 0.46 1704.83 272.77 2.88 2.73 7.11 25.87 0.44 173112/15/2008 5427-3 UDDS 6.01 0.41 1771.67 294.79 2.46 2.68 8.31 27.78 0.44 172912/16/2008 5428-1 Acc 5.4 0.44 1805.09 334.28 2.38 1.62 5.48 24.76 0.42 148112/17/2008 5431-1 UDDS 5.57 0.71 1941.86 348.63 3.95 3.60 6.32 13.71 0.75 166512/17/2008 5431-2 UDDS 5.56 0.74 2068.94 372.11 4.11 4.11 6.82 14 0.63 169112/17/2008 5431-3 UDDS 5.54 0.76 2108.19 380.54 4.21 4.50 7.38 13.91 0.58 170612/17/2008 5432-1 Cruise 9.61 0.2 1798.87 187.19 1.92 1.67 1.86 16.8 0.42 92012/17/2008 5432-2 Cruise 9.59 0.18 1726.83 180.07 1.73 1.80 1.83 16.24 0.48 89112/17/2008 5432-3 Cruise 9.6 0.32 2836.73 295.49 3.07 3.52 2.76 7.86 0.43 89012/17/2008 5433-1 Acc 4.99 0.37 1509.33 302.47 1.85 1.94 4.72 16.62 0.68 125212/19/2008 5436-1 UDDS 5.61 0.56 1756.16 313.04 3.14 3.67 4.35 7.63 0.2 182412/19/2008 5436-2 UDDS 5.61 0.49 1639.42 292.23 2.75 3.47 3.75 7.43 0.21 177212/19/2008 5436-3 UDDS 5.61 0.63 1742.61 310.63 3.53 3.80 4.03 8.05 0.16 183612/19/2008 5437-1 Cruise 9.6 0.14 1348.22 140.44 1.34 13.97 1.12 3.54 0.17 104012/19/2008 5437-2 Cruise 9.61 0.15 1471.75 153.15 1.44 0.06 1.09 3.75 0.18 103012/19/2008 5437-3 Cruise 9.59 0.13 1196.14 124.73 1.25 1.97 1.01 3.62 0.2 10421/22/2009 5442-1 UDDS 5.53 0.21 902.28 163.16 1.16 1.17 1.99 5.35 0.33 22911/22/2009 5442-2 UDDS 5.52 0.21 912.99 165.40 1.16 1.30 1.98 5.25 0.39 23731/22/2009 5442-3 UDDS 5.52 0.19 842.90 152.70 1.05 1.21 2.16 5.27 0.34 22681/23/2009 5447-1 Cruise 9.65 0.11 1257.65 130.33 1.06 N/A 0.77 2.47 0.23 11801/23/2009 5447-2 Cruise 9.44 0.11 1164.57 123.37 1.04 N/A 0.85 2.54 0.22 12801/23/2009 5447-3 Cruise 9.69 0.1 1063.28 109.73 0.97 1.07 0.79 2.38 0.22 11681/23/2009 5448-1 Acc 4.98 0.12 451.55 90.67 0.60 0.82 1.03 4.32 0.29 14141/22/2009 5439-1 UDDS 5.53 0.017 6.42 1.16 0.09 0.19 0.57 5.08 0.091 23001/22/2009 5439-2 UDDS 5.51 0.013 6.72 1.22 0.07 0.15 0.48 5.12 0.018 22441/22/2009 5439-3 UDDS 5.52 0.007 6.94 1.26 0.04 0.19 0.46 5.27 0.014 21721/22/2009 5440-1 Cruise 9.6 2.E-04 7.31 0.76 0.00 0.05 0.23 2.44 0.016 10201/22/2009 5440-2 Cruise 9.63 2.E-03 6.89 0.72 0.02 0.16 0.23 2.47 0.006 1008
94 Freight
liner
99 Peterbilt
05 Thomas
Bus
09 Thomas Bus B*
09 Thomas Bus A*
96 Peterbilt
95 Mack
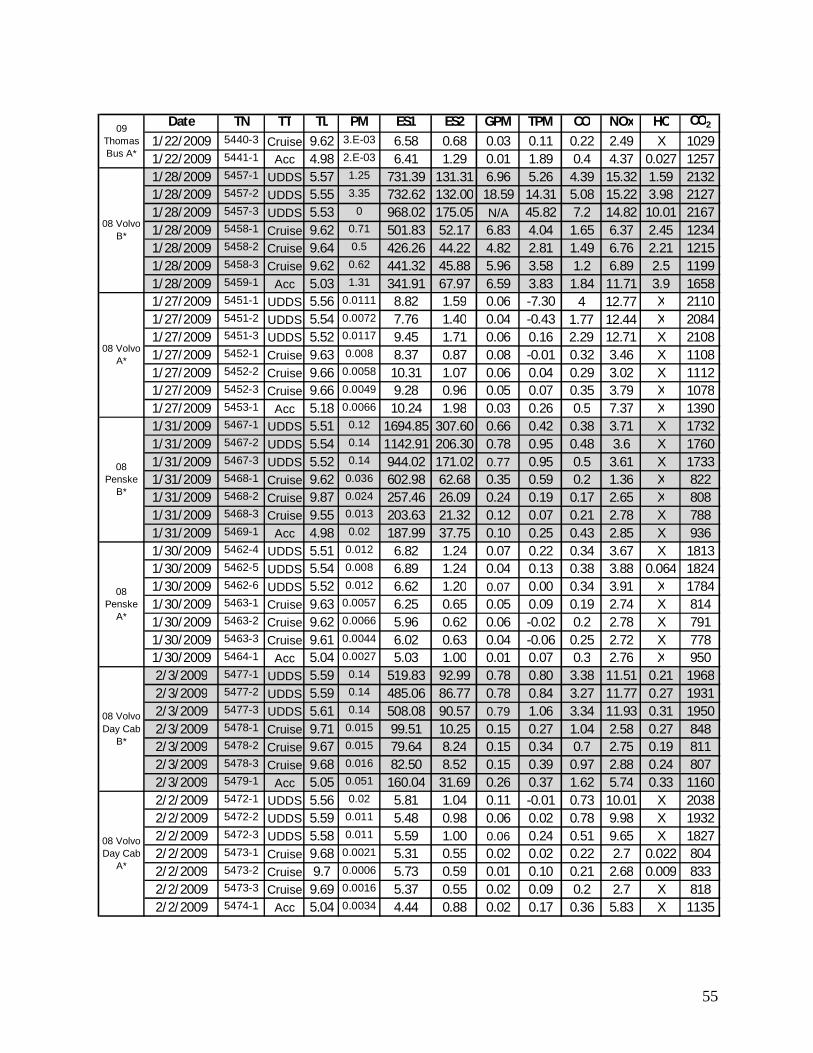
55
Date TN TT TL PM ES1 ES2 GPM TPM CO NOx HC CO2
1/22/2009 5440-3 Cruise 9.62 3.E-03 6.58 0.68 0.03 0.11 0.22 2.49 X 10291/22/2009 5441-1 Acc 4.98 2.E-03 6.41 1.29 0.01 1.89 0.4 4.37 0.027 12571/28/2009 5457-1 UDDS 5.57 1.25 731.39 131.31 6.96 5.26 4.39 15.32 1.59 21321/28/2009 5457-2 UDDS 5.55 3.35 732.62 132.00 18.59 14.31 5.08 15.22 3.98 21271/28/2009 5457-3 UDDS 5.53 0 968.02 175.05 N/A 45.82 7.2 14.82 10.01 21671/28/2009 5458-1 Cruise 9.62 0.71 501.83 52.17 6.83 4.04 1.65 6.37 2.45 12341/28/2009 5458-2 Cruise 9.64 0.5 426.26 44.22 4.82 2.81 1.49 6.76 2.21 12151/28/2009 5458-3 Cruise 9.62 0.62 441.32 45.88 5.96 3.58 1.2 6.89 2.5 11991/28/2009 5459-1 Acc 5.03 1.31 341.91 67.97 6.59 3.83 1.84 11.71 3.9 16581/27/2009 5451-1 UDDS 5.56 0.0111 8.82 1.59 0.06 -7.30 4 12.77 X 21101/27/2009 5451-2 UDDS 5.54 0.0072 7.76 1.40 0.04 -0.43 1.77 12.44 X 20841/27/2009 5451-3 UDDS 5.52 0.0117 9.45 1.71 0.06 0.16 2.29 12.71 X 21081/27/2009 5452-1 Cruise 9.63 0.008 8.37 0.87 0.08 -0.01 0.32 3.46 X 11081/27/2009 5452-2 Cruise 9.66 0.0058 10.31 1.07 0.06 0.04 0.29 3.02 X 11121/27/2009 5452-3 Cruise 9.66 0.0049 9.28 0.96 0.05 0.07 0.35 3.79 X 10781/27/2009 5453-1 Acc 5.18 0.0066 10.24 1.98 0.03 0.26 0.5 7.37 X 13901/31/2009 5467-1 UDDS 5.51 0.12 1694.85 307.60 0.66 0.42 0.38 3.71 X 17321/31/2009 5467-2 UDDS 5.54 0.14 1142.91 206.30 0.78 0.95 0.48 3.6 X 17601/31/2009 5467-3 UDDS 5.52 0.14 944.02 171.02 0.77 0.95 0.5 3.61 X 17331/31/2009 5468-1 Cruise 9.62 0.036 602.98 62.68 0.35 0.59 0.2 1.36 X 8221/31/2009 5468-2 Cruise 9.87 0.024 257.46 26.09 0.24 0.19 0.17 2.65 X 8081/31/2009 5468-3 Cruise 9.55 0.013 203.63 21.32 0.12 0.07 0.21 2.78 X 7881/31/2009 5469-1 Acc 4.98 0.02 187.99 37.75 0.10 0.25 0.43 2.85 X 9361/30/2009 5462-4 UDDS 5.51 0.012 6.82 1.24 0.07 0.22 0.34 3.67 X 18131/30/2009 5462-5 UDDS 5.54 0.008 6.89 1.24 0.04 0.13 0.38 3.88 0.064 18241/30/2009 5462-6 UDDS 5.52 0.012 6.62 1.20 0.07 0.00 0.34 3.91 X 17841/30/2009 5463-1 Cruise 9.63 0.0057 6.25 0.65 0.05 0.09 0.19 2.74 X 8141/30/2009 5463-2 Cruise 9.62 0.0066 5.96 0.62 0.06 -0.02 0.2 2.78 X 7911/30/2009 5463-3 Cruise 9.61 0.0044 6.02 0.63 0.04 -0.06 0.25 2.72 X 7781/30/2009 5464-1 Acc 5.04 0.0027 5.03 1.00 0.01 0.07 0.3 2.76 X 9502/3/2009 5477-1 UDDS 5.59 0.14 519.83 92.99 0.78 0.80 3.38 11.51 0.21 19682/3/2009 5477-2 UDDS 5.59 0.14 485.06 86.77 0.78 0.84 3.27 11.77 0.27 19312/3/2009 5477-3 UDDS 5.61 0.14 508.08 90.57 0.79 1.06 3.34 11.93 0.31 19502/3/2009 5478-1 Cruise 9.71 0.015 99.51 10.25 0.15 0.27 1.04 2.58 0.27 8482/3/2009 5478-2 Cruise 9.67 0.015 79.64 8.24 0.15 0.34 0.7 2.75 0.19 8112/3/2009 5478-3 Cruise 9.68 0.016 82.50 8.52 0.15 0.39 0.97 2.88 0.24 8072/3/2009 5479-1 Acc 5.05 0.051 160.04 31.69 0.26 0.37 1.62 5.74 0.33 11602/2/2009 5472-1 UDDS 5.56 0.02 5.81 1.04 0.11 -0.01 0.73 10.01 X 20382/2/2009 5472-2 UDDS 5.59 0.011 5.48 0.98 0.06 0.02 0.78 9.98 X 19322/2/2009 5472-3 UDDS 5.58 0.011 5.59 1.00 0.06 0.24 0.51 9.65 X 18272/2/2009 5473-1 Cruise 9.68 0.0021 5.31 0.55 0.02 0.02 0.22 2.7 0.022 8042/2/2009 5473-2 Cruise 9.7 0.0006 5.73 0.59 0.01 0.10 0.21 2.68 0.009 8332/2/2009 5473-3 Cruise 9.69 0.0016 5.37 0.55 0.02 0.09 0.2 2.7 X 8182/2/2009 5474-1 Acc 5.04 0.0034 4.44 0.88 0.02 0.17 0.36 5.83 X 1135
08 Volvo A*
08 Penske
B*
08 Penske
A*
08 Volvo Day Cab
B*
08 Volvo Day Cab
A*
08 Volvo B*
09 Thomas Bus A*
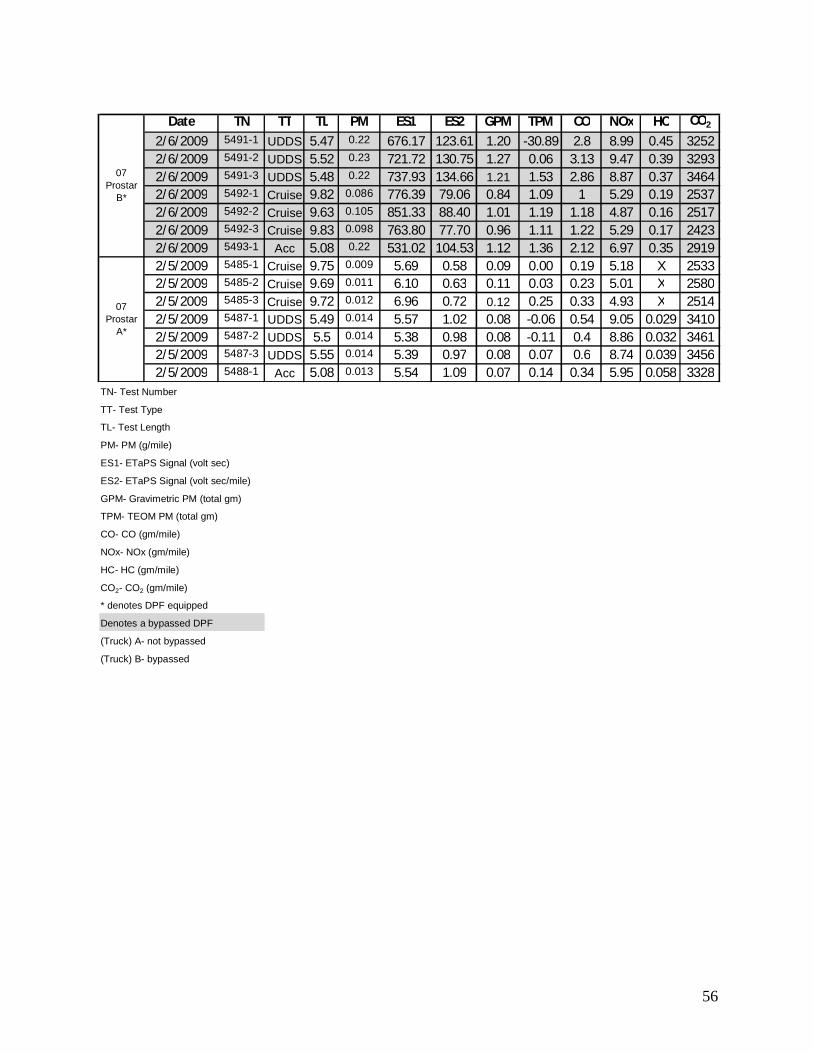
56
Date TN TT TL PM ES1 ES2 GPM TPM CO NOx HC CO2
2/6/2009 5491-1 UDDS 5.47 0.22 676.17 123.61 1.20 -30.89 2.8 8.99 0.45 32522/6/2009 5491-2 UDDS 5.52 0.23 721.72 130.75 1.27 0.06 3.13 9.47 0.39 32932/6/2009 5491-3 UDDS 5.48 0.22 737.93 134.66 1.21 1.53 2.86 8.87 0.37 34642/6/2009 5492-1 Cruise 9.82 0.086 776.39 79.06 0.84 1.09 1 5.29 0.19 25372/6/2009 5492-2 Cruise 9.63 0.105 851.33 88.40 1.01 1.19 1.18 4.87 0.16 25172/6/2009 5492-3 Cruise 9.83 0.098 763.80 77.70 0.96 1.11 1.22 5.29 0.17 24232/6/2009 5493-1 Acc 5.08 0.22 531.02 104.53 1.12 1.36 2.12 6.97 0.35 29192/5/2009 5485-1 Cruise 9.75 0.009 5.69 0.58 0.09 0.00 0.19 5.18 X 25332/5/2009 5485-2 Cruise 9.69 0.011 6.10 0.63 0.11 0.03 0.23 5.01 X 25802/5/2009 5485-3 Cruise 9.72 0.012 6.96 0.72 0.12 0.25 0.33 4.93 X 25142/5/2009 5487-1 UDDS 5.49 0.014 5.57 1.02 0.08 -0.06 0.54 9.05 0.029 34102/5/2009 5487-2 UDDS 5.5 0.014 5.38 0.98 0.08 -0.11 0.4 8.86 0.032 34612/5/2009 5487-3 UDDS 5.55 0.014 5.39 0.97 0.08 0.07 0.6 8.74 0.039 34562/5/2009 5488-1 Acc 5.08 0.013 5.54 1.09 0.07 0.14 0.34 5.95 0.058 3328
07 Prostar
B*
CO2- CO2 (gm/mile)
* denotes DPF equipped
Denotes a bypassed DPF
(Truck) A- not bypassed
(Truck) B- bypassed
ES2- ETaPS Signal (volt sec/mile)
GPM- Gravimetric PM (total gm)
TPM- TEOM PM (total gm)
CO- CO (gm/mile)
NOx- NOx (gm/mile)
HC- HC (gm/mile)
07 Prostar
A*
TN- Test Number
TT- Test Type
TL- Test Length
PM- PM (g/mile)
ES1- ETaPS Signal (volt sec)
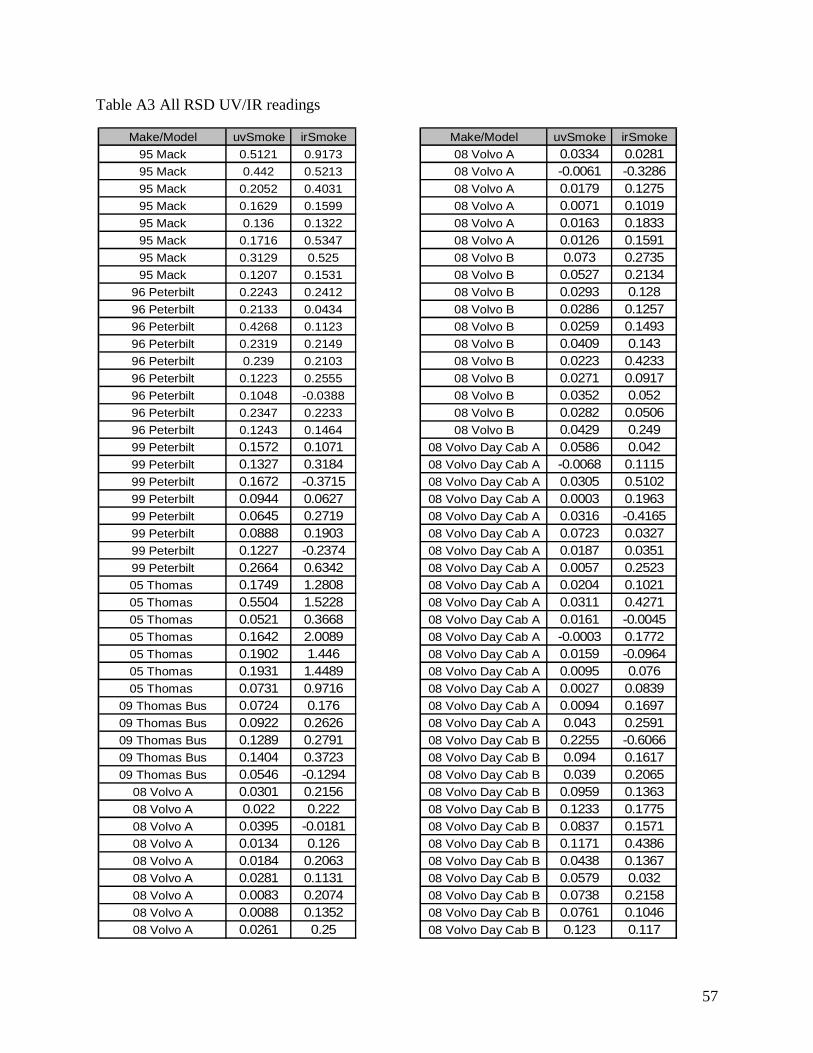
57
Table A3 All RSD UV/IR readings
Make/Model uvSmoke irSmoke Make/Model uvSmoke irSmoke95 Mack 0.5121 0.9173 08 Volvo A 0.0334 0.028195 Mack 0.442 0.5213 08 Volvo A -0.0061 -0.328695 Mack 0.2052 0.4031 08 Volvo A 0.0179 0.127595 Mack 0.1629 0.1599 08 Volvo A 0.0071 0.101995 Mack 0.136 0.1322 08 Volvo A 0.0163 0.183395 Mack 0.1716 0.5347 08 Volvo A 0.0126 0.159195 Mack 0.3129 0.525 08 Volvo B 0.073 0.273595 Mack 0.1207 0.1531 08 Volvo B 0.0527 0.2134
96 Peterbilt 0.2243 0.2412 08 Volvo B 0.0293 0.12896 Peterbilt 0.2133 0.0434 08 Volvo B 0.0286 0.125796 Peterbilt 0.4268 0.1123 08 Volvo B 0.0259 0.149396 Peterbilt 0.2319 0.2149 08 Volvo B 0.0409 0.14396 Peterbilt 0.239 0.2103 08 Volvo B 0.0223 0.423396 Peterbilt 0.1223 0.2555 08 Volvo B 0.0271 0.091796 Peterbilt 0.1048 -0.0388 08 Volvo B 0.0352 0.05296 Peterbilt 0.2347 0.2233 08 Volvo B 0.0282 0.050696 Peterbilt 0.1243 0.1464 08 Volvo B 0.0429 0.24999 Peterbilt 0.1572 0.1071 08 Volvo Day Cab A 0.0586 0.04299 Peterbilt 0.1327 0.3184 08 Volvo Day Cab A -0.0068 0.111599 Peterbilt 0.1672 -0.3715 08 Volvo Day Cab A 0.0305 0.510299 Peterbilt 0.0944 0.0627 08 Volvo Day Cab A 0.0003 0.196399 Peterbilt 0.0645 0.2719 08 Volvo Day Cab A 0.0316 -0.416599 Peterbilt 0.0888 0.1903 08 Volvo Day Cab A 0.0723 0.032799 Peterbilt 0.1227 -0.2374 08 Volvo Day Cab A 0.0187 0.035199 Peterbilt 0.2664 0.6342 08 Volvo Day Cab A 0.0057 0.252305 Thomas 0.1749 1.2808 08 Volvo Day Cab A 0.0204 0.102105 Thomas 0.5504 1.5228 08 Volvo Day Cab A 0.0311 0.427105 Thomas 0.0521 0.3668 08 Volvo Day Cab A 0.0161 -0.004505 Thomas 0.1642 2.0089 08 Volvo Day Cab A -0.0003 0.177205 Thomas 0.1902 1.446 08 Volvo Day Cab A 0.0159 -0.096405 Thomas 0.1931 1.4489 08 Volvo Day Cab A 0.0095 0.07605 Thomas 0.0731 0.9716 08 Volvo Day Cab A 0.0027 0.0839
09 Thomas Bus 0.0724 0.176 08 Volvo Day Cab A 0.0094 0.169709 Thomas Bus 0.0922 0.2626 08 Volvo Day Cab A 0.043 0.259109 Thomas Bus 0.1289 0.2791 08 Volvo Day Cab B 0.2255 -0.606609 Thomas Bus 0.1404 0.3723 08 Volvo Day Cab B 0.094 0.161709 Thomas Bus 0.0546 -0.1294 08 Volvo Day Cab B 0.039 0.2065
08 Volvo A 0.0301 0.2156 08 Volvo Day Cab B 0.0959 0.136308 Volvo A 0.022 0.222 08 Volvo Day Cab B 0.1233 0.177508 Volvo A 0.0395 -0.0181 08 Volvo Day Cab B 0.0837 0.157108 Volvo A 0.0134 0.126 08 Volvo Day Cab B 0.1171 0.438608 Volvo A 0.0184 0.2063 08 Volvo Day Cab B 0.0438 0.136708 Volvo A 0.0281 0.1131 08 Volvo Day Cab B 0.0579 0.03208 Volvo A 0.0083 0.2074 08 Volvo Day Cab B 0.0738 0.215808 Volvo A 0.0088 0.1352 08 Volvo Day Cab B 0.0761 0.104608 Volvo A 0.0261 0.25 08 Volvo Day Cab B 0.123 0.117
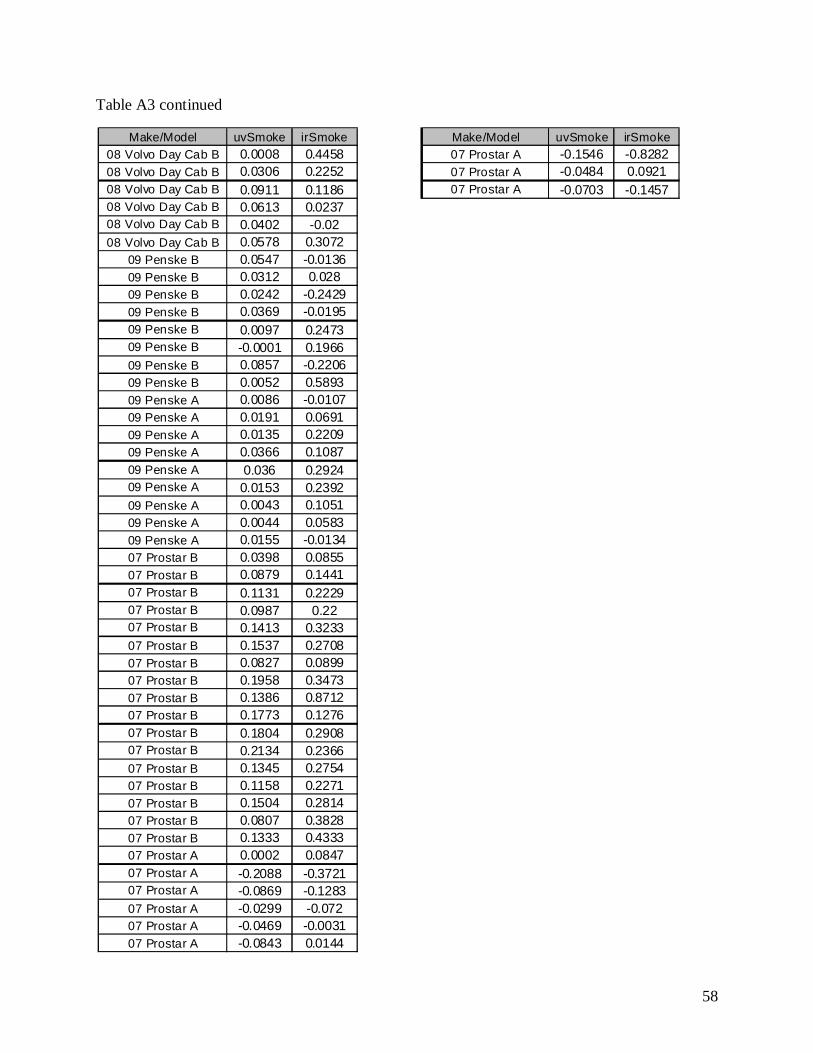
58
Table A3 continued
Make/Model uvSmoke irSmoke Make/Model uvSmoke irSmoke08 Volvo Day Cab B 0.0008 0.4458 07 Prostar A -0.1546 -0.828208 Volvo Day Cab B 0.0306 0.2252 07 Prostar A -0.0484 0.092108 Volvo Day Cab B 0.0911 0.1186 07 Prostar A -0.0703 -0.145708 Volvo Day Cab B 0.0613 0.023708 Volvo Day Cab B 0.0402 -0.0208 Volvo Day Cab B 0.0578 0.3072
09 Penske B 0.0547 -0.013609 Penske B 0.0312 0.02809 Penske B 0.0242 -0.242909 Penske B 0.0369 -0.019509 Penske B 0.0097 0.247309 Penske B -0.0001 0.196609 Penske B 0.0857 -0.220609 Penske B 0.0052 0.589309 Penske A 0.0086 -0.010709 Penske A 0.0191 0.069109 Penske A 0.0135 0.220909 Penske A 0.0366 0.108709 Penske A 0.036 0.292409 Penske A 0.0153 0.239209 Penske A 0.0043 0.105109 Penske A 0.0044 0.058309 Penske A 0.0155 -0.013407 Prostar B 0.0398 0.085507 Prostar B 0.0879 0.144107 Prostar B 0.1131 0.222907 Prostar B 0.0987 0.2207 Prostar B 0.1413 0.323307 Prostar B 0.1537 0.270807 Prostar B 0.0827 0.089907 Prostar B 0.1958 0.347307 Prostar B 0.1386 0.871207 Prostar B 0.1773 0.127607 Prostar B 0.1804 0.290807 Prostar B 0.2134 0.236607 Prostar B 0.1345 0.275407 Prostar B 0.1158 0.227107 Prostar B 0.1504 0.281407 Prostar B 0.0807 0.382807 Prostar B 0.1333 0.433307 Prostar A 0.0002 0.084707 Prostar A -0.2088 -0.372107 Prostar A -0.0869 -0.128307 Prostar A -0.0299 -0.07207 Prostar A -0.0469 -0.003107 Prostar A -0.0843 0.0144
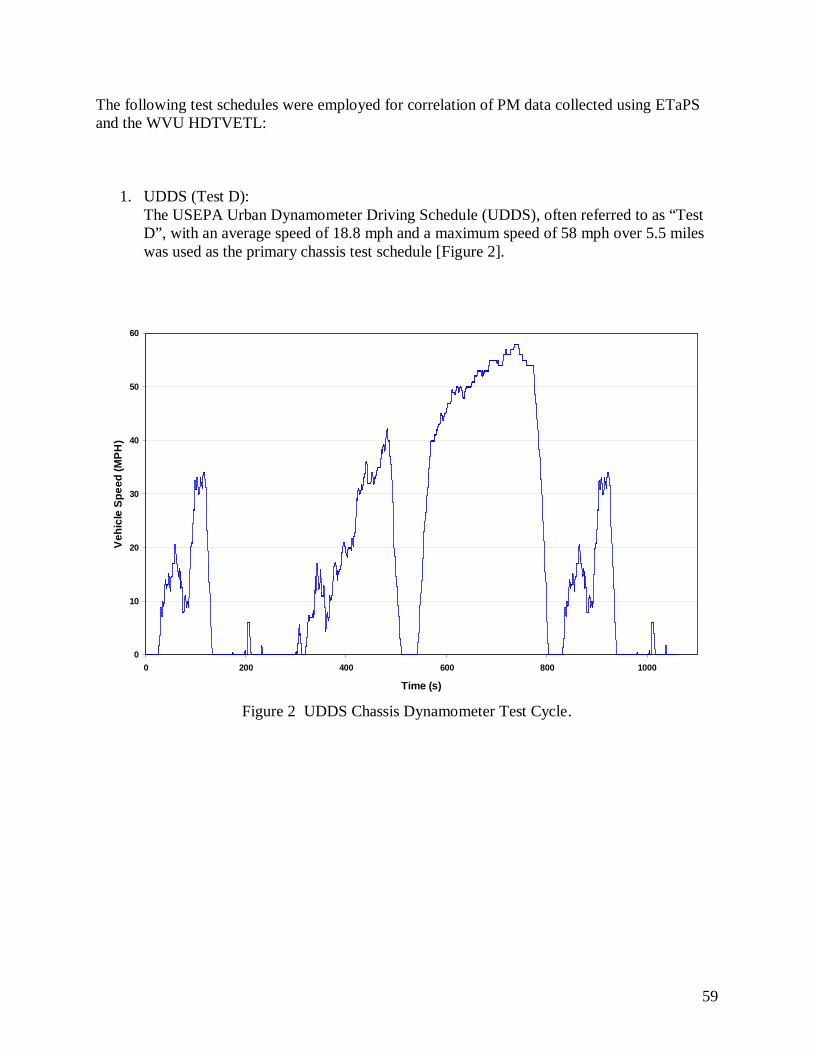
59
The following test schedules were employed for correlation of PM data collected using ETaPS and the WVU HDTVETL:
1. UDDS (Test D):
The USEPA Urban Dynamometer Driving Schedule (UDDS), often referred to as “Test D”, with an average speed of 18.8 mph and a maximum speed of 58 mph over 5.5 miles was used as the primary chassis test schedule [Figure 2].
Figure 2 UDDS Chassis Dynamometer Test Cycle.
0
10
20
30
40
50
60
0 200 400 600 800 1000
Time (s)
Veh
icle
Spe
ed (M
PH)
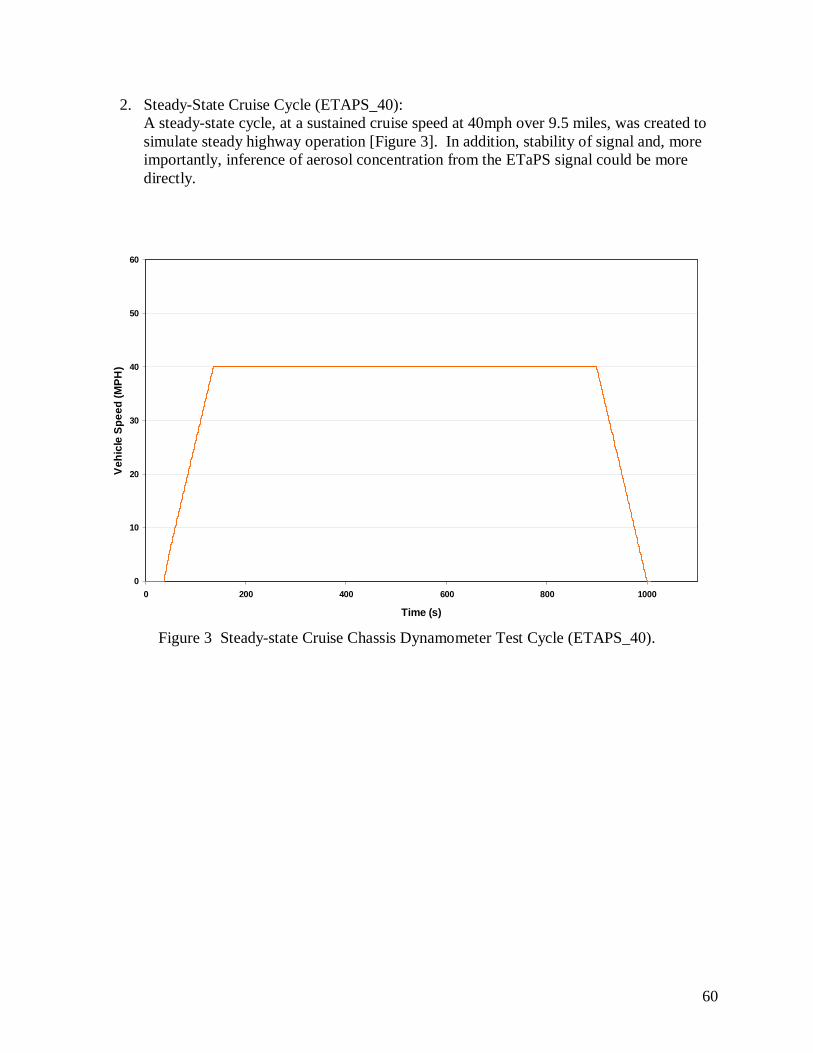
60
2. Steady-State Cruise Cycle (ETAPS_40): A steady-state cycle, at a sustained cruise speed at 40mph over 9.5 miles, was created to simulate steady highway operation [Figure 3]. In addition, stability of signal and, more importantly, inference of aerosol concentration from the ETaPS signal could be more directly.
Figure 3 Steady-state Cruise Chassis Dynamometer Test Cycle (ETAPS_40).
0
10
20
30
40
50
60
0 200 400 600 800 1000
Time (s)
Veh
icle
Spe
ed (M
PH)
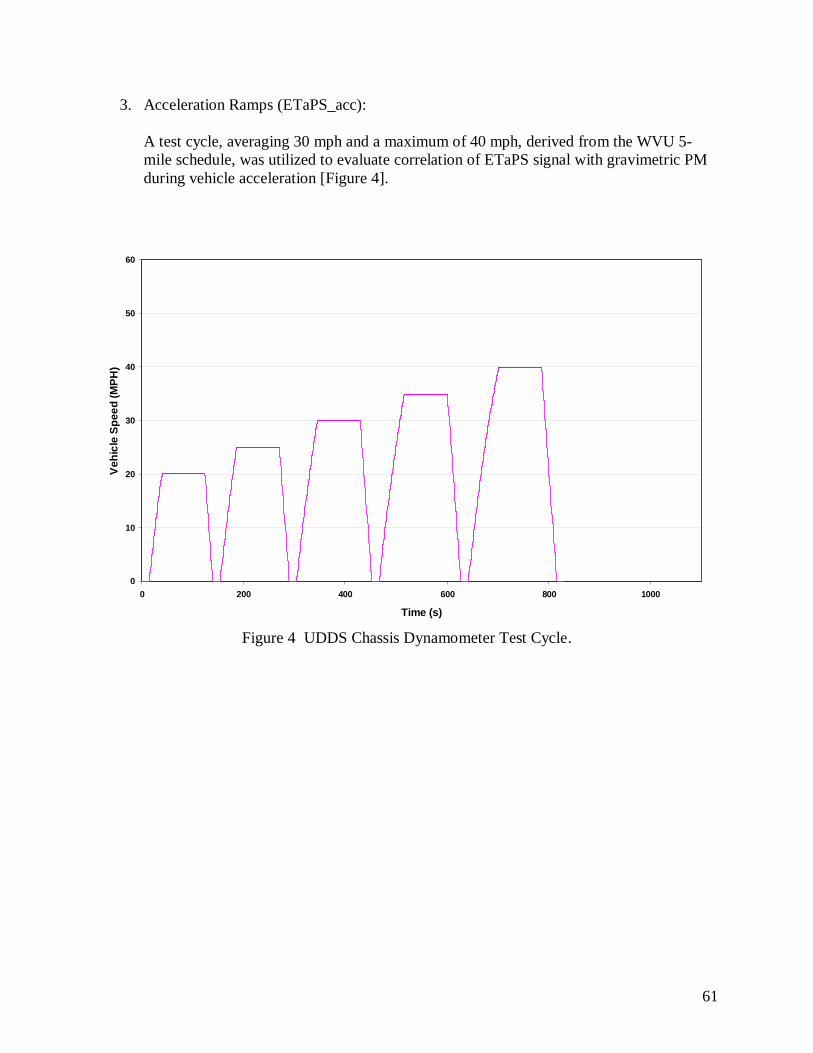
61
3. Acceleration Ramps (ETaPS_acc):
A test cycle, averaging 30 mph and a maximum of 40 mph, derived from the WVU 5-mile schedule, was utilized to evaluate correlation of ETaPS signal with gravimetric PM during vehicle acceleration [Figure 4].
Figure 4 UDDS Chassis Dynamometer Test Cycle.
0
10
20
30
40
50
60
0 200 400 600 800 1000
Time (s)
Veh
icle
Spe
ed (M
PH)