correlation of the results of the standard beam and efnarc
TRANSCRIPT

Proceedings of the World Tunnel Congress 2017 – Surface challenges – Underground solutions. Bergen, Norway.
1
Correlation of the results of the standard beam and EFNARC panel test
P. K. Juhasz JKP Static Ltd., Budapest, Hungary
L. Nagy JKP Static Ltd., Budapest, Hungary
P. Schaul JKP Static Ltd., Budapest, Hungary
ABSTRACT: Fibre Reinforced Concrete (FRC) is widely accepted in the tunnelling industry for use such as shotcrete, cast-in-situ linings or Tunnel Boring Machine (TBM) concrete linings. To calculate an FRC structure the generally accepted method is to measure the parameters of the FRC using the standard 3 point beam test, measuring the load, deflection and/or crack mouth opening displacement (CMOD). However, in the tunnelling industry the most common method of testing FRC is the EFNARC panel test. The possibility of converting one result with another could be very useful for design engineers. In this paper we present our research comparing beam and EFNARC panel test results, which consists of a beam and EFNARC panel laboratory test series made from the same concrete mix, with 3 different dosages of macro synthetic fibre. The stress-crack width diagrams were calculated for all FRC specimens and modelled by Finite Element Analysis to analyse the mechanism. 1 INTRODUCTION
The European standard for sprayed concrete, EN 14487-1 (2005), describes the different ways of specifying the ductility of fibre reinforced sprayed concrete in terms of residual strength and energy absorption capacity. It also mentions that both ways are not exactly comparable and are measured using different test specimen geometries:
1) The energy absorption value, measured on panel specimens in Joules, can be prescribed when, as in the case of rockbolting, emphasis is placed on energy which has to be absorbed during the deformation of the rock.; especially useful for primary sprayed concrete linings (EN 14488-5: Testing sprayed concrete, part 5: Determination of energy absorption capacity of fibre reinforced slab specimens, 2006)).
2) The residual strength value, measured on beam specimens, can be prescribed when the concrete characteristics are used in a structural design model (EN 14488-3: Testing sprayed concrete, part 3: Flexural strengths of fibre reinforced beam specimens, 2006)).
Usually the panels are made by spraying the concrete into the formwork onsite, in contrast the beams are made in laboratories.
From the panel tests the energy absorption can be calculated by measuring the load and the middle point deflection. The value obtained can only be used for the actual concrete mixture and fibre type. Material parameters can’t be extracted from these tests, although the energy absorption could be used in empirical formulas, such as Q-chart (Grimstad, Barton, 1993).
The three point bending beam test, usually made with a notch in the middle of the beam (RILEM TC 162-TDF, 2003) which measures the force and the CMOD (Crack Mouth Opening Distance). Material parameters can be gained from these residual flexural strength numbers according to different guidelines (ACI 544, 1999; RILEM, 2003; ÖVB, 2008) which can be used in calculations.
The process of a panel test is relatively faster compared to a beam test, with a lower variation of results. The beam tests need more preparation, the results could be misleading because of inadequate crack propagation and the variation is normally high. There are methods to reduce the

Proceedings of the World Tunnel Congress 2017 – Surface challenges – Underground solutions. Bergen, Norway.
2
variation, but this makes the tests even more complex (Juhasz, 2015).
In this paper laboratory research is presented, where panels and beams were made with the same concrete and same dosage. Results were compared and a numerical FEA model was made to estimate the results of both types of test with the same material model parameters. The possibility estimating the material parameters from EFNARC panel tests were then examined.
2 LABORATORY TEST
2.1 Test matrix EFNARC panels and beams were made with plain concrete and three (3) dosages of synthetic macro fibers (BarChip48). The test matrix can be seen in Table 1. For every series three EFNARC panels and four beams were made.
The specimens and the test were made at the Adolf Czako Laboratory of the Department of Mechanics, Materials & Structures, Budapest University of Technology and Economics. The tests were made using a Zwick Z150 universal testing machine with a capacity of 150 kN.
Table 1.Test matrix
Fibre dosage Plain concrete
2,5 kg/m3
5,0 kg/m3
7,5 kg/m3
EFNARC panels
EF PC 1-3
EF 2,5 1-3
EF 5,0 1-3
EF 7,5 1-3
Beams B PC 1-4
B2,5 1-4
B 5,0 1-4
B 7,5 1-4
2.2 Concrete mixture For the tests a typical sprayed concrete mixture was designed. The beams and the panels used the same concrete mixture. To get the proper slump in the concrete mixture superplasticizer was used. The macro synthetic fibre was BarChip48 at 2.5, 5.0 and 7.5 kg dosages. The fibre length is 48 mm, continuously embossed, diameter is 0.72 mm. There are ~59500 fibres per kg.
Table 2.Concrete mixture.
Component Type [kg/m3] Cement Holcim 400 Silica fume Mapeplast SF 40 Sand 1320 dmax= 8mm Superplasticizer Mapei Nrg 1012 3 Fibres BarChip 48 2.5; 5.0;7.5
w/c 0,5
slump 120-140 The fibre mixed well at 2.5, 5.0 and 7.5 kg/m3 dosage and the fresh fibre reinforced concrete was homogeneous and well compacted.
None of the specimens were vibrated, and the casting method was poured in place in both case. The beam and the panel tests were also stored in a climate room with set temperature of 25°C and 55-60% relative humidity. The specimen’s testing date was at the age of 28 days.
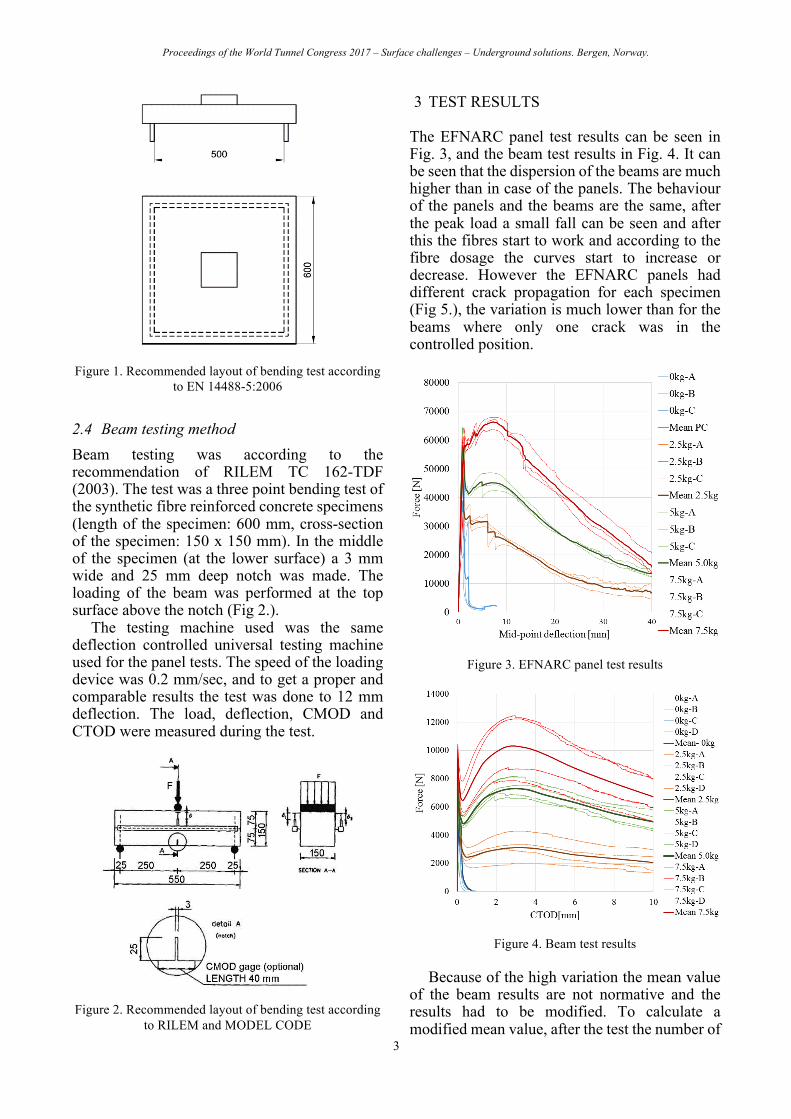
2.3 EFNARC testing method The panel tests were done according to the EN 14488-5 standard. The specimen’s geometry were 600 x 600 mm with 100 mm thickness. The panels were tested on a steel support according to the standard mentioned above (See Fig. 1).
A mortar layer was applied between the sample and both the loading block and the square support.
The test was displacement controlled with a speed of 1 mm/sec. The load-deflection curve was recorded and the test was continued until a deflection of at least 30 mm was achieved at the centre point of the slab. In this test the tests were done until 40 mm to investigate the fibres effect in large crack widths.
Proceedings of the World Tunnel Congress 2017 – Surface challenges – Underground solutions. Bergen, Norway.
3
Figure 1. Recommended layout of bending test according to EN 14488-5:2006
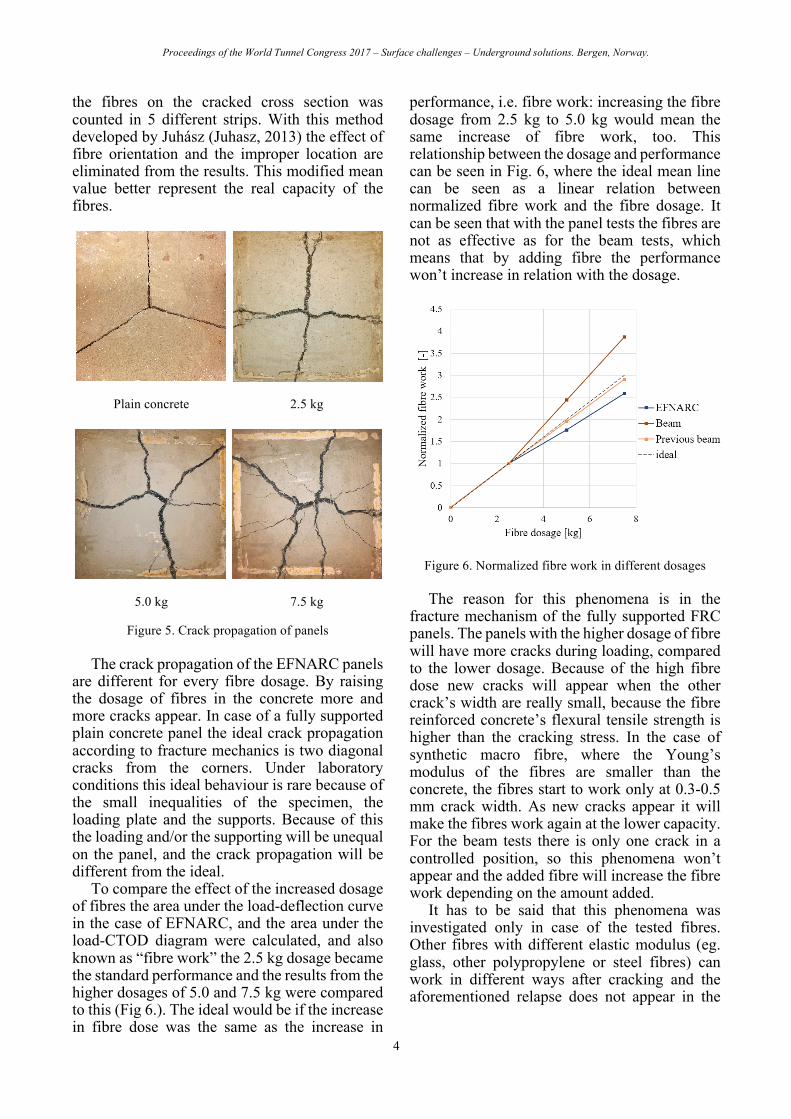
2.4 Beam testing method Beam testing was according to the recommendation of RILEM TC 162-TDF (2003). The test was a three point bending test of the synthetic fibre reinforced concrete specimens (length of the specimen: 600 mm, cross-section of the specimen: 150 x 150 mm). In the middle of the specimen (at the lower surface) a 3 mm wide and 25 mm deep notch was made. The loading of the beam was performed at the top surface above the notch (Fig 2.).
The testing machine used was the same deflection controlled universal testing machine used for the panel tests. The speed of the loading device was 0.2 mm/sec, and to get a proper and comparable results the test was done to 12 mm deflection. The load, deflection, CMOD and CTOD were measured during the test.
Figure 2. Recommended layout of bending test according
to RILEM and MODEL CODE
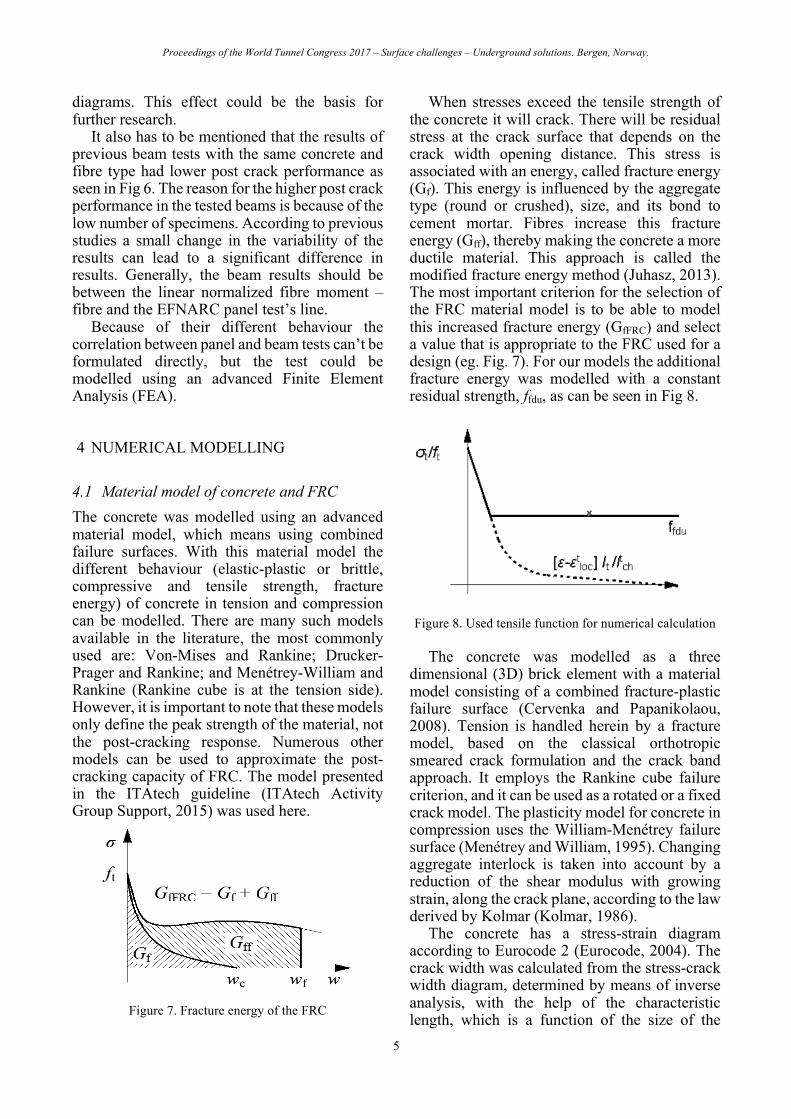
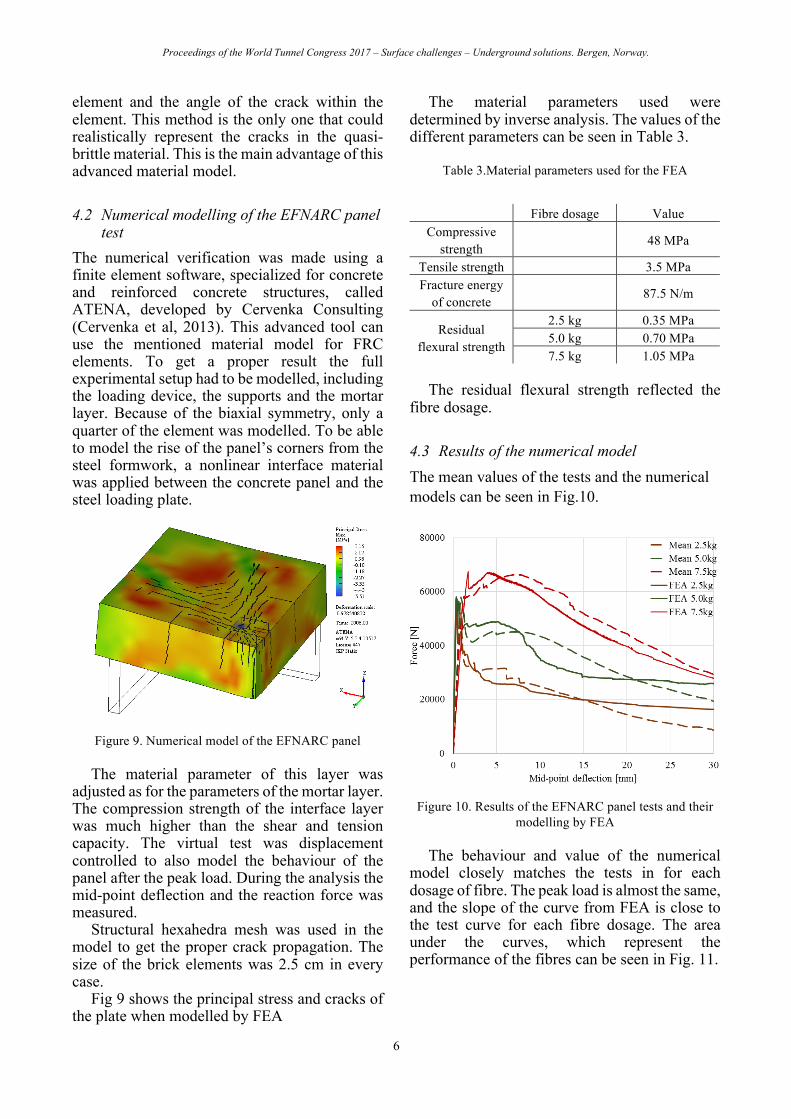
3 TEST RESULTS
The EFNARC panel test results can be seen in Fig. 3, and the beam test results in Fig. 4. It can be seen that the dispersion of the beams are much higher than in case of the panels. The behaviour of the panels and the beams are the same, after the peak load a small fall can be seen and after this the fibres start to work and according to the fibre dosage the curves start to increase or decrease. However the EFNARC panels had different crack propagation for each specimen (Fig 5.), the variation is much lower than for the beams where only one crack was in the controlled position.
Figure 3. EFNARC panel test results
Figure 4. Beam test results
Because of the high variation the mean value of the beam results are not normative and the results had to be modified. To calculate a modified mean value, after the test the number of
Proceedings of the World Tunnel Congress 2017 – Surface challenges – Underground solutions. Bergen, Norway.
4
the fibres on the cracked cross section was counted in 5 different strips. With this method developed by Juhász (Juhasz, 2013) the effect of fibre orientation and the improper location are eliminated from the results. This modified mean value better represent the real capacity of the fibres.
Plain concrete 2.5 kg
5.0 kg 7.5 kg
Figure 5. Crack propagation of panels
The crack propagation of the EFNARC panels are different for every fibre dosage. By raising the dosage of fibres in the concrete more and more cracks appear. In case of a fully supported plain concrete panel the ideal crack propagation according to fracture mechanics is two diagonal cracks from the corners. Under laboratory conditions this ideal behaviour is rare because of the small inequalities of the specimen, the loading plate and the supports. Because of this the loading and/or the supporting will be unequal on the panel, and the crack propagation will be different from the ideal.
To compare the effect of the increased dosage of fibres the area under the load-deflection curve in the case of EFNARC, and the area under the load-CTOD diagram were calculated, and also known as “fibre work” the 2.5 kg dosage became the standard performance and the results from the higher dosages of 5.0 and 7.5 kg were compared to this (Fig 6.). The ideal would be if the increase in fibre dose was the same as the increase in
performance, i.e. fibre work: increasing the fibre dosage from 2.5 kg to 5.0 kg would mean the same increase of fibre work, too. This relationship between the dosage and performance can be seen in Fig. 6, where the ideal mean line can be seen as a linear relation between normalized fibre work and the fibre dosage. It can be seen that with the panel tests the fibres are not as effective as for the beam tests, which means that by adding fibre the performance won’t increase in relation with the dosage.
Figure 6. Normalized fibre work in different dosages
The reason for this phenomena is in the fracture mechanism of the fully supported FRC panels. The panels with the higher dosage of fibre will have more cracks during loading, compared to the lower dosage. Because of the high fibre dose new cracks will appear when the other crack’s width are really small, because the fibre reinforced concrete’s flexural tensile strength is higher than the cracking stress. In the case of synthetic macro fibre, where the Young’s modulus of the fibres are smaller than the concrete, the fibres start to work only at 0.3-0.5 mm crack width. As new cracks appear it will make the fibres work again at the lower capacity. For the beam tests there is only one crack in a controlled position, so this phenomena won’t appear and the added fibre will increase the fibre work depending on the amount added.
It has to be said that this phenomena was investigated only in case of the tested fibres. Other fibres with different elastic modulus (eg. glass, other polypropylene or steel fibres) can work in different ways after cracking and the aforementioned relapse does not appear in the
Proceedings of the World Tunnel Congress 2017 – Surface challenges – Underground solutions. Bergen, Norway.
5
diagrams. This effect could be the basis for further research.
It also has to be mentioned that the results of previous beam tests with the same concrete and fibre type had lower post crack performance as seen in Fig 6. The reason for the higher post crack performance in the tested beams is because of the low number of specimens. According to previous studies a small change in the variability of the results can lead to a significant difference in results. Generally, the beam results should be between the linear normalized fibre moment – fibre and the EFNARC panel test’s line.
Because of their different behaviour the correlation between panel and beam tests can’t be formulated directly, but the test could be modelled using an advanced Finite Element Analysis (FEA).
4 NUMERICAL MODELLING
4.1 Material model of concrete and FRC The concrete was modelled using an advanced material model, which means using combined failure surfaces. With this material model the different behaviour (elastic-plastic or brittle, compressive and tensile strength, fracture energy) of concrete in tension and compression can be modelled. There are many such models available in the literature, the most commonly used are: Von-Mises and Rankine; Drucker-Prager and Rankine; and Menétrey-William and Rankine (Rankine cube is at the tension side). However, it is important to note that these models only define the peak strength of the material, not the post-cracking response. Numerous other models can be used to approximate the post-cracking capacity of FRC. The model presented in the ITAtech guideline (ITAtech Activity Group Support, 2015) was used here.
Figure 7. Fracture energy of the FRC
When stresses exceed the tensile strength of the concrete it will crack. There will be residual stress at the crack surface that depends on the crack width opening distance. This stress is associated with an energy, called fracture energy (Gf). This energy is influenced by the aggregate type (round or crushed), size, and its bond to cement mortar. Fibres increase this fracture energy (Gff), thereby making the concrete a more ductile material. This approach is called the modified fracture energy method (Juhasz, 2013). The most important criterion for the selection of the FRC material model is to be able to model this increased fracture energy (GfFRC) and select a value that is appropriate to the FRC used for a design (eg. Fig. 7). For our models the additional fracture energy was modelled with a constant residual strength, ffdu, as can be seen in Fig 8.
Figure 8. Used tensile function for numerical calculation
The concrete was modelled as a three dimensional (3D) brick element with a material model consisting of a combined fracture-plastic failure surface (Cervenka and Papanikolaou, 2008). Tension is handled herein by a fracture model, based on the classical orthotropic smeared crack formulation and the crack band approach. It employs the Rankine cube failure criterion, and it can be used as a rotated or a fixed crack model. The plasticity model for concrete in compression uses the William-Menétrey failure surface (Menétrey and William, 1995). Changing aggregate interlock is taken into account by a reduction of the shear modulus with growing strain, along the crack plane, according to the law derived by Kolmar (Kolmar, 1986).
The concrete has a stress-strain diagram according to Eurocode 2 (Eurocode, 2004). The crack width was calculated from the stress-crack width diagram, determined by means of inverse analysis, with the help of the characteristic length, which is a function of the size of the
Proceedings of the World Tunnel Congress 2017 – Surface challenges – Underground solutions. Bergen, Norway.
6
element and the angle of the crack within the element. This method is the only one that could realistically represent the cracks in the quasi-brittle material. This is the main advantage of this advanced material model.
4.2 Numerical modelling of the EFNARC panel test
The numerical verification was made using a finite element software, specialized for concrete and reinforced concrete structures, called ATENA, developed by Cervenka Consulting (Cervenka et al, 2013). This advanced tool can use the mentioned material model for FRC elements. To get a proper result the full experimental setup had to be modelled, including the loading device, the supports and the mortar layer. Because of the biaxial symmetry, only a quarter of the element was modelled. To be able to model the rise of the panel’s corners from the steel formwork, a nonlinear interface material was applied between the concrete panel and the steel loading plate.
Figure 9. Numerical model of the EFNARC panel
The material parameter of this layer was adjusted as for the parameters of the mortar layer. The compression strength of the interface layer was much higher than the shear and tension capacity. The virtual test was displacement controlled to also model the behaviour of the panel after the peak load. During the analysis the mid-point deflection and the reaction force was measured.
Structural hexahedra mesh was used in the model to get the proper crack propagation. The size of the brick elements was 2.5 cm in every case.
Fig 9 shows the principal stress and cracks of the plate when modelled by FEA
The material parameters used were determined by inverse analysis. The values of the different parameters can be seen in Table 3.
Table 3.Material parameters used for the FEA
Fibre dosage Value
Compressive strength
48 MPa
Tensile strength 3.5 MPa Fracture energy
of concrete 87.5 N/m
Residual flexural strength
2.5 kg 0.35 MPa 5.0 kg 0.70 MPa 7.5 kg 1.05 MPa
The residual flexural strength reflected the
fibre dosage.
4.3 Results of the numerical model The mean values of the tests and the numerical models can be seen in Fig.10.
Figure 10. Results of the EFNARC panel tests and their modelling by FEA
The behaviour and value of the numerical model closely matches the tests in for each dosage of fibre. The peak load is almost the same, and the slope of the curve from FEA is close to the test curve for each fibre dosage. The area under the curves, which represent the performance of the fibres can be seen in Fig. 11.
Proceedings of the World Tunnel Congress 2017 – Surface challenges – Underground solutions. Bergen, Norway.
7
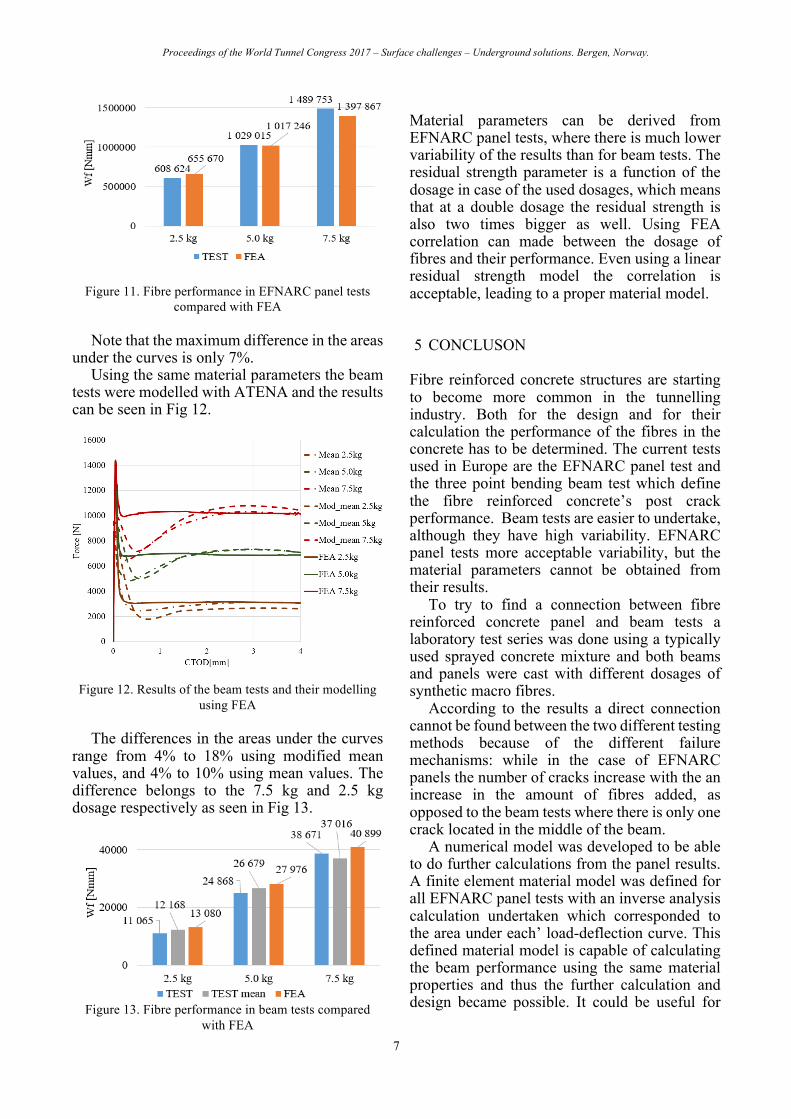
Figure 11. Fibre performance in EFNARC panel tests compared with FEA
Note that the maximum difference in the areas under the curves is only 7%.
Using the same material parameters the beam tests were modelled with ATENA and the results can be seen in Fig 12.
Figure 12. Results of the beam tests and their modelling
using FEA
The differences in the areas under the curves range from 4% to 18% using modified mean values, and 4% to 10% using mean values. The difference belongs to the 7.5 kg and 2.5 kg dosage respectively as seen in Fig 13.
Figure 13. Fibre performance in beam tests compared
with FEA
Material parameters can be derived from EFNARC panel tests, where there is much lower variability of the results than for beam tests. The residual strength parameter is a function of the dosage in case of the used dosages, which means that at a double dosage the residual strength is also two times bigger as well. Using FEA correlation can made between the dosage of fibres and their performance. Even using a linear residual strength model the correlation is acceptable, leading to a proper material model.
5 CONCLUSON
Fibre reinforced concrete structures are starting to become more common in the tunnelling industry. Both for the design and for their calculation the performance of the fibres in the concrete has to be determined. The current tests used in Europe are the EFNARC panel test and the three point bending beam test which define the fibre reinforced concrete’s post crack performance. Beam tests are easier to undertake, although they have high variability. EFNARC panel tests more acceptable variability, but the material parameters cannot be obtained from their results.
To try to find a connection between fibre reinforced concrete panel and beam tests a laboratory test series was done using a typically used sprayed concrete mixture and both beams and panels were cast with different dosages of synthetic macro fibres.
According to the results a direct connection cannot be found between the two different testing methods because of the different failure mechanisms: while in the case of EFNARC panels the number of cracks increase with the an increase in the amount of fibres added, as opposed to the beam tests where there is only one crack located in the middle of the beam.
A numerical model was developed to be able to do further calculations from the panel results. A finite element material model was defined for all EFNARC panel tests with an inverse analysis calculation undertaken which corresponded to the area under each’ load-deflection curve. This defined material model is capable of calculating the beam performance using the same material properties and thus the further calculation and design became possible. It could be useful for

Proceedings of the World Tunnel Congress 2017 – Surface challenges – Underground solutions. Bergen, Norway.
8
design engineers to verify a material model using only EFNARC panel tests.
Further research is planned to determine the performance of different fibres in EFNARC panels and beams, and compile a database for design engineers with the results of the fibre’s performance
ACKNOWLEDGEMENT
The Authors would like to express their gratitude to Janos Taierling for his work in casting and testing the concrete specimens. REFERNCES ACI Committee 544. Design Considerations for Steel
Fibre Reinforced Concrete, ACI 544.4R-88, 1999. Cervenka, J., Papanikolaou V.K. 2008. Three dimensional
combined fracture-plastic material model for concrete, International Journal of Plasticity (24): 2192-2220, 2008.
Cervenka, V., Jendele, L., Cervenka, J. 2013 ATENA Program Documentation: Part 1 Theory. Cervenka Consulting. Prague, Czech Republic.
EN 14487-1, 2005. Sprayed concrete - Part 1: Definitions, specifications and conformity, European Committee for Standardization (CEN), 2005
EN 14488-3, 2006: Testing sprayed concrete, part 3: Flexural strengths of fibre reinforced beam specimens, European Committee for Standardization (CEN)
EN 14488-5, 2006: Testing sprayed concrete - Part 5: Determination of energy absorption capacity of fibre
reinforced slab specimens, European Committee for Standardization (CEN)
EUROCODE EN 1992, 2004. European Code for design of concrete structures, European Committee for Standardization (CEN). Avaible from: http://eurocodes.jrc.ec.europa.eu/ (European Committee for Standardization)
Grimstad, E., Barton, N. 1993. Updating of the Q system for NMT, Proceedings of the International Symposium on Sprayed Concrete. Modern Use of Wet Mix Sprayed Concrete for Underground Support, Fagernes. NorwegianConcrete Association, Oslo.
ITAtech Activity Group Support: "ITAtech Design Guidance For Precast Fibre Reinforced Concrete Segments", ITAtech Report n7, draft, July 2015
Juhász, K.P. 2013. Modified fracture energy method for fibre reinforced concrete, in Fibre Concrete 2013: Technology, Design, Application (ed. Kohoutkova A, et al) pp. 89-90 (Faculty of Civil Engineering Department of Concrete and Masonry Structures: Prague)
Juhász, K.P. 2015. Evaluation of fibre reinforced concrete beam test results based on the examination of the real fibre distribution, Fiber Concrete 2015, Prague
Kolmar, W. 1986. „Beschreibung der Kraftuebertragung über Risse in nichtlinearen Finite-Element-Berechnungen von Stahlbetontragwerken“, Dissertation, T.H. Darmstadt.
Menétrey, P., William K.J. 1995. Triaxial Failure Criterion for Concrete and Its Generalization, ACI Structural Journal, 1995, 92(3): 311-318.
Österreichische Vereinigung für Beton- und Bautechnik, 2008. Richtlinie Faserbeton. Österreichische Vereinigung für Beton- und Bautechnik, Wien
RILEM TC 162-TDF, 2003. Final recommendation of RILEM TC 162-TDF: Test and design methods for steel fibre reinforced concrete. Materials and Structures, 36(262), 560–567.