correlation, principal components, and the problem of multistate data
TRANSCRIPT
Geofomm, Vol. 8, pp. 69-72, 1977. Pergamon Press. Printed in Great Britain.
Correlation, Principal Components, and the Problem of Multistate Data
COLIN CLARK,* England
Abstract - Problems of using discrete data in correlation and components analysis are discussed, and some guidelines are suggested.
Principal Components Analysis (PCA) is one of a group of techniques whose utility is often judged by results in spite of the fact that data transformation employed has been shown to influence the results (CLARK, 1973). Indeed, as long ago as 1965 Minkoff showed how coded data gives different correlation coefficients if the direction of coding is reversed. A major problem in such situations is that little gui- dance is available to would be users. Because correla- tion coefficients are used in Principal Components Analysis, the effects of coding data upon the results have been briefly examined. Eades, 1965, has already pointed out the shortcomings of the correlation coefficient as a distance measure in taxonomy. Similarly, in Principal Components Analysis, the distance of items on ordination plots may not be a true representation of taxonomic distance: BOYCE, 1969, gives a useful example. Because one ordination is a two dimensional view of the multidimensional space, several ordinations must be carefully examined before classification can proceed.
Effects of data coding on correlations and ordinations _ introduction
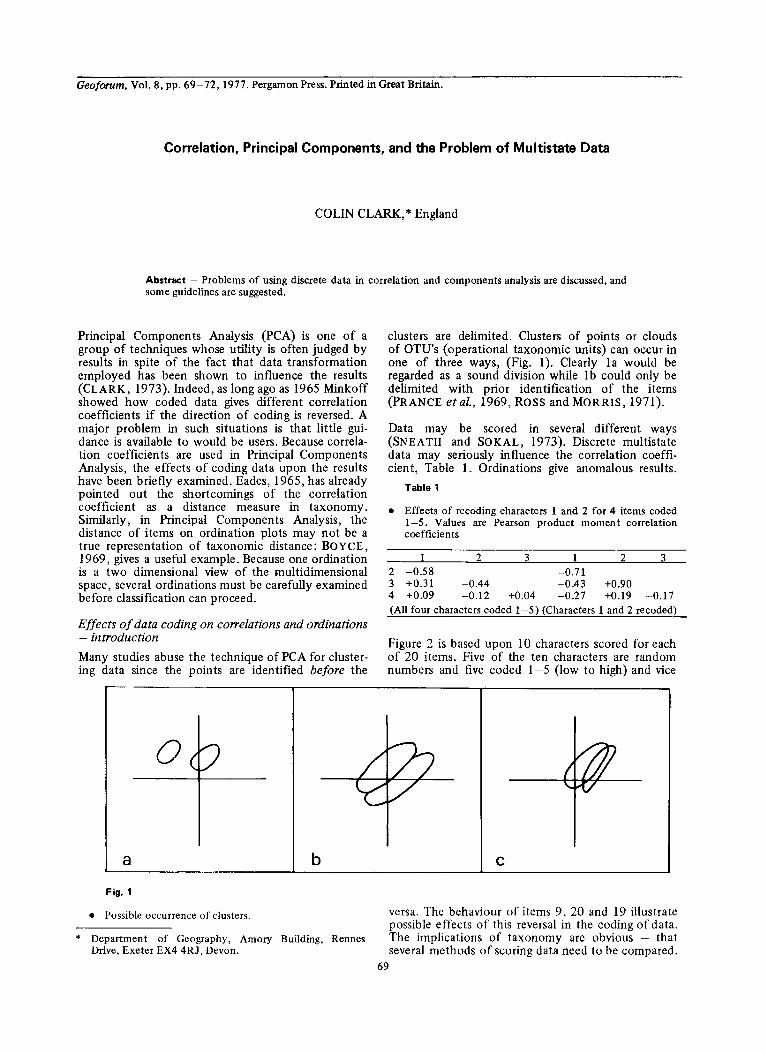
Many studies abuse the technique of PCA for cluster- ing data since the points are identified before the
clusters are delimited. Clusters of points or clouds of OTU’s (operational taxonomic units) can occur in one of three ways, (Fig. 1). Clearly la would be regarded as a sound division while lb could only be delimited with prior identification of the items (PRANCE et al., 1969, Ross and MORRIS, 1971).
Data may be scored in several different ways (SNEATH and SOKAL, 1973). Discrete multistate data may seriously influence the correlation coeffi- cient, Table 1. Ordinations give anomalous results.
Table 1
l Effects of recoding characters 1 and 2 for 4 items coded 1-5. Values are Pearson product moment correlation coefficients
1 2 3 1 2 3 2 -0.58 -0.71 3 +0.31 -0.44 -0.43 +0.90 4 +0.09 -0.12 +0.04 -0.27 +0.19 -0.17 (All four characters coded 1-5) (Characters 1 and 2 recoded)
Figure 2 is based upon 10 characters scored for each of 20 items. Five of the ten characters are random numbers and five coded l-5 (low to high) and vice
a 1 b
l Possible occurrence of clusters. versa. The behaviour of items 9, 20 and 19 illustrate possible effects of this reversal in the coding of data.
* Department of Geography, Amory Building, Rennes The implications of taxonomy are obvious - that Drive, Exeter EX4 4RJ, Devon. several methods of scoring data need to be compared.
69

70 Geoforum/Volume 8/Number 2/1977
1 7 1
18 4 17 1 ”
15 14
12 6
10 13
16 2o19
3 5 8 8 3 9
20 9 2 2 5 2 16 15
19 10
13
12 6
14 2
I 11 17 4
18 7
HIGH TO LOW LOW TO HIGH
Fig. 2
l Ordinations with 50% recoding of 10 variables.
7
6
5
MS 4
3
2
Fig. 3
. . . . . c . . . . .
Al-- XAh_---- :*:*:.:.:. REVERSAL OF COEFFICIENT . ’ ‘. * LIKELY
d 6 8 lo 12 14 16 18 20 Cn
l Nomogram of ZAr and TAh for components 1 and 2.

GeoforumlVolume l/Number 2/1977 71
Some guidehes for the use of multistate data in correlation
Because little or no advice is offered in such situa- tions, and the choice of coding is arbitary, Fig. 3 has been specially prepared to meet this requirement. It is based on correlations between 4 items with charac- ter number (Cn) 4-20 and order of multistate (MS) 2-7. Only general advice can be given: first, high orders of multistate should be avoided, especially where the number of characters coded thus are small. Second, to obtain the average change in coef- ficient, the values of the isolines should be divided by 6.0. This only gives a rough guide and the discri- minator for reversals of at least one of these 6 coef- ficients is given in the nomogram. To assist users where other than 50% character coding is performed
3
Ar
Fig. 4
Fig. 4 has been prepared for representative combina- tions of Cn and MS only. The peak of EAr around 75% is well marked for which, at present, no reason can be given. Used together, these two diagrams may provide, it is hoped, some guidance for coding multistate data. It should be pointed out that coded data is free of sampling error (intermediate values do not occur). This may favour the use of it in prefer- ence to parametric data. Also, there is a considerable range of values for high orders of MS, and it must be remembered that EAr depends upon the initial values of the correlation coefficients themselves.
Multistate data and ~nci~al Components Analysis
Principal Components Analysis is based on correla- tions of variables of items, and a general formula
25 50 75 % Character recoding
Lh16
vls5
l Effects of recoding different proportions of characters.

72 Geoforum/Volume 8/Number 2/1977
for the number of changed coefficients for an n X n matric is x&x) where x is the number of recoded variables. Calculation of x+x) for a range of n shows that it is unimodal, with a peak around x = 0.5~. In coding data the same guidelines are recom- mended as in OTU correlation. However, Fig. 3 illustrates that MS has little or no effect upon the change of eigenvectors for the first two components. Rather it seems that variable number is of critical importance. Further tests showed that OTU number is of little importance in influencing the results of Principal Components Analysis. Thus while multi- state data can be used it is best with a large rather than small number of variables. Reversal of both sign and magnitude is a common feature, although excep- tions do occur.
Conclusion
A great deal has been written about correlation and Principal Components Analysis, and like many numerical techniques they are powerful tools which can be used to obtain insight into data. Problems in the use of multistate data have been discussed and clearly there is a great need for empirical evalua- tion of techniques like Principal Components Analy- sis in order to restrain the gulf between theory and practice.
Ackn~w~edge~en~~ - This paper was written while in possession of a NERC studentship for which the author is grateful. My thanks also go to Dr. Frank Bisby of the Biology Department at Southampton University and Jim Hanwell.
References
BOYCE A. J. (1969) Mapping diversity: a comparative study of some numerical methods, In ~ume~cal Taxo- nomy. A. J. COLE (Ed). Academic Press, London.
CLARK D. (1973) Normality, transformation and the principal components solution: an empirical note. Area 5, 110-113.
EADES D. C. (1965) The inappropriateness of the correla- tion coefficient as a measure of taxonomic resemblance. Sysr. Zool. 14,98-100.
MINKOFF E. C. (1965) The effects on classification of slight alterations in numerical technique. Sysr. Zod 14, 196213.
PRANCE G. T., ROGERS D. J. & WHITE F. (1969) A taxometric study of an angiosperm family;generic delimi- tation in the Chrysobalanaceae. New Phyrol. 68, 1203- 1234.
ROSS J. H. & MORRIS J. W. (1971) Principal Components Analysis of Acacia burkei and A. Nizrescens in Natal. Both& 10,437-450.
SNEATH P. H. A. & SOKAL P. R. (1973) Numerical Taxo- nomy. W. H. Freeman & Co., San Francisco.