*corresponding author: @dit - radiance · pdf filecapacity of lighting a single level/storey...
TRANSCRIPT

Lightpipe daylight simulation modelling using Radiance backward and forward
ray tracing methods: a comparison with monitored data for commercial
lightpipes in Ireland
Anthony J. Farrell*, Brian Norton, David Kennedy
Dublin Institute of Technology
Ireland
*Corresponding author: [email protected]
Abstract
A full-scale vertical light pipe experimental test rig was constructed to investigate the
feasibility of light pipes in deep plan buildings. The Test rig allowed for monitoring
of the light output from the base of lightpipes through base enclosures. Two light
pipes were examined: 1000mm diameter and 530mm diameter, both approximately
6m in length. The light pipes were monitored for one month weeks and the daylight
factor at reference points analyzed. The experimental test rig was then modeled in
desktop Radiance, the output files of which were simulated using the 'PMAP' edition
of Radiance. The results were compared with the monitored data and a comparative
analysis presented. The PMAP program predicted luminance levels between 1.79 and
2 times that predicted by Desktop Radiance for the 530 and 1000mm lightpipes
respectively. When the luminance ratio is used as an illuminance multiplier for the
Desktop Radiance illuminance predictions, values within one per cent of measured
illuminance are shown to result for the 530mm lightpipe.
1. Introduction
A light pipe is a 97 per cent specular reflective mirror pipe or duct that is used for the
transmission of daylight from outside to a location within a building that would
otherwise not experience daylight. Light pipes are commonly found in houses for
lighting landing areas and en-suite toilets. Light pipes are also used in daylighting
buildings across the industrial, education, and commercial sectors; but only in the
capacity of lighting a single level/storey building. A multi-aperture light pipe system,
patent pending, that can serve several levels of such buildings is proposed in this
paper.
The light levels experienced from light pipes can be derived from experimentation
and expressed mathematically which can then be modelled using computational
methods. Radiance software was originally developed for prediction of illuminance
levels experienced from conventional lighting applications such as windows,
luminaries, and sky lights and is based on a backward ray tracing algorithm that
derives the illuminance through tracing a ray of light from a point in a room backward
reflecting two or three times typically along its path to the source, the sky. A forward
ray tracing method has been developed which traces the light rays from the source
forward through many reflections to a point in a room. Since light pipes are highly
specular and contain many reflections of light, a forward ray tracing method is most
suitable. The extent of the suitability of both methods is the subject of this paper
which is validated through comparison with monitored data.
Two commercially available, full scale light pipes have undergone experimental
analysis for their feasibility in this application. The experimental monitoring began at
17.30hrs on the 22nd
July on a cloudy/sunny evening in Dublin, Ireland, and was used
as the reference condition for comparison with lighting estimation methods. Forward
and backward ray tracing methods using Radiance computer simulation software were
then used to derive the expected illuminance contribution from the apertures. The
results were compared with the measured values and conclusions drawn relating to the
accuracy of Radiance software for predicting illuminance levels from light pipes
under clear sky conditions.
3. Outside luminance
The outside luminance level was measured using standard type M light sensors
supplied by Megatron. The sensors were calibrated to measure 1000lux per volt
through a maximum voltage range of 30v (300,000 lux). The sensors were fitted with
human corrective filters to monitor the light level that would normally be experienced
by the occupants of a building. The sensors were secured to most central point within
each lightpipe dome. The respective luminance levels received at the inlet to the light
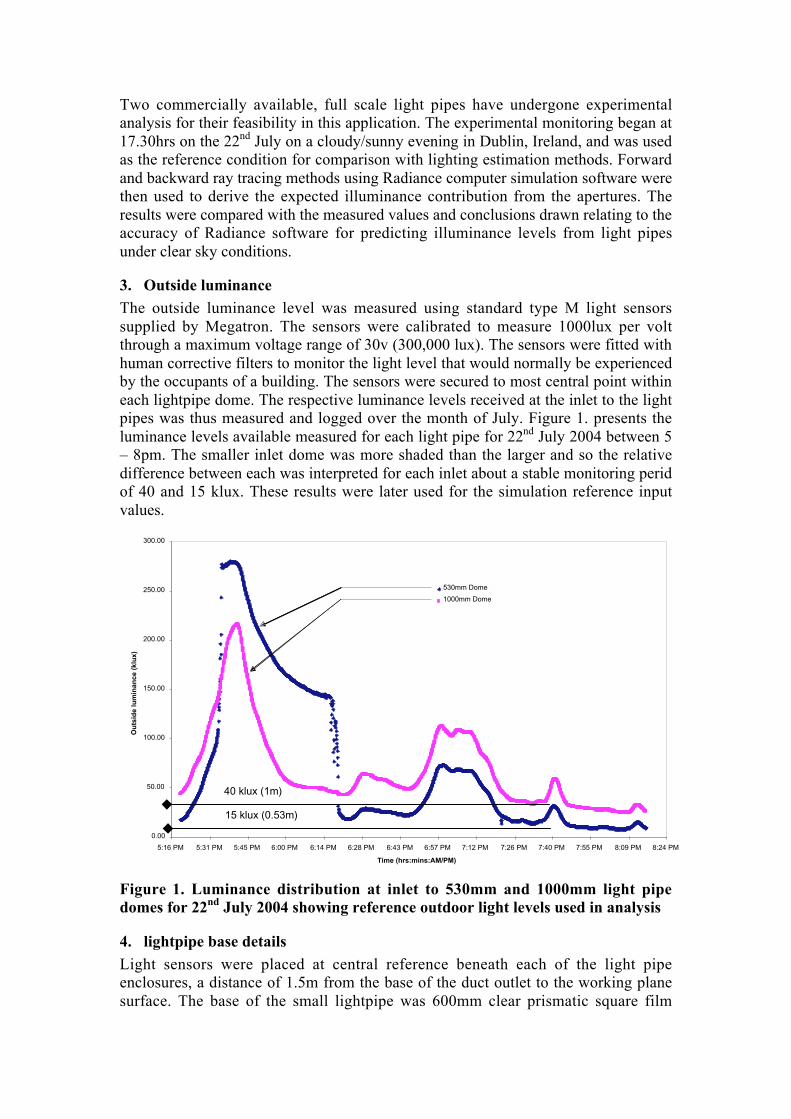
pipes was thus measured and logged over the month of July. Figure 1. presents the
luminance levels available measured for each light pipe for 22nd
July 2004 between 5
– 8pm. The smaller inlet dome was more shaded than the larger and so the relative
difference between each was interpreted for each inlet about a stable monitoring perid
of 40 and 15 klux. These results were later used for the simulation reference input
values.
0.00
50.00
100.00
150.00
200.00
250.00
300.00
5:16 PM 5:31 PM 5:45 PM 6:00 PM 6:14 PM 6:28 PM 6:43 PM 6:57 PM 7:12 PM 7:26 PM 7:40 PM 7:55 PM 8:09 PM 8:24 PM
Time (hrs:mins:AM/PM)
Ou
tsid
e l
um
ina
nc
e (
klu
x)
530mm Dome
1000mm Dome
Figure 1. Luminance distribution at inlet to 530mm and 1000mm light pipe
domes for 22nd
July 2004 showing reference outdoor light levels used in analysis
4. lightpipe base details
Light sensors were placed at central reference beneath each of the light pipe
enclosures, a distance of 1.5m from the base of the duct outlet to the working plane
surface. The base of the small lightpipe was 600mm clear prismatic square film
40 klux (1m)
15 klux (0.53m)

diffuser which was connected to through a 0.5m circular to square lightpipe transition
piece. The large lightpipe base was a parabolic white plastic dome.
5. Desktop illuminance levels
Figure 2. presents the measured illuminance levels for the 530mm and 1000mm
lightpipe enclosures respectively, for the same period of the outdoor luminance
measurements (Figure 1.).
0
100
200
300
400
500
600
700
5:20 PM 5:40 PM 6:00 PM 6:20 PM 6:41 PM 7:01 PM 7:21 PM 7:41 PM 8:02 PM
Time (hrs:mins:AM/PM)
Illu
min
an
ce
(lu
x)
530mm Duct
1000mm Duct
Figure 2. Illuminance measurements from lightpipes for 22nd
July 2004
6. Daylight factors
The daylight factor, a common method of representation of light levels in buildings,
may be expressed through calculation of the ratio of outdoor luminance to indoor
illuminance expressed as a percentage. Figure 3. presents the daylight factors
calculated for each enclosure.
0.00
0.20
0.40
0.60
0.80
1.00
1.20
5:20 PM 5:40 PM 6:00 PM 6:20 PM 6:41 PM 7:01 PM 7:21 PM 7:41 PM 8:02 PM
Time (hrs:mins:AM/PM)
Da
yli
gh
t F
ac
tor
(%)
DF LEVEL 0:530mm
DF LEVEL 0:1000mm
Figure 3. Daylight factors for 530mm and 1000mm light pipe apertures for 22nd
July 2004

7. Radiance simulated results
The latest version of desktop radiance, v 2.0 Beta, was originally used for estimating
the luminance and illuminance distribution throughout the lightpipes but following
several simulation runs errors occurred that inhibited further simulation exercises. The
errors included failure to simulate the base of the light pipe properly, showing a semi
disc shape rather than a full disk that forms the base of the lightpipe; program
‘crashing’ during simulation runs following minor changes to geometry; failure of
program to re-open after several simulation runs; and failure for program to model a
dome inlet to the lightpipe. Version 1.02 was then used to simulate the same
scenarios. The program was more stable, produced a full disc shape for the base of
lightpipes and continued to run without problems following minor changes to the
geometry; but could not model a glass dome inlet. A glass disc inlet was therefore
adopted as a compromise. Initially the outside of the test rig was simulated and
modified through an iterative process to achieve approximate reference light levels at
the reference points within each dome. The actual simulated results for the reference
illuminance levels at 18:00hrs was approximately half the actual values. The time of
simulation was therefore brought forward until similar values were reached. The
illuminance level within the small lightpipe dome was difficult to attain because the
exact shading configuration resulting from the site geometery did not now exist owing
to the new higher sun position. The glazing was therefore modified from clear
(clear3.rad) to one with approximately half its transmission (afg-Es140.rad).
Reference discs of similar ‘specular reflective’ material (galvanized.rad modified to
97% specular reflection) were placed as reference markers 200mm beneath each
dome which defined the plane of the illuminance plot. The simulation yielded an
illuminance level within the small dome of approximately 15.625 klux and in the
large dome of some 40.25 klux, approximating the reference values of 15 and 40klux
respectively. Figure 4. presents the results from the final simulation of outside the test
rig and illustrates the arrangement of the ducts about the enclosure scaffold fixture.
Figure 4. Outdoor illuminance plot at 15.00hrs (22/07) using reference
aluminium discs within each light pipe
Data: 530mm duct = 15,625 lux at reference marker; 1000mm duct = 40,625 lux at
reference marker
Large lightpipe
(1000mm)
Small light pipe
(530mm)
Enclosure scaffold
Support structure
ENCLOSURE
LIGHTPIPE
DOME

7.1 Enclosure light levels
The following range of figures present the simulated illuminance and luminance
levels for both enclosures taken at the reference date and time, i.e. as per Figure 4.
light levels.
7.1.1 530mm Duct base enclosure
Figure 5. Illuminance plot (DR V 1.02)
Figure 6. Luminance plot (DR V 1.02)
Figure 7. Luminance plot (PMAP)
7.8lux reference surface
1.56lux across surface
14lux reference
4.69surface
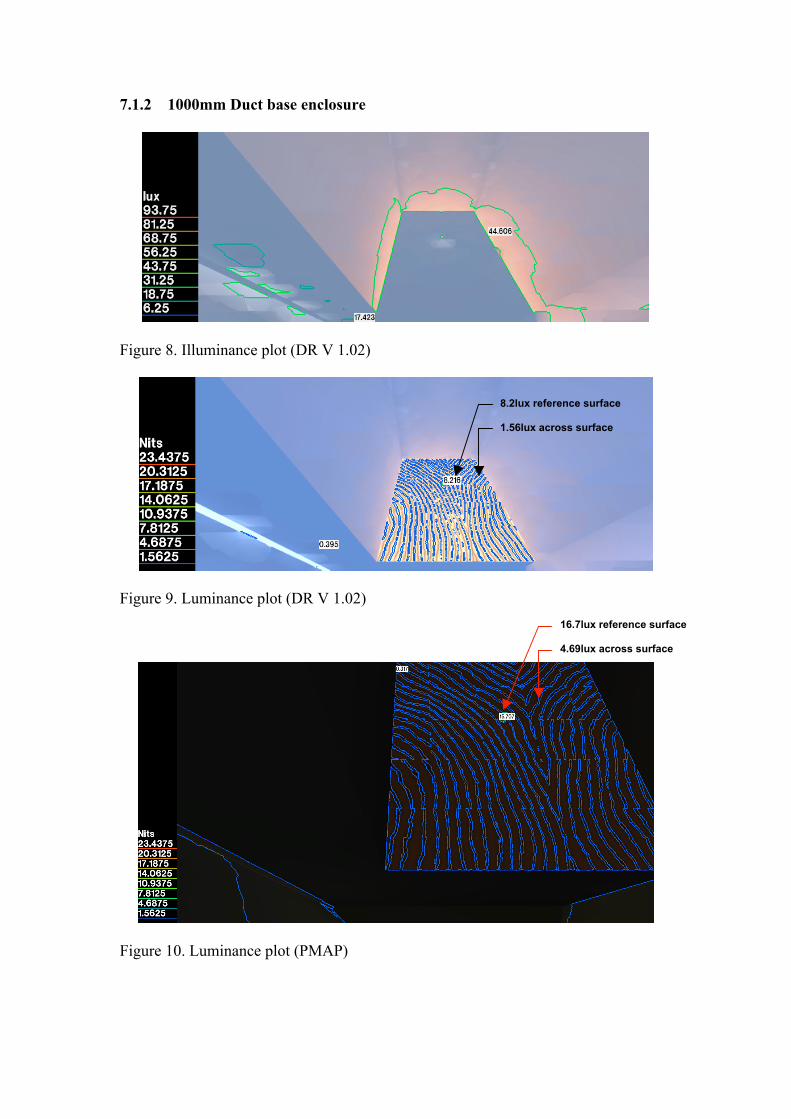
7.1.2 1000mm Duct base enclosure
Figure 8. Illuminance plot (DR V 1.02)
Figure 9. Luminance plot (DR V 1.02)
Figure 10. Luminance plot (PMAP)
8.2lux reference surface
1.56lux across surface
16.7lux reference surface
4.69lux across surface
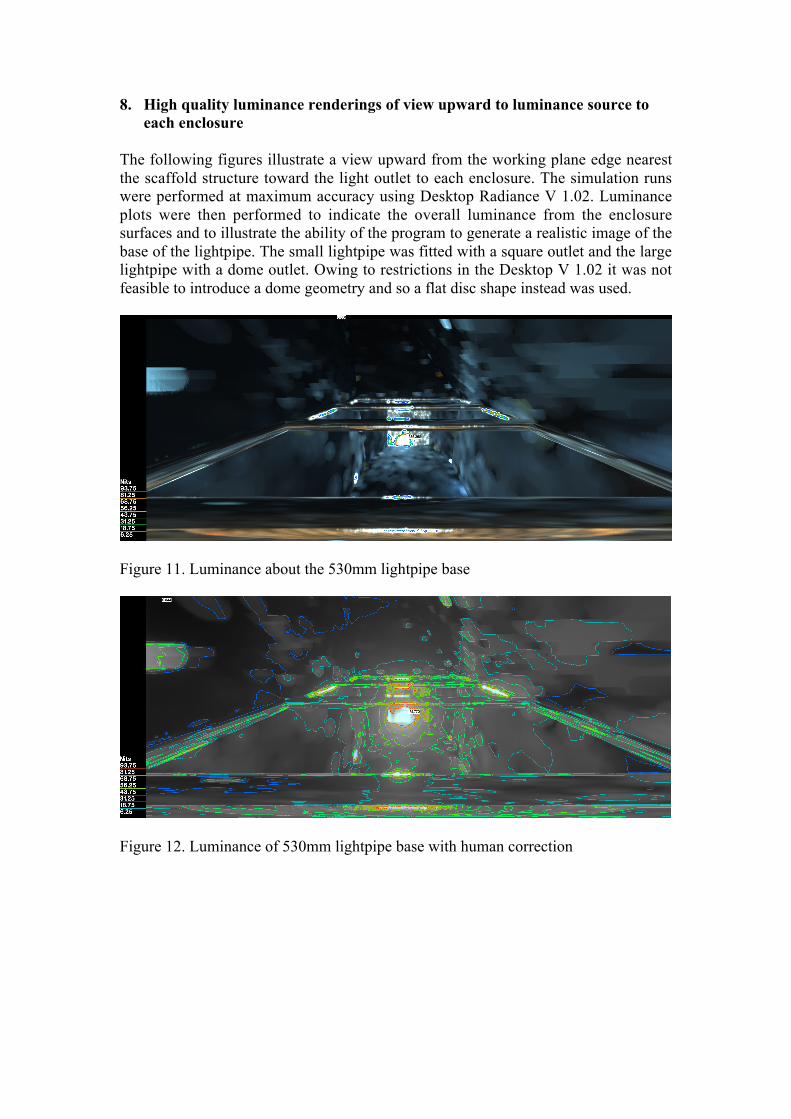
8. High quality luminance renderings of view upward to luminance source to
each enclosure
The following figures illustrate a view upward from the working plane edge nearest
the scaffold structure toward the light outlet to each enclosure. The simulation runs
were performed at maximum accuracy using Desktop Radiance V 1.02. Luminance
plots were then performed to indicate the overall luminance from the enclosure
surfaces and to illustrate the ability of the program to generate a realistic image of the
base of the lightpipe. The small lightpipe was fitted with a square outlet and the large
lightpipe with a dome outlet. Owing to restrictions in the Desktop V 1.02 it was not
feasible to introduce a dome geometry and so a flat disc shape instead was used.
Figure 11. Luminance about the 530mm lightpipe base
Figure 12. Luminance of 530mm lightpipe base with human correction

Figure 13. Luminance about the 1000mm lightpipe base
Figure 14. Luminance of 1000mm lightpipe base with human correction
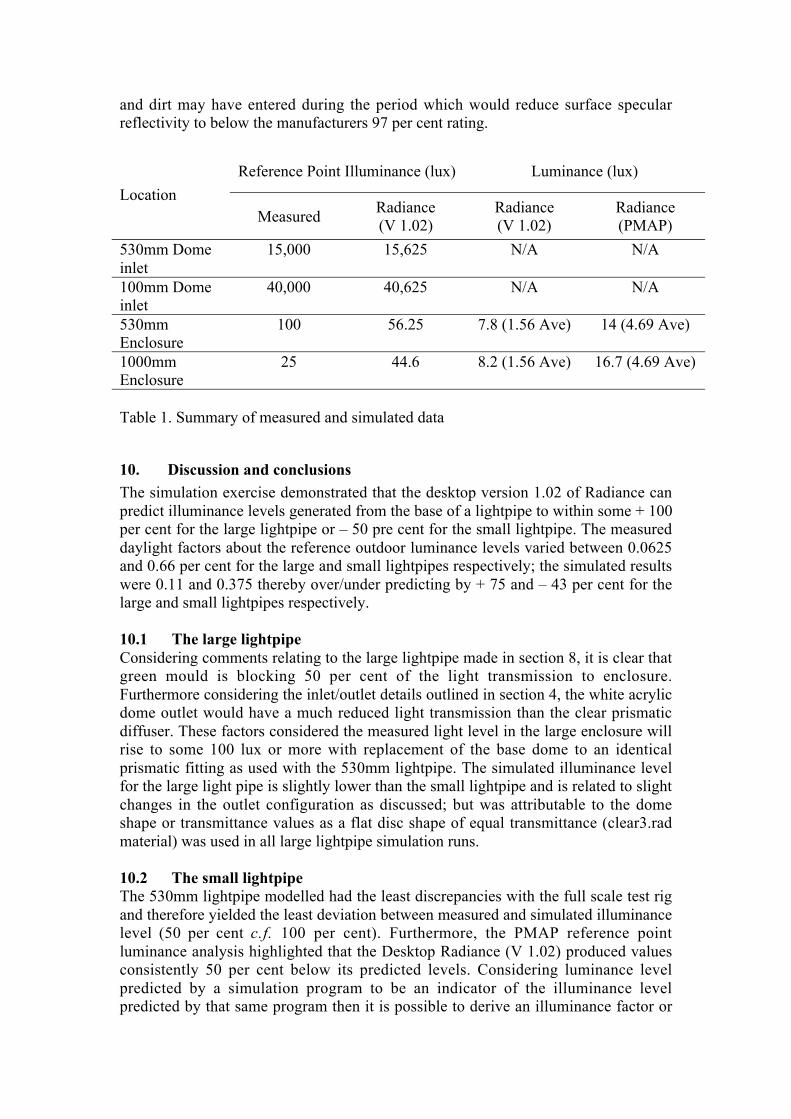
9. Monitoring and Simulation Results
Table 1. presents in summary the results from the measured and simulated light levels
for the light pipe test rig. The location refers to the area of the test rig under
examination whereas the reference point illuminance is the illuminance measured or
simulated at the reference point set out in section 4. The luminance level could not be
measured directly and so is simulated for both enclosures thereby acting as one
indicator of simulation performance.
9.1 Comments on monitoring of test rig
Shortly after completion of the test rig the large lightpipe allowed ingress of some
water during heavy rain storms. The water accumulated on the surface of the outlet
dome and when drained prior to the monitoring, a green mould surface remained. This
surface covered approximately 50 per cent of the dome base and was practically
opaque to light transmission from the lightpipe to the enclosure. Furthermore, dust
and dirt may have entered during the period which would reduce surface specular
reflectivity to below the manufacturers 97 per cent rating.
Reference Point Illuminance (lux) Luminance (lux)
Location
MeasuredRadiance
(V 1.02)
Radiance
(V 1.02)
Radiance
(PMAP)
530mm Dome
inlet
15,000 15,625 N/A N/A
100mm Dome
inlet
40,000 40,625 N/A N/A
530mm
Enclosure
100 56.25 7.8 (1.56 Ave) 14 (4.69 Ave)
1000mm
Enclosure
25 44.6 8.2 (1.56 Ave) 16.7 (4.69 Ave)
Table 1. Summary of measured and simulated data
10. Discussion and conclusions
The simulation exercise demonstrated that the desktop version 1.02 of Radiance can
predict illuminance levels generated from the base of a lightpipe to within some + 100
per cent for the large lightpipe or – 50 pre cent for the small lightpipe. The measured
daylight factors about the reference outdoor luminance levels varied between 0.0625
and 0.66 per cent for the large and small lightpipes respectively; the simulated results
were 0.11 and 0.375 thereby over/under predicting by + 75 and – 43 per cent for the
large and small lightpipes respectively.
10.1 The large lightpipe
Considering comments relating to the large lightpipe made in section 8, it is clear that
green mould is blocking 50 per cent of the light transmission to enclosure.
Furthermore considering the inlet/outlet details outlined in section 4, the white acrylic
dome outlet would have a much reduced light transmission than the clear prismatic
diffuser. These factors considered the measured light level in the large enclosure will
rise to some 100 lux or more with replacement of the base dome to an identical
prismatic fitting as used with the 530mm lightpipe. The simulated illuminance level
for the large light pipe is slightly lower than the small lightpipe and is related to slight
changes in the outlet configuration as discussed; but was attributable to the dome
shape or transmittance values as a flat disc shape of equal transmittance (clear3.rad
material) was used in all large lightpipe simulation runs.
10.2 The small lightpipe
The 530mm lightpipe modelled had the least discrepancies with the full scale test rig
and therefore yielded the least deviation between measured and simulated illuminance
level (50 per cent c.f. 100 per cent). Furthermore, the PMAP reference point
luminance analysis highlighted that the Desktop Radiance (V 1.02) produced values
consistently 50 per cent below its predicted levels. Considering luminance level
predicted by a simulation program to be an indicator of the illuminance level
predicted by that same program then it is possible to derive an illuminance factor or

multiplier with reference to the most accurate program. Taking the ratio of the PMAP
to Radiance V 1.02 luminance values as a multiplier for the respective point
illuminance values then a simulated value within one percent of the measured value
results.
10.3 Conclusion
A full scale test rig was constructed to demonstrate the feasibility of lightpipes as a
means of providing sufficient illuminance for lighting buildings and to serve as a
reference for demonstration of simulation program ability to predict such illuminance
levels. Two lightpipes, 530mm and 1000mm diameter, were monitored for a period of
one month from which a reference working plane illuminance and daylight factor
were derived. The daylight factors varied greatly from 0.66 per cent for the 530mm
lightpipe and 0.0625 per cent for the 1000mm lightpipe. It was shown that the large
light pipe was inefficient in light transmission due to initial leaking of water to the
lightpipe from outside which led to build up of dirt, dust, and mould on the wall
surfaces and on the aperture outlet. Furthermore the aperture was white acrylic which
had inferior transmittance to the prismatic diffuser used for the 530mm lightpipe.
The Radiance simulation software program was used to estimate the illuminance and
luminance from the light pipes. The test rig was drawn into ACAD R14 and both
versions of Desktop Radiance (V 1.02 and V 2.0 Beta) were run Windows 2000
Professional. The latter proved unstable and unable to visually represent the basic
cylindrical lightpipe outlet shape. Neither program could simulate using 3D surface
domes for the inlet or outlet of the system. The original V 1.02 of Desktop Radiance
was however stable, and succeeded to generate illuminance and luminance
distribution analysis for the test rig. The simulated illuminance level for the 530mm
lightpipe best represented the monitored value, owing to physical testing reasons as
discussed, but still predicted illuminance levels some 50 per cent below the actual
condition.
The photon mapping (PMAP) edition of Radiance was run on Linux (Redhat) and
successfully generated luminance distribution analysis for the test rig. The input data
(Octree, View, Material, Glazing data) was taken from the initial Desktop Radiance
(V 1.02) analysis and the glazing file(s) was/were used as the photon port modifier(s)
in the luminance simulation runs. The PMAP program predicted luminance levels
twice that predicted using the Desktop Radiance (V 1.02) program and produced more
clear and realistic images. Considering the forward ray tracer (PMAP) to produce
more indicative results than the backward ray tracer (Desktop Radiance) the
luminance from the PMAP edition was taken as most representative of the real value.
The difference in prediction methods was established through the ratio of the
PMAP/DR luminance reference point values which was in turn used as an illuminance
multiplier. When the multiplier was applied to the 530mm lightpipe a simulated value
of within 1 per cent of the measured value resulted. The PMAP version of Radiance
simulation software suite has been demonstrated to be more accurate than Desktop
Radiance V 1.02 and can accurately predict illumination levels of spaces lit by
lightpipes through application of a luminance ratio multiplier. In this paper, the
multiplier was found to range between 1.79 and 2 for the 530mm and 1000mm
lightpipes respectively.