cortical mechanisms of seeing and hearing...
TRANSCRIPT

Helsinki University of Technology Laboratory of Computational Engineering Espoo 2004 REPORT B43
CORTICAL MECHANISMS OF SEEING AND HEARING SPEECH
Riikka Möttönen
Dissertation for the degree of Doctor of Philosophy to be presented with due permission of the Department of Electrical and Communications Engineering, Helsinki University of Technology, for public examination and debate in Auditorium S1 at Helsinki University of Technology (Espoo, Finland) on the 10th of December, 2004, at 12 o’clock noon. Helsinki University of Technology Department of Electrical and Communications Engineering Laboratory of Computational Engineering Teknillinen korkeakoulu Sähkö- ja tietoliikennetekniikan osasto Laskennallisen tekniikan laboratorio
Distribution: Helsinki University of Technology Laboratory of Computational Engineering P. O. Box 9203 FIN-02015 HUT FINLAND Tel. +358-9-451 6151 Fax. +358-9-451 4830 http://www.lce.hut.fi Online in PDF format: http://lib.hut.fi/Diss/ E-mail: [email protected] ©Riikka Möttönen ISBN 951-22-7426-4 (printed) ISBN 951-22-7427-2 (PDF) ISSN 1455-0474 PicaSet Oy Espoo 2004
i
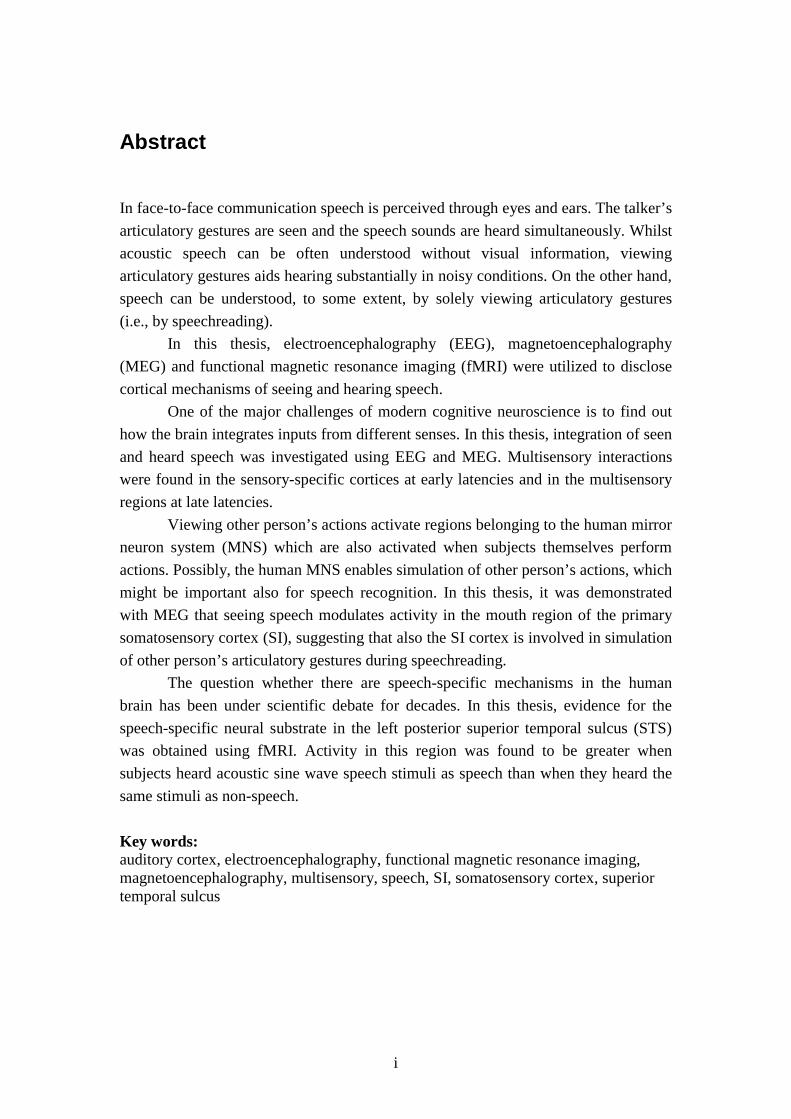
Abstract In face-to-face communication speech is perceived through eyes and ears. The talker’s
articulatory gestures are seen and the speech sounds are heard simultaneously. Whilst
acoustic speech can be often understood without visual information, viewing
articulatory gestures aids hearing substantially in noisy conditions. On the other hand,
speech can be understood, to some extent, by solely viewing articulatory gestures
(i.e., by speechreading).
In this thesis, electroencephalography (EEG), magnetoencephalography
(MEG) and functional magnetic resonance imaging (fMRI) were utilized to disclose
cortical mechanisms of seeing and hearing speech.
One of the major challenges of modern cognitive neuroscience is to find out
how the brain integrates inputs from different senses. In this thesis, integration of seen
and heard speech was investigated using EEG and MEG. Multisensory interactions
were found in the sensory-specific cortices at early latencies and in the multisensory
regions at late latencies.
Viewing other person’s actions activate regions belonging to the human mirror
neuron system (MNS) which are also activated when subjects themselves perform
actions. Possibly, the human MNS enables simulation of other person’s actions, which
might be important also for speech recognition. In this thesis, it was demonstrated
with MEG that seeing speech modulates activity in the mouth region of the primary
somatosensory cortex (SI), suggesting that also the SI cortex is involved in simulation
of other person’s articulatory gestures during speechreading.
The question whether there are speech-specific mechanisms in the human
brain has been under scientific debate for decades. In this thesis, evidence for the
speech-specific neural substrate in the left posterior superior temporal sulcus (STS)
was obtained using fMRI. Activity in this region was found to be greater when
subjects heard acoustic sine wave speech stimuli as speech than when they heard the
same stimuli as non-speech.
Key words: auditory cortex, electroencephalography, functional magnetic resonance imaging, magnetoencephalography, multisensory, speech, SI, somatosensory cortex, superior temporal sulcus

ii
Author: Riikka Möttönen Laboratory of Computational Engineering Helsinki University of Technology
Finland Supervisor: Academy Professor Mikko Sams Laboratory of Computational Engineering Helsinki University of Technology Finland Preliminary examiners: Professor Kimmo Alho Department of Psychology University of Helsinki Finland Professor Heikki Lyytinen Department of Psychology University of Jyväskylä Finland Official opponent: Professor Ruth Campbell Department of Human Communication Science University College London United Kingdom

iii
Publications The dissertation is based on following papers: Study I: Möttönen, R., Krause, C. M., Tiippana, K., and Sams, M. (2002)
Processing of changes in visual speech in the human auditory cortex. Cognitive Brain Research, 13, 417–425.
Study II: Klucharev, V., Möttönen, R., and Sams, M. (2003)
Electrophysiological indicators of phonetic and non-phonetic multisensory interactions during audiovisual speech perception. Cognitive Brain Research, 18, 65–75.
Study III: Möttönen, R., Schürmann, M., and Sams, M. (2004) Time course of
multisensory interactions during audiovisual speech perception in humans: a magnetoencephalographic study. Neuroscience Letters, 363, 112–115.
Study IV: Möttönen, R., Järveläinen, J., Sams, M., and Hari, R. (in press)
Viewing speech modulates activity in the left SI mouth cortex. NeuroImage.
Study V: Möttönen, R., Calvert, G. A., Jääskeläinen, I. P., Matthews, P. M.,
Thesen, T., Tuomainen, J., and Sams, M. (2004). Perception of identical acoustic stimuli as speech or non-speech modifies activity in left posterior superior temporal sulcus. Technical Report B42, ISBN 951-22-7412-4, Helsinki University of Technology, Laboratory of Computational Engineering.
Contributions of the author
I was the principal author in Studies I and III–V. I planned the experiments,
carried out the measurements, analyzed the data and wrote the papers. My co-authors
provided contributions at all stages of the studies. I had an active role in planning the
experiment, preparing the stimuli and writing the paper in Study II.
iv
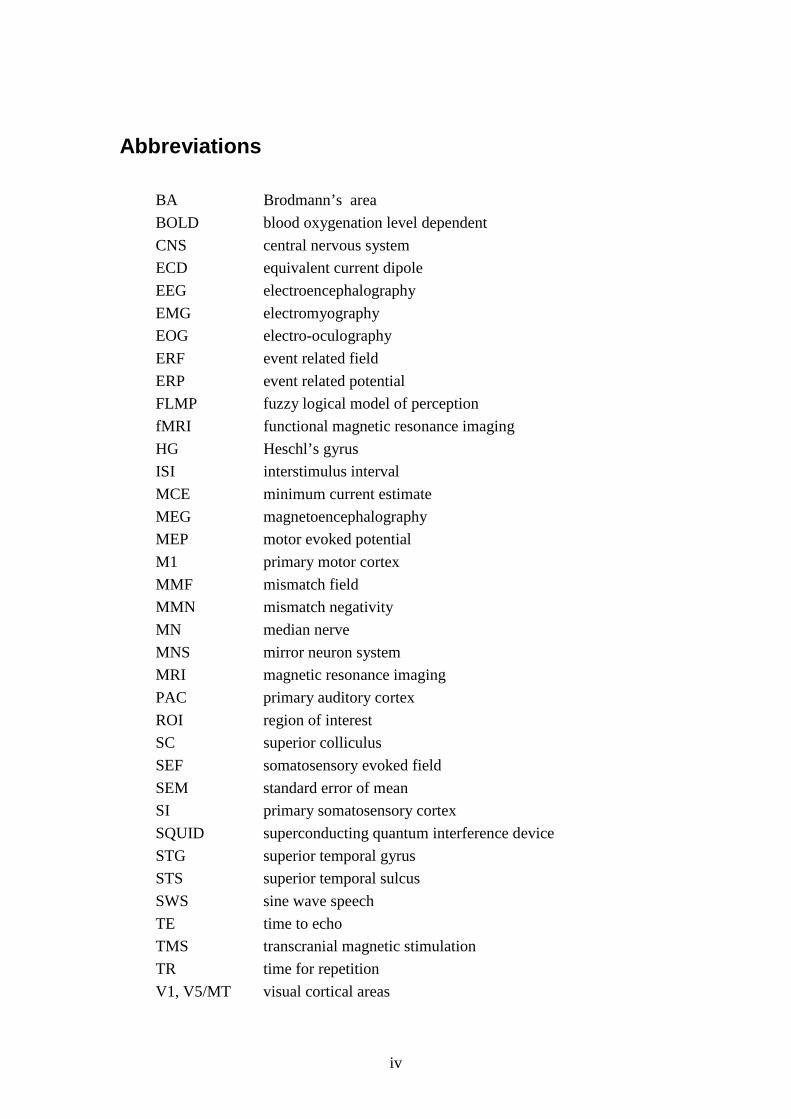
Abbreviations
BA Brodmann’s area
BOLD blood oxygenation level dependent
CNS central nervous system
ECD equivalent current dipole
EEG electroencephalography
EMG electromyography
EOG electro-oculography
ERF event related field
ERP event related potential
FLMP fuzzy logical model of perception
fMRI functional magnetic resonance imaging
HG Heschl’s gyrus
ISI interstimulus interval
MCE minimum current estimate
MEG magnetoencephalography
MEP motor evoked potential
M1 primary motor cortex
MMF mismatch field
MMN mismatch negativity
MN median nerve
MNS mirror neuron system
MRI magnetic resonance imaging
PAC primary auditory cortex
ROI region of interest
SC superior colliculus
SEF somatosensory evoked field
SEM standard error of mean
SI primary somatosensory cortex
SQUID superconducting quantum interference device
STG superior temporal gyrus
STS superior temporal sulcus
SWS sine wave speech
TE time to echo
TMS transcranial magnetic stimulation
TR time for repetition
V1, V5/MT visual cortical areas

v
Preface
This thesis work was carried out in the Laboratory Computational Engineering (LCE)
at the Helsinki University of Technology. The work was financially supported by the
Academy of Finland and the Finnish Graduate School of Neuroscience.
Academy Professor Mikko Sams has been very enthusiastic and supportive
supervisor, who has provided me wonderful opportunities to develop my skills. I am
extremely grateful for his skillful guidance and encouragement.
I thank my co-authors Prof. Iiro P. Jääskeläinen, Dr. Vasily Klucharev, Dr.
Kaisa Tiippana and Dr. Jyrki Tuomainen for successful collaboration and numerous
fruitful discussions. I am also grateful to Prof. Christina M. Krause for her friendly
guidance when I started my work. Thanks also to my colleagues Tobias Andersen,
Toni Auranen, Dr. Michael Frydrych, Aapo Nummenmaa, Laura Kauhanen, Jari
Kätsyri, Janne Lehtonen, Ville Ojanen, Johanna Pekkola, Iina Tarnanen and to many
others with whom I have had a pleasure to work during the past years.
LCE has been an excellent environment to do my research. I wish to
acknowledge the efforts of Academy Professor Kimmo Kaski and Prof. Jouko
Lampinen, head of the laboratory, in leading and developing the laboratory. Special
thanks also to Eeva Lampinen for her help in many practical and bureaucratic issues.
My MEG experiments were carried out in the Brain Research Unit of the Low
Temperature Laboratory. I am grateful to Prof. Riitta Hari, head of the Brain Research
Unit, for this remarkable opportunity. Her enthusiasm and expertise in
neuromagnetism have really impressed me during these years. It has also been a great
pleasure to work with my other co-authors Juha Järveläinen and Dr. Martin
Schürmann from the Low Temperature Laboratory.
My fMRI experiments were carried out in the FMRIB centre at the Oxford
University. I wish to express my gratitude to Prof. Paul M Matthews, head of the
FMRIB centre, for his guidance during my stay in Oxford. I also thank warmly Dr.
Gemma Calvert for welcoming me to her multisensory research group. Working with
her was one of the most effective and exciting periods of my studies. I am also
grateful for help of Thomas Thesen in both scientific and practical issues during my
stay.
I thank Prof. Iiro Jääskeläinen, Ville Ojanen and Dr. Kaisa Tiippana for useful
comments on the manuscript and Prof. Kimmo Alho and Prof. Heikki Lyytinen for
review.
I dedicate this thesis to my beloved parents Marja and Sakari.
Riikka Möttönen

vi
Table of Contents Abstract ...........................................................................................................................i Publications.................................................................................................................. iii Abbreviations................................................................................................................iv Preface............................................................................................................................v Table of Contents..........................................................................................................vi Chapter 1: Review of Literature ....................................................................................1
Hearing Speech ..........................................................................................................1 Speech perception theories ....................................................................................1 Neural basis of speech perception..........................................................................2
Seeing Speech ............................................................................................................6 Intelligibility of seen speech ..................................................................................6 Neural basis of seeing speech ................................................................................7
Integration of heard and seen speech .........................................................................9 Psychophysical evidence .......................................................................................9 Early or late integration?......................................................................................10 Neural mechanisms of multisensory processing..................................................11 Audiovisual speech processing in the human brain.............................................13
Chapter 2: Brain research methods used in the study..................................................15
Electro- and magnetoencephalography (EEG and MEG)........................................15 Generation of electric potentials and neuromagnetic fields.................................15 Measurement devices...........................................................................................17 Analysis methods .................................................................................................18
Functional magnetic resonance imaging (fMRI) .....................................................19 Blood oxygenation level dependent (BOLD) ......................................................19 Measurement devices...........................................................................................20 Analysis methods .................................................................................................20
Chapter 3: Aims of the study .......................................................................................22 Chapter 4: Experiments................................................................................................23
Summary of methods ...............................................................................................23 Subjects ................................................................................................................23 Stimuli..................................................................................................................23 Data acquisition ...................................................................................................25 Source analysis in MEG studies ..........................................................................26
Study I: Changes in visual speech modulate activity in the auditory cortices.........27 Introduction and methods ....................................................................................27 Results and discussion .........................................................................................28
Study II: Non-phonetic interactions precede phonetic interactions during audiovisual speech processing .................................................................................29
Introduction and methods ....................................................................................29 Results and discussion .........................................................................................30
vii
Study III: Acoustic and visual speech inputs interact in auditory cortices earlier than in a multisensory region...................................................................................32
Introduction and methods ....................................................................................32 Results and discussion .........................................................................................32
Study IV: Viewing speech modulates activity in the mouth region of the left primary somatosensory cortex (SI) ..........................................................................34
Introduction and methods ....................................................................................34 Results and discussion .........................................................................................35
Study V: Left posterior STS contains neural substrate for speech perception ........37 Introduction and methods ....................................................................................37 Results and discussion .........................................................................................38
Chapter 5: General discussion .....................................................................................41
Processing of acoustic and visual speech.................................................................41 Speech processing in the superior temporal cortex..............................................41 Embodied simulation of speech ...........................................................................42
Multisensory interactions during audiovisual speech perception ............................43 Early cortical interactions ....................................................................................43 Late cortical interactions......................................................................................44 Summary and insights to further studies..............................................................45
Conclusions..............................................................................................................46 References....................................................................................................................47


1
Chapter 1: Review of Literature
The following sections review theoretical views on speech perception and
experimental studies on the neural basis of hearing and seeing speech. The first and
second sections focus on auditory and visual speech perception, respectively, whereas
the third section focuses on audiovisual speech perception.
Hearing Speech
Speech perception theories
Speech sounds are produced in a talker’s articulatory organs (for a review, see
e.g., Borden et al., 1994). The subglottal structures (diaphragm, trachea and lungs)
serve as an air supply in speech production. The vocal folds in the larynx either
convert the air flow from the lungs into series of puffs by vibrating or allow the air
pass through larynx freely to the vocal tract (oral, nasal, and pharyngeal cavities). The
movements of articulatory organs (tongue, pharynx, palate, lips, and jaw) modify the
resonance characteristics of the vocal tract by changing its shape. Consequently, the
spectrum of the speech acoustic signal is modified.
The key question in speech perception research is how the significant
information is extracted from the acoustic speech signal. Theories of speech
perception fall roughly into two categories (Diehl et al., 2004): (1) those assuming
that speech sounds are mapped into speech-specific (e.g., motor) representations
(Liberman et al., 1967; Liberman and Mattingly, 1985), thus making processing of
speech sounds radically different from that of non-speech sounds, and (2) theories that
posit the same mechanisms to be responsible for processing of both speech and non-
speech acoustic signals (Fowler, 1996; Massaro, 1998). Furthermore, speech
perception theories can be classified on the basis of the assumed objects of speech
perception. Some theories assume that (1) the talker’s articulatory gestures are the
objects of speech perception (Liberman et al., 1967; Liberman and Mattingly, 1985;
Fowler, 1996), whereas others consider (2) the acoustic speech signals as the objects
of perception (Diehl and Kluender, 1989; Massaro, 1998; Kuhl, 2000).
The motor theory of speech perception assumes that speech signal is mapped
into the motor representations of intended articulatory gestures (Liberman et al., 1967;
Liberman and Mattingly, 1985). Speech perception is supposed to be inherently
linked to speech production. The same motor representations are used, when we
produce speech and when we perceive speech produced by others. This is supported
for example by the fact that the phonetic categories do not correspond strictly the
acoustic properties of phonemes (e.g., phoneme /d/ is acoustically very different in
2
syllables /di/ and /du/), but rather the articulatory gestures, which modify the acoustic
speech signal (e.g., /d/ is produces similarly in /di/ and /du/ contexts). The categorical
perception of speech sounds is assumed to be a result of speech-specific perceptual
mechanisms. The motor theory also claims that speech perception is special, meaning
that a specialized innate speech module (that is unique to humans) is responsible for
speech perception.
In contrast, according to the direct realist theory, speech perception is not
special (Fowler, 1986, 1996). Listeners perceive speech and door slams by using the
same perceptual mechanisms. According to this theory we perceive (directly) the
events in our environment that have caused the structure of media (e.g., acoustic
speech signal), to which our sense organs are sensitive, rather than the media itself.
Thus, to perceive speech is to perceive articulatory gestures, which change the shape
of the vocal tract and consequently the spectrum of the acoustic speech signal.
Many researchers have adopted a “general approach” to speech perception
(Diehl and Kluender, 1989; Massaro, 1998; Kuhl, 2000). They argue that speech is
processed by the same mechanisms as other complex sounds and that speech
perception is not mediated by perception of articulatory gestures (as the motor and
direct realist theories assume). This approach is supported by results showing that
both speech and nonspeech sounds can be perceived categorically (Stevens and Klatt,
1974; Pisoni, 1977). Furthermore, there is evidence that even nonhuman animals are
able to perceive speech sounds categorically (Kuhl and Miller, 1975, 1978),
suggesting that general auditory mechanisms (common to humans and nonhuman
animals) contribute to the categorical perception of speech sounds. Perceptual
learning is, however, assumed to affect speech perception. For example, Kuhl (2000)
has proposed that we learn the perceptual characteristics of our native language by
detecting patterns and extracting statistical information from our auditory
environment during early development. These experiences reshape our perceptual
space in such a way that it is compressed around the phonetic prototypes of our native
language.
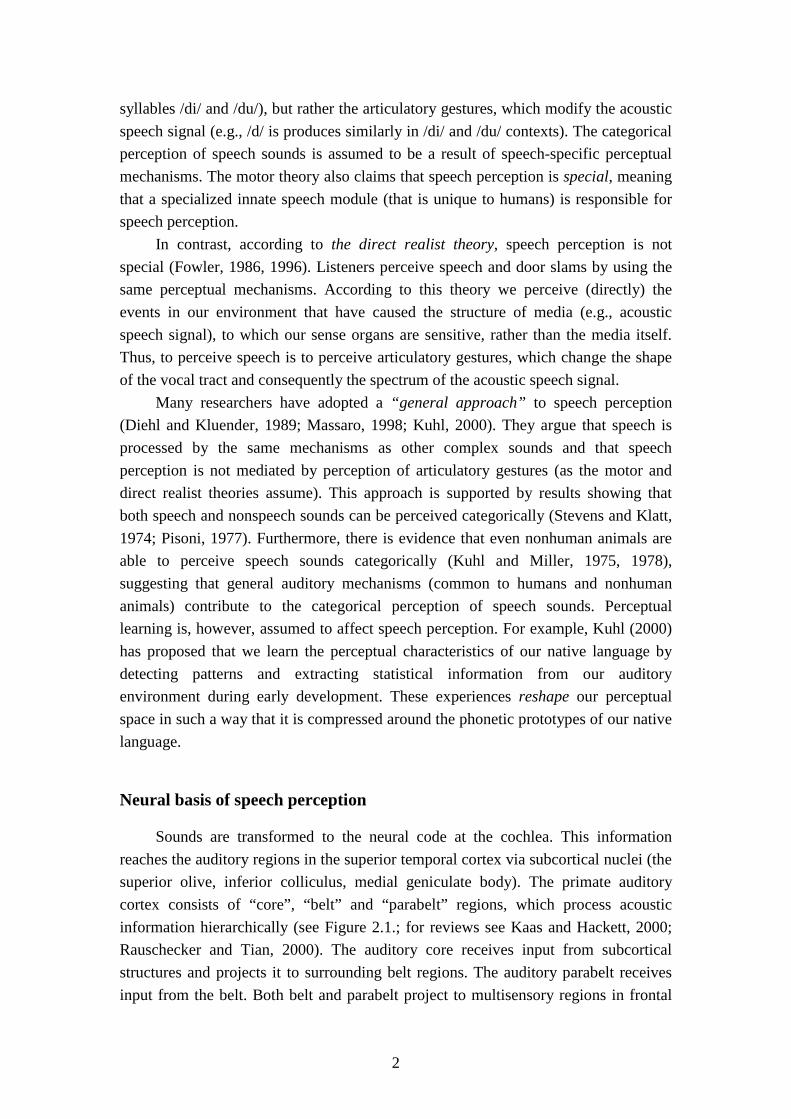
Neural basis of speech perception
Sounds are transformed to the neural code at the cochlea. This information
reaches the auditory regions in the superior temporal cortex via subcortical nuclei (the
superior olive, inferior colliculus, medial geniculate body). The primate auditory
cortex consists of “core”, “belt” and “parabelt” regions, which process acoustic
information hierarchically (see Figure 2.1.; for reviews see Kaas and Hackett, 2000;
Rauschecker and Tian, 2000). The auditory core receives input from subcortical
structures and projects it to surrounding belt regions. The auditory parabelt receives
input from the belt. Both belt and parabelt project to multisensory regions in frontal

3
(Hackett et al., 1999; Romanski et al., 1999), and temporal lobes (e.g., upper and
lower banks of the STS) (Hackett et al., 1998), which receive input from other
sensory systems as well. Functional studies have revealed that processing of acoustic
features becomes increasingly specialized as information flows from lower to higher
levels of auditory cortex (for a review, see Rauschecker and Tian, 2000). In the
auditory core, neurons are tonotopically organized and they respond vigorously to
pure tones (see, however, Nelken et al., 2003). In the lateral belt region, neurons are
more specialized and they respond selectively to, for instance, band-passed noise
bursts, frequency-modulated sweeps and monkey calls (Rauschecker et al., 1995). The
functional properties of the parabelt neurons are not yet well understood.
Figure 2.1. Cortical auditory regions in the macaque brain (viewed from the left). (A) The approximate location of the parabelt region on the superior temporal gyrus (STG) (dashed orange line). (B) The same brain as in A after removal of part of the parietal cortex (dashed black line). The auditory areas within the lateral sulcus (LS) are now visible: the core region (solid red line), the belt region (dashed yellow line), and the parabelt region (dashed orange line). AS, arcuate sulcus; CS central sulcus; INS, insula; STS, superior temporal sulcus. Adapted from Kaas and Hackett, 2000.
The anatomical and functional organization of the human auditory cortex is
likely to be similar to that of the macaque auditory cortex (see, e.g., Zatorre et al.,
1992; Howard et al., 1996; Binder et al., 2000; Howard et al., 2000). The human
homologue of the auditory core, i.e., the primary auditory cortex (PAC, BA 41), is
located in the medial portion of the Heschl’s gyrus (HG) (Galaburda and Sanides,
1980).
When it comes to the speech processing in the human auditory stream, the
fundamental questions in speech perception research are: (1) Is acoustic speech signal
processed (at least partly) by specialized neural mechanisms or is it processed

4
completely by the same auditory mechanisms as other complex sounds? (2) If there
are specialized mechanisms for speech, at which processing stage do they exist?
Neuroimaging studies have attempted to find speech-specific auditory
mechanisms by comparing responses to speech vs. non-speech sounds (Demonet et
al., 1992; Zatorre et al., 1992; Mummery et al., 1999; Binder et al., 2000; Scott et al.,
2000; Vouloumanos et al., 2001; Narain et al., 2003). These studies have consistently
demonstrated that haemodynamic responses are greater for (meaningful and
meaningless) speech than to non-speech sounds in the left STG/STS. These findings
suggest that neuronal systems responsible for the sub-lexical analysis of speech
sounds are located at a relatively late level of auditory processing stream in the
secondary auditory cortex (in STG) and/or in the multisensory regions (in STS).
Comparison of brain activity elicited by speech and non-speech sounds that are
acoustically different is, however, problematic. It cannot be ruled out that any
observed differences in response are due to differences in acoustic features. It is
possible that the left STG/STS region is not involved in speech-specific processing
per se, but rather in processing of complex acoustic features that are characteristic of
speech sounds. Consistent with this interpretation, there is evidence that the left
STG/STS is specialized for processing the rapid time-varying acoustic features
characteristic of consonant sounds (Zatorre and Belin, 2001; Jäncke et al., 2002;
Joanisse and Gati, 2003). In sum, it has remained open (1) whether the putative
speech-specific regions are responsible for processing of acoustic features of the
speech signal or (2) whether these regions contain speech-specific (e.g., articulatory-
gestural or acoustic-phonetic) representations into which acoustic signal is mapped
during speech perception (but not during non-speech perception).
Many electrophysiological and neuromagnetic studies on speech perception
have focused on the mismatch responses, which are elicited by infrequent deviant
sounds presented among frequent standard sounds (for reviews, see Näätänen, 2001;
Näätänen et al., 2001). A mismatch response (i.e., mismatch negativity, MMN, or
mismatch field, MMF) is generated in the auditory cortex typically 100–200 ms after
sound onset (Hari et al., 1984). Since the mismatch response is elicited when subjects
do not attend to the sound sequence, it is assumed to be generated by pre-attentive
change-detection mechanisms (Alho et al., 1992: see also Jääskeläinen et al., 2004).
However, it is elicited also when subject actively attend to the stimuli. Several studies
(e.g., Dehaene-Lambertz, 1997; Rinne et al., 1999; Sharma and Dorman, 1999;
Phillips et al., 2000) have shown that deviants, that are phonetically and acoustically
different from standards, elicit larger mismatch responses (usually 100–150 ms after
sound onset in the left hemisphere) than deviants, that are only acoustically different
from standards (for conflicting evidence see, however, Sams et al., 1990 and Sharma
et al., 1993). Furthermore, subjects’ language background affects the size of mismatch
response to speech sounds: acoustic differences which are phonetically relevant in
subjects’ native language elicit larger mismatch responses in the left hemisphere than
5
phonetically irrelevant acoustic changes (Näätänen et al., 1997; Winkler et al., 1999).
On the basis of the above-mentioned findings it has been proposed that relatively low-
levels of auditory cortex (~ left posterior STG) would contain phonetic memory
traces, which are accessed as early as 100–150 ms after acoustic stimulus onset
(Näätänen et al., 1997; Rinne et al., 1999; Näätänen, 2001).
The hypothesis, derived from the motor theory of speech perception, that speech
perception would use the neural mechanisms of speech production, has gained support
recently. Several studies have shown that hearing speech modulates activity in the
primary motor cortex (M1) of the human brain (Fadiga et al., 2002, Watkins et al.,
2003, Wilson et al., 2004). For example, recent transcranial magnetic stimulation
(TMS) studies demonstrate that motor evoked potentials (MEPs) recorded from
articulatory muscles to TMS of the left M1 are enhanced during listening to speech
(Fadiga, 2002; Watkins et al., 2003). These findings provide direct evidence that
heard speech is simulated in the “speech production” system. The human M1 is
considered to be a part of the mirror neuron system (MNS) which provides a link
between action execution and perception (Hari et al., 1998). In monkeys, mirror
neurons in area F5 of the premotor cortex are activated both when the monkey
performs hand and mouth actions and when it sees actions made by others (di
Pellegrino et al., 1992; Ferrari et al., 2003). Moreover, action-related sounds activate a
subpopulation of these neurons (Kohler et al., 2002; Keysers et al., 2003). Similar
mirror neurons seem to exist also in the human brain in a neuronal circuitry that
comprises at least Broca’s area, the premotor regions, and the primary motor cortex.
These areas form the MNS which is also closely connected to STS region and the
inferior parietal lobule (Fadiga et al., 1995; Hari et al., 1998; Nishitani and Hari,
2000; Buccino et al., 2001; Nishitani and Hari, 2002). Mirror neurons might provide a
neural substrate for embodied simulation of other persons’ actions, likely to be
important in interpersonal communication (Gallese et al., 1996; Gallese and Goldman,
1998; Rizzolatti et al., 2001). Specifically, the human MNS might play a specific role
in speech communication by aiding the recognition of other people’s articulatory
gestures through embodied simulation.
Both Hickock and Poeppel (2000, 2004) and Scott and colleagues (Scott and
Johnsrude, 2003; Scott and Wise, 2004) have proposed that parallel ventral and dorsal
streams would be responsible for mapping the acoustic speech signal into acoustic-
phonetic (i.e., non-gestural) and articulatory-based (i.e., gestural) representations,
respectively. This view has been derived from functional organization of the visual
system, which consists of parallel ventral and dorsal streams. The ventral stream of
the auditory system is assumed to subserve understanding of meaningful speech,
whereas the dorsal stream is assumed to provide a link between speech perception and
production.
The exact anatomical locations of these two speech-processing streams differ in
models proposed by Hickock and Poeppel and by Scott and colleagues. According to

6
Scott and colleagues (2004) the ventral (anterior) stream, responsible for mapping
acoustic-phonetic cues onto lexical representations, contains the anterior STG/STS
regions, which have connections with the ventro- and dorsolateral frontal cortex (e.g.,
Broca’s area). The dorsal (posterior) stream, responsible for mapping acoustic input
onto articulatory-gestural representations, contains the posterior STG/STS regions
which are connected with the dorsolateral frontal cortex (e.g., premotor cortex). In
contrast, Hickock and Poeppel propose that conceptual analysis of speech sounds
occurs in the posterior parts of the temporal lobe, and articulatory-based analysis
takes place in the posterior Sylvian fissure connected with the frontal lobe.
Seeing Speech
Intelligibility of seen speech
Viewing a talker’s articulatory gestures allows the observer to understand
speech to some extent (for reviews, see Dodd and Campbell, 1987; Campbell et al.,
1998). The ability to speechread can vary a lot across observers. Hearing-impaired
and deaf people are typically (but not always) very skillful speechreaders, although
normal-hearing people are able to speechread as well. Since only some articulatory
movements are visible, visual speech does not contain as much information as
acoustic speech.
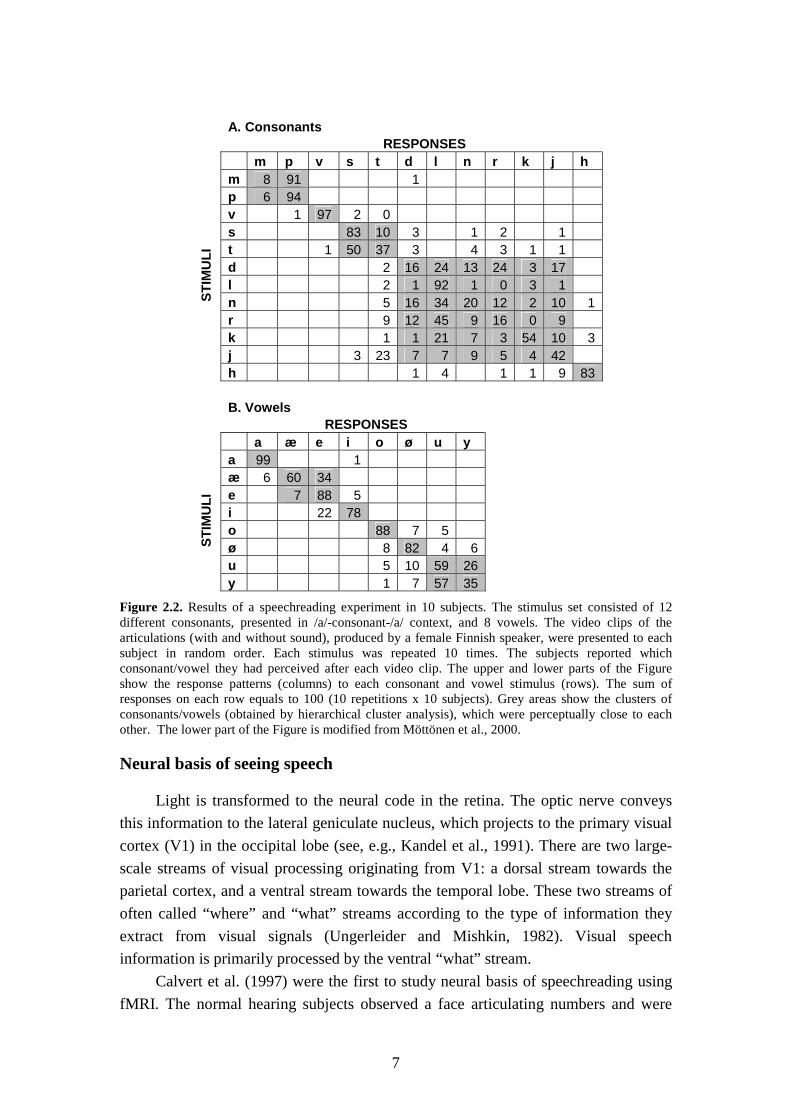
Figure 2.2 depicts results from a speechreading experiment in 10 Finnish
speaking subjects carried out in our laboratory (Möttönen et al., 2000). Subjects had
normal hearing and vision and they did not have any speechreading training or special
experience related to it. The matrices in Figure 2.2 present the response distributions
(columns) to each stimulus (rows). Only three (/p/, /v/, /l/) out of 12 consonants were
identified correctly over 90 times out of 100 presentation times. However, the
responses to the other consonants were not randomly distributed across response
alternatives. There were confusions between consonants which share the same place
of articulation, but not between consonants which are articulated at clearly different
places. For example, bilabials /m/ and /p/ were frequently confused with each other
but not with labiodentals (/v/), dentals (/s/, /t/, /d/, /n/, /r/, /l/), palatals (/j/), velars (/k/)
or larynguals (/h/). The vowels were rather well identified. There are however
frequent confusions between /æ/ and /e/ as well as between /u/ and /y/, which differ
from each other with respect to front-back feature. These results demonstrate that
normal hearing subjects are able to extract phonetic information from seen
articulatory gestures.
7
A. Consonants RESPONSES m p v s t d l n r k j h
m 8 91 1 p 6 94 v 1 97 2 0 s 83 10 3 1 2 1 t 1 50 37 3 4 3 1 1 d 2 16 24 13 24 3 17 l 2 1 92 1 0 3 1 n 5 16 34 20 12 2 10 1 r 9 12 45 9 16 0 9 k 1 1 21 7 3 54 10 3 j 3 23 7 7 9 5 4 42
ST
IMU
LI
h 1 4 1 1 9 83 B. Vowels RESPONSES a æ e i o ø u y
a 99 1 æ 6 60 34 e 7 88 5 i 22 78 o 88 7 5 ø 8 82 4 6 u 5 10 59 26
ST
IMU
LI
y 1 7 57 35
Figure 2.2. Results of a speechreading experiment in 10 subjects. The stimulus set consisted of 12 different consonants, presented in /a/-consonant-/a/ context, and 8 vowels. The video clips of the articulations (with and without sound), produced by a female Finnish speaker, were presented to each subject in random order. Each stimulus was repeated 10 times. The subjects reported which consonant/vowel they had perceived after each video clip. The upper and lower parts of the Figure show the response patterns (columns) to each consonant and vowel stimulus (rows). The sum of responses on each row equals to 100 (10 repetitions x 10 subjects). Grey areas show the clusters of consonants/vowels (obtained by hierarchical cluster analysis), which were perceptually close to each other. The lower part of the Figure is modified from Möttönen et al., 2000.
Neural basis of seeing speech
Light is transformed to the neural code in the retina. The optic nerve conveys
this information to the lateral geniculate nucleus, which projects to the primary visual
cortex (V1) in the occipital lobe (see, e.g., Kandel et al., 1991). There are two large-
scale streams of visual processing originating from V1: a dorsal stream towards the
parietal cortex, and a ventral stream towards the temporal lobe. These two streams of
often called “where” and “what” streams according to the type of information they
extract from visual signals (Ungerleider and Mishkin, 1982). Visual speech
information is primarily processed by the ventral “what” stream.
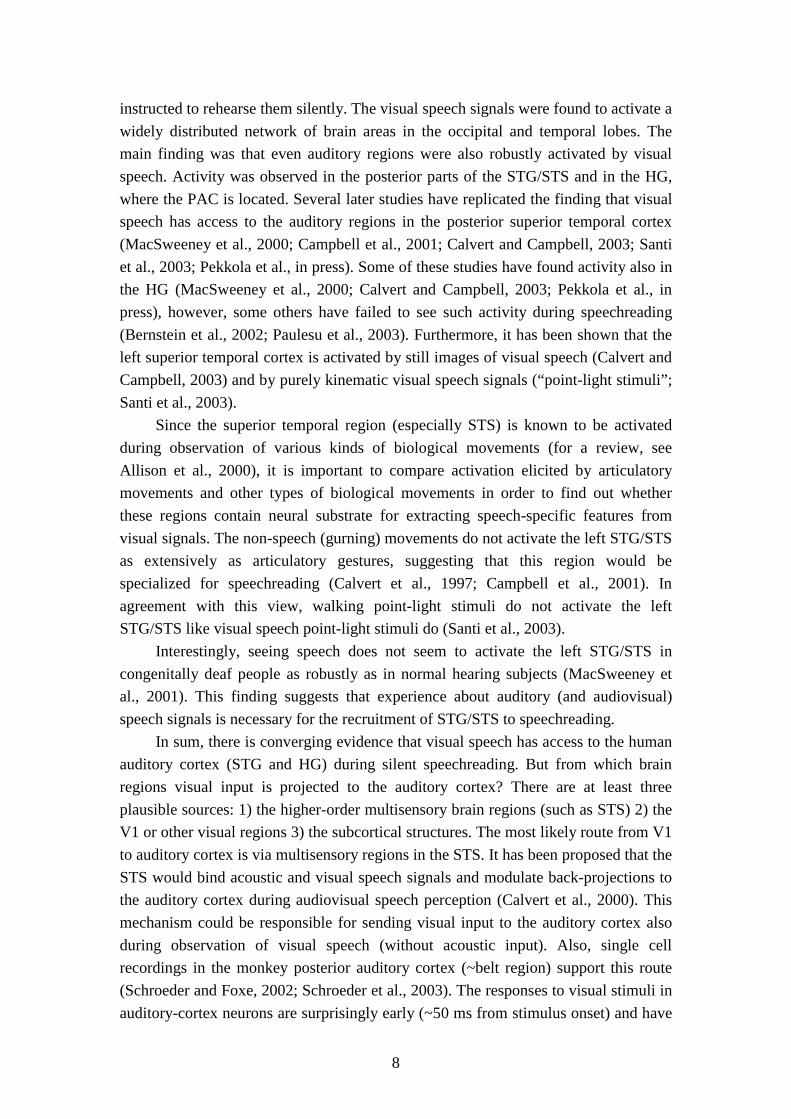
Calvert et al. (1997) were the first to study neural basis of speechreading using
fMRI. The normal hearing subjects observed a face articulating numbers and were
8
instructed to rehearse them silently. The visual speech signals were found to activate a
widely distributed network of brain areas in the occipital and temporal lobes. The
main finding was that even auditory regions were also robustly activated by visual
speech. Activity was observed in the posterior parts of the STG/STS and in the HG,
where the PAC is located. Several later studies have replicated the finding that visual
speech has access to the auditory regions in the posterior superior temporal cortex
(MacSweeney et al., 2000; Campbell et al., 2001; Calvert and Campbell, 2003; Santi
et al., 2003; Pekkola et al., in press). Some of these studies have found activity also in
the HG (MacSweeney et al., 2000; Calvert and Campbell, 2003; Pekkola et al., in
press), however, some others have failed to see such activity during speechreading
(Bernstein et al., 2002; Paulesu et al., 2003). Furthermore, it has been shown that the
left superior temporal cortex is activated by still images of visual speech (Calvert and
Campbell, 2003) and by purely kinematic visual speech signals (“point-light stimuli”;
Santi et al., 2003).
Since the superior temporal region (especially STS) is known to be activated
during observation of various kinds of biological movements (for a review, see
Allison et al., 2000), it is important to compare activation elicited by articulatory
movements and other types of biological movements in order to find out whether
these regions contain neural substrate for extracting speech-specific features from
visual signals. The non-speech (gurning) movements do not activate the left STG/STS
as extensively as articulatory gestures, suggesting that this region would be
specialized for speechreading (Calvert et al., 1997; Campbell et al., 2001). In
agreement with this view, walking point-light stimuli do not activate the left
STG/STS like visual speech point-light stimuli do (Santi et al., 2003).
Interestingly, seeing speech does not seem to activate the left STG/STS in
congenitally deaf people as robustly as in normal hearing subjects (MacSweeney et
al., 2001). This finding suggests that experience about auditory (and audiovisual)
speech signals is necessary for the recruitment of STG/STS to speechreading.
In sum, there is converging evidence that visual speech has access to the human
auditory cortex (STG and HG) during silent speechreading. But from which brain
regions visual input is projected to the auditory cortex? There are at least three
plausible sources: 1) the higher-order multisensory brain regions (such as STS) 2) the
V1 or other visual regions 3) the subcortical structures. The most likely route from V1
to auditory cortex is via multisensory regions in the STS. It has been proposed that the
STS would bind acoustic and visual speech signals and modulate back-projections to
the auditory cortex during audiovisual speech perception (Calvert et al., 2000). This
mechanism could be responsible for sending visual input to the auditory cortex also
during observation of visual speech (without acoustic input). Also, single cell
recordings in the monkey posterior auditory cortex (~belt region) support this route
(Schroeder and Foxe, 2002; Schroeder et al., 2003). The responses to visual stimuli in
auditory-cortex neurons are surprisingly early (~50 ms from stimulus onset) and have

9
feed-back laminar response profile, which suggests that visual input was projected
from higher-level cortical region, for instance, STS. (Note that the visual stimuli in
these recordings were flashes of light, thus very simple visual stimuli have access to
the auditory-cortex neurons in monkeys.) Currently, there is no evidence about direct
pathways from V1 to the auditory cortex. However, retrograde trace studies in cats
have shown that auditory cortex (~parabelt region) projects directly to the visual
cortex, including V1 (Falchier et al., 2002; Rockland and Ojima, 2003). Thus, it can
be just a matter of time when the pathways to the opposite direction are found. The
subcortical structures are also plausible candidates for sources of visual input, because
many of them function as relay areas for both acoustic and visual signals. However,
there is currently no direct evidence of subcortical structures projecting visual input to
the auditory cortices.
Numerous studies to date have demonstrated that also frontal regions (Broca’s
area, the premotor cortices and M1) are activated during seeing speech in normal
hearing subjects (Campbell et al., 2001; Nishitani and Hari, 2002; Callan et al., 2003;
Calvert and Campbell, 2003; Paulesu et al., 2003; Santi et al., 2003). Furthermore, in
a recent TMS study seeing speech modulated functioning of the primary motor cortex
MI, specifically its mouth area in the left hemisphere (Watkins et al., 2003). These
findings are in agreement with the hypothesis that seen articulatory gestures are
internally simulated in MNS during speechreading.
Integration of heard and seen speech
Psychophysical evidence
In everyday conversations, we typically hear talkers’ voice and see their
articulatory gestures simultaneously. The visual speech information improves the
intelligibility of acoustic speech, when there is background noise (Sumby and Pollack,
1954) or the content of speech is semantically difficult (Reisberg et al., 1987).
Figure 2.3 shows results from a speech recognition experiment that was carried
out in our laboratory in 20 normal hearing subjects (Möttönen, 1999). Meaningless
acoustic vowel-consonant-vowel stimuli were presented both alone and with
concordant visual speech. Noise was added to acoustic stimuli in order to acquire four
signal-to-noise-ratio (SNR) levels: 0, –6, –12, and –18 dB. In each subject, the
proportion of correctly recognized audiovisual speech stimuli was greater than that of
acoustic speech stimuli at all SNR levels. The benefit of visual information was the
greater the lower the SNR of acoustic speech. The results demonstrate that normal
hearing subjects use both acoustic and visual information in order to recognize
speech.

10
Figure 2.3. Proportions of correctly identified acoustic and audiovisual speech items at different signal-to-noise-ratio levels (0, –6, –12 and –18 dB) in 20 subjects. The stimulus set consisted of 39 vowel-consonant-vowel words produced by a native Finnish speaker. Each acoustic stimulus was presented alone and together with visual articulation. Modified from Möttönen, 1999.
Another clear indication of the use of both acoustic and visual information
during speech perception is the McGurk effect (McGurk and MacDonald, 1976). It
shows that phonetically conflicting visual information can be integrated with highly
intelligible acoustic signal and modifies its perception. McGurk effect is named
according to Harry McGurk, who coincidentally found that auditory syllable /ba/
dubbed with visual articulatory gestures of /ga/ was heard as /da/. Summerfield and
McGrath (1984) found that visual information can change the auditory perception of
vowels, too. Interestingly, a strong McGurk effect can be produced by even
temporally asynchronous (Green, 1996; Massaro et al., 1996; Munhall et al., 1996)
and spatially disparate acoustically and visual speech inputs (Jones and Munhall,
1997).
Early or late integration?
A number of models have been proposed to explain how the acoustic and visual
speech inputs are combined (for reviews, see Summerfield, 1987; Massaro, 1998;
Massaro and Stork, 1998; Robert-Ribes et al., 1998; Massaro, 2004). The main
challenge of these models is to explain in what kind of common representational
space the integration occurs. The models can be divided roughly into two categories
according to the assumed level of integration (Schwartz et al., 1998): (1) The early
integration models assume that audiovisual integration occurs before the level of
11
phonetic categorization. (2) The late integration models assume, in contrast, that
acoustic and visual speech inputs are processed in isolation up to the phonetic level.
The speech perception theories are primarily developed to explain processing of
acoustic speech signals. The contribution of visual input to auditory speech perception
provides a challenge to these theories.
The theories according to which speech perception is mediated by perception of
articulatory gestures can quite efficiently explain audiovisual integration of speech.
The motor and direct realist theories assume that acoustic and visual sensory inputs
are combined in an amodal (gestural) representational space. According to the motor
theory both acoustic and visual speech inputs are mapped into the same motor
representations of the vocal tract gestures (Liberman et al., 1967; Liberman and
Mattingly, 1985). Thus, audiovisual integration can be seen as a natural consequence
of special speech processing. In a similar vein, since the vocal tract gestures are the
objects of speech perception according to the direct realist theory (Fowler, 1986;
1996; 2004), it is obvious that both acoustic and visual signals from the same gestures
contribute to speech perception.
The theories, according to which acoustic features rather than articulatory
gestures are the objects of speech perception, emphasize the dominance of acoustic
speech in normal speech perception (e.g., Diehl and Kluender, 1989). However,
supporters of these theories acknowledge also the effect of visual speech on auditory
phonetic categorization in some specific cases. Diehl and Kluender (1989) assume
that during audiovisual speech perception both visual and acoustic speech inputs are
categorized phonetically and the integration occurs (late) at a post-phonetic level. The
link between acoustic and visual speech signals is assumed to be formed through
perceptual learning.
Massaro (1998, 2004) considers audiovisual speech perception as a case of
pattern recognition in which several sources of information from different sensory
systems contribute to the perceptual outcome. The Fuzzy Logical Model of Perception
(FLMP) describes how pattern recognition occurs by a statistically optimal integration
rule. This integration rule is assumed describe integration of any sensory inputs, not
only integration of acoustic and visual speech. FLMP is a late integration model,
because it assumes that different sensory inputs are “evaluated” separately, before the
level of integration. In the case of audiovisual speech perception, acoustic and visual
inputs are compared to phonetic prototypes at an evaluation level.
Neural mechanisms of multisensory processing
Audiovisual speech perception is just one example of multisensory processing.
Nowadays it is widely acknowledged that sensory systems do not function completely
independently from each other (Stein and Meredith, 1993; Calvert et al., 2004). In the
natural environment, we receive information about the objects around us via different
senses. For example, a singing bird can be both seen and heard. Typically, these kinds
12
of multimodal objects are detected, localized and identified more rapidly and
accurately than objects, which are perceived via only one sensory system (see, e.g.,
Welch and Warren, 1986; De Gelder and Bertelson, 2003). The central nervous
system (CNS) thus seems to be able to integrate sensory inputs mediated by different
sense organs.
Single cell recording studies in non-human mammals have found multisensory
neurons which are activated by inputs mediated by multiple sense organs. These kinds
of neurons have been found at various levels of CNS: (1) In the subcortical structures
(e.g., the superior colliculus, Stein and Meredith, 1993; Stein et al., 2004), (2) in the
sensory-specific cortices (e.g., auditory belt and parabelt, Schroeder and Foxe, 2002;
Schroeder et al., 2003), and (3) in the association cortices (e.g., anterior and posterior
regions of STS, for a review, see Cusick, 1997). These findings support the view that
convergence of different sensory inputs to the same neurons enables interaction
between sensory modalities.
The most thoroughly studied multisensory neurons are located in the
mammalian superior colliculus (SC) (Stein and Meredith, 1993; Stein et al., 2004),
which is a subcortical structure thought to be involved in orientation and attentive
behaviours. Some of the multisensory neurons in SC are able to integrate inputs from
different sensory systems: two stimuli presented in the same location at the same time
produce response enhancement in these neurons. The response to two simultaneous
stimuli typically exceeds the sum of responses to the same stimuli presented
separately. The enhancements tend to be the stronger the weaker the unimodal
stimuli; this principle is called inverse effectiveness. In contrast, two stimuli presented
in different locations (or at different times) produce response suppression in these
neurons.
Surprisingly little is known about how the simultaneous sensory inputs from
different senses interact in cortical neurons (see, e.g., Meredith, 2004). There is
however evidence that some cortical multisensory neurons would behave quite
differently than SC neurons during multisensory stimulation. For example, neurons in
the area SIV of the cat somatosensory cortex are activated strongly by tactile stimuli,
but not by auditory stimulation alone. However, auditory-tactile stimuli produce a
smaller response than tactile stimuli alone in these neurons (Dehner et al., 2004).
Thus, in addition to excitatory-excitatory form of convergence (demonstrated in SC
neurons) there exists also excitatory-inhibitory form of multisensory convergence.
The properties of the SC multisensory neurons have influenced enormously on
the methodology of brain imaging studies which have attempted to find multisensory
integration mechanisms in the human brain. First, the multisensory integration
mechanisms are studied by comparing responses to multisensory stimuli with the sum
of responses to unimodal stimuli, i.e., “predicted responses” (Calvert et al., 1999;
Giard and Peronnet, 1999; Calvert et al., 2000; Fort et al., 2002a, b; Molholm et al.,
2002). The underlying assumption of this “additive model” is following: if the

13
multisensory responses differ from the “predicted” responses, multisensory
integration has taken place. Second, several studies have applied the inverse
effectiveness rule to brain imaging data and assumed that degraded unimodal stimuli
are integrated more efficiently than clear ones (Callan et al., 2001; Callan et al., 2003;
Callan et al., 2004). A third method is to compare responses to congruent and
incongruent multisensory stimuli (by manipulating, e.g., semantic, temporal or spatial
properties of the stimuli) (Calvert et al., 2000; Calvert et al., 2001; Macaluso et al.,
2004). This approach allows studying selectively the sensitivity of integration
mechanisms to a specific feature of the multisensory stimuli.
Audiovisual speech processing in the human brain
The key questions of neurophysiological research of audiovisual speech
perception are: (1) Where and (2) when in the human CNS acoustic and visual speech
inputs are integrated? (3) What kinds of integration mechanisms are responsible for
the improved intelligibility of audiovisual speech and for the McGurk effect?
Sams et al. (1991) were the first to study neural basis of the McGurk effect.
They recorded neuromagnetic mismatch responses to audiovisual speech stimuli
which gave rise to McGurk effect. The mismatch responses are typically elicited by
occasional acoustical changes in the sound sequence (for a review, see Näätänen et
al., 2001). The obvious question which arises is whether these responses are elicited
also when there is no acoustical change in the sound sequence, but a subject perceives
an illusory auditory change due to McGurk effect. In order to answer this question
Sams and colleagues presented infrequent incongruent audiovisual stimuli (acoustic
/pa/ and visual /ka/) that were heard as /ta/ or /ka/ among frequent congruent syllables
(acoustic /pa/ and visual /pa/) and measured neuromagnetic responses over the left
hemisphere. The infrequent (deviant) stimuli were thus acoustically identical with the
standard stimuli, but they were perceived to be acoustically deviant from the standard
stimuli. This kind of deviant stimuli elicited mismatch responses peaking at 180 ms in
the left supratemporal auditory cortex. This finding showed, for the first time, that
visual speech modulates activity in the auditory cortex during audiovisual speech
perception.
Modulated activity in the sensory-specific cortices during audiovisual binding
has been demonstrated also by using fMRI. BOLD responses in the auditory cortex
(BA 42/41) as well as in the visual motion cortex (V5/MT) are enhanced during
audiovisual speech perception in comparison to the sum of responses to auditory or
visual speech stimuli (Calvert et al., 1999; Calvert et al., 2000).
There is also evidence that multisensory STS region plays a role in audiovisual
integration of speech. Calvert et al. (2000) showed that observing synchronous
meaningful audiovisual speech enhances haemodynamic responses in the posterior
parts of STS in comparison to the sum of responses to acoustic and visual speech
observed separately. Observing asynchronous audiovisual speech decreased
14
haemodynamic responses in the left STS. Accordingly, Macaluso et al. (2004) found
that left STS is sensitive to temporal synchrony, but not to spatial disparity, of
acoustic and visual speech inputs. In contrast, (Olson et al., 2002) failed to see
modified activity in the STS region during perception of synchronized versus
desynchronised audiovisual words. The left claustrum was the only brain region
which showed differential responses to two types of audiovisual stimuli in their study.
Callan et al. (2001; 2003; 2004) have explored neural correlates of enhanced
perception of audiovisual speech. It is well known that the perceptual enhancements
due to audiovisual integration are greatest when auditory speech signals is degraded
(Sumby and Pollack, 1954; Erber, 1969). The fMRI study of Callan et al. (2003)
showed that activity in the STG/STS regions to audiovisual speech is enhanced when
noise is added to the auditory signal. Similarly, an EEG study showed that the left
superior temporal cortex generates high-frequency oscillations (45–70 Hz) at 150–300
ms after audiovisual speech stimuli presented in noise (Callan et al., 2001). These
findings suggest that multisensory neurons in STG/STS region would obey the
inverse effectiveness rule stating that the response enhancement to multisensory
stimulation is greatest when the unimodal stimuli are least effective.
In sum, there is evidence that activity in subcortical structures and in the
sensory-specific and multisensory cortical regions is modulated during binding of
audiovisual speech, suggesting that multiple levels of the human CNS would play a
role in audiovisual speech integration. However, little is known about the time course
of these modulations. It has been proposed that acoustic and visual speech inputs
would be first integrated in the high-level multisensory cortical regions (such as STS)
and that the activity modulations in the sensory-specific cortices would be caused by
back-projections from these higher-level multisensory integration sites to sensory-
specific cortices (Calvert et al., 2000; Bernstein et al., 2004). According to an
alternative view, the inputs from different senses start to interact at low levels of CNS
(in the sensory-specific cortices and/or in the subcortical structures) independently of
the high-level multisensory cortices (Ettlinger and Wilson, 1990; Schroeder and Foxe,
2004).
15
Chapter 2: Brain research methods used in the study
This study consists of five experiments in which electroencephalography (EEG,
Berger, 1929; Niemermeyer and Da Silva, 1999), magnetoencephalography (MEG,
Cohen, 1968; Hämäläinen et al., 1993) and functional magnetic resonance imaging
(fMRI, Belliveau et al., 1991; Jezzard et al., 2001) were used to investigate neural
basis of hearing and seeing speech. These non-invasive brain research methods
provide complementary information about the human brain activity underlying
various sensory and cognitive processes. EEG and MEG measure directly electric
potentials and neuromagnetic fields generated by neural currents, providing
information about the brain activity with millisecond accuracy. The haemodynamic
responses measured by fMRI do not provide accurate information about the timing of
brain activity. However, fMRI is superior to both EEG and MEG in terms of spatial
resolution.
The MEG and EEG section below is largely based on the review articles of
Hämäläinen and colleagues (1993) and Hari (1999). The fMRI section is largely
based on the book by Jezzard and colleagues (2001).
Electro- and magnetoencephalography (EEG and MEG)
Generation of electric potentials and neuromagnetic fields
The brain is made up of enormous number of neurons (~1011) and glial cells
(~10–5012) (see, e.g., Kandel et al., 1991). Communication between neurons results in
tiny electric currents. When a population of parallel neurons is active synchronously
the electric currents sum up and electric potentials and electromagnetic fields become
detectable by EEG and MEG, respectively, outside the head.
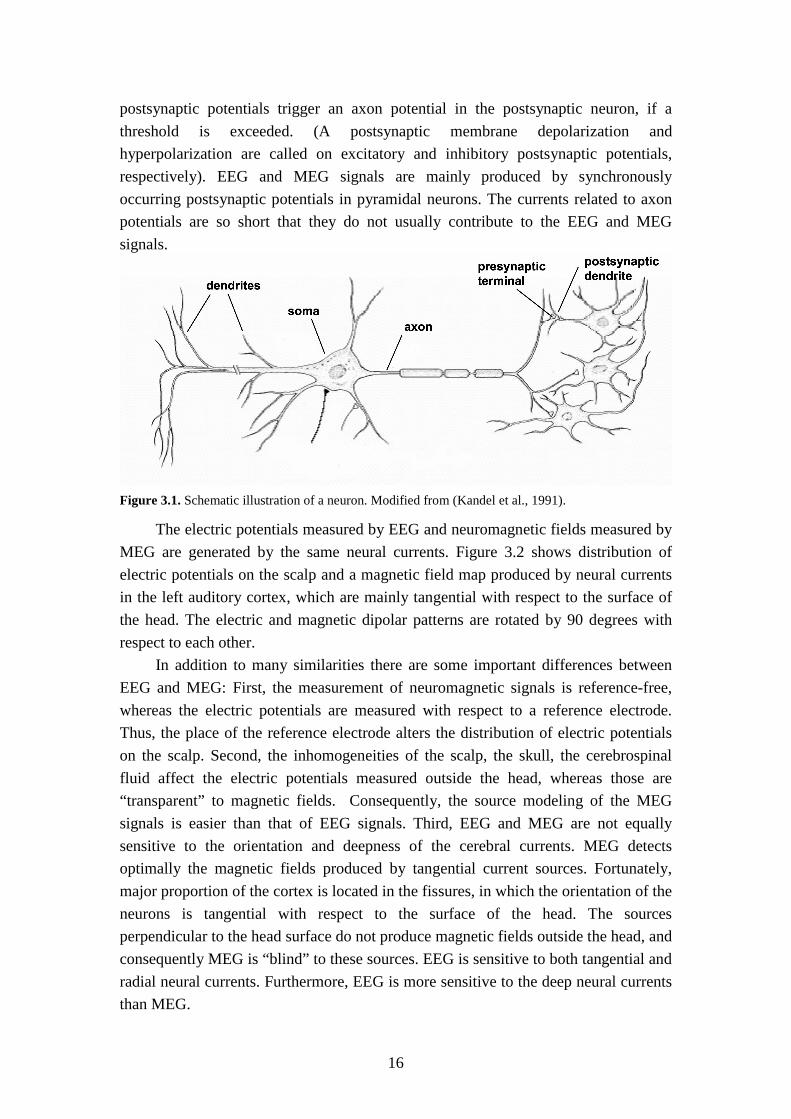
Figure 3.1 depicts a pyramidal neuron which is a typical neuron in the cortex. It
consists of a soma, afferent dendrites and an efferent axon. The ion channels and
pumps in the cell membrane change the electrical properties of the neuron (see, e.g.,
Kandel et al., 1991). In the resting state, there are relatively more ions with a negative
charge inside than outside the cell as a result of active work of ion pumps. Due to this
imbalance the potential difference between inside and outside the cell is about –70
mV. The neurons communicate with each other via synapses: (1) An axon potential
arrives to the axon terminal of a presynaptic neuron, (2) the presynaptic neuron
releases transmitter molecules to the synaptic cleft, (3) these transmitters are bound to
receptors located in the dendrites of a postsynaptic neuron, (4) as a consequence the
membrane potential of the postsynaptic neuron changes. (5) Finally, simultaneous
16
postsynaptic potentials trigger an axon potential in the postsynaptic neuron, if a
threshold is exceeded. (A postsynaptic membrane depolarization and
hyperpolarization are called on excitatory and inhibitory postsynaptic potentials,
respectively). EEG and MEG signals are mainly produced by synchronously
occurring postsynaptic potentials in pyramidal neurons. The currents related to axon
potentials are so short that they do not usually contribute to the EEG and MEG
signals.
Figure 3.1. Schematic illustration of a neuron. Modified from (Kandel et al., 1991).
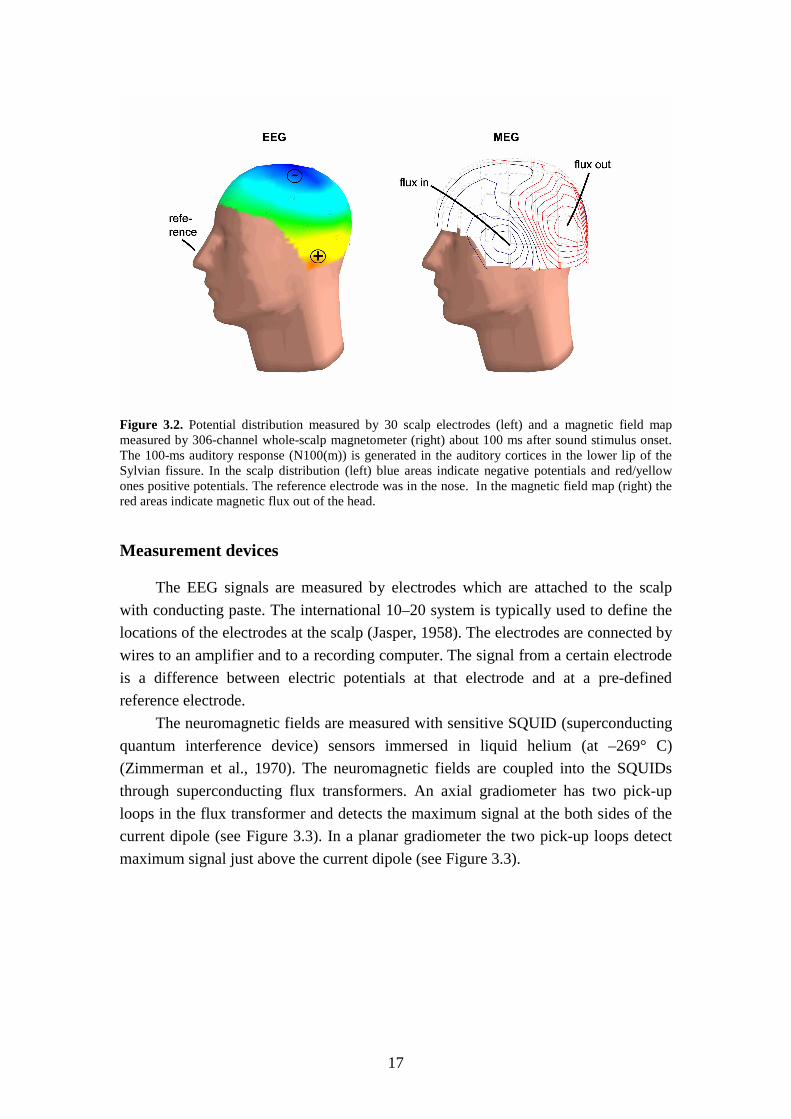
The electric potentials measured by EEG and neuromagnetic fields measured by
MEG are generated by the same neural currents. Figure 3.2 shows distribution of
electric potentials on the scalp and a magnetic field map produced by neural currents
in the left auditory cortex, which are mainly tangential with respect to the surface of
the head. The electric and magnetic dipolar patterns are rotated by 90 degrees with
respect to each other.
In addition to many similarities there are some important differences between
EEG and MEG: First, the measurement of neuromagnetic signals is reference-free,
whereas the electric potentials are measured with respect to a reference electrode.
Thus, the place of the reference electrode alters the distribution of electric potentials
on the scalp. Second, the inhomogeneities of the scalp, the skull, the cerebrospinal
fluid affect the electric potentials measured outside the head, whereas those are
“transparent” to magnetic fields. Consequently, the source modeling of the MEG
signals is easier than that of EEG signals. Third, EEG and MEG are not equally
sensitive to the orientation and deepness of the cerebral currents. MEG detects
optimally the magnetic fields produced by tangential current sources. Fortunately,
major proportion of the cortex is located in the fissures, in which the orientation of the
neurons is tangential with respect to the surface of the head. The sources
perpendicular to the head surface do not produce magnetic fields outside the head, and
consequently MEG is “blind” to these sources. EEG is sensitive to both tangential and
radial neural currents. Furthermore, EEG is more sensitive to the deep neural currents
than MEG.
17
Figure 3.2. Potential distribution measured by 30 scalp electrodes (left) and a magnetic field map measured by 306-channel whole-scalp magnetometer (right) about 100 ms after sound stimulus onset. The 100-ms auditory response (N100(m)) is generated in the auditory cortices in the lower lip of the Sylvian fissure. In the scalp distribution (left) blue areas indicate negative potentials and red/yellow ones positive potentials. The reference electrode was in the nose. In the magnetic field map (right) the red areas indicate magnetic flux out of the head.
Measurement devices
The EEG signals are measured by electrodes which are attached to the scalp
with conducting paste. The international 10–20 system is typically used to define the
locations of the electrodes at the scalp (Jasper, 1958). The electrodes are connected by
wires to an amplifier and to a recording computer. The signal from a certain electrode
is a difference between electric potentials at that electrode and at a pre-defined
reference electrode.
The neuromagnetic fields are measured with sensitive SQUID (superconducting
quantum interference device) sensors immersed in liquid helium (at –269° C)
(Zimmerman et al., 1970). The neuromagnetic fields are coupled into the SQUIDs
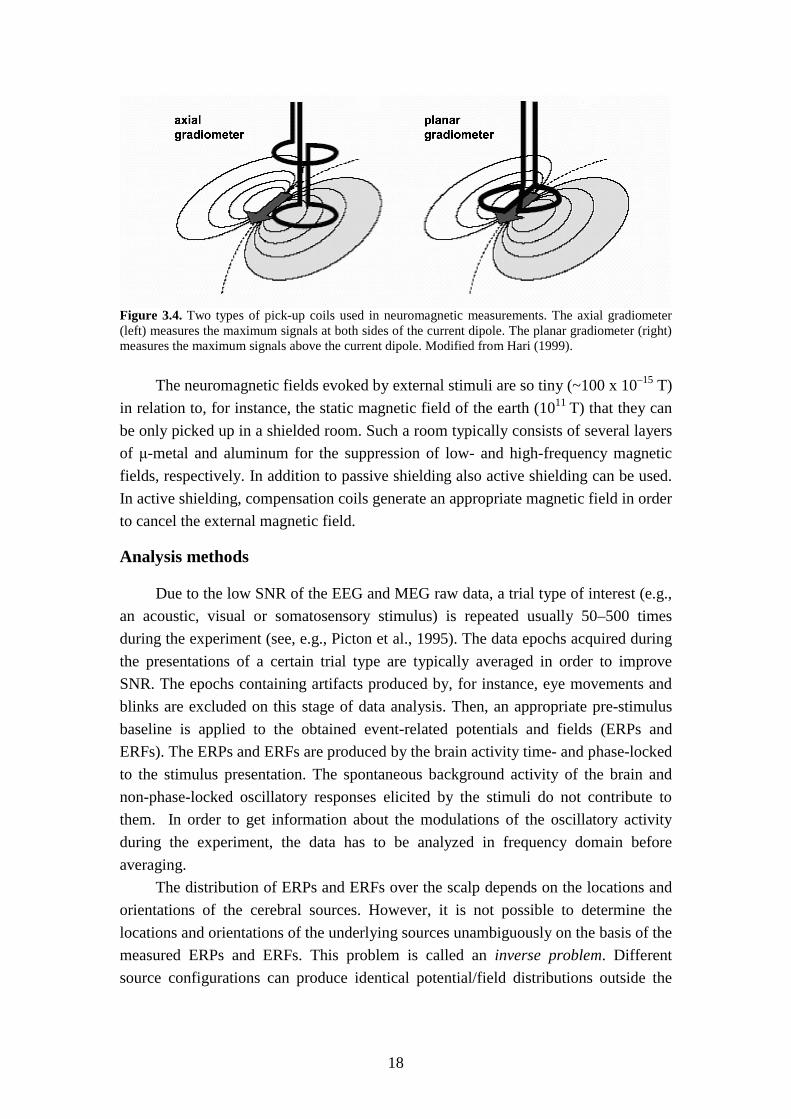
through superconducting flux transformers. An axial gradiometer has two pick-up
loops in the flux transformer and detects the maximum signal at the both sides of the
current dipole (see Figure 3.3). In a planar gradiometer the two pick-up loops detect
maximum signal just above the current dipole (see Figure 3.3).
18
Figure 3.4. Two types of pick-up coils used in neuromagnetic measurements. The axial gradiometer (left) measures the maximum signals at both sides of the current dipole. The planar gradiometer (right) measures the maximum signals above the current dipole. Modified from Hari (1999).
The neuromagnetic fields evoked by external stimuli are so tiny (~100 x 10–15 T)
in relation to, for instance, the static magnetic field of the earth (1011 T) that they can
be only picked up in a shielded room. Such a room typically consists of several layers
of µ-metal and aluminum for the suppression of low- and high-frequency magnetic
fields, respectively. In addition to passive shielding also active shielding can be used.
In active shielding, compensation coils generate an appropriate magnetic field in order
to cancel the external magnetic field.
Analysis methods
Due to the low SNR of the EEG and MEG raw data, a trial type of interest (e.g.,
an acoustic, visual or somatosensory stimulus) is repeated usually 50–500 times
during the experiment (see, e.g., Picton et al., 1995). The data epochs acquired during
the presentations of a certain trial type are typically averaged in order to improve
SNR. The epochs containing artifacts produced by, for instance, eye movements and
blinks are excluded on this stage of data analysis. Then, an appropriate pre-stimulus
baseline is applied to the obtained event-related potentials and fields (ERPs and
ERFs). The ERPs and ERFs are produced by the brain activity time- and phase-locked
to the stimulus presentation. The spontaneous background activity of the brain and
non-phase-locked oscillatory responses elicited by the stimuli do not contribute to
them. In order to get information about the modulations of the oscillatory activity
during the experiment, the data has to be analyzed in frequency domain before
averaging.
The distribution of ERPs and ERFs over the scalp depends on the locations and
orientations of the cerebral sources. However, it is not possible to determine the
locations and orientations of the underlying sources unambiguously on the basis of the
measured ERPs and ERFs. This problem is called an inverse problem. Different
source configurations can produce identical potential/field distributions outside the
19
head. Due to the non-uniqueness of the inverse model sophisticated source modeling
techniques have to be used in order to find the most probable source configuration.
The most common way to characterize local current sources is to model them
with equivalent current dipoles (ECDs) having location, orientation and strength
(Hämäläinen et al. 1993). An ECD can be found by minimizing the difference
between the calculated and measured magnetic fields, e.g., by using a least-squares
search (Kaukoranta et al., 1986). An alternative way to estimate the current sources is
to calculate the most likely current distribution which explains the measured data
(e.g., minimum norm estimates, Hämäläinen and Ilmoniemi, 1994). Minimum current
estimate (MCE) is an implementation of the L1-norm estimate (Matsuura and Okabe,
1995) that explains the measured data with a current distribution that has the smallest
sum of current amplitudes (Uutela et al., 1999). Calculation of MCEs does not require
a piori assumptions about the source configuration. In order to determine the exact
anatomical locations of the sources (estimated by either method), they are typically
superimposed to MR images and/or their coordinates are transformed to Talairach
coordinates (Talairach and Tournoux, 1988).
The source modeling of the EEG data is more inaccurate and laborious than that
of MEG data due to the effect of different head structures on electric potentials
measured outside the head. In practice, source modeling of EEG data requires an
accurate volume conductor model of the subject’s head including layers for brain,
skull and scalp. Source modeling of the MEG data can also benefit from a conductor
model with a realistic shape (Tarkiainen et al., 2003). However, since MEG data are
not affected by different head structures, a simple spherical model is often accurate
enough.
Functional magnetic resonance imaging (fMRI)
Blood oxygenation level dependent (BOLD)
MRI is a technique for creating pictures with high spatial resolution of the brain
or other parts of the body. Thus, it enables non-invasive study of the anatomy of the
living brain. Furthermore, specific MR images, such as T2*-weighted images, are also
sensitive to blood flow and blood oxygenation level enabling indirect study of
functioning of the brain. This is based on the assumption that the haemodynamic
changes in the brain are coupled with the changes in neural activity (see, e.g.,
Logothetis et al., 2001).
The main method to measure haemodynamic changes in the brain by means of
fMRI is to detect Blood Oxygenation Level Dependent (BOLD) effects (Ogawa et al.,
1993). The increased synaptic activity within a specific brain region leads to increased
oxygen consumption and to increased flow of oxygenated blood into this region.

20
Consequently, the relative amount of deoxygenated haemoglobin decreases within
this region, because the increase in total oxygen delivery exceeds the increase in
oxygen consumption. Since deoxygenated haemoglobin is paramagnetic, the change
in the blood oxygenation leads to the change in the local distortion of a magnetic
field. This change of distortion can be seen as a local intensity increase in BOLD
images. BOLD signal changes in typical tissue voxels (3 x 3 x 3 mm) are about 0.5–3
percents at 1.5 T. A BOLD response elicited by, e.g., an auditory stimulus reaches its
peak 5–7 seconds after the stimulus onset and returns to baseline after 10–12 seconds
(Hall et al., 2000).
Measurement devices
The MRI system contains the magnet, the gradient coil and the radiofrequency
coil. The magnet creates a strong (typically 1.5 or 3 T) and homogeneous magnetic
field, which affects the orientation of the nuclei of the hydrogen atoms with a nuclear
spin in the subject’s body. The spins having a high-energy state are oriented against
the applied field, whereas the spins having a low-energy state are oriented parallel to
the applied field. A transition from a high-energy state to a low-energy state emits
energy in the radiofrequency range, whereas a transition to an opposite direction
requires energy. The gradient coils produce variations in the main magnetic field,
which permit, e.g., localization of image slices. The radiofrequency coil is used to
generate the oscillating magnetic field (i.e., a radiofrequency pulse), which causes
transitions between the energy states of the spins. The same or different coil is used to
receive the echo signal emitted by the spins returning to the low-energy state after a
radiofrequency pulse.
The relaxation behaviour of the spins depends on their local environment. For
example, T1 recovery time (i.e., longitudinal magnetization recovery time) is longer
for the hydrogen nuclei of a water molecule in the tissue than for one in the
cerebrospinal fluid. T2* relaxation time (i.e., transverse decay time constant) is
particularly important for fMRI, because it is sensitive to the local field
inhomogeneities produced, e.g., by deoxygenated haemoglobin. The parameters (the
flip angle, time to echo (TE) and time for repetition (TR)) of a pulse sequence
determine how the spins are excited. The different pulse sequences are used to
generate MR images of different contrasts. BOLD contrasts are typically imaged by
using fast sequences, which are optimized to measure T2* relaxation time. High-
resolution anatomical images are typically T1-weigthed images.
Analysis methods
fMRI data is a set of serially acquired images, which consists of voxels. Pre-
processing of the data involves typically slice-timing correction, motion correction,
spatial smoothing, intensity normalization and temporal filtering (see, e.g., Jezzard et
21
al., 2001 for details). The purpose of these pre-processing steps is to reduce artifacts
in the data and to prepare it for statistical analysis.
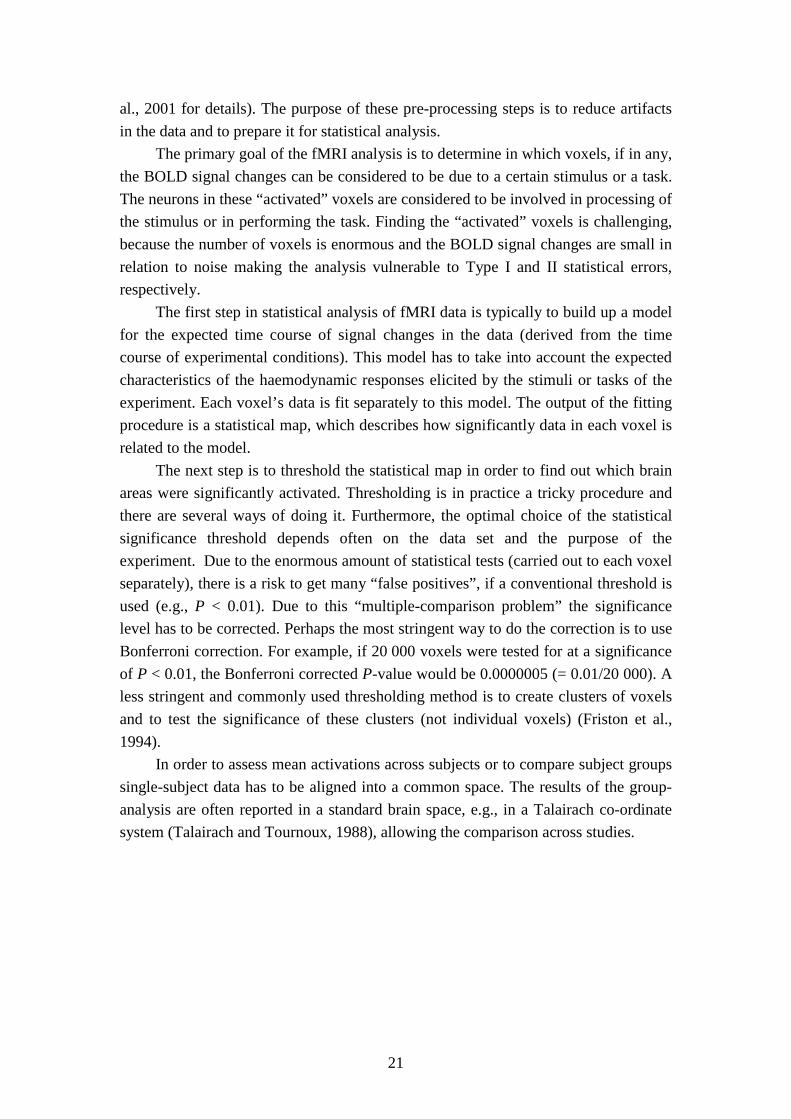
The primary goal of the fMRI analysis is to determine in which voxels, if in any,
the BOLD signal changes can be considered to be due to a certain stimulus or a task.
The neurons in these “activated” voxels are considered to be involved in processing of
the stimulus or in performing the task. Finding the “activated” voxels is challenging,
because the number of voxels is enormous and the BOLD signal changes are small in
relation to noise making the analysis vulnerable to Type I and II statistical errors,
respectively.
The first step in statistical analysis of fMRI data is typically to build up a model
for the expected time course of signal changes in the data (derived from the time
course of experimental conditions). This model has to take into account the expected
characteristics of the haemodynamic responses elicited by the stimuli or tasks of the
experiment. Each voxel’s data is fit separately to this model. The output of the fitting
procedure is a statistical map, which describes how significantly data in each voxel is
related to the model.
The next step is to threshold the statistical map in order to find out which brain
areas were significantly activated. Thresholding is in practice a tricky procedure and
there are several ways of doing it. Furthermore, the optimal choice of the statistical
significance threshold depends often on the data set and the purpose of the
experiment. Due to the enormous amount of statistical tests (carried out to each voxel
separately), there is a risk to get many “false positives”, if a conventional threshold is
used (e.g., P < 0.01). Due to this “multiple-comparison problem” the significance
level has to be corrected. Perhaps the most stringent way to do the correction is to use
Bonferroni correction. For example, if 20 000 voxels were tested for at a significance
of P < 0.01, the Bonferroni corrected P-value would be 0.0000005 (= 0.01/20 000). A
less stringent and commonly used thresholding method is to create clusters of voxels
and to test the significance of these clusters (not individual voxels) (Friston et al.,
1994).
In order to assess mean activations across subjects or to compare subject groups
single-subject data has to be aligned into a common space. The results of the group-
analysis are often reported in a standard brain space, e.g., in a Talairach co-ordinate
system (Talairach and Tournoux, 1988), allowing the comparison across studies.

22
Chapter 3: Aims of the study
The aim of this thesis was to investigate neural mechanisms of seeing (Studies I
& IV) and hearing (Studies IV & V) speech as well as interactions between heard and
seen speech signals (Studies I–III) by using EEG, MEG and fMRI. The specific aims
of Studies I–V were following:
Study I aimed at finding out whether change detection mechanisms in the
auditory cortex distinguish between different visual speech stimuli presented without
acoustic stimuli or whether interaction with acoustic speech stimuli is necessary for
the detection of visual change in the auditory cortex.
Study II investigated the time courses of non-phonetic and phonetic interactions
between acoustic and visual speech signals.
Study III investigated timing of audiovisual interactions in the auditory and
multisensory cortices.
Study IV addressed the question whether the primary somatosensory cortex (SI)
is involved in processing of acoustic and visual speech.
Study V aimed at finding out whether there are such speech-specific regions in
the human brain which are responsible for speech perception irrespective of acoustic
features of the speech stimulus.

23
Chapter 4: Experiments
This chapter presents the methods and results of Studies I–V. Furthermore, the
main findings are briefly discussed; more detailed discussion of the findings can be
found in Chapter 5. The first section presents the methodological issues related all
studies. Then, the following sections focus on each study separately.
Summary of methods
Subjects
In all studies, subjects were healthy and they had normal hearing and vision (self
reported). In studies I–IV, all subjects were native speakers of Finnish; in the Study V
subjects were native speakers of English. All subjects gave their informed consent
(either oral or written) to participate in the experiments. The principles of Helsinki
Declaration were followed.
Stimuli
Speech stimulus material (see Table 1.) for studies I, II, V was recorded in a
sound attenuated chamber with a professional video camera. Sound (Praat, Sound
Forge) and video editing programs (Purple) were used to create appropriate stimulus
files from the recorded material. The acoustic speech stimuli (.wav files) and visual
speech stimuli (a sequence of bitmap files, 25 Hz) were presented with Presentation
software. In study III synthetic acoustic, visual and audiovisual speech stimuli were
produced by a Finnish talking head (Olivès et al., 1999; Möttönen et al., 2000). The
acoustic stimuli were presented binaurally through headphones in Studies I, III and V,
and through loudspeakers in Study II. An articulating face was presented on a
computer monitor (Study II) or it was projected to the measurement room with a data
projector (Studies I, III, V). In Study IV, an experiment was sitting in front of the
subjects and read a book either aloud (acoustic speech) or articulating silently (visual
speech).
In the lip experiment of Study IV, the lower lip was stimulated once every 1.5
s simultaneously with two balloon diaphragms driven by compressed air (Mertens and
Lütkenhöner, 2000). The pressure of the 170-ms pulses, kept equal for all subjects,
produced a sensation of brief touch. In the hand experiment of Study IV, the left and
right median nerves were stimulated alternatingly at the wrists once every 1.5 s with
current pulses (5–10 mA) that exceeded the motor threshold.

24
Table. 1.
Study Subjects Stimuli Conditions/ Tasks
Method
I n = 7* three females, one left-handed, 21–47 years
Audiovisual experiment: acoustic /ipi/ & visual /ipi/ (85%), acoustic /iti/ & visual /iti/ (5%), acoustic /ipi/ & visual /iti/ (5%), acoustic /ivi/ & visual /ivi/ (5%) Visual experiment: visual /ipi/ (85%) visual /iti/ (10%) visual /ivi/ (5%) Stimulus lengths: 580–590 ms (acoustic), 900 ms (visual) ISIs: 1600 ms
Task: To count targets (/ivi/)
MEG; 306-channels
II n = 11 three females, right-handed, 21–27 years
Acoustic: /a/, /i/, /o/, /y/ Visual: /a/, /i/, /o/, /y/ Audiovisual: congruent (e.g. acoustic /a/ & visual /a/), incongruent (e.g. acoustic /a/ & visual /y/) Stimulus lengths: 439–444 ms (acoustic), 780 ms (visual) ISI: 1700–2800 ms
Task: To press a button when the stimulus type changes
EEG; 32-channels
III n = 8 two females, one left-handed, 21–31 years
Acoustic: /pa/ Visual: /pa/ Audiovisual: /pa/ Stimulus lengths: 250 ms (acoustic), 600 ms (visual) ISI: 1640–2570 ms
MEG; 306-channels
IV Lip exp: n = 8**, one female, right-handed, 23–30 years Hand exp: n = 8, one female, right-handed 22–26 years
Lip experiment: Tactile lip stimuli (170 ms) Hand experiment: Electric median nerve stimuli (0.2 ms) ISI: 1500 ms
Conditions: Rest, Viewing speech, Listening to speech, Mouth movement execution
MEG; 306-channels
V n = 21, 9 females, right-handed, 18–36 years
Acoustic: Sine wave speech (SWS) replicas of /omso/ & /onso/, control sound Audiovisual: SWS /omso/ & visual /onso/ Stimulus lengths: 640 ms (acoustic), 700 ms (visual) ISI: 12–16 s
Conditions: Pre speech training, Post speech training Task: To categorize acoustic stimuli
fMRI; 3T
* Altogether 10 subjects participated in the audiovisual experiment. Data from two subjects were excluded from MEG data analysis because of the absence of the McGurk effect, and those of one subject because of extensive artefacts in the recordings. These subjects did not participate in the visual experiment.
** Three subjects participated in both lip and hand experiments.

25
Data acquisition
MEG data (Studies I, III and IV) were recorded with a 306-channel whole-scalp
neuromagnetometer (Neuromag Vectorview, Helsinki Finland) at Low Temperature
Laboratory, Helsinki University of Technology. Each of the 102 sensor elements of
the device comprises two orthogonal planar gradiometers and one magnetometer. The
device was placed in a magnetically shielded room with two aluminium and µ-metal
layers and active noise compensation. Before the experiment, the positions of four
marker coils, placed on the scalp, were determined in relation to three anatomical
landmark points (the nasion and both preauricular points) with an Isotrak 3D-digitizer.
This procedure allowed alignment of the MEG and MRI coordinate systems.
Anatomical T1-weighted MRIs of subjects’ brains were obtained with a 1.5 T scanner
(Siemens, Erlangen, Germany) at the Department of Radiology, Helsinki University
Central Hospital. (The MRIs were acquired from all subjects participating in Studies
I&III, and from 8 out of 13 subjects participating in Study IV.)
The MEG signals were bandpass filtered at 0.1–172 Hz (0.06–100 Hz in Study
I) and digitized at 600 Hz (300 Hz in Study I). Vertical and horizontal electro-
oculograms (EOGs) were monitored to reject all MEG epochs coinciding with blinks
and excessive eye movements. At minimum 100 artefact-free epochs were acquired to
each stimulus type in all studies. The data were averaged across epochs either online
or offline. Then, appropriate high- and low-pass filters were applied to the obtained
ERFs and a pre-stimulus baseline was set.
EEG data (Study II) were collected with in an electrically and acoustically
shielded room at Laboratory of Computational Engineering, Helsinki University of
Technology. EEG was recorded with a cap from 30 silver/silver chloride electrodes
(BrainCap, Brain Products) from the following locations (extended 10–20 system):
Fp1, Fp2, F3, F4, FCz, C3, C4, P3, P4, O1, O2, F7, F8, T7, T8, P7, P8, Fz, Cz, Pz,
FC1, FC2, CP1, CP2, FC5, FC6, CP5, CP6, TP9, TP10. Reference electrode was at a
tip of the nose. The signals were bandpass filtered at 0.016–100 Hz and digitized at
250 Hz. The impedance of the electrodes was below 5 kΩ. Eye movements were
monitored with two EOG electrodes. Epochs with EEG or EOG with a large (> 60 V)
amplitude were automatically rejected. The artefact-free epochs were filtered at 1–25
Hz, baseline corrected and averaged.
fMRI data (Study V) were acquired on a 3.0 T MRI system with a multislice
gradient-echo echo planar imaging sequence (TR = 3000 ms; TE = 28 ms, flip angle =
90°, field of view = 256 mm2, matrix = 64 x 64) at the Oxford FMRIB Center.
Twenty-four 5-mm-thick axial slices covering the whole brain were acquired over the
15-min scans. The sparse-sampled sequence with silent periods of 11 s was used to
minimize contamination due to auditory responses to scanner noise (Hall et al., 1999;
Hall et al., 2000). The 3-s volume acquisition (mid-point) followed the onset of the
acoustic stimulus by 5, 6 or 7 s (see Fig. 1), where the peak of the haemodynamic

26
response was assumed to be based on previous studies (Hickok et al., 1997; Belin et
al., 1999; Hall et al., 2000). After the functional image acquisition a T1-weighted
volume was acquired from each subject to aid in anatomical definition and co-
registration (TR = 20 ms, TE = 5 ms, TI = 500 ms, flip angle = 15°, field of view =
256 x 192).
Source analysis in MEG studies
Sources of mismatch responses in Study I, auditory responses in Study III and
somatosensory responses in Study IV were modelled as single ECDs, best describing
the most dominant cerebral currents during the strongest dipolar field patterns. ECDs
were identified by a least-squares search using a subset of sensors over the area of the
maximum signal. The 3-D locations, orientations, and strengths of the ECDs were
obtained in a spherical head model, based on the subject’s individual MR images (if
MR images were not available, a “standard” head model was used). The validity of
the single-dipole model was evaluated by computing the goodness of fit (Hämäläinen
et al., 1993).
In Studies III and IV the analysis was thereafter extended to cover the entire
time period and all channels were included in computing a time-varying (multi)dipole
model. The locations of the dipoles were kept fixed, but their strengths were allowed
to change as a function of time.
In study III, the two-dipole model found on the basis of bilateral auditory-cortex
responses to acoustic syllables was applied for the analysis of the same subject’s
audiovisual responses and “predicted” responses (i.e., sum of responses to unimodal
stimuli). Then, the individual source waveforms were averaged across subjects. The
grand average source waveforms served to define time windows within which the
audiovisual and “predicted” source strengths differed from each other. The statistical
significances of the differences between audiovisual and “predicted” source strengths
were tested by Wilcoxon matched pairs tests
In Study IV, the dipole model found on the basis of SI responses recorded in the
rest condition was applied for the analysis of the same subject’s all responses
(acquired during speech viewing and listening and execution of mouth movements).
Finally, the peak latencies and amplitudes of SI responses were measured from the
source waveforms in all conditions. Statistical significances of changes (relative to the
rest condition) of the SI source strengths were tested with Student’s paired, two-tailed
t tests.
In Study III, MCEs were calculated to estimate the sources of difference
signals (audiovisual – “predicted”) (Uutela et al., 1999). The procedure was as
follows: (1) Estimates of individual signals were calculated for each time point. (2)
The individual estimates were aligned on a standard brain (Roland and Zilles, 1996).
The alignment applies first a 12-parameter affine transformation (Woods et al., 1998),

27
followed by a refinement with an elastic non-linear transformation (Schormann et al.,
1996). The match is based on the comparison of grey-scale values of the individual
and the standard brain MR images. As a result, major sulci and other important brain
structures are aligned. (3) Aligned estimates were averaged across subjects. (4) The
regions of interests (ROIs) were selected from grand average estimates to cover the
most active areas. The centre and extent of each ROI was automatically adjusted to fit
the estimated activity. (5) The activity within a selected ROI was calculated for
audiovisual and “predicted” grand average estimates as a function of time and the
time windows during which the strengths of activities differed were defined. (6) The
mean strength of activity within the ROI during the selected time window was then
calculated from aligned individual audiovisual and “predicted” estimates. The
strengths of audiovisual and “predicted” activities were compared to each other
statistically by Wilcoxon matched pairs tests. (7) For the determination of cortical
interaction areas, the centre points of selected ROIs were superimposed on the MRI of
the standard brain (to which the individual estimates were aligned before averaging).
The source coordinates of the ROI centre points were also transformed to Talairach
coordinates.
Study I: Changes in visual speech modulate activity in the auditory cortices
Introduction and methods
Sams et al. (1991) showed in their MEG study that visual changes in an
audiovisual speech stimulus sequence elicit mismatch responses in the left auditory
cortex. This finding suggests that auditory-cortex change detection mechanisms can
distinguish between visually different (but acoustically identical) audiovisual speech
stimuli, which are heard differently due to the McGurk effect. In the MEG study we
compared the mismatch responses elicited by “real” acoustic changes to those elicited
by “illusory” auditory changes (due to the McGurk effect). Moreover, we investigated
whether changes in visual speech stimuli elicit mismatch responses when they are
presented without acoustic stimuli or whether integration with acoustic stimuli is
needed.
In the audiovisual experiment, the stimulus sequence included infrequent
congruent (acoustically and visually deviant) and incongruent (only visually deviant)
audiovisual stimuli, which are typically heard to be phonetically deviant from the
frequent stimuli by subjects who experience a McGurk effect (see Figure 4.1). In the
visual experiment, the same visual stimuli were presented without acoustic stimuli
(see Figure 4.1).
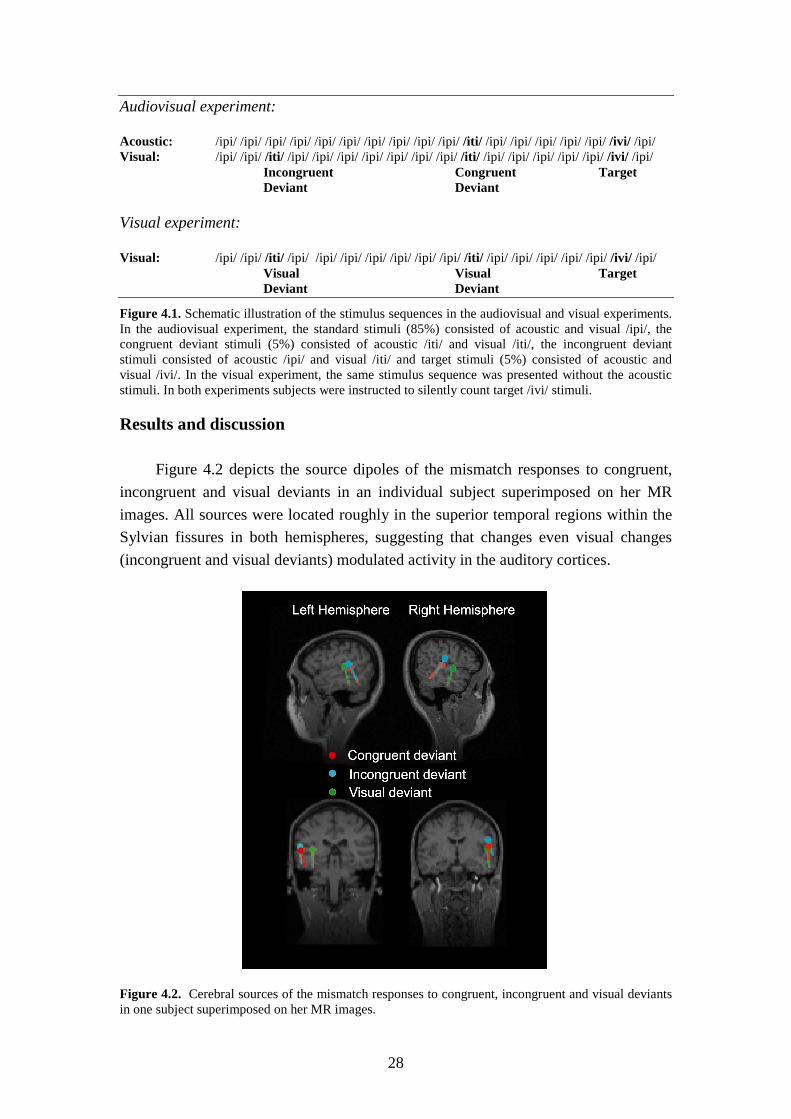
28
Audiovisual experiment: Acoustic: /ipi/ /ipi/ /ipi/ /ipi/ /ipi/ /ipi/ /ipi/ /ipi/ /ipi/ /ipi/ /iti/ /ipi/ /ipi/ /ipi/ /ipi/ /ipi/ /ivi/ /ipi/ Visual: /ipi/ /ipi/ /iti/ /ipi/ /ipi/ /ipi/ /ipi/ /ipi/ /ipi/ /ipi/ /iti/ /ipi/ /ipi/ /ipi/ /ipi/ /ipi/ /ivi/ /ipi/ Incongruent Congruent Target Deviant Deviant Visual experiment: Visual: /ipi/ /ipi/ /iti/ /ipi/ /ipi/ /ipi/ /ipi/ /ipi/ /ipi/ /ipi/ /iti/ /ipi/ /ipi/ /ipi/ /ipi/ /ipi/ /ivi/ /ipi/ Visual Visual Target Deviant Deviant
Figure 4.1. Schematic illustration of the stimulus sequences in the audiovisual and visual experiments. In the audiovisual experiment, the standard stimuli (85%) consisted of acoustic and visual /ipi/, the congruent deviant stimuli (5%) consisted of acoustic /iti/ and visual /iti/, the incongruent deviant stimuli consisted of acoustic /ipi/ and visual /iti/ and target stimuli (5%) consisted of acoustic and visual /ivi/. In the visual experiment, the same stimulus sequence was presented without the acoustic stimuli. In both experiments subjects were instructed to silently count target /ivi/ stimuli.
Results and discussion
Figure 4.2 depicts the source dipoles of the mismatch responses to congruent,
incongruent and visual deviants in an individual subject superimposed on her MR
images. All sources were located roughly in the superior temporal regions within the
Sylvian fissures in both hemispheres, suggesting that changes even visual changes
(incongruent and visual deviants) modulated activity in the auditory cortices.
Figure 4.2. Cerebral sources of the mismatch responses to congruent, incongruent and visual deviants in one subject superimposed on her MR images.
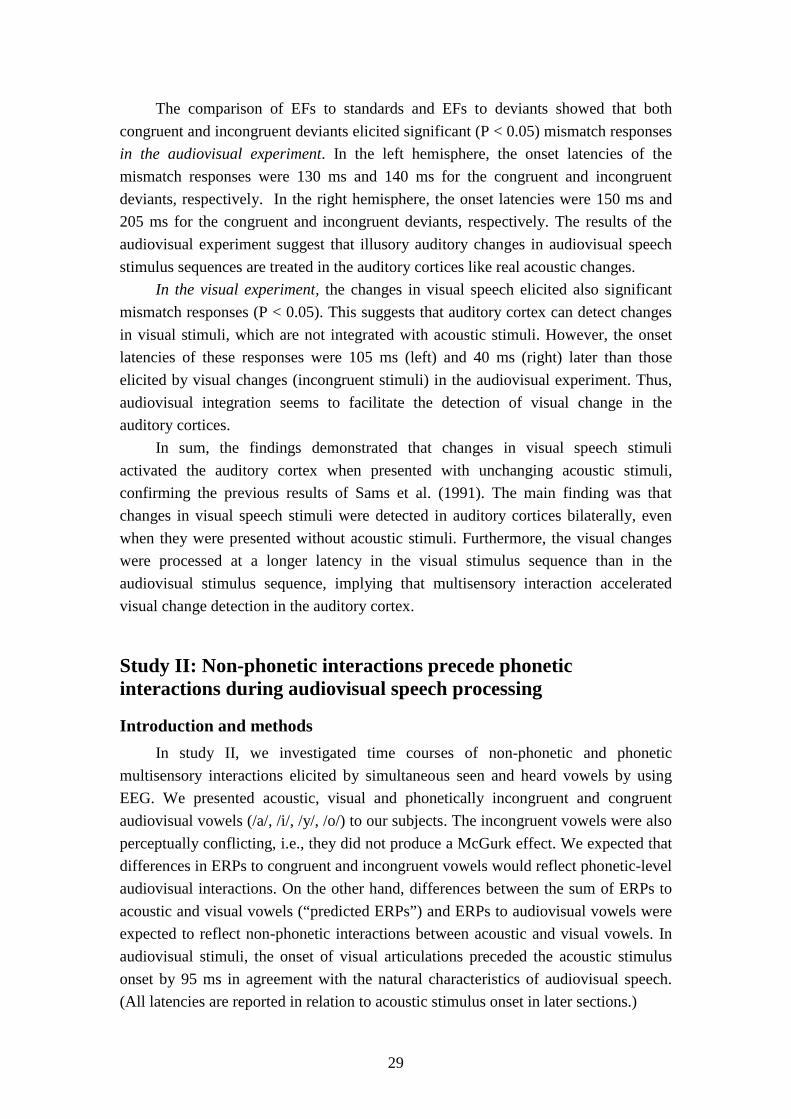
29
The comparison of EFs to standards and EFs to deviants showed that both
congruent and incongruent deviants elicited significant (P < 0.05) mismatch responses
in the audiovisual experiment. In the left hemisphere, the onset latencies of the
mismatch responses were 130 ms and 140 ms for the congruent and incongruent
deviants, respectively. In the right hemisphere, the onset latencies were 150 ms and
205 ms for the congruent and incongruent deviants, respectively. The results of the
audiovisual experiment suggest that illusory auditory changes in audiovisual speech
stimulus sequences are treated in the auditory cortices like real acoustic changes.
In the visual experiment, the changes in visual speech elicited also significant
mismatch responses (P < 0.05). This suggests that auditory cortex can detect changes
in visual stimuli, which are not integrated with acoustic stimuli. However, the onset
latencies of these responses were 105 ms (left) and 40 ms (right) later than those
elicited by visual changes (incongruent stimuli) in the audiovisual experiment. Thus,
audiovisual integration seems to facilitate the detection of visual change in the
auditory cortices.
In sum, the findings demonstrated that changes in visual speech stimuli
activated the auditory cortex when presented with unchanging acoustic stimuli,
confirming the previous results of Sams et al. (1991). The main finding was that
changes in visual speech stimuli were detected in auditory cortices bilaterally, even
when they were presented without acoustic stimuli. Furthermore, the visual changes
were processed at a longer latency in the visual stimulus sequence than in the
audiovisual stimulus sequence, implying that multisensory interaction accelerated
visual change detection in the auditory cortex.
Study II: Non-phonetic interactions precede phonetic interactions during audiovisual speech processing
Introduction and methods
In study II, we investigated time courses of non-phonetic and phonetic
multisensory interactions elicited by simultaneous seen and heard vowels by using
EEG. We presented acoustic, visual and phonetically incongruent and congruent
audiovisual vowels (/a/, /i/, /y/, /o/) to our subjects. The incongruent vowels were also
perceptually conflicting, i.e., they did not produce a McGurk effect. We expected that
differences in ERPs to congruent and incongruent vowels would reflect phonetic-level
audiovisual interactions. On the other hand, differences between the sum of ERPs to
acoustic and visual vowels (“predicted ERPs”) and ERPs to audiovisual vowels were
expected to reflect non-phonetic interactions between acoustic and visual vowels. In
audiovisual stimuli, the onset of visual articulations preceded the acoustic stimulus
onset by 95 ms in agreement with the natural characteristics of audiovisual speech.
(All latencies are reported in relation to acoustic stimulus onset in later sections.)
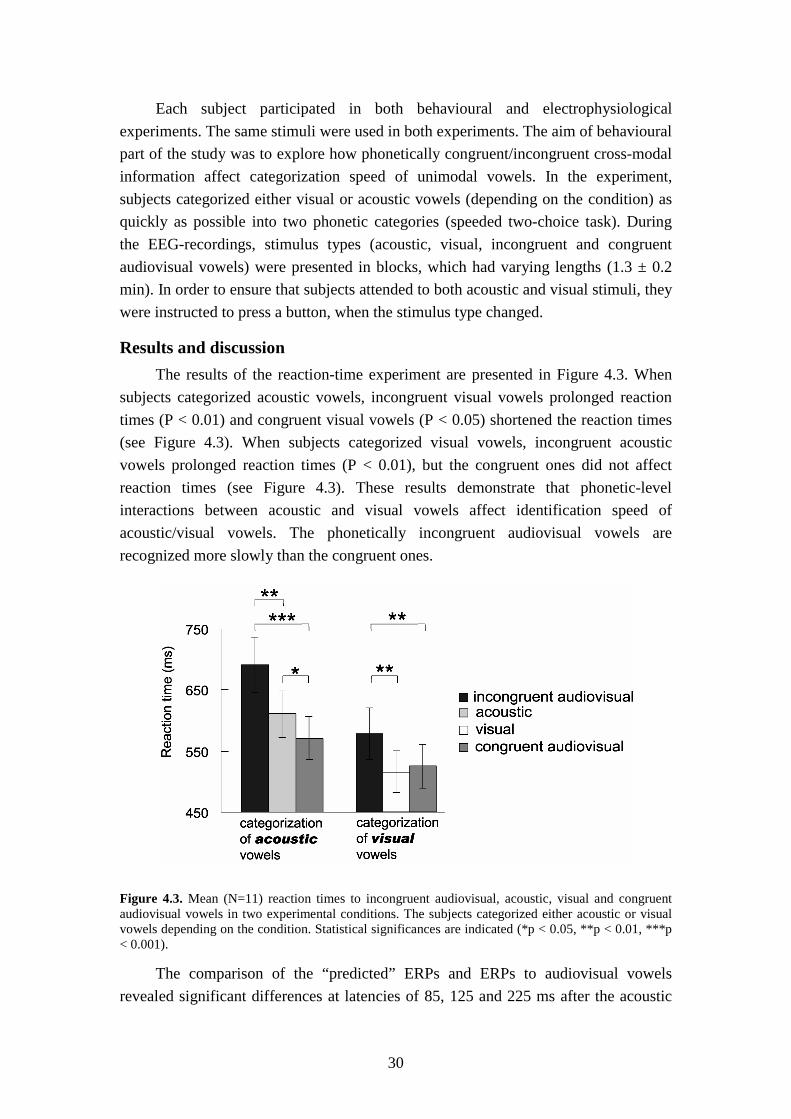
30
Each subject participated in both behavioural and electrophysiological
experiments. The same stimuli were used in both experiments. The aim of behavioural
part of the study was to explore how phonetically congruent/incongruent cross-modal
information affect categorization speed of unimodal vowels. In the experiment,
subjects categorized either visual or acoustic vowels (depending on the condition) as
quickly as possible into two phonetic categories (speeded two-choice task). During
the EEG-recordings, stimulus types (acoustic, visual, incongruent and congruent
audiovisual vowels) were presented in blocks, which had varying lengths (1.3 ± 0.2
min). In order to ensure that subjects attended to both acoustic and visual stimuli, they
were instructed to press a button, when the stimulus type changed.
Results and discussion
The results of the reaction-time experiment are presented in Figure 4.3. When
subjects categorized acoustic vowels, incongruent visual vowels prolonged reaction
times (P < 0.01) and congruent visual vowels (P < 0.05) shortened the reaction times
(see Figure 4.3). When subjects categorized visual vowels, incongruent acoustic
vowels prolonged reaction times (P < 0.01), but the congruent ones did not affect
reaction times (see Figure 4.3). These results demonstrate that phonetic-level
interactions between acoustic and visual vowels affect identification speed of
acoustic/visual vowels. The phonetically incongruent audiovisual vowels are
recognized more slowly than the congruent ones.
Figure 4.3. Mean (N=11) reaction times to incongruent audiovisual, acoustic, visual and congruent audiovisual vowels in two experimental conditions. The subjects categorized either acoustic or visual vowels depending on the condition. Statistical significances are indicated (*p < 0.05, **p < 0.01, ***p < 0.001).
The comparison of the “predicted” ERPs and ERPs to audiovisual vowels
revealed significant differences at latencies of 85, 125 and 225 ms after the acoustic

31
stimulus onset (see Figure 4.4). The phonetic (in)congruency did not affect the ERPs
to audiovisual stimuli at these latencies. The first two interactions at latencies of 85
ms and 125 ms, which were dominant in electrodes over the right hemisphere,
probably reflect suppression of visual and auditory responses, respectively, in the
right sensory-specific regions. The third interaction at latency of 225 ms probably
reflects modulated activity in the parietal cortex.
Figure 4.4. The left side of the figure shows the grand averaged ERPs to congruent, incongruent audiovisual vowels as well as the predicted ERPs (e.g., the sum of unimodal ERPs) at electrodes showing maximal difference. The vertical bars indicate significant differences between the ERPs to audiovisual vowels and predicted ERPs at three consecutive latencies. The right side of the Figure shows the grand averaged ERPs to incongruent and congruent audiovisual vowels. The vertical bars indicate significant differences between these ERPs at three consecutive latencies at electrodes showing maximal difference. The red circles an the top view of the electrode montage indicate at which electrodes the difference was significant. The enlarged red circle indicates the place of the electrode from which the depicted ERPs were recorded.
The comparison of ERPs to congruent and incongruent audiovisual vowels
revealed significant differences at latencies of 155, 235 and 325 ms after the sound
onset (see Figure 4.4). The first interaction (at 155 ms) was dominant in electrodes
over the left hemisphere and could be explained by modulation of activity in the
multisensory STS. The second and third interactions could be explained by modulated
activity in parieto-occipital and temporal regions.

32
Importantly, the first two non-phonetic interactions, which were probably
generated in the sensory-specific regions, were earlier than the first phonetic
interaction. All phonetic interactions were probably generated in the high-level
multisensory regions. The results suggest that sensory-specific and multisensory
cortices are involved in audiovisual speech processing at separate latencies and that
they are sensitive to different features of audiovisual stimuli.
Study III: Acoustic and visual speech inputs interact in auditory cortices earlier than in a multisensory region
Introduction and methods
In this MEG study we explored timing multisensory interactions in the auditory
and multisensory cortices during audiovisual speech perception. The acoustic, visual
and audiovisual /pa/ syllables were produced by a Finnish talking head (Olives et al.,
1999, Möttönen et al., 2000). The differences between the sum of auditory and visual
responses (“predicted responses”) and audiovisual responses were expected to reflect
multisensory interactions.
A two-dipole model consisting of left and right auditory-cortex dipoles was
used to estimate time-varying strength of auditory-cortex activity for audiovisual and
“predicted” responses. The sources of difference (audiovisual – “predicted”)
responses were estimated by calculating MCEs.
Results and discussion
Auditory-cortex source dipoles were modelled from each subject’s bilateral
neuromagnetic responses peaking 100 ms after acoustic stimulus onset (see Figure
4.5). These dipoles were then used to estimate contribution of auditory-cortex activity
to audiovisual responses and to “predicted” responses. The strengths of auditory-
cortex sources differed 150–200 ms (P < 0.05) after stimulus onset in both
hemispheres for audiovisual responses and “predicted” responses, suggesting that
acoustic and visual syllables interacted at this latency in the auditory cortices.

33
Figure 4.5. Audiovisual interaction in the auditory cortices. A. The current dipoles for N100m responses of subject 8 superimposed on his MRIs. B. Strengths of the current dipoles as a function of time in subject 8 (grey: audiovisual (AV), black: “predicted” (A+V)). C. Mean (N=8) strengths of the current dipoles as a function of time (grey: AV, black: A+V). D. The mean source strengths for A+V, AV and A signals at 150 – 200 ms in the left and right hemispheres.
Due to the low SNR of difference responses (audiovisual responses – predicted
responses), they could not be localized reliably by means of dipole modelling from
each subject’s data. Therefore, MCEs of each subject’s difference responses were
calculated and the MCEs were averaged across subjects. The grand average MCE
showed prominent activity in the right STS region 250–600 ms after stimulus onset
(Figure 4.6). In this region, the strength of activity estimated from audiovisual
responses was weaker than that estimated from “predicted” responses in all eight
subjects (Figure 4.6).
The results suggest that multisensory interactions occur earlier in the auditory
cortices (150–200 ms) than in the right STS region (250–600 ms), which is known to
be a multisensory region. These results are in agreement with the view that acoustic
and visual stimuli would converge initially at a low level of CNS (in the sensory-
specific cortices or in the subcortical structures) and that the high-level regions (such
as STS) would participate in multisensory processing at a later stage. On the other
hand, the results are in disagreement with the view that modulated activity in the
sensory-specific cortices would be caused by preceding interactions in the higher-
level multisensory regions (this view would predict later interactions in the auditory
than multisensory regions).

34
Figure 4.6. Audiovisual interaction in the right Superior Temporal Sulcus (STS). A. Grand average MCE calculated from AV–(A+V) signals at 250–600 ms. ROI was determined on the basis of the right temporal activation (inside the white ellipse). B. Strengths of estimated activity in the right STS at 250 – 600 ms for audiovisual (AV) and “predicted” (A+V) signals in all eight subjects (black diamonds). B. The center point of the right temporal ROI (the red square) superimposed on the standard MRI shows that it is located in the right STS. The black squares indicate the mean source locations of N100 responses.
Study IV: Viewing speech modulates activity in the mouth region of the left primary somatosensory cortex (SI)
Introduction and methods
The motor regions are activated when a subject sees hand or mouth actions or
hears sounds related to these actions (Fadiga et al., 1995; Hari et al., 1998; Fadiga et
al., 2002; Watkins et al., 2003), supporting the view that other person’s action are
simulated during action observation. There is also evidence that primary
somatosensory cortex (SI) would be involved in simulation of other person’s hand
actions. For example, the 30–35-ms somatosensory evoked fields (SEFs), originating
from the SI cortex after median nerve stimuli, are enhanced during viewing of hand
actions (Avikainen et al., 2002; Rossi et al., 2002). Consistently, a recent functional
magnetic resonance imaging (fMRI) study demonstrated that SI cortex is activated
during hand action viewing (Hasson et al., 2004). Such a modulation of SI cortex
could be related to prediction of somatosensory consequences of observed hand
actions from the actor’s perspective (Avikainen et al., 2002; Hari and Nishitani,
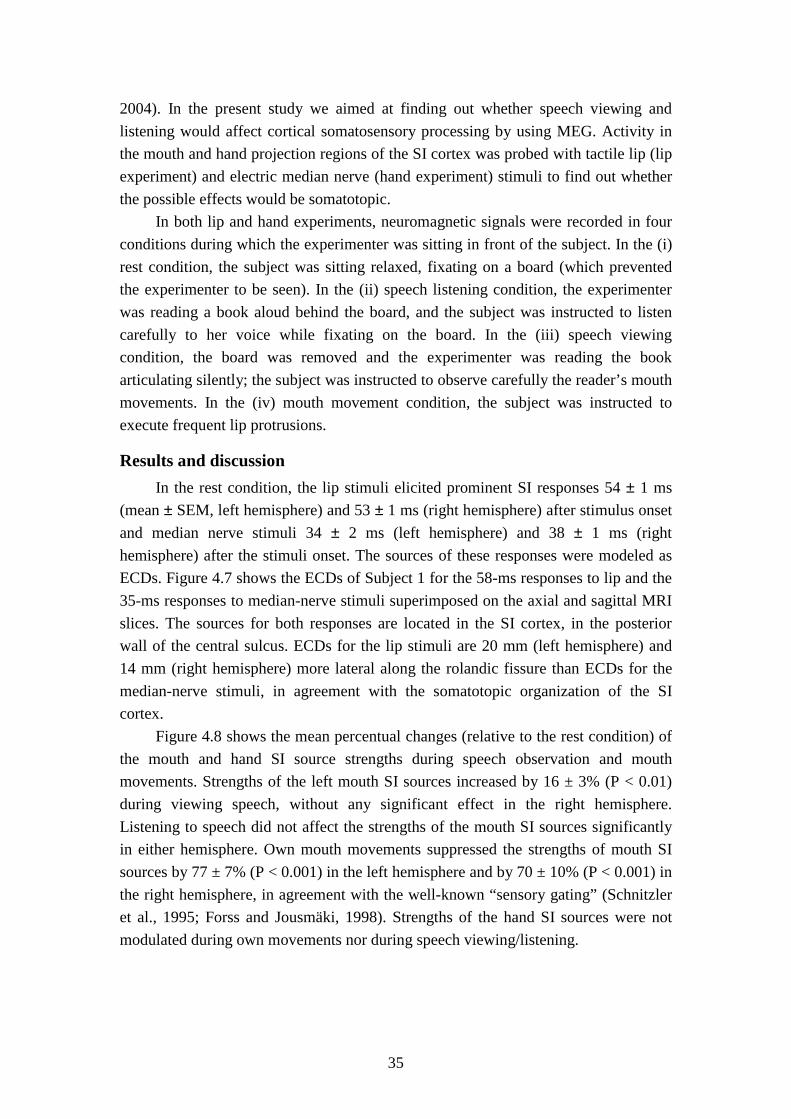
35
2004). In the present study we aimed at finding out whether speech viewing and
listening would affect cortical somatosensory processing by using MEG. Activity in
the mouth and hand projection regions of the SI cortex was probed with tactile lip (lip
experiment) and electric median nerve (hand experiment) stimuli to find out whether
the possible effects would be somatotopic.
In both lip and hand experiments, neuromagnetic signals were recorded in four
conditions during which the experimenter was sitting in front of the subject. In the (i)
rest condition, the subject was sitting relaxed, fixating on a board (which prevented
the experimenter to be seen). In the (ii) speech listening condition, the experimenter
was reading a book aloud behind the board, and the subject was instructed to listen
carefully to her voice while fixating on the board. In the (iii) speech viewing
condition, the board was removed and the experimenter was reading the book
articulating silently; the subject was instructed to observe carefully the reader’s mouth
movements. In the (iv) mouth movement condition, the subject was instructed to
execute frequent lip protrusions.
Results and discussion
In the rest condition, the lip stimuli elicited prominent SI responses 54 ± 1 ms
(mean ± SEM, left hemisphere) and 53 ± 1 ms (right hemisphere) after stimulus onset
and median nerve stimuli 34 ± 2 ms (left hemisphere) and 38 ± 1 ms (right
hemisphere) after the stimuli onset. The sources of these responses were modeled as
ECDs. Figure 4.7 shows the ECDs of Subject 1 for the 58-ms responses to lip and the
35-ms responses to median-nerve stimuli superimposed on the axial and sagittal MRI
slices. The sources for both responses are located in the SI cortex, in the posterior
wall of the central sulcus. ECDs for the lip stimuli are 20 mm (left hemisphere) and
14 mm (right hemisphere) more lateral along the rolandic fissure than ECDs for the
median-nerve stimuli, in agreement with the somatotopic organization of the SI
cortex.
Figure 4.8 shows the mean percentual changes (relative to the rest condition) of
the mouth and hand SI source strengths during speech observation and mouth
movements. Strengths of the left mouth SI sources increased by 16 ± 3% (P < 0.01)
during viewing speech, without any significant effect in the right hemisphere.
Listening to speech did not affect the strengths of the mouth SI sources significantly
in either hemisphere. Own mouth movements suppressed the strengths of mouth SI
sources by 77 ± 7% (P < 0.001) in the left hemisphere and by 70 ± 10% (P < 0.001) in
the right hemisphere, in agreement with the well-known “sensory gating” (Schnitzler
et al., 1995; Forss and Jousmäki, 1998). Strengths of the hand SI sources were not
modulated during own movements nor during speech viewing/listening.
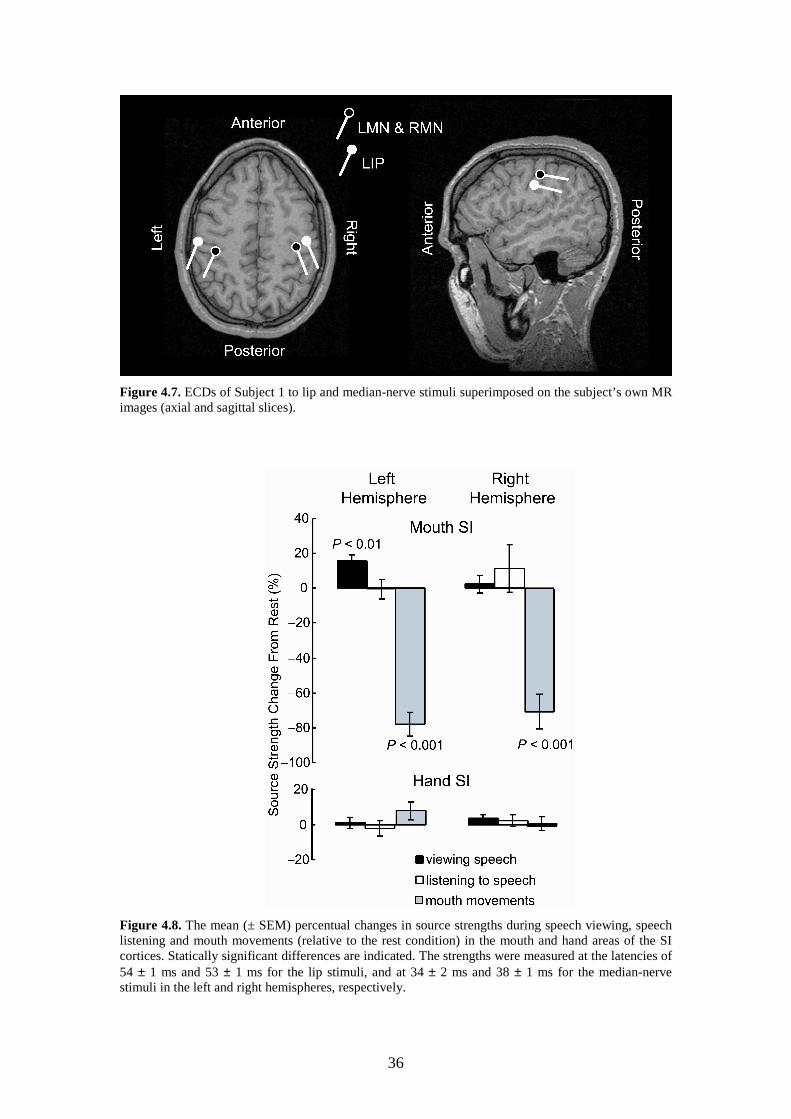
36
Figure 4.7. ECDs of Subject 1 to lip and median-nerve stimuli superimposed on the subject’s own MR images (axial and sagittal slices).
Figure 4.8. The mean (± SEM) percentual changes in source strengths during speech viewing, speech listening and mouth movements (relative to the rest condition) in the mouth and hand areas of the SI cortices. Statically significant differences are indicated. The strengths were measured at the latencies of 54 ± 1 ms and 53 ± 1 ms for the lip stimuli, and at 34 ± 2 ms and 38 ± 1 ms for the median-nerve stimuli in the left and right hemispheres, respectively.
37
The results show that viewing other person’s articulatory mouth movements
enhances activity in the left SI mouth area. This effect was not seen in the
corresponding region in the right hemisphere, nor in the SI hand area of either
hemisphere. Thus, mouth action viewing activated the left SI cortex in a somatotopic
manner. These data suggest that SI cortex is involved in embodied simulation other
persons’ actions.
Study V: Left posterior STS contains neural substrate for speech perception
Introduction and methods
Sine wave speech (SWS) stimuli are typically perceived as non-speech when
subjects are not aware of the origin of the stimuli. As soon as subjects are told that
SWS stimuli are modified speech sounds, they start to hear them as speech (Remez et
al., 1981). A psychophysical study of (Tuomainen et al., in press) showed that an
audiovisual stimulus, which consists of an acoustic SWS stimulus and a visual
articulation, produce a McGurk illusion when subjects are in the speech mode but not
when they are in the non-speech mode.
We used the SWS stimuli of Tuomainen and collaborators (in press) in the
present fMRI study in order to find out whether the left posterior STG/STS regions
are speech-specific, i.e., that they are specialized for sub-lexical processing of sounds
perceived as speech, independently of their acoustic characteristics. We hypothesized
that these regions should be more active when subjects perceive the SWS stimuli as
speech as compared with the activity when the same stimuli are perceived as non-
speech. To ensure that the subjects’ mode of perception really changed after training
to perceive SWS stimuli as speech, incongruent audiovisual stimuli were presented to
the subjects. Specifically, we hypothesized that seeing incongruent articulatory
movements should affect the categorization of acoustic SWS stimuli when (and only
when) subjects perceived them as speech.
The experiment included three stimulus types: (1) SWS replicas of /omso/ and
/onso/, (2) control sounds, (3) incongruent audiovisual stimuli which consisted of
SWS replica of /omso/ and visual articulation of /onso/. This type of audiovisual
stimulus was previously shown to produce auditory /onso/ percepts, while the subjects
perceived the SWS stimuli as speech in the study of Tuomainen et al. (submitted).
The control stimulus did not sound like speech, yet shared some physical
characteristics with SWS stimuli. It was expected that speech training would not
affect the perception of the control stimulus, unlike the perception of SWS stimuli
Furthermore, the experiment included baseline trials during which a still face with
mouth closed was presented without any sound.
38
In order to test speech-specificity within the left superior temporal cortex, we
contrasted pre- and post-training activations within a ROI. The ROI for the left
superior temporal cortex was obtained from the Volumes of Interest database (Nielsen
and Hansen, 2002). The used ROI included the mid and posterior parts of STG and
STS, Heschl’s gyrus and parieto-occipital junction. A mixed-effects group analysis
was carried out within this ROI. Statistical parametric images were thresholded at Z >
2.3 for subsequent clustering, and the cluster-wise significance threshold was set at P
< 0.05, corrected for multiple comparisons across the ROI.
Results and discussion
16 out of 21 subjects reported after the experiment that they perceived SWS
stimuli as non-speech during the pre-training session and as speech during the post-
training session. The data of five subjects who reported having perceived the SWS
stimuli as non-speech during both sessions were excluded from the further data
analyses. Figure 4.9 shows the mean (n = 16) proportions of correct responses to SWS
and audiovisual stimuli during pre- and post-training. Proportions of correct responses
to SWS and audiovisual stimuli did not differ significantly during the pre-training
session, indicating that viewing incongruent articulation did not affect subjects’
auditory (non-speech) perception. In contrast, during the post-training session the
incongruent audiovisual stimuli were identified significantly less accurately than SWS
stimuli (t-test, P < 0.001), demonstrating that viewing incongruent articulation
modified subjects’ auditory perception (i.e., subjects experienced a McGurk effect).
These behavioural findings support the view that subjects perceived the SWS stimuli
differently (as non-speech and speech) in the pre- and post-training sessions. The
control stimuli were identified perfectly in both sessions.

39
Figure 4.9. Proportions of correctly identified SWS stimuli presented alone and together with visual articulations (audiovisual stimuli) in the pre- and post-training sessions (n = 16). The difference in proportions of correct responses to SWS and audiovisual (AV) stimuli was tested by carrying out t tests; statistical significances are indicated.
In ROI analysis, SWS stimuli were found to elicit stronger activity during the
post- than pre-training session in the left posterior STS (Talairach coordinates: x =
–61 mm, y = –39 mm, z = 2 mm, cluster size: 117 voxels; Figure 4.10). None of the
regions within the ROI showed decreased activity to SWS stimuli in the post-training
session contrasted with the pre-training session. No differences were found between
pre- and post-training activations for either control or audiovisual stimuli.
To test further whether the left posterior STS region, showing increased activity
to the SWS-stimuli after speech training, fulfils the criteria of “a speech-specific”
region, the BOLD signal intensities to all stimulus types (contrasted with baseline)
during pre- and post-training session were obtained from the data of individual
subjects (Figure 4.10). Statistical comparisons showed that the BOLD signals were
increased after speech-training for SWS (t-test, P < 0.001), but not for control stimuli.
Furthermore, BOLD signals for audiovisual stimuli were increased significantly after
training (t-test, P < 0.05). The signals for the SWS and audiovisual stimuli did not
differ from each other in either session. BOLD signals for neither SWS nor
audiovisual stimuli differed from the signals for control stimuli during pre-training
session. In the post-training session, signals for both SWS (t-test, P < 0.01) and
audiovisual (t-test, P < 0.01) stimuli differed significantly from signals for control
stimuli.
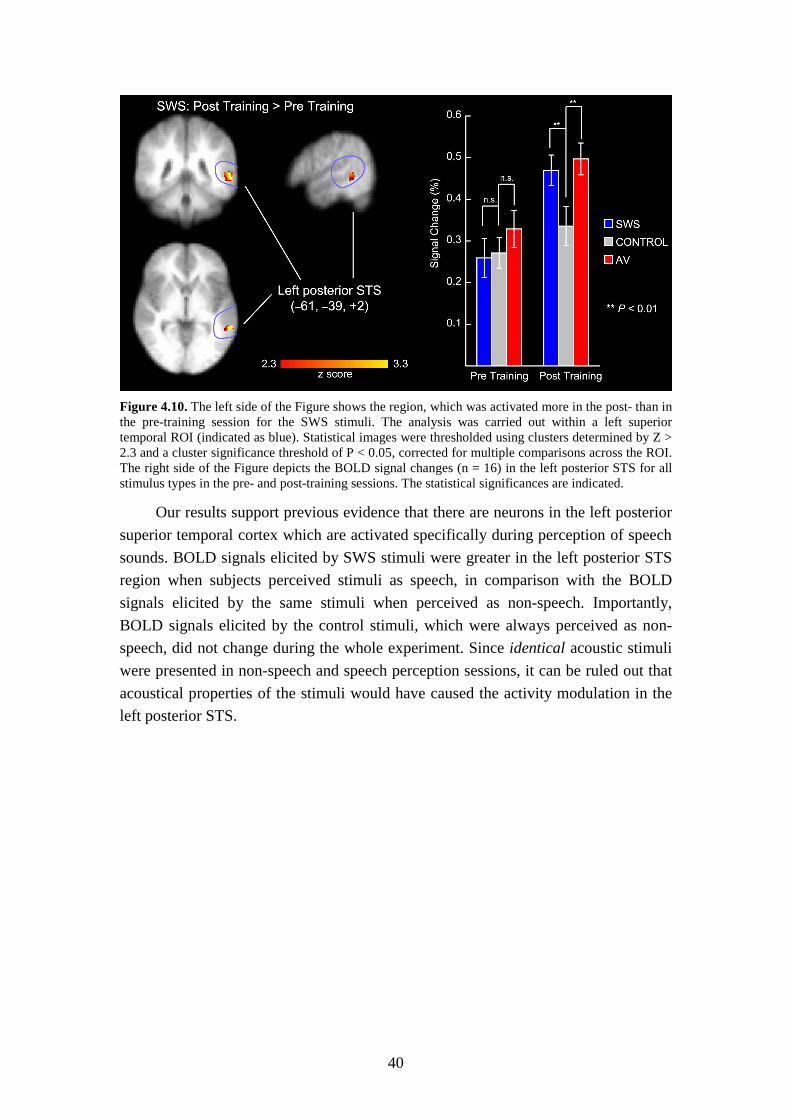
40
Figure 4.10. The left side of the Figure shows the region, which was activated more in the post- than in the pre-training session for the SWS stimuli. The analysis was carried out within a left superior temporal ROI (indicated as blue). Statistical images were thresholded using clusters determined by Z > 2.3 and a cluster significance threshold of P < 0.05, corrected for multiple comparisons across the ROI. The right side of the Figure depicts the BOLD signal changes (n = 16) in the left posterior STS for all stimulus types in the pre- and post-training sessions. The statistical significances are indicated.
Our results support previous evidence that there are neurons in the left posterior
superior temporal cortex which are activated specifically during perception of speech
sounds. BOLD signals elicited by SWS stimuli were greater in the left posterior STS
region when subjects perceived stimuli as speech, in comparison with the BOLD
signals elicited by the same stimuli when perceived as non-speech. Importantly,
BOLD signals elicited by the control stimuli, which were always perceived as non-
speech, did not change during the whole experiment. Since identical acoustic stimuli
were presented in non-speech and speech perception sessions, it can be ruled out that
acoustical properties of the stimuli would have caused the activity modulation in the
left posterior STS.
41
Chapter 5: General discussion
The current study investigated brain mechanisms underlying auditory, visual
and audiovisual speech perception by using EEG, MEG and fMRI. The left posterior
STS region was found to contain neural substrate for hearing speech (Study V).
Visual speech was shown to modulate activity in both auditory (Study I) and
somatosensory cortices (Study IV). Furthermore, acoustic and visual speech signals
were shown to interact both at early and late levels of cortical processing (Studies I–
III). The following sections discuss these main findings. The first section discusses
cortical mechanisms of seeing and hearing speech separately. The second section
discusses multisensory interactions during audiovisual speech perception.
Processing of acoustic and visual speech
Speech processing in the superior temporal cortex
Numerous studies have found evidence that left posterior STG/STS regions
would be specialized in processing of speech sounds (Demonet et al., 1992; Zatorre et
al., 1992; Mummery et al., 1999; Binder et al., 2000; Scott et al., 2000; Vouloumanos
et al., 2001; Narain et al., 2003). It has however remained open whether these regions
contain speech-specific neural representations or whether these regions are
specialized in processing of complex acoustic features characteristic to familiar
speech sounds. Results of Study V strongly suggest that the left posterior STS
contains speech-specific neural representations onto which acoustic input is mapped
during speech perception, but not during non-speech perception. Since we used
identical SWS stimuli in non-speech and speech perception conditions, the acoustic
features of the stimuli cannot explain the modulated activity in the left STS. Our
findings suggest, together with earlier studies, that speech-specific processing takes
place at a relatively late level of auditory processing stream. This conclusion is in
agreement with the proposed hierarchical organization of the cortical sound
processing, according to which the primary and secondary auditory cortices (in
~HG/STG) are responsible for processing acoustic features of both non-speech and
speech sounds, whereas the higher-order regions (in STS) are responsible for the
phonetic categorization of speech sounds (see, e.g., Binder et al., 2000). It has been
proposed that the speech representations in the left posterior STS would be either
articulatory-gestural (Scott and Johnsrude, 2003; Scott and Wise, 2004) or acoustic-
phonetic (Hickok and Poeppel, 2000; 2004).
Recording mismatch responses (with MEG or EEG) has proven to be an
effective tool to study processing of acoustic input in the low-level auditory regions in
42
the superior temporal cortex (~HG/STG) (for a review, see Näätänen, 2001). Study I
demonstrated, for the first time, that also visual changes, presented without acoustic
stimuli, can elicit mismatch responses in the auditory cortices (~HG/STG). Evidently,
there are neural mechanisms in the auditory cortex, which are able to distinguish
between visual speech inputs (/ipi/ versus /iti/). The finding challenges, together with
previous fMRI studies (e.g., Calvert et al. 1997), the traditional view that the human
auditory cortices would solely process acoustic input in isolation from other sensory
systems. Visual speech could have a special access into the auditory-cortex change-
detection mechanisms, since any other types of visual stimuli (presented without
acoustic stimuli) have not been found to elicit auditory-cortex mismatch responses
(e.g., Nyman et al., 1990; Alho et al., 1992; Tales et al., 1999; Stekelenburg et al.,
2004). There is evidence that changes in non-attended visual speech stimuli would not
elicit auditory-cortex responses that have the characteristics of mismatch responses
(Colin et al., 2002; Colin et al., 2004). In Study I the subjects attended to the stimuli.
Whether the differential results can be explained in terms of attention needs to be
addressed in further studies.
Embodied simulation of speech
A specific feature of a speech signal is that it is produced by motor acts of
another human being. Consequently, it is possible to imitate other person’s
articulatory gestures during seeing and hearing speech. To date, there is considerable
evidence that the motor system is activated during both seeing and hearing speech,
suggesting that observers indeed simulate talker’s motor acts during speech
perception as suggested by the motor theory of speech perception (Liberman et al.,
1967; Liberman and Mattingly, 1985).
Successful controlling of own actions, however, requires also somatosensory,
not only motor, structures. Especially during speech production, sensory feed-back
from the articulatory organs is important (see, e.g., Trembley et al., 2003). Thus, it
can be hypothesized that complete simulation of speech actions would activate
somatosensory brain regions. Study IV showed that this is the case. Activity in the
mouth region of left SI cortex was modulated during viewing other person’s
articulatory gestures, i.e., speechreading. This finding supports the view that a widely
distributed neural circuitry (that goes beyond motor regions) subserves embodied
simulation of other persons’ motor acts. The SI cortex could possibly subserve
simulation of other person’s action-related sensations and hence could enable the
observer to experience what the other person feels while performing motor acts, such
as articulatory gestures.
43
Multisensory interactions during audiovisual speech perception
Early cortical interactions
Studies I–III consistently showed that activity in the auditory cortices
(~HG/STG) is modulated during audiovisual speech perception within 200 ms after
acoustic stimulus onset. In Study II, activity in the right visual cortex was modulated
as well, 85 ms after acoustic stimulus onset (180 ms after visual stimulus onset).
These timings show that the acoustic and visual speech signals start to interact at early
latencies at a low level of cortical processing hierarchy. In agreement, previous fMRI
studies have demonstrated that activity in the low-level, presumably sensory-specific,
cortices (HG, V5/MT) is modulated during audiovisual speech perception (Calvert et
al., 1999).
An important question is whether the earliest multisensory interactions during
audiovisual speech processing occur before, during or after phonetic categorization of
sensory inputs. The phonetic categorization of acoustic speech has been estimated to
start 100–150 ms after acoustic stimulus onset (see, e.g., Rinne et al., 1999; Philips et
al., 2000). In Study II the early suppressions of the visual (85 ms) and auditory (125
ms) ERPs occurred probably before phonetic categorization of sensory inputs. This
conclusion is strongly supported by the fact that phonetic congruency of audiovisual
stimuli did not affect these early interaction effects in Study II. Furthermore, both
early interactions were right-lateralized. In Study III, the bilateral auditory-cortex
interaction effects started 150 ms after acoustic stimulus onset, thus they could have
occurred at a stage of phonetic categorization. In Study I, the onset latency of
auditory-cortex mismatch responses to visual changes was shortened when acoustic
stimuli were presented simultaneously with visual stimuli. The onsets of the responses
to McGurk-type of audiovisual stimuli were 150 ms and 205 ms in the left and right
auditory cortices, respectively. These latencies are rather typical to mismatch
responses elicited by “real” acoustic-phonetic changes, suggesting that audiovisual
integration occurred at an early level, before or during phonetic categorization.
Short-latency multisensory interactions in the sensory-specific cortices have
been found also in ERP studies using non-speech audiovisual stimuli (for reviews, see
(Fort and Giard, 2004; Schroeder and Foxe, 2004). The non-speech studies have
demonstrated that visual ERPs are enhanced by simultaneous presentation of acoustic
stimuli about 40 ms after stimulus onset (Giard & Peronnet, 1999; Molholm et al.,
2002). Furthermore, Giard & Peronnet (1999) found that visual N1 response, peaking
185 ms after stimulus onset over right occipito-temporal regions, is suppressed during
simultaneous presentation of acoustic stimuli. A similar right-lateralized suppression
of visual N1 (peaking 180 ms after visual stimulus onset) was found also in Study II.
Thus, in light of the current evidence it seems that the visual N1 is suppressed when
either non-speech or speech stimuli are used. On the other hand, auditory N100
response has not been found to be suppressed in non-speech ERP studies. Instead,

44
Giard and Peronnet (1999) found enhancement of auditory N100 response in a
“visually-oriented” subject group. Thus, the suppression of auditory N100 response
found in the Study II might be specific to audiovisual speech (see also, Jääskeläinen et
al., in press).
One should be however cautious when comparing results of above mentioned
non-speech ERP studies and Study II. Since the studies differ from each other with
respect to tasks of the subjects and temporal characteristics of the audiovisual stimuli,
the discrepant results are not necessarily due to nature of stimuli (non-speech/speech).
In non-speech studies, subjects have typically responded to each stimulus and the
onsets of acoustic and visual components have been simultaneous in audiovisual
stimuli. In our speech studies, we have used more passive tasks and in audiovisual
stimuli the onset of visual component has preceded that of acoustic one according to
the natural characteristics of audiovisual speech. Studies, which directly compare
multisensory interactions of speech and non-speech stimuli, are needed in order to
resolve whether the early interactions occurring in putative sensory-specific cortices
are sensitive to “speechness” of the stimuli.
Late cortical interactions
Study III demonstrated that activity in the right multisensory STS region is
modulated at a rather late stage (onset 250 ms) of audiovisual speech processing. The
results of the Study II were also consistent with the view that the late (>150 ms)
audiovisual interactions occurred in the putative multisensory cortical regions in
temporal and parietal lobes.
In Study II, the late left-lateralized interactions (>150 ms) were shown to be
sensitive to phonetic congruency of audiovisual vowels, suggesting that phonetic
features of acoustic and visual speech signals are extracted and combined at a late
stage of sensory processing. Timing of the onset of the first phonetic interaction, 155
ms after acoustic stimulus onset, agrees well with the suggested onset of phonetic
processing of speech sounds (see, e.g., Philips et al., 2000). The scalp distribution of
this first phonetic interaction effect could be explained by two temporal sources, in
the left and right STS regions. (Note, however, that exact locations of the underlying
sources cannot be determined due to poor spatial resolution of ERPs.)
The multisensory STS region has been shown to be involved in integration of
audiovisual speech in number of studies (Calvert et al., 2000; Sekiyama et al., 2003;
Wright et al., 2003; Callan et al., 2004). However, this region participates also in
integration of non-speech audiovisual stimuli (Beauchamp et al., 2004; van Atteveldt
et al., 2004). MEG study of Raij et al. (2000) showed that integration of letters and
speech sounds starts 380 ms and 450 ms after stimulus onset in the left and right STS
regions, respectively, indicating, in agreement with Study III, that STS takes part in
audiovisual processing at a late stage of sensory processing. Thus, the STS regions
seem to be responsible for integrating non-speech acoustic and visual stimulus

45
contents which are learned to be connected with each other (e.g., a letter “R” and a
speech sound /r/, or a picture and a sound of the telephone). This type of “associative”
integration is likely implemented by neural mechanisms that are different from, e.g.,
“spatio-temporal” integration occurring in SC neurons (see also Raij and Jousmäki,
2004). It is possible that also acoustic and visual speech signals are integrated by
these kinds of associative mechanisms in the STS region.
Frontal speech motor regions are also potential candidates for late interaction
sites, since they are activated by both seen and heard speech (Fadiga et al., 2002;
Watkins et al., 2003; Watkins and Paus, 2004; Wilson et al., 2004). We recently
carried out an fMRI study in which BOLD responses to phonetically congruent and
incongruent audiovisual vowels (identical with the stimuli of Study II) were compared
(Ojanen et al., 2004). Phonetically incongruent audiovisual vowels elicited greater
BOLD responses in the Broca’s area than the congruent ones, suggesting that this
region participates in integration of audiovisual speech. In monkeys, audiovisual
mirror neurons have been found in the F5 region, which is the homologue of the
Broca’s region in the human brain (Kohler et al., 2002; Keysers et al., 2003). By
definition, an audiovisual mirror neuron responds both when a monkey sees or hears a
specific action (e.g., peanut breaking) and when the monkey performs the same action
itself. In humans, this kind of mirror neurons could subserve integration of seen and
heard speech inputs, which originate from the talker’s articulatory actions.
Summary and insights to further studies
The translation of the perceptual theories of audiovisual speech integration (see
Chapter 2) to neural implementations is not straightforward. However, some
predictions concerning cortical integration mechanisms can be derived from these
theories. The theories assuming that audiovisual integration occurs early at a pre-
phonetic level would naturally predict that seen and heard speech interact with each
other at low-level cortical regions at early latencies. This prediction gained support in
the present study. At an early stage (~50–200 ms) of cortical processing, seen and
heard speech signals interacted in the sensory-specific cortices (Studies I–III). On the
other hand, theories assuming that acoustic and visual speech signals are phonetically
categorized separately and then associated would predict that integration occurs in the
higher-order multisensory regions at late latencies (see, e.g., Bernstein et al., 2004). In
agreement with this view, late (~150–600 ms) audiovisual interactions were found in
the multisensory STS regions in the current study (Studies II–III). The gestural
theories (the motor theory and the direct realist theory) would predict that seen and
heard speech converge in gestural representations. This type of interaction
mechanisms are likely to exist as well, since both auditory and visual speech seem to
activate frontal “speech production regions” (Fadiga et al., 2002; Watkins et al., 2003;
Watkins and Paus, 2004; Wilson et al., 2004) and Broca’s region shows differential
responses to phonetically incongruent and congruent audiovisual vowels (Ojanen et

46
al., 2004). In sum, all predictions derived from different perceptual theories have
gained support to some extent in recent neurophysiological studies.
Thus, multiple, hierarchically organized, cortical mechanisms are likely to be
responsible for binding seen and heard speech in the human brain. This is not
surprising, taken into account that according to recent views, heard speech is also
processed by parallel, hierarchically organized, cortical pathways which map acoustic
input into different kinds (acoustic-phonetic and articulatory gestural) of neural
representations (e.g., Scott and Johnstrude, 2003; see Chapter 2).
The challenge of further research is to characterize behavior and functional
significance of the distinct cortical mechanisms participating in integration of seen
and heard speech. An important question is whether speech stimuli are integrated in a
fundamentally different manner than non-speech stimuli. This question can be
answered only by studies which directly compare multisensory interactions elicited by
audiovisual non-speech and speech stimuli. Further studies should also address the
sensitivity of different cortical integration mechanisms to different physical
parameters of audiovisual speech (and non-speech) stimuli (e.g., temporal synchrony,
spatial coincidence, phonetic congruence). Furthermore, it is important to address the
influence of cognitive factors such as attention and learning on these mechanisms in
order to find out, for instance, which integration mechanisms are sensitive to whether
the subject attends to the stimuli or not and/or whether s/he has experienced specific
audiovisual events before or not.
Conclusions Speech is the primary communication tool in everyday life. Our remarkable skill
to understand heard and seen speech has been under active investigation during past
decades. Recently, modern brain research techniques, such as EEG, MEG, fMRI,
have started to illuminate brain mechanisms that underlie speech perception.
Although we are still far from understanding how the brain allows us to hear voices
and see lips moving, some important findings have been made. Importantly, neural
processing of acoustic and visual speech signals is not restricted to auditory and visual
systems, respectively. This study showed that the left posterior STS region is crucially
important in auditory speech perception; as its activity is modified when perception of
acoustic signals changes from non-speech to speech. The finding supports the view
that speech-specific processing occurs at a late stage of auditory processing stream.
Furthermore, it was shown that visual speech has access to the auditory cortex and to
the left SI mouth cortex, demonstrating that the putatively sensory-specific regions of
other modalities are involved in speechreading. Multisensory interactions between
seen and heard speech were found in the sensory-specific cortices at early latencies
and in the multisensory regions at late latencies. Altogether, the results imply that a
widely-distributed network of low- and high-level cortical regions subserves seeing
and hearing speech.

47
References Alho K, Woods DL, Algazi A, Näätänen R (1992) Intermodal selective attenttion. II.
Effects of attentional load on processing of auditory and visual stimuli in central space. Electroencephalogr Clin Neurophysiol 82:356-368.
Allison T, Puce A, McCarthy G (2000) Social perception from visual cues: role of the STS region. Trends Cogn Sci 4:267-278.
Avikainen S, Forss N, Hari R (2002) Modulated activation of the human SI and SII cortices during observation of hand actions. NeuroImage 15:640-646.
Beauchamp MS, Lee KE, Argall BD, Martin A (2004) Integration of auditory and visual information about objects in superior temporal sulcus. Neuron 41:809-823.
Belin P, Zatorre RJ, Hoge R, Evans AC, Pike B (1999) Event-related fMRI of the auditory cortex. NeuroImage 10:417-429.
Belliveau JW, Kennedy DN, Jr., McKinstry RC, Buchbinder BR, Weisskoff RM, Cohen MS, Vevea JM, Brady TJ, Rosen BR (1991) Functional mapping of the human visual cortex by magnetic resonance imaging. Science 254:716-719.
Berger H (1929) Über das Elektoenkephalogram de Menchen. Archiv Psychiatrishe Nervenkrankenheit 87:527-570.
Bernstein LE, Auer ET, Moore JK (2004) Audiovisual speech binding: convergence or association? In: The Handbook of Multisensory Processes (Calvert G, Spence C, Stein BE, eds), pp 203-224. Cambridge, Massachusetts: The MIT Press.
Bernstein LE, Auer ET, Jr., Moore JK, Ponton CW, Don M, Singh M (2002) Visual speech perception without primary auditory cortex activation. NeuroReport 13:311-315.
Binder JR, Frost JA, Hammeke TA, Bellgowan PS, Springer JA, Kaufman JN, Possing ET (2000) Human temporal lobe activation by speech and nonspeech sounds. Cereb Cortex 10:512-528.
Borden GJ, Harris KS, Raphael LJ (1994) Speech Science Primer: physiology, acoustics, and perception of speech, 3rd Edition. Baltimore, US: Williams & Wilkins.
Buccino G, Binkofski F, Fink GR, Fadiga L, Fogassi L, Gallese V, Seitz RJ, Zilles K, Rizzolatti G, Freund HJ (2001) Action observation activates premotor and parietal areas in a somatotopic manner: an fMRI study. Eur J Neurosci 13:400-404.
Callan DE, Callan AM, Kroos C, Vatikiotis-Bateson E (2001) Multimodal contribution to speech perception revealed by independent component analysis: a single-sweep EEG case study. Brain Res Cogn Brain Res 10:349-353.
Callan DE, Jones JA, Munhall KG, Callan AM, Kroos C, Vatikiotis-Bateson E (2003) Neural processes underlying perceptual enhancement by visual speech gestures. NeuroReport 14:2213-2217.
Callan DE, Jones JA, Munhall K, Kroos C, Callan AM, Vatikiotis-Bateson E (2004) Multisensory integration sites identified by perception of spatial wavelet filtered visual speech gesture information. J Cogn Neurosci 16:805-816.
Calvert G, Campbell R (2003) Reading speech from still and moving faces: The neural substrates of visible speech. J Cogn Neurosci 15:57-70.
48
Calvert G, Spence C, Stein BE (2004) The Handbook of Multisensory Processes. Cambridge, Massachusetts: The MIT Press.
Calvert GA, Campbell R, Brammer MJ (2000) Evidence from functional magnetic resonance imaging of crossmodal binding in the human heteromodal cortex. Curr Biol 10:649-657.
Calvert GA, Hansen PC, Iversen SD, Brammer MJ (2001) Detection of audio-visual integration sites in humans by application of electrophysiological criteria to the bold effect. NeuroImage 14:427-438.
Calvert GA, Brammer MJ, Bullmore ET, Campbell R, Iversen SD, David AS (1999) Response amplification in sensory-specific cortices during crossmodal binding. NeuroReport 10:2619-2623.
Calvert GA, Bullmore ET, Brammer MJ, Campbell R, Williams SC, McGuire PK, Woodruff PW, Iversen SD, David AS (1997) Activation of auditory cortex during silent lipreading. Science 276:593-596.
Campbell R, Dodd B, Burnham D (1998) Hearing by eye II: Advances in the psychology of speech-reading and audio-visual speech. Hove: Psychology Press.
Campbell R, MacSweeney M, Surguladze S, Calvert G, McGuire P, Suckling J, Brammer MJ, David AS (2001) Cortical substrates for the perception of face actions: an fMRI study of the specificity of activation for seen speech and for meaningless lower-face acts (gurning). Brain Res Cogn Brain Res 12:233-243.
Cohen D (1968) Magnetoencephalography: evidence of magnetic field produced by alpha-rhythm currents. Science 161:784-786.
Colin C, Radeau M, Soquet A, Deltenre P (2004) Generalization of the generation of an MMN by illusory McGurk percepts: voiceless consonants. Clin Neurophysiol 115:1989-2000.
Colin C, Radeau M, Soquet A, Demolin D, Colin F, Deltenre P (2002) Mismatch negativity evoked by the McGurk-MacDonald effect: a phonetic representation within short-term memory. Clin Neurophysiol 113:495-506.
Cusick CG (1997) The superior temporal polysensory region in monkeys. In: Cerebral Cortex (Rockland KS, Kaas JH, Peters A, eds), pp 435-468. New York: Plenum.
De Gelder B, Bertelson P (2003) Multisensory integration, perception and ecological validity. Trends Cogn Sci 7:460-467.
Dehaene-Lambertz G (1997) Electrophysiological correlates of categorical phoneme perception in adults. NeuroReport 8:919-924.
Dehner LR, Keniston LP, Clemo HR, Meredith MA (2004) Cross-modal circuitry between auditory and somatosensory areas of the cat anterior ectosylvian sulcal cortex: a 'new' inhibitory form of multisensory convergence. Cereb Cortex 14:387-403.
Demonet JF, Chollet F, Ramsay S, Cardebat D, Nespoulous JL, Wise R, Rascol A, Frackowiak R (1992) The anatomy of phonological and semantic processing in normal subjects. Brain 115:1753-1768.
di Pellegrino G, Fadiga L, Fogassi L, Gallese V, Rizzolatti G (1992) Understanding motor events: a neurophysiological study. Exp Brain Res 91:176-180.
Diehl RL, Kluender KR (1989) On the Objects of Speech Perception. Ecol Psych 1:121-144.
Diehl RL, Lotto AJ, Holt LL (2004) Speech perception. Annu Rev Psychol 55:149-179.
49
Dodd B, Campbell R (1987) Hearing by eye: The psychology of lip-reading. Hove: Lawrence Erlbaum Associates Ltd.
Erber NP (1969) Interaction of audition and vision in the recognition of oral speech stimuli. J Speech Hear Res12:423-425.
Ettlinger G, Wilson WA (1990) Cross-modal performance: behavioural processes, phylogenetic considerations and neural mechanisms. Behav Brain Res 40:169-192.
Fadiga L, Fogassi L, Pavesi G, Rizzolatti G (1995) Motor facilitation during action observation: a magnetic stimulation study. J Neurophysiol 73:2608-2611.
Fadiga L, Craighero L, Buccino G, Rizzolatti G (2002) Speech listening specifically modulates the excitability of tongue muscles: a TMS study. Eur J Neurosci 15:399-402.
Falchier A, Clavagnier S, Barone P, Kennedy H (2002) Anatomical evidence of multimodal integration in primate striate cortex. J Neurosci 22:5749-5759.
Ferrari PF, Gallese V, Rizzolatti G, Fogassi L (2003) Mirror neurons responding to the observation of ingestive and communicative mouth actions in monkey ventral premotor cortex. Eur J Neurosci 17:1703-1714.
Forss N, Jousmäki V (1998) Sensorimotor integration in human primary and secondary somatosensory cortices. Brain Res 781:259-267.
Fort A, Giard MH (2004) Multiple Electrophysiological mechanisms of audiovisual integration in human perception. In: The Handbook of Multisensory Processes (Calvert G, Spence C, Stein BE, eds), pp 503-514. Cambridge, Massachusetts: The MIT Press.
Fort A, Delpuech C, Pernier J, Giard MH (2002a) Early auditory-visual interactions in human cortex during nonredundant target identification. Brain Res Cogn Brain Res 14:20-30.
Fort A, Delpuech C, Pernier J, Giard MH (2002b) Dynamics of cortico-subcortical cross-modal operations involved in audio-visual object detection in humans. Cereb Cortex 12:1031-1039.
Fowler CA (1986) An event approach to the study of speech perception direct-realist perspective. J Phon 14:3-28.
Fowler CA (1996) Listeners do hear sounds, not tongues. J Acoust Soc Am 99:1730-1741.
Fowler CA (2004) Speech as a supramodal or amodal phenomenon. In: The Handbook of Multisensory Processes (Calvert G, Spence C, Stein BE, eds), pp 189-202. Cambridge, Massachusetts: The MIT Press.
Friston KJ, Worsley KJ, Frakowiak RSJ, Mazziotta JC, Evans AC (1994) Assessing the significance of focal activations using their spatial extent. Hum Brain Mapp 1:214-220.
Galaburda A, Sanides F (1980) Cytoarchitectonic organization of the human auditory cortex. J Comp Neurol 190:597-610.
Gallese V, Goldman A (1998) Mirror neurons and the simulation theory of mind-reading. Trends Cogn Sci 2:493-501.
Gallese V, Fadiga L, Fogassi L, Rizzolatti G (1996) Action recognition in the premotor cortex. Brain 119:593-609.
Giard MH, Peronnet F (1999) Auditory-visual integration during multimodal object recognition in humans: a behavioral and electrophysiological study. J Cogn Neurosci 11:473-490.

50
Green KP (1996) The use of auditory and visual information in phonetic perception. In: Speechreading by Humans and Machines : Models, Systems, and Applications (Stork DG, Hennecke ME, eds), pp 55-77. Berlin: Springer.
Hackett TA, Stepniewska I, Kaas JH (1998) Subdivisions of auditory cortex and ipsilateral cortical connections of the parabelt auditory cortex in macaque monkeys. J Comp Neurol 394:475-495.
Hackett TA, Stepniewska I, Kaas JH (1999) Prefrontal connections of the parabelt auditory cortex in macaque monkeys. Brain Res 817:45-58.
Hall DA, Summerfield AQ, Goncalves MS, Foster JR, Palmer AR, Bowtell RW (2000) Time-course of the auditory BOLD response to scanner noise. Magn Reson Med 43:601-606.
Hall DA, Haggard MP, Akeroyd MA, Palmer AR, Summerfield AQ, Elliot MR, Gurney EM, Bowtell RW (1999) "Sparse" Temporal Sampling in Auditory fMRI. Hum Brain Mapp 7:213-223.
Hari R (1999) Magnetoencephalography as a tool of clinical neurophysiology. In: Electroencephalography: Basic principles, Clinical applications, and Related Fields (Niemermeyer E, Da Silva FL, eds), pp 1107-1134. Maryland, USA: Lippincott Williams & Wilkins.
Hari R, Nishitani N (2004) From viewing of movements to understanding and imitation of other persons' acts: MEG studies of the human mirror-neuron system. In: Functional Neuroimaging of Visual Cognition - Attention and Performance XX (Kanwisher N, Duncan J, eds).pp. 463-473. Oxford University Press.
Hari R, Forss N, Avikainen S, Kirveskari E, Salenius S, Rizzolatti G (1998) Activation of human primary motor cortex during action observation: a neuromagnetic study. Proc Nat Acad Sci U S A 95:15061-15065.
Hari R, Hämäläinen M, Ilmoniemi R, Kaukoranta E, Reinikainen K, Salminen J, Alho K, Näätänen R, Sams M (1984) Responses of the primary auditory cortex to pitch changes in a sequence of tone pips: neuromagnetic recordings in man. Neurosci Lett 50:127-132.
Hasson U, Nir Y, Levy I, Fuhrmann G, Malach R (2004) Intersubject synchronization of cortical activity during natural vision. Science 303:1634-1640.
Hickok G, Poeppel D (2000) Towards a functional neuroanatomy of speech perception. Trends Cogn Sci 4:131-138.
Hickok G, Poeppel D (2004) Dorsal and ventral streams: a framework for understanding aspects of the functional anatomy of language. Cognition 92:67-99.
Hickok G, Love T, Swinney D, Wong EC, Buxton RB (1997) Functional MR imaging during auditory word perception: a single-trial presentation paradigm. Brain Lang 58:197-201.
Howard MA, Volkov IO, Mirsky R, Garell PC, Noh MD, Granner M, Damasio H, Steinschneider M, Reale RA, Hind JE, Brugge JF (2000) Auditory cortex on the human posterior superior temporal gyrus. J Comp Neurol 416:79-92.
Howard MA, 3rd, Volkov IO, Abbas PJ, Damasio H, Ollendieck MC, Granner MA (1996) A chronic microelectrode investigation of the tonotopic organization of human auditory cortex. Brain Res 724:260-264.
Hämäläinen M, Hari R, Ilmoniemi RJ, Knuutila J, Lounasmaa OV (1993) Magnetoencephalography — theory, instrumentation, and applications to noninvasive studies of the working human brain. Rev Mod Physics 65:413-497.
51
Hämäläinen MS, Ilmoniemi R (1994) Interpreting magnetic fields of the brain: Minimum norm estimates. Med Biol Eng Comp 32:35-42.
Jääskeläinen IP, Ahveninen J, Bonmassar G, Dale AM, Ilmoniemi RJ, Levänen S, Lin FH, May P, Melcher J, Stufflebeam S, Tiitinen H, Belliveau JW (2004) Human posterior auditory cortex gates novel sounds to consciousness. Proc Natl Acad Sci U S A 101:6809-6814.
Jääskeläinen IP, Ojanen V, Ahveninen J, Auranen T, Levänen S, Möttönen R, Tarnanen I, Sams M (in press) Adaptation of neuromagnetic NI responses to phonetic stimuli by visual speech in humans. NeuroReport.
Jäncke L, Wustenberg T, Scheich H, Heinze H-J (2002) Phonetic Perception and the Temporal Cortex. NeuroImage 15:733-746.
Jasper HH (1958) The ten-twenty electrode system of the International Federation. Electroenphalogr Clin Neurophysiol 10:371-375.
Jezzard P, Matthews PM, Smith SM (2001) Functional MRI: An Introduction to Methods. Oxford University Press.
Joanisse MF, Gati JS (2003) Overlapping neural regions for processing rapid temporal cues in speech and nonspeech signals. NeuroImage 19:64-79.
Jones JA, Munhall KG (1997) The effects of separating auditory and visual sources on audiovisual integration of speech. Can Acoust 25:13-19.
Kaas JH, Hackett TA (2000) Subdivisions of auditory cortex and processing streams in primates. Proc Natl Acad Sci U S A 97:11793-11799.
Kandel ER, Schwartz JH, Jessell TM (1991) Principles of neural science. Prentice-Hall International Inc.
Kaukoranta E, Hämäläinen M, Sarvas J, Hari R (1986) Mixed and sensory nerve stimulations activate diffrent cytoarchitectonic areas in the human primary somatosensory cortex SI. Exp Brain Res 63:60-66.
Keysers C, Kohler E, Umilta MA, Nanetti L, Fogassi L, Gallese V (2003) Audiovisual mirror neurons and action recognition. Exp Brain Res 153:628-636.
Kohler E, Keysers C, Umilta MA, Fogassi L, Gallese V, Rizzolatti G (2002a) Hearing sounds, understanding actions: action representation in mirror neurons. Science 297:846-848.
Kuhl PK (2000) A new view of language acquisition. Proc Natl Acad Sci U S A 97:11850-11857.
Kuhl PK, Miller JD (1975) Speech perception by the chinchilla: voiced-voiceless distinction in alveolar plosive consonants. Science 190:69-72.
Kuhl PK, Miller JD (1978) Speech perception by the chinchilla: identification function for synthetic VOT stimuli. J Acoust Soc Am 63:905-917.
Liberman A, Mattingly IG (1985) The motor theory of speech perception revised. Cognition 21:1-36.
Liberman AM, Cooper FS, Shankweiler DP, Studdert-Kennedy M (1967) Perception of the speech code. Psychol Rev 74:431-461.
Logothetis NK, Pauls J, Augath M, Trinath T, Oeltermann A (2001) Neurophysiological investigation of the basis of the fMRI signal. Nature 412:150-157.
Macaluso E, George N, Dolan R, Spence C, Driver J (2004) Spatial and temporal factors during processing of audiovisual speech: a PET study. NeuroImage 21:725-732.
MacSweeney M, Amaro E, Calvert GA, Campbell R, David AS, McGuire P, Williams SC, Woll B, Brammer MJ (2000) Silent speechreading in the
52
absence of scanner noise: an event-related fMRI study. NeuroReport 11:1729-1733.
MacSweeney M, Campbell R, Calvert GA, McGuire PK, David AS, Suckling J, Andrew C, Woll B, Brammer MJ (2001) Dispersed activation in the left temporal cortex for speech-reading in congenitally deaf people. Proc R Soc Lond B Biol Sci 268:451-457.
Massaro DW (1998) Perceiving talking faces. Cambridge, Massachusetts: MIT Press. Massaro DW (2004) From multisensory integration to talking heads and language-
learning. In: The Handbook of Multisensory Processes (Calvert G, Spence C, Stein BE, eds), pp 153-177. Cambridge, Massachusetts: The MIT Press.
Massaro DW, Cohen MM, Smeele PM (1996) Perception of asynchronous and conflicting visual and auditory speech. J Acoust Soc Am 100:1777-1786.
Matsuura K, Okabe U (1995) Selective minimum-norm solution of the biomagnetic inverse problem. IEEE Trans Biomed Eng 42:608-615.
McGurk H, MacDonald J (1976) Hearing lips and seeing voices. Nature 264:746-748. Meredith MA (2004) Cortico-cortical connectivity of cross-modal circuits. In: The
Handbook of Multisensory Processes (Calvert G, Spence C, Stein BE, eds), pp 343-356. Cambridge, Massachusetts: The MIT Press.
Mertens M, Lütkenhöner B (2000) Efficient neuromagnetic determination of landmarks in the somatosensory cortex. Clin Neurophysiol 111:1478-1487.
Molholm S, Ritter W, Murray MM, Javitt DC, Schroeder CE, Foxe JJ (2002) Multisensory auditory-visual interactions during early sensory processing in humans: a high-density electrical mapping study. Brain Res Cogn Brain Res 14:115-128.
Mummery CJ, Ashburner J, Scott SK, Wise RJ (1999) Functional neuroimaging of speech perception in six normal and two aphasic subjects. J Acoust Soc Am 106:449-457.
Munhall KG, Gribble P, Sacco L, Ward M (1996) Temporal constraints on the McGurk effect. Percept Psychophys 58:351-362.
Möttönen R (1999) Perception of Natural and Synthetic Audiovisual Finnish Speech. Master's Thesis, Department of Psychology, University of Helsinki.
Möttönen R, Olives J-L, Kulju J, Sams M (2000) Parameterized Visual Speech Synthesis and its Evaluation. In: Proceedings of the European Signal Processing Conference. Tampere, Finland.
Näätänen R (2001) The perception of speech sounds by the human brain as reflected by the mismatch negativity (MMN) and its magnetic equivalent (MMNm). Psychophysiol 38:1-21.
Näätänen R, Tervaniemi M, Sussman E, Paavilainen P, Winkler I (2001) 'Primitive intelligence' in the auditory cortex. Trends Neurosci 24:283-288.
Näätänen R, Lehtokoski A, Lennes M, Cheour M, Huotilainen M, Iivonen A, Vainio M, Alku P, Ilmoniemi RJ, Luuk A, Allik J, Sinkkonen J, Alho K (1997) Language-specific phoneme representations revealed by electric and magnetic brain responses. Nature 385:432-434.
Narain C, Scott SK, Wise RJ, Rosen S, Leff A, Iversen SD, Matthews PM (2003) Defining a left-lateralized response specific to intelligible speech using fMRI. Cereb Cortex 13:1362-1368.
Nelken I, Fishbach A, Las L, Ulanovsky N, Farkas D (2003) Primary auditory cortex of cats: feature detection or something else? Biol Cybern 89:397-406.
Nielsen FÅ, Hansen LK (2002) Automatic anatomical labeling of Talairach coordinates and generation of volumes of interest via the BrainMap database.

53
Presensented at the 8th International Conference on Functional Mapping of the Human Brain. Sendai, Japan.
Niemermeyer E, Da Silva FL (1999) Electroencephalography: Basic principles, Clinical applications, and Related Fields. Maryland, USA: Lippincott Williams & Wilkins.
Nishitani N, Hari R (2000) Temporal dynamics of cortical representation for action. Proc Natl Acad Sci U S A 97:913-918.
Nishitani N, Hari R (2002) Viewing lip forms: cortical dynamics. Neuron 36:1211-1220.
Nyman G, Alho K, Laurinen P, Paavilainen P, Radil T, Reinikainen K, Sams M, Näätänen R (1990) Mismatch negativity (MMN) for sequences of auditory and visual stimuli: evidence for a mechanism specific to the auditory modality. Electroencephalogr Clin Neurophysiol 77:436-444.
Ogawa S, Menon RS, Tank DW, Kim SG, Merkle H, Ellermann JM, Ugurbil K (1993) Functional brain mapping by blood oxygenation level-dependent contrast magnetic resonance imaging. A comparison of signal characteristics with a biophysical model. Biophys J 64:803-812.
Ojanen V, Möttönen R, Pekkola J, Jääskeläinen IP, Sams M (2004) Processing of audiovisual speech in the Broca's area. Presented at the 10th Annual Meeting of the Organization for Human Brain Mapping. Budapest, Hungary.
Olivès J-L, Möttönen R, Kulju J, Sams M (1999) Audiovisual speech synthesis for Finnish. In: Proceedings of AVSP'99 (Massaro D, ed). Santa Cruz, USA.
Olson IR, Gatenby JC, Gore JC (2002) A comparison of bound and unbound audio-visual information processing in the human cerebral cortex. Brain Res Cogn Brain Res 14:129-138.
Paulesu E, Perani D, Blasi V, Silani G, Borghese NA, De Giovanni U, Sensolo S, Fazio F (2003a) A functional-anatomical model for lip-reading. J Neurophysiol 90:2005-2013.
Pekkola J, Ojanen V, Autti T, Jääskeläinen IP, Möttönen R, Tarkiainen A, Sams M (in press) Primary auditory activation by visual speech. an fMRI study at 3 Tesla. NeuroReport.
Phillips C, Pellathy T, Marantz A, Yellin E, Wexler K, Poeppel D, McGinnis M, Roberts T (2000) Auditory cortex accesses phonological categories: an MEG mismatch study. J Cogn Neurosci 12:1038-1055.
Picton T, Lins OG, Scherg M (1995) The recording and analysis of event-related potential. In: Handbook of Neuropsychology, Vol 10 (Boller F and Grafman J, eds). pp. 429-499, Amsterdam: Elsevier.
Pisoni DB (1977) Identification and discrimination of the relative onset time of two component tones: implications for voicing perception in stops. J Acoust Soc Am 61:1352-1361.
Raij T, Jousmäki V (2004) MEG studies of cross-modal integration and plasticity. In: The Handbook of Multisensory Processes (Calvert G, Spence C, Stein BE, eds), pp 515-528. Cambridge, Massachusetts: The MIT Press.
Raij T, Uutela K, Hari R (2000) Audiovisual integration of letters in the human brain. Neuron 28:617-625.
Rauschecker JP, Tian B (2000) Mechanisms and streams for processing of "what" and "where" in auditory cortex. Proc Natl Acad Sci U S A 97:11800-11806.
Rauschecker JP, Tian B, Hauser M (1995) Processing of complex sounds in the macaque nonprimary auditory cortex. Science 268:111-114.

54
Reisberg D, McLean J, Goldfield A (1987) Easy to hear but hard to understand: A lip-reading advantage with intact auditory stimuli. In: Hearing by Eye: The Psychology of Lip-reading (Dodd B, Campbell R, eds), pp 97-113. London: Lawrence Erlbaum Associates.
Remez RE, Rubin PE, Pisoni DB, Carrell TD (1981) Speech perception without traditional speech cues. Science 212:947-949.
Rinne T, Alho K, Alku P, Holi M, Sinkkonen J, Virtanen J, Bertrand O, Näätänen R (1999) Analysis of speech sounds is left-hemisphere predominant at 100-150ms after sound onset. NeuroReport 10:1113-1117.
Rizzolatti G, Fogassi L, Gallese V (2001) Neurophysiological mechanisms underlying the understanding and imitation of action. Nat Rev Neurosci 2:661-670.
Robert-Ribes J, Schwartz JL, Lallouache T, Escudier P (1998) Complementarity and synergy in bimodal speech: auditory, visual, and audio-visual identification of French oral vowels in noise. J Acoust Soc Am 103:3677-3689.
Rockland KS, Ojima H (2003) Multisensory convergence in calcarine visual areas in macaque monkey. Int J Psychophysiol 50:19-26.
Roland PE, Zilles K (1996) The developing European computerized human brain database for all imaging modalities. NeuroImage 4:39-47.
Romanski LM, Tian B, Fritz J, Mishkin M, Goldman-Rakic PS, Rauschecker JP (1999) Dual streams of auditory afferents target multiple domains in the primate prefrontal cortex. Nat Neurosci 2:1131-1136.
Rossi S, Tecchio F, Pasqualetti P, Ulivelli M, Pizzella V, Romani GL, Passero S, Battistini N, Rossini PM (2002) Somatosensory processing during movement observation in humans. Clin Neurophysiol 113:16-24.
Sams M, Aulanko R, Aaltonen O, Näätänen R (1990) Event-related potentials to infrequent changes in synthesized phonetic stimuli. J Cogn Neurosci 2:344-357.
Sams M, Aulanko R, Hamalainen M, Hari R, Lounasmaa OV, Lu ST, Simola J (1991) Seeing speech: visual information from lip movements modifies activity in the human auditory cortex. Neurosci Lett 127:141-145.
Santi A, Servos P, Vatikiotis-Bateson E, Kuratate T, Munhall K (2003) Perceiving biological motion: dissociating visible speech from walking. J Cogn Neurosci 15:800-809.
Schnitzler A, Witte OW, Cheyne D, Haid G, Vrba J, Freund HJ (1995) Modulation of somatosensory evoked magnetic fields by sensory and motor interfaces. NeuroReport 6:1653-1658.
Schormann T, Henn S, Zilles K (1996) A new approach to fast elastic alignment with applications to human brains. Lect Notes Comp Sci 1131:337-342.
Schroeder CE, Foxe JJ (2002) The timing and laminar profile of converging inputs to multisensory areas of the macaque neocortex. Brain Res Cogn Brain Res 14:187-198.
Schroeder CE, Foxe JJ (2004) Multisensory Convergence in Early Cortical Processing. In: The Handbook of Multisensory Processes (Calvert G, Spence C, Stein BE, eds), pp 295-310. Cambridge, Massachusetts: The MIT Press.
Schroeder CE, Smiley J, Fu KG, McGinnis T, O'Connell MN, Hackett TA (2003) Anatomical mechanisms and functional implications of multisensory convergence in early cortical processing. Int J Psychophysiol 50:5-17.
Schwartz J-L, Robert-Ribes J, Esculier P (1998) Ten years after summerfield: a taxonomy of models for audiovisual fusion in speech perception. In: Hearing by Eye 2: Advantages in the Psychology of Speechreading and Auditory-
55
Visual Speech (Campbell R, Dodd B, Burnham D, eds). Hove, UK: Psychology Press Ltd.
Scott SK, Johnsrude IS (2003) The neuroanatomical and functional organization of speech perception. Trends Neurosci 26:100-107.
Scott SK, Wise RJ (2004) The functional neuroanatomy of prelexical processing in speech perception. Cognition 92:13-45.
Scott SK, Blank CC, Rosen S, Wise RJ (2000) Identification of a pathway for intelligible speech in the left temporal lobe. Brain 123:2400-2406.
Sekiyama K, Kanno I, Miura S, Sugita Y (2003) Audio-visual speech perception examined by fMRI and PET. Neurosci Res 47:277-287.
Sharma A, Dorman MF (1999) Cortical auditory evoked potential correlates of categorical perception of voice-onset time. J Acoust Soc Am 106:1078-1083.
Sharma A, Kraus N, McGee T, Carrell T, Nicol T (1993) Acoustic versus phonetic representation of speech as reflected by the mismatch negativity event-related potential. Electroencephalogr Clin Neurophysiol 88:64-71.
Stein BE, Meredith MA (1993) Merging of the senses. Cambridge, Massachusetts: The MIT Press.
Stein BE, Jiang H, Stanford TE (2004) Multisensory integration in single neurons of the midbrain. In: The Handbook of Multisensory Processes (Calvert G, Spence C, Stein BE, eds), pp 243-264. Cambridge, Massachusetts: The MIT Press.
Stekelenburg JJ, Vroomen J, de Gelder B (2004) Illusory sound shifts induced by the ventriloquist illusion evoke the mismatch negativity. Neurosci Lett 357:163-166.
Stevens KN, Klatt DH (1974) Role of formant transitions in the voiced-voiceless distinction for stops. J Acoust Soc Am 55:653-659.
Sumby WH, Pollack I (1954) Visual contribution to speech intelligibility in noise. J Acoust Soc Am 26:212-215.
Summerfield Q (1987) Some preliminaries to a comprehensive account of audio-visual speech perception. In: Hearing by Eye: The Psychology of Lip-reading (Dodd B, Campbell R, eds), pp 3-51. London: Lawrence Erlbaum Associates.
Summerfield Q, McGrath M (1984) Detection and resolution of audio-visual incompatibility in the perception of vowels. Quart J Exp Psych 36A:51-74.
Talairach J, Tournoux P (1988) Co-planar stereotaxic atlas of the human brain. Stuttgart: Thieme.
Tales A, Newton P, Troscianko T, Butler S (1999) Mismatch negativity in the visual modality. NeuroReport 10:3363-3367.
Tarkiainen A, Liljeström M, Seppä M, Salmelin R (2003) The 3D topography of MEG source localization accuracy: effects of conductor model and noise. Clin Neurophysiol 114:1977-1992.
Trembley S, Shiller DM, Ostry OJ (2003) Somatosensory basis of speech production. Nature 423:866-869.
Tuomainen J, Andersen T, Tiippana K, Sams M (in press) Audio-visual speech perception is special. Cognition.
Ungerleider LG, Mishkin, M (1982) Two cortical visual systems. In Analysis of visual behavior (Ingle DJ, Goodale MA, Mansfield, RJW, eds), pp 549-586. Cambridge, MA: MIT Press.
Uutela K, Hämäläinen M, Somersalo E (1999) Visualization of magnetoencephalographic data using minimum current estimates. NeuroImage 10:173-180.
56
van Atteveldt N, Formisano E, Goebel R, Blomert L (2004) Integration of letters and speech sounds in the human brain. Neuron 43:271-282.
Watkins K, Paus T (2004) Modulation of motor excitability during speech perception: the role of Broca's area. J Cogn Neurosci 16:978-987.
Watkins KE, Strafella AP, Paus T (2003) Seeing and hearing speech excites the motor system involved in speech production. Neuropsychologia 41:989-994.
Welch RB, Warren DH (1986) Intersensory interactions. In: Handbook of Perception and Human Performance: Vol. 1. Sensory Processes and Perception (Boff KR, Kaufman L, Thomas JP, eds), pp 25.21-25.36. New York: Wiley.
Wilson SM, Saygin AP, Sereno MI, Iacoboni M (2004) Listening to speech activates motor areas involved in speech production. Nat Neurosci 7:701-702.
Winkler I, Kujala T, Tiitinen H, Sivonen P, Alku P, Lehtokoski A, Czigler I, Csepe V, Ilmoniemi RJ, Naatanen R (1999) Brain responses reveal the learning of foreign language phonemes. Psychophysiol 36:638-642.
Woods RP, Grafton ST, Watson JD, Sicotte NL, Mazziotta JC (1998) Automated image registration: II. Intersubject validation of linear and nonlinear models. J Comp Assist Tomogr 22:153-165.
Vouloumanos A, Kiehl KA, Werker JF, Liddle PF (2001) Detection of sounds in the auditory stream: event-related fMRI evidence for differential activation to speech and nonspeech. J Cogn Neurosci 13:994-1005.
Wright TM, Pelphrey KA, Allison T, McKeown MJ, McCarthy G (2003) Polysensory interactions along lateral temporal regions evoked by audiovisual speech. Cereb Cortex 13:1034-1043.
Zatorre RJ, Belin P (2001) Spectral and temporal processing in human auditory cortex. Cereb Cortex 11:946-953.
Zatorre RJ, Evans AC, Meyer E, Gjedde A (1992) Lateralization of phonetic and pitch discrimination in speech processing. Science 256:846-849.
Zimmerman JE, Thiene P, Harding JT (1970) Design and operation of stable rf-biased superconducting point-contact quantum devices and a note on the properties of perfectly clean metal contacts. J Appl Phys 41:1572-1580.