cost distribution resource allocations (1st sem 2013-14)
DESCRIPTION
management civil unitenTRANSCRIPT
COST DISTRIBUTION AND RESOURCE ALLOCATIONS
1. Objectives
After studying this topic, students are expected to understand and able to apply the following topics:
Develop cost distribution histogram and graph.
Improve resource allocation and distribution.
2. Cost Distribution
Management of projects requires the knowledge of cost distribution with respect to time and the cost distribution of an activity over the duration of the activity.
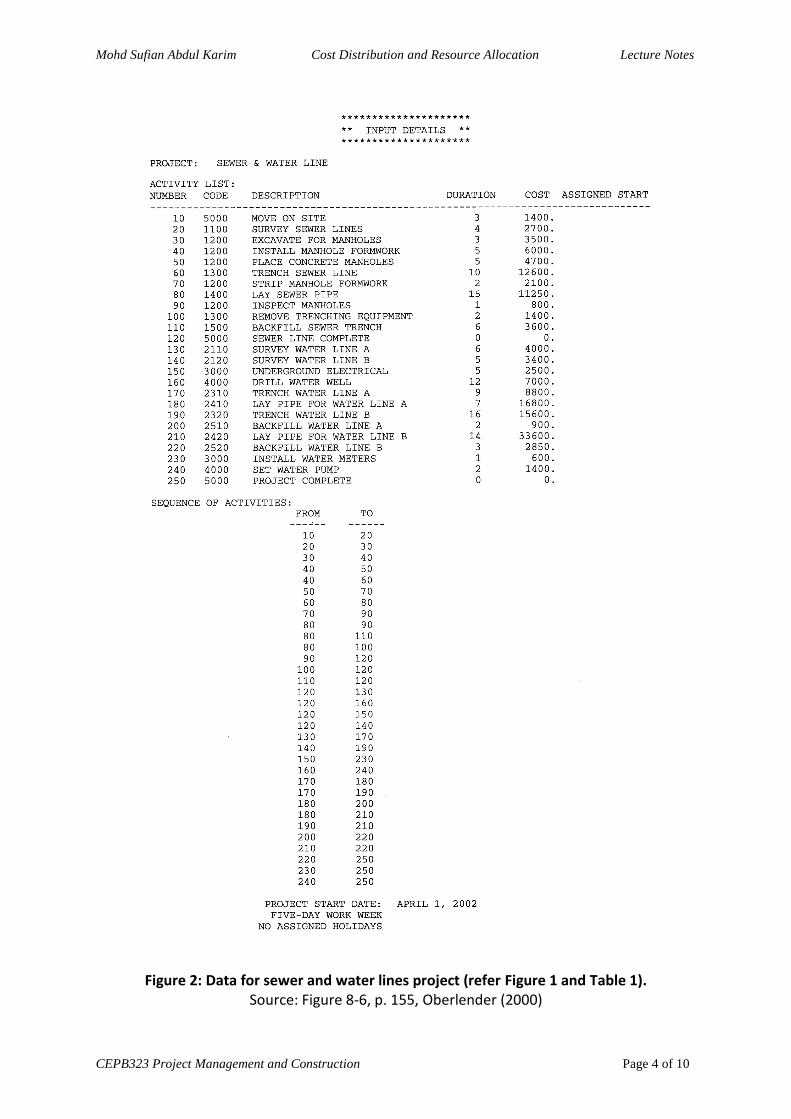
A sewer and water lines project is used as an example. The CPM Precedence Diagram for the project is illustrated in Figure 1. The data for the CPM Precedence Diagram is listed in Figure 2. Note that the activity number, description and duration in Figure 2 correspond to the same set of data in Figure 1. Activity cost is added as a new set of data in Figure 2.
The daily cost, cumulative cost and cost percentage for the project are then determined and as listed in Table 1. With reference to Table 1 and the Precedence Diagram (Figure 1), note that activity no. 10 as an example, covers the first 3 days of the project and therefore the daily cost is calculated by dividing the activity cost by 3 days = $1,400/3 = $466.67 / day.
A histogram (refer to Figure 3) can be constructed based on project cost / day data from Table 1 to illustrate the daily project cost distribution. This histogram can be analyzed to determine periods of time when the need for cost financing is high or low. Similar histograms for other resources such as labor and equipment can also be produced. The project manager can use the histogram to detect problems due to these situations early and therefore make the necessary adjustments to the project plan.
An activity may be performed over a range of time: starting from early to late start and completing from early to late finish. The activity costs used in Figure 2 and Table 1 are based on the target schedule for the project which is the midpoint between Early Start time and Late Start time of each activity. There may be different values of activity cost based on Early Start time and Late Start time, and Figure 4 lists the corresponding daily cost and cumulative cost of the project based on Early Start time and Late Start time of each activity.
Figure 5 shows the cumulative cost graph for the sewer and water lines project that was constructed using the cumulative costs based on Early Start, Late Start and Target Schedule data in Figure 4. The graph is also known as the S-curve because of the S shape of the graph. It links two basic elements of a project: time and cost and describes the plan to spend the project budget throughout the project duration. Project expenditure

Mohd Sufian Abdul Karim Cost Distribution and Resource Allocation Lecture Notes
CEPB323 Project Management and Construction Page 2 of 10
would be targeted along the Target curve and within the envelope formed by the Early Start curve and Late Start curve.
3. Resource Allocations
The required, correct and appropriate quantity and quality of resources – materials, labour, equipment, etc. – must be ordered, delivered and available at the construction site at the right time to ensure efficiency and effectiveness of resource utilization. The demand and allocation of resources must be uniformly distributed throughout the project period to prevent unwanted irregularities.
Figure 6 is an example of a resource plan that shows data for labor utilization for a project as a bar chart (above part) and the lower part is a histogram that illustrates the irregular distribution of workers per day during the middle duration of the project. The histogram in Figure 7 shows an improved resource plan that has a relatively uniform distribution of labour throughout the project duration. This is accomplished by starting activity F one day later and starting activity H two days earlier (refer to the bar chart) because these activities have enough float for these changes to be done. These changes would not be possible if activities F and H were critical activities.
Reference
1. Oberlender, G. D. (2000); Project Management for Engineering and Construction; 2nd Edition, McGraw-Hill.

Mohd Sufian Abdul Karim Cost Distribution and Resource Allocation Lecture Notes
CEPB323 Project Management and Construction Page 3 of 10
Figures & Tables
Figure 1: Precedence Diagram for construction of sewer and water lines project.
Source: Figure 8-5, p. 154, Oberlender (2000)
Mohd Sufian Abdul Karim Cost Distribution and Resource Allocation Lecture Notes
CEPB323 Project Management and Construction Page 4 of 10
Figure 2: Data for sewer and water lines project (refer Figure 1 and Table 1).
Source: Figure 8-6, p. 155, Oberlender (2000)

Mohd Sufian Abdul Karim Cost Distribution and Resource Allocation Lecture Notes
CEPB323 Project Management and Construction Page 5 of 10
Table 1: Cost calculations and data for Figures 1 and 2.
Source: Table 8-5, p. 160, Oberlender (2000)

Mohd Sufian Abdul Karim Cost Distribution and Resource Allocation Lecture Notes
CEPB323 Project Management and Construction Page 6 of 10
Figure 3: Daily distribution of costs for sewer and water lines project.
Source: Figure 8-10, p. 161, Oberlender (2000)

Mohd Sufian Abdul Karim Cost Distribution and Resource Allocation Lecture Notes
CEPB323 Project Management and Construction Page 7 of 10
Figure 4: Daily costs and cumulative costs for all activities of sewer and water lines project
based on Early Start, Late Start and target schedule.
Source: Figure 8-11, p. 162, Oberlender (2000)

Mohd Sufian Abdul Karim Cost Distribution and Resource Allocation Lecture Notes
CEPB323 Project Management and Construction Page 8 of 10
Figure 5: S-curve for cumulative cost curve based on early start, late start
and target schedule.
Source: Figure 8-12, p. 163, Oberlender (2000)

Mohd Sufian Abdul Karim Cost Distribution and Resource Allocation Lecture Notes
CEPB323 Project Management and Construction Page 9 of 10
Figure 6: Irregular distribution of labour.
Source: Figure 8-13, p. 166, Oberlender (2000)

Mohd Sufian Abdul Karim Cost Distribution and Resource Allocation Lecture Notes
CEPB323 Project Management and Construction Page 10 of 10
Figure 7: Distribution of labor after starting activity F one day later and activity H two days earlier
Source: Figure 8-14, p. 167, Oberlender (2000)
Latest update: 21st
August, 2013