cost-effectiveness of screening for bowel cancer · · 2018-02-26cost effectiveness of screening...
TRANSCRIPT

Cost-effectiveness of screening for bowel cancer The Gut Foundation
19 June 2011

Cost effectiveness of screening for bowel cancer
Contents Glossary ..................................................................................................................................... i
Executive Summary .................................................................................................................... i
1 Background ..................................................................................................................... 1
1.1 Bowel cancer in Australia .................................................................................................. 1
1.2 Risk factors for bowel cancer............................................................................................. 3
1.2.1 Hereditary syndromes and predisposing conditions........................................... 3
1.2.2 Lifestyle factors................................................................................................. 3
1.2.3 Dietary factors .................................................................................................. 4
1.2.4 Medications ...................................................................................................... 5
1.3 Screening for bowel cancer ............................................................................................... 5
1.3.1 Faecal occult blood tests (FOBTs) ...................................................................... 5
1.3.2 Colonoscopy screening ..................................................................................... 6
1.3.3 Computed tomographic colonography (virtual colonoscopy) ............................. 6
1.3.4 Flexible sigmoidoscopy ..................................................................................... 7
2 Cost effectiveness analyses ............................................................................................. 8
2.1 iFOBT screening: annual and biennial ................................................................................ 9
2.1.1 Description of intervention ............................................................................... 9
2.1.2 Target population and reach ............................................................................. 9
2.1.3 Effectiveness and adverse events from screening ............................................ 10
2.1.4 Detected bowel cancer cases – parameters for each pathway ......................... 11
2.1.5 Costs of intervention: mail-out of kits and health care costs ............................ 12
2.1.6 Financial cost savings from iFOBT screening .................................................... 13
2.1.7 Net DALYs averted with screening ................................................................... 15
2.1.8 Modelling results ............................................................................................ 15
2.2 Colonoscopy screening .................................................................................................... 21
2.2.1 Description of intervention ............................................................................. 21
2.2.2 Target population and reach ........................................................................... 21
2.2.3 Effectiveness and adverse events from screening ............................................ 22
2.2.4 Detected bowel cancer cases – parameters ..................................................... 23
2.2.5 Costs of intervention: mail-out and health care costs ...................................... 23
2.2.6 Financial cost savings from colonoscopy screening .......................................... 23
2.2.7 Net DALYs averted with screening ................................................................... 23
2.2.8 Modelling results ............................................................................................ 24

Cost effectiveness of screening for bowel cancer
Deloitte Access Economics
2.3 Sensitivity analysis .......................................................................................................... 26
3 Conclusions ................................................................................................................... 29
References .............................................................................................................................. 30
Charts Chart 1.1 : Leading causes of cancer death in Australia, 2007 .................................................... 1
Chart 1.2 : Bowel cancer incidence rates by stage, age and gender ........................................... 2
Tables Table 2.1 : Sensitivity, specificity, mortality and incidence efficacy parameters - iFOBT ........... 11
Table 2.2 : Bowel cancer incidence rates by age and gender ................................................... 12
Table 2.3 : Cost elements of iFOBT screening, per cost element .............................................. 12
Table 2.4 : Financial lifetime costs per case of bowel cancer.................................................... 13
Table 2.5 : Bowel cancer treatment costs by stage, past Australian survey .............................. 13
Table 2.6 : Estimated bowel cancer treatment costs by stage in 2011 ..................................... 14
Table 2.7 : NBCSP – bowel cancer stage distribution, screened versus unscreened.................. 14
Table 2.8 : Five year relative survival rates for bowel cancer (1984-2004) ............................... 15
Table 2.9 : Biennial iFOBT screening – modelling parameters, estimates and results, 2011 ...... 17
Table 2.10 : Annual iFOBT screening – modelling parameters, estimates and results, 2011 ..... 19
Table 2.11 : Sensitivity, specificity, mortality and incidence efficacy parameters colonoscopy . 22
Table 2.12 : Cost elements of colonoscopy screening, per cost element .................................. 23
Table 2.13 : Colonoscopy screening – modelling parameters, estimates and results, 2011 ...... 25
Table 2.14 : Bowel cancer stage distribution of gFOBT screened cases, UK pilot programs ...... 27
Table 2.15 : Bowel cancer stage distribution of colonoscopy screened cases, Germany ........... 27
Table 2.16 : Sensitivity analysis – cancer stage distribution data, ICER results .......................... 28

Cost effectiveness of screening for bowel cancer
Liability limited by a scheme approved under Professional Standards Legislation. Deloitte refers to one or more of Deloitte Touche Tohmatsu Limited, a UK private company limited by guarantee, and its network of member firms, each of which is a legally separate and independent entity. Please see www.deloitte.com/au/about for a detailed description of the legal structure of Deloitte Touche Tohmatsu Limited an d its member firms. © 2011 Deloitte Access Economics Pty Ltd
Glossary ABS Australian Bureau of Statistics ACPS Australian Clinico Pathological Staging (system) AIHW Australian Institute of Health and Welfare AWE average weekly earnings BMI body mass index BoD burden of disease CEA cost effectiveness analysis CT computed tomography/tomographic DALY disability adjusted life year DOFD Department of Finance and Deregulation DoHA Department of Health and Ageing DWL deadweight losses FAP familial adenomatous polyposis FOBT faecal occult blood test FS flexible sigmoidoscopy GDP gross domestic product gFOBT guaiac faecal occult blood test GP general practitioner GESA Gastroenterological Society of Australia HNPCC hereditary non-polyposis bowel cancer ICER incremental cost effectiveness ratio iFOBT immunochemical faecal occult blood test LYS life year saved MBS Medicare Benefits Schedule NBCSP National Bowel Cancer Screening Program ng/mL nanograms per millilitre NHS National Health Survey NRCP National Respite for Carers Program NSAIDs non-steroidal anti-inflammatory drugs OECD Organization for Economic Cooperation and Development QALY quality adjusted life year RCT randomised controlled trial RR relative risk VSL(Y) value of a statistical life (year) WHO World Health Organization YLD years of healthy life lost due to disability YLL years of life lost due to premature mortality

Cost effectiveness of screening for bowel cancer
i Deloitte Access Economics
Executive Summary This report provides a cost effectiveness analysis (CEA) of bowel cancer screening relative to the comparator of ‘no screening’. From the CEA we draw conclusions regarding different screening interventions and the benefits they have for the Australian population.
Australia has one of the highest rates of bowel cancer in the world. It is the second most commonly diagnosed cancer nationally and the second single leading cause of cancer death (AIHW, 2010). There were an estimated 14,234 new cases of bowel cancer in 2007 and 4,047 deaths that year from the disease. Most bowel cancers originate from the development of polyps inside the colon or rectum although not all polyps become malignant (DOHA, 2009).
Bowel cancer predominately affects older people, although the development of bowel cancer typically results from a complex interaction between genetic and environmental influences. These include:
family history – genetic factors (Askling et al, 2001; Newcomb et al, 1999; Steward and Kleihues, 2003);
lifestyle factors – physical inactivity (Levin 2006), high levels of cigarette smoking (Levin, 2006; Tsoi et al, 2009) and obesity (Huxley et al, 2009);
diet – high levels of red and processed meat (Norat et al, 2005) and alcohol (Huxley et al, 2009), low dietary fibre (Howe et al, 1992) and vegetable/fruit intake (Potter, 1995); and
medications – recent users of postmenopausal hormone therapy (Nanda et al, 1999) and nonsteroidal anti-inflammatory drugs (NSAIDs).
Bowel cancer screening interventions have been shown – across many studies – to be cost effective (e.g. Bolin et al, 1999). One form of CEA is cost utility analysis (CUA) which uses the outcome metric ‘disability adjusted life years’ (DALYs) averted1. This metric allows for the measurement from better survival (i.e. ‘survival efficacy’) and better quality of life arising from early intervention.
A PICO (Population, Intervention, Comparator and Outcomes) approach was adopted for the CEA. The bowel cancer screening interventions compared with the protocol of ‘no screening’ comprised:
1. biennial iFOBT screening starting at age 40 and ceasing at age 70 (Section 2.1);
2. annual iFOBT screening starting at age 40 and ceasing at age 70 (Section 2.1); and
3. colonoscopy screening at age 40, then at age 50, and then at 5-yearly intervals after age 50 ceasing at age 70 (Section 2.2).
These data were analysed based on parameter estimates from the literature as summarised in the body of the report – sensitivity and specificity of screening tests, their efficacy in reducing incidence and mortality (by age), cancer incidence and mortality rates by age, gender and stage of cancer, adverse event rates and costs, and unit costs and DALYs for
1 DALYs = years of life lost (YLL) + years of healthy life lost due to disability (YLD)

Cost effectiveness of screening for bowel cancer
ii Deloitte Access Economics
screening and treatment intervention pathways. The analysis was used to estimate the incremental cost effectiveness ratios (ICERs) for each pathway, specifically the cost per DALY averted by the screening intervention.
The World Health Organization (WHO) makes recommendations in relation to ICER benchmarks, based on the recommendations of the Commission on Macroeconomics and Health, using Gross Domestic Product (GDP) as a readily available indicator to derive the following three categories of cost-effectiveness (WHO, 2011):
highly cost-effective: less than GDP per capita i.e. in Australia less than $60,000/DALY averted approximately;
cost-effective: between one and three times GDP per capita i.e. in Australia between $60,000 and $180,000/DALY averted approximately; and
not cost-effective: more than three times GDP per capita in Australia over $180,000/DALY averted approximately.
For biennial iFOBT screening the CEA shows that the net financial cost of biennial iFOBT screening was $103.1 million, together with a gain of 4,798 DALYs. From a societal perspective, the ICER of this screening program is $21,490/DALY averted, and $27,620/DALY averted from a health care perspective.
For annual iFOBT screening the CEA shows that the net financial cost of annual iFOBT screening was $149.8 million, together with a gain of 15,756 DALYs. From a societal perspective, the ICER of this screening program is $9,510/DALY averted, and $15,719/DALY averted from a health care perspective.
For colonoscopy screening the CEA shows that the net financial cost of colonoscopy screening was $196.9 million, together with a gain of 4,805 DALYs. From a societal perspective, the ICER of this screening program is $40,978/DALY averted, and $49,894/DALY averted from a health care perspective.
The results show that annual and biennial iFOBT as well as colonoscopy screening represent value for money at the individual and Australian healthcare system level. This finding was robust when international cancer incidence data by stage were used in sensitivity analysis. Population-based screening for Australians aged 40 to 70 years is cost-effective, with annual iFOBT screening followed by a colonoscopy and treatment for positive iFOBT being the most cost effective screening option.
Deloitte Access Economics

Cost effectiveness of screening for bowel cancer
1 Deloitte Access Economics
1 Background
1.1 Bowel cancer in Australia
Bowel cancer (also known as colorectal cancer) refers to malignant growth that develops most commonly in the lining of the large bowel. Most bowel cancers originate from the development of polyps inside the colon or rectum.
There are two main types of polyps, adenomatous and hyperplastic polyps. Adenomatous polyps (also known as adenomas) make up two-thirds of colon polyps (Charette et al, 2011). Although most of adenomatous polyps do not become cancerous, they have the potential to develop into cancer. On the other hand, hyperplastic polyps rarely become malignant (Charette et al, 2011). Approximately half of all Australians are likely to develop a bowel polyp during their lifetime (GESA, 2006).
The removal of polyps (polypectomy) is commonly performed using a colonoscope during a colonoscopy. Rarely, a polyp will be too large for removal during colonoscopy, in which case it may be removed as a surgical procedure. Once the polyp is removed from the bowel it can no longer develop into cancer (DOHA, 2009). Bowel cancer is, therefore, one of the most preventable types of cancer if detected early (Bowel Cancer Australia, 2010). Despite this, Australia still has one of the highest rates of bowel cancer in the world. The latest statistics show that bowel cancer is the second most commonly diagnosed cancer in Australia and second single leading cause of cancer death (AIHW, 2010) (Chart 1.1). There were an estimated 14,234 new cases of bowel cancer in 2007 and 4,047 deaths that year from the disease.
Chart 1.1: Leading causes of cancer death in Australia, 2007
7,626
4,0472,938 2,680 2,552 2,248
1,459
16,334
0
2,000
4,000
6,000
8,000
10,000
12,000
14,000
16,000
18,000
Lung
Bow
el
Pros
tate
Brea
st
Lym
phoi
d
Panc
reas
Mye
loid
All
othe
r ca
ncer
s
Deaths
Source: AIHW (2010).

Cost effectiveness of screening for bowel cancer
2 Deloitte Access Economics
Bowel cancer predominantly affects older people, with most cases occurring in those beyond retirement age. In 2007, bowel cancer incidence rates in Australia were 75 cases per 100,000 males, and 50 cases per 100,000 females (AIHW, 2010). For males, the risk of being diagnosed with bowel cancer in 2007 was 1 in 18 before the age of 75 years and 1 in 10 before the age of 85 years. For females, the risk was 1 in 26 before the age of 75 years and 1 in 14 before the age of 85 years.
Incidence rates for bowel cancer and progressive adenomas, by age, gender and disease stage are presented in Chart 1.2, derived from Australian Institute of Health and Welfare (AIHW) and NSW Cancer Registry data (Access Economics, 2007) for the year 2001. This older data enables a detailed breakdown of bowel cancer incidence for different bowel cancer stages before the implementation of the National Bowel Cancer Screening Program (NBCSP), in order to compare a ‘no screening’ pathway. As the NBCSP Pilot Program began in 2002, incidence data after 2001 includes the impact of NBCSP screening and treatment for since them.
Chart 1.2 shows the rising risk of bowel cancer rises with age for males and females, with those aged over 50 years at higher risk (Steward and Kleihues, 2003; Weitz et al, 2005).
Chart 1.2: Bowel cancer incidence rates by stage, age and gender
Source: Derived from NSW Cancer Institute (2006). * Left panel – females; right panel – males.
In Australia, the staging system for bowel cancer is in accordance with the Australian Clinico Pathological Staging (ACPS) system. Under the ACPS system, bowel cancers are grouped into four stages (Cancer Council Victoria, 2011):
Stage A (Stage 1): the cancer is confined to the bowel wall;
Stage B (Stage 2): the cancer has spread to the outer surface of the bowel wall but no further;
Stage C (Stage 3): the cancer is found in lymph nodes near the bowel; and
Stage D (Stage 4): the cancer is found at distant sites, for example, in the liver or lungs.
The AIHW and NSW Cancer Institute datasets broadly define bowel cancer stages as local, regional and distal (or metastatic). Local bowel cancer aligns with stages A and B in ACPS

Cost effectiveness of screening for bowel cancer
3 Deloitte Access Economics
classification system, regional bowel cancer aligns with stage C and distal bowel cancer aligns with stage D (personal communication, Professor Terry Bolin, 7 April, 2010).
1.2 Risk factors for bowel cancer
As with many other cancers, the development of bowel cancer typically results from a complex interaction between genetic and environmental influences. These are described below.
1.2.1 Hereditary syndromes and predisposing conditions
Although as many as 25% of patients with bowel cancer have a family history of the disease, suggesting the involvement of a genetic factor (Levin, 2006), genetic factors only play a partial role in those patients developing cancer. While positive family history raises the possibility of a genetic factor (Askling et al, 2001; Newcomb et al, 1999; Steward and Kleihues, 2003), it may also reflect common exposure to environmental factors (toxins, dietary factors, common lifestyle, and so on). Where genetic factors have been identified (there may be other, possibly weaker, as yet unidentified genetic factors as well), inherited colon cancers can generally be classified as either familial adenomatous polyposis (FAP)2 or the more common hereditary non-polyposis bowel cancer (HNPCC)3. Collectively, these account for between 3% and 6% of bowel cancers in Western countries (Liu et al, 1996) i.e. about 20% of cases where there is an obvious family history.
Certain existing conditions may increase the risk of bowel cancer in patients. Relative risk of bowel cancer is significantly raised in those with Crohn’s disease (Canavan et al, 2006; Jess et al, 2005). A meta-analysis of international studies found that the overall combined risk of bowel cancer in Crohn’s disease was more than two and a half times that of the general population (Canavan et al, 2006).
Diabetes has also been found to significantly increase the risk of bowel cancer by 20% (Huxley et al, 2009). The association between ulcerative colitis and colorectal cancer has also been confirmed in many studies from different countries. The quantitative estimates of the relative risk of colorectal cancer in patients with ulcerative colitis, however, are varied (Ekbom et al, 1990b).
1.2.2 Lifestyle factors
Numerous lifestyle factors may be implicated in the aetiology of bowel cancer.
Physical activity: A number of studies have shown an inverse relationship between physical activity and colon cancer incidence (Levin 2006), although the precise
2 FAP is an autosomal disorder characterised by the appearance of thousands of adenomatous polyps, each typically smaller than 1cm in diameter, throughout the entire large bowel (Levin, 2006). FAP is due to a germline mutation in the APC gene, affecting all cells in the body. Loss, mutation or silencing of the second allele in the colonic cells and other tissues leads to neoplastic growth, as the suppressor function of the APC gene is entirely lost from those cells sustaining the second hit.
3 Like FAP, HNPCC is an autosomal dominant disorder. However, in contrast to FAP, it is associated with an unusually high frequency of cancers in the proximal large bowel. There is also evidence of an association between bowel cancer and either endometrial or ovarian carcinomas in women (Levin, 2006).

Cost effectiveness of screening for bowel cancer
4 Deloitte Access Economics
mechanism through which physical activity provides protection is unknown (it may be linked to effects of colonic mucosal prostaglandins). Individuals reporting the highest levels of physical activity, recreational or otherwise, have been found to have a 20% lower risk of bowel cancer compared with the most sedentary individuals (Huxley et al, 2009).
Cigarette smoking: There is evidence of an elevated risk of adenomas for cigarette smokers, but the evidence is less certain for bowel cancer (Levin, 2006; Tsoi et al, 2009)
Obesity and overweight: BMI is the most commonly used measure of obesity and overweight and is calculated as the ratio of weight in kilograms to the square of height in metres i.e., BMI = weight/(height)2. A recent meta-analysis including 18 cohort studies and 57,985 individuals found that individuals with a BMI > 30 had a 20% greater risk of bowel cancer compared to individuals with a BMI < 25 (Huxley et al, 2009). Previous Australian analysis found that the risk of bowel cancer was increased 1.2 times by being overweight (BMI of 25-29) and 1.4 times by obesity (BMI of 30 or higher) (Mathers et al, 1999).
1.2.3 Dietary factors
A number of dietary elements have been researched and some solid relationships established.
Meat: Results from cohort studies, including the largest study of diet and nutrition worldwide, the European Prospective Investigation into Cancer and Nutrition, showed that eating high levels of red and processed meat increases the risk of bowel cancer (Norat et al, 2005). However, the Australian Polyp Prevention trial, which tested a low fat diet with retention of red meat, in association with a wheat bran supplement, showed a complete and significant reduction in large adenoma development compared to a control diet, within the higher ranking design of a randomised controlled trial (RCT). A recent international meta-analysis of 26 studies found that individuals in the highest level meat intake group had a significant 20% increased risk for developing bowel cancer, compared to those in the lowest meat intake group (Huxley et al, 2009).
Dietary fibre: Fibre binds bile acids, reduces transit time, increases stool bulk, ferments volatile fatty acids which may be directly anticarcinogenic and which, by lowering pH, may reduce the conversion of primary to secondary bile acids (Potter, 1995). It is through these mechanisms that low fibre intake has been linked to bowel cancer. A meta-analysis of 13 case-control studies from nine countries concluded that intake of fibre rich foods is inversely related to cancers of both the colon and rectum (Howe et al, 1992). Findings from the European Prospective Investigation into Cancer and Nutrition, a prospective study from 10 European countries with 1,721 cases of bowel cancer, found a significant inverse association of dietary fibre and bowel cancer (Bingham et al, 2003).
Vegetables and fruit: The evidence suggesting that increased intake of fruit and vegetables reduces the risk of bowel cancer is not entirely conclusive. A recent meta-analysis (Huxley et al, 2009) found no significant association between fruit and vegetable consumption and risk of bowel cancer. However an older review (Potter, 1995) reported that of 29 studies reviewed, 24 reported an inverse association between bowel cancer risk and vegetable intake.

Cost effectiveness of screening for bowel cancer
5 Deloitte Access Economics
Alcohol: There is evidence to suggest alcohol is a significant risk factor for bowel cancer (Bongaerts et al, 2008; Cho et al, 2004; Huxley et al, 2009). One pooled analysis reported a 16% increase in the risk of bowel cancer in people drinking more than 30g alcohol a day, and a 40% increase for more than 45g alcohol a day (Cho et al, 2004). Another recent analysis (Huxley et al, 2009) also suggested a significant association between bowel cancer risk and alcohol consumption. This study found that individuals consuming the most alcohol had a 60% greater bowel cancer risk compared to non- or light drinkers.
Calcium: A modest, inverse relationship has been found between calcium intake and cancer risk, with the likely causal mechanism being indirect inhibition of bowel cancer by binding bile acids into insoluble soaps, thereby blocking contact with the luminal epithelium (Levin, 2006).
1.2.4 Medications
Postmenopausal hormone therapy: In a meta-analysis of 18 epidemiological studies, postmenopausal hormone therapy was associated with a 33% reduction in the risk of colon cancer in recent users; the relative risk was 0.67, compared with a relative risk of 0.92 in women who had used hormone therapy more than one year ago (Nanda et al, 1999). Hormone therapy may also protect against adenoma formation.
Nonsteroidal anti-inflammatory drugs (NSAIDs): There is epidemiological evidence of reduction in the incidence of colorectal adenomas, bowel cancer and colon cancer mortality associated with the use of NSAIDs (Levin, 2006).
1.3 Screening for bowel cancer
Bowel cancer can be treated successfully if detected in its early stages, but currently fewer than 40% of bowel cancers are detected early (DOHA, 2009). The following sections outline types of bowel cancer screening procedures. There is a wide range of options available for bowel cancer screening and the cost, efficacy and practicality of these options vary considerably. The method of population screening adopted, be it a single test or a multi-staged approach, will depend on the constraints and objectives of the screening program as well as the characteristics of the specific population.
1.3.1 Faecal occult blood tests (FOBTs)
Bowel cancers and their precursor adenomas may release microscopic amounts of blood into the bowel motion and tests that examine the stool for the presence of this blood are called faecal occult blood tests (FOBTs). Two widely used forms of FOBT include guaiac FOBT (gFOBT) and immunochemical FOBT (iFOBT).
The gFOBT consists of cards impregnated with guaiac that, when treated with a developer containing hydrogen peroxidase, give a colour-coded result based on the presence or absence of peroxidase-like activity of the haem in the stool. The iFOBT test employs a more complex reaction using monoclonal and/or polyclonal antibodies that detect the intact globin protein portion of human haemoglobin. Those with a positive FOBT result are generally referred to further investigation by their doctor. This is usually through conventional colonoscopy, an endoscopic examination of the large colon and the distal part

Cost effectiveness of screening for bowel cancer
6 Deloitte Access Economics
of the small bowel using a flexible tube known as a colonoscope. A small video camera is attached to the colonoscope so that still images and video footage of the region can be obtained during the procedure.
Because gFOBT has a high rate of false positive results, it can incur substantial costs and use of colonoscopy resources. The iFOBT has been found to detect almost all clinically important lesions in gFOBT positive individuals, while reducing false positive results and the need for colonoscopy (Ransohoff, 2007). In Australia, the two-tiered method of iFOBT followed by general practitioner (GP) referred colonoscopy for a positive FOBT result has been implemented as the preferred screening pathway for the National Bowel Cancer Screening Program (NBCSP).
1.3.2 Colonoscopy screening
Conventional colonoscopy is the endoscopic examination of the large colon and the distal part of the small bowel using a flexible tube known as a colonoscope. A small video camera is attached to the colonoscope so that still images and video footage of the region can be obtained during the procedure. During colonoscopy, biopsies can be taken and therapeutic procedures such as removal of polyps can be performed.
Colonoscopy has a high level of accuracy (Bishop et al, 2008), although there are uncommon serious complications of colonoscopy that occur in less than one in five hundred examinations. A low risk of death of 0.01% has been reported from colonoscopy complications (Viiala et al, 2003).
Complications from colonoscopy may include (Australian Government, 2008):
intolerance of the bowel preparation causing dizziness, headaches or vomiting;
reaction to sedatives or anaesthetic;
perforation (making a hole in the bowel wall); and
major bleeding from the bowel which can occur as a result of polyps being removed.
Advantages of colonoscopy are that it allows the entire colon to be examined and allows polyps to be removed during the procedure, making it both diagnostic and therapeutic (Bolin et al, 2001). Disadvantages include need for full bowel preparation, risk of complications and time lost from work for those undergoing procedures.
Colonoscopy is considered the gold standard for bowel cancer screening although it is invasive, requires skilled medical professionals and, relative to alternatives such as FOBT, is considerably more expensive.
1.3.3 Computed tomographic colonography (virtual colonoscopy)
Computed tomographic (CT) colonography is an imaging procedure that uses computer programming to combine multiple, helical CT scans in order to create two- or three-dimensional images of the interior of a patient’s colon. CT colonography is an emerging technology, however, and evaluation of its efficacy is still underway. This procedure offers the advantage of potentially identifying cancers in the colon that may not be adequately assessed or identified by conventional endoscopy; it also offers the patient a choice regarding polypectomy and is less invasive than conventional colonoscopy. Limitations

Cost effectiveness of screening for bowel cancer
7 Deloitte Access Economics
include false positive readings, an unknown ability to detect flat adenomas (rarer and more aggressive than typical adenomatous polyps), inability to perform therapeutic procedures and potentially higher costs than conventional colonoscopy (Levin et al, 2003; Forbes et al, 2006).
1.3.4 Flexible sigmoidoscopy
Flexible sigmoidoscopy (FS) is a procedure similar to, but not the same as, a conventional colonoscopy. Preparation is easier and examination time is shorter compared with total colonoscopy, as a FS only examines up to the sigmoid, the most distal part of the colon, whereas colonoscopy examines the whole large bowel. The two are not substitutes however, as a positive FS-proven adenoma or cancer requires further evaluation with colonoscopy (Atkin et al, 2010; Olynyk et al, 2001).
Although, in absolute terms, only a relatively small section of the large intestine can be examined using sigmoidoscopy, the sites that can be observed represent areas that are affected by diseases such as colorectal cancer. As with colonoscopy, it also allows for the collection of tissue (biopsies) if it uses instruments inserted into the scope.
Advantages of FS include its relative simplicity, lack of requirement for sedation or formal preparation of the bowel (in contrast to colonoscopy procedures), less patient time away from work than colonoscopy and lower medical costs (Bolin et al, 2001). It is also deemed to have lower risk of complications. Disadvantages of FS include that it does not allow complete bowel examination and may fail to detect up to 50% of lesions (Bolin et al, 2001).

Cost effectiveness of screening for bowel cancer
8 Deloitte Access Economics
2 Cost effectiveness analyses Cost-effectiveness analyses (CEAs) compare the monetary costs of achieving a particular non-monetary objective such as deaths averted or life years saved. It is a robust and proven tool used to directly compare alternative interventions. In this paper, we adopt a PICO (Population, Intervention, Comparator and Outcomes) approach to the CEA.
P (Population) - The population in question is all Australian adults aged 40 to 70 years, based on projections from Deloitte Access Economics’ in-house demographics model (DAE-DEM)4.
I (Intervention) - The bowel cancer screening interventions considered were:
1. biennial iFOBT screening starting at age 40 and ceasing at age 70 (Section 2.1);
2. annual iFOBT screening starting at age 40 and ceasing at age 70 (Section 2.1); and
3. colonoscopy screening at age 40, then at age 50, and then at 5-yearly intervals after age 50 ceasing at age 70 (Section 2.2).
C (Comparator) was no screening and standard care when diagnosed symptomatically.
O (Outcomes) were the net financial cost in dollars and disability adjusted life years (DALYs)5, with the incremental cost effectiveness ratios (ICER) then expressed as cost per DALY averted by the screening intervention. These ICERs were estimated from two perspectives.
Health care perspective – including direct health system costs of the intervention and associated treatment only.
Societal perspective – including other financial costs such as productivity losses, informal care costs and deadweight losses (DWL).
All CEAs of the screening interventions involved an analysis of:
program costs e.g. costs of screening kits, costs of diagnostic and pathology tests;
screening results e.g. number of bowel cancer cases detected (true positives), missed (false negatives), or otherwise (false positive and true negatives)
bowel cancer stage incidence rates for true positive and false negative cancer cases;
treatment costs and health outcomes per person associated with each of the four pathways (true positive, false positive, true negative, false negative); and
overall outcomes in terms of health care cost savings and avoidance of DALYs from earlier from earlier stage detection and treatment of bowel cancer.
4 The age group of this base case intervention differs from that of the current NBCSP which provides biennial screening for Australians who turned 50 years of age between January 2008 and December 2010, and those who turned 55 or 65 between July 2008 and December 2010.
5 DALYs are the primary non-financial metric used by the World Health Organization for measuring loss of health
and wellbeing from an illness or injury.

Cost effectiveness of screening for bowel cancer
9 Deloitte Access Economics
The World Health Organization (WHO) makes recommendations in relation to cost effectiveness benchmarks, based on the recommendations of the Commission on Macroeconomics and Health, using Gross Domestic Product (GDP) as a readily available indicator to derive the following three categories of cost-effectiveness (WHO, 2011):
highly cost-effective: less than GDP per capita i.e. in Australia less than $60,000/DALY averted approximately;
cost-effective: between one and three times GDP per capita i.e. in Australia between $60,000 and $180,000/DALY averted approximately; and
not cost-effective: more than three times GDP per capita in Australia over $180,000/DALY averted approximately.
2.1 iFOBT screening: annual and biennial
2.1.1 Description of intervention
The iFOBT population recruitment and participation pathway for early detection of bowel cancer was modelled on the current National Bowel Cancer Screening Program (NBCSP). Each person in the target age group (starting at 40 years) is sent a letter inviting them to participate in the program, with a test kit. Those who choose to participate6 complete an iFOBT and send the kit to a pathology laboratory that sends results to the participant or to their general practitioner (GP) if nominated.
Those who receive a positive result are referred to see their GP within two weeks (indeterminate results are retested, but this is relatively rare and not included in the modelling). Those who received a negative result would be followed up again after a specified time interval for another test. Those who attended their GP7, if compliant, receive a referral to a specialist and a colonoscopy to either confirm or negate the FOBT result. If negated, they are followed up again at a specified time interval, but if confirmed, they have further detailed pathology and then treatment. Follow-ups for patients continue till the age of 70 years.
CEAs were conducted for annual and biennial iFOBT screening.
2.1.2 Target population and reach
There are an estimated 341,055 people aged 40 years in 2011, based on projections from Deloitte Access Economics’ in-house demographics model (DAE-DEM). This was the estimated target population for the yearly and biennial iFOBT screening interventions.
According to the Australian Institute of Health and Welfare (AIHW) (2010), 40.1% of the people invited into the NBCSP in 2008 agreed to participate. Participation by males was significantly lower than females, and participation also increased with age. Participation in iFOBT screening was modelled as 45% of the target population based on these data and on a past literature review by Access Economics (2007). It was estimated that 153,475 people aged 40 years in 2011 participate in iFOBT screening. The numbers of people participating
6 People who do not complete the FOBT within 6 weeks are sent a reminder letter.
7 Positive test results where the person does not visit a GP are actively followed up by the NBCSP registry.

Cost effectiveness of screening for bowel cancer
10 Deloitte Access Economics
at follow-up iFOBT screenings (yearly and biennial) at ages after 40 years were estimated based on the same participation rate, less those already screened with true positive results in the prior screening period.
From AIHW data (AIHW, 2010), compliance with follow-up colonoscopy treatment in the NBCSP for positive iFOBT cases was 76.3% for Australia in 2009. However, the AIHW noted that actual numbers of participant colonoscopies may have been underestimated as reporting of colonoscopy follow-up is not mandatory in the NBCSP.
Access Economics (2007) conducted past literature review on colonoscopy compliance in similar screening programs in other countries. In a UK Pilot program, colonoscopy compliance was reported as 82.8% in the second round (Weller et al, 2006). This was lower than a 93.1% compliance rate observed in an Italian Pilot (Crotta et al, 2003). Research conducted in Uruguay from June 1997 to July 2004 (Fenocchi et al, 2005) involving 11,734 participants found overall compliance with colonoscopy following a positive iFOBT result to be 75.1%. However, cultural differences are an important factor influencing compliance.
Compliance with follow-up colonoscopy treatment for positive iFOBT cases was modelled at a rounded 80%, based on the combination of the recent NBCSP data (AIHW, 2010) and the past literature review by Access Economics (2007).
2.1.3 Effectiveness and adverse events from screening
The effectiveness of bowel cancer screening was estimated based on the expected sensitivity and specificity of iFOBT testing and the savings through earlier detection – largely from better survival (i.e. ‘survival efficacy’) but also from better quality of life as some adenomas can be detected and removed prior to becoming cancerous (i.e. ‘incidence efficacy’).
Sensitivity is the ability to detect disease when disease is present (true positives), a vital measure of the test’s efficacy. Specificity is the ability to indicate no disease when no disease is present (true negatives) equally important to cost effectiveness since poor specificity leads to costly, inconvenient follow-up colonoscopy procedures and significant loss of wellbeing, reducing cost effectiveness.
Sensitivity of iFOBT screening was modelled at 60% while specificity was modelled at 95% based on a review of the literature (Allison et al, 1996; Hoepffner et al, 2006; Levi et al, 2007; Morikawa et al, 2005; Nozaki et al, 2006; Smith et al, 2006; Weller et al, 2006; Wong et al, 2003; Yamamoto and Nakama, 2000). The same sensitivity and specificity parameters were employed for both annual and biennial iFOBT screening.
O’Leary et al (2004) found that biennial FOBT screening in Australia resulted in a 19% reduction in mortality risk (relative risk = 0.81) and annual FOBT screening resulted in a 29% reduction in mortality (relative risk = 0.71). The same study found a 14% reduction in incidence risk (relative risk = 0.86) with biennial FOBT screening and 24% reduction in incidence risk (relative risk = 0.76) with annual iFOBT screening. These rates were based on a screening population aged 55 to 64 years.
Based on literature review, cost effectiveness of FOBT screening by age reflects both changes in efficacy and changes in cost per person by age (Access Economics, 2007). While

Cost effectiveness of screening for bowel cancer
11 Deloitte Access Economics
the effectiveness of one-time screening peaks around age 50 years (negligible difference between 50 and 55), bowel cancer-related costs reach a minimum around age 60 years, for both men and women. The extent of the variation as reported by Whynes et al (1998) in cost-utility estimates was within a range of around 20% in the 40-60 years range compared to the most cost effective 50-54 year olds. Assuming that half the difference between the 50-54 year olds (i.e. 10% of the variation) is due to efficacy and 10% is due to cost variation, mortality efficacy and incidence efficacy rates were derived for younger age groups relative to the O’Leary et al (2004) parameters for 55-64 year olds. Furthermore, the same proportionality was applied to estimate parameters for an older age group (65 to 74 year olds).
Sensitivity, specificity, mortality efficacy and incidence efficacy parameters employed in modelling for annual and biennial iFOBT are presented by age group in Table 2.1.
Table 2.1: Sensitivity, specificity, mortality and incidence efficacy parameters - iFOBT
Age group (years) 40-44 45-49 50-54 55-64 65-74
Biennial iFOBT
Sensitivity (%) 60% 60% 60% 60% 60%
Specificity (%) 95% 95% 95% 95% 95%
Incidence efficacy (RR) 0.818 0.832 0.846 0.860 0.874
Mortality efficacy (RR) 0.753 0.772 0.791 0.810 0.829
Annual iFOBT
Sensitivity (%) 60% 60% 60% 60% 60%
Specificity (%) 95% 95% 95% 95% 95%
Incidence efficacy (RR) 0.723 0.735 0.748 0.760 0.772
Mortality efficacy (RR) 0.660 0.677 0.693 0.710 0.727
Source: Deloitte Access Economics calculations based on Allison et al (1996), Hoepffner et al (2006), Levi et al (2007), Morikawa et al (2005), Nozaki et al (2006), O’Leary et al (2004), Smith et al (2006), Weller et al (2006), Whynes et al (1998), Wong et al (2003) and Yamamoto and Nakama (2000)
The sensitivity and specificity of follow-up colonoscopy were both modelled at 100%, based on previous literature analysis by Access Economics (2007). Adverse events from follow-up colonoscopy were modelled as perforation/haemorrhage occurring at a rate of 0.1% per colonoscopy, while the death rate from colonoscopy complications modelled as 0.01% (Viiala et al, 2003).
2.1.4 Detected bowel cancer cases – parameters for each pathway
Estimated bowel cancer cases for each screening age cohort with biennial and annual screening were estimated using age-gender specific bowel cancer incidence rates derived from AIHW (2001) and NSW Cancer Institute datasets (Access Economics, 2007). Pre 2001 incidence rates were adopted because the NBCSP Pilot Program began in 2002 and any incidence data after 2001 would include some impact from the colonoscopies performed on participants with positive iFOBT tests since then. Incidence rates applied in modelling are presented in Table 2.2.

Cost effectiveness of screening for bowel cancer
12 Deloitte Access Economics
Table 2.2: Bowel cancer incidence rates by age and gender
Age group Male Female
% %
40-44 0.07 0.02
45-49 0.07 0.05
50-54 0.07 0.05
55-59 0.22 0.14
60-64 0.22 0.14
65-69 0.50 0.30
70-74 0.50 0.30
Source: NSW Cancer Institute (2006)
Positive and negative iFOBT test cases (true positive and false positive, true negative and false negative) were estimated for each screening age cohort using the sensitivity and specificity parameters outlined in Section 2.1.3.
2.1.5 Costs of intervention: mail-out of kits and health care costs
The costs of iFOBT screening include mail out of kits to the target population in each age group (40 years to 70 years), cost of pathology (specimen analysis for screening participants and complex pathology for true positive cases) and costs of GP visits for all GP-referred cases. For those cases followed up with colonoscopy, relevant costs comprise the cost of specialist consultations (including pre-anaesthesia consultations), anaesthesia itself, the colonoscopy procedure and the cost of treating any colonoscopy perforations. These costs were modelled based on Medicare Benefit Schedule (MBS) fees and other sources and are summarised (per cost element) in Table 2.3.
Table 2.3: Cost elements of iFOBT screening, per cost element
Cost element $ 2011
Cost of mailout per invitee (based on postage costs with administrative loading)# 2.1
Cost of kit (based on Rotary kit cost) 10.3
Specimen analysis, MBS Item 73934 18.2
GP cost, MBS Item 23 35.4
Specialist cost, MBS Item 104 83.4
Anaesthesia, MBS Item 20810 77.1
Pre-anaesthesia consultation, MBS Item 17610 41.9
Colonoscopy, MBS Item 32090* 325.7
Colonoscopy, MBS Item 32093* 457.1
Lifetime treatment perforation cost (O'Leary et al, 2004)** 23,201.6
Complex biopsy, MBS Item 72823 100.8
Source: Deloitte Access Economics calculations based on Access Economics (2006). # Note for people outside the NBCSP this cost would not apply. * The average of the two colonoscopy items was used in the modelling. ** Inflated to 2011 prices at 3.2% per annum (average health cost inflation).

Cost effectiveness of screening for bowel cancer
13 Deloitte Access Economics
2.1.6 Financial cost savings from iFOBT screening
Financial cost savings from iFOBT screening comprise savings in health care treatment costs from earlier stage detection of bowel cancer and other financial costs averted (productivity losses, informal care costs, indirect costs and DWL) from fewer deaths and lower incidence.
Access Economics previously estimated the present value or ‘lifetime’ cost of an incident case of bowel cancer for the base year 2005-06 for the NSW Cancer Council (Access Economics, 2006). This separated lifetime costs into health care system costs, productivity costs, informal care costs, other indirect financial costs (e.g. formal community care, aids and home modifications, travel) and deadweight losses from transfers. Financial lifetime costs for the 2011 year are presented in Table 2.4 and calculated by factoring up:
per capita health care costs by the average rate of health inflation (3.2% per annum);
productivity and carer costs by wage growth (4.5% per annum); and
other costs by consumer price inflation (2.5% per annum).
Table 2.4: Financial lifetime costs per case of bowel cancer
Cost element $ 2011
Health care costs 36,397
Productivity costs 76,543
Carer costs 1,375
Indirect costs 5,977
DWL 15,213
Financial costs per case 135,505
Source: Deloitte Access Economics calculations based on Access Economics (2006). Inflated to 2011 prices as outlined above the table.
The estimate of lifetime health care cost of $36,397 per bowel cancer case represents an average of bowel cancer stages – local, regional and distal (or metastatic) – as this is dependent on varying treatment pathways (e.g. the mix of surgery, chemotherapy and radiotherapy options). Costs by stage were estimated in a past Australian survey (Bolin et al, 1999). These costs, inflated to 2005 (as in Access Economics, 2007), are presented in Table 2.5.
Table 2.5: Bowel cancer treatment costs by stage, past Australian survey
Item $ 2005
Surgery for localised cancer 18,433
Surgery and therapy for regional cancer 29,341
Surgery and therapy for distal cancer 25,169
Source: Bolin et al (1999) and Access Economics (2007).
Costs by stage in 2011 were estimated by applying stage relativities from Bolin et al (1999) to Access Economics’ lifetime cost estimate of $36,397, relative to the total cost in 2005 of $30,129. Treatment costs by stage applied in modelling are presented in Table 2.6. Note that these are all less than the $36,397 average as there are also non-surgery costs.

Cost effectiveness of screening for bowel cancer
14 Deloitte Access Economics
Table 2.6: Estimated bowel cancer treatment costs by stage in 2011
Item $ 2011
Surgery for localised cancer (stage 1 and 2) 22,268
Surgery and therapy for regional cancer (stage 3) 35,445
Surgery and therapy for distal cancer (stage 4) 30,405 Source: Deloitte Access Economics’ calculations based on Bolin et al (1999) and Access Economics (2006).
Health care cost savings from iFOBT screening were estimated using the difference in health care treatment costs from earlier stage detection of bowel cancer. The NBCSP reported the distribution of bowel cancers detected by stage, in NBCSP screened participants and unscreened participants (Cancer Council Victoria, 2010). Findings are presented in Table 2.7 and show that the majority of participants in the NBCSP were found with cancers at Stage 1 or 2, with non-participants more likely to be found with later stage disease.
Table 2.7: NBCSP – bowel cancer stage distribution, screened versus unscreened
Stage NBCSP Screened Unscreened
% of cancer cases % of cancer cases
1 (Local) 43 17
2 (Local) 27 37
3 (Distal) 27 29
4 (Regional) 3 18
Source: Cancer Council Victoria (2010). Totals may not sum to 100% due to rounding.
The screened and unscreened stage distributions in Table 2.7 were applied to estimate true positive bowel cancer cases detected in each screening age group with biennial and annual screening. Health care costs by stage were taken from Table 2.6 and then applied to the distributions of true positive cases to estimate treatment cost savings that would result from earlier stage detection with screening.
Reduced incidence (cases) from bowel cancer with annual and biennial screening was estimated for each screening age cohort using the incidence efficacy parameters presented in Table 2.1.
Reduced deaths from bowel cancer with annual and biennial screening were estimated for each screening age cohort by applying the incidence efficacy parameters presented in Table 2.1 to estimated bowel cancer deaths that would have otherwise resulted. Deaths from bowel cancer that would have resulted without screening for each age cohort were derived from the latest five-year survival rates for bowel cancer by age presented in Table 2.8 (AIHW, 2010).
Cost effectiveness of screening for bowel cancer
15 Deloitte Access Economics
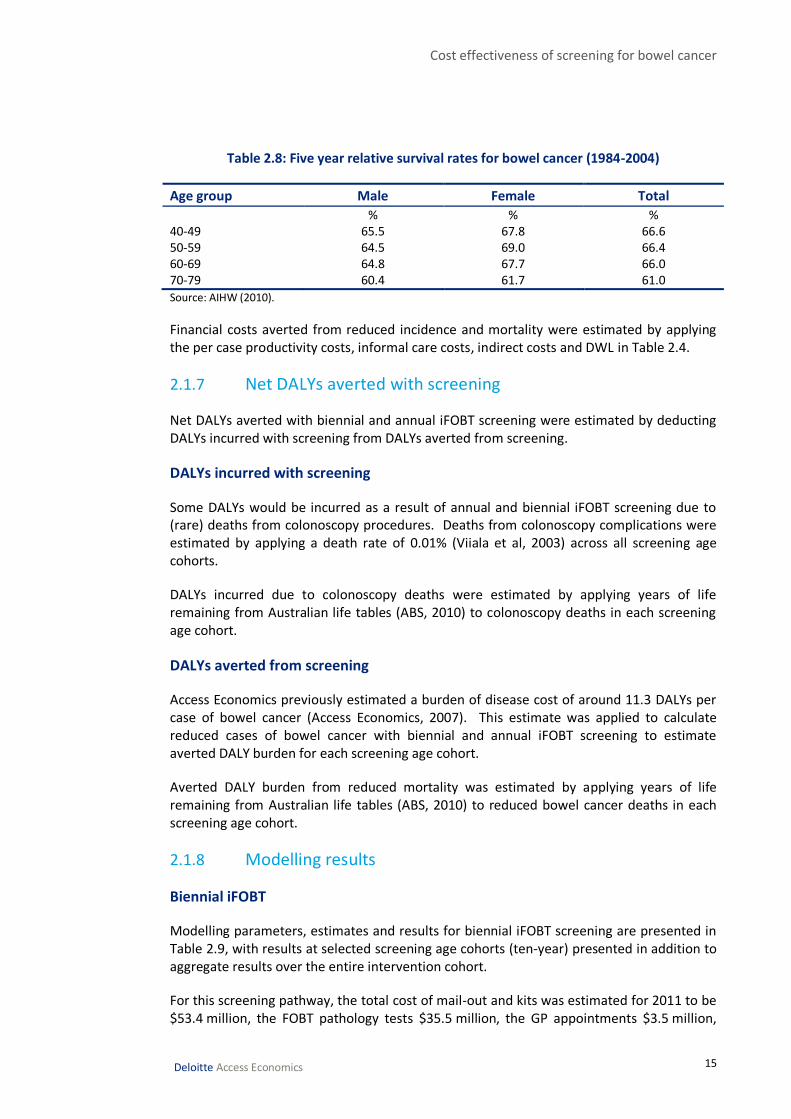
Table 2.8: Five year relative survival rates for bowel cancer (1984-2004)
Age group Male Female Total
% % % 40-49 65.5 67.8 66.6 50-59 64.5 69.0 66.4 60-69 64.8 67.7 66.0 70-79 60.4 61.7 61.0
Source: AIHW (2010).
Financial costs averted from reduced incidence and mortality were estimated by applying the per case productivity costs, informal care costs, indirect costs and DWL in Table 2.4.
2.1.7 Net DALYs averted with screening
Net DALYs averted with biennial and annual iFOBT screening were estimated by deducting DALYs incurred with screening from DALYs averted from screening.
DALYs incurred with screening
Some DALYs would be incurred as a result of annual and biennial iFOBT screening due to (rare) deaths from colonoscopy procedures. Deaths from colonoscopy complications were estimated by applying a death rate of 0.01% (Viiala et al, 2003) across all screening age cohorts.
DALYs incurred due to colonoscopy deaths were estimated by applying years of life remaining from Australian life tables (ABS, 2010) to colonoscopy deaths in each screening age cohort.
DALYs averted from screening
Access Economics previously estimated a burden of disease cost of around 11.3 DALYs per case of bowel cancer (Access Economics, 2007). This estimate was applied to calculate reduced cases of bowel cancer with biennial and annual iFOBT screening to estimate averted DALY burden for each screening age cohort.
Averted DALY burden from reduced mortality was estimated by applying years of life remaining from Australian life tables (ABS, 2010) to reduced bowel cancer deaths in each screening age cohort.
2.1.8 Modelling results
Biennial iFOBT
Modelling parameters, estimates and results for biennial iFOBT screening are presented in Table 2.9, with results at selected screening age cohorts (ten-year) presented in addition to aggregate results over the entire intervention cohort.
For this screening pathway, the total cost of mail-out and kits was estimated for 2011 to be $53.4 million, the FOBT pathology tests $35.5 million, the GP appointments $3.5 million,

Cost effectiveness of screening for bowel cancer
16 Deloitte Access Economics
the colonoscopy and specialist costs $46.8 million, the perforation treatment costs $1.8 million, and the complex pathology costs $0.2 million.
Altogether, the financial costs of biennial iFOBT screening total $141.2 million per annum. It was estimated that 241 DALYs would be incurred as a result of colonoscopy deaths.
The Department of Finance and Deregulation (DOFD, 2009) have provided an estimate of the value of a statistical life year (VSLY), which appears to represent a fixed estimate of the net VSLY. This estimate was $151,000 in 2007 which inflates to approximately $171,602 in 2011 dollars (DOFD, 2009). Multiplying DALYs incurred from colonoscopy deaths by this VSLY results in an estimate of $41.4 million in burden of disease costs with biennial iFOBT screening. Thus, total costs of biennial iFOBT screening (including the value of DALYs) is $182.6 million per annum.
Biennial iFOBT screening would include savings in health care treatment costs from earlier stage detection of bowel cancer (compared to no screening).
It was estimated that health care cost savings from earlier stage detection of bowel cancer would total $2.7 million.
Biennial iFOBT screening would result in fewer deaths and reduced incidence of bowel cancer, as proxied by the mortality and efficacy parameters employed in modelling.
It was estimated that reduced incidence of bowel cancer with screening would result in health care cost savings of $6.1 million and other financial cost savings of $21.6 million. Reduced mortality would result in productivity and indirect cost savings of $7.8 million.
Overall financial benefits of biennial screening were estimated to total $38.1 million. In addition, it is estimated that 2,570 DALYs would be averted from better survival and 2,470 DALYs would be averted from reduced incidence. Including the value of these DALYs, the estimated total benefit from biennial iFOBT screening would be $902.8 million.
The net financial cost of biennial iFOBT screening (total financial costs minus total financial benefits) was estimated to be $103.1 million. The net total benefit of biennial screening (including the value of DALYs) was estimated to be $720.2 million.
Net DALYs averted by the intervention totalled 4,798 (DALYs averted by screening minus DALYs incurred due to colonoscopy complications). Dividing net financial cost ($103.1 million) by net DALYs averted (4,798) results in an ICER of $21,490 per DALY averted (societal perspective). Including only direct health care costs and cost savings, the ICER would be $27,620 per DALY averted (health care perspective).

Cost effectiveness of screening for bowel cancer
17 Deloitte Access Economics
Table 2.9: Biennial iFOBT screening – modelling parameters, estimates and results, 2011
Screening cohort Aged 40 Aged 50 Aged 60 Aged 70 Total*
Target population (people) 341,055 314,005 254,383 159,368 4,319,598
Cost of mailout+kit ($m) 4.22 3.88 3.15 1.97 53.44
Participation (people) 153,475 141,302 114,472 71,716 1,943,819
Pathology cost ($m) 2.80 2.58 2.09 1.31 35.47
Incidence (% of age group) 0.04% 0.06% 0.18% 0.40% 0.16%
Expected detection 63 84 205 285 2584
True +ve 38 50 123 171 1551
False +ve 7,671 7,061 5,713 3,572 97,062
True –ve 145,742 134,158 108,554 67,859 1,844,173
False –ve 25 33 82 114 1,034
Any +ve, GP appointment ($m) 0.27 0.25 0.21 0.13 3.49
Colonoscopies (any +ve, compliant)
6,167 5,689 4,669 2,994 78,890
Colonoscopy/specialist cost ($m) 3.66 3.38 2.77 1.78 46.84
Perforations (number) 6.2 5.7 4.7 3.0 78.9
Colonoscopy deaths (number) 0.6 0.6 0.5 0.3 7.9
Perforation cost ($m) 0.14 0.13 0.11 0.07 1.83
Colonoscopy deaths, DALYs 26.5 19.1 11.4 4.9 241.0
Colonoscopy loss of wellbeing cost ($m)
4.54 3.27 1.96 0.83 41.36
True +ve, complex pathology ($m) 0.004 0.005 0.012 0.017 0.156
Total financial costs incurred ($m) 11.10 10.23 8.34 5.28 141.23
Total costs ($m, including value of DALYs) 15.65 13.50 10.30 6.11 182.59
Screening, incidence relative risk 0.846 0.846 0.860 0.874 0.856
Screening, mortality relative risk 0.791 0.791 0.810 0.829 0.804
Survival rate (natural) % 66.6% 66.4% 66.0% 61.0% 66.0%
Deaths (no screening), true +ve 12.53 16.86 41.76 66.60 532.91
Fewer deaths with screening 3.10 3.52 7.93 11.39 101.58
DALYs averted from better survival 133.0 118.0 194.4 184.5 2,569.6
Better survival, YLL value ($m) 22.8 20.3 33.4 31.7 440.9
Productivity/indirect gains, better survival ($m)
0.24 0.27 0.61 0.87 7.78
Health care cost savings, earlier stage detection ($m)
0.06 0.09 0.21 0.29 2.65
Reduced incidence (fewer cases) 6.83 7.73 17.19 21.52 218.31
Health care costs averted, fewer cases ($m)
0.19 0.21 0.48 0.60 6.06
Other financial costs averted, fewer cases ($m)
0.68 0.77 1.70 2.13 21.64
YLD DALYs averted, fewer cases (number)
77.26 87.39 194.49 243.40 2469.45
Cost effectiveness of screening for bowel cancer
18 Deloitte Access Economics
Screening cohort Aged 40 Aged 50 Aged 60 Aged 70 Total*
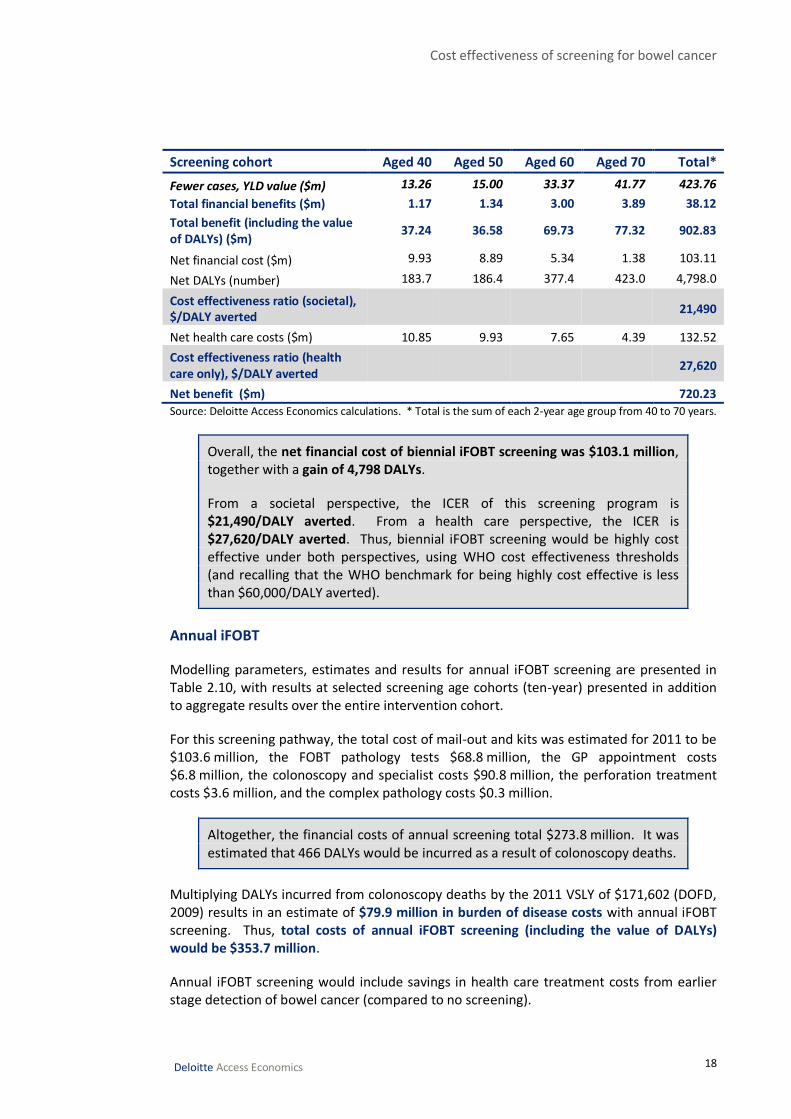
Fewer cases, YLD value ($m) 13.26 15.00 33.37 41.77 423.76
Total financial benefits ($m) 1.17 1.34 3.00 3.89 38.12
Total benefit (including the value of DALYs) ($m)
37.24 36.58 69.73 77.32 902.83
Net financial cost ($m) 9.93 8.89 5.34 1.38 103.11
Net DALYs (number) 183.7 186.4 377.4 423.0 4,798.0
Cost effectiveness ratio (societal), $/DALY averted
21,490
Net health care costs ($m) 10.85 9.93 7.65 4.39 132.52
Cost effectiveness ratio (health care only), $/DALY averted
27,620
Net benefit ($m) 720.23
Source: Deloitte Access Economics calculations. * Total is the sum of each 2-year age group from 40 to 70 years.
Overall, the net financial cost of biennial iFOBT screening was $103.1 million, together with a gain of 4,798 DALYs.
From a societal perspective, the ICER of this screening program is $21,490/DALY averted. From a health care perspective, the ICER is $27,620/DALY averted. Thus, biennial iFOBT screening would be highly cost effective under both perspectives, using WHO cost effectiveness thresholds (and recalling that the WHO benchmark for being highly cost effective is less than $60,000/DALY averted).
Annual iFOBT
Modelling parameters, estimates and results for annual iFOBT screening are presented in Table 2.10, with results at selected screening age cohorts (ten-year) presented in addition to aggregate results over the entire intervention cohort.
For this screening pathway, the total cost of mail-out and kits was estimated for 2011 to be $103.6 million, the FOBT pathology tests $68.8 million, the GP appointment costs $6.8 million, the colonoscopy and specialist costs $90.8 million, the perforation treatment costs $3.6 million, and the complex pathology costs $0.3 million.
Altogether, the financial costs of annual screening total $273.8 million. It was estimated that 466 DALYs would be incurred as a result of colonoscopy deaths.
Multiplying DALYs incurred from colonoscopy deaths by the 2011 VSLY of $171,602 (DOFD, 2009) results in an estimate of $79.9 million in burden of disease costs with annual iFOBT screening. Thus, total costs of annual iFOBT screening (including the value of DALYs) would be $353.7 million.
Annual iFOBT screening would include savings in health care treatment costs from earlier stage detection of bowel cancer (compared to no screening).

Cost effectiveness of screening for bowel cancer
19 Deloitte Access Economics
It was estimated that health care cost savings from earlier stage detection of bowel cancer would total $5.3 million.
Annual iFOBT screening would result in fewer deaths and reduced incidence of bowel cancer, as proxied by the mortality and efficacy parameters employed in modelling.
It was estimated that reduced incidence of bowel cancer with screening would result in health care cost savings of $20.8 million and other financial cost savings of $74.2 million. Reduced mortality would result in productivity and indirect cost savings of $23.6 million.
Overall financial benefits of annual screening were estimated to total $124.0 million. In addition, it is estimated that 7,747 DALYs would be averted from better survival and 8,474 DALYs would be averted from reduced incidence. Including the value of these DALYs, the estimated total benefit from annual iFOBT screening would be $2.9 billion.
The net financial cost of annual iFOBT screening (total financial costs minus total financial benefits) was estimated to be $149.8 million. The net total benefit of annual screening (including the value of DALYs) was estimated to be $2.6 billion.
Net DALYs averted by the intervention totalled 15,756 (DALYs averted by screening minus DALYs incurred due to colonoscopy complications). Dividing net financial cost ($149.8 million) by net DALYs averted (15,756) results in an ICER of $9,510 per DALY averted (societal perspective). Including only direct health care costs and cost savings, the ICER would be $15,719 per DALY averted (health care perspective).
Table 2.10: Annual iFOBT screening – modelling parameters, estimates and results, 2011
Screening cohort Aged 40 Aged 50 Aged 60 Aged 70 Total
Target population (people) 341,055 314,005 254,383 159,368 8,371,987
Cost of mailout+kit ($m) 4.22 3.88 3.15 1.97 103.58
Participation (people) 153,475 141,302 114,472 71,716 3,767,394
Pathology cost ($m) 2.80 2.58 2.09 1.31 68.75
Incidence (% of age group) 0.04% 0.06% 0.18% 0.40% 0.16%
Expected detection 63 84 205 285 5,196
True +ve 38 50 123 171 3,118
False +ve 7,671 7,061 5,713 3,572 188,110
True –ve 145,742 134,158 108,554 67,859 3,574,088
False –ve 25 33 82 114 2,078
Any +ve, GP appointment ($m) 0.27 0.25 0.21 0.13 6.76
Colonoscopies (any +ve, compliant)
6,167 5,689 4,669 2,994 152,982
Colonoscopy/specialist cost ($m) 3.66 3.38 2.77 1.78 90.84

Cost effectiveness of screening for bowel cancer
20 Deloitte Access Economics
Screening cohort Aged 40 Aged 50 Aged 60 Aged 70 Total
Perforations (number) 6.2 5.7 4.7 3.0 153.0
Colonoscopy deaths (number) 0.6 0.6 0.5 0.3 15.3
Perforation cost ($m) 0.14 0.13 0.11 0.07 3.55
Colonoscopy deaths, DALYs 26.5 19.1 11.4 4.9 465.6
Colonoscopy loss of wellbeing cost ($m)
4.54 3.27 1.96 0.83 79.89
True +ve, complex pathology ($m) 0.004 0.005 0.012 0.017 0.314
Total financial costs incurred ($m) 11.10 10.23 8.34 5.28 273.8
Total costs ($m, including value of DALYs) 15.65 13.50 10.30 6.11 353.7
Screening, incidence relative risk 0.723 0.748 0.760 0.772 0.750
Screening, mortality relative risk 0.660 0.693 0.710 0.727 0.697
Survival rate (natural) % 67% 66% 66% 61% 66%
Deaths (no screening), true +ve 12.53 16.86 41.76 66.60 1062.39
Fewer deaths with screening 4.26 5.17 12.11 18.20 308.24
DALYs averted from better survival 183.0 173.2 296.7 294.9 7,747.3
Better survival, YLL value ($m) 31.4 29.7 50.9 50.6 1,329.5
Productivity/indirect gains, better survival ($m)
0.33 0.40 0.93 1.39 23.59
Health care cost savings, earlier stage detection ($m)
0.06 0.09 0.21 0.29 5.32
Reduced incidence (fewer cases) 10.40 12.66 29.47 38.87 749.10
Health care costs averted, fewer cases ($m)
0.29 0.35 0.82 1.08 20.81
Other financial costs averted, fewer cases ($m)
1.03 1.25 2.92 3.85 74.24
YLD DALYs averted, fewer cases (number)
117.63 143.22 333.41 439.71 8,473.78
Fewer cases, YLD value ($m) 20.19 24.58 57.21 75.46 1,454.11
Total financial benefits ($m) 1.71 2.09 4.88 6.62 123.96
Total benefit (including the value of DALYs) ($m)
53.30 56.38 113.00 132.68 2,907.53
Net financial cost ($m) 9.39 8.14 3.46 -1.34 149.83
Net DALYs (number) 274.2 297.3 618.6 729.8 15,755.5
Cost effectiveness ratio (societal), $/DALY averted
9,510
Net health care costs ($m) 10.75 9.79 7.31 3.91 247.66
Cost effectiveness ratio (health care only), $/DALY averted
15,719
Net benefit ($m) 2,553.85
Source: Deloitte Access Economics calculations

Cost effectiveness of screening for bowel cancer
21 Deloitte Access Economics
Overall, the net financial cost of annual iFOBT screening was $149.8 million, together with a gain of 15,756 DALYs.
From a societal perspective, the ICER of this screening program would be $9,510/DALY averted. From a health care perspective, the ICER of this program would be $15,719/DALY averted. Thus, annual iFOBT screening would be highly cost effective under both perspectives, using WHO cost effectiveness thresholds (and recalling that the WHO benchmark for being highly cost effective is less than $60,000/DALY averted).
2.2 Colonoscopy screening
2.2.1 Description of intervention
This screening intervention would encompass colonoscopy screening starting at age 40, then at age 50, and thereafter at five-yearly intervals thereafter, ceasing at age 70.
Following the format of an Australian colonoscopy screening intervention assessed by Corbett et al (2004), it is assumed that invitation to participate in screening would occur through an invitation letter sent directly to all people in the target population (those aged 40 years in Australia). Those who responded to this letter would then be followed up by a GP assessment to determine eligibility for colonoscopy. Of these, it is estimated a percentage would undertake the actual colonoscopy procedure with participation parameters derived from literature (Corbett et al, 2004). Those who received a negative result would be followed up again at 50 years and at five-yearly intervals to the age of 70 years.
2.2.2 Target population and reach
There are an estimated 341,055 people aged 40 years in 2011, based on projections from Deloitte Access Economics’ in-house demographics model (DAE-DEM). This was the initial estimated target population for the colonoscopy intervention.
Corbett et al (2004) assessed participation in a colonoscopy screening intervention where people aged 55 to 75 years randomly selected from the electoral roll were invited to screen. These estimates were adopted in this analysis. In summary, of the selected population, 91.9% were sent invitation letters. Of this group, 5.0% declined the invitation, 21.2% did not respond, 34.2% were assessed as being ineligible for colonoscopy and 39.6% were assessed as being eligible for colonoscopy. Of those assessed as being eligible, 58.3% actually undertook the colonoscopy procedure.
The above parameters were applied to the initial target population aged 40 years in 2011 (341,055) to estimate that 313,430 people would be sent invitation letters for colonoscopy screening. Excluding those estimated to decline invitations or not respond, this leaves 231,311 who would be assessed by a GP. Approximately 124,118 people would be assessed as being eligible for a colonoscopy (39.6% of total people invited). Finally, 72,361 were estimated to undergo a colonoscopy procedure (58.3% of people assessed as eligible).

Cost effectiveness of screening for bowel cancer
22 Deloitte Access Economics
The numbers of people participating at colonoscopy screenings at ages after 40 years were estimated using a similar method, proxied by the estimated population in each age group in 2011 (from DAE-DEM) multiplied by participation parameters from Corbett et al (2004), less those already screened with true positive results in the prior screening period.
2.2.3 Effectiveness and adverse events from screening
The sensitivity and specificity of colonoscopy were both modelled as 100%, following the approach used in past modelling of the NBCSP by Access Economics (2007) and to align with the follow-up colonoscopy parameters employed in iFOBT modelling in Section .
O’Leary et al (2004) found that ten-yearly colonoscopy screening in Australia resulted in a 31% reduction in mortality risk (relative risk = 0.69) and a 35% reduction in incidence risk (relative risk = 0.65). These rates were based on a screening population aged 55 to 64 years.
Mortality efficacy and incidence efficacy rates with colonoscopy for other ages were estimated by applying ratios from the estimated age-specific efficacy parameters for biennial iFOBT screening in Section 2.1.3 (Table 2.1). Thus it is assumed that colonoscopy incidence/mortality efficacy varies by age, following the same age group pattern as iFOBT screening.
Sensitivity, specificity, mortality efficacy and incidence efficacy parameters employed in modelling for colonoscopy screening are presented by age group in Table 2.11. The efficacy parameters apply to ten-year colonoscopy screening, although it is noted that the intervention assessed in this section encompasses five-yearly colonoscopy screenings after the age of 50 years. Due to an absence of data on incidence and mortality efficacy for five-yearly colonoscopy screening, the ten-year efficacy parameters were also applied to five-year screenings after 50 years. It is noted that the efficacy parameters employed in modelling for this intervention are likely to be conservative, since five-yearly colonoscopy screening is expected to reduce mortality and incidence risk more than ten-yearly colonoscopy screening.
Table 2.11: Sensitivity, specificity, mortality and incidence efficacy parameters colonoscopy
Age group (years) 40-44 45-49 50-54 55f-64 65-74
10-year colonoscopy
Sensitivity (%) 100% 100% 100% 100% 100%
Specificity (%) 100% 100% 100% 100% 100%
Incidence efficacy (RR) 0.618 0.639 0.650 0.650 0.661
Mortality efficacy (RR) 0.641 0.674 0.690 0.690 0.706
Source: Deloitte Access Economics calculations based on Allison et al (1996), Hoepffner et al (2006), Levi et al (2007), Morikawa et al (2005), Nozaki et al (2006), O’Leary et al (2004), Smith et al (2006), Weller et al (2006), Whynes et al (1998), Wong et al (2003) and Yamamoto and Nakama (2000)
Adverse events from follow-up colonoscopy were modelled as perforation/haemorrhage occurring at a rate of 0.1% per colonoscopy, while the death rate from colonoscopy complications modelled as 0.01% (Viiala et al, 2003).

Cost effectiveness of screening for bowel cancer
23 Deloitte Access Economics
2.2.4 Detected bowel cancer cases – parameters
Estimated bowel cancer cases for each screening age cohort with colonoscopy screening were estimated using age-gender specific bowel cancer incidence rates (Access Economics, 2007) derived from 2001 data from the AIHW and NSW Cancer Institute, presented in Section 2.1.4. With colonoscopy, both sensitivity and specificity are assumed to be 100%. Thus, all positive and negative results are estimated to be ‘true’ results.
2.2.5 Costs of intervention: mail-out and health care costs
The initial costs of the intervention would include mail out of invitation letters to the target population in each age group (40 years to 70 years) and cost of GP assessments for those who respond to invitation letters. For those people who undertake colonoscopies, relevant costs would include costs of specialist consultations (including pre-anaesthesia consultation), costs of anaesthetic, cost of colonoscopy procedures and costs of treatment for colonoscopy perforations. Relevant costs were modelled based on Medicare Benefit Schedule (MBS) fees and other sources and are summarised (per cost element) in Table 2.3.
Table 2.12: Cost elements of colonoscopy screening, per cost element
Cost element $ 2011
Cost of mailout per invitee (based on postage costs with administrative loading) 2.1
GP cost, MBS Item 23 35.4
Specialist cost, MBS Item 104 83.4
Anaesthesia, MBS Item 20810 77.1
Pre-anaesthesia consultation, MBS Item 17610 41.9
Colonoscopy, MBS Item 32090* 325.7
Colonoscopy, MBS Item 32093* 457.1
Lifetime treatment perforation cost (O'Leary et al, 2004)** 23,201.6
Source: Deloitte Access Economics calculations based on Access Economics (2006). * The average of the two colonoscopy items was used in the modelling. ** Inflated to 2011 prices at 3.2% per annum (average health cost inflation).
2.2.6 Financial cost savings from colonoscopy screening
Financial cost savings from colonoscopy screening were modelled using the same method as that iFOBT screening (described in Section 2.1.6). Only the incidence efficacy and mortality efficacy parameters were changed to account for different parameters with colonoscopy screening. Bowel cancer lifetime cost inputs per case and relative cancer survival rates by age were the same as those used for iFOBT screening. Health care cost savings with colonoscopy were estimated using the same stage distribution with screening versus no screening as iFOBT (Table 2.6).
2.2.7 Net DALYs averted with screening
Net DALYs averted with colonoscopy screening were estimated using a similar method as that for iFOBT screening (Section 2.1.7). DALYs incurred from colonoscopy screening would include those due to colonoscopy complications. DALYs averted by colonoscopy screening

Cost effectiveness of screening for bowel cancer
24 Deloitte Access Economics
would be those due to reduced incidence and mortality, estimated from the mortality and incidence efficacy parameters for colonoscopy screening.
2.2.8 Modelling results
Modelling parameters, estimates and results for colonoscopy screening are presented in Table 2.13, with results at selected screening age cohorts (ten-year) presented in addition to aggregate results over entire intervention cohort.
For this screening pathway, the total cost of invitation mail-out was estimated to be $3.2 million, GP visits for responders $37.5 million, colonoscopy and specialist costs $197.2 million, and perforation treatment costs $13.2 million.
Altogether, the financial costs of screening total $251.2 million. It was estimated that 1,692 DALYs would be incurred as a result of colonoscopy deaths.
Multiplying DALYs incurred from colonoscopy deaths by the 2011 VSLY of $171,602 (DOFD, 2009) results in an estimate of $290.4 million in burden of disease costs with colonoscopy screening. Thus, total costs of colonoscopy screening (including the value of DALYs) would be $541.6 million.
Colonoscopy screening would result in savings in health care treatment costs from earlier stage detection of bowel cancer (compared to no screening).
It was estimated that health care cost savings from earlier stage detection of bowel cancer would total $1.7 million.
Colonoscopy screening would result in fewer deaths and reduced incidence of bowel cancer, as estimated from the mortality and efficacy parameters employed in modelling.
It was estimated that reduced incidence of bowel cancer with screening would result in health care cost savings of $9.7 million and other financial cost savings of $34.6 million. Reduced mortality would result in productivity and indirect cost savings of $8.2 million.
Overall, financial benefits of screening were estimated to total nearly $54.3 million. In addition to this, it is estimated that 2,546 DALYs would be averted from better survival and 3,952 DALYs would be averted from reduced incidence. Including the value of these DALYs, the estimated total benefit from colonoscopy screening would be $1.2 billion.
The net financial cost of colonoscopy screening (total financial costs minus total financial benefits) was estimated to be $196.9 million. The net total benefit of colonoscopy screening (including the value of DALYs) was estimated to be $627.7 million.

Cost effectiveness of screening for bowel cancer
25 Deloitte Access Economics
Net DALYs averted by the intervention totalled 4,805 (DALYs averted by screening minus DALYs incurred due to colonoscopy complications). Dividing net financial cost ($196.9 million) by net DALYs averted (4,805) results in an ICER of $40,978 per DALY averted (societal perspective). Including only direct health care costs and cost savings, the ICER would be $49,894 per DALY averted (health care perspective).
Table 2.13: Colonoscopy screening – modelling parameters, estimates and results, 2011
Screening cohort Aged 40 Aged 50 Aged 60 Aged 70 Total
Target population (people) 341,055 314,005 254,383 159,368 1,565,199
Number invited (people) 313,430 288,571 233,778 146,459 1,438,418
Cost of invitation mailout ($m) 0.70 0.65 0.52 0.33 3.23
Number undertaking GP assessment to determine eligibility (people)
231,311 212,965 172,528 108,087 1,061,552
Cost, GP appointment ($m) 8.18 7.53 6.10 3.82 37.54
Number eligible for colonoscopy (people)
124,118 114,274 92,576 57,998 569,613
Incidence (% of age group) 0.04% 0.06% 0.18% 0.40% 0.21%
Expected detection 51 68 166 230 1008
True +ve 51 68 166 230 1008
False +ve 0 0 0 0 0
True –ve 124,068 114,206 92,411 57,768 568,606
False –ve 0 0 0 0 0
Colonoscopies (number) 72,361 66,622 53,972 33,813 332,085
Colonoscopy/specialist cost ($m) 42.97 39.56 32.05 20.08 197.18
Perforations (number) 124.1 114.3 92.6 58.0 569.6
Colonoscopy deaths (number) 12.4 11.4 9.3 5.8 57.0
Perforation cost ($m) 2.88 2.65 2.15 1.35 13.22
Colonoscopy deaths, DALYs 533.1 382.8 226.8 94.0 1,692.3
Colonoscopy loss of wellbeing cost ($m)
91.48 65.69 38.92 16.12 290.40
Total financial costs incurred ($m) 54.73 50.39 40.82 25.57 251.17
Total costs ($m, including value of DALYs)
146.21 116.08 79.74 41.70 541.56
Screening, incidence relative risk 0.618 0.639 0.650 0.661 0.646
Screening, mortality relative risk 0.641 0.674 0.690 0.706 0.685
Survival rate (natural) % 67% 66% 66% 61% 65%
Deaths (no screening), true +ve 16.89 22.7 56.3 89.8 352.8
Fewer deaths with screening 6.06 7.41 17.45 26.38 107.41
DALYs averted from better survival 260.16 248.26 427.45 427.28 2,545.66
Better survival, YLL value ($m) 44.6 42.6 73.4 73.3 436.8
Productivity/indirect gains, better survival ($m)
0.46 0.57 1.34 2.02 8.22

Cost effectiveness of screening for bowel cancer
26 Deloitte Access Economics
Screening cohort Aged 40 Aged 50 Aged 60 Aged 70 Total
Health care cost savings, earlier stage detection ($m)
0.09 0.12 0.28 0.39 1.72
Reduced incidence (fewer cases) 19.31 24.38 57.94 78.13 349.34
Health care costs averted, fewer cases ($m)
0.54 0.68 1.61 2.17 9.70
Other financial costs averted, fewer cases ($m)
1.91 2.42 5.74 7.74 34.62
YLD DALYs averted, fewer cases (number)
218.42 275.81 655.37 883.75 3,951.68
Fewer cases, YLD value ($m) 37.48 47.33 112.46 151.65 678.12
Total financial benefits ($m) 3.00 3.78 8.97 12.32 54.27
Total benefit (including the value of DALYs) ($m)
85.12 93.71 194.78 237.30 1,169.22
Net financial cost ($m) 51.73 46.61 31.85 13.25 196.90
Net DALYs (number) -55 141 856 1,217 4,805
Cost effectiveness ratio (societal), $/DALY averted
40,978
Net health care costs ($m) 54.11 49.60 38.93 23.01 239.74
Cost effectiveness ratio (health care only), $/DALY averted
49,894
Net benefit ($m) 627.66
Source: Deloitte Access Economics calculations
Overall, the net financial cost of colonoscopy screening was $196.9 million, together with a gain of 4,805 DALYs.
Under a societal perspective, the ICER of this screening program would be $40,978/DALY averted. Under a health care perspective, the ICER of this program would be $49,894/DALY averted. Thus, colonoscopy screening would be highly cost effective under both perspectives, using WHO cost effectiveness thresholds (and recalling that the WHO benchmark for being highly cost effective is less than $60,000/DALY averted).
2.3 Sensitivity analysis
Sensitivity analysis was conducted using international data on cancer stage distributions of detected cancer cases in bowel cancer screening programs. Two FOBT trials conducted in the UK were an English pilot screening program and a trial in Nottingham (Weller et al, 2006).
A randomised control trial of gFOBT screening was conducted in the Nottingham area between 1981 and 1995 with 150,000 people allocated between an intervention and control arm. Those in the intervention arm were offered biennial screening by gFOBT.
Bowel cancer screening pilots were conducted in England during 2000 to 2004. The aim of these pilots was to see if FOBT screening, as carried out under research conditions in

Cost effectiveness of screening for bowel cancer
27 Deloitte Access Economics
Nottingham, was practical, acceptable and feasible within the National Health Service healthcare setting.
The second round of the English pilot offered FOBT screening testing by invitation to 127,746 people aged 50 to 69 years at an interval of two years after the first round. During this round, people aged 70 years or older who were registered with general practices in the pilot area were able to request a test kit by contacting the screening unit. Testing was primarily via gFOBT tests (as with the Nottingham trial), although from June 2004 to November 2004, iFOBT tests were trialled on 5,122 individuals. These individuals were excluded from subsequent evaluation analyses (Weller et al, 2006).
The breakdown of screen-detected cancers by Dukes’ stage in the second round of the Nottingham pilot and English pilot are presented in Table 2.14. Similar to iFOBT screening data in Australia (Cancer Council Victoria, 2010), a large proportion of screen detected cancers were in the earliest two stages.
Table 2.14: Bowel cancer stage distribution of gFOBT screened cases, UK pilot programs
Stage English pilot Nottingham pilot
% of cancer cases % of cancer cases
A (Local) 39.0 40.0
B (Local) 33.9 33.3
C (Distal) 27.1 23.3
D (Regional) 0.0 3.3
Source: Derived from Weller et al (2006)
An organised screening program for bowel cancer prevention was introduced in Germany in 2003, using complete colonoscopy in average-risk individuals aged 55 years and over as the recommended nationwide screening procedure (Bokemeyer et al, 2009). Bokemeyer et al (2009) evaluated data for 269,114 screening colonoscopies. Staging data was available for 575 cancer cases primarily detected at screening colonoscopies. This is presented in Table 2.15.
Table 2.15: Bowel cancer stage distribution of colonoscopy screened cases, Germany
Stage Germany colonoscopy screening program
% of cancer cases
A (Local) 42.8
B (Local) 26.6
C (Distal) 20.5
D (Regional) 10.1
Source: Derived from Bokemeyer et al (2009)
The cancer stage distributions from the Nottingham pilot, English pilot and Germany colonoscopy program were applied across all screening arms of the model to estimated true positive cancer cases to examine impacts on cost-effectiveness. Since cancer stage distributions are similar across the international bowel cancer screening programs and the

Cost effectiveness of screening for bowel cancer
28 Deloitte Access Economics
NBCSP in Australia, there was minimal impact on cost-effectiveness results, as presented in Table 2.16.
Table 2.16: Sensitivity analysis – cancer stage distribution data, ICER results
Baseline: NBCSP data
English pilot (gFOBT)
Nottingham pilot (gFOBT)
Germany colonoscopy
$ $ $ $
Biennial iFOBT
ICER (all financial) 21,490 21,416 21,343 21,400
ICER (health only) 27,620 27,546 27,473 27,530
Annual iFOBT
ICER (all financial) 9,510 9,464 9,419 9,454
ICER (health only) 15,719 15,674 15,629 15,664
Colonoscopy
ICER (all financial) 40,978 40,930 40,882 40,919
ICER (health only) 49,894 49,846 49,798 49,836
Source: Access Economics calculations using cancer staging data from Cancer Council Victoria (2010), Weller et al (2006) and Bokemeyer et al (2009).
Cost effectiveness of screening for bowel cancer
29 Deloitte Access Economics
3 Conclusions This report demonstrates that interventions of annual and biennial iFOBT as well as colonoscopy screening arms are all cost effective. The analysis indicates that population-based screening for Australians aged 40 to 70 years is cost-effective, with annual iFOBT screening followed by a colonoscopy and treatment for positive iFOBT being the most cost effective.
The net financial cost of annual iFOBT screening was $149.8 million for a gain of 15,756 DALYs. Relative to the biennial iFOBT intervention of $103.1 million and 4,798 DALYs, the additional net financial cost was $46.7 million per annum for an additional gain of 10,958 DALYs per annum. This suggests an ICER of $4,264/DALY for annual compared to biennial screening.
Compared to the intervention of conventional colonoscopy screening ($196.9 million and 4,805 DALYs), the net financial cost saved through annual screening was $47.1 million per annum with a gain of 10,950 DALYs per annum. Hence annual screening ‘dominated’ colonoscopy screening (i.e. resulting in lower net cost and more healthy life).
While colonoscopy averted 7 more DALYs than biennial screening, the cost of this was $93.8 million, with an ICER of $13.2 million/DALY averted – not cost effective.
Faecal occult blood testing is an easy to use non invasive technique for asymptomatic people to detect the presence of occult (hidden) blood in stools which may be attributed to bowl cancer (Bishop et al, 2008). Colonoscopy, although considered the gold standard in terms of specificity requires skilled medical professionals and relative to alternatives such as iFOBT is more expensive though is much more effective. Colonoscopy screening remains an alternative to iFOBT, not only because it is more effective, but because its periodic frequency may improve participation rates.
Presently, treating bowel cancer is expensive and the cost is rapidly rising. In the past 10 years treatment costs have increased for cancers at all stages. There have been huge increases in the cost of treating Stage 3 and 4 cancers, largely due to the increased chemotherapy options and the introduction of more effective but expensive drug regimes (Cancer Council Victoria, 2011). From an economic and personal wellbeing point of view, the National Bowel Cancer Screening Program is to be commended for its prevention efforts. This study suggests that extension of the NBSCP to additional age groups and frequency may be appropriate.

Cost effectiveness of screening for bowel cancer
30 Deloitte Access Economics
References Access Economics 2007, National Bowel Cancer Screening Program Economic Evaluation,
Report for the Department of Health and Ageing, September.
- 2006, The Cost of Cancer in NSW, Report for the Cancer Council of NSW, http://www.accesseconomics.com.au/publicationsreports/showreport.php?id=144&searchfor=2006&searchby=year, accessed 10 August 2010.
Australian Bureau of Statistics (ABS) 2010, Life tables, Australia, 2007-2009, Cat. No. 3302.0.55.001, Canberra.
Australian Government 2008, Colonoscopy – facts about..., available at http://www.health.gov.au/internet/screening/publishing.nsf/Content/736434B57E6F27E5CA2574EB007F7534/$File/colonoscopy-brochure-june08.pdf, accessed 20 April 2011.
Allison J, Tekawa A, Ransom L, Adrian A 1996, ‘A comparison of fecal-occult blood tests for colorectal cancer screening’ New England Journal of Medicine, 336;155-159.
Askling J, Dickman P, Karlen P, et al 2001, ‘Colorectal cancer rates among first-degree relatives of patients with inflammatory bowel disease: a population-based cohort study’, Lancet 357:262-266.
Atkin W, Edwards R, Krali-Hans I, Wooldrage K, Hart A, Northover J, Parkin DM, Wardie J, Duffy S, Cuzick J and UK Flexible Sigmoidoscopy Trial Investigators 2010, ‘Once-only flexible sigmoidoscopy screening in prevention of colorectal cancer: a multicentre randomised controlled trial’, Lancet, 375: 1624-33.
Australian Institute of Health and Welfare (AIHW) 2010, Cancer in Australia: an overview, 2010, Cancer series no. 60, Cat. no. CAN 56, Canberra: AIHW.
- 2010a, National Bowel Cancer Screening Program: Annual monitoring report, Data supplement 2010, Cancer series no. 57, Cat. no. CAN 53, Canberra: AIHW.
- 2007, The burden of disease and injury in Australia 2003, Cat. no. PHE 82, Canberra: AIHW.
Bingham SA, Day NE, Luben R, Ferrari P, Slimani N, Norat T, et al 2005, ‘Dietary fibre in food and protection against colorectal cancer in the European Prospective Investigation into Cancer and Nutrition (EPIC): an observational study’, Lancet, 361: 1496–501
Bishop J, Glass P, Tracey E, Hardy M, Warner K, Makino K, Gordois A, Wilson J, Guarnieri C, Feng J, Sartori L 2008, Health Economics Review of Bowel Cancer Screening in Australia, Cancer Institute NSW, August 2008.
Bokemeyer B, Bock H, Huppe D, Duffelmeyer M, Rambow A, Tacke W and Koop H 2009, ‘Screening colonoscopy for colorectal cancer prevention: results from a German

Cost effectiveness of screening for bowel cancer
31 Deloitte Access Economics
online registry on 269,000 cases’, European Journal of Gastroenterology and Hepatology, 21: 650-655.
Bolin T, Korman M, Stanton R, Talley N, Newstead G, Donnelly N, Hall W, Ho M, Lapsley H 1999, ‘Positive cost effectiveness of early diagnosis of colorectal cancer’, Colorectal Disease, 1: 113-122.
Bolin T, Lapsley H, Korman M 2001, ‘Screening for colorectal cancer: what is the most cost-effective approach?’, MJA, 174: 298-301.
Bongaerts BWC, van den Brandt PA, Goldbohm RA, et al 2008, ‘Alcohol consumption, type of alcoholic beverage and risk of colorectal cancer at specific subsites’, International Journal of Cancer, 123: 2411-7.
Bowel Cancer Australia 2010, ‘What is bowel cancer?’, http://www.bowelcanceraustralia.org/bca/index.php?option=com_content&view=article&id=163&Itemid=289, accessed 21 April, 2011.
Canavan C, Abrams KR, Mayberry J 2006, ‘Meta-analysis: colorectal and small bowel cancer risk in patients with Crohn’s disease’, Alimentary Pharmacology & Therapeutics, 23: 1097-104.
Cancer Council Victoria 2011, Diagnosing bowel cancer, available at http://www.cancervic.org.au/about-cancer/cancer_types/bowel_cancer/diagnosing_bowel_cancer.html, accessed 20 March 2011.
Charette A, Fletcher RH 2011, ‘Patient information: colon polyps’, UpToDate, http://www.uptodate.com/contents/patient-information-colon-polyps, accessed 21 April, 2011.
Cho E, Smith-Warner S, Ritz J, van den Brandt P, Colditz G, Folsom A, Freudenheim J, Giovannucci E, Goldbohm R, Graham S, Holmberg L, Kim D, Malila N, Miller A, Pietinen P, Rohan T, Sellers T, Speizer F, Willett W, Wolk A, Hunter D 2004, ‘Alcohol intake and colorectal cancer: a pooled analysis of 8 cohort studies’, Ann Intern Med, 140(8): 603-13.
Corbett M, Chambers S, Shadbolt B, Hillman L, Taupin D 2004, ‘Colonoscopy screening for colorectal cancer: the outcomes of two recruitment methods’, MJA, 181: 423-427.
Crotta S, Castiglione G, Grazzini G, Valle F, Mosconi S, Rosset R 2003, ‘Feasibility study of colorectal cancer screening by immunochemical faecal occult blood testing: results in a northern Italian community’, European Journal of Gastroenterology and Hepatology, 16(1): 33-37.
Department of Finance and Deregulation (DOFD) 2008, Best practice regulation guidance note: Value of a statistical life, Department of Finance and Deregulation, http://www.finance.gov.au/obpr/docs/ ValuingStatisticalLife.pdf, accessed 20 April 2011.

Cost effectiveness of screening for bowel cancer
32 Deloitte Access Economics
Department of Health and Ageing (DOHA) 2009, National Bowel Cancer screening program: bowel cancer – the facts, available at http://www.health.gov.au/internet/screening/publishing.nsf/Content/bw-facts, accessed 6 March 2011.
Ekbom A, Helmick C, Zack M, Adami HO 1990b, ‘Ulcerative colitis and colorectal cancer – a population-based study’, New England Journal of Medicine, 323: 1228-1233.
Fenocchi E, Martinez L, Tolve J, Montano D, Rondan M, Parra-Blanco A, Eishi Y 2005, ‘Screening for colorectal cancer in Uruguay with an immunochemical faecal occult blood test’, European Journal of Cancer Prevention, 15: 384-399.
Forbes GM, Mendelson RM, Edwards JT, Foster NM, Pawlik JZ, Bampton PA, Voyvodic F, Upton J, Macrae FA, Stella D, Viney B, Pizzey CJ, Fritschi L, Heyworth J: The Multicentre Australian Colorectal-neoplasia Screening Group 2006, ‘A comparison of colorectal neoplasia screening tests: a multicentre community-based study of the impact of consumer choice’, Med J Aust 184: 546-550.
Gastroenterological Society of Australia (GESA) 2006, ‘Bowl Polyps’, http://www.gesa.org.au/leaflets/bowel-polyps.cfm, accessed 21 April, 2011.
Hoepffner N, Shastri M, Hanisch W, Mossners J, Caspary W, Stein J 2006, ‘Comparative evaluation of a new bedside faecal occult blood test in a prospective multicentre study’ Alimentary Pharmacology and Therapeutics, 23:145-154.
Howe G, Benito E, Castelleto R, Cornée J, Estève J, Gallagher R, Iscovich J, Deng-ao J, Kaaks R, Kune G, Kune S, L'Abbé K, Lee H, Lee M, Miller A, Peters R, Potter J, Riboli E, Slattery M, Trichopoulos D, Tuyns A, Tzonou A, Whittemore A, Wu-Williams A, Shu Z 1992, ‘Dietary fibre and the risk of cancers of the colon and rectum: evidence from the combined analysis of 13-case control studies’, J Nat Cancer Inst, 84:1887.
Huxley RR, Ansary-Moghaddam A, Clifton P, et al 2009, ‘The impact of dietary and lifestyle risk factors on risk of colorectal cancer: a quantitative overview of the epidemiological evidence’, International Journal of Cancer, 125: 171-80.
Levi Z, Rozen P, Hazazi R, Vilkin A, Waked A, Maoz E, Birkenfeld S, Leshno M, Niv Y 2007, ‘A quantitative immunochemical fecal occult blood test for colorectal neoplasia’ Annals of internal medicine 146(4):244-255
Levin B 2006, Colorectal cancer, ACP Medicine, American College of Physicians/WebMD professional publishing, New York.
Levin B, Brooks D, Smith RA, Stone A 2003, ‘Emerging technologies in screening for colorectal cancer: CT colonography, immunochemical fecal occult blood tests, and stool screening using molecular markers’, CA: a Cancer Journal for Clinicians, 53(1): 44-55.
Liu B, Parsons R, Papadopoulos N, Nicolaides N, Lynch H, Watson P, Jass J, Dunlop M, Wyllie A, Peltomaki P, de la Chapelle A, Hamilton S, Vogelstein B, Kinzler K 1996, ‘Analysis of mismatch repair genes in hereditary non-polyposis colorectal cancer patients’, Nat Med, 2(2): 169-74.

Cost effectiveness of screening for bowel cancer
33 Deloitte Access Economics
Mathers C, Vos T, Stevenson C 1999, The burden of disease and injury in Australia, Australian Institute of Health and Welfare, AIHW Cat No PHE 17, Canberra.
Morikawa T, Kato J, Yamaji Y, Wada R, Mitsushima T, Shiratori Y 2005, ‘A comparison of the immunochemical fecal occult blood test and total colonoscopy in the asymptomatic population’ Gastroenterology, 129:422-428.
Nanda K, Bastian L, Hasselblad V et al 1999, ‘Hormone replacement therapy and the risk of colorectal cancer: a meta-analysis’, Obstet Gynecol, 93: 880.
Ness RM, Holmes AM, Klein R, Dittus R 2000, ‘Cost-utility of one-time colonoscopic screening for colorectal cancer at various ages’ Am J Gastroenterol, 95:1800-11.
Newcomb PA, Taylor JO, Trentham-Dietz A 1999, ‘Interactions of familial and hormonal risk factors for large bowel cancer in women’, International Journal of Epidemiology, 28: 603-8.
Norat T, Bingham S, Ferrari P, Slimani N, Jenab M et al 2005, ‘Meat, fish, and colorectal cancer risk: the European Prospective Investigation into cancer and nutrition’, J Natl Cancer Inst, 97(12):906-16.
Nozaki R, Murata R, Tanimura S, Ohwan T, Ogata S, Yamada K, Takano M 2006, ‘Community-based mass screening for colorectal cancer by a combination of fecal occult blood testing and flexible sigmoidoscopy’ Digestive Endoscopy, 18(2):122-127.
O’Leary B, Olynyk J, Neville M, Platell C 2004, ‘Cost effectiveness of colorectal cancer screening: Comparison of community-based flexible sigmoidoscopy with fecal occult blood testing and colonoscopy’ Journal of Gastroenterology and Hepatology, 19:38-47.
Olynyk J, Platell C, Collett J 2001, ‘Fecal occult blood and flexible sigmoidoscopy screening for colorectal cancer: modeling the impact on colonoscopy requirements and cancer detection rates’, Journal of Gastroenterology and Hepatology, 16: 389-392.
Potter J 1995, ‘Risk factors for colon neoplasia - epidemiology and biology’, European Journal of Cancer, 31A (7/8): 1033-1038.
Ransohoff D 2007, ‘What is the role of iFOBT in screening for colorectal cancer?’, Gut, 56: 1343-1344.
Smith A, Young GP, Cole SR, Bampton P 2006, ‘Comparison of a brush-sampling fecal immunochemical test for hemoglobin with a sensitive guaiac-based fecal occult blood test in detection of colorectal neoplasia’ Cancer 107:2152-2159.
Steward B, Kleihues P, 2003, Colorectal Cancer, World Cancer Report. Lyon, IARC Press, pp 198-202.
Tsoi KKF, Pau CYY, Wu WKK, et al 2009, ‘Cigarette smoking and the risk of colorectal cancer: a meta-analysis of prospective cohort studies’, Clinical Gastroenterology & Hepatology 7:682-688.e1-5.

Cost effectiveness of screening for bowel cancer
34 Deloitte Access Economics
Viiala C, Zimmerman M, Cullen D, Hoffman N 2003, ‘Complication rates of colonoscopy in an Australian teaching hospital environment’ Internal Medicine Journal, 33(8):355-359.
Weitz J, Koch M, Debus J, et al 2005, ‘Colorectal cancer’, Lancet, 365: 153-165.
Weller D, Moss S, Butler P, Campbell C, Coleman D, Melia J, Robertson R 2006, ‘English pilot of bowel cancer screening: an evaluation of the second round’ Report to the Department of Health.
Whynes DK, Neilson AR, Walker AR, Hardcastle JD 1998, ‘Faecal occult blood screening for colorectal cancer: is it cost effective?’ Health Econ, 7:21-9.
World Health Organization (WHO) 2011, Choosing interventions that are cost-effective (WHO-CHOICE), cost effectiveness thresholds, http://www.who.int/choice/costs/CER_thresholds/en/index.html, accessed March 20, 2011.
Wong W, Lam S, Cheung K, Tong T, Rozen P, Young G, Chu K, Ho J, Law W, Tung H, Choi H, Lee Y, Lai K, Hu W, Chan C, Chan C, Yuen M, Won B 2003, ‘Evaluation of an automated immunochemical fecal occult blood test for colorectal neoplasia detection in a Chinese population’ Cancer, 97(10):2420-2424.
Yamamoto M, Nakama H 2000, ‘Cost effectiveness analysis of immunochemical occult blood screening for colorectal cancer among three faecal sampling methods’ Hepatogastroenterology, 47(320):396-399.

Limitation of our work
General use restriction
This report is prepared solely for the use of The Gut Foundation. This report is not intended to and should not be used or relied upon by anyone else and we accept no duty of care to any other person or entity. The report has been prepared for the purpose of assisting the Gut Foundation to assess the cost-effectiveness of bowel cancer screening. You should not refer to or use our name or the advice for any other purpose.

Contact us
Deloitte Access Economics ACN: 49 633 116 Level 1 9 Sydney Avenue Barton ACT 2600 PO Box 6334 Kingston ACT 2604 Australia Tel: +61 2 6175 2000 Fax: +61 2 6175 2001 www.deloitte.com/au/economics
About Deloitte Deloitte refers to one or more of Deloitte Touche Tohmatsu Limited, a UK private company limited by guarantee, and its network of member firms, each of which is a legally separate and independent entity. Please see www.deloitte.com/au/about for a detailed description of the legal structure of Deloitte Touche Tohmatsu Limited and its member firms. Deloitte provides audit, tax, consulting, and financial advisory services to public and private clients spanning multiple industries. With a globally connected network of member firms in more than 150 countries, Deloitte brings world-class capabilities and deep local expertise to help clients succeed wherever they operate. Deloitte's approximately 170,000 professionals are committed to becoming the standard of excellence About Deloitte Australia In Australia, the member firm is the Australian partnership of Deloitte Touche Tohmatsu. As one of Australia’s leading professional services firms, Deloitte Touche Tohmatsu and its affiliates provide audit, tax, consulting, and financial advisory services through approximately 5,000 people across the country. Focused on the creation of value and growth, and known as an employer of choice for innovative human resources programs, we are dedicated to helping our clients and our people excel. For more information, please visit Deloitte’s web site at www.deloitte.com.au. Deloitte Access Economics is Australia’s pre-eminent economics advisory practice and a member of Deloitte's global economics group. The Directors and staff of Access Economics joined Deloitte in early 2011. Liability limited by a scheme approved under Professional Standards Legislation. Member of Deloitte Touche Tohmatsu Limited © 2011 Deloitte Access Economics Pty Ltd