cost of new entry estimates for combustion turbine and combined
TRANSCRIPT

Cost of New Entry Estimates for Combustion Turbine and Combined Cycle Plants in PJM With June 1, 2018 Online Date
PREPARED FOR
PJM Interconnection, L.L.C.
PREPARED BY
Samuel A. Newell
J. Michael Hagerty
Kathleen Spees
Johannes P. Pfeifenberger
Quincy Liao
The Brattle Group
Christopher D. Ungate
John Wroble
Sargent & Lundy
May 15, 2014
This report was prepared for PJM Interconnection, L.L.C. All results and any errors are the responsibility of the authors and do not represent the opinion of The Brattle Group, Inc. or Sargent & Lundy, or their clients.
The authors would like to thank PJM staff for their cooperation and responsiveness to our many questions and requests. We would also like to thank the PJM Independent Market Monitor for helpful discussions. Copyright © 2014 The Brattle Group, Inc.

i|brattle.com
Table of Contents
EExecutive Summary ............................................................................................................... iii
I. Introduction .................................................................................................................... 1 A. Background and Objective ............................................................................................... 1 B. Analytical Approach ........................................................................................................ 2
II. Determination of Reference Technologies ......................................................................... 3 A. Locational Screen ............................................................................................................. 3 B. Plant Size, Configuration and Turbine Model ................................................................. 7 C. Detailed Technical Specifications .................................................................................. 10
1. Combined Cycle Cooling System........................................................................... 10 2. Combined-Cycle Duct Firing ................................................................................ 11 3. Power Augmentation............................................................................................. 12 4. Emissions Controls................................................................................................. 12 5. Dual Fuel Capability, Firm Gas Contracts, and Gas Compression ......................... 13 6. Black Start Capability ............................................................................................ 14 7. Electrical Interconnection ..................................................................................... 15
D. Summary of Reference Technology Specifications ........................................................ 15
III. Capital Cost Estimates .................................................................................................... 16 A. Plant Proper Capital Costs ............................................................................................. 17
1. Plant Developer and Contractor Arrangements .................................................... 17 2. Equipment and Sales Tax ....................................................................................... 17 3. Labor and Materials ............................................................................................... 17 4. EPC Contractor Fee and Contingency ................................................................... 18
B. Owner’s Capital Costs .................................................................................................... 18 1. Project Development and Mobilization and Startup ............................................. 18 2. Net Start-Up Fuel Costs During Testing ................................................................ 19 3. Gas Interconnection .............................................................................................. 20 4. Electric Interconnection ........................................................................................ 21 5. Land ....................................................................................................................... 22 6. Fuel and Non-Fuel Inventories .............................................................................. 23 7. Owner’s Contingency ............................................................................................ 23 8. Financing Fees ....................................................................................................... 23
C. Escalation to 2018 Installed Costs .................................................................................. 24 1. Escalation ............................................................................................................... 24 2. Cost of Capital During Construction ..................................................................... 24
D. Capital Cost Summary.................................................................................................... 26
ii|brattle.com
IIV. Operation and Maintenance Costs .................................................................................. 27 A. Annual Fixed Operations and Maintenance Costs ......................................................... 28
1. Plant Operation and Maintenance......................................................................... 28 2. Insurance and Asset Management Costs ................................................................ 28 3. Property Tax .......................................................................................................... 28 4. Working Capital .................................................................................................... 30 5. Firm Transportation Service Contract in Southwest MAAC ................................. 31
B. Variable Operation and Maintenance Costs .................................................................. 32 C. Escalation to 2018 .......................................................................................................... 33 D. Summary of O&M Costs ................................................................................................ 33
V. Financial Assumptions ................................................................................................... 34 A. Cost of Capital ................................................................................................................ 34 B. Other Financial Assumptions ........................................................................................ 38
VI. Summary of CONE Estimates ......................................................................................... 39
List of Acronyms .................................................................................................................. 45 13

iii|brattle.com
Executive Summary
PJM Interconnection, L.L.C (PJM) retained The Brattle Group (Brattle) and Sargent & Lundy (S&L) to review the Cost of New Entry (CONE) parameters and other elements of the Reliability Pricing Model (RPM), as required periodically under PJM’s tariff.1 This report presents our estimates of the CONE parameters for consideration by PJM and stakeholders in advance of their upcoming capacity auctions. Our review of the other elements of RPM is presented separately, in a concurrently-released report, the “Third Triennial Review of PJM’s Variable Resource Requirement Curve” (“2014 VRR Report”).
CONE represents the first-year total net revenue (net of variable operating costs) a new generation resource would need in order to recover its capital investment and fixed costs, given reasonable expectations about future cost recovery over its economic life. It is the starting point for estimating the Net Cost of New Entry (Net CONE). Net CONE is defined as the operating margins that a new resource would need to earn in the capacity market, after netting margins earned in markets for energy and ancillary services (E&AS).
Accurate estimates of CONE, E&AS, and ultimately Net CONE are critical to RPM meeting its objectives because they provide the benchmark prices that define the administratively-determined demand curve for capacity (i.e., the variable resource requirements, or VRR, curves). Without accurate Net CONE estimates, the VRR curves cannot be expected to procure the target amounts of capacity needed to satisfy PJM’s resource adequacy requirements. Net CONE values are also used to establish offer price screens for market mitigation purposes under the Minimum Offer Price Rule (MOPR) for new generation offering capacity into RPM.2
We developed CONE estimates for gas-fired simple-cycle combustion turbine (CT) and combined-cycle (CC) power plants in each of the five administrative CONE Areas, with an assumed online date of June 1, 2018. Our estimates are based on complete plant designs reflecting the locations, technology choices, and plant configurations that developers are likely to choose, as indicated by actual projects and current environmental requirements. For both the CT and CC plants, we specify two GE 7FA turbines, with the CC equipped with a single heat recovery steam generator and steam turbine (“2×1 configuration”), cooling towers, and supplemental duct-firing capacity. All plants have selective catalytic reduction (SCR) for controlling NOx. Most have dual-fuel capability except in the Rest of RTO Area, where actual projects have generally not been designed with dual-fuel capability (however, we also provide an alternative estimate with dual fuel at PJM’s request following the gas delivery challenges experienced this past winter). CCs in the Southwestern Mid-Atlantic Area Council (SWMAAC) Area are also assumed not to have dual-fuel capability, consistent with projects in development and an assumption that they pay for firm gas transportation service instead. There
1 PJM Interconnection, L.L.C. (2014). Open Access Transmission Tariff, effective date 1/31/2014, (“PJM 2014 OATT”), accessed 5/1/2014 from http://www.pjm.com/~/media/documents/agreements/tariff.ashx, Section 5.10 a.
2 PJM 2014 OATT, Section 5.14 h.
iv|brattle.com
are no other major differences in plant specifications among regions, although plant capacities and heat rates vary regionally with elevation and with ambient summer conditions.
For each plant specified, we conducted a comprehensive, bottom-up analysis of the capital costs to build the plant: the engineering, procurement, and construction (EPC) costs, including equipment, materials, labor, and EPC contracting; and non-EPC owner’s costs, including project development, financing fees, gas and electric interconnection costs, and inventories. We separately estimated annual fixed operating and maintenance (O&M) costs, including labor, materials, property taxes, and insurance. We then translated the estimated costs into the annualized average net revenues the resource owner would have to earn over an assumed 20-year economic life to earn its required return on and of capital, assuming an after-tax weighted-average cost of capital (ATWACC) of 8.0% for a merchant investor, which we estimated based on various reference points. An ATWACC of 8.0% is equivalent to a return on equity of 13.8% at a 7% cost of debt and a 60/40 debt-to-equity capital structure.
Table 1 shows the resulting CONE values for CT plants in each CONE Area. We present the CONE estimates on both a “level-real” basis (a lower year-one cost recovery amount, assuming future contributions to cost recovery increase with inflation) and on a “level-nominal” basis (a higher year-one cost recovery requirement, assuming future contributions to cost recovery do not increase with inflation). As discussed in our 2014 VRR Report, we recommend that PJM transition from level-nominal to level-real CONE values. However, the following paragraphs discuss CONE in level-nominal terms to facilitate comparison to current parameter values.
Our CONE estimates vary by CONE Area due to differences in plant configuration and performance assumptions, labor rates, property tax laws, and other locational differences in capital and fixed O&M costs. The Eastern Mid-Atlantic Area Council (EMAAC) and SWMAAC Areas have the highest CT CONE estimates at $150,000/MW-year and $148,400/MW-year, respectively. Their higher CONE values reflect significantly higher labor costs in EMAAC and high property taxes in SWMAAC that are based on all property, not just land and buildings. The Western Mid-Atlantic Area Council (WMAAC) and Dominion Areas have the next highest CONE values of $143,500/MW-year and $141,200/MW-year, respectively. The Rest of RTO Area has the lowest CONE value of $138,000/MW-year due to the assumed absence of dual-fuel capability (consistent with observed development efforts) and lower labor costs. Under PJM’s alternative assumption that future entrants there will invest in dual-fuel capability, the CT CONE value increases to $147,500.
Table 1 also compares these CT CONE estimates to two reference points: PJM’s current parameters for the 2017/18 capacity auction and Brattle’s prior estimates for the 2015/16 delivery year from its 2011 PJM CONE Study.3 To produce a meaningful comparison, we show these reference points escalated to 2018 at 3% per year. As shown, our estimates are similar to the Brattle 2015/16 values, except in SWMAAC and Dominion where updated property tax calculations and labor costs contribute to increasing the CONE values by 9% and 15%, respectively. Our estimates in those
3 Spees, Kathleen, Samuel Newell, Robert Carlton, Bin Zhou, and Johannes Pfeifenberger, (2011). Cost
of New Entry Estimates for Combustion-Turbine and Combined-Cycle Plants in PJM, August 24, 2011, (“2011 PJM CONE Study”), available at http://www.pjm.com/documents/reports.aspx.

v|brattle.com
CONE Areas are closer to the PJM 2017/18 parameters (which are higher than the Brattle 2015/16 values largely because they were escalated from prior settlement values using a Handy-Whitman index that has risen significantly faster than actual plant costs, as noted in our 2014 VRR Report). In the other CONE Areas (EMAAC, Rest of RTO, and WMAAC), our estimates are lower than the 2017/18 parameters. Overall, our estimates are within -8% to +6% of PJM’s current parameters, depending on the Area.
Table 1 Recommended CT CONE for 2018/19
Sources and Notes:
Brattle 2015/16 estimates and PJM 2017/18 parameters escalated to 2018/19 at 3% annually, based on escalation rates for individual cost components.
Table 2 shows the recommended CONE estimates for CC plants in each CONE Area, with comparisons to prior CONE values. EMAAC has the highest CONE estimates at $203,900/MW-year due to labor costs that are higher than the rest of PJM. SWMAAC and WMAAC have the next highest CC CONE estimates at $197,200/MW-year and $190,900/MW-year, respectively. The CONE
CONE Area1 2 3 4 5
EMAAC SWMAAC RTO WMAAC Dominion
Gross CostsOvernight ($m) $400 $373 $348 $372 $364Installed ($m) $420 $391 $364 $390 $382First Year FOM ($m/yr) $6 $10 $7 $5 $8
Net Summer ICAP (MW) 396 393 385 383 391
Unitized CostsOvernight ($/kW) $1,012 $948 $903 $971 $931Installed ($/kW) $1,061 $994 $947 $1,018 $977Levelized FOM ($/MW-yr) $15,000 $25,600 $18,800 $13,700 $19,600
After-Tax WACC (%) 8.0% 8.0% 8.0% 8.0% 8.1%
Levelized Gross CONELevel-Real ($/MW-yr) $127,300 $126,000 $117,100 $121,800 $119,900Level-Nominal ($/MW-yr) $150,000 $148,400 $138,000 $143,500 $141,200
Prior CONE EstimatesPJM 2017/18 Parameter* ($/MW-yr) $161,600 $150,700 $148,000 $155,200 $132,400Brattle 2015/16 Estimate* ($/MW-yr) $145,700 $134,400 $134,200 $141,400 $120,600
Increase (Decrease) Above Prior CONE EstimatesPJM 2017/18 Parameter ($/MW-yr) ($11,600) ($2,300) ($10,000) ($11,700) $8,800Brattle 2015/16 Estimate ($/MW-yr) $4,300 $14,000 $3,800 $2,000 $20,600
PJM 2017/18 Parameter (%) -8% -2% -7% -8% 6%Brattle 2015/16 Estimate (%) 3% 9% 3% 1% 15%

vi|brattle.com
Areas with the lowest values are Rest of RTO (due to the lack of dual fuel) at $188,100/MW-year, and Dominion (as it has the lowest labor costs) at $182,400/MW-year. Under PJM’s alternative assumption that future entrants will invest in dual-fuel capability in the Rest of RTO Area, the CC CONE value there increases to $193,700.
Compared to the Brattle 2015/16 values, the current CC CONE estimates are higher across all CONE Areas due to higher estimated costs of EPC contingency, owner’s project development costs, and plant O&M costs. While the EPC contract costs increased in all Areas, the SWMAAC and Dominion values increased more due to higher estimated labor costs than in the previous analysis, as we found the prevailing wages in those regions include both union and non-union labor, whereas the previous analysis assumed strictly non-union labor.
Table 2 Recommended CC CONE for 2018/19
Sources and Notes:
Brattle 2015/16 estimates and PJM 2017/18 parameters escalated to 2018/19 at 3% annually, based on escalation rates for individual cost components.
CONE Area1 2 3 4 5
EMAAC SWMAAC RTO WMAAC Dominion
Gross CostsOvernight ($m) $808 $707 $709 $737 $708Installed ($m) $885 $775 $777 $808 $776First Year FOM ($m/yr) $17 $30 $19 $15 $19
Net Summer ICAP (MW) 668 664 651 649 660
Unitized CostsOvernight ($/kW) $1,210 $1,065 $1,089 $1,137 $1,073Installed ($/kW) $1,326 $1,168 $1,193 $1,245 $1,176Levelized FOM ($/MW-yr) $26,000 $44,800 $29,500 $23,300 $28,300
After-Tax WACC (%) 8.0% 8.0% 8.0% 8.0% 8.1%
Levelized Gross CONELevel-Real ($/MW-yr) $173,100 $167,400 $159,700 $162,000 $154,800Level-Nominal ($/MW-yr) $203,900 $197,200 $188,100 $190,900 $182,400
Prior CONE EstimatesPJM 2017/18 Parameter* ($/MW-yr) $199,900 $176,300 $192,900 $191,800 $170,100Brattle 2015/16 Estimate* ($/MW-yr) $183,700 $161,000 $177,100 $176,700 $157,000
Increase (Decrease) Above Prior CONE EstimatesPJM 2017/18 Parameter ($/MW-yr) $4,100 $20,900 ($4,700) ($900) $12,200Brattle 2015/16 Estimate ($/MW-yr) $20,300 $36,200 $11,100 $14,200 $25,400
PJM 2017/18 Parameter (%) 2% 11% -3% 0% 7%Brattle 2015/16 Estimate (%) 10% 18% 6% 7% 14%

vii|brattle.com
The updated CC CONE values have increased over the prior estimates more than the CT CONE values have, leading to a higher cost premium for CCs of $41,000–54,000/MW-year compared to $27,000-43,000/MW-year in our prior study. The most significant driver for the greater CC CONE increase is the relative difference in plant O&M costs estimated by S&L compared to the previous analysis. Fixed O&M costs decreased for CTs (with a larger fraction treated as variable costs) but increased for CCs. This difference explains approximately two-thirds of the increase in the CC premium over CTs. The rest of the difference is explained by higher labor rates and contingency and project development factors than in the prior study, which add more dollars to the cost of the more capital-intensive CC than the CT. In the Dominion CONE Area, the addition of the SCR to the CT largely offsets these differences.
The Brattle authors and Sargent & Lundy (S&L) collaborated in completing the CONE analysis and preparing this study. The specification of plant characteristics was jointly developed by both teams, with S&L taking primary responsibility for developing the plant proper capital, plant O&M, and major maintenance costs and the Brattle authors taking responsibility for various owner’s costs and fixed O&M costs, and for translating the cost estimates into the CONE values.

1|brattle.com
I. Introduction
A. BACKGROUND AND OBJECTIVE
PJM’s capacity market, the Reliability Pricing Model (RPM), features a three-year forward auction and subsequent incremental auctions in which Variable Resource Requirement (VRR) curves set the “demand.” The VRR curves are determined administratively based on a design objective to procure sufficient capacity for maintaining resource adequacy in all locations while also mitigating price volatility and susceptibility to market power abuse. To procure sufficient capacity, the VRR curves’ price-quantity combinations are established to be consistent with the assumption that, in a long-term economic equilibrium, new entrants will set average capacity market prices at the Net Cost of New Entry (Net CONE). Net CONE is the first-year capacity revenue a new generation resource would need (in combination with expected energy and ancillary services margins) to recover its capital and fixed costs, given reasonable expectations about future cost recovery under continued equilibrium conditions. Thus, the sloped demand curve is assigned a price equal to Net CONE at approximately the point where the quantity equals the desired average reserve margin.4 VRR curve prices are higher at lower reserve margins and lower at higher reserve margins, but all price points on the curve are indexed to Net CONE.
Just prior to each three-year forward auction, PJM determines Net CONE values for each of five CONE Areas, which are used to establish VRR curves for the system and for all Locational Deliverability Areas (LDAs). PJM calculates Net CONE for a defined “reference resource” by subtracting its estimated one-year energy and ancillary services (E&AS) net revenues from its estimated Cost of New Entry (CONE). CONE values are determined through triennial CONE studies (or litigated settlements), with escalation rates applied to the subsequent two auctions.5 PJM separately estimates net E&AS revenue offsets annually for setting the Net CONE in each auction.
PJM has traditionally estimated CONE and Net CONE based on a gas-fired simple-cycle combustion turbine (CT) as the reference technology. However, as we explain in the concurrently-released 2014 VRR Report, we recommend defining the VRR curve based on the average Net CONE of a CT and a gas-fired combined-cycle gas turbine (CC).6 If PJM and stakeholders accept this recommendation, they will need estimates for both a CT and a CC in setting the VRR curve. If they do not, PJM will still need both estimates for calculating offer price screens under the Minimum Offer Price Rule (MOPR) for new generation offering capacity into RPM.7
4 The exact quantity on the VRR curve where the price equals Net CONE is actually 1% above the IRM
reliability requirement in order to reduce the likelihood of deficient outcomes. However, our concurrently-released VRR Curve report finds that even with this adjustment, the existing VRR curve is likely to fall short of reliability objectives. For more details, see 2014 VRR Report.
5 PJM 2014 OATT, Section 5.10 a. 6 2014 VRR Report. 7 PJM 2014 OATT, Section 5.14 h.

2|brattle.com
We were asked to assist PJM and stakeholders in this triennial review by developing CONE estimates for new CT and CC plants in each of the five CONE Areas. In this study, we define the CT and CC reference technologies and estimate their CONEs in the five CONE Areas.
B. ANALYTICAL APPROACH
Our analytical starting point for estimating CONE is a detailed characterization of the CC and CT plants in each CONE Area to reflect the technologies, plant configurations, and locations where developers are most likely to build. While the turbine technology for each plant is specified in the tariff (GE 7FA), we provide a review of the most recent gas-fired generation projects in PJM and the U.S. to determine whether this assumption is still relevant to the PJM market.8 The key configuration variables we define for each plant include the number of gas and steam turbines, NOx
controls, duct firing and power augmentation, cooling systems, dual-fuel capability, and gas compression. We selected specific plant characteristics based on: our analysis of the predominant practices among recently-developed plants; our analysis of technologies, regulations, and infrastructure; and our experience with previous projects. Key site characteristics include proximity to high voltage transmission infrastructure and interstate gas pipelines, siting attractiveness as indicated by units recently built or currently under construction, and availability of vacant industrial land. Our analysis for selecting plant locations and technical specifications for each CONE Area is presented in Section II.
We developed comprehensive, bottom-up estimates of the costs of building and maintaining the specified plants in Section III. S&L estimated plant proper capital costs—equipment, materials, labor, and EPC contracting costs—based on a complete plant design and S&L’s proprietary database on actual projects. S&L and Brattle then estimated the owner’s capital costs, including gas and electric interconnection, development and startup costs, land, inventories, and financing fees using S&L’s proprietary data and additional analysis of each component.
We estimated annual fixed operations and maintenance (fixed O&M) costs, including labor, materials, property tax, insurance, asset management costs, and working capital. The results of this analysis are presented in Section IV.
Next, we translated these costs into the capital and fixed cost recovery the plant would have to earn in its first year, which we call the “Cost of New Entry” (“CONE”). CONE depends on the estimated capital and fixed O&M costs as well as the estimated cost of capital consistent with the project’s risk and the assumed economic life of the asset. CONE also depends on developers’ long-term market view and how it impacts the cost recovery path for the plant, specifically whether they can expect to earn as much in later years as in earlier years. We present our financial assumptions for calculating CONE in Section V.
Finally, in Section VI, we offer CONE calculations based on two different assumed cost recovery paths: one in which future revenues are assumed to remain constant in real-terms, which we recommend, as explained in our 2014 VRR Report; and one in which future revenues are assumed to
8 PJM, PJM Manual 18: PJM Capacity Market, Revision: 22, p. 21.

3|brattle.com
remain constant in nominal terms, which PJM has historically assumed. The level-real assumption results in lower CONE values.
The Brattle authors and Sargent & Lundy collaborated on completing this study and report. The specification of plant characteristics was jointly developed by both teams, with S&L taking primary responsibility for developing the plant proper capital, plant O&M and major maintenance costs and the Brattle authors taking responsibility for various owner’s costs and fixed O&M costs, and for translating the cost estimates into the CONE values.
II. Determination of Reference Technologies
Similar to the 2011 PJM CONE Study, we determined the characteristics of the reference technology primarily based on a “revealed preferences” approach that relies on our review of the choices that actual developers found to be most feasible and economic. However, because technologies and environmental regulations continue to evolve, we supplement our analysis with additional review of the underlying economics, regulations, and infrastructure, and S&L’s experience. For selecting the reference technology location within each CONE Area, we modified our analysis from the 2011 PJM CONE Study to take into account a broader view of potential sites that can be considered feasible and favorable for new plant development. As the basis for determining most of the selected reference technology specifications, we updated our analysis from the 2011 study by examining CT and CC plants built in PJM and the U.S. since 2008, including plants currently under construction. We characterized these plants by size, plant configuration, turbine type, NOx controls, CO catalyst, duct firing, dual-fuel capability, and cooling system.
A. LOCATIONAL SCREEN
The Open Access Transmission Tariff (OATT) requires a separate CONE parameter in each of five CONE Areas as summarized in Table 3.9
Table 3 PJM CONE Areas
9 PJM 2014 OATT, Section 5.10 a.
CONE Area Transmission Zones States
1 Eastern MAAC AECO, DPL, JCPL, PECO, PSEG, RECO NJ, MD, DE2 Southwest MAAC BGE, PEPCO MD, DC3 Rest of RTO AEP, APS, ATSI, ComEd, DAY, DEOK, DQL WV, VA, OH, IN, IL, KY, TN, MI4 Western MAAC MedEd, Penelec, PPL PA5 Dominion Dominion VA, NC

4|brattle.com
We conducted a locational screening analysis to identify feasible and favorable locations for each of the five CONE Areas. Our approach for identifying the representative locations within each CONE Area included three steps:
1. We identified candidate locations based on revealed preference of actual plants built since 2002 or recently proposed plants to identify the areas of primary development, putting more weight on recent projects.
2. We sharpened the definition of likely areas for future development, depending on the extent of information available from the first step. For CONE Areas where recent projects provide a clear signal of favored locations, we only excluded counties that would appear to be less attractive going forward, based on environmental constraints or economic costs (absent special offsetting factors we would not know about). For CONE Areas where revealed preference data is weak or scattered, we identified promising locations from a developer perspective based on proximity to gas and electric interconnections and key economic factors such as labor rates and energy prices
3. This approach results in identifying a specified area that spans a wider range of counties than the previous CONE study. For this reason, we developed cost estimates for each CONE Area by taking the average of cost inputs (e.g., labor rates) across the specified locations.
We describe next the results of the screening analysis that we used for determining the reference plant locations in each CONE Area. The locations chosen for each CONE Area are shown in Figure 1. To provide a more detailed description of the specified locations, we show the cities used for estimating labor rates in Table 4.
Our review of recent development in CONE Area 1 EEastern MAAC (EMAAC) resulted in identifying two areas where significant development has occurred since 2002. The first area is in northern New Jersey along the I-95 corridor, where four plants have been built since 2002, including the 2012 Kearny peaking facility, and three additional CC plants are in the planning phase. The second area includes Philadelphia and the southernmost New Jersey counties, where two CC plants have been built and three additional facilities are in the planning phase. With significant development in both areas and no reason for excluding either due to environmental or economic reasons, we include both as our reference locations.
In CONE Area 2 SSouthwest MAAC (SWMAAC), four new projects are in various stages of development (three CCs and one CT) in the area around Waldorf, Maryland including portions of Charles and Prince George’s counties. Despite the strong indication of developers’ preferences to build in this area, limits on the existing gas infrastructure are expected to create gas supply challenges that will be addressed in the cost estimation section of this study. There is limited development in the rest of the region.
For the larger CONE Area 3 RRest of RTO CONE Area, the revealed preferences approach indicated three favored areas based on our review of recently built or in-development plants: northern Illinois, northwest Ohio, and the Pennsylvania, Ohio, and West Virginia portions of the Ohio River valley.

5|brattle.com
Further analysis resulted in excluding northern Illinois due to relatively low energy revenues and high labor costs, which disfavor this area relative to the others identified. For these reasons, we chose the counties in northwest Ohio and the Ohio River valley region for estimating costs in the Rest of RTO Area.
In CONE Area 4 WWestern MAAC (WMAAC), developers have demonstrated a willingness to build primarily in mid-eastern Pennsylvania, including areas around Allentown, Scranton, and Lancaster. Projects include the Mehoopany peaking facilities added in 2013 and five CC facilities in different planning stages within this region. We found no reasons to narrow or expand the specified area further.
In CONE Area 5 DDominion, we identified two promising areas, one with several operating plants (in north-central Virginia) and the other with two proposed plants (south-central Virginia), both of which appear to meet developers’ gas and electric infrastructure needs. We expanded the region considered to include both areas as well as the counties in between, which amounts to the counties along and just west of I-95 in Virginia.

6|brattle.com
Figure 1 Results of Locational Screening for each CONE Area
Source: Map provided by SNL Financial
Data on operating and planned projects downloaded from SNL Financial between November 2013 and March 2014.
Table 4 CONE Area Labor Pools
CONE Area1 2 3 4 5
EMAAC SWMAAC Rest of RTO WMAAC Dominion
Jersey City, NJ Washington, DC Pittsburgh, PA Reading, PA Petersburg, VANewark, NJ Annapolis, MD New Castle, PA Williamsport, PA Richmond, VACamden, NJ Alexandria, VA Steubenville, OH Wilkes-Barre, PA Alexandria, VA
New Brunswick, NJ Cleveland, OHNewark, DE Lorain, OH
Wilmington, DE Toledo, OHPhiladelphia, PA Wheeling, WV
Parkersburg, WVHuntington, WV

7|brattle.com
We calculate the plant operating characteristics (e.g., net capacity and heat rate) of the reference technologies using turbine vendors’ performance estimation software for the combustion turbines output and GateCycle software for the remainder of the CC plant. For the specified locations within each CONE Area, we estimate the performance characteristics at a representative elevation and at a temperature and humidity that reflects peak conditions in the median year.10 The assumed ambient conditions for each location are shown in Table 5.
Table 5 Assumed PJM CONE Area Ambient Conditions
Source:
Elevation estimated by S&L based on geography of specified area. Summer conditions developed by S&L based on data from the National Climatic Data Center’s Engineering Weather dataset.
B. PLANT SIZE, CONFIGURATION AND TURBINE MODEL
While the turbine technology for each plant is specified in the tariff (i.e., GE 7FA as the turbine model), we provide a review of the most recent gas-fired generation projects in PJM and the U.S. to confirm this assumption.11 We reviewed CT and CC projects built or currently proposed in PJM and across the U.S. to determine the configuration, size, and turbine types for the reference technologies.
10 The 50/50 summer peak day ambient condition data developed from National Climatic Data Center,
Engineering Weather 2000 Interactive Edition, Asheville, NC, 2000. Adjustments were made for adapting the values to representative site elevation using J.V. Iribarne, and W.L. Godson, Atmospheric Thermodynamics, Second Edition, Dordrecht, Holland: D. Reidel Publishing Company, 1981.
11 PJM 2014 OATT, Attachment DD, Section 2, see definition for Reference Resource.
CONE Area ElevationMax. Summer
TempRelative
Humidity(ft) (deg F) (%RH)
1 Eastern MAAC 110 94.0 44.2 2 Southwest MAAC 150 95.2 45.2 3 Rest of RTO 1,070 89.5 50.2 4 Western MAAC 1,200 91.0 46.0 5 Dominion 390 93.7 47.2
8|brattle.com
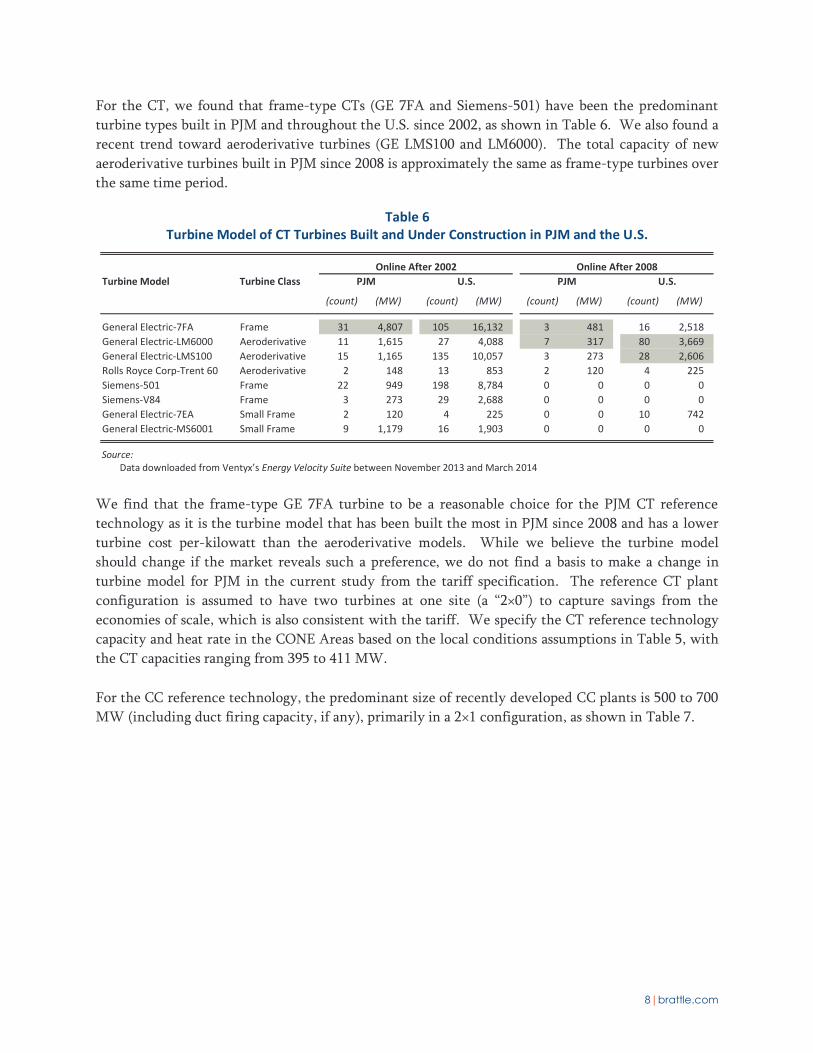
For the CT, we found that frame-type CTs (GE 7FA and Siemens-501) have been the predominant turbine types built in PJM and throughout the U.S. since 2002, as shown in Table 6. We also found a recent trend toward aeroderivative turbines (GE LMS100 and LM6000). The total capacity of new aeroderivative turbines built in PJM since 2008 is approximately the same as frame-type turbines over the same time period.
Table 6 Turbine Model of CT Turbines Built and Under Construction in PJM and the U.S.
Source:
Data downloaded from Ventyx’s Energy Velocity Suite between November 2013 and March 2014
We find that the frame-type GE 7FA turbine to be a reasonable choice for the PJM CT reference technology as it is the turbine model that has been built the most in PJM since 2008 and has a lower turbine cost per-kilowatt than the aeroderivative models. While we believe the turbine model should change if the market reveals such a preference, we do not find a basis to make a change in turbine model for PJM in the current study from the tariff specification. The reference CT plant configuration is assumed to have two turbines at one site (a “2×0”) to capture savings from the economies of scale, which is also consistent with the tariff. We specify the CT reference technology capacity and heat rate in the CONE Areas based on the local conditions assumptions in Table 5, with the CT capacities ranging from 395 to 411 MW.
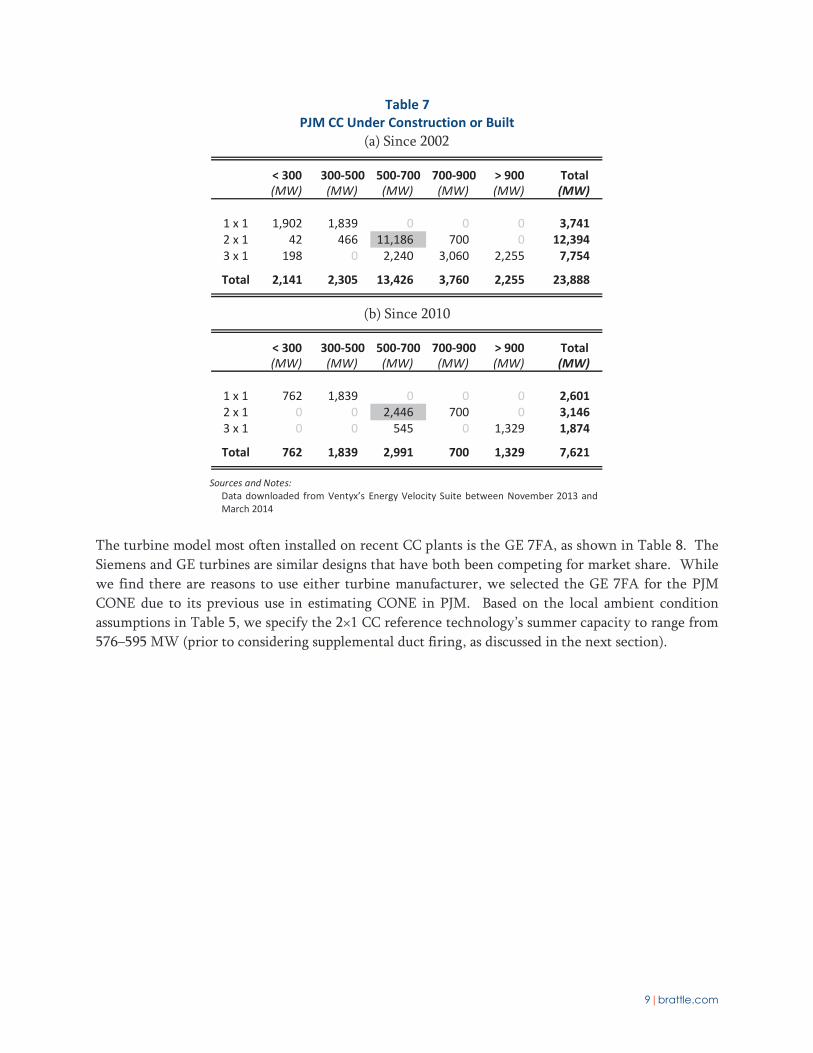
For the CC reference technology, the predominant size of recently developed CC plants is 500 to 700 MW (including duct firing capacity, if any), primarily in a 2×1 configuration, as shown in Table 7.
Online After 2002 Online After 2008Turbine Model Turbine Class PJM U.S. PJM U.S.
(count) (MW) (count) (MW) (count) (MW) (count) (MW)
General Electric-7FA Frame 31 4,807 105 16,132 3 481 16 2,518General Electric-LM6000 Aeroderivative 11 1,615 27 4,088 7 317 80 3,669General Electric-LMS100 Aeroderivative 15 1,165 135 10,057 3 273 28 2,606Rolls Royce Corp-Trent 60 Aeroderivative 2 148 13 853 2 120 4 225Siemens-501 Frame 22 949 198 8,784 0 0 0 0Siemens-V84 Frame 3 273 29 2,688 0 0 0 0General Electric-7EA Small Frame 2 120 4 225 0 0 10 742General Electric-MS6001 Small Frame 9 1,179 16 1,903 0 0 0 0
9|brattle.com
Table 7 PJM CC Under Construction or Built
(a) Since 2002
(b) Since 2010
Sources and Notes:
Data downloaded from Ventyx’s Energy Velocity Suite between November 2013 and March 2014
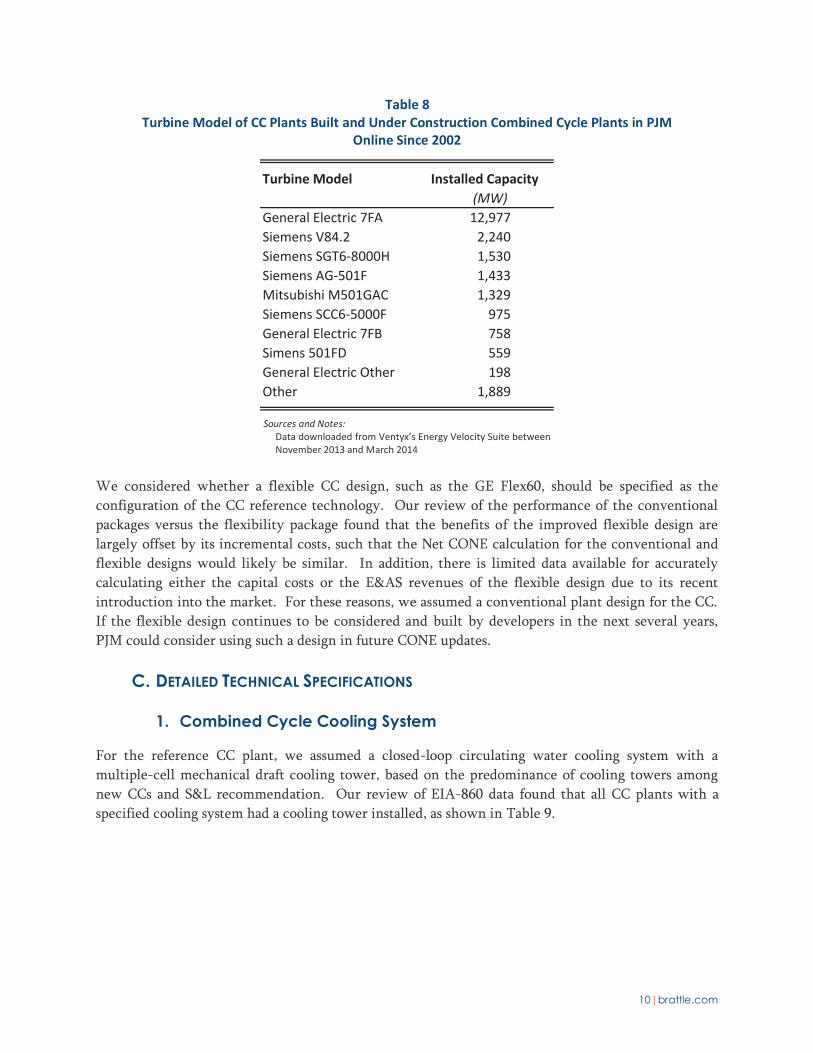
The turbine model most often installed on recent CC plants is the GE 7FA, as shown in Table 8. The Siemens and GE turbines are similar designs that have both been competing for market share. While we find there are reasons to use either turbine manufacturer, we selected the GE 7FA for the PJM CONE due to its previous use in estimating CONE in PJM. Based on the local ambient condition assumptions in Table 5, we specify the 2×1 CC reference technology’s summer capacity to range from 576–595 MW (prior to considering supplemental duct firing, as discussed in the next section).
< 300 300-500 500-700 700-900 > 900 Total(MW) (MW) (MW) (MW) (MW) (MW)
1 x 1 1,902 1,839 0 0 0 3,7412 x 1 42 466 11,186 700 0 12,3943 x 1 198 0 2,240 3,060 2,255 7,754
Total 2,141 2,305 13,426 3,760 2,255 23,888
< 300 300-500 500-700 700-900 > 900 Total(MW) (MW) (MW) (MW) (MW) (MW)
1 x 1 762 1,839 0 0 0 2,6012 x 1 0 0 2,446 700 0 3,1463 x 1 0 0 545 0 1,329 1,874
Total 762 1,839 2,991 700 1,329 7,621
10|brattle.com
Table 8 Turbine Model of CC Plants Built and Under Construction Combined Cycle Plants in PJM
Online Since 2002
Sources and Notes:
Data downloaded from Ventyx’s Energy Velocity Suite between November 2013 and March 2014
We considered whether a flexible CC design, such as the GE Flex60, should be specified as the configuration of the CC reference technology. Our review of the performance of the conventional packages versus the flexibility package found that the benefits of the improved flexible design are largely offset by its incremental costs, such that the Net CONE calculation for the conventional and flexible designs would likely be similar. In addition, there is limited data available for accurately calculating either the capital costs or the E&AS revenues of the flexible design due to its recent introduction into the market. For these reasons, we assumed a conventional plant design for the CC. If the flexible design continues to be considered and built by developers in the next several years, PJM could consider using such a design in future CONE updates.
C. DETAILED TECHNICAL SPECIFICATIONS
1. Combined Cycle Cooling System
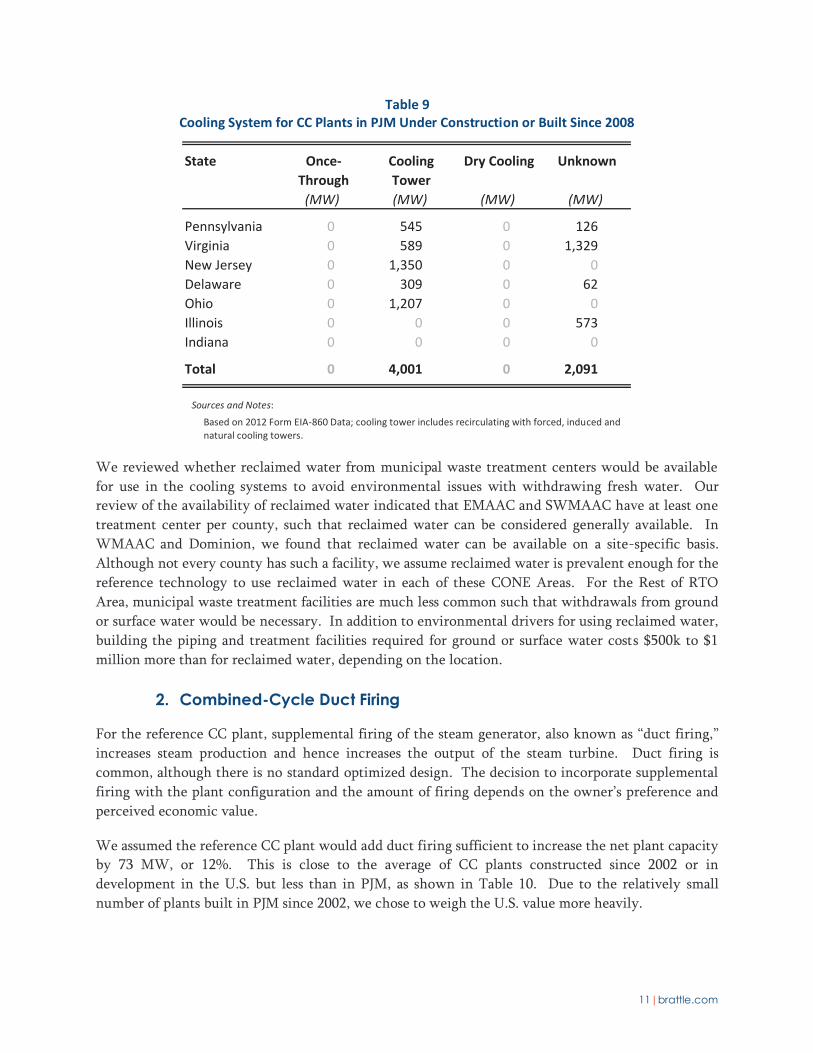
For the reference CC plant, we assumed a closed-loop circulating water cooling system with a multiple-cell mechanical draft cooling tower, based on the predominance of cooling towers among new CCs and S&L recommendation. Our review of EIA-860 data found that all CC plants with a specified cooling system had a cooling tower installed, as shown in Table 9.
Turbine Model Installed Capacity(MW)
General Electric 7FA 12,977Siemens V84.2 2,240Siemens SGT6-8000H 1,530Siemens AG-501F 1,433Mitsubishi M501GAC 1,329Siemens SCC6-5000F 975General Electric 7FB 758Simens 501FD 559General Electric Other 198Other 1,889
11|brattle.com
Table 9 Cooling System for CC Plants in PJM Under Construction or Built Since 2008
Sources and Notes:
Based on 2012 Form EIA-860 Data; cooling tower includes recirculating with forced, induced and natural cooling towers.
We reviewed whether reclaimed water from municipal waste treatment centers would be available for use in the cooling systems to avoid environmental issues with withdrawing fresh water. Our review of the availability of reclaimed water indicated that EMAAC and SWMAAC have at least one treatment center per county, such that reclaimed water can be considered generally available. In WMAAC and Dominion, we found that reclaimed water can be available on a site-specific basis. Although not every county has such a facility, we assume reclaimed water is prevalent enough for the reference technology to use reclaimed water in each of these CONE Areas. For the Rest of RTO Area, municipal waste treatment facilities are much less common such that withdrawals from ground or surface water would be necessary. In addition to environmental drivers for using reclaimed water, building the piping and treatment facilities required for ground or surface water costs $500k to $1 million more than for reclaimed water, depending on the location.
2. Combined-Cycle Duct Firing
For the reference CC plant, supplemental firing of the steam generator, also known as “duct firing,” increases steam production and hence increases the output of the steam turbine. Duct firing is common, although there is no standard optimized design. The decision to incorporate supplemental firing with the plant configuration and the amount of firing depends on the owner’s preference and perceived economic value.
We assumed the reference CC plant would add duct firing sufficient to increase the net plant capacity by 73 MW, or 12%. This is close to the average of CC plants constructed since 2002 or in development in the U.S. but less than in PJM, as shown in Table 10. Due to the relatively small number of plants built in PJM since 2002, we chose to weigh the U.S. value more heavily.
State Once-Through
Cooling Tower
Dry Cooling Unknown
(MW) (MW) (MW) (MW)
Pennsylvania 0 545 0 126Virginia 0 589 0 1,329New Jersey 0 1,350 0 0Delaware 0 309 0 62Ohio 0 1,207 0 0Illinois 0 0 0 573Indiana 0 0 0 0
Total 0 4,001 0 2,091

12|brattle.com
Table 10 Duct-Firing Capability of CC Plants Constructed Since 2002 and In Development
Sources and Notes:
Data on duct firing capacities for CC plants downloaded from Ventyx’s Energy Velocity Suite in 2014
Including duct firing increases the net capacity of the plant but reduces efficiency due to the higher incremental heat rate of the supplemental firing (when operating in duct firing mode) and the reduced efficiency of steam turbine (when not operating at full output). The estimated heat rates and capacities take account for this effect.
3. Power Augmentation
Based on our analysis in the 2011 PJM CONE Study, we included evaporative coolers downstream of the filtration system to lower the combustion turbine inlet air temperature during warm weather operation. This increases turbine output and efficiency for only a small increase in capital cost. In addition, the combustion turbines in both simple- and combined-cycle arrangements are equipped with an inlet filtration system to protect from airborne dirt and particles. Evaporative coolers and associated equipment add $3 million per combustion turbine to the capital costs.
4. Emissions Controls
Emission control technology requirements for new major stationary sources are determined through the New Source Review (NSR) pre-construction permitting program. The NSR permitting program evaluates the quantity of regulated air pollutants the proposed facility has the potential-to-emit and determines the appropriate emission control technology/practice required for each air pollutant. The regulated air pollutants that will have the most impact on emission control technology requirements for new CTs and CCs are nitrogen oxides (NOx) and carbon monoxide (CO).
NOx and CO emissions from proposed gas-fired facilities located in PJM will be evaluated through two different types of NSR permitting requirements:
Non-attainment NSR (NNSR) for NOx emissions; and Prevention of Significant Deterioration (PSD) for CO emissions.
NOx emissions are evaluated through the NNSR permitting requirements, because NOx (a precursor to ozone) is treated as a non-attainment air pollutant for all areas within the Ozone Transport Region
Installed Capacity
No. of Plants
Avg. Plant Size
Avg. Duct Fired Capacity
Duct Fired Addition %
(MW) (count) (MW) (MW) (%)
PJM 2,020 3 673 93 16%U.S. 35,865 56 640 77 14%
13|brattle.com
(OTR) regardless of ozone attainment status.12 Except for Rest of RTO, all of the CONE Areas in PJM are within OTR, and thus, emissions of NOx from proposed facilities are treated as a non-attainment air pollutant and evaluated through non-attainment new source review (NNSR). The Rest of RTO is currently non-attainment for 8-hour ozone.
New CTs and CCs with no federally enforceable restrictions on operating hours are deemed a major source of NOx emissions, and therefore, trigger a Lowest Achievable Emission Rates (LAER) analysis to evaluate NOx emission control technologies. The NOx emission control technology required by the LAER analysis is likely to be a selective catalytic reduction (SCR) system. SCR systems are widely recognized as viable technology on aeroderivative and smaller E-class frame combustion turbines and have more recently been demonstrated on F-class frame turbines. Our assumptions of an SCR on the F-class turbine is supported by the Commission’s recent determination in approving the NYISO’s assumption of F-class turbine with SCR as the proxy unit for its proposed Demand Curves that “the record of evidence presented in support of the frame unit with SCR is adequate in order to find that NYISO reasonably concluded that the F class frame with SCR is a viable technology.”13 In addition, we assume inlet air filters and dry low NOx burners, which are also necessary to achieve the required emissions reductions.
CO emissions are evaluated through the PSD permitting requirements, because PJM is designated as an attainment area for CO. New combustion turbine facilities with no operating hour restrictions have the potential-to-emit CO in a quantity that exceeds the significant emission threshold for CO, and therefore, trigger a Best Available Control Technology (BACT) analysis to evaluate CO emission control technologies. The CO emission control technology required as a result of a BACT analysis is likely to be an oxidation catalyst (CO Catalyst) system.
For these reasons, we assume an SCR and a CO Catalyst system as the likely requirements resulting from the NSR permitting program for new gas-fired facilities proposed in all CONE Areas. The most significant change from the 2011 PJM CONE Study is assuming an SCR on the CT in Dominion, which is being added due to additional consideration of the regulatory requirements of being located in the Ozone Transport Region. The CO Catalyst system in all areas is expected to increase costs of emissions control equipment by $2.4 million (in 2014 dollars) over the 2011 CONE study.
5. Dual Fuel Capability, Firm Gas Contracts, and Gas Compression
We largely maintained our assumption from the 2011 PJM CONE Study that the reference CT and CC plants would install dual-fuel capability in all CONE Areas except for the Rest of RTO Area, based on a review of recent projects. The Rest of RTO Area is assumed to be single-fuel, although at PJM’s request we also calculated CONE estimates for Rest of RTO with dual-fuel capability in Section VI).
12 The Ozone Transport Region (OTR) includes all of New England as well as Delaware, the District of
Columbia, Maryland, New Jersey, New York, Pennsylvania, and portions of Virginia. 13 Federal Energy Regulatory Commission (2014). Order 146 FERC ¶ 61,043, Issued January 28, 2014, at
paragraph 58. Docket No. ER14-500-000.
14|brattle.com
Our assumptions have changed only for CCs in SWMAAC, where we do not assume dual fuel, consistent with the CPV St. Charles project under development there.14 Instead, we assume firm transportation service on the Dominion Cove Point (DCP) pipeline. We understand from shippers that the DCP pipeline is capacity-constrained and also has limited operational flexibility. Firm transportation avoids interruptions, although it may not provide additional operational flexibility. Firm transportation also largely eliminates the value of dual-fuel capability (except when the three major interstate pipelines to which the DCP pipeline is connected become constrained). However, we do not assume firm transportation for the reference CT plant since firm gas is unlikely to be economic for a plant that operates at a low capacity factor. We assume the CT will have dual-fuel capability.
To be capable of firing gaseous and liquid fuels, the plants are assumed to be equipped with enough liquid fuel storage and infrastructure on-site for three days of continuous operation. Dual-fuel capability also requires the combustion turbines to have water injection nozzles to reduce NOx emissions while firing liquid fuel. These modifications as well as the costs associated with fuel oil testing, commissioning, inventory, and the capital carrying charges on the additional capital costs contribute to the overall costs for dual-fuel capability. The incremental cost is approximately $22 million for the CC and $24 million for the CT (in 2014 dollars), including equipment, labor, and materials, indirect costs, and fuel inventory.15 That contributes approximately $9,500/MW-year to the CONE for the CT and $5,600/MW-year for the CC (in 2018 dollars and in level-nominal terms). For CCs in SWMAAC, firm transportation avoids these costs, but the firm transportation itself costs about twice as much, as discussed in Section IV.A.5.
Based on our analysis in the 2011 PJM CONE Study, we determined gas compression would not be needed for new gas plants with frame-type combustion turbines located near and/or along the major gas pipelines selected in our study. The frame machines generally operate at lower gas pressures than the gas pipelines.
6. Black Start Capability
Based on our analysis in the 2011 PJM CONE Study, we did not include black start capability in either the CC or CT reference units because few recently built gas units have this capability.
14 Environmental Consulting & Technology, Inc. (2011), Demonstration of Compliance with Air Quality
Control Requirements and Request for Prevention of Significant Deterioration (PSD) and Nonattainment New Source Review (NNSR) Approvals: CPV St. Charles Project, 725-MW Combined Cycle Project, Prepared for Competitive Power Ventures Maryland, LLC (CPV), ECT No. 110122-0200, August 2011.
15 The incremental cost of dual-fuel capability is higher for the CT due to the cost of the demineralized water package that is already assumed to be installed for the CC for its steam cycle.
15|brattle.com
7. Electrical Interconnection
While all CONE Areas have a variety of transmission voltages, both lower and higher than 345 kV, we selected 345 kV as the typical voltage for new CT and CC plants to interconnect to the transmission grid in PJM. The switchyard is assumed to be within the plant boundary and is counted as an EPC cost under “Other Equipment,” including generator circuit breakers, main power and auxiliary generator step-up transformers, and switchgear. All other electric interconnection equipment, including generator lead and network upgrades, is included separately under Owner’s Costs, as presented in Section III.B.4.
D. SUMMARY OF REFERENCE TECHNOLOGY SPECIFICATIONS
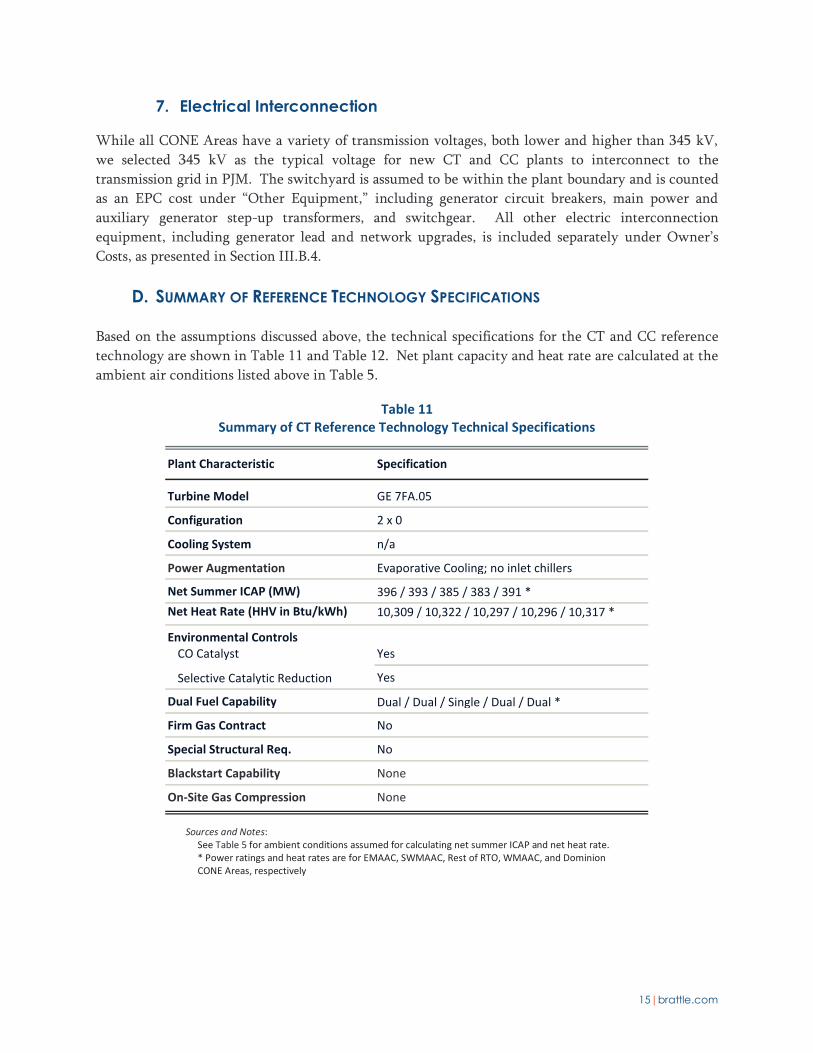
Based on the assumptions discussed above, the technical specifications for the CT and CC reference technology are shown in Table 11 and Table 12. Net plant capacity and heat rate are calculated at the ambient air conditions listed above in Table 5.
Table 11 Summary of CT Reference Technology Technical Specifications
Sources and Notes: See Table 5 for ambient conditions assumed for calculating net summer ICAP and net heat rate.
* Power ratings and heat rates are for EMAAC, SWMAAC, Rest of RTO, WMAAC, and Dominion CONE Areas, respectively
Plant Characteristic Specification
Turbine Model GE 7FA.05
Configuration 2 x 0
Cooling System n/a
Power Augmentation Evaporative Cooling; no inlet chillers
Net Summer ICAP (MW) 396 / 393 / 385 / 383 / 391 *Net Heat Rate (HHV in Btu/kWh) 10,309 / 10,322 / 10,297 / 10,296 / 10,317 *
Environmental ControlsCO Catalyst Yes
Selective Catalytic Reduction Yes
Dual Fuel Capability Dual / Dual / Single / Dual / Dual *
Firm Gas Contract No
Special Structural Req. No
Blackstart Capability None
On-Site Gas Compression None

16|brattle.com
Table 12 Summary of CC Reference Technology Technical Specifications
Sources and Notes: See Table 5 for ambient conditions assumed for calculating net summer ICAP and net heat rate.
* CONE Area 3 uses ground/surface water; all others use reclaimed water for cooling
** For EMAAC, SWMAAC, Rest of RTO, WMAAC, and Dominion CONE Areas, respectively
III. Capital Cost Estimates
Capital costs are those costs incurred when constructing the power plant before the commercial online date. Power plant developers typically hire an engineering, procurement, and construction (EPC) company to complete construction and to ensure the plant operates properly. EPC costs include major equipment, labor, and materials, and non-EPC or owner’s costs, include development costs, startup costs, interconnection costs, and inventories.
All equipment and material costs are initially estimated by S&L in 2014 dollars using S&L proprietary data, vendor catalogs, or publications. Both labor rates and materials costs have been estimated for the specific counties chosen as representative of each CONE Area. Estimates for the number of labor hours and quantities of material and equipment needed to construct simple and combined-cycle plants are based on S&L experience on similarly sized and configured facilities.
Plant Characteristic Specification
Turbine Model GE 7FA.05
Configuration 2 x 1
Cooling System Cooling Tower *
Power Augmentation Evaporative Cooling; no inlet chillers
Net Summer ICAP (MW)w/o Duct Firing 595 / 591 / 578 / 576 / 587 **with Duct Firing 668 / 664 / 651 / 649 / 660 **
Net Heat Rate (HHV in Btu/kWh)w/o Duct Firing 6,800 / 6,811 / 6,791 / 6,792 / 6,808 **with Duct Firing 7,028 / 7,041 / 7,026 / 7,027 / 7,039 **
Environmental ControlsCO Catalyst Yes
Selective Catalytic Reduction Yes
Dual Fuel Capability Dual / Single / Single / Dual / Dual **
Firm Transportation Service No / Yes / No / No / No **
Special Structural Req. No
Blackstart Capability None
On-Site Gas Compression None

17|brattle.com
Based on the monthly construction drawdown schedule, we estimate the overnight capital cost in 2018 dollars by escalating the 2014 cost data using reasonable escalation rates. The 2018 “installed cost” is the present value of the construction period cash flows as of the end of the construction period and is calculated using the monthly drawdown schedule and the cost of capital for the project.
A. PLANT PROPER CAPITAL COSTS
1. Plant Developer and Contractor Arrangements
Costs that are typically within the scope of an EPC contract include the major equipment (gas turbines, heat recovery steam generator (HRSG), condenser, and steam turbine), other equipment, construction and other labor, materials, sales tax, contractor’s fee, and contractor’s contingency.
The contracting scheme for procuring professional EPC services in the U.S. is typically implemented with a single contractor at a single, fixed, lump-sum price. A single contract reduces the owner’s responsibility with construction coordination and reduces the potential for missed or duplicated scope compared to multiple contract schemes. The estimates and contractor fees herein reflect this contracting scheme.
2. Equipment and Sales Tax
“Major equipment” includes costs associated with the gas turbines, HRSG, SCR, condenser, and steam turbines, where applicable. The major equipment includes “owner-furnished equipment” (OFE) that the owner purchases through the EPC. OFE costs include EPC handling costs contingency on logistics, installation, delivery, etc., with no EPC profit markup on the major equipment cost itself. “Other equipment” includes inside-the-fence equipment required for interconnection and other miscellaneous equipment and associated freight costs. Equipment costs, including the combustion turbine costs, are based on S&L’s proprietary database and continuous interaction with clients and vendors regarding equipment costs and budget estimates. A sales tax rate specific to each CONE Area is applied to the sum of major equipment and other equipment to account for the sales tax on all equipment.
3. Labor and Materials
Labor consists of “construction labor” associated with the EPC scope of work and “other labor,” which includes engineering, procurement, project services, construction management, and field engineering, start-up, and commissioning services. “Materials” include all construction material associated with the EPC scope of work, material freight costs, and consumables during construction.
The labor rates in this analysis do not reflect a specific assumption of whether union or non-union labor is utilized. Instead, the labor rates have been developed by S&L through a survey of the prevalent wages in each region in 2014, including both union and non-union labor. This approach differs from the 2011 PJM CONE Study, in which a single assumption of the labor type was specified for each CONE Area. The change in determining wages and productivity rates results in higher labor costs in SWMAAC and Dominion, which were assumed to use strictly non-union labor in the 2011
18|brattle.com
study. The updated approach provides a better representation of the labor force that will include labor from both pools. The labor costs are based on average labor rates weighted by the combination of trades required for each plant type.
4. EPC Contractor Fee and Contingency
The “EPC Contractor’s fee” is added compensation and profit paid to an EPC contractor for coordination of engineering, procurement, project services, construction management, field engineering, and startup and commissioning. Capital cost estimates include an EPC contractor fee of 10% and 12% of EPC costs for CT and CC facilities, respectively.
“Contingency” covers undefined variables in both scope definition and pricing that are encountered during project implementation. Examples include nominal adjustments to material quantities in accordance with the final design; items clearly required by the initial design parameters that were overlooked in the original estimate detail; and pricing fluctuations for materials and equipment. Our capital cost estimates include an EPC contingency of 10% of EPC costs.
The EPC contractor fee and contingency rates are based on S&L’s proprietary project cost database. The EPC contingency rate (10%) is higher than the value used in the 2011 PJM CONE study (4% contingency charged by the EPC, plus an additional 3% of EPC costs for change orders that was included as part of the Owner’s Contingency) due to input received from stakeholders following the issuance of that study. The overall contingency rate in this analysis (including the Owner’s Contingency presented in the next section) is 9.6% of the pre-contingency overnight capital costs, compared to 6.4% in the 2011 study.
B. OWNER’S CAPITAL COSTS
“Owner’s capital costs” include all other capital costs not expected to be included in the EPC contract, including development costs, legal fees, gas and electric interconnections, and inventories.
1. Project Development and Mobilization and Startup
Project development costs include items such as development costs, oversight, legal fees, and emissions reductions credits that are required prior to and generally through the early stages of plant construction. We assume project development costs are 5% of the total EPC costs, based on S&L’s review of similar projects for which it has detailed information on actual owner’s costs.
Mobilization and startup costs include those costs incurred by the owner of the plant towards the completion of the plant and during the initial operation and testing prior to operation, including the training, commissioning, and testing by the staff that will operate the plant going forward. We assume mobilization and startup costs are 1% of the total EPC costs, based on S&L’s review of similar projects for which it has detailed information on actual owner’s costs.
19|brattle.com
2. Net Start-Up Fuel Costs During Testing
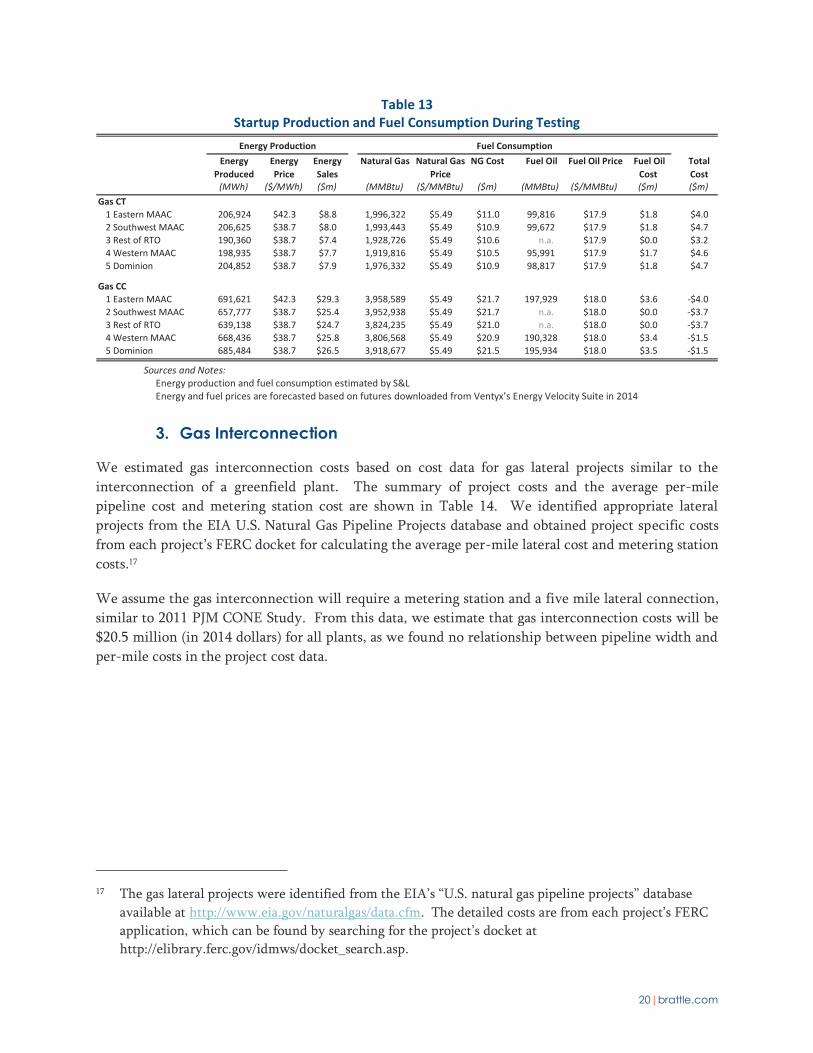
Before commencing full commercial operations, new generation plants must undergo testing to ensure the plant is functioning and producing power correctly. This occurs in the months before the online date and involves testing the turbine generators on natural gas and ultra-lower sulfur diesel (ULSD) if dual fuel capability is specified. S&L estimated the fuel consumption and energy production during testing for each plant type based on typical schedule durations and testing protocols for plant startup and commissioning, as observed for actual projects. A plant will pay for the natural gas and fuel oil consumption, and will receive revenues for its energy production. We made the following assumptions to calculate net start-up fuel costs:
NNatural Gas: assume Transco Zone 6 Non-New York (Z6 NNY) prices apply for all CONE Areas; forecast Z6 NNY natural gas prices using traded futures on NYMEX (CME Group) until March 2015 and grow the basis differentials at the rate of inflation into 2018.
Fuel Oil: rely on No. 2 fuel oil futures for New York harbor through January 2018; escalate fuel oil prices between January 2018 and an assumed fuel delivery date of March and April 2018 based on the escalation in Brent crude oil futures over the same date range.16
Electric Energy: estimate prices based on PJM Eastern Hub for EMAAC, and PJM Western Hub for all other CONE Areas; calculate monthly 2015 market heat rates based on electricity and gas futures in each location and assume market heat rates remain constant to 2018; average the resulting estimates for locational day-ahead on-peak and off-peak energy prices to estimate the average revenues that would be received during testing.
16 Data from Bloomberg, representing trade dates 12/22/2013 to 2/20/2014.
20|brattle.com
Table 13 Startup Production and Fuel Consumption During Testing
Sources and Notes: Energy production and fuel consumption estimated by S&L Energy and fuel prices are forecasted based on futures downloaded from Ventyx’s Energy Velocity Suite in 2014
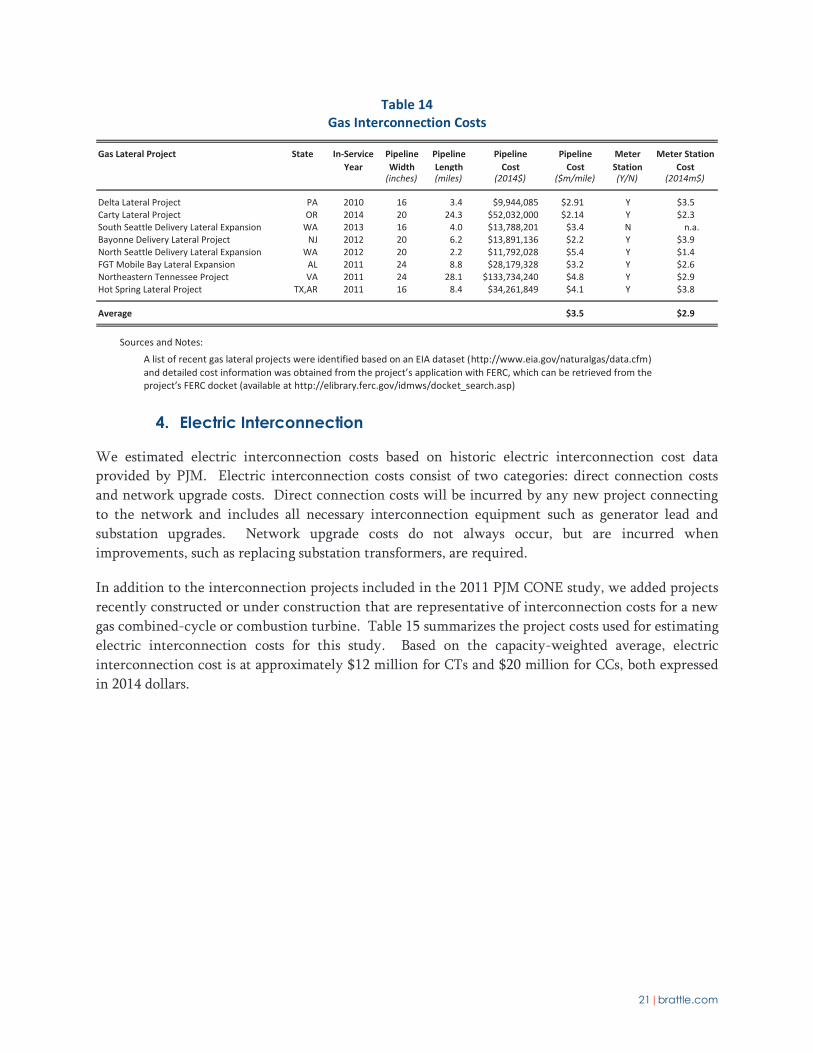
3. Gas Interconnection
We estimated gas interconnection costs based on cost data for gas lateral projects similar to the interconnection of a greenfield plant. The summary of project costs and the average per-mile pipeline cost and metering station cost are shown in Table 14. We identified appropriate lateral projects from the EIA U.S. Natural Gas Pipeline Projects database and obtained project specific costs from each project’s FERC docket for calculating the average per-mile lateral cost and metering station costs.17
We assume the gas interconnection will require a metering station and a five mile lateral connection, similar to 2011 PJM CONE Study. From this data, we estimate that gas interconnection costs will be $20.5 million (in 2014 dollars) for all plants, as we found no relationship between pipeline width and per-mile costs in the project cost data.
17 The gas lateral projects were identified from the EIA’s “U.S. natural gas pipeline projects” database
available at http://www.eia.gov/naturalgas/data.cfm. The detailed costs are from each project’s FERC application, which can be found by searching for the project’s docket at http://elibrary.ferc.gov/idmws/docket_search.asp.
Energy Production Fuel ConsumptionEnergy
ProducedEnergy Price
Energy Sales
Natural Gas Natural Gas Price
NG Cost Fuel Oil Fuel Oil Price Fuel Oil Cost
Total Cost
(MWh) ($/MWh) ($m) (MMBtu) ($/MMBtu) ($m) (MMBtu) ($/MMBtu) ($m) ($m)Gas CT
1 Eastern MAAC 206,924 $42.3 $8.8 1,996,322 $5.49 $11.0 99,816 $17.9 $1.8 $4.02 Southwest MAAC 206,625 $38.7 $8.0 1,993,443 $5.49 $10.9 99,672 $17.9 $1.8 $4.73 Rest of RTO 190,360 $38.7 $7.4 1,928,726 $5.49 $10.6 n.a. $17.9 $0.0 $3.24 Western MAAC 198,935 $38.7 $7.7 1,919,816 $5.49 $10.5 95,991 $17.9 $1.7 $4.65 Dominion 204,852 $38.7 $7.9 1,976,332 $5.49 $10.9 98,817 $17.9 $1.8 $4.7
Gas CC1 Eastern MAAC 691,621 $42.3 $29.3 3,958,589 $5.49 $21.7 197,929 $18.0 $3.6 -$4.02 Southwest MAAC 657,777 $38.7 $25.4 3,952,938 $5.49 $21.7 n.a. $18.0 $0.0 -$3.73 Rest of RTO 639,138 $38.7 $24.7 3,824,235 $5.49 $21.0 n.a. $18.0 $0.0 -$3.74 Western MAAC 668,436 $38.7 $25.8 3,806,568 $5.49 $20.9 190,328 $18.0 $3.4 -$1.55 Dominion 685,484 $38.7 $26.5 3,918,677 $5.49 $21.5 195,934 $18.0 $3.5 -$1.5
21|brattle.com
Table 14 Gas Interconnection Costs
Sources and Notes:
A list of recent gas lateral projects were identified based on an EIA dataset (http://www.eia.gov/naturalgas/data.cfm) and detailed cost information was obtained from the project’s application with FERC, which can be retrieved from the project’s FERC docket (available at http://elibrary.ferc.gov/idmws/docket_search.asp)
4. Electric Interconnection
We estimated electric interconnection costs based on historic electric interconnection cost data provided by PJM. Electric interconnection costs consist of two categories: direct connection costs and network upgrade costs. Direct connection costs will be incurred by any new project connecting to the network and includes all necessary interconnection equipment such as generator lead and substation upgrades. Network upgrade costs do not always occur, but are incurred when improvements, such as replacing substation transformers, are required.
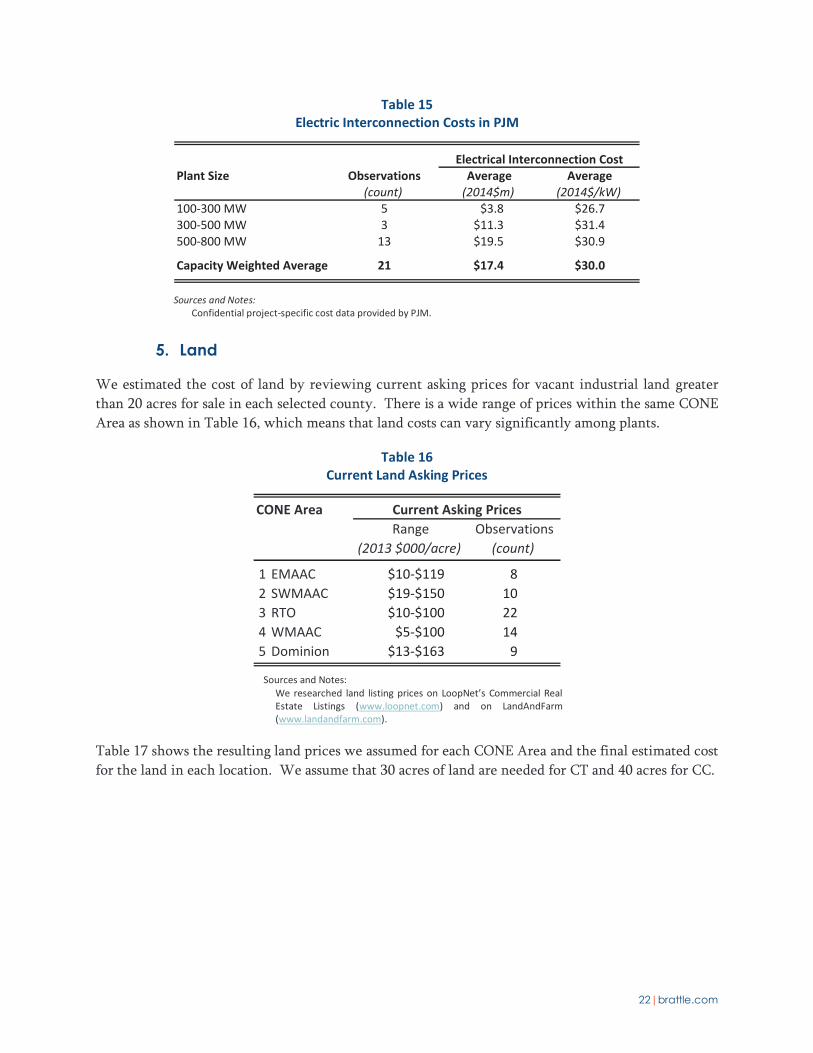
In addition to the interconnection projects included in the 2011 PJM CONE study, we added projects recently constructed or under construction that are representative of interconnection costs for a new gas combined-cycle or combustion turbine. Table 15 summarizes the project costs used for estimating electric interconnection costs for this study. Based on the capacity-weighted average, electric interconnection cost is at approximately $12 million for CTs and $20 million for CCs, both expressed in 2014 dollars.
Gas Lateral Project State In-Service Year
Pipeline Width
Pipeline Length
Pipeline Cost
Pipeline Cost
Meter Station
Meter Station Cost
(inches) (miles) (2014$) ($m/mile) (Y/N) (2014m$)
Delta Lateral Project PA 2010 16 3.4 $9,944,085 $2.91 Y $3.5Carty Lateral Project OR 2014 20 24.3 $52,032,000 $2.14 Y $2.3South Seattle Delivery Lateral Expansion WA 2013 16 4.0 $13,788,201 $3.4 N n.a.Bayonne Delivery Lateral Project NJ 2012 20 6.2 $13,891,136 $2.2 Y $3.9North Seattle Delivery Lateral Expansion WA 2012 20 2.2 $11,792,028 $5.4 Y $1.4FGT Mobile Bay Lateral Expansion AL 2011 24 8.8 $28,179,328 $3.2 Y $2.6Northeastern Tennessee Project VA 2011 24 28.1 $133,734,240 $4.8 Y $2.9Hot Spring Lateral Project TX,AR 2011 16 8.4 $34,261,849 $4.1 Y $3.8
Average $3.5 $2.9
22|brattle.com
Table 15 Electric Interconnection Costs in PJM
Sources and Notes:
Confidential project-specific cost data provided by PJM.
5. Land
We estimated the cost of land by reviewing current asking prices for vacant industrial land greater than 20 acres for sale in each selected county. There is a wide range of prices within the same CONE Area as shown in Table 16, which means that land costs can vary significantly among plants.
Table 16 Current Land Asking Prices
Sources and Notes:
We researched land listing prices on LoopNet’s Commercial Real Estate Listings (www.loopnet.com) and on LandAndFarm (www.landandfarm.com).
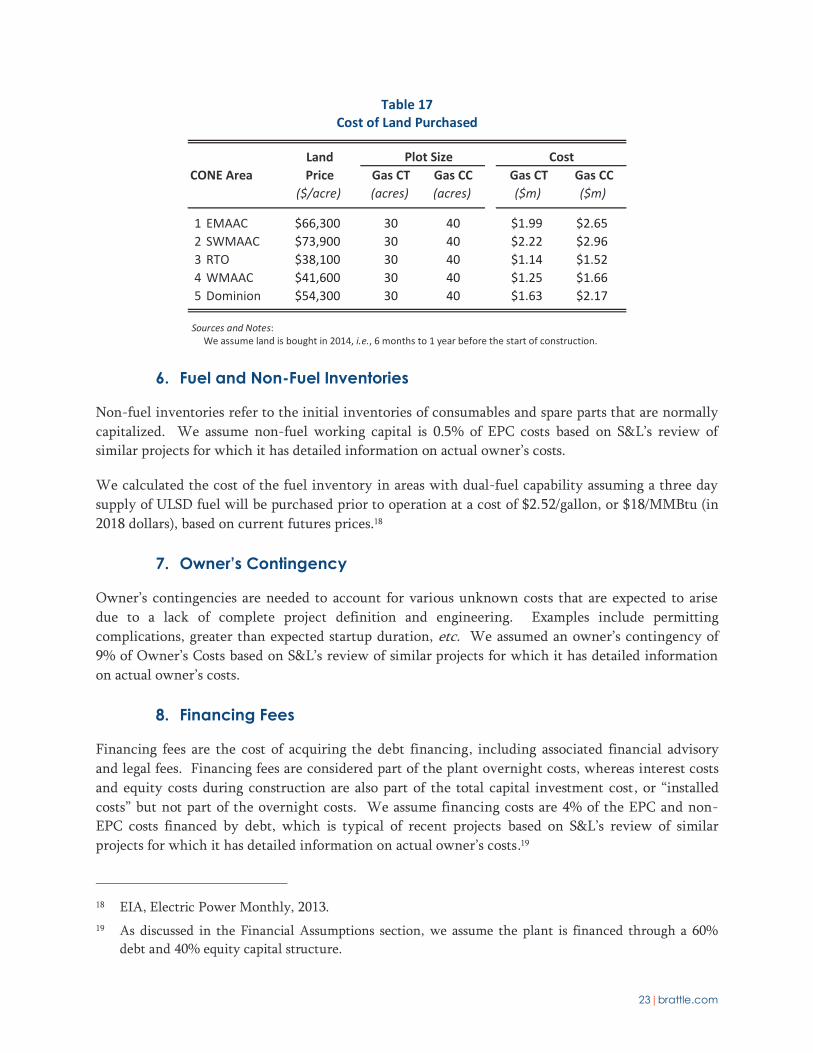
Table 17 shows the resulting land prices we assumed for each CONE Area and the final estimated cost for the land in each location. We assume that 30 acres of land are needed for CT and 40 acres for CC.
Electrical Interconnection CostPlant Size Observations Average Average
(count) (2014$m) (2014$/kW)100-300 MW 5 $3.8 $26.7300-500 MW 3 $11.3 $31.4500-800 MW 13 $19.5 $30.9
Capacity Weighted Average 21 $17.4 $30.0
CONE Area Current Asking PricesRange Observations
(2013 $000/acre) (count)
1 EMAAC $10-$119 82 SWMAAC $19-$150 103 RTO $10-$100 224 WMAAC $5-$100 145 Dominion $13-$163 9
23|brattle.com
Table 17 Cost of Land Purchased
Sources and Notes:
We assume land is bought in 2014, i.e., 6 months to 1 year before the start of construction.
6. Fuel and Non-Fuel Inventories
Non-fuel inventories refer to the initial inventories of consumables and spare parts that are normally capitalized. We assume non-fuel working capital is 0.5% of EPC costs based on S&L’s review of similar projects for which it has detailed information on actual owner’s costs.
We calculated the cost of the fuel inventory in areas with dual-fuel capability assuming a three day supply of ULSD fuel will be purchased prior to operation at a cost of $2.52/gallon, or $18/MMBtu (in 2018 dollars), based on current futures prices.18
7. Owner’s Contingency
Owner’s contingencies are needed to account for various unknown costs that are expected to arise due to a lack of complete project definition and engineering. Examples include permitting complications, greater than expected startup duration, etc. We assumed an owner’s contingency of 9% of Owner’s Costs based on S&L’s review of similar projects for which it has detailed information on actual owner’s costs.
8. Financing Fees
Financing fees are the cost of acquiring the debt financing, including associated financial advisory and legal fees. Financing fees are considered part of the plant overnight costs, whereas interest costs and equity costs during construction are also part of the total capital investment cost, or “installed costs” but not part of the overnight costs. We assume financing costs are 4% of the EPC and non-EPC costs financed by debt, which is typical of recent projects based on S&L’s review of similar projects for which it has detailed information on actual owner’s costs.19
18 EIA, Electric Power Monthly, 2013. 19 As discussed in the Financial Assumptions section, we assume the plant is financed through a 60%
debt and 40% equity capital structure.
Land Plot Size CostCONE Area Price Gas CT Gas CC Gas CT Gas CC
($/acre) (acres) (acres) ($m) ($m)
1 EMAAC $66,300 30 40 $1.99 $2.652 SWMAAC $73,900 30 40 $2.22 $2.963 RTO $38,100 30 40 $1.14 $1.524 WMAAC $41,600 30 40 $1.25 $1.665 Dominion $54,300 30 40 $1.63 $2.17
24|brattle.com
C. ESCALATION TO 2018 INSTALLED COSTS
1. Escalation
We escalated the 2014 estimates of overnight capital cost components forward to the construction period for a June 2018 online date using cost escalation rates particular to each cost category.
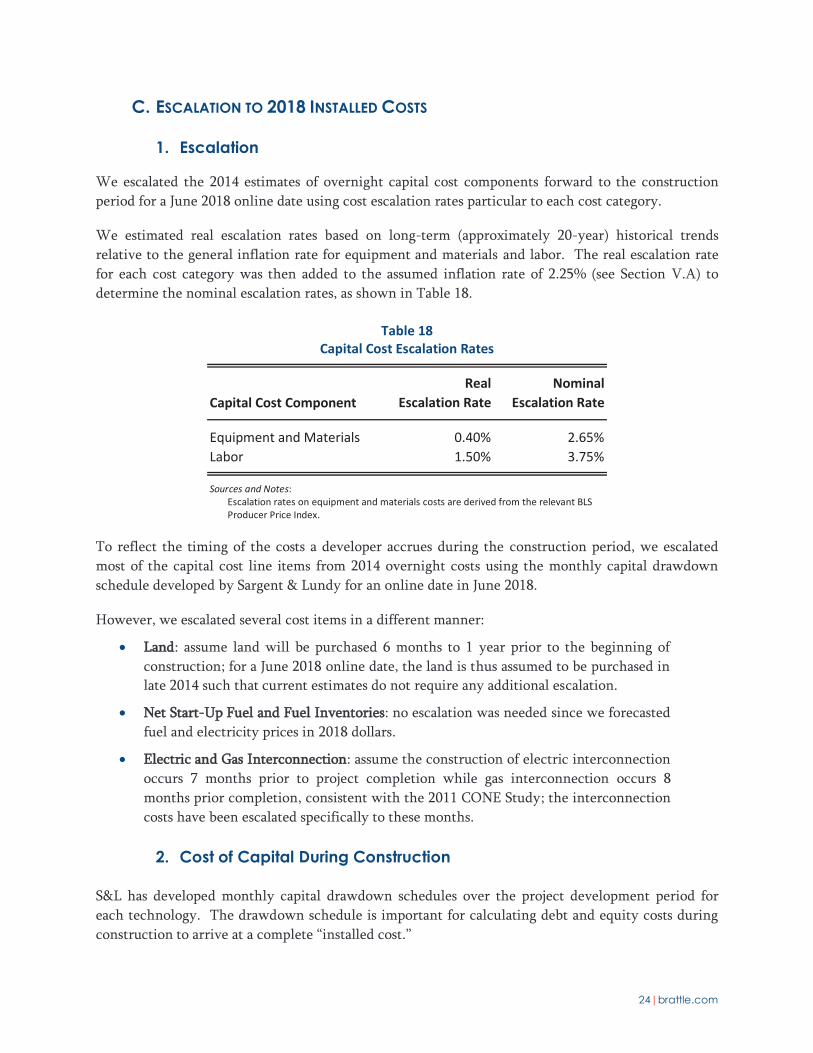
We estimated real escalation rates based on long-term (approximately 20-year) historical trends relative to the general inflation rate for equipment and materials and labor. The real escalation rate for each cost category was then added to the assumed inflation rate of 2.25% (see Section V.A) to determine the nominal escalation rates, as shown in Table 18.
Table 18 Capital Cost Escalation Rates
Sources and Notes:
Escalation rates on equipment and materials costs are derived from the relevant BLS Producer Price Index.
To reflect the timing of the costs a developer accrues during the construction period, we escalated most of the capital cost line items from 2014 overnight costs using the monthly capital drawdown schedule developed by Sargent & Lundy for an online date in June 2018.
However, we escalated several cost items in a different manner:
LLand: assume land will be purchased 6 months to 1 year prior to the beginning of construction; for a June 2018 online date, the land is thus assumed to be purchased in late 2014 such that current estimates do not require any additional escalation.
Net Start-Up Fuel and Fuel Inventories: no escalation was needed since we forecasted fuel and electricity prices in 2018 dollars.
Electric and Gas Interconnection: assume the construction of electric interconnection occurs 7 months prior to project completion while gas interconnection occurs 8 months prior completion, consistent with the 2011 CONE Study; the interconnection costs have been escalated specifically to these months.
2. Cost of Capital During Construction
S&L has developed monthly capital drawdown schedules over the project development period for each technology. The drawdown schedule is important for calculating debt and equity costs during construction to arrive at a complete “installed cost.”
Capital Cost ComponentReal
Escalation RateNominal
Escalation Rate
Equipment and Materials 0.40% 2.65%Labor 1.50% 3.75%
25|brattle.com
The installed cost for each technology is calculated by first applying the monthly construction drawdown schedule for the project to the 2018 overnight capital cost and then finding the present value of the cash flows as of the end of the construction period using the assumed cost of capital as the discount rate.20 By using the ATWACC to calculate the present value, the installed costs will include both the interest during construction from the debt financed portion of the project and the cost of equity for the equity financed portion.
20 For CTs, the construction drawdown schedule occurs over 20 months with 80% of the costs incurred
in the final 11 months prior to commercial operation. For CCs, the construction drawdown schedule occurs over 36 months with 80% of the costs incurred in the final 20 months prior to commercial operation.
26|brattle.com
D. CAPITAL COST SUMMARY
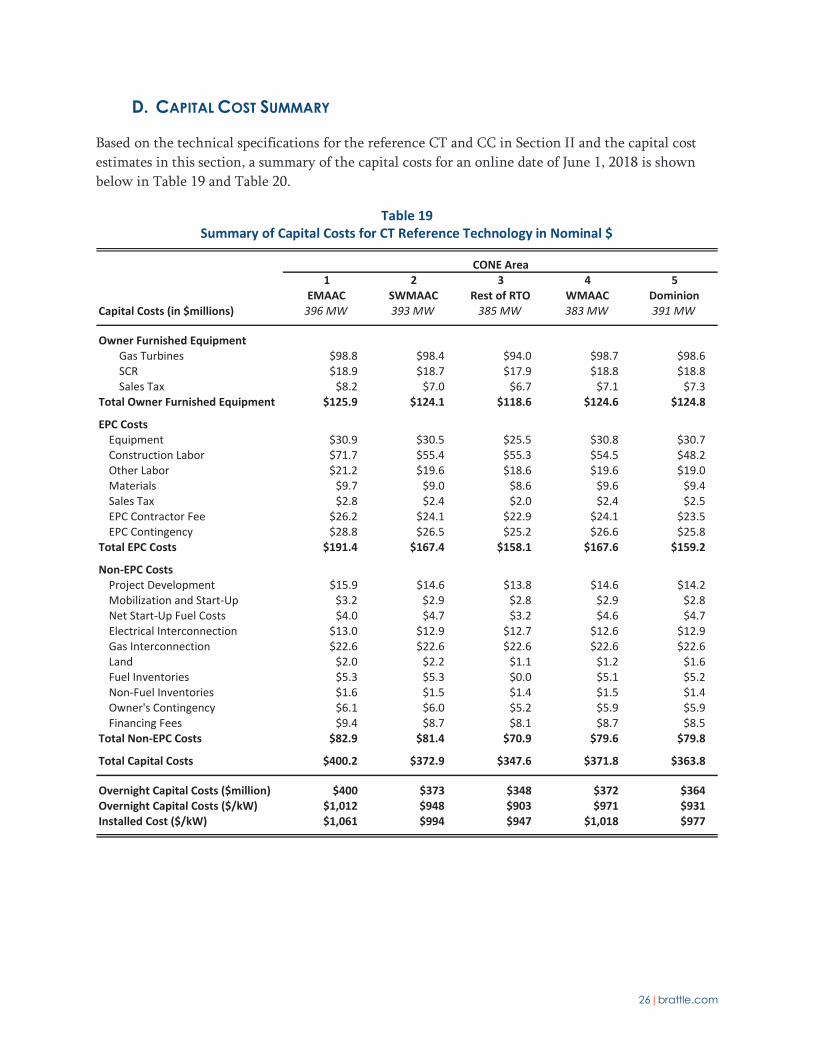
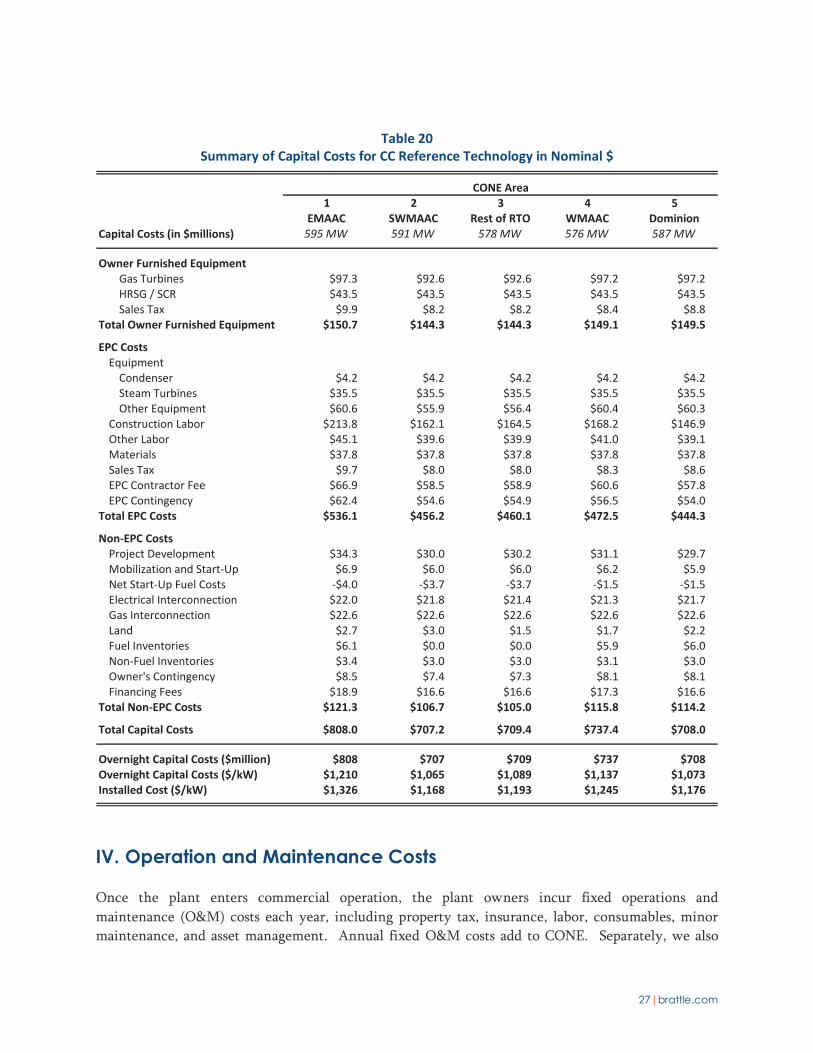
Based on the technical specifications for the reference CT and CC in Section II and the capital cost estimates in this section, a summary of the capital costs for an online date of June 1, 2018 is shown below in Table 19 and Table 20.
Table 19 Summary of Capital Costs for CT Reference Technology in Nominal $
CONE Area1 2 3 4 5
EMAAC SWMAAC Rest of RTO WMAAC DominionCapital Costs (in $millions) 396 MW 393 MW 385 MW 383 MW 391 MW
Owner Furnished EquipmentGas Turbines $98.8 $98.4 $94.0 $98.7 $98.6SCR $18.9 $18.7 $17.9 $18.8 $18.8Sales Tax $8.2 $7.0 $6.7 $7.1 $7.3
Total Owner Furnished Equipment $125.9 $124.1 $118.6 $124.6 $124.8
EPC CostsEquipment $30.9 $30.5 $25.5 $30.8 $30.7Construction Labor $71.7 $55.4 $55.3 $54.5 $48.2Other Labor $21.2 $19.6 $18.6 $19.6 $19.0Materials $9.7 $9.0 $8.6 $9.6 $9.4Sales Tax $2.8 $2.4 $2.0 $2.4 $2.5EPC Contractor Fee $26.2 $24.1 $22.9 $24.1 $23.5EPC Contingency $28.8 $26.5 $25.2 $26.6 $25.8
Total EPC Costs $191.4 $167.4 $158.1 $167.6 $159.2
Non-EPC CostsProject Development $15.9 $14.6 $13.8 $14.6 $14.2Mobilization and Start-Up $3.2 $2.9 $2.8 $2.9 $2.8Net Start-Up Fuel Costs $4.0 $4.7 $3.2 $4.6 $4.7Electrical Interconnection $13.0 $12.9 $12.7 $12.6 $12.9Gas Interconnection $22.6 $22.6 $22.6 $22.6 $22.6Land $2.0 $2.2 $1.1 $1.2 $1.6Fuel Inventories $5.3 $5.3 $0.0 $5.1 $5.2Non-Fuel Inventories $1.6 $1.5 $1.4 $1.5 $1.4Owner's Contingency $6.1 $6.0 $5.2 $5.9 $5.9Financing Fees $9.4 $8.7 $8.1 $8.7 $8.5
Total Non-EPC Costs $82.9 $81.4 $70.9 $79.6 $79.8
Total Capital Costs $400.2 $372.9 $347.6 $371.8 $363.8
Overnight Capital Costs ($million) $400 $373 $348 $372 $364Overnight Capital Costs ($/kW) $1,012 $948 $903 $971 $931Installed Cost ($/kW) $1,061 $994 $947 $1,018 $977
27|brattle.com
Table 20 Summary of Capital Costs for CC Reference Technology in Nominal $
IV. Operation and Maintenance Costs
Once the plant enters commercial operation, the plant owners incur fixed operations and maintenance (O&M) costs each year, including property tax, insurance, labor, consumables, minor maintenance, and asset management. Annual fixed O&M costs add to CONE. Separately, we also
CONE Area1 2 3 4 5
EMAAC SWMAAC Rest of RTO WMAAC DominionCapital Costs (in $millions) 595 MW 591 MW 578 MW 576 MW 587 MW
Owner Furnished EquipmentGas Turbines $97.3 $92.6 $92.6 $97.2 $97.2HRSG / SCR $43.5 $43.5 $43.5 $43.5 $43.5Sales Tax $9.9 $8.2 $8.2 $8.4 $8.8
Total Owner Furnished Equipment $150.7 $144.3 $144.3 $149.1 $149.5
EPC CostsEquipment
Condenser $4.2 $4.2 $4.2 $4.2 $4.2Steam Turbines $35.5 $35.5 $35.5 $35.5 $35.5Other Equipment $60.6 $55.9 $56.4 $60.4 $60.3
Construction Labor $213.8 $162.1 $164.5 $168.2 $146.9Other Labor $45.1 $39.6 $39.9 $41.0 $39.1Materials $37.8 $37.8 $37.8 $37.8 $37.8Sales Tax $9.7 $8.0 $8.0 $8.3 $8.6EPC Contractor Fee $66.9 $58.5 $58.9 $60.6 $57.8EPC Contingency $62.4 $54.6 $54.9 $56.5 $54.0
Total EPC Costs $536.1 $456.2 $460.1 $472.5 $444.3
Non-EPC CostsProject Development $34.3 $30.0 $30.2 $31.1 $29.7Mobilization and Start-Up $6.9 $6.0 $6.0 $6.2 $5.9Net Start-Up Fuel Costs -$4.0 -$3.7 -$3.7 -$1.5 -$1.5Electrical Interconnection $22.0 $21.8 $21.4 $21.3 $21.7Gas Interconnection $22.6 $22.6 $22.6 $22.6 $22.6Land $2.7 $3.0 $1.5 $1.7 $2.2Fuel Inventories $6.1 $0.0 $0.0 $5.9 $6.0Non-Fuel Inventories $3.4 $3.0 $3.0 $3.1 $3.0Owner's Contingency $8.5 $7.4 $7.3 $8.1 $8.1Financing Fees $18.9 $16.6 $16.6 $17.3 $16.6
Total Non-EPC Costs $121.3 $106.7 $105.0 $115.8 $114.2
Total Capital Costs $808.0 $707.2 $709.4 $737.4 $708.0
Overnight Capital Costs ($million) $808 $707 $709 $737 $708Overnight Capital Costs ($/kW) $1,210 $1,065 $1,089 $1,137 $1,073Installed Cost ($/kW) $1,326 $1,168 $1,193 $1,245 $1,176
28|brattle.com
calculated variable operations and maintenance costs (including maintenance, consumables, and waste disposal costs) to inform PJM’s future E&AS calculations.
A. ANNUAL FIXED OPERATIONS AND MAINTENANCE COSTS
Fixed O&M costs include costs directly related to the turbine design (labor, materials, contract services for routine O&M, and administrative and general costs) and other fixed operating costs related to the location (site leasing costs, property taxes, and insurance).
1. Plant Operation and Maintenance
We estimated the labor, consumables, maintenance and minor repairs, and general and administrative costs based on a variety of sources, including the Electric Power Research Institute (EPRI) State-of-the-Art Power Plant Combustion Turbine Workstation v 9.0 data for existing plants reported on FERC Form 1, confidential data from other operating plants, and vendor publications for equipment maintenance.
Major maintenance is assumed to be completed through a long-term service agreement (LTSA) with the original equipment manufacturer that specifies when to complete the maintenance based on either fired-hours or starts. We include monthly LTSA payments as fixed O&M since they are not based on the operation of the plant, and all other costs under the LTSA are considered variable O&M.
2. Insurance and Asset Management Costs
We calculated insurance costs as 0.60% of the overnight capital cost per year, based on a sample of independent power projects recently under development in the Northeastern U.S. and discussions with a project developer. We estimated the asset management costs from typical costs incurred for fuel procurement, power marketing, energy management, and related services from a sample of CT and CC plants in operation.
3. Property Tax
To estimate property tax, we researched tax regulations for the locations selected in each CONE Area, averaging the tax rates in the areas that include multiple states. We estimated the property taxes through bottom-up cost estimates that separately evaluated taxes on real property (including land and structural improvements) and personal property (the remainder of the plant) in each location. In this study, we did not incorporate any assumed Payment in Lieu of Taxes (PILOT) agreements. Although PILOT agreements could be executed between an individual plant developer and a county, these agreements are individually negotiated and may not be available on a similar basis for all plants.
Real property is taxed in all states containing reference plant locations we selected for the CONE Area. Personal property is taxed only in SWMAAC (Maryland), Rest of RTO (the portion in Ohio), and Dominion (Virginia). For power plants, the value of personal property tends to be much higher than the value of real property, since equipment costs make up the majority of the total capital cost.
29|brattle.com
For this reason, property taxes for plants located in states that impose taxes on personal property will be significantly higher than plants located in states that do not.
To estimate real property taxes, we assumed the assessed value of land and structural improvements is the initial capital cost of these specific components. We determined assessment ratios and tax rates for each CONE Area by reviewing the publicly posted tax rates for several counties within the specified locations and by contacting county and state tax assessors (The tax rates assumed for each CONE Area is summarized in Table 21). We multiply the assessment ratio by the tax rate to determine the overall effective tax rate, and apply that rate to our estimate of assessed value. We assume that assessed value of real property will escalate in future years with inflation.
Personal property taxes in the states of Maryland, Ohio, and Virginia were estimated using a similar approach. As with real property, we multiply the local tax rate by the assessment ratio to determine the effective tax rate on assessed value. We assume that the initial assessed value of the property is the plant’s total capital cost (exclusive of real property). The assessed value of personal property is subject to depreciation in future years. For example, in Maryland, personal property is subject to straight-line depreciation of 3.3% per year down to a minimum of 25% of the original assessed value.21
21 Maryland Depreciation Regulation Chapter 18, Subtitle 03, Chapter 01, Depreciation .02B(2). Phone
conversation with Laura Kittel (410-767-1897) at State Department of Assessments & Taxation in June 2012.
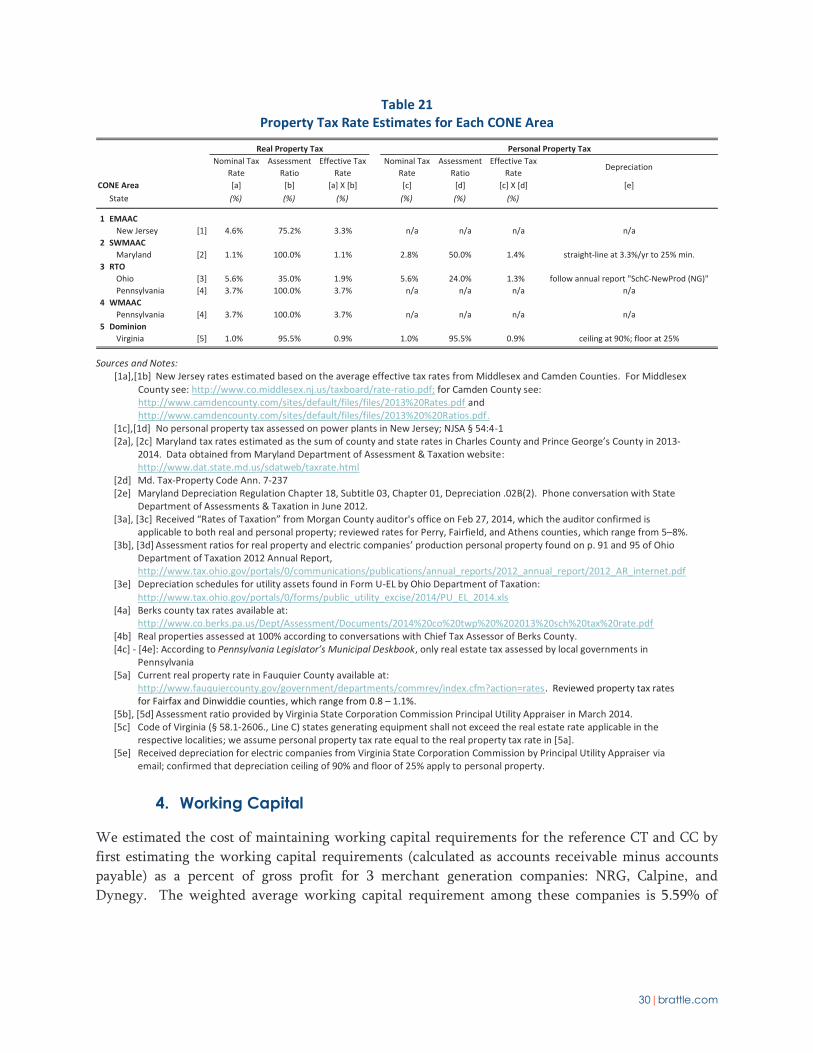
30|brattle.com
Table 21 Property Tax Rate Estimates for Each CONE Area
Sources and Notes:
[1a],[1b] New Jersey rates estimated based on the average effective tax rates from Middlesex and Camden Counties. For Middlesex County see: http://www.co.middlesex.nj.us/taxboard/rate-ratio.pdf; for Camden County see: http://www.camdencounty.com/sites/default/files/files/2013%20Rates.pdf and http://www.camdencounty.com/sites/default/files/files/2013%20%20Ratios.pdf.
[1c],[1d] No personal property tax assessed on power plants in New Jersey; NJSA § 54:4-1 [2a], [2c] Maryland tax rates estimated as the sum of county and state rates in Charles County and Prince George’s County in 2013-
2014. Data obtained from Maryland Department of Assessment & Taxation website: http://www.dat.state.md.us/sdatweb/taxrate.html
[2d] Md. Tax-Property Code Ann. 7-237 [2e] Maryland Depreciation Regulation Chapter 18, Subtitle 03, Chapter 01, Depreciation .02B(2). Phone conversation with State
Department of Assessments & Taxation in June 2012. [3a], [3c] Received “Rates of Taxation” from Morgan County auditor's office on Feb 27, 2014, which the auditor confirmed is
applicable to both real and personal property; reviewed rates for Perry, Fairfield, and Athens counties, which range from 5–8%. [3b], [3d] Assessment ratios for real property and electric companies’ production personal property found on p. 91 and 95 of Ohio
Department of Taxation 2012 Annual Report, http://www.tax.ohio.gov/portals/0/communications/publications/annual_reports/2012_annual_report/2012_AR_internet.pdf
[3e] Depreciation schedules for utility assets found in Form U-EL by Ohio Department of Taxation: http://www.tax.ohio.gov/portals/0/forms/public_utility_excise/2014/PU_EL_2014.xls
[4a] Berks county tax rates available at: http://www.co.berks.pa.us/Dept/Assessment/Documents/2014%20co%20twp%20%202013%20sch%20tax%20rate.pdf
[4b] Real properties assessed at 100% according to conversations with Chief Tax Assessor of Berks County. [4c] - [4e]: According to Pennsylvania Legislator’s Municipal Deskbook, only real estate tax assessed by local governments in
Pennsylvania [5a] Current real property rate in Fauquier County available at:
http://www.fauquiercounty.gov/government/departments/commrev/index.cfm?action=rates. Reviewed property tax rates for Fairfax and Dinwiddie counties, which range from 0.8 – 1.1%.
[5b], [5d] Assessment ratio provided by Virginia State Corporation Commission Principal Utility Appraiser in March 2014. [5c] Code of Virginia (§ 58.1-2606., Line C) states generating equipment shall not exceed the real estate rate applicable in the
respective localities; we assume personal property tax rate equal to the real property tax rate in [5a]. [5e] Received depreciation for electric companies from Virginia State Corporation Commission by Principal Utility Appraiser via
email; confirmed that depreciation ceiling of 90% and floor of 25% apply to personal property.
4. Working Capital
We estimated the cost of maintaining working capital requirements for the reference CT and CC by first estimating the working capital requirements (calculated as accounts receivable minus accounts payable) as a percent of gross profit for 3 merchant generation companies: NRG, Calpine, and Dynegy. The weighted average working capital requirement among these companies is 5.59% of
Real Property Tax Personal Property TaxNominal Tax
RateAssessment
RatioEffective Tax
RateNominal Tax
RateAssessment
RatioEffective Tax
RateDepreciation
CONE Area [a] [b] [a] X [b] [c] [d] [c] X [d] [e]State (%) (%) (%) (%) (%) (%)
1 EMAACNew Jersey [1] 4.6% 75.2% 3.3% n/a n/a n/a n/a
2 SWMAACMaryland [2] 1.1% 100.0% 1.1% 2.8% 50.0% 1.4% straight-line at 3.3%/yr to 25% min.
3 RTOOhio [3] 5.6% 35.0% 1.9% 5.6% 24.0% 1.3% follow annual report "SchC-NewProd (NG)"Pennsylvania [4] 3.7% 100.0% 3.7% n/a n/a n/a n/a
4 WMAACPennsylvania [4] 3.7% 100.0% 3.7% n/a n/a n/a n/a
5 DominionVirginia [5] 1.0% 95.5% 0.9% 1.0% 95.5% 0.9% ceiling at 90%; floor at 25%
31|brattle.com
gross profits.22 Translated to the plant level, we estimate that the working capital requirement is approximately 0.7% of overnight costs in the first operating year (increasing with inflation thereafter). In the capital cost estimates, we do not include the working capital requirements but instead the cost of maintaining the working capital requirement based on the borrowing rate for short-term debt for BB rated companies 0.96%.23
5. Firm Transportation Service Contract in Southwest MAAC
The gas pipeline serving the part of SWMAAC we identified for the reference plants is the Dominion Cove Point (DCP) pipeline. We understand from shippers that they have had trouble obtaining gas on the DCP pipeline. Availability of interruptible service has been unreliable and inflexible with the pipeline being fully subscribed and also unable to absorb substantial swings in usage within a day. To at least partially address this problem, we assume new CC plants will sign up for firm transportation service on DCP. We assume that the new CT will not acquire firm service due to the relatively few hours such a plant is expected to operate.
To estimate the costs of acquiring firm transportation service on the DCP pipeline for a plant coming online in 2018, we assume the same transportation reservation rate on DCP as that filed for the proposed Dominion Cove LNG export project. That rate is $5.5260 per dekatherm per month for 2017,24 which we escalate to 2018 dollars, resulting in a rate of $5.6503 per dekatherm.25 We assume that the CC will reserve sufficient gas service to support baseload operation (without supplemental duct firing) as summarized in Table 22. This results in a $6.5 million annual cost, adding $11,100/MW-year to the CONE for CCs in SWMAAC.
Flexible, no-notice, non-ratable firm service would cost even more, but we do not have a basis for estimating such costs. Instead, we assume energy margin calculations would have to account for limited flexibility of gas service from the DCP (see Section III.B of the 2014 VRR Report).
22 Gross profits are revenues minus cost of goods sold, including variable and fixed operation and
maintenance costs. 23 15-day average 3-month bond yield as of February 14, 2014, BFV USD Composite (BB), from
Bloomberg. 24 Application for Authority to Construct, Modify, and Operate Facilities Used for the Export of Natural
Gas under Section 3 of the Natural Gas Act and Abbreviated Application for a Certificate of Public Convenience and Necessity under Section 7 of the Natural Gas Act, Volume 1 of III, Public, before the Federal Energy Regulatory Commission, in the matter of Dominion Cove Point LNG, LP, Cove Point Liquefaction Project, filed April 1, 2013. Docket No. CP13-___-000. Available at http://newsinteractive.post-gazette.com/20130401-5045(28233263).pdf.
25 This does not include variable charges, which should not be included in CONE but should be accounted for in estimating energy margins to calculate Net CONE.

32|brattle.com
Table 22 Estimated Cost of Procuring Firm Gas Service on DCP Pipeline
Sources and Notes:
See footnote 24. 1 dekatherm (Dth) is equivalent to 1 MMBtu.
B. VARIABLE OPERATION AND MAINTENANCE COSTS
Variable O&M costs are not used in calculating CONE, but they inform the E&AS revenue offset calculations performed annually by PJM. We provide an explanation of the costs here to clearly differentiate which O&M costs are considered fixed and which are variable.
MMajor Maintenance: Over the long-term operating life of CT and CC plants, the largest component of variable O&M is the allowance for major maintenance expenses. Each major maintenance cycle for a combustion turbine typically includes regular combustion inspections, periodic hot gas path inspections, and one major overhaul. Since major maintenance activities and costs are spaced irregularly over the long-term, the cost in a given year represents an annual accrual for future major maintenance. For hours-based major maintenance, the average variable O&M cost (in dollars per megawatt-hour, or $/MWh) is equal to the total cost of parts and labor over a complete major maintenance interval divided by the factored operating hours between overhauls, divided by the plant capacity in megawatts. For starts-based major maintenance, the average variable O&M cost ($/factored start, per turbine) is equal to the total cost of parts and labor over a complete major maintenance interval divided by the factored starts between overhauls.
Other Variable O&M: Other variable O&M costs are directly proportional to plant generating output, such as SCR catalyst and ammonia, CO oxidation catalyst, water, and other chemicals and consumables. These items are always expressed in $/MWh, regardless of whether the maintenance component is hours-based or starts-based.
Component Units Gas CC
Plant CharacteristicsSummer ICAP (w/o duct-firing) (MW) 591Summer Heatrate at Baseload (HHV) (Btu/kWh) 6,811Gas Consumption at Baseload
Maximum Hourly (MMBtu/hr) 4,023Maximum Daily (MMBtu/hr) 96,563
Firm Gas ReservationsCost of Firm Gas Capacity per Month (2018$/Dth) $5.6503Total Firm Gas Capacity Reservation (Dth) 96,600
Total Cost of Firm Gas Reservations (2018$) $6,550,000(2018$/MW-year) $11,100
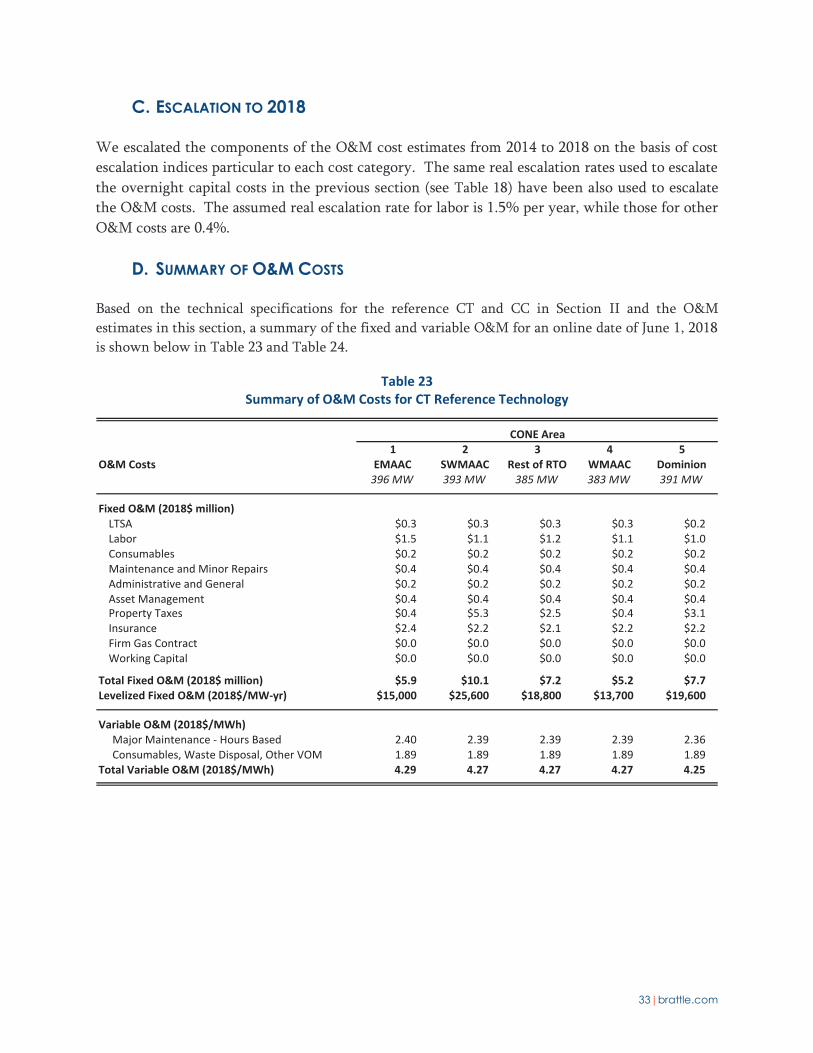
33|brattle.com
C. ESCALATION TO 2018
We escalated the components of the O&M cost estimates from 2014 to 2018 on the basis of cost escalation indices particular to each cost category. The same real escalation rates used to escalate the overnight capital costs in the previous section (see Table 18) have been also used to escalate the O&M costs. The assumed real escalation rate for labor is 1.5% per year, while those for other O&M costs are 0.4%.
D. SUMMARY OF O&M COSTS
Based on the technical specifications for the reference CT and CC in Section II and the O&M estimates in this section, a summary of the fixed and variable O&M for an online date of June 1, 2018 is shown below in Table 23 and Table 24.
Table 23 Summary of O&M Costs for CT Reference Technology
CONE Area1 2 3 4 5
O&M Costs EMAAC SWMAAC Rest of RTO WMAAC Dominion396 MW 393 MW 385 MW 383 MW 391 MW
Fixed O&M (2018$ million)LTSA $0.3 $0.3 $0.3 $0.3 $0.2Labor $1.5 $1.1 $1.2 $1.1 $1.0Consumables $0.2 $0.2 $0.2 $0.2 $0.2Maintenance and Minor Repairs $0.4 $0.4 $0.4 $0.4 $0.4Administrative and General $0.2 $0.2 $0.2 $0.2 $0.2Asset Management $0.4 $0.4 $0.4 $0.4 $0.4Property Taxes $0.4 $5.3 $2.5 $0.4 $3.1Insurance $2.4 $2.2 $2.1 $2.2 $2.2Firm Gas Contract $0.0 $0.0 $0.0 $0.0 $0.0Working Capital $0.0 $0.0 $0.0 $0.0 $0.0
Total Fixed O&M (2018$ million) $5.9 $10.1 $7.2 $5.2 $7.7Levelized Fixed O&M (2018$/MW-yr) $15,000 $25,600 $18,800 $13,700 $19,600
Variable O&M (2018$/MWh) Major Maintenance - Hours Based 2.40 2.39 2.39 2.39 2.36 Consumables, Waste Disposal, Other VOM 1.89 1.89 1.89 1.89 1.89Total Variable O&M (2018$/MWh) 4.29 4.27 4.27 4.27 4.25
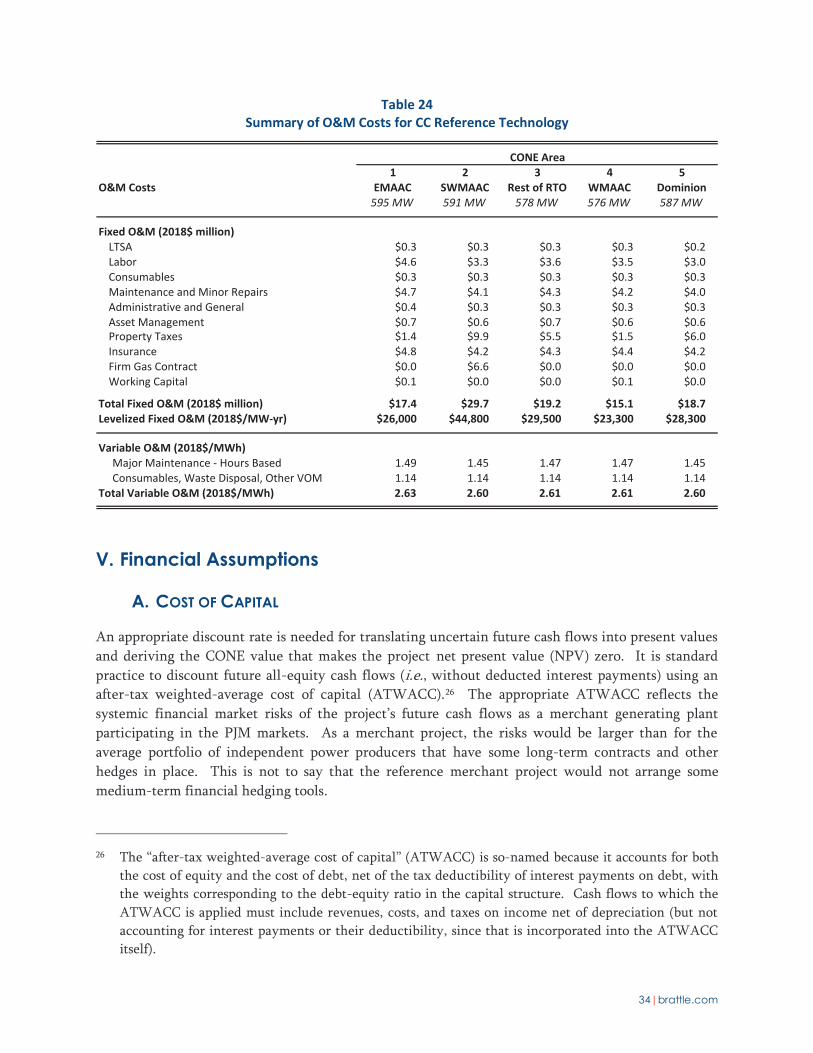
34|brattle.com
Table 24 Summary of O&M Costs for CC Reference Technology
V. Financial Assumptions
A. COST OF CAPITAL
An appropriate discount rate is needed for translating uncertain future cash flows into present values and deriving the CONE value that makes the project net present value (NPV) zero. It is standard practice to discount future all-equity cash flows (i.e., without deducted interest payments) using an after-tax weighted-average cost of capital (ATWACC).26 The appropriate ATWACC reflects the systemic financial market risks of the project’s future cash flows as a merchant generating plant participating in the PJM markets. As a merchant project, the risks would be larger than for the average portfolio of independent power producers that have some long-term contracts and other hedges in place. This is not to say that the reference merchant project would not arrange some medium-term financial hedging tools.
26 The “after-tax weighted-average cost of capital” (ATWACC) is so-named because it accounts for both
the cost of equity and the cost of debt, net of the tax deductibility of interest payments on debt, with the weights corresponding to the debt-equity ratio in the capital structure. Cash flows to which the ATWACC is applied must include revenues, costs, and taxes on income net of depreciation (but not accounting for interest payments or their deductibility, since that is incorporated into the ATWACC itself).
CONE Area1 2 3 4 5
O&M Costs EMAAC SWMAAC Rest of RTO WMAAC Dominion595 MW 591 MW 578 MW 576 MW 587 MW
Fixed O&M (2018$ million)LTSA $0.3 $0.3 $0.3 $0.3 $0.2Labor $4.6 $3.3 $3.6 $3.5 $3.0Consumables $0.3 $0.3 $0.3 $0.3 $0.3Maintenance and Minor Repairs $4.7 $4.1 $4.3 $4.2 $4.0Administrative and General $0.4 $0.3 $0.3 $0.3 $0.3Asset Management $0.7 $0.6 $0.7 $0.6 $0.6Property Taxes $1.4 $9.9 $5.5 $1.5 $6.0Insurance $4.8 $4.2 $4.3 $4.4 $4.2Firm Gas Contract $0.0 $6.6 $0.0 $0.0 $0.0Working Capital $0.1 $0.0 $0.0 $0.1 $0.0
Total Fixed O&M (2018$ million) $17.4 $29.7 $19.2 $15.1 $18.7Levelized Fixed O&M (2018$/MW-yr) $26,000 $44,800 $29,500 $23,300 $28,300
Variable O&M (2018$/MWh) Major Maintenance - Hours Based 1.49 1.45 1.47 1.47 1.45 Consumables, Waste Disposal, Other VOM 1.14 1.14 1.14 1.14 1.14Total Variable O&M (2018$/MWh) 2.63 2.60 2.61 2.61 2.60
35|brattle.com
To estimate the cost of capital for such a project, we reviewed a broad range of reference points. As there is significant uncertainty in any single cost of capital estimate, we reviewed all of the available reference points and selected a level that is reasonable considering the wide range of values. The reference points that we are using include updated estimates for publicly-traded merchant generation companies (NRG, Calpine, and Dynegy), additional sources from previous analysis by Brattle, fairness opinions for merchant generation divestitures, and analyst estimates.27 Supplementing our analysis with estimates from other financial analysts is valuable as others’ methodologies may account for market risks and estimation uncertainties differently from ours. We derived each of the reference points as follows, with results summarized in Table 25.
PPublicly Traded Companies: we derived ATWACC estimates using the following standard techniques. ─ Return on Equity: We estimate the return on equity (ROE) using the Capital Asset
Pricing Model (CAPM). The ROE for each company is derived as the risk-free rate plus a risk premium given by the expected risk premium of the overall market times the company’s “beta.”28 We calculated a risk-free rate of 3.4% using a 15-day average of 30-year U.S. treasuries as of February 2014.29 We estimated the expected risk premium of the market to be 6.5% based on the long-term average of values provided by Credit Suisse and Ibbotson.30 The “beta” describes each company stock’s (five-year) historical correlation with the overall market, where the “market” is taken to be the S&P 500 index. The resulting return on equity ranges from 7.1–11.9% for the companies included in the analysis, as shown in Table 25.31
─ Cost of Debt: We estimate the cost of debt (COD) by compiling the unsecured senior credit ratings for each merchant generation company and examining the bond yields associated with those credit ratings. In Standard and Poor’s (S&P) credit ratings, a company receives a higher rating based on its ability to meet financial commitments, with “AAA” being the highest rating and “D” being the lowest. Calpine and Dynegy’s credit
27 We do not include private equity investors in our sample because their cost of equity cannot be
observed in market data. Nor do we include electric utilities in cost-of-service regulated businesses, as their businesses face lower risks and lower cost of capital than merchant generation.
28 Brealy, Richard, Stuart C. Myers, and Franklin Allen (2011). Principles of Corporate Finance. New York: McGraw-Hill/Irwin.
29 Bloomberg, Bloomberg Professional Service (2014). Data downloaded February 21, 2014. (Bloomberg, 2014). Risk free rate calculated based on 30 year U.S. bond yields.
30 The Ibbotson market risk premium is 6.7% and the Credit Suisse market risk premium is 6.2%. Ibbotson (2013), SBBI 2013 Valuation Yearbook, Chicago: Morningstar, 2013. Dimson, Elroy, Paul Marsh, and Mike Stauton (2013). Credit Suisse Global Investment Returns Sourcebook 2013, Zurich: Credit Suisse Research Institute, February 2013.
31 Dynegy financial characteristics are currently significantly different from Calpine and NRG as it is in the final stages of emerging from bankruptcy. However, we believe that it still can provide a useful reference point for estimating the cost of capital for a merchant generator.
36|brattle.com
ratings are “B,” with an associated cost of debt of 8.7%, while NRG’s is “BB” with a 7.5% cost of debt.32
─ Debt/Equity Ratio: We estimate the five-year average debt/equity ratio for each merchant generation company using company 10-Ks for the debt value and Bloomberg for the market value of equity.
AApril 2011 Brattle Estimates were calculated using a similar approach and have been adjusted downward by 0.9 percentage points for the current analysis based on the difference in the risk-free rate between April 2011 (4.3%) and February 2014 (3.4%).
The other reference points come from publicly available values used by financial advisors and analysts in valuations associated with mergers and divestitures. For example, the financial advisors for the acquisition of GenOn by NRG used discount rates of 7.0–8.5% for NRG and 8.5–9.5% for GenOn in their discounted cash flow analyses associated with the merger. While there are no details provided on how these ranges were developed, we find these values provide useful reference points for estimating the cost of capital. The values in Table 25 have been adjusted upward by 0.7 percentage points due to the change in risk-free rates since the original estimates were developed by the financial analysts in 2012.
32 Data downloaded from Bloomberg in 2014.
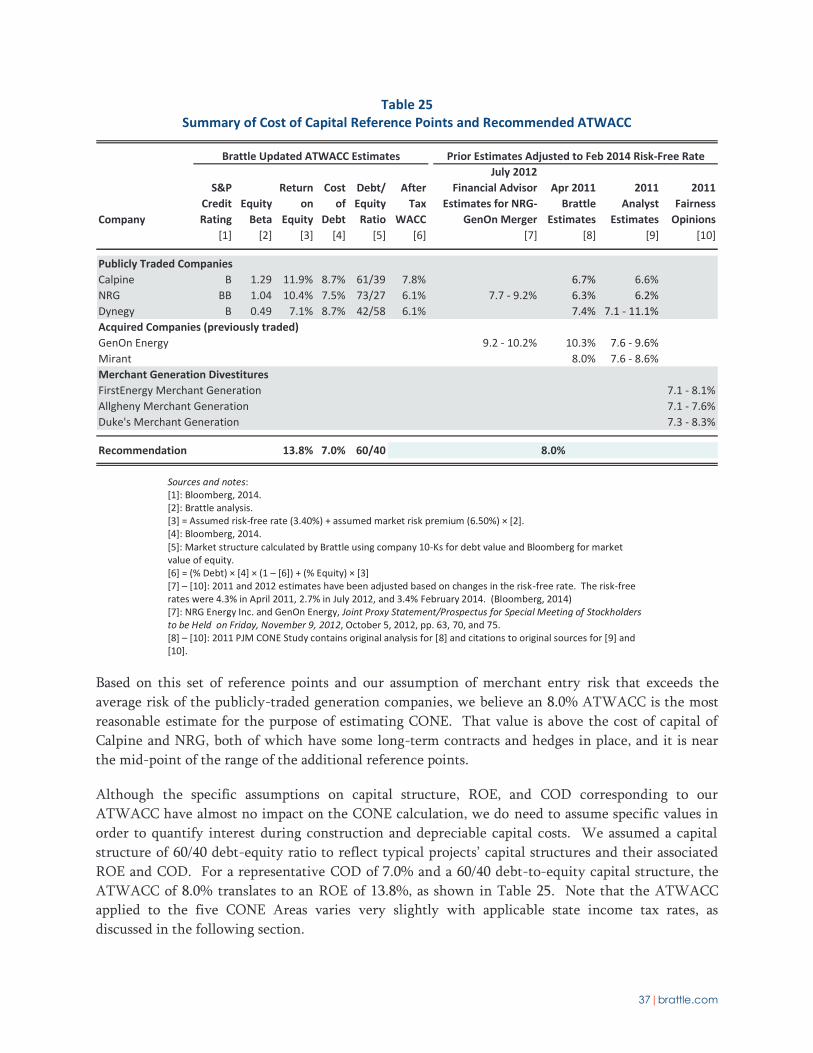
37|brattle.com
Table 25 Summary of Cost of Capital Reference Points and Recommended ATWACC
Sources and notes: [1]: Bloomberg, 2014. [2]: Brattle analysis. [3] = Assumed risk-free rate (3.40%) + assumed market risk premium (6.50%) × [2]. [4]: Bloomberg, 2014. [5]: Market structure calculated by Brattle using company 10-Ks for debt value and Bloomberg for market value of equity. [6] = (% Debt) × [4] × (1 – [6]) + (% Equity) × [3] [7] – [10]: 2011 and 2012 estimates have been adjusted based on changes in the risk-free rate. The risk-free rates were 4.3% in April 2011, 2.7% in July 2012, and 3.4% February 2014. (Bloomberg, 2014) [7]: NRG Energy Inc. and GenOn Energy, Joint Proxy Statement/Prospectus for Special Meeting of Stockholders to be Held on Friday, November 9, 2012, October 5, 2012, pp. 63, 70, and 75. [8] – [10]: 2011 PJM CONE Study contains original analysis for [8] and citations to original sources for [9] and [10].
Based on this set of reference points and our assumption of merchant entry risk that exceeds the average risk of the publicly-traded generation companies, we believe an 8.0% ATWACC is the most reasonable estimate for the purpose of estimating CONE. That value is above the cost of capital of Calpine and NRG, both of which have some long-term contracts and hedges in place, and it is near the mid-point of the range of the additional reference points.
Although the specific assumptions on capital structure, ROE, and COD corresponding to our ATWACC have almost no impact on the CONE calculation, we do need to assume specific values in order to quantify interest during construction and depreciable capital costs. We assumed a capital structure of 60/40 debt-equity ratio to reflect typical projects’ capital structures and their associated ROE and COD. For a representative COD of 7.0% and a 60/40 debt-to-equity capital structure, the ATWACC of 8.0% translates to an ROE of 13.8%, as shown in Table 25. Note that the ATWACC applied to the five CONE Areas varies very slightly with applicable state income tax rates, as discussed in the following section.
Brattle Updated ATWACC Estimates Prior Estimates Adjusted to Feb 2014 Risk-Free Rate
Company
S&P Credit Rating
Equity Beta
Return on
Equity
Cost of
Debt
Debt/ Equity Ratio
After Tax
WACC
July 2012 Financial Advisor
Estimates for NRG-GenOn Merger
Apr 2011 Brattle
Estimates
2011 Analyst
Estimates
2011 Fairness
Opinions[1] [2] [3] [4] [5] [6] [7] [8] [9] [10]
Publicly Traded CompaniesCalpine B 1.29 11.9% 8.7% 61/39 7.8% 6.7% 6.6%NRG BB 1.04 10.4% 7.5% 73/27 6.1% 7.7 - 9.2% 6.3% 6.2%Dynegy B 0.49 7.1% 8.7% 42/58 6.1% 7.4% 7.1 - 11.1%Acquired Companies (previously traded)GenOn Energy 9.2 - 10.2% 10.3% 7.6 - 9.6%Mirant 8.0% 7.6 - 8.6%Merchant Generation DivestituresFirstEnergy Merchant Generation 7.1 - 8.1%Allgheny Merchant Generation 7.1 - 7.6%Duke's Merchant Generation 7.3 - 8.3%
Recommendation 13.8% 7.0% 60/40 8.0%

38|brattle.com
B. OTHER FINANCIAL ASSUMPTIONS
Calculating CONE requires several other financial assumptions about general inflation rates, tax rates, depreciation, and interest during construction.
Inflation rates affect our CONE estimates by forming the basis for projected increases in various FOM cost components over time. We also use the inflation rate as the cost escalation rate in our level-real CONE estimate. We estimated future twenty-year inflation rates based on bond market data, Federal Reserve estimates, and consensus U.S. economic projections. The implied inflation rate over twenty years from treasury yields is 2.2%, and the Cleveland Federal Reserve estimate of inflation expectations is 1.9% over twenty years.33 The most forward looking forecast in the Blue Chip Economic Indicators report is 2.3%.34 Based on these sources, we assumed for the Net CONE calculations an average long-term inflation rate of 2.25%.
Income tax rates affect both the cost of capital and cash flows in the financial model used to calculate CONE. We calculated income tax rates based on current federal and state tax rates. The marginal federal corporate income tax rate for 2013 is 35%.35 The state tax rates assumed for each CONE Area are shown in Table 26. Virginia’s lower rate slightly reduces Dominion’s CONE, although ATWACC there increases from 8.0% to 8.1% because the debt tax shield is less valuable.
33 As stated on the Cleveland Federal Reserve website, “The Cleveland Fed’s estimate of inflation
expectations is based on a model that combines information from a number of sources to address the shortcomings of other, commonly used measures, such as the “break-even” rate derived from Treasury inflation protected securities (TIPS) or survey-based estimates. The Cleveland Fed model can produce estimates for many time horizons, and it isolates not only inflation expectations, but several other interesting variables, such as the real interest rate and the inflation risk premium.” Federal Reserve Bank of Cleveland (2013), Cleveland Fed Estimates of Inflation Expectations, accessed July 16, 2013. Available at http://www.clevelandfed.org/research/data/inflation_expectations/.
34 Blue Chip Economic Indicators (2013), Blue Chip Economic Indicators, Top Analysts’ Forecasts of the U.S. Economic Outlook for the Year Ahead, New York: Aspen Publishers, March 2013. We used the consensus ten-year average consumer price index (CPI) for all urban consumers.
35 Internal Revenue Service (2013), 2012 Instructions for Form 1120, U.S. Corporation Income Tax Return, January 25, 2013. Available at http://www.irs.gov/pub/irs-pdf/i1120.pdf.
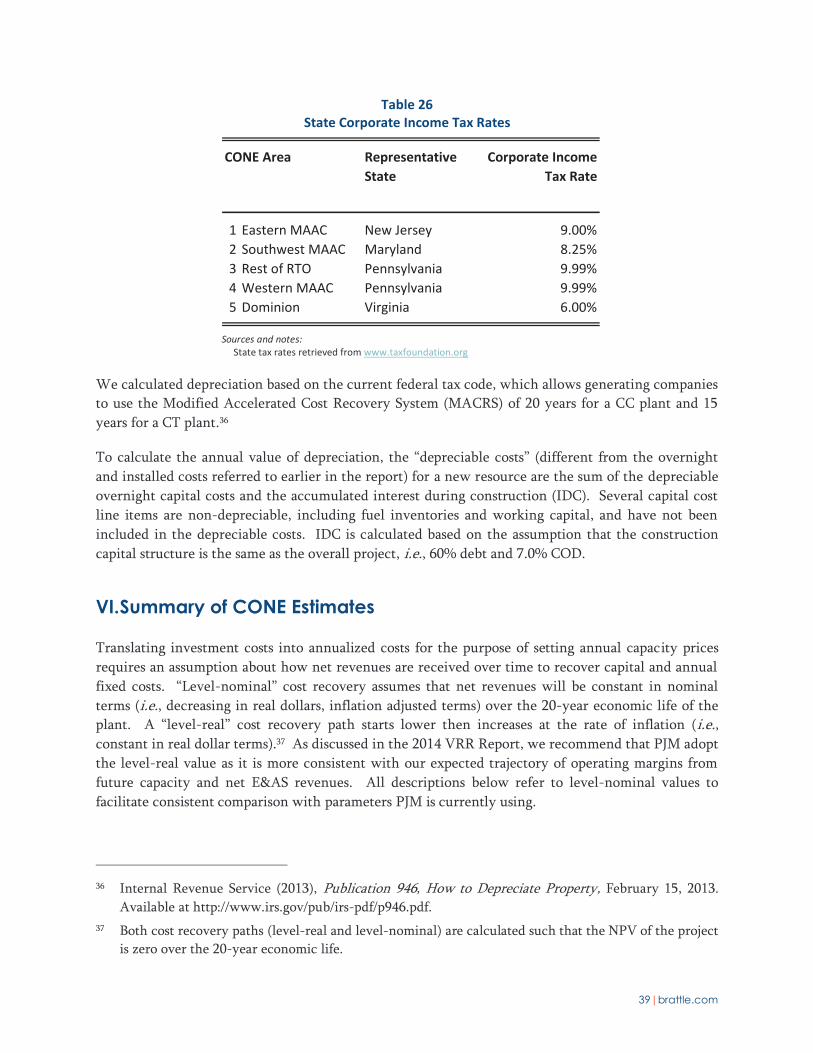
39|brattle.com
Table 26 State Corporate Income Tax Rates
Sources and notes:
State tax rates retrieved from www.taxfoundation.org
We calculated depreciation based on the current federal tax code, which allows generating companies to use the Modified Accelerated Cost Recovery System (MACRS) of 20 years for a CC plant and 15 years for a CT plant.36
To calculate the annual value of depreciation, the “depreciable costs” (different from the overnight and installed costs referred to earlier in the report) for a new resource are the sum of the depreciable overnight capital costs and the accumulated interest during construction (IDC). Several capital cost line items are non-depreciable, including fuel inventories and working capital, and have not been included in the depreciable costs. IDC is calculated based on the assumption that the construction capital structure is the same as the overall project, i.e., 60% debt and 7.0% COD.
VI. Summary of CONE Estimates
Translating investment costs into annualized costs for the purpose of setting annual capacity prices requires an assumption about how net revenues are received over time to recover capital and annual fixed costs. “Level-nominal” cost recovery assumes that net revenues will be constant in nominal terms (i.e., decreasing in real dollars, inflation adjusted terms) over the 20-year economic life of the plant. A “level-real” cost recovery path starts lower then increases at the rate of inflation (i.e., constant in real dollar terms).37 As discussed in the 2014 VRR Report, we recommend that PJM adopt the level-real value as it is more consistent with our expected trajectory of operating margins from future capacity and net E&AS revenues. All descriptions below refer to level-nominal values to facilitate consistent comparison with parameters PJM is currently using.
36 Internal Revenue Service (2013), Publication 946, How to Depreciate Property, February 15, 2013.
Available at http://www.irs.gov/pub/irs-pdf/p946.pdf. 37 Both cost recovery paths (level-real and level-nominal) are calculated such that the NPV of the project
is zero over the 20-year economic life.
CONE Area Representative State
Corporate Income Tax Rate
1 Eastern MAAC New Jersey 9.00%2 Southwest MAAC Maryland 8.25%3 Rest of RTO Pennsylvania 9.99%4 Western MAAC Pennsylvania 9.99%5 Dominion Virginia 6.00%

40|brattle.com
Table 27 and Table 28 show summaries of our capital costs, annual fixed costs, and levelized CONE estimates for the CT and CC reference plants for the 2018/19 delivery year. For comparison, the tables include the most recent 2017/18 PJM administrative CONE parameters and the results of the 2011 PJM CONE Study for the 2015/16 auction, with both escalated to a 2018/19 delivery year at 3% per year to reflect estimated historical escalation rates for generation.38
For the CT, our CONE estimates differ by CONE Area due to differences in plant configuration and performance assumptions, differences in labor rates, differences in property tax regulations, and other locational differences in capital and fixed O&M costs. EMAAC and SWMAAC have the highest CONE estimates at $150,000/MW-year and $148,400/MW-year, respectively, due to significantly higher labor costs in EMAAC and high property taxes in SWMAAC that are based on all property, not just land and buildings, as in some other areas. WMAAC and Dominion have the next highest CONE values of $143,500/MW-year and $141,200/MW-year, respectively. The Rest of RTO Area has the lowest CONE values of $138,000/MW-year due to the lack of dual-fuel capability and lower labor costs.
38 The 3% escalation rate is based on a component-weighted average of the escalation rates in Table
1818.
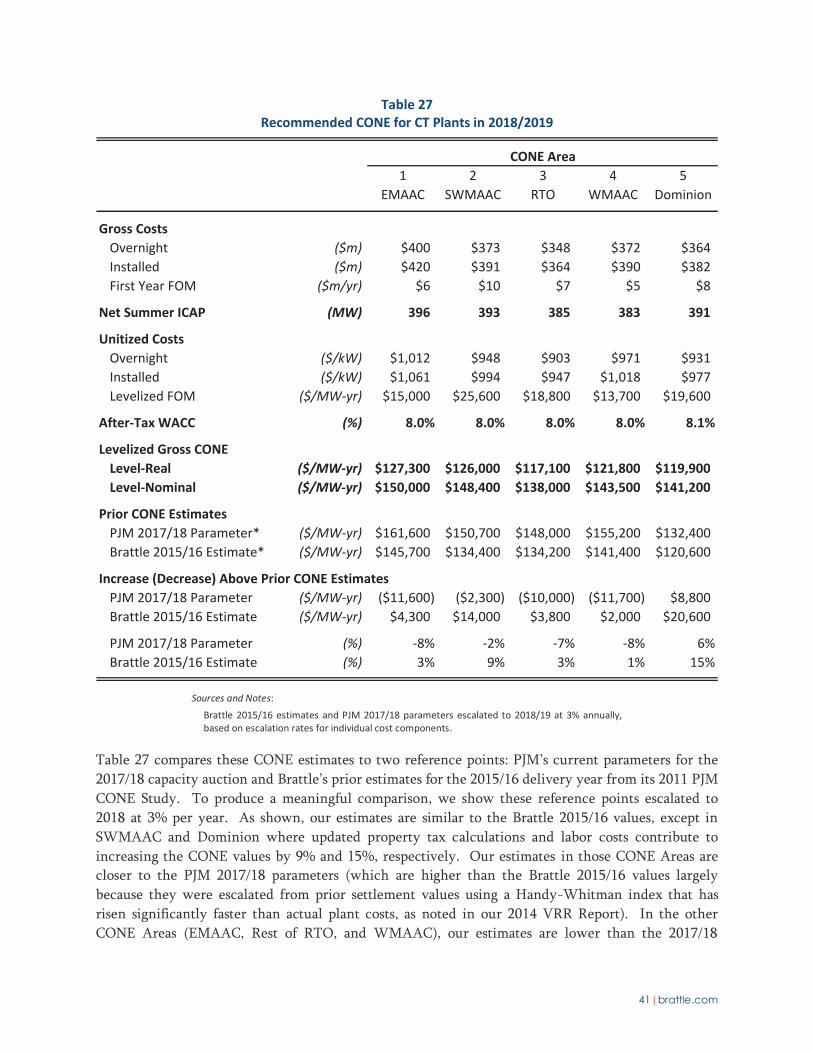
41|brattle.com
Table 27 Recommended CONE for CT Plants in 2018/2019
Sources and Notes:
Brattle 2015/16 estimates and PJM 2017/18 parameters escalated to 2018/19 at 3% annually, based on escalation rates for individual cost components.
Table 27 compares these CONE estimates to two reference points: PJM’s current parameters for the 2017/18 capacity auction and Brattle’s prior estimates for the 2015/16 delivery year from its 2011 PJM CONE Study. To produce a meaningful comparison, we show these reference points escalated to 2018 at 3% per year. As shown, our estimates are similar to the Brattle 2015/16 values, except in SWMAAC and Dominion where updated property tax calculations and labor costs contribute to increasing the CONE values by 9% and 15%, respectively. Our estimates in those CONE Areas are closer to the PJM 2017/18 parameters (which are higher than the Brattle 2015/16 values largely because they were escalated from prior settlement values using a Handy-Whitman index that has risen significantly faster than actual plant costs, as noted in our 2014 VRR Report). In the other CONE Areas (EMAAC, Rest of RTO, and WMAAC), our estimates are lower than the 2017/18
CONE Area1 2 3 4 5
EMAAC SWMAAC RTO WMAAC Dominion
Gross CostsOvernight ($m) $400 $373 $348 $372 $364Installed ($m) $420 $391 $364 $390 $382First Year FOM ($m/yr) $6 $10 $7 $5 $8
Net Summer ICAP (MW) 396 393 385 383 391
Unitized CostsOvernight ($/kW) $1,012 $948 $903 $971 $931Installed ($/kW) $1,061 $994 $947 $1,018 $977Levelized FOM ($/MW-yr) $15,000 $25,600 $18,800 $13,700 $19,600
After-Tax WACC (%) 8.0% 8.0% 8.0% 8.0% 8.1%
Levelized Gross CONELevel-Real ($/MW-yr) $127,300 $126,000 $117,100 $121,800 $119,900Level-Nominal ($/MW-yr) $150,000 $148,400 $138,000 $143,500 $141,200
Prior CONE EstimatesPJM 2017/18 Parameter* ($/MW-yr) $161,600 $150,700 $148,000 $155,200 $132,400Brattle 2015/16 Estimate* ($/MW-yr) $145,700 $134,400 $134,200 $141,400 $120,600
Increase (Decrease) Above Prior CONE EstimatesPJM 2017/18 Parameter ($/MW-yr) ($11,600) ($2,300) ($10,000) ($11,700) $8,800Brattle 2015/16 Estimate ($/MW-yr) $4,300 $14,000 $3,800 $2,000 $20,600
PJM 2017/18 Parameter (%) -8% -2% -7% -8% 6%Brattle 2015/16 Estimate (%) 3% 9% 3% 1% 15%

42|brattle.com
parameters. Overall, our estimates are within -8% to +6% of PJM’s current parameters, depending on the Area.
Comparing the current CT CONE estimates to the Brattle 2015/16 estimates, the CT CONE values are either approximately equal in EMAAC, Rest of RTO and WMAAC or higher by 9% in SWMAAC and higher by 15% in Dominion. The SWMAAC and Dominion values are higher for several reasons. First, we assumed higher labor rates, based on the prevailing wages in those Areas, which include a mix of union and non-union labor. Second, increased property tax estimates that now consider taxes on personal property (i.e., the plant equipment) in accordance with state tax laws in both of these regions also lead to higher CONE estimates. Third, the assumed addition of an SCR on the Dominion CT increased the CONE estimates there. Other components of the estimate also changed there and in all the CONE Areas, but with increases in some categories offsetting decreases in others. Assumptions that increased CONE included higher EPC contract costs (mostly due to labor costs), EPC contingency costs, and owner’s project development costs. On the other hand, a lower ATWACC and lower plant O&M estimates reduced CONE.
For the CC, EMAAC has the highest CONE estimates at $203,900/MW-year due to labor costs that are higher than the rest of PJM. SWMAAC and WMAAC have the next highest CC CONE at $197,200/MW-year and $190,900/MW-year, respectively. The CONE Areas with the lowest values are Rest of RTO (due to the lack of dual fuel) at $188,100/MW-yr and Dominion (as it has the lowest labor costs) at $182,400/MW-year.
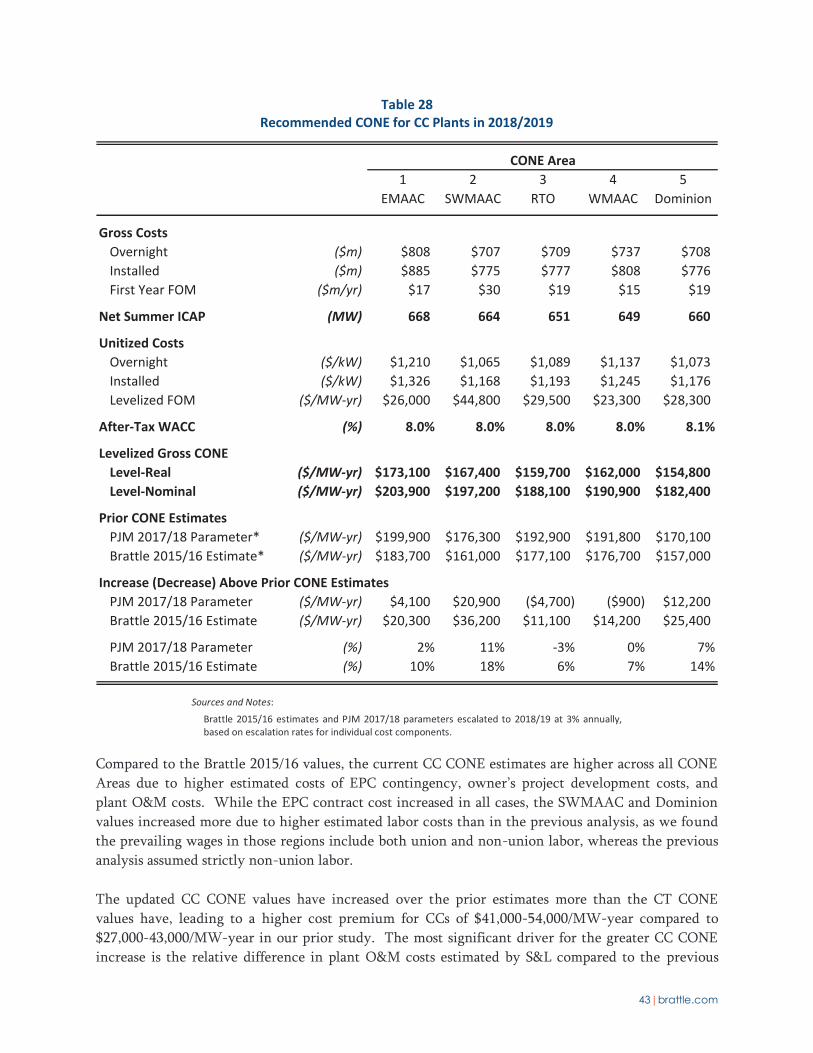
43|brattle.com
Table 28 Recommended CONE for CC Plants in 2018/2019
Sources and Notes:
Brattle 2015/16 estimates and PJM 2017/18 parameters escalated to 2018/19 at 3% annually, based on escalation rates for individual cost components.
Compared to the Brattle 2015/16 values, the current CC CONE estimates are higher across all CONE Areas due to higher estimated costs of EPC contingency, owner’s project development costs, and plant O&M costs. While the EPC contract cost increased in all cases, the SWMAAC and Dominion values increased more due to higher estimated labor costs than in the previous analysis, as we found the prevailing wages in those regions include both union and non-union labor, whereas the previous analysis assumed strictly non-union labor.
The updated CC CONE values have increased over the prior estimates more than the CT CONE values have, leading to a higher cost premium for CCs of $41,000-54,000/MW-year compared to $27,000-43,000/MW-year in our prior study. The most significant driver for the greater CC CONE increase is the relative difference in plant O&M costs estimated by S&L compared to the previous
CONE Area1 2 3 4 5
EMAAC SWMAAC RTO WMAAC Dominion
Gross CostsOvernight ($m) $808 $707 $709 $737 $708Installed ($m) $885 $775 $777 $808 $776First Year FOM ($m/yr) $17 $30 $19 $15 $19
Net Summer ICAP (MW) 668 664 651 649 660
Unitized CostsOvernight ($/kW) $1,210 $1,065 $1,089 $1,137 $1,073Installed ($/kW) $1,326 $1,168 $1,193 $1,245 $1,176Levelized FOM ($/MW-yr) $26,000 $44,800 $29,500 $23,300 $28,300
After-Tax WACC (%) 8.0% 8.0% 8.0% 8.0% 8.1%
Levelized Gross CONELevel-Real ($/MW-yr) $173,100 $167,400 $159,700 $162,000 $154,800Level-Nominal ($/MW-yr) $203,900 $197,200 $188,100 $190,900 $182,400
Prior CONE EstimatesPJM 2017/18 Parameter* ($/MW-yr) $199,900 $176,300 $192,900 $191,800 $170,100Brattle 2015/16 Estimate* ($/MW-yr) $183,700 $161,000 $177,100 $176,700 $157,000
Increase (Decrease) Above Prior CONE EstimatesPJM 2017/18 Parameter ($/MW-yr) $4,100 $20,900 ($4,700) ($900) $12,200Brattle 2015/16 Estimate ($/MW-yr) $20,300 $36,200 $11,100 $14,200 $25,400
PJM 2017/18 Parameter (%) 2% 11% -3% 0% 7%Brattle 2015/16 Estimate (%) 10% 18% 6% 7% 14%
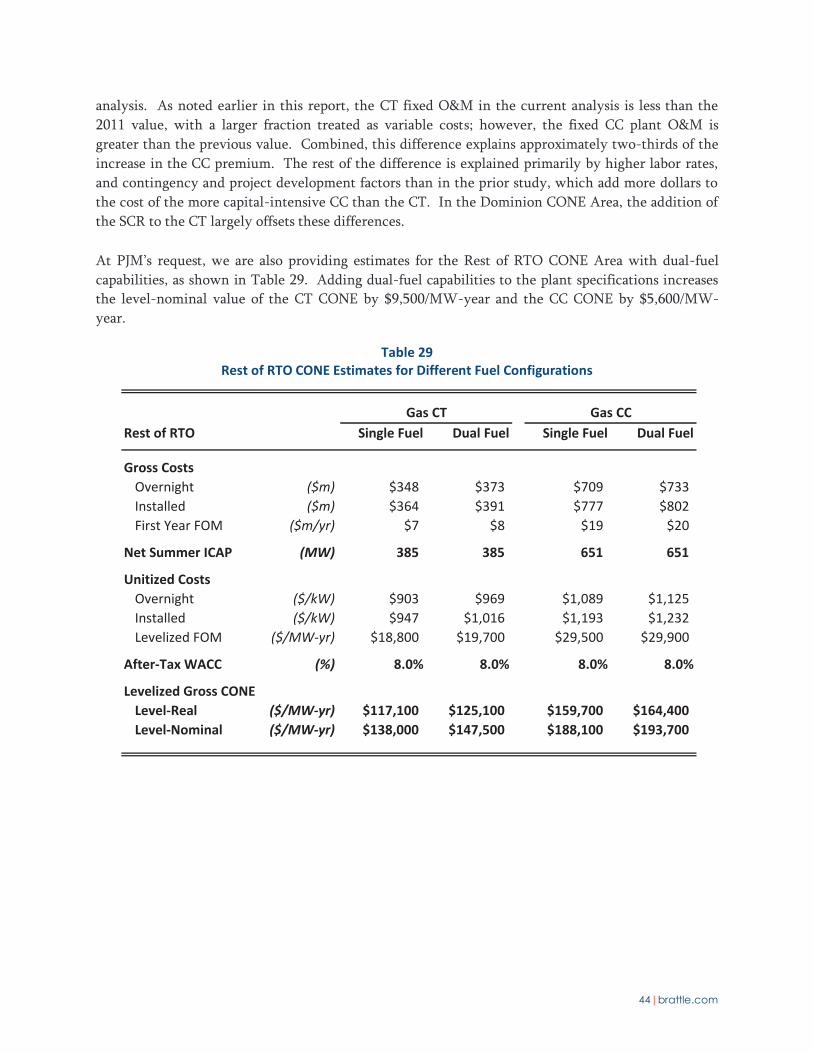
44|brattle.com
analysis. As noted earlier in this report, the CT fixed O&M in the current analysis is less than the 2011 value, with a larger fraction treated as variable costs; however, the fixed CC plant O&M is greater than the previous value. Combined, this difference explains approximately two-thirds of the increase in the CC premium. The rest of the difference is explained primarily by higher labor rates, and contingency and project development factors than in the prior study, which add more dollars to the cost of the more capital-intensive CC than the CT. In the Dominion CONE Area, the addition of the SCR to the CT largely offsets these differences.
At PJM’s request, we are also providing estimates for the Rest of RTO CONE Area with dual-fuel capabilities, as shown in Table 29. Adding dual-fuel capabilities to the plant specifications increases the level-nominal value of the CT CONE by $9,500/MW-year and the CC CONE by $5,600/MW-year.
Table 29 Rest of RTO CONE Estimates for Different Fuel Configurations
Gas CT Gas CCRest of RTO Single Fuel Dual Fuel Single Fuel Dual Fuel
Gross CostsOvernight ($m) $348 $373 $709 $733Installed ($m) $364 $391 $777 $802First Year FOM ($m/yr) $7 $8 $19 $20
Net Summer ICAP (MW) 385 385 651 651
Unitized CostsOvernight ($/kW) $903 $969 $1,089 $1,125Installed ($/kW) $947 $1,016 $1,193 $1,232Levelized FOM ($/MW-yr) $18,800 $19,700 $29,500 $29,900
After-Tax WACC (%) 8.0% 8.0% 8.0% 8.0%
Levelized Gross CONELevel-Real ($/MW-yr) $117,100 $125,100 $159,700 $164,400Level-Nominal ($/MW-yr) $138,000 $147,500 $188,100 $193,700
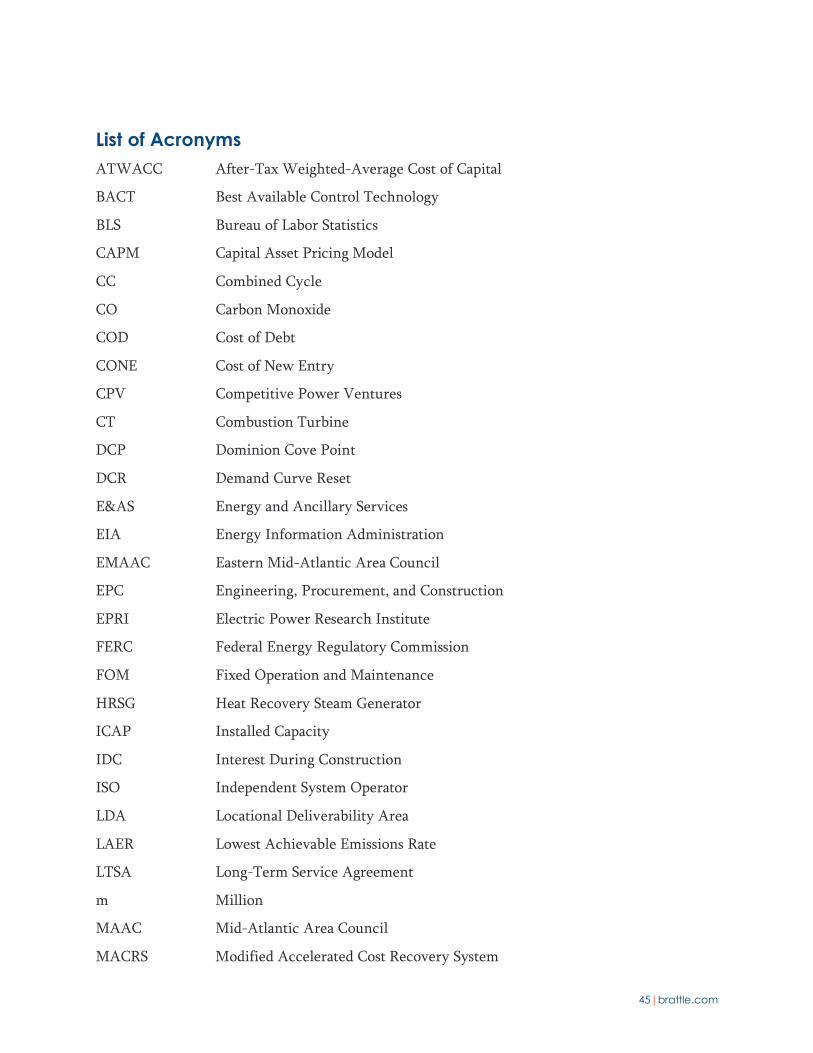
45|brattle.com
List of Acronyms ATWACC After-Tax Weighted-Average Cost of Capital
BACT Best Available Control Technology
BLS Bureau of Labor Statistics
CAPM Capital Asset Pricing Model
CC Combined Cycle
CO Carbon Monoxide
COD Cost of Debt
CONE Cost of New Entry
CPV Competitive Power Ventures
CT Combustion Turbine
DCP Dominion Cove Point
DCR Demand Curve Reset
E&AS Energy and Ancillary Services
EIA Energy Information Administration
EMAAC Eastern Mid-Atlantic Area Council
EPC Engineering, Procurement, and Construction
EPRI Electric Power Research Institute
FERC Federal Energy Regulatory Commission
FOM Fixed Operation and Maintenance
HRSG Heat Recovery Steam Generator
ICAP Installed Capacity
IDC Interest During Construction
ISO Independent System Operator
LDA Locational Deliverability Area
LAER Lowest Achievable Emissions Rate
LTSA Long-Term Service Agreement
m Million
MAAC Mid-Atlantic Area Council
MACRS Modified Accelerated Cost Recovery System
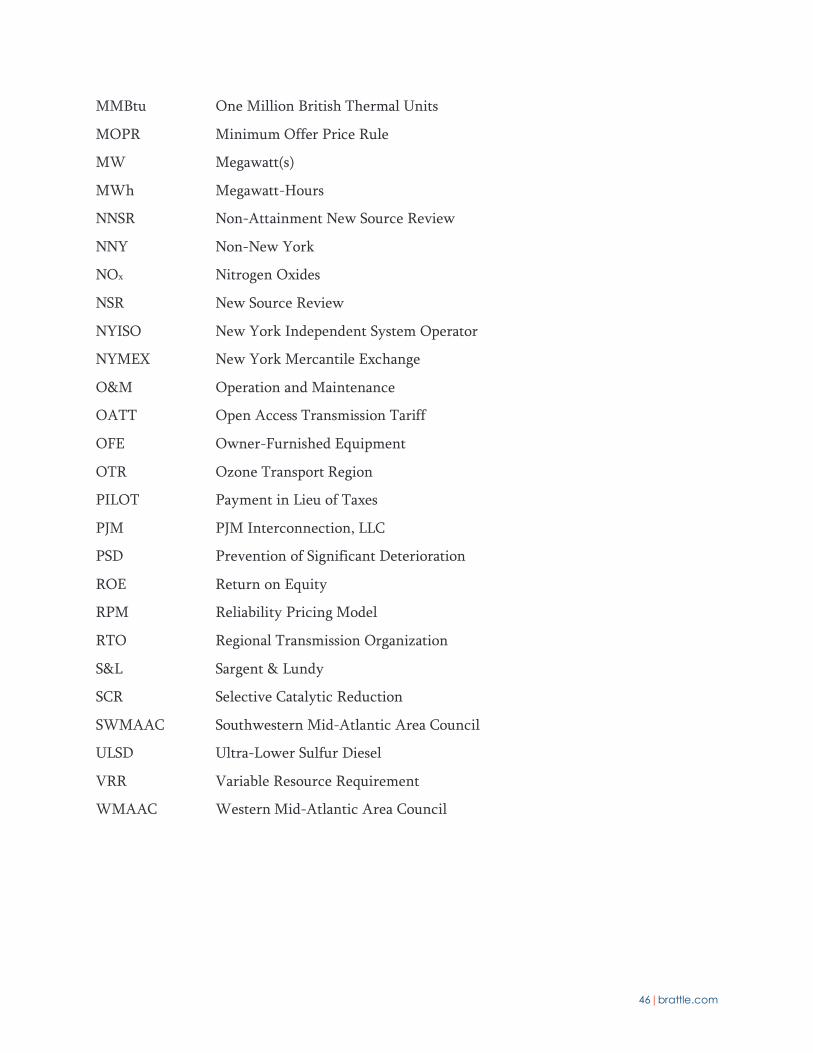
46|brattle.com
MMBtu One Million British Thermal Units
MOPR Minimum Offer Price Rule
MW Megawatt(s)
MWh Megawatt-Hours
NNSR Non-Attainment New Source Review
NNY Non-New York
NOx Nitrogen Oxides
NSR New Source Review
NYISO New York Independent System Operator
NYMEX New York Mercantile Exchange
O&M Operation and Maintenance
OATT Open Access Transmission Tariff
OFE Owner-Furnished Equipment
OTR Ozone Transport Region
PILOT Payment in Lieu of Taxes
PJM PJM Interconnection, LLC
PSD Prevention of Significant Deterioration
ROE Return on Equity
RPM Reliability Pricing Model
RTO Regional Transmission Organization
S&L Sargent & Lundy
SCR Selective Catalytic Reduction
SWMAAC Southwestern Mid-Atlantic Area Council
ULSD Ultra-Lower Sulfur Diesel
VRR Variable Resource Requirement
WMAAC Western Mid-Atlantic Area Council