cost of school uniform 2015 - assets.publishing.service.gov.uk · list of tables . table 1 number...
TRANSCRIPT

Cost of school uniform 2015 Research report
June 2015
Elizabeth Davies - BMG Research

Contents List of figures 5
List of tables 6
Executive summary 8
Introduction 8
Method 8
Key findings 8
Uniform, PE kit, and logo requirements 8
Cost of school uniform 9
Cost of PE Kit 10
Changes to school uniform 10
Satisfaction with costs 10
Financial hardship and assistance 11
Factors influencing purchases 11
Introduction 12
Background to the research 12
Aims of the research 13
Methodology 13
Notes on reading the report 14
Survey findings 15
Uniform and logo requirements 15
Required items of uniform 15
Use of school logo on uniform 17
Where items can be purchased 18
Logos 19
2

Cost of school uniform 20
Average number of items bought 20
Cost of each item of uniform 21
Average expenditure on each item of uniform 26
Total expenditure on school uniform in 2015 to date 28
PE kit and logo requirements 31
Required items of PE kit 31
Use of school logo on PE kit 33
Cost of PE kit 34
Average number of items bought 34
Cost of each item of PE kit 35
Average expenditure on each type of item of PE kit 37
Total expenditure on PE kit to date in 2015 39
Financial assistance with uniform and PE kit 42
Financial hardship 42
Types of assistance accessed 42
Consequences of not wearing a uniform 43
Changes to school uniform and PE kit 43
Happiness with costs of uniform and perceptions of the value- for-money of uniforms 44
Factors influencing purchases 46
Availability, cost, and quality 46
Has cost of school uniform ever discouraged them from applying to a particular school? 47
Appendix 1: Cost calculations 48
Appendix 2: Weighting 50
Appendix 3: Questionnaire 53
3

Appendix 4: Sample profile 65
4

List of figures Figure 1 Items of uniform required in 2015 and 2007 16
Figure 2 Average number of items bought in 2015 and 2007 21
Figure 3 Average costs of uniform by item in 2015 and 2007 22
Figure 4 Average total expenditure on different types of items of uniform in 2015 and 2007 28
Figure 5 Items of PE kit required in 2015 and 2007 32
Figure 6 Average number of items bought in 2015 and 2007 35
Figure 7 Average costs of PE kit by item in 2015 and 2007 36
Figure 8 Average total expenditure on PE kit by item in 2015 and 2007 39
Figure 9 Happiness with costs of school uniform and PE kit by household income 45
Figure 10 Extent to which different factors influence parent’s/carer’s decisions when purchasing school uniform 46
5

List of tables Table 1 Number of items requiring a logo by school phase 17
Table 2 Buying restrictions in 2015 compared with 2007 18
Table 3 Average costs of uniform by item and phase in 2015 and 2007 23
Table 4 Average costs of uniform by item, phase and type in 2015 24
Table 5 Average costs of uniform by item and buying restrictions in 2015 25
Table 6 Average total expenditure on individual items of uniform 2015 27
Table 7 Total expenditure on all school uniform items in 2015 29
Table 8 Average total expenditure on all school uniform items in 2007 and 2015 by gender and phase 30
Table 9 Average total expenditure on all school uniform items in 2015 by where uniform is available 30
Table 10 Number of items requiring a logo by school phase in 2015 33
Table 11 Average costs of PE kit by item and phase in 2015 and 2007 37
Table 12 Average total expenditure on items of PE kit 2015 38
Table 13 Average total expenditure on all PE kit items in 2015 40
Table 14 Average total expenditure on all PE kit items in 2007 and 2015 by gender and phase 40
Table 15 Average total expenditure on all school PE kit items in 2015 by where PE kit is available 41
Table 16 Profile of respondents in 2007 and 2015 studies 50
Table 17 Phase of school 65
Table 18 Type of school 65
Table 19 Eligibility for free school meals 65
Table 20 Eligibility for free school meals (excluding parents/carers with both a household income of more than £15,000 and a child below Year 3) 65
Table 21 Annual household income 66
6

Table 22 Ethnicity of respondent 66
Table 23 Region of respondent 67
7

Executive summary
Introduction This report presents findings from the Cost of School Uniform 2015 study. The research was carried out by BMG Research on behalf of the Department for Education (DfE) with parents/carers of children in state funded education.
The research was commissioned to assess whether the relative cost of school uniforms has changed since a previous ‘Cost of schooling 2007’ study, and as a baseline against which to measure the impact of any future policy action.
Method The study involved a telephone survey of a representative sample of 1,200 parents/carers of children aged 4 to 16 attending state funded schools in England, using random digit dialling. Fieldwork was conducted between February and March 2015.
Subgroup analysis has been undertaken to understand key differences based on school phase, school type, household income, and eligibility for free school meals. When comparing costs with findings from 2007 these have been adjusted for inflation using the Retail Price Index (RPI).
Key findings
Uniform, PE kit, and logo requirements
Nearly all parents/carers (99%) said their child’s school required children to wear school uniform. Several items are required by nearly every child who requires a school uniform, including shirts/blouses (99% for girls and 98% for boys), shoes (96%), and jumpers/sweatshirts (91%).
The proportion of parents/carers who reported that their child’s school required them to have blazers increased from 26 per cent in 2007 to 35 per cent in 2015. Parents/carers whose child was at a secondary school were more likely than those whose child was at a primary school to require a blazer (75% compared with 6%), and a tie (77% compared with 22%). Both these items were also more likely to be required where the child attended a secondary academy than a secondary non-academy (81% compared with 70% for blazers; and 83% compared with 73% for ties).
The majority of parents/carers (94%) said that their child’s school required children to have a PE kit. Items that are required by nearly every child who requires a PE kit include all-year-round t-shirts (97%), and plimsolls/trainers (93%).
8

Parents/carers whose child was at a secondary school were more likely to require specialist items than those whose child was in primary school, including: hockey/football/rugby boots (37% compared with 7%); socks (77% compared with 29%); a summer and winter t-shirts (26% compared with 13% in both cases).
Most parents/carers (88%) reported that at least one item of uniform required a logo. The likelihood of at least one item of school uniform requiring a logo was significantly higher amongst parents/carers whose child was in secondary school (97% compared with 81% for primary school children). Further to this the majority of respondents (82%) reported that all items had to be purchased with the logo on, only 14 per cent were allowed to sew/attach these on.
Over two-thirds (67%) of parents/carers reported that at least one item of PE kit required a logo, again, this proportion was significantly higher for those whose child was in secondary school (89% compared with 49% of those in primary school).
When parents were asked where their child’s school uniform and PE kit could be purchased the majority (62%) of parents/carers could buy these items from a combination of designated shops/the school and anywhere else. Nearly one-fifth (17%) of parents/carers could buy all their child’s school uniform and PE kit from any shop; the overall proportion of those who could purchase the required items from anywhere has decreased compared with 2007 (when it was 22%).
Cost of school uniform
Once the 2007 costs have been adjusted for inflation, the average cost of all but one item of uniform has decreased since 2007. The single item of uniform which has increased in cost is a schoolbag. Items were consistently more expensive for parents/carers of children in secondary school than for those with children at primary school; however, there were no significant differences in the cost of items based on the type of school attended (academy or non-academy) within each phase.
The majority of clothing items were found to be cheapest when parents/carers reported they could buy items from anywhere. However, more specialist items such as blazers and hats were found to be less expensive when items either had to be bought exclusively from specialist shops or the school, or some items had to be bought from these outlets.
The average total expenditure on school uniform for the 2014/15 school year to date (so up to the end of February 2015) was £212.88.1 This was less expensive for those in primary school (£192.14 for boys and £201.04 for girls) than in secondary school (£231.01 for boys and £239.93 for girls).
1 Comparison costs are not provided here due to differences in the methodology used to generate the average total expenditure on uniform in 2015 and 2007. These differences are explored in detail in the main report.
9

The average total expenditure was also less expensive when items could be purchased from any shop (£188.82).
Cost of PE Kit
Once the 2007 costs have been adjusted for inflation, the average cost of all but two items of PE kit have decreased since 2007. The items of PE kit that have increased in cost are skirts and hockey boots. Items were consistently more expensive for parents/carers of children in secondary school than for those with children at primary school.
The average total expenditure on PE kit to date based on the items required in 2015 was £87.67.2 This was less expensive for those in primary school (£66.23 for boys and £62.60 for girls) than in secondary school (£130.52 for boys and £103.63 for girls).
As with school uniform, the average total expenditure was also less expensive when items could be purchased from any shop (£63.13).
Changes to school uniform
Nearly one-third (31%) of parents had experienced changes in their child’s school uniform in the last three years. This was more likely to be the case where the child went to an academy than to another type of state-funded school (35% compared with 19% in the primary phase, and 43% compared with 39% in the secondary phase). Within this three year period, nearly one-half (48%) of parents had experienced changes in their child’s school uniform in the last year.
Where changes had been made these were mostly one or two changes. The scale of these were evenly split between small changes (50%) and major changes (50%).
Satisfaction with costs
Over two-thirds (69%) of parents/carers are ‘very happy’ or ‘quite happy’ with the cost of school uniform and PE kit in 2015; however, this proportion has decreased from 75 per cent in 2007. Parents/carers of children in primary school were more likely to be happy with the costs than those who have children in secondary school (77% compared with 58%).
Low income families (those with household incomes of less than £15,000) were particularly likely to be unhappy with the costs of uniform and PE kit compared with those
2 As previously, comparison costs are not provided here due to differences in the methodology used to generate the average total expenditure on PE kit in 2015 and 2007. These differences are explored in detail in the main report.
10

with higher household incomes (43% per cent of the former were unhappy compared with 26% of the latter). This pattern is also associated with eligibility for free school meals (42% of those who are eligible are unhappy with the cost compared with 27% of those who are ineligible).
Over three-quarters (78%) reported they thought school uniform items to be excellent (11%) or good (67%) value for money, whilst one-fifth (20%) though them to be poor (17%) or very poor (3%) value for money. Parents or carers who could purchase their child’s uniform from anywhere were more likely to think the uniform was excellent or good value than those who could not (88% compared with 77%).
Only a small minority of parents/carers (3%) reported that the cost of school uniform had at some point in the past, discouraged them from applying to enter their child into a particular school.
Financial hardship and assistance
Nearly one-fifth (18%) of parents/carers reported that they had suffered financial hardship as a result of purchasing their child’s school uniform. Parents/carers were significantly less likely to report that they experienced financial hardship if the school allowed them to purchase all items of uniform from anywhere (9% compared with 20%).
Parents/carers whose households have a lower annual income and/or are eligible for free school meals are more likely to report experiencing financial hardship (37% of those with an annual household income of £15,000 or less report this compared with 10% of those with household incomes in excess of £15,000; and 38% of those who are eligible for free school meals report this compared with 13% of those who are ineligible).
Three per cent of parents/carers reported that they had received financial help or assistance when buying school uniform for their child (including Local Authority grants, charity grants, funds from school, or funds from friends/family). However, over one-half (58%) reported that they did not receive financial assistance as there was none available.
Factors influencing purchases
The factor that is most influential on parents’ purchasing decisions is quality. Over two-thirds (67%) of respondents said that this influenced them to some extent or a great deal, whilst 61 per cent gave one or other of these ratings on the ‘availability’ measure and 56 per cent gave one or other of the ratings on the ‘cost’ measure.
Overall, parents/carers who were strongly influenced by these factors were more likely to have a child in primary school, whilst parents with a child in secondary school were more likely to say they were not influenced by these factors, suggesting other elements feed into the decision-making process for parents in secondary school.
11

Introduction This report presents findings from the Cost of School Uniform 2015 study. The research was carried out by BMG Research, on behalf of the Department for Education (DfE), with parents/carers of children in state-funded education.
Background to the research Education in state-funded schools is England is free; however, parents and carers are frequently required to fund the costs associated with a child’s attendance at school including school uniform, PE kit, transport, school meals, and school trips.
The DfE issues non-statutory guidance which sets out best practice on developing school uniform policy. The current guidance places considerable emphasis on cost considerations e.g. that schools should keep compulsory branded items to a minimum, and exclusive single supplier contracts should be avoided. The guidance states that: ‘No school uniform should be so expensive as to leave pupils or their families feeling unable to apply to, or attend, a school of their choice, due to the cost of the uniform.’3
Research has previously been carried out to investigate the costs to parents/carers associated with a child’s schooling in 2003 and 2007. These costs included those of school uniform, PE kit, transport, school meals, and school trips, amongst others. This prior research included surveys of parents/carers, schools, and children.
After adjusting the costs identified in the 2003 study for inflation using the Retail Price Index (RPI) to enable comparison, the 2007 study was able to show (using estimates from its survey of parents/carers) that the annual cost of school uniform for a child to parents/carers had, on average, increased between 2003 and 2007 by £4.70; whilst the average annual cost for PE kit had decreased by £2.20.
The DfE has not completed a systematic survey of the cost of uniforms since the last Cost of Schooling 2007 study. This research was commissioned to be undertaken with parents/carers to repeat only the uniform and PE kit related elements of the Cost of Schooling study to assess whether the relative cost of school uniforms has changed since then and to act as a baseline against which to measure the impact of any future policy action.
3 Department for Education. (2013). School uniform: Guidance for governing bodies, school leaders, school staff, and local authorities. https://www.gov.uk/government/uploads/system/uploads/attachment_data/file/269113/school_uniform_guidance_2013.pdf
12

Aims of the research The DfE commissioned this research to address the following research questions:
• What are the costs to parents and carers for uniform and PE kit when sending their children to state-funded primary and secondary schools in England?
• How do the costs vary across different types of schools and across school phases?
• Have costs to parents and carers increased or decreased in real terms since 2007?
• Are parents/carers happy or unhappy with the costs of school uniform and PE kit, and have their views changed since 2007?
• Do parents/carers find it easy or difficult to meet the costs of school uniform and PE kit, and has this changed since 2007?
Methodology A key consideration for the approach to this research was that findings should be comparable with those of the 2007 survey. For this reason a similar approach was adopted to that used in the survey of parents/carers in 2015. However, one key difference between the 2007 and 2015 survey designs was the decision to add parents/carers of children in reception classes into the 2015 design for the first time, to allow the views and experiences of these parents/carers to be included in the research. Another key difference was the shorter period of time explored in this study; in the previous research parents were asked to retrospectively consider their requirements for the full 2007 school year, whilst in this study parents were reflecting on the time period between September and February (so 2 school terms as opposed to 3). The number of items bought would obviously not affect the average cost of each item.
The questionnaire was also kept similar, although some amendments were made to make sure the questions were up-to-date and relevant to current circumstances, and to explore the decision-making process parents/carers undertook when purchasing school uniform.
As in 2007 the survey of parents/carers was carried out using a random-digit dialling telephone survey technique. Interviewers screened households to ensure that the respondent had at least one child aged between 4 to 16 in state-funded education and that the prospective interviewee was the person best able to discuss the costs associated with their child’s education. If there was more than one eligible child, a random technique, selection of the child who had the most recent birthday, was used to select one child as the focus of survey questions. Thus, all questions in the survey were asked in relation to this randomly-selected child.
1,200 parents/carers were interviewed in total using a Computer Assisted Telephone Interview (CATI) approach. The questionnaire took an average of 16 minutes to
13

complete. The pilot stage of the survey, to test the questionnaire, took place on the 8th and 9th of February 2015. Main stage fieldwork was carried out between 10th February and 4th March 2015.
Notes on reading the report Although occasional anomalies appear due to rounding differences, these are never more than +/-1 per cent. These occur where, for example, average scores on rating scales have been added to calculate proportions of respondents who are satisfied at all (i.e. adding together percentages of those who are either very or fairly satisfied). Following comparison of the survey sample profile in respect of a variety of ‘structural’ characteristics (household size and income, ethnicity, and others) with the same characteristics of the general population of households in England and with the same characteristics of the 2007 Cost of Schooling survey, it was determined that weighting of the sample was required only to adjust the relative proportions of responses from parents/carers of children at the primary stage compared with those from parents/carers of children at the secondary stage (Appendix 2 describes weighting considerations in more detail and a full sample profile is included in Appendix 4).
Unweighted bases, (the actual numbers of respondents who answered particular questions prior to adjusting the primary/secondary balance of responses) are shown in the report’s graphs and tables.
Various crosstabulations have been included in our analysis for this report. These show whether or not there are differences in findings between sub-groups of the population which was surveyed. Comparisons are made according to:
• School phase and type
• Household income
• Eligibility for free school meals (excluding parents/carers with both a household income of more than £15,000 and a child below Year 3)
Independent t-tests for the significance of differences between sub-groups were conducted at the 95 per cent confidence level. Where specific findings from cross-tabulations are discussed in the report it is because they have been identified as statistically significant unless otherwise stated.
Throughout the report findings are compared, where possible, to findings from the previous Cost of Schooling 2007 study. When costs are compared, data from 2007 has been adjusted for inflation using the RPI. Appendix 1 gives details of this procedure.
14

Survey findings The following section explores the findings from the survey. Where distinctions are relevant and significant, the section compares subgroups including those based on school phase/type, household income, and eligibility for free school meals.
Uniform and logo requirements Nearly all parents/carers (99%) said their child’s school required children to wear school uniform. This is slightly higher to that reported in the 2007 study (98%). Parents/carers of a child in primary school were slightly less likely to say their child required a school uniform than those with a child in secondary school (98% compared with 99%).
Required items of uniform
Parents/carers were asked which items of clothing they were required by the school to buy for their child from a pre-defined list which was read out.
Figure 1 shows the percentage of parents/carers who reported that their child’s school required each item of uniform compared with the 2007 study. It should be noted that, in line with the 2007 study, the figures for shirts/blouses, skirts/kilts and dresses/pinafores are based on female children only, while those for shirts and shorts are based on male children only. Figure 1 shows that, as in 2007, there are several items that are required by nearly every child who requires a school uniform, including shirts/blouses (99% for girls and 98% for boys), shoes (96%), and jumpers/sweatshirts (91%).
Figure 1 also shows a high proportion of change in the requirement for certain items since 2007. Specifically, this includes:
• the proportion of parents/carers who reported that their child’s school required them to have school-approved socks has increased from 42 per cent in 2007 to 76 per cent in 2015;
• the proportion of parents/carers who reported that their child’s school required them to have blazers has increased from 26 per cent in 2007 to 35 per cent in 2015;
• the proportion of parents/carers who reported that their child’s school required them to have shorts has decreased from 54 per cent in 2007 to 40 per cent in 2015,4 and
4 This reduction is likely related to the time of year at which they survey was conducted and the period of time it covers.

• the proportion of parents/carers who reported that their child’s school required them to have a school-approved dress/pinafore has decreased from 44 per cent in 2007 to 19 per cent in 2015.
Figure 1 Items of uniform required in 2015 and 2007
Base= All parents/carers where child’s school requires uniform (1,183)
Source: Survey of parents/carers Note: Coats were included as an item in 2015 but not 2007
Parents/carers whose child was at a primary school were more likely than those whose child was at a secondary school to require a skirt/kilt/short (69% compared with 51%); a jumper/sweatshirt/cardigan (99% compared with 80%); a dress/pinafore (31% compared with 3%); a hat (12% compared with 4%); and a coat (59% compared with 52%).
In contrast, parents/carers whose child was at a secondary school were more likely than those whose child was at a primary school to require a blazer (75% compared with 6%), and a tie (77% compared with 22%).
When type of school is also taken into consideration, the requirements further varied between phases and types of schools.
• Parents/carers whose child was at a secondary non-academy school were more likely to require a jumper/sweatshirt/cardigan than those in a secondary academy (84% compared with 76%).
11%
44%
26%
54%
40%
42%
77%
72%
88%
92%
91%
95%
97%
9%
19%
35%
40%
45%
56%
76%
79%
80%
83%
91%
96%
98%
99%
0% 20% 40% 60% 80% 100%
Hat
Dress/pinafore (Girls only)
Blazer
Shorts (Boys only)
Tie
Coat
Socks
Schoolbag
Skirt/kilt (Girls only)
Trousers
Jumper/sweatshirt
Shoes
Shirt (Boys only)
Shirt/blouse (Girls only)
2015 (Base=1,183) 2007 (Base=1,464)
16

• Parents/carers whose child was at a secondary academy school were more likely to require a blazer than those who child was at a secondary non-academy (81% compared with 70%).
• Parents/carers whose child was at a secondary academy were more likely to require a tie than those who child was at a secondary non-academy (83% compared with 73% of those at secondary non-academy).
There were no significant differences in the types of uniform parents/carers were required to buy between the different types of primary school.
Use of school logo on uniform
Parents/carers were asked how many of the items of school uniform they were required to buy also required a logo, or for which they could have an optional logo.
Most parents/carers (88%) reported that at least one item of uniform required a logo whilst considerably fewer (28%) stated that at least one logo was optional. These figures are consistent with findings in the 2007 study. Table 1 shows the percentages of parents/carers who, in 2015, reported that logos were required.
Table 1 Number of items requiring a logo by school phase
Logo required
Primary (n=602)
%
Secondary (n=581)
%
None 19% 3%
One 34% 30%
Two 28% 40%
Three 15% 20%
Four 4% 4%
Five or more 1% 3% All parents/carers where child’s school requires uniform (1,183)
Source: Survey of parents/carers
The proportion of parents/carers who reported that at least one item of school uniform required a logo was significantly higher for those whose child was in secondary school (97% compared with 81% for primary school children). In contrast the proportion of parents/carers who reported at least one item of school uniform could have an optional logo was significantly higher for those who child was in primary school (38% compared with 14% for secondary school children).
The types of clothes that were most frequently reported to require a logo were jumpers/sweatshirts/cardigans (66%), blazers (32%), and shirts/blouses/t-shirts (24%).
17

Children in the primary phase were more likely to require a logo on a jumper/sweatshirt/cardigan if they attended a non-academy than if they attended an academy (74% compared with 66%). Children in the secondary phase were more likely to require a logo on a blazer if they attended an academy than if they attended a non-academy (78% compared with 66%).
Where items can be purchased
Parents/carers were asked where items of school uniform and PE kit could be purchased (including from designated shops, the school itself, or any other outlets such as sole sources or as combinations of sources). Table 2 shows the proportion of respondents whose child’s school adhered to each option in comparison to the same findings from 2007.
Table 2 Buying restrictions in 2015 compared with 2007
2007 (Base=1,464)
2015 (Base=1,183)
Some items have to be bought from designated shop(s), but others can be bought anywhere
27% 35%
Some items have to be bought from school, but others can be bought anywhere
34% 27%
All items can be bought from anywhere 22% 17%
All items have to be bought from designated shop(s) 6% 11%
All items have to be bought from school 5% 5%
Some items have to be bought from the school and some from designated shop(s)
6% 5%
All parents/carers where child’s school requires uniform (1,183) Source: Survey of parents/carers
The majority (62%) of parents/carers could buy their child’s uniform from a combination of designated shops/the school and anywhere else. This is a similar proportion as in 2007 (61%), although the balance of those who can buy some items from the school compared with those who can buy some items from designated shops has reversed as shown in Table 2. Nearly one-fifth (17%) of parents/carers could buy all their child’s school uniform from any shop; however, the overall proportion has decreased compared with 2007 (when it was 22%).
• Parents/carers of children in secondary school were more likely to need to buy their child’s uniform from a combination of designated shops and anywhere else than those whose child was in primary school (42% compared with 30%).
18

• Parents/carers of children in primary school were more likely to need to buy their child’s uniform from a combination of the school and anywhere else than those whose child was in secondary school (31% compared with 20%).
• Parents/carers of children in primary school were more likely to be able to buy their child’s uniform from any shop than those whose child was in secondary school (26% compared with 4%).
• Parents/carers of children in secondary school were more likely to need to buy their child’s uniform from designated shops only than those whose child was in primary school (20% compared with 6%).
• Parents/carers of children in secondary school were more likely to need to buy their child’s uniform from the school only than those whose child was in primary school (6% compared with 4%).
• Parents/carers of children in secondary school were more likely to need to buy their child’s uniform from a combination of designated shops and the school only than those whose child was in primary school (7% compared with 3%).
There were no significant differences in where items could be purchased when comparing types of schools within each phase.
Further to this, parents/carers were asked whether the school their child attended made second-hand school uniforms available for purchase or donation. Second-hand uniforms were available for purchase in nearly one-quarter (23%) of schools, whilst 3 per cent provided second-hand uniforms free of charge, and 6 per cent provided both options. Over one-half (57%) of schools did not offer any of these options, and 11 per cent did not know either way. Second-hand items that could be purchased were more likely to be an option for parents whose child was in primary schools than secondary (28% compared with 16%).
Logos
Parents/carers were also asked if they were allowed to sew/attach logos onto items of uniform or PE kit themselves. The majority of respondents (82%) reported that all items had to be purchased with the logo on, whilst only 14 per cent were allowed to sew/attach these on. Parents/carers with a child in secondary school were more likely to report that they could sew/attach logos than those with a child in primary school (21% compared with 8%). There were no significant differences by school type in this respect.
19

Cost of school uniform Parents/carers were asked about the number of items they had purchased in the 2014/15 school year and the costs of a randomly-selected four of these items. This data was used to determine the average cost of specific items and the total average cost of school uniform.5
As in 2007, interviewers were instructed to probe for the price of single items only. For example if the price of a pack of three shirts was given, the cost recorded was calculated on the price of a single item (i.e. pack price divided by 3).
Average number of items bought
Figure 2 shows the average number of each item purchased for the 2014/15 school year by the end of February 2015 compared with those bought in 2007.
It can be noted that in nearly all instances, parents/carers in this study have purchased slightly fewer items than had parents in the 2007 study. It is likely that this is because, as noted previously, this study only accounts for purchasing behaviour for approximately two out of three school terms in comparison to all three. The number of items bought would obviously not affect the average cost of each item.
5 Four items were randomly selected for which parents/carers provided costs in order to meet time constraints on interviews.
20

Figure 2 Average number of items bought in 2015 and 2007
Base= All parents/carers where child’s school requires uniform (1,183), individual item bases vary
Source: Survey of parents/carers Note: Coats were included as an item in 2015 but not 2007
Cost of each item of uniform
Figure 3 shows the average costs for one of each item of uniform for both the 2015 and 2007 studies. The 2007 figures have been adjusted for inflation using the RPI to allow a more direct comparison between the findings.
Figure 3 shows that, once the 2007 costs have been adjusted for inflation, the average cost of all but one item of uniform has decreased since 2007. The single item of uniform which has increased in cost is a schoolbag. 6
6 Individual costs were explored by school year to identify if the inclusion of children in Reception classes in 2015 had added to any change in the costs of items. There was found to be no statistically significant difference between the average costs per item for those in Reception compared with Years 1-6. This, combined with a similar proportion of respondents from the primary and secondary phases in 2007, leads us to conclude the inclusion of children in Reception has not impacted on the average cost per item shown.
0.9
1.1
1.4
1.3
2.0
3.5
2.6
2.4
2.2
2.4
4.8
5.5
9.6
1.1
1.2
1.2
1.3
1.4
1.7
2.1
2.2
2.2
2.3
2.5
4.5
5.3
9.3
0.0 1.0 2.0 3.0 4.0 5.0 6.0 7.0 8.0 9.0 10.0
Hat
Blazer
Schoolbag
Coat
Tie
Shorts (Boys only)
Trousers
Dress/pinafore (Girls only)
Shoes
Skirt/kilt (Girls only)
Jumper/sweatshirt
Shirt/blouse (Girls only)
Shirt (Boys only)
Socks
2015 (Base=1,183) 2007 (Base=1,464)
21

Figure 3 Average costs of uniform by item in 2015 and 2007
Base= All parents/carers where child’s school requires uniform (1,183), individual item bases vary
Source: Survey of parents/carers Note: Coats were included as an item in 2015 but not 2007
The level of change between 2007 and 2015 was similar for purchases in relation to primary and secondary schools, as shown in Table 3. Items were consistently more expensive for parents/carers of children in secondary school than for those with children at primary school (again, the 2007 figures have been adjusted for inflation using the RPI to allow a more direct comparison between the findings).
£3.31
£5.21
£5.63
£7.15
£7.52
£8.11
£9.86
£12.29
£11.33
£13.87
£12.92
£34.45
£39.36
£1.63
£5.03
£5.20
£5.36
£5.65
£6.40
£8.44
£9.79
£10.59
£12.36
£13.86
£30.19
£32.67
£34.05
£- £10.00 £20.00 £30.00 £40.00
Socks
Hat
Tie
Shirt (Boys only)
Shirt/blouse (Girls only)
Shorts (Boys only)
Dress/pinafore (Girls only)
Trousers
Skirt/kilt (Girls only)
Jumper/sweatshirt
Schoolbag
Shoes
Coat
Blazer
2015 (Base=1,183) 2007 (Base=1,464)
22

Table 3 Average costs of uniform by item and phase in 2015 and 2007
Primary Secondary
2007 (n=840)
2015 (n=602)
2007 (n=624)
2015 (n=581)
Shirt/blouse (Girls only) £6.28 £4.23 £9.22 £7.37
Shirt (Boys only) £6.03 £4.88 £8.76 £6.21
Jumper/sweatshirt/cardigan £11.82 £10.31 £17.11 £16.74
Shoes £32.09 £26.00 £37.54 £36.44
Trousers £8.96 £7.17 £16.40 £13.46
Schoolbag £9.17 £8.97 £17.64 £20.96
Skirt/kilt (Girls only) £9.04 £6.85 £16.72 £17.22
Shorts (Boys only) £7.17 £5.54 £10.25 £8.63
Socks £3.11 £1.60 £3.60 £1.67
Tie £4.44 £3.83 £5.96 £5.71
Dress/pinafore - £7.86 - £19.75
Blazer - £30.36 - £34.32
Coat - £27.36 - £41.23 All parents/carers where child’s school requires uniform (1,183), individual item bases vary
Source: Survey of parents/carers Note: Comparisons for dresses/pinafores, blazers, and coats by school phase are not available.
Costs for hat not included due to low subgroup bases
Costs were further explored to identify if there were any significant differences based on the type of school attended by children in the different phases. As Table 4 shows, there are slight differences between academies and other types of state-funded schools for each item of school uniform within each phase of education. However, neither type of school is consistently or predominantly more or less expensive and these differences are not statistically significant.
23

Table 4 Average costs of uniform by item, phase and type in 2015
Primary Secondary
Academy (n=173)
Other type of state funded school
(n=423)
Academy (n=280)
Other type of state funded school
(n=287)
Shirt/blouse (Girls only) £3.84 £4.42 £7.39 £7.38
Shirt (Boys only) £4.64 £4.92 £5.76 £6.73
Jumper/sweatshirt/cardigan £10.11 £10.39 £16.67 £16.94
Shoes £25.15 £26.34 £37.82 £35.34
Trousers £7.45 £7.06 £13.59 £13.34
Schoolbag £8.94 £8.96 £20.63 £21.02
Skirt/kilt (Girls only) £6.92 £6.81 £18.41 £16.41
Shorts (Boys only) £6.00 £5.22 £9.35 £7.91
Socks £1.74 £1.54 £1.78 £1.53
Tie £4.21 £3.61 £5.60 £5.97
Dress/pinafore £7.47 £7.92 £20.50 £19.00
Blazer £31.00 £30.00 £34.57 £33.92
Coat £28.33 £26.94 £38.92 £43.38 All parents/carers where child’s school requires uniform (1,183), individual item bases vary
Source: Survey of parents/carers Note: Comparisons for hats, dresses/pinafores, blazers, and coats by school phase are not available
Costs for hat not included due to low subgroup bases
Costs were also analysed in relation to where uniform can be bought, as shown in Table 5. The table shows that, as in the 2007 study, most items tended to be substantially cheaper when they could be bought anywhere. However, interestingly, more specialist items such as blazers and hats were found to be less expensive when these items either had to be bought exclusively from specialist shops or the school, or some items had to be bought from these outlets.
24

Table 5 Average costs of uniform by item and buying restrictions in 2015
All items have to be
bought from school/
designated shop
(Base=194)
Some items have to be
bought from school/
designated shop
(Base=734)
Some items have to be
bought from designated shop and
some have to be bought
from school (Base=58)
Items can be bought
anywhere (Base=200)
Shirt/blouse (Girls only) (Base=299)
£7.90 £5.79 £5.91 £3.49
Shirt (Boys only) (Base=336)
£7.64 £5.31 £7.27 £3.94
Jumper/sweatshirt/cardigan (Base=579)
£15.19 £12.73 £15.36 £8.67
Shoes (Base=595)
£34.69 £30.26 £33.14 £25.07
Trousers (Base=510)
£12.49 £9.72 £12.05 £7.05
Schoolbag (Base=416)
£17.62 £13.75 £14.50 £9.31
Skirt/kilt (Girls only) (Base=225)
£15.77 £10.71 £17.90 £6.83
Shorts (Boys only) (Base=105)
£8.20 £6.58 £6.72 £4.68
Socks (Base=425)
£1.82 £1.62 £1.82 £1.48
Tie (Base=244)
£5.70 £5.10 £5.43 £4.11
Hat (Base=29)
£5.28 £4.85 - £5.33
Dress/pinafore (Base=66)
£9.10 £9.33 £8.67 £6.29
Blazer (Base=213)
£37.60 £31.74 £39.61 £38.83
Coat (Base=299)
£41.28 £31.37 £40.18 £27.97
All parents/carers where child’s school requires uniform (1,183), individual item bases vary Source: Survey of parents/carers
25

Average expenditure on each item of uniform
As in 2007, by taking the price for each item of uniform and multiplying by the number of items bought in the previous year for each respondent, the average cost to parents/carers for school uniform items was calculated. This was then imputed for those who required this item of school uniform but did not report the cost, and an overall average was calculated. The cost in both 2015 and 2007 therefore applies only to parents/carers who needed each item.
Therefore the average cost was calculated for each item based on individual responses to both questions and not simply obtained by multiplying the average cost of each item by the average number bought.
Table 6 shows the average expenditure on each type of item by the parents who purchased that type of item. As in 2007, average annual expenditure was highest (for parents who made that type of expenditure) on shoes (£59.13); this was followed by coats (£42.05), blazers (£38.83) and trousers (£30.65).
26

Table 6 Average total expenditure on individual items of uniform 2015
% needing
item (n=1,183)
Average cost per item (£)
Average number of
items bought
Average total expenditure
(£)
Shirt/blouse (Girls only) 99% £5.65 4.5 £23.66 (n=571)
Shirt (Boys only) 98% £5.36 5.3 £24.62 (n=595)
Jumper/sweatshirt/cardigan 91% £12.36 2.5 £28.66 (n=1,059)
Shoes 96% £30.19 2.2 £59.13 (n=1,131)
Trousers 83% £9.79 2.1 £30.65 (n=987)
Schoolbag 79% £13.86 1.2 £18.61 (n=929)
Skirt/kilt (Girls only) 80% £10.59 2.3 £20.83 (n=459)
Shorts (Boys only) 40% £6.40 1.7 £15.83 (n=259)
Socks 76% £1.63 9.3 £14.11 (n=901)
Tie 45% £5.20 1.4 £7.14 (n=582)
Hat 9% £5.03 1.1 £5.26 (n=99)
Dress/pinafore 19% £8.44 2.2 £17.45 (n=207)
Blazer 35% £34.05 1.2 £38.83 (n=472)
Coat 56% £32.67 1.3 £42.05 (n=661)
All parents/carers where child’s school requires uniform (1,183), individual item bases vary Source: Survey of parents/carers
As can be seen in Figure 4, the average expenditure on each type of item was lower than in 2007 after adjusting for inflation. The largest decrease in expenditure was in that on shoes (from £79.40 in 2007 to £59.13 in 2015).
27

Figure 4 Average total expenditure on different types of items of uniform in 2015 and 2007
Base= All parents/carers where child’s school requires purchase of each type of item of uniform (1,183),
individual item bases vary Source: Survey of parents/carers
Note: Coats were included as an item in 2015 but not 2007
Average expenditures were higher across all types of items of school uniform for children in secondary school than for children in primary school. As shown earlier in Tables 3 and 4 these differences reflect a higher cost per item in the secondary phase than in primary.
Total expenditure on school uniform in 2015 to date
This section examines the total expenditure on school uniform so far in 2015. Whilst broad comparisons are made in this section to the total expenditure on uniform in 2007, some caution is necessary in making these comparisons, for 3 reasons:
1. Unlike the 2007 study, this analysis is based upon parents/carers requiring each particular item of uniform, rather than on all of those who need any item of uniform. This avoids overestimation of expenditure from inclusion of children where children may not need some particular items of uniform.
£4.93
£7.10
£29.15
£15.72
£23.76
£18.32
£24.02
£33.91
£35.21
£31.56
£40.22
£41.35
£79.40
£5.26
£7.14
£14.11
£15.83
£17.45
£18.61
£20.83
£23.66
£24.62
£28.66
£30.65
£38.83
£42.05
£59.13
£- £20.00 £40.00 £60.00 £80.00
Hat
Tie
Socks
Shorts (Boys only)
Dress/pinafore (Girls only)
Schoolbag
Skirt/kilt (Girls only)
Shirt/blouse (Girls only)
Shirt (Boys only)
Jumper/sweatshirt
Trousers
Blazer
Coat
Shoes
2015 (Base=1,183) 2007 (Base=1,464)
28

2. This study only captures the information for items of clothing bought for the 2014/15 school year by the end of February 2015 whereas the 2007 study captured information for a full school year. It was noted (Figure 2 earlier) that the average numbers of items purchased in the 2007 and 2015 studies are slightly lower in each case in 2015 due to the different time-periods covered. Generally, it is assumed that most items are bought at the start of the school year and, therefore, that broad comparisons between the total expenditures on school uniform (and PE kit) can be made between the studies but with a caveat to reflect the fact that further items may still be required in 2015.
3. The total expenditures on school uniform in 2007 did not include the cost of a coat which this study does.
Table 7 provides a banded breakdown of total school uniform expenditures for both phase of schooling and type of school. As in 2007, total expenditures were more likely to be higher for parents/carers with children in secondary school compared with parents/carers of primary schoolchildren. There was no statistically significant difference in expenditure when comparing types of school within each phase of education. There were no statistically significant differences based on household income or eligibility for free school meals.
Table 7 Total expenditure on all school uniform items in 2015
Total
(n=1,183) (%)
Primary (n=602)
%
Secondary (n=581)
%
Less than £100 6% 8% 3%
£100-£149 13% 18% 7%
£150-£199 27% 30% 23%
£200-£249 28% 25% 31%
£250-£299 16% 12% 21%
£300+ 10% 7% 15% All parents/carers where child’s school requires uniform (1,183), individual item bases vary
Source: Survey of parents/carers
Table 8, shows the average total expenditure on school uniform in 2015 to date. The corresponding figures from 2007 adjusted for inflation are also shown.
The average total expenditure on school uniform to date, based on the items required in 2015 was £212.88 compared with £228.48 for the full year in 2007. However, as noted previously, this comparison is caveated in that a direct reconstruction of how data was captured and analysed in 2007 was not possible on this occasion. As such these expenditures may increase for parents/carers as the 2014/15 school year progresses
29

(although it should also be noted the cost of a coat was not included in 2007 whereas it has been in 2015).
Table 8 Average total expenditure on all school uniform items in 2007 and 2015 by gender and phase
Total cost 2007 Total cost to date 2015
All parents/carers £228.48 £212.88
Primary – boys £202.84 £192.14
Secondary – boys £272.40 £231.01
Primary – girls £203.40 £201.04
Secondary – girls £252.10 £239.93 All parents/carers where child’s school requires uniform (1,183), individual item bases vary
Source: Survey of parents/carers Note: Data not available from 2007 to show comparison by type
There was no statistically significant difference in total expenditure when comparing types of school within each phase of education.
Finally, in Table 9, the average total expenditures on school uniform were compared for parents/carers who had different options as to where items of school uniform could be purchased. This comparison shows that the average expenditure on school uniform was lowest where items can be purchased from anywhere (£188.82) and highest when all items had to be purchased from designated shops and/or the school itself (£237.76).
Table 9 Average total expenditure on all school uniform items in 2015 by where uniform is available
Total cost
All parents/carers £212.88 (n=1,183)
Whether all items have to be purchased from designated shop or school
£237.76 (n=206)
Some items have to be purchased from designated shop or school and some can be purchased anywhere
£211.73 (n=734)
Some items have to be purchased from designated shop and some have to be purchased from school
£228.35 (n=60)
All items can be purchased from anywhere £188.82 (n=179)
All parents/carers where child’s school requires uniform (1,183), individual item bases vary Source: Survey of parents/carers
30

PE kit and logo requirements The majority of parents/carers (94%) said that their child’s school required children to have a PE kit. This is slightly higher than the proportion (90%) reported in the 2007 study. Parents/carers of children in primary school were less likely to say their child required a PE kit than those with a child in secondary school (93% compared with 97%).
Required items of PE kit
Parents/carers were asked which items of PE kit they were required by the school to buy for their child from a pre-defined list which was read out.
Figure 5 shows the percentages of parents/carers who reported that their child’s school required each item of PE kit and compares these with percentages from the 2007 study. It should be noted that, in line with the 2007 study, the figures for some items are based on parents/carers of female children only (skirts, hockey boots, and swimming costume) and others based on parents/carers of male children only (football/rugby shirts and boots, and swimming trunks).
Figure 5 shows that, as in 2007, there are a few items that are required by nearly every child who requires a PE kit, including all-year-round t-shirts (97%), and plimsolls/trainers (93%).
Other items were not as frequently needed, likely due to learner choice of preferred sports and the seasonal nature of some sports.
31

Figure 5 Items of PE kit required in 2015 and 2007
Base= All parents/carers where child’s school requires PE kit (1,134)
Source: Survey of parents/carers Note: PE bags and tracksuit bottoms were included as an item in 2015 but not 2007
As in 2007, parents/carers whose child was at a secondary school were more likely to require specialist items than those whose child was in primary school, including: hockey/football/rugby boots (37% compared with 7%); socks (77% compared with 29%); a summer t-shirt (26% compared with 13%); a winter t-shirt (26% compared with 13%); a skirt/football/rugby shirt (41% compared with 6%); and a jumper/tracksuit top (39% compared with 28%).
In contrast, parents/carers whose child was at a primary school were more likely to require the following items than those whose child was at secondary school: shorts (91% compared with 87%); a year-round t-shirt (98% compared with 95%); a full tracksuit (28% compared with 21%); a swimming costume/trunks (34% compared with 19%); and a PE bag (71% compared with 41%).
9%
15%
22%
20%
30%
39%
37%
38%
30%
45%
49%
97%
96%
92%
5%
12%
18%
19%
25%
26%
29%
30%
32%
35%
41%
50%
58%
89%
93%
97%
0% 20% 40% 60% 80% 100%
Hockey boots (Girls only)
Skirts (Girls only)
PE shirt (summer)
PE shirt (winter)
Tracksuit
Swimming trunks (Boys only)
Swimming costume (Girls only)
Football/rugby shirt (Boys only)
Jumper
Football/rugby boots (Boys only)
Tracksuit bottoms
Socks
PE bag
Shorts
Plimsolls/trainers
T-shirts (all year round)
2015 (Base=1,134) 2007 (Base=1,352)
32

There are no differences in the type of PE kit required when comparing types of school within each phase of education.
Use of school logo on PE kit
Parents/carers were asked how many of the items of PE kit they were required to buy also required a logo, or for which they could have an optional logo.
Over two-thirds (67%) of parents/carers reported that at least one item of PE kit required a logo whilst considerably fewer (19%) stated that at least one logo was optional. These results are consistent with findings in the 2007 study. Table 10 shows the percentages of parents/carers who reported different numbers of logos were required.
Table 10 Number of items requiring a logo by school phase in 2015
Logo required
Primary (n=568)
%
Secondary (n=569)
%
None 51% 11%
One 26% 21%
Two 15% 26%
Three 5% 20%
Four 8% 10%
Five or more 2% 13% All parents/carers where child’s school requires PE kit (1,134)
Source: Survey of parents/carers
The proportion of parents/carers who reported that at least one item of PE kit required a logo was significantly higher for those whose child was in secondary school (89% compared with 49% of those in primary school). In contrast the proportion of parents/carers who reported at least one item of PE kit could have an optional logo was significantly higher for those who child was in primary school than for those whose child was in a secondary school (23% compared with 14%).
The types of PE kit that were most frequently reported to require a logo were all year round t-shirts (54%), followed by PE bags (15%). PE bags were significantly more likely to require logos in primary schools than secondary (22% compared with 6%); whilst logos were more likely to be required on all-year round t-shirts in secondary school than primary (77% compared with 37%).
33

Cost of PE kit Parents/carers were subsequently asked about the number of items they purchased and the costs of four of these in order to determine the average cost of specific items, and the total average cost of PE kit.7
As in 2007 interviewers were instructed to probe for the price of a single item only. For example if the price of a pack of three shirts was given, the cost recorded was calculated on the price of a single item (i.e. divided by 3).
Average number of items bought
Figure 6 shows the average number of each item purchased for the 2014/15 school year by the end of February 2015 compared with those bought in 2007.
It is noted that as with school uniform in many instances parents/carers in this study have purchased slightly less items than those in 2007. It is likely that this is because, as noted previously, this study only accounts for purchasing behaviour for approximately two out of three school terms in comparison to all three in 2007.
7 Four items were randomly selected for parents/carers to provide costs for to reflect time constraints in the survey.
34

Figure 6 Average number of items bought in 2015 and 2007
Base= All parents/carers where child’s school requires PE kit (1,134), individual item bases vary
Source: Survey of parents/carers Note: PE bags and tracksuit bottoms were included as an item in 2015 but not 2007
Cost of each item of PE kit
Figure 7, shows the average costs for one of each item of PE kit in both the 2015 and 2007 studies. The 2007 figures have been adjusted for inflation using the RPI to allow a more direct comparison between the two sets of findings.
Figure 7 shows that, once the 2007 costs have been adjusted for inflation, the average cost of all but two items of PE kit have decreased since 2007. The items of PE kit that have increased in cost are skirts and hockey boots.
0.8
1.1
0.9
1.3
1.3
1.0
1.1
1.4
1.1
1.8
1.7
1.4
1.8
2.5
0.9
0.9
1.0
1.1
1.1
1.1
1.1
1.2
1.2
1.2
1.3
1.4
1.5
1.5
1.8
3.4
0.0 1.0 2.0 3.0 4.0
Hockey boots (Girls only)
PE bag
Tracksuit
Skirts (Girls only)
Swimming trunks (Boys only)
Swimming costume (Girls only)
Football/rugby shirt (Boys only)
Jumper
Football/rugby boots (Boys only)
Tracksuit bottoms
PE shirt (winter)
Plimsolls/trainers
PE shirt (summer)
Shorts
T-shirts (all year round)
Socks
2015 (Base=1,134) 2007 (Base=1,352)
35

Figure 7 Average costs of PE kit by item in 2015 and 2007
Base= All parents/carers where child’s school requires PE kit (1,134), individual item bases vary
Source: Survey of parents/carers Note: PE bags and tracksuit bottoms were included as an item in 2015 but not 2007
The degree of change was similar for purchases in respect of children in primary and secondary schools, as shown in Table 11. Items were consistently more expensive for parents/carers of children in secondary school than for those with children at primary school (again, the 2007 figures have been adjusted for inflation using the RPI to allow a more direct comparison between the findings).
£4.90
£6.70
£7.31
£8.13
£8.57
£11.82
£11.64
£13.93
£15.28
£17.83
£22.26
£20.41
£30.59
£39.07
£3.61
£5.75
£6.54
£7.09
£7.52
£8.45
£10.52
£11.12
£11.80
£12.05
£12.96
£18.16
£18.52
£19.84
£31.50
£34.88
£- £10.00 £20.00 £30.00 £40.00
Socks
Shorts
PE bag
T-shirts (all year round)
Swimming trunks (Boys only)
PE shirt (summer)
Tracksuit bottoms
Swimming costume (Girls only)
Skirts (Girls only)
PE shirt (winter)
Jumper
Football/rugby shirt (Boys only)
Tracksuit
Plimsolls/trainers
Hockey boots (Girls only)
Football/rugby boots (Boys only)
2015 (Base=1,134) 2007 (Base=1,352)
36

Table 11 Average costs of PE kit by item and phase in 2015 and 2007
Primary Secondary
2007
2015 (n=567)
2007
2015 (n=567)
T-shirts (all year round) £5.57 £4.60 £10.26 £11.39
Plimsolls/trainers £12.69 £11.82 £32.88 £32.17
Shorts £5.48 £4.26 £8.75 £8.65
PE bag - £5.67 - £9.39
Socks - £1.82 - £4.59
Tracksuit bottoms - £6.86 - £14.85
Jumper £11.86 £8.83 £18.47 £16.96
Tracksuit £18.19 £15.03 £30.85 £28.09 All parents/carers where child’s school requires PE kit (1,134), individual item bases vary
Source: Survey of parents/carers Note: Comparisons for some items of PE kit are not available from the 2007 study due to low bases
Costs for some items not included due to low subgroup bases
Average expenditure on each type of item of PE kit
As in 2007 by taking the price for each item of PE kit and multiplying by the number of items bought in the previous year for each respondent, the average cost to parents/carers for PE kit items was calculated. This was then imputed for those who required this item of PE kit but did not report the cost, and an overall average was calculated. The cost in both 2015 and 2007 therefore applies only to parents/carers who needed each item.
Therefore the average cost was calculated for each item based on individual responses to both questions and not simply obtained by multiplying the average cost of each item by the average number bought.
The following table, Table 12, shows the average expenditure on each type of item by the parents who purchased that type of item. As in 2007, average annual expenditure was highest (for parents who made that type of expenditure) was highest for football/rugby boots (£39.49).
37

Table 12 Average total expenditure on items of PE kit 2015
% needing
item (n=1,134)
Average cost per item (£)
Average number of
items bought
Average total expenditure
(£)
T-shirts (all year round) 97% £7.09 1.8 £11.97
Plimsolls/trainers 93% £19.84 1.4 £28.28
Shorts 89% £5.75 1.5 £8.82
PE bag 58% £6.54 0.9 £6.49
Socks 50% £3.61 3.4 £8.46
Tracksuit bottoms 41% £10.52 1.2 £12.54
Football/rugby boots (Boys only)
35% £34.88 1.2 £39.49
Jumper 32% £12.96 1.2 £15.20
Football/rugby shirt (Boys only)
30% £18.16 1.1 £17.83
Swimming costume (Girls only)
29% £11.12 1.1 £11.75
Swimming trunks (Boys only)
26% £7.52 1.1 £10.82
Tracksuit 25% £18.52 1.0 £19.04
PE shirt (winter) 19% £12.05 1.3 £13.63
PE shirt (summer) 18% £8.45 1.5 £11.69
Skirts (Girls only) 12% £11.80 1.1 £14.59
Hockey boots (Girls only) 5% £31.50 0.9 £37.69 All parents/carers where child’s school requires PE kit (1,134), individual item bases vary
Source: Survey of parents/carers
Average annual expenditure was again higher for all items of school PE kit for children in secondary school than for children in primary school. As shown in Table 11 earlier, these differences reflect a higher cost per item in the secondary phase than in primary.
Figure 8 shows that the average amount spent on each type of item was lower than in 2007 after adjusting for inflation. The largest decrease was for football/rugby boots (from £56.89 in 2007 to £39.49 in 2015).
38

Figure 8 Average total expenditure on PE kit by item in 2015 and 2007
Base= All parents/carers where child’s school requires uniform (1,183), individual item bases vary
Source: Survey of parents/carers Note: PE bags and tracksuit bottoms were included as an item in 2015 but not in 2007
Total expenditure on PE kit to date in 2015
This section examines total expenditure on PE kit so far in 2015. As with school uniform expenditure, whilst broad comparisons are made in this section of the total expenditure on PE kit in 2007 and 2015, some caution is necessary when making these comparisons – in respect of a slightly different base for the calculations, a two-terms rather than a whole year time period for expenditure, and inclusion of extra items (PE bag and tracksuit bottoms) in the 2015 calculation.
Table 13 provides a banded breakdown of total expenditure on PE kit for both phase and type of school. As in 2007, total expenditures were more likely to be higher for parents/carers with children in secondary school than for parents/carers of primary schoolchildren. There were no statistically significant differences in these bandings based on household income or eligibility for free school meals.
£11.07
£9.84
£11.08
£13.78
£15.22
£12.68
£15.16
£10.59
£16.43
£21.17
£23.46
£37.74
£30.59
£56.89
£6.49
£8.46
£8.82
£10.82
£11.69
£11.75
£11.97
£12.54
£13.63
£14.59
£15.20
£17.83
£19.04
£28.28
£37.69
£39.49
£- £10.00 £20.00 £30.00 £40.00 £50.00 £60.00
PE bag
Socks
Shorts
Swimming trunks (Boys only)
PE shirt (summer)
Swimming costume (Girls only)
T-shirts (all year round)
Tracksuit bottoms
PE shirt (winter)
Skirts (Girls only)
Jumper
Football/rugby shirt (Boys only)
Tracksuit
Plimsolls/trainers
Hockey boots (Girls only)
Football/rugby boots (Boys only)
2015 (Base=1,134) 2007 (Base=1,352)
39

Table 13 Average total expenditure on all PE kit items in 2015
Total
(n=1,134) (%)
Primary (n=567)
%
Secondary (n=567)
%
Less than £100 66% 84% 41%
£100-£149 22% 12% 37%
£150-£199 8% 3% 15%
£200-£249 2% 1% 4%
£250-£299 1% *% 2%
£300+ 1% *% 1% All parents/carers where child’s school requires PE kit (1,134), individual item bases vary
Source: Survey of parents/carers
Table 14 shows the average total expenditure on school PE kit in 2015 to date. The corresponding figures from 2007 adjusted for inflation are also shown.
On average, the average total expenditure on PE kit to date based on the items required in 2015 was £87.67 compared with £108.21 for the full year in 2007. However, as noted previously this comparison is caveated in that a direct reconstruction of how data was captured and analysed in 2007 was not possible. As such these expenditures may increase for parents/carers as the 2014/15 school year progresses (although it should also be noted the cost of a PE bag and tracksuit bottoms was not included in 2007 whereas it has been in 2015).
Table 14 Average total expenditure on all PE kit items in 2007 and 2015 by gender and phase
Total cost 2007 Total cost to date 2015
All parents/carers £108.21 £87.67
Primary – boys £66.88 £66.23
Secondary – boys £192.62 £130.52
Primary – girls £65.17 £62.60
Secondary – girls £126.68 £103.63 All parents/carers where child’s school requires PE kit (1,134), individual item bases vary
Source: Survey of parents/carers Note: Data not available from 2007 to show comparison by type
Expenditures were also likely to be higher for those whose child was at a primary academy compared to those for children in other types of primary state-funded schools (£71.77 compared with £61.62). Finally, average total expenditure on PE kit was analysed according to where parents/carers could buy it. Table 15 shows that average expenditure on PE kit was lowest where items can be purchased from anywhere (£63.13)
40

and highest when all items had to be purchased from the designated shop and/or school (£107.61).
Table 15 Average total expenditure on all school PE kit items in 2015 by where PE kit is available
Total cost
All parents/carers £87.67 (n=1,134)
Whether all items have to be purchased from designated shop or school
£107.61 (n=200)
Some items have to be purchased from designated shop or school and some can be purchased anywhere
£87.35 (n=709)
Some items have to be purchased from designated shop and some have to be purchased from school
£105.29 (n=57)
All items can be purchased from anywhere £63.13 (n=165)
All parents/carers where child’s school requires PE kit (1,134), individual item bases vary Source: Survey of parents/carers
41

Financial assistance with uniform and PE kit
Financial hardship
Nearly one-fifth (18%) of parents/carers reported that they had suffered financial hardship8 as a result of purchasing their child’s school uniform. There were no significant differences in parent’s likelihood of reporting that they had experienced financial hardship based on the phase or type of school their child attended. However, parents/carers were significantly less likely to report that they experienced financial hardship if the school allowed them to purchase all items of uniform from anywhere (9% compared with 20%).
Correspondingly (given that ‘anywhere’ purchase of uniform has been shown to be of lower average cost), the total cost of school uniform and PE kit was significantly higher for those who reported having experienced financial hardship (£244.17 for uniform and £105.90 for PE kit for those who had experienced this, compared with £206.01 for uniform and £83.57 for PE kit for those who had not).
Parents/carers whose households have a lower annual income are more likely to report experiencing financial hardship (37% of those with an annual household income of £15,000 or less report this compared with 10% of those with household incomes in excess of £15,000). Not surprisingly, this pattern is also associated with eligibility for free school meals, with those who are eligible being more likely to report having experienced financial hardship than those who are ineligible (38% compared with 13%).
Essentially, financial hardship appears to be a combined function of low income and high uniform costs.
Types of assistance accessed
When asked if they had received any financial help or assistance when buying school uniform for their child (including Local Authority grants, charity grants, funds from school, or funds from friends/family) three per cent of parents/carers reported that they had received help, compared with four per cent in 2007. However, over one-half (58%) reported that they did not receive financial assistance as there was none available – of these respondents were significantly more likely to be eligible for free school meals (69% compared with 55%), or to have an annual household income of less than £15,000 (68% compared with 54%). This suggests many parents/carers on low incomes would value financial assistance but are not able to receive it as it is not available.
8 Respondents were informed that ‘financial hardship’ meant that, as a result of purchasing their child’s school uniform, they could not pay for their accommodation, their bills, buy food, or meet other essential costs.
42

Those on a lower income were more likely to have had financial assistance. This applied to 6 per cent of those with an annual household income of less than £15,000 per year, compared with 2 per cent of those with a household income in excess of £15,000.
Over two-thirds (69%) of those who had received financial help in the form of grants from an organisation were eligible for free school meals. Those who were not eligible for free school meals were more likely to seek support from friends/family (8 out of 9 respondents).
There were no differences in likelihood of receiving financial support according to phase of school attended by the child. However, parents/carers of children in primary academies were more likely than parents/carers of children in primary non-academies to report that they did not receive any financial assistance as they did not require (54% compared with 41%).
Consequences of not wearing a uniform Parents/carers were asked whether their child had ever been sent home for not wearing the correct uniform. Four per cent of parents/carers said this had happened, which was similar to the proportion recorded in 2007 (3%). As in the 2007 study, this was more frequent in secondary schools than in primary schools (8% compared with 1%). However, there was no difference by type of school.
There was also no difference in this proportion based on eligibility for free school meals. However, the figure was higher amongst those on a low income (7% of those with an annual household income of less than £15,000 compared with 3% of those with a household income in excess of £15,000).
It should be noted that answers to this question both in 2007 and 2015 may have been influenced by reluctance on the part of the parent/carer to admit to having their child being sent home. It should also be noted that instances of children being sent home, for whatever reason, may not always be relayed accurately to the parent.
Changes to school uniform and PE kit Parents were asked if there had been any changes to their child’s uniform or PE kit in the last 3 years (or less if the child had not been in the school that long).
Nearly one-third (31%) of parents had experienced changes in their child’s school uniform in the last three years. This was more likely to be the case where the child went to an academy than to another type of state-funded school (35% compared with 19% in the primary phase, and 43% compared with 39% in the secondary phase). In the majority (85%) of cases there had been only one change to the uniform and more than three changes had only been made in 4 cases. Higher numbers of changes (i.e. two or three changes) were more likely to have taken place in academies than in other types of state funded schools.
43

Within the three year period referenced in the previous paragraph, nearly one-half (48%) of parents had experienced changes in their child’s school uniform in the last year. Again, in nearly all these cases, there had only been one or two changes.
When asked about the scale of the changes made to uniforms over the last three years, these changes were evenly split between small changes (50%) and major changes (50%).
Happiness with costs of uniform and perceptions of the value- for-money of uniforms Over two-thirds (69%) of parents/carers are ‘very happy’ or ‘quite happy’ with the cost of school uniform and PE kit in 2015. However, this proportion has decreased from 75 per cent in 2007. In more detail, 16 per cent of parents/carers were ‘very happy’ with the costs of uniform and PE kit in 2015, compared with 21 per cent in 2007 whilst and, a further 53 per cent were ‘quite happy’ in 2015 compared with 59 per cent in 2007. These declines in satisfaction are observed as occurring despite the falling prices for most items of uniform reported earlier.
In 2015, one-fifth (22%) of parents/carers were ‘not very happy’ with the costs of uniform and PE kit while a small proportion, of 8per cent, were ‘not at all happy’.
Parents/carers of children in primary school were more likely to be happy with the costs than those who have children in secondary school (77% compared with 58%). Parents of a child in primary academy were more likely to be happy with the cost of school uniform than those with a child in a primary non-academy (84% compared with 75%). There was no significant difference in parents’ levels of happiness in the secondary phase based on the type of school their child attended.
Happiness with costs varied by household income, with wealthier families being more likely to be happy with the costs. Figure 9, shows happiness with the costs of uniform and PE kit for all parents/carers and for different household income groups. Low income families (those with household incomes of less than £15,000) were particularly likely to be unhappy with the costs of uniform and PE kit compared with those with higher household incomes (43% per cent of the former were unhappy compared with 26% of the latter).
44

Figure 9 Happiness with costs of school uniform and PE kit by household income
Base= All parents/carers where child’s school requires uniform or PE kit (1,191), individual bases vary
Source: Survey of parents/carers
Correspondingly, this pattern is associated with eligibility for free school meals, with those who were eligible more likely to be unhappy with the cost of school uniform and PE kit (42% of those who are eligible compared with 27% of those who are ineligible).
Parents/carers were also asked about the extent to which they believed the items of school uniform they had purchased were good or poor value for money. Over three-quarters (78%) reported they thought school uniform items to be excellent (11%) or good (67%) value for money, whilst one-fifth (20%) though them to be poor (17%) or very poor (3%) value for money.
Those whose child was in primary school were more likely to think they got excellent or good value for money than those whose child was in secondary school (82% compared with 73%). Parents/carers of children in academies were more likely to think they got excellent or good value than those in other types of state-funded schools (88% compared with 80% in the primary phase, and 77% compared with 70% in the secondary phase).
Further, those parents or carers who could purchase their child’s uniform from anywhere were more likely to think the uniform was excellent or good value than those who could not (88% compared with 77%). Parents/carers whose children were eligible for free school meals were less likely to think they got excellent or good value than those who were ineligible (69% compared with 80%).
18%
11%
16%
56%
47%
53%
20%
29%
22%
6%
13%
8%
0% 20% 40% 60% 80% 100%
Household income of more than £15,000(Base=719)
Household income of less than £15,000(Base=315)
All parents/carers (Base=1,191)
Very happy Quite happy Not very happy Not at all happy
45

Factors influencing purchases
Availability, cost, and quality
Parents/carers were asked to consider the extent which availability, cost, and quality of items of uniform influenced their decisions on where to buy these items. Parents/carers responded on a scale of 1 to 5 where 1 is ‘not at all’ and 5 is ‘a great deal’ in respect of each of these items.
Figure 10 shows that the factor that is most influential on parents is quality. Over two-thirds (67%) of respondents said that this influenced them to some extent or a great deal. Fewer respondents gave these ratings on the other two attributes: 61 per cent gave one or other of these ratings on the ‘availability’ measure and 56 per cent gave one or other of the ratings on the ‘cost’ measure.
Figure 10 Extent to which different factors influence parent’s/carer’s decisions when purchasing school uniform
Base= All parents/carers where child’s school requires uniform or PE kit (1,191)
Source: Survey of parents/carers
Parents/carers whose child was in primary school were more likely than those whose child was in secondary school to be influenced by quality (71% compared with 62%). There were no differences by school type. However, parents/carers who were eligible for free school meals were less likely to be influenced by quality than those who were ineligible (59% compared with 69%).
Parents/carers whose child was in primary school were more likely than those whose child was in secondary school to be influenced by availability (66% compared with 55%). There were no differences on this measure according to school type, household income, or eligibility for free school meals.
15%
12%
9%
4%
6%
5%
17%
24%
18%
20%
22%
29%
41%
34%
38%
0% 20% 40% 60% 80% 100%
Availability of the uniform you need
Cost of the uniform
Quality of the uniform
1 - not at all 2 3 4 5 - a great deal
46

Parents/carers whose child was in primary school were also more likely than those whose child was in secondary school to be influenced by cost (62% compared with 49%). Again there were no differences by school type, income, or eligibility for free school meals.
Overall, parents/carers who were strongly influenced by these factors were more likely to have a child in primary school, whilst parents with a child in secondary school were more likely to say they were not influenced by these factors, suggesting other elements feed into the decision-making process for parents in secondary school.
Has cost of school uniform ever discouraged them from applying to a particular school?
A very small minority of parents/carers (3%) reported that the cost of school uniform had at some point in the past, discouraged them from applying to enter their child into a particular school. Whilst this provides a good measure of schools adherence to the guidelines set out by the DfE regarding the costs of school uniform not being prohibitive to parents applying for school place for their children, this data does not provide further information on whether the respondent is referring to their child’s current school or a school for which they did not apply.
However, where parents had been discouraged from applying to a particular school due to the cost of uniform there were no significant differences according to the child’s phase of education, the type of school the child is currently attending, or where uniform can be purchased from.
However, household income and eligibility for free school meals are likely to affect whether a parent/carer has been discouraged from applying to a particular school due to the cost of uniform. Eight per cent of those who were eligible for free school meals have been discouraged compared with one per cent of those who are not eligible. The figure was also higher amongst those on a low income (6% of those with an annual household income of less than £15,000 compared with 2% of those with a household income in excess of £15,000).
47

Appendix 1: Cost calculations Cost calculations were applied using the same approach as that undertaken in the Cost of School 2007 study in order to ensure comparability of findings.
As in the previous study, parents/carers were asked in a telephone interview whether a particular item of uniform or PE kit had been required. Then, for a maximum of four items (i.e. four items for school uniform and four for PE kit) they were asked what the cost per item was and how many they had bought in 2014/15. The overall expenditure on each item was then calculated by multiplying the number bought by the price for each case, and an average price calculated for each item.
As noted in the Cost of Schooling 2007 study, there are some limitations with this approach as it relies on respondent recall of purchases. Time constraints on the project in both studies dictated a telephone approach which, despite the reliance on the ability of parents/carers to recall, is an efficient and effective way of collecting the data. It should be noted that, due to the timing of the 2015 survey, on this occasion there was less elapsed time between parents’/carers’ purchases in the current school year and the survey than in the previous 2007 survey which asked parents/carers to think back over a full school year. However, the timing of the 2015 survey means that parents/carers in this study only reported current school year purchases to date and does not take into account any items that may be purchased during the remainder of the school year. However, when the average number of items purchased is compared between the two surveys, these are very similar for each item. It may be concluded that parents/carers buy most items at the start of the school year and, therefore, reasonable comparisons of the total costs of school uniform and PE kit can be made between the two studies, albeit with this caveat regarding survey timings.
The fact that each respondent was only asked for four randomly chosen items (to reduce the time burden on respondents) meant it was not possible to compile a complete picture of the expenditure of each parent/carer. Therefore, when total expenditure on uniform or PE kit was calculated, in cases where an item of uniform or PE kit was purchased but no cost was given (each respondent being asked the cost of a maximum of four items only) then an imputed cost was used – the mean cost for that item (based on all those who did answer the question). Whilst this approach is not exact, it allows the most accurate cost estimates within the interview length and other methodological constraints of the survey.
Throughout the report costs and expenditures are compared with those reported by the previous 2007 study. To enable valid comparisons, figures from the 2007 study have been adjusted to account for inflation. The Retail Price Index (RPI) has been used to make the adjustment. Taking 2007 as the base year, the subsequent RPI year-on-year change is:
• 2008: 4.0%
• 2009: -0.5%
• 2010: 4.6%

• 2011: 5.2%
• 2012: 3.2%
• 2013: 3.1%
• 2014: 2.4%
Using these annual rates of change in prices means that, to meaningfully compare 2007 and 2015 financial figures in the report, the former have to be multiplied by 1.2406. For example, school uniform jumpers/sweatshirts which actually cost £11.18 on average in 2007 need to be given an adjusted average ‘cost’ of £13.87 (the price which would apply if inflation since 2007 is accounted for) in order to make a valid comparison with the average cost of the same item observed in the 2015 survey.
49

Appendix 2: Weighting The sample of parents/carers reached was examined to see if non-response weighting might be required. While an exact population profile of parents/carers with children aged between 4 and 16 at maintained school is not available, as in the 2007 study suitable comparative data is available to ensure that no group is over- or under-represented in the final sample on which survey findings are based. These data derive from the national Population Census, the Labour Force Survey, and the previous 2007 study.
These sources were used to compare the profile of respondents to the overall population according to:
• Marital status
• Number of financially dependent children in household
• Ethnicity
• Working status
• Region
• Eligibility for free school meals
Overall, the profile of respondents and respondent households achieved by the 2015 survey sample was very close to national population and workforce profiles on these dimensions. Non-response weighting was therefore not necessary on the grounds of significant sample/population divergences in these respects. To allow meaningful comparisons of the 2007 and 2015 studies it was also important that the 2015 sample profile should not differ to any substantial degree from that of the 2007 sample. The following table shows the unweighted profile of respondents to the 2015 parents/carers survey compared with the relevant figures from the 2007 survey:
Table 16 Profile of respondents in 2007 and 2015 studies
% in 2007 study % in 2015 study
Household income
Less than £3,000 2% 2%
£3,000 - £5,999 4% 3%
£6,000 - £9,999 7% 8%
£10,000 - £14,999 11% 12%
£15,000 - £24,999 18% 19%
£25,000 - £34,999 18% 16%
£35,000 - £49,999 21% 13%
£50,000 or more 19% 12%

Don’t know/Refused 15%
Number of financially dependent children (under 18) in household
1 29% 30%
2 49% 44%
3 17% 18%
4 4% 6%
5 1% 2%
6+ 0.3% 1%
Ethnic origin of respondent
White 89% 84%
Black or Black British 3% 4%
Asian or Asian British 4% 8%
Mixed 1% 2%
Any other ethnic group 2% 1%
Working status
Working 79% 68%
Retired 1% 1%
Other 21% 31%
Marital status
Single, never married 16% 24%
Married and living with husband or wife 66% 63%
Married and separated from husband or wife 6% 5%
Divorced 11% 6%
Widowed 1% 1% Base: All respondents (1,200), Source: Survey of parents
51

Overall, it was judged that the sample profiles were sufficiently similar as to not introduce any major bias into comparisons of findings from the two points in time.
However, data from the survey sample data was also compared to the known proportions of children in primary and secondary schools and it was determined that, in this case, there was sufficient divergence between sample and population to justify weighting on this characteristic. Thus, the following design weights have been applied to ensure that the sample proportions of parents/carers of children in primary and secondary schools reflect actual population proportions ( the actual weights being: Primary – 1.1354; Secondary – 0.8586).
52

Appendix 3: Questionnaire DEPARTMENT FOR EDUCATION: PARENTS/CARERS SCHOOL UNIFORM QUESTIONNAIRE Screening S1 Good afternoon/evening. My name is ........ and I’m calling on behalf of BMG Research,
an independent market research company.
We are conducting a survey for the Government’s Department for Education into the costs of uniform for children in state schools. The survey will take approximately 10 minutes to complete and your help would be much appreciated. Are you willing to take part in the survey? IF NECESSARY: This study aims to find out what uniform costs are involved in sending children to state schools in England.. INSERT REASSURANCES ACCORDINGLY
• Your co-operation will ensure that the views expressed are representative of all parents/carers in England
• All information collected will be treated in the strictest confidence. Responses will not be attributed to any individual or company
• We work strictly within the Market Research Society Code of Conduct • Contact at BMG Research is Elizabeth Davies on 0121 333 6006 • READ OUT IF NECESSARY: The data collected in this survey will be processed in
accordance with the Data Protection Act and anonymised for further use within the scope of the study. No information will be published which permits the identification of any particular person, company or location.
Yes Continue Yes, but at another time Arrange appointment No Thank and close ASK ALL, SR S2 First of all can I just ask, how many children aged between 4 and 16 attending state
school live in this household? 0 1 CLOSE 1 2 ASK S7A 2 3
ASK S7B
3 4 4 5 5 6 6 7 7 8 8 or more 9 Refused X CLOSE
53

ASK ALL, SR S3 We would like to conduct the interview with the parent or guardian who is best equipped
to talk about the costs of their child or children’s school uniform. Are you the parent or guardian best equipped to talk about these issues? Yes 1 CONTINUE No 2 ASK TO TRANSFER
⇒ Re introduce survey if necessary
IF NECESSARY SUSPEND ON THIS SCREEN AND MAKE APPOINTMENT. COLLECT NAME OF CORRECT RESPONDENT IN CALL RECORD.
WHEN SPEAKING TO CORRECT RESPONDENT, CONTINUE
IF CORRECT RESPONDENT ASK ALL S4 What is your name? RECORD FIRST NAME AND SURNAME ASK ALL S5 What is your postcode? WRITE IN______________________ REFUSED CHILD DETAILS IF ONLY ONE CHILD ATTENDING STATE SCHOOL (S2=2), OPEN S7A And can I just record the name of the child aged between 4 and 16 who attends state
school? THIS WILL BE USED IN TEXT IN LATER QUESTIONS. IF RESPONDENT RELUCTANT, OFFER TO RECORD THE CHILDS INITIAL
IF MORE THAN ONE CHILD ATTENDING STATE SCHOOL (S2=3 TO 9). SR S7B We need to randomly select one child for you to answer questions on. Can I ask the name
of your child aged 4-16 attending state school (not including sixth form or college) whose birthday was most recent?
THIS WILL BE USED IN TEXT IN LATER QUESTIONS. IF RESPONDENT RELUCTANT, OFFER TO RECORD JUST THE INITIAL Yes – WRITE IN NAME 1 GO TO S8 Last birthday was twins / triplets etc. 2 ASK S7B1 REFUSED 3 CLOSE
IF TWINS / TRIPLETS (S7b=2), OPEN S7B1 Which of your children’s names comes first alphabetically.
54

ASK ALL, SR S8 Record child’s sex (should be clear – ASK IF NECESSARY)
Male 1 Female 2
ASK ALL, SR S8A And what is your relationship to (NAME)?
Parent – Mother (inc natural parent, step-parent, adoptive parent, and foster parent)
1
Parent – Father (inc natural parent, step-parent, adoptive parent, and foster parent)
2
Guardian 3
INTERVIEWER TEXT Thank you. Please answer the next questions with (NAME) in mind. BACKGROUND SCHOOLS INFO ASK ALL, SR Q1 What school year is (NAME) in?
Reception class (not pre-school) 1
CONTINUE
Year 1 2 Year 2 3 Year 3 4 Year 4 5 Year 5 6 Year 6 7 Year 7 8 Year 8 9 Year 9 10 Year 10 11 Year 11 12 Year 12 (6th Form) or Pre-school/nursery 13
GO BACK TO S7B AND ASK FOR OTHER CHILD IF NO OTHER CHILD IN S2 CLOSE
DK 14 GO TO FILTER ABOVE Q2 REFUSED 15
55

IF DK / REFUSED SCHOOL YEAR (Q1=14 or 15), SR Q2 Is (NAME) at primary, middle or secondary school?
Primary 1 CONTINUE Middle 2 Secondary 3 Reception Class 4 6th Form or pre-school/nursery
5
IF RESPONDENT HAS MORE THAN ONE CHILD AT STATE SCHOOL - GO BACK TO S7B AND ASK FOR OTHER CHILD IF NO OTHER CHILDREN AT STATE SCHOOL – THANK AND CLOSE
DK X TERMINATE ASK ALL, SR Q2i. Does (name) attend an academy or a different type of state school? PROBE AND CODE ONE
Academy (IF NEEDED including Free Schools) 1 CONTINUE
A different type of state school 2 CONTINUE Private or independent school 3 THANK AND CLOSE Don’t know 4 CONTINUE
ASK ALL, SR Q2ii How long has (NAME) been in their current school?
Less than a year 1 Between one and two years 2 Between two and three years 3 Three years or more 4
INTERVIEWER TEXT I’m now going to ask you to think about the types of school uniform items that (NAME’s) school may ask you to pay for or contribute to. UNIFORM ASK ALL, SR Q3 Starting with School uniform, does (NAME’s) school require pupils to wear a school
uniform? Yes 1 CONTINUE No 2
GO TO Q7 DK 3
56

ASK ALL WITH SCHOOL UNIFORM (Q3=1), MR Q5 Please tell me which of the following items of uniform you are required to buy for
(name)…
READ OUT. MULTICODED. ADD IF NECESSARY: Please think only of normal school uniform – PE kit will be covered later Response list filtered on sex of child. Girls Boys
i. Blouse/shirt/t-shirt i. Shirt/t-shirt ii. Trousers ii. Trousers iii. Skirt/kilt iii. Shorts iv. Jumper / sweatshirt/cardigan iv. Jumper / sweatshirt v. Blazer v. Blazer vi. Dress / Pinafore vi. - vii. Tie vii. Tie viii. Shoes viii. Shoes ix. School Bag ix. School Bag x. Hat x. Hat xi. Socks/tights xi. Socks xii. Coat xii. Coat
ASK Q5A AND Q5B IF ANY ITEM MENTIONED AT Q5 Q5A How many of these items were required to have a logo? ENTER NUMBER OF ITEMS Q5B And apart from any items that were required to have a logo, how many of the items (of
uniform) could have an optional logo? ENTER NUMBER OF ITEMS ASK Q6 FOR MAX 4 ITEMS MENTIONED AT Q5 IF MORE THAN 4 ITEMS MENTIONED CATI WILL RANDOMLY SELECT Q6 Thinking of (ITEM) how many of these did you buy for (name) as part of school uniform in
the current school year (2014/15)? Write in___________
Don’t know IF BOUGHT ITEM ASK Q6A Q6A How much did they cost per item?
WRITE IN ______________ - Don’t know MUST USE POUNDS AND PENCE & DECIMALS (00.00) IF PACKS OF ITEMS WERE PURCHASED INTERVIEWER TO PROBE FOR INDIVIDUAL ITEM COST
57

ASK ALL WITH UNIFORM (Q3=1), SR Q6B Has (name) ever been sent home from school because they did not have the right
uniform? Yes 1 No 2 DK 3
ASK ALL, SR Q7 Does (name’s) school require pupils to buy a PE or Games kit?
Yes 1 CONTINUE No 2
GO TO Q10 DK 3
ASK ALL WITH PE/GAMES KIT (Q7=1), MR Q8 I am now going to ask about the kit. Which of the following items does (NAME)’s PE or
Games kit consist of? READ OUT. MULTICODED. Girls Boys
I. Shorts I. Shorts II. T-shirt (used all year round) II. T-shirt (used all year round)
III. Summer PE shirt III. Summer PE shirt IV. Winter PE shirt IV. Winter PE shirt V. Skirt V. Football/rugby shirt VI. Full Tracksuit VI. Full Tracksuit
VII. Plimsolls/trainers VII. Plimsolls/trainers VIII. Jumper/tracksuit top VIII. Jumper/tracksuit top IX. Hockey boots IX. Football/rugby boots X. Swimming Costume X. Swimming Trunks XI. Socks XI. Socks
XII. PE Bag XII. PE Bag XIII. Tracksuit bottoms XIII. Tracksuit bottoms
ASK Q8A AND Q8B IF ANY ITEM MENTIONED AT Q8 Q8A How many of these items were required to have a logo? ENTER NUMBER OF ITEMS Q8B And apart from any items that were required to have a logo, how many of the items (of
sports kit) could have an optional logo? ENTER NUMBER OF ITEMS ASK Q9 FOR MAX 4 ITEMS MENTIONED AT Q8 IF MORE THAN 4 ITEMS MENTIONED CATI WILL RANDOMLY SELECT Q9 And thinking of (ITEM) how many of these did you buy for (name) in the current school
year (2014/15)?
WRITE IN ______________ Don’t know
58

IF BOUGHT ITEM ASK Q9A Q9A How much did they cost per item?
WRITE IN ______________ Don’t know MUST USE POUNDS AND PENCE & DECIMALS (00.00) IF PACKS OF ITEMS WERE PURCHASED INTERVIEWER TO PROBE FOR INDIVIDUAL ITEM COST
ASK ALL WITH UNIFORM / PE KIT (Q3=1 or Q7=1), SR Q10 Thinking about uniform and PE kit as a whole, does either some or all of the uniform have
to be bought from a designated shop/shops or the school itself or can it be bought from any outlet?
PROBE AS APPROPRIATE All has to be bought from designated shop(s) 1 All has to be bought from school 2 Some items have to be bought from designated shop(s), but other items can be bought from anywhere 3
Some items have to be bought from the school itself , but other items can be bought from anywhere 4
Some items have to be bought from the school and some from designated shop(s) 5
All items can be bought from anywhere 6 DK 7
ASK ALL WITH SCHOOL UNIFORM / PE KIT (Q3=1 or Q7=1), SR Q10A How happy are you with the cost of items of school uniform in general for (name)? Are
you…? READ OUT
Very happy 1 Quite happy 2 Not very happy 3 Not at all happy 4 DK / REFUSED 5
ASK ALL WITH SCHOOL UNIFORM / PE KIT (Q3=1 or Q7=1), SR Q10B How would you rate the value for money of items of school uniform in general for (name)?
Do you think it is…? READ OUT
Excellent value for money 1 Good value for money 2 Poor value for money 3 Very poor value for money 4 DK / REFUSED 5
59

ASK ALL WITH SCHOOL UNIFORM / PE KIT (Q3=1 or Q7=1), SR TO EACH OPTION Q10C To what extent do the following factors influence your decisions on where to buy items of
school uniform in general? Please respond on a scale of 1 to 5 where 1 is ‘not at all’ and 5 is ‘a great deal’.
READ OUT 1 – Not
at all 2 3 4 5 – A
great deal
Don’t know
Availability of the uniform you need
1 2 3 4 5 6
Cost of the uniform 1 2 3 4 5 6
Quality of the uniform
1 2 3 4 5 6
ASK ALL WHERE LOGOS REQUIRED / OPTIONAL FOR ANY ITEM(S) OF SCHOOL UNIFORM / PE KIT, SR Q10D Thinking about logos on any items of school uniform and PE kit, were you allowed to
sew/attach these on yourself? PROBE AS APPROPRIATE
Allowed to sew/attach logos on to all items 1 Allowed to sew/attach logos on to some items 2 All items had to be bought with the logo 3 DK 4
ASK ALL WITH SCHOOL UNIFORM / PE KIT (Q3=1 or Q7=1), SR Q11 Do you have the opportunity to buy used school uniforms from the school, or be given
them free of charge by the school? PROBE AS APPROPRIATE
Yes, second-hand uniform can be purchased 1 Yes, second-hand uniform can be given free of charge 2 Yes, both these options are available 3 No, neither of these options are available 4 DK 5
ASK ALL WITH SCHOOL UNIFORM / PE KIT (Q3=1 or Q7=1), SR Q13 Do you receive any financial help or assistance with buying school uniform for (name)? IF YES : WHAT SORT
PROBE FULLY. MULTICODE IF NECESSARY. No financial assistance – I don’t need any 1 No financial assistance – None available 2 Local Authority Grant 3 Charity grant 4 Friends / Family 5 Funds from School 6 OTHER (SPECIFY) _____ 95 DK/REF 97
60

ASK ALL WITH SCHOOL UNIFORM / PE KIT (Q3=1 or Q7=1) Q14A Has (NAME’S) school made any changes to its school uniform at all in the last 3 years ?
IF Q2II>4 If your child has not been in school for 3 years then have changes been made to the uniform during the time they have been there? Yes 1
No 2
Don’t know 3 ASK IF Q14A=1 Q14B How many times has (NAME’s) school changed their school uniform in...?
INSERT NUMBER
DK/REF
i...the last three years IF Q2II>4 (or during the time (CHILD) has been there if less than 3 years)
Ii IF Q14Bi => 1...the last year IF CHANGES MADE AT Q14 ask Q15, IF NONE SKIP TO Q16, SR Q15 What was the nature of each of these changes? ASK FOR EACH CHANGE ABOVE (UP
TO A MAXIMUM OF 3 CHANGES) A major change to the school uniform 1 Small alterations to the school uniform 2 DK/REF 3
ASK ALL WITH SCHOOL UNIFORM / PE KIT (Q3=1 or Q7=1), SR Q16 Have you suffered any financial hardship as a result of purchasing (NAME’s) school
uniform? By financial hardship we mean as a result you could not pay for your accommodation, your bills, buy food or meet other essential costs. Yes 1 No 2 DK/REF 3
ASK ALL, SR Q17 Has the cost of school uniform ever discouraged you from applying to a particular
school? Yes 1 No 2 DK/REF 3
61

DEMOGRAPHICS For classification purposes only I would now like to ask about annual household income. Any information given will be in the strictest confidence. ASK ALL, SR Q18A In which of the following bands does your TOTAL annual household income
fall before tax is deducted? READ OUT. SINGLE CODE. Less than 3000 pounds per year 1 3000 pounds-5,999 pounds per year 2 6,000 pounds - 9,999 pounds per year 3 10,000 pounds - 14,999 pounds per year 4 15,000 pounds - 24,999 pounds per year 5 25,000 pounds - 34,999 pounds per year 6 35,000 - 49,999 pounds per year 7 50,000 or more per year 8 Don’t know 9 Refused 10
ASK ALL, SR Q18B Is (NAME) eligible for free school meals?
Yes 1 No 2 Don’t know 3 Refused 4
ASK ALL, SR Q19A What is your age? WRITE IN___________ Refused ASK IF Q19A=REFUSED Q19B INTERVIEWER TO ASK FOR AGE BAND IF NECESSARY
Under 24 1 25-29 2 30-44 3 45-59 4 60+ 5 Refused 6
62

ASK ALL, SR Q20 Which of the following groups do you belong to?
White British 1 White Irish 2 White, other white background 3 Mixed: White and Black Caribbean 4 Mixed: White and Black African 5 Mixed: White and Asian 6 Mixed: Other mixed background 7 Asian or Asian British: Indian 8 Asian or Asian British: Pakistani 9 Asian or Asian British Bangladeshi 10 Asian or Asian British Other Asian background 11 Black or Black British: Caribbean 12 Black or Black British African 13 Black or Black British: Other black background `4 Any other ethnic group 15 Don’t know 16 Refused 17
ASK ALL, SR Q21 Can I just check your legal marital status? Are you...
READ OUT AND CODE FIRST TO APPLY Single – that is never married, and cohabiting with a partner at the moment
1
Single – that is never married, and not cohabiting with a partner at the moment
2
Married and living with husband or wife 3 Married and separated from husband or wife 4 Divorced 5 Widowed 6 Don’t know 7 Refused 8
ASK ALL Q22 Including (NAME) how many children aged under 18 who live in this household
are financially dependent on you? INSERT NUMBER__________
DON’T KNOW REFUSED
63

ASK ALL, SR Q23 Do you yourself work ... READ OUT LIST Thirty hours or more per week 1 Less than thirty hours per week 2 Are you retired from a full time job 3 Or are you not working for some other reason 4 (DO NOT READ OUT) Refused/not stated 5
INTEVIEWER TO THANK AND CLOSE, REPEAT ASSURANCES
64

Appendix 4: Sample profile A breakdown of the final weighted sample profile of the parents/carers survey is shown below.
Table 17 Phase of school
Phase of school N %
Primary 696 58%
Secondary 504 42% Base: All respondents (1,200)
Source: Survey of parents
Table 18 Type of school
Type of school N %
Academy (including free schools) 443 37%
A different type of state school 737 61%
Don’t know 20 2% Base: All respondents (1,200)
Source: Survey of parents
Table 19 Eligibility for free school meals
Eligibility for free school meals N %
Eligible 380 32%
Not eligible 804 67%
Don’t know/refused 16 1% Base: All respondents (1,200)
Source: Survey of parents
Table 20 Eligibility for free school meals (excluding parents/carers with both a household income of more than £15,000 and a child below Year 3)
Eligibility for free school meals N %
Eligible 238 20%
Not eligible 909 76%
Don’t know/refused 53 4% Base: All respondents (1,200)
Source: Survey of parents
65
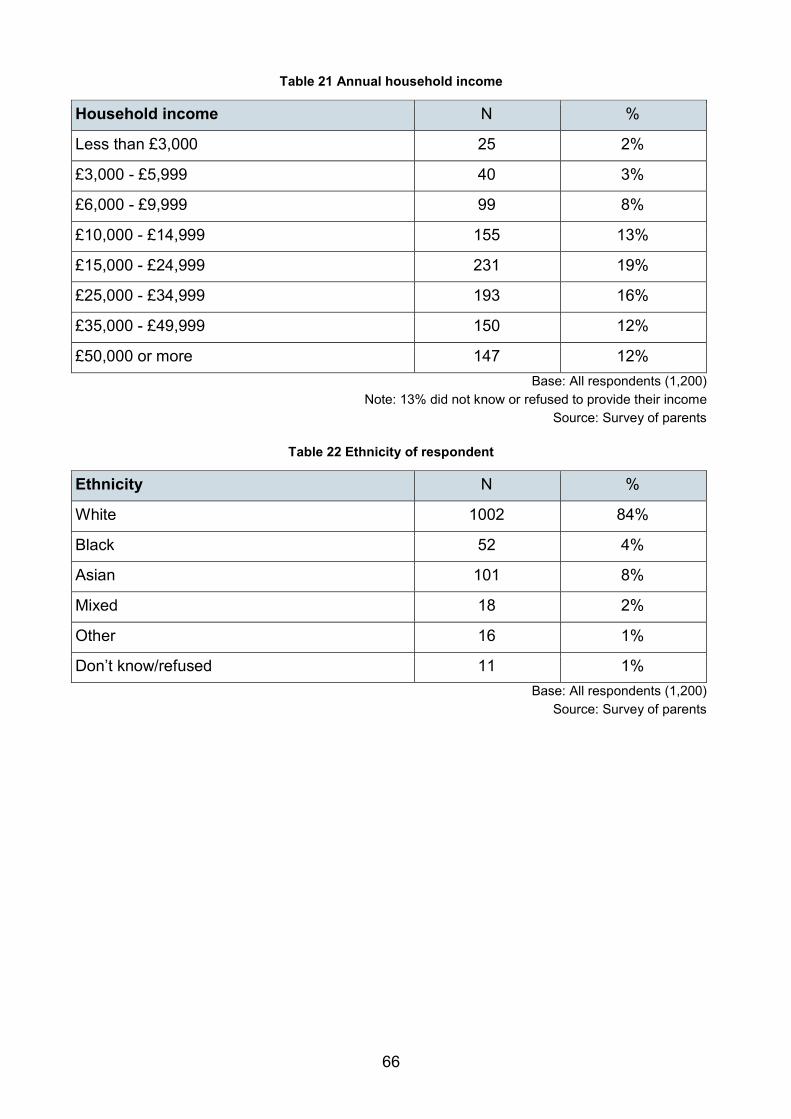
Table 21 Annual household income
Household income N %
Less than £3,000 25 2%
£3,000 - £5,999 40 3%
£6,000 - £9,999 99 8%
£10,000 - £14,999 155 13%
£15,000 - £24,999 231 19%
£25,000 - £34,999 193 16%
£35,000 - £49,999 150 12%
£50,000 or more 147 12% Base: All respondents (1,200)
Note: 13% did not know or refused to provide their income Source: Survey of parents
Table 22 Ethnicity of respondent
Ethnicity N %
White 1002 84%
Black 52 4%
Asian 101 8%
Mixed 18 2%
Other 16 1%
Don’t know/refused 11 1% Base: All respondents (1,200)
Source: Survey of parents
66

Table 23 Region of respondent
Region N %
North West 155 13%
North East 58 5%
Yorkshire and the Humber 132 11%
East Midlands 104 9%
West Midlands 134 11%
East of England 113 9%
London 195 16%
South East 178 15%
South West 130 11% Base: All respondents (1,200)
Source: Survey of parents
67

© Department for Education 2015
Reference: DFE-RR474
ISBN: 978-1-78105-483-3
You may re-use this document/publication (not including logos) free of charge in any format or medium, under the terms of the Open Government Licence v2.0. To view this licence, visit www.nationalarchives.gov.uk/doc/open-government-licence/version/2 or email: [email protected]
Where we have identified any third party copyright information you will need to obtain permission from the copyright holders concerned.
This research was commissioned under the under the 2010 to 2015 Conservative and Liberal Democrat coalition government. As a result the content may not reflect current Government policy.
The views expressed in this report are the authors’ and do not necessarily reflect those of the Department for Education.
Any enquiries regarding this publication should be sent to us at: [email protected] or www.education.gov.uk/contactus
This document is available for download at www.gov.uk/government/publications
68