cost ofcapital estimation - ky public service …bkllawfirm...to the bond if its expected return was...
TRANSCRIPT

Cost of Capital Estimation
The Risk Premium Approach to Measuringa Utility1s Cost of Equity
Eugene F. Brigham, Dilip K. Shome, and Steve R. Vinson
Eugene F. Brigham and Dilip K. Shome are faculty members of theUniversity of Florida and the Virginia Polytechnic Institute and StateUniversity, respectively; Steve R. Vinson is affiliated with AT&TCommunications.
• In the mid-1960s, Myron Gordon and others beganapplying the theory of finance to help estimate utilities'costs of capital. Previously, the standard approach incost of equity studies was the "comparable earningsmethod," which involved selecting a sample of unregulated companies whose investment risk was judged tobe comparable to that of the utility in question, calculating the average return on book equity (ROE) ofthese sample companies, and setting the utility's service rates at a level that would permit the utility toachieve the same ROE as comparable companies. Thisprocedure has now been thoroughly discredited (seeRobichek [15]), and it has been replaced by three market-oriented (as opposed to accounting-oriented) approaches: (i) the DCF method, (ii) the bond-yield-plusrisk-premium method, and (iii) the CAPM, which is aspecific version of the generalized bond-yield-plusrisk-premium approach.
Our purpose in this paper is to discuss the riskpremium approach, including the market risk premiumthat is used in the CAPM. First, we critique the variousprocedures that have been used in the past to estimaterisk premiums. Second, we present some data on esti-
33
mated risk premiums since 1965. Third, we examinethe relationship between equity risk premiums and thelevel of interest rates, because it is important, for purposes of estimating the cost of capital, to know justhow stable the relationship between risk premiums andinterest rates is over time. If stability exists, then onecan estimate the cost of equity at any point in time as afunction of interest rates as reported in The Wall StreetJournal, the Federal Reserve Bulletin, or some similarsource.' Fourth, while we do not discuss the CAPMdirectly, our analysis does have some important implications for selecting a market risk premium for use inthat model. Our focus is on utilities, but the methodology is applicable to the estimation of the cost of
'For example. the Federal Energy Regulatory Commission's Staff recently proposed that a risk premium be estimated every two years andthat. between estimation dates, the last-detennined risk premium beadded to the current yield on ten-year Treasury bonds to obtain anestimate of the cost of equity to an average utility (Docket RM 80-36).Subsequently, the FCC made a similar proposal ("Notice of ProposedRulemaking," August 13, 1984, Docket No. 84-8(0). Obviously, thevalidity of such procedures depends on (i) the accuracy of the riskpremium estimate and (jj) the stability of the relationship between riskpremiums and interest rates. Both proposals are still under review.
Workpaper No. 4561
FINANCIAL MANAGEMENT/SPRING 1985
equity for any publicly traded firm, and also for nontraded firms for which an appropriate risk class can beassessed, including divisions of publicly traded corporations. 2
Historic Risk PremiumsA number of researchers, most notably Ibbotson and
Sinquefield [121. have calculated historic holding period returns on different securities and then estimatedrisk premiums as follows:
Alternative Procedures for EstimatingRisk Premiums
In a review of both rate cases and the academicliterature, we have identified three basic methods forestimating equity risk premiums: (i) the ex post, orhistoric, yield spread method; (ii) the survey method;and (iii) an ex ante yield spread method based on DCFanalysis. 3 In this section, we briefly review these threemethods.
HistoricRiskPremium
Average of the )annual returns ona stock index for
a particularpast period
Average of theannual returns ona bond index for
the samepast period
(I)
mate of its cost of equity, and (ii) indirectly, whereI&S data are used to estimate the market risk premiumin CAPM studies.
There are both conceptual and measurement problems with using I&S data for purposes of estimatingthe cost of capital. Conceptually, there is no compelling reason to think that investors expect the samerelative returns that were earned in the past. Indeed,evidence presented in the following sections indicatesthat relative expected returns should, and do, varysignificantly over time. Empirically, the measured historic premium is sensitive both to the choice of estimation horizon and to the end points. These choices areessentially arbitrary, yet they can result in significantdifferences in the final outcome. These measurementproblems are common to most forecasts based on timeseries data,
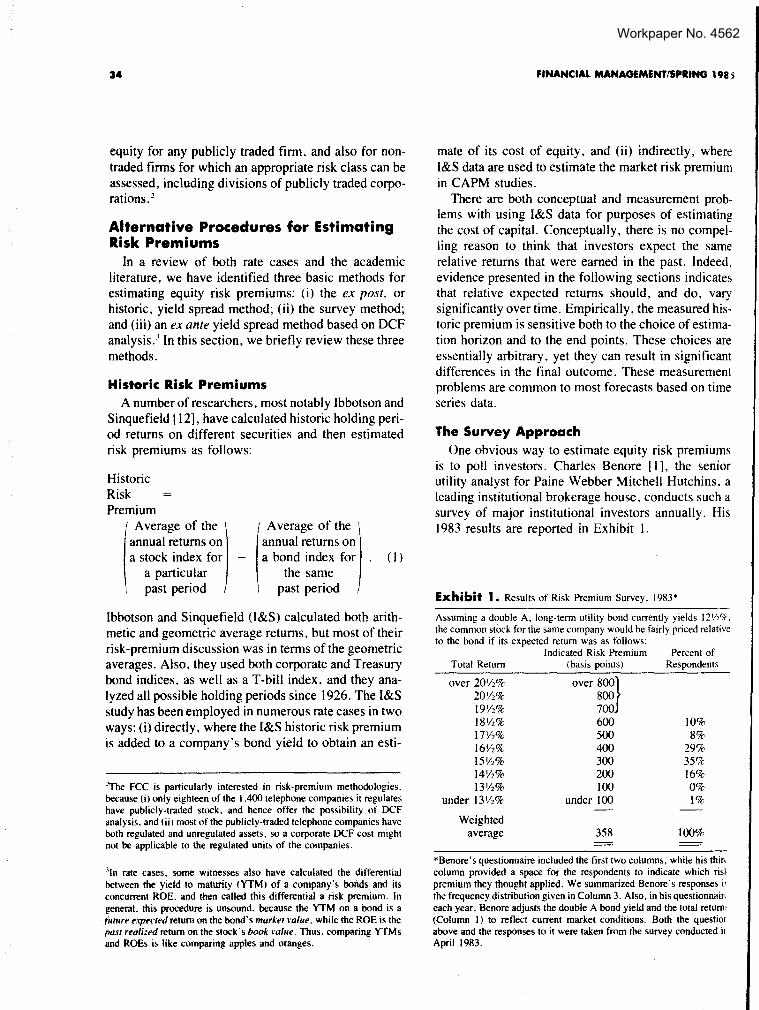
The Survey ApproachOne obvious way to estimate equity risk premiums
is to poll investors, Charles Benore [1], the seniorutility analyst for Paine Webber Mitchell Hutchins, aleading institutional brokerage house, conducts such asurvey of major institutional investors annually, His1983 results are reported in Exhibit 1.
Exhibit 1. Results of Risk Premium Survey, 1983*
10%8%
29%35%16%0%1%
100%
Percent ofRespondents
358
over 8oo}800700600500400300200100
under 100
Total Return
over 20'/2%20'/2%19Y2%18\12%17Y2%16Y2%15'/2%14Y2%13Y2%
under 13'/2%
Weightedaverage
Assuming a double A, long-term utility bond currently yields 12W7c,the common stock for the same company would be fairly priced relativeto the bond if its expected return was as follows:
Indicated Risk Premium(basis points)
"The FCC is particularly interested in risk-premium methodologies.because ti) only eighteen of the 1.400 telephone companies it regulateshave publicly-traded stock. and hence offer the possibility of DCFanalysis. and (ii) most of the publicly-traded telephone companies haveboth regulated and unregulated assets, so a corporate DCF cost mightnot be applicable to the regulated units of the companies.
Ibbotson and Sinquefield (I&S) calculated both arithmetic and geometric average returns, but most of theirrisk-premium discussion was in terms of the geometricaverages. Also, they used both corporate and Treasurybond indices, as well as a T-bill index, and they analyzed all possible holding periods since 1926. The I&Sstudy has been employed in numerous rate cases in twoways: (i) directly, where the I&S historic risk premiumis added to a company's bond yield to obtain an esti-
-'In rate cases. some witnesses also have calculated the differentialbetween the yield to maturity (YTM) of a company's bonds and itsconcurrent ROE. and then called this differential a risk premium. Ingeneral. this procedure is unsound, because the YTM on a bond is a(u/llre expected return on the bond's market \'a/ue, while the ROE is thepast realized return on the stock's book m/ue. Thus, comparing YTMsand ROEs is like comparing apples and oranges.
*Benore's questionnaire included the first two columns, while his thincolumn provided a space for the respondents to indicate which rislpremium they thought applied, We summarized Benore's responses ilthe frequency distribution given in Column 3. Also, in his questionnaineach year, Benore adjusts the double A bond yield and the total return'(Column I) to reflect current market conditions. Both the questio,above and the responses to it were taken from the survey conducted itApril 1983.
Workpaper No. 4562

BRIGHAM, SHOME, VINSON/COST Of EQUITY MEASUREMENT
Benore's results, as measured by the average riskpremiums, have varied over the years as follows:
Average RPYear (basis points)1978 4911979 4751980 4231981 3491982 2751983 358
The survey approach is conceptually sound in that itattempts to measure investors' expectations regardingrisk premiums, and the Benore data also seem to becarefully collected and processed. Therefore, the Benore studies do provide one useful basis for estimatingrisk premiums. However, as with most survey results,the possibility of biased responses and/or biased sampling always exists. For example, if the respondinginstitutions are owners of utility stocks (and many ofthem are), and if the respondents think that the surveyresults might be used in a rate case, then they mightbias upward their responses to help utilities obtainhigher authorized returns. Also, Benore surveys largeinstitutional investors, whereas a high percentage ofutility stocks are owned by individuals rather than institutions, so there is a question as to whether hisreported risk premiums are really based on the expectations of the "representative" investor. Finally, from apragmatic standpoint, there is a question as to how touse the Benore data for utilities that are not rated AA.The Benore premiums can be applied as an add-on tothe own-company bond yields of any given utility onlyif it can be assumed that the premiums are constantacross bond rating classes. A priori, there is no reasonto believe that the premiums will be constant.
DCF·Based Ex Ante Risk PremiumsIn a number of studies, the DCF model has been
used to estimate the ex ante market risk premium,RPM' Here, one estimates the average expected futurereturn on equity for a group of stocks, kM, and thensubtracts the concurrent risk-free rate, RF , as proxiedby the yield to maturity on either corporate or Treasurysecurities:4
(2)
Conceptually, this procedure is exactly like the I&Sapproach except that one makes direct estimates offuture expected returns on stocks and bonds rather than
3S
assuming that investors expect future returns to mirrorpast returns.
The most difficult task, ofcourse, is to obtain a validestimate of kM, the expected rate of return on the market. Several studies have attempted to estimate DCFrisk premiums for the utility industry and for otherstock market indices. Two of these are summarizednext.
Vandell and Kester. In a recently publishedmonograph, Vandell and Kester 118] estimated ex anterisk premiums for the period from 1944 to 1978. RF
was measured both by the yield on 90-day T-bills andby the yield on the Standard and Poor's AA UtilityBond Index. They measured kMas the average expected return on the S&P's 500 Index, with the expectedreturn on individual securities estimated as follows:
(3)
where,
D1 dividend per share expected over the nexttwelve months,
Po current stock price,g estimated long-term constant growth rate,
andthe i1h stock.
To estimate gj' Vandell and Kester developed fifteenforecasting models based on both exponential smoothing and trend-line forecasts of earnings and dividends,and they used historic data over several estimatinghorizons. Vandell and Kester themselves acknowledgethat, like the Ibbotson-Sinquefield premiums, theiranalysis is subject to potential errors associated withtrying to estimate expected future growth purely frompast data. We shall have more to say about this pointlater.
41n this analysis. most people have used yields on long-term bondsrather than short-term money market instruments. It is recognized thatlong-term bonds. even Treasury bonds, are not risk free. so an RPMbased on these debt instruments is smaller than it would be if there weresome better proxy to the long-term riskless rate. People have attemptedto use the T-bill rate for RF, but the T-bill rate embodies a differentaverage inflation premium than stocks, and it is sullject to randomfluctuations caused by monetary policy. international currency flows.and other factors. Thus, many people believe that for cost of capitalpurposes, RF should be based on long-term securities.
We did test to see how debt maturities would affect our calculated riskpremiums. If a shoo-term rate such as the 3O-day T-bill rate is used,measured risk premiums jump around widely and, so far as we couldtell. randomly. The choice of a maturity in the IO-to 3O-year range haslittle effect. as the yield curve is generally fairly flat in that range.
Workpaper No. 4563

Malkiel. Malkiel [14] estimated equity risk premiums for the Dow Jones Industrials using the DCF model. Recognizing that the constant dividend growth assumption may not be valid, Malkiel used a nonconstantversion of the DCF model. Also, rather than rely exclusively on historic data, he based his growth rates onValue Line's five-year earnings growth forecasts plusthe assumption that each company's growth ratewould, after an initial five-year period, move toward along-run real national growth rate of four percent. Healso used ten-year maturity government bonds as aproxy for the riskless rate. Malkiel reported that hetested the sensitivity of his results against a number ofdifferent types of growth rates, but, in his words, "Theresults are remarkably robust, and the estimated riskpremiums are all very similar." Malkiel's is, to the bestof our knowledge, the first risk-premium study thatuses analysts' forecasts. A discussion of analysts' forecasts follows.
Security Analysts' Growth ForecastsEx ante DCF risk premium estimates can be based
either on expected growth rates developed from timeseries data, such as VandeII and Kester used, or onanalysts' forecasts, such as Malkiel used. Althoughthere is nothing inherently wrong with time seriesbased growth rates, an increasing body of evidencesuggests that primary reliance should be placed onanalysts' growth rates. First, we note that the observedmarket price of a stock reflects the consensus view ofinvestors regarding its future growth. Second, weknow that most large brokerage houses, the larger institutional investors, and many investment advisoryorganizations employ security analysts who forecastfuture EPS and DPS, and, to the extent that investorsrely on analysts' forecasts, the consensus of analysts'forecasts is embodied in market prices. Third, therehave been literally dozens of academic research papersdealing with the accuracy of analysts' forecasts, aswell as with the extent to which investors actually usethem. For example, Cragg and Malkiel [7] and Brownand Rozeff {5] determined that security analysts' forecasts are more relevant in valuing common stocks andestimating the cost of capital than are forecasts basedsolely on hi~toric time series. Stanley, Lewellen, andSchlarbaum [16] and Linke [13] investigated the importance of analysts' forecasts and recommendationsto the investment decisions of individual and institutional investors. Both studies indicate that investorsrely heavily on analysts' reports and incorporate analysts' forecast information in the formation of their
fiNANCIAL MANAGEMENT/SPRING 198
expectations about stock returns. A representative listing of other work supporting the use of analysts' forecasts is included in the References section. Thus, evidence in the current literature indicates that (i)analysts' forecasts are superior to forecasts based solelyon time series data, and (ii) investors do rely onanalysts' forecasts. Accordingly, we based our cost ofequity, and hence risk premium estimates, on analysts'forecast data. 5
Risk Premium EstimatesFor purposes of estimating the cost of capital using
the risk premium approach, it is necessary either thatthe risk premiums be time-invariant or that there existsa predictable relationship between risk premiums andinterest rates. If the premiums are constant over time,then the constant premium could be added to the prevailing interest rate. Alternatively, if there exists astable relationship between risk premiums and interestrates, it could be used to predict the risk premium fromthe prevailing interest rate.
To test for stability, we obviously need to calculaterisk premiums over a fairly long period of time. Priorto 1980, the only consistent set of data we could findcame from Value Line, and, because of the work involved, we could develop risk premiums only once ayear (on January 1). Beginning in 1980, however, webegan collecting and analyzing Value Line data on amonthly basis, and in 1981 we added monthly estimates from Merrill Lynch and Salomon Brothers to ourdata base. Finally, in mid-1983, we expanded ouranalysis to include the IBES data.
Annual Data and Results, 1966-1984Over the period 1966-1984, we used Value Line
data to estimate risk premiums both for the electricutility industry and for industrial companies, using thecompanies included in the Dow Jones Industrial andUtility averages as representative of the two groups.Value Line makes a five-year growth rate forecast, butit also gives data from which one can develop a longerterm forecast. Since DCF theory calls for a truly longteTIl\ (infinite horizon) growth rate, we concluded thatit was better to develop and use such a forecast than to
SRecently, a new type of service that summarizes the key data from mostanatysts' reports has become available. We are aware of two sources ofsuch services, the Lynch, Jones, and Ryan's Institutional Brokers Estimate System (IBES) and Zack's Icarus Investment Service. IBES andthe Icarus Service gather data from both buy-side and sell-side analystsand provide it to subscribers on a monthly basis in both a printed and acomputer-readable format.
Workpaper No. 4564

ilRIGHAM, SHOME, VINSON/COST Of EQUITY MEASUREMENT 37
Exhibit 2. Estimated Annual Risk Premiums, Nonconstant (Value Line) Model,1966-1984
January Iof the
Dow Jones Electrics Dow Jones IndustrialsYearReported kAvg RF RP kAvg RF RP (3)7(6)
(I) (2) (3) (4) (5) (6) (7)1966 8.11% 4.50% 3.61% 9.560/, 4.50'7, 5.06% 0.711967 9.00% 4.76% 4.24% 11.57% 4.76% 6.81% 0.621968 9.68% 5.59% 4.09% 10.56% 5.59% 4.97'7, 0.821969 9.34% 5.88% 3.46% 10.96% 5.88% 5.08% 0.681970 11.04% 6.91% 4.13% 12.22% 6.91% 5.31% 0.781971 10.80% 6.28% 4.52% 11.23% 6.28% 4.95'1{ 0.911972 10.53% 6.00% 4.53% 11.09% 6.00% 5.09% 0.891973 11.37% 5.96% 5.41% 11.47% 5.96% 5.519c 0.981974 13.85% 7.29% 6.56% 12.38% 7.290/, 5.09% 1.291975 16.63% 7.91% 8.72% 14.83'1{ 7.91'1c 6.92% 1.261976 13.97% 8.23% 5.74% 13.32% 8.23% 5.09'k 1.131977 12.96% 7.30% 5.66% 13.630/, 7.30'k 6.33% 0.891978 13.42% 7.87% 5.55% 14.75% 7.87% 6.88% 0.811979 14.92% 8.990/, 5.93% 15.50% 8.99% 6.51% 0.911980 16.39% 10.18% 6.21% 16.53% 10.18'7, 6.35% 0.981981 17.61% 11.99% 5.62% 17.37% 11.99% 5.38% 1,()41982 17.70% 14.00% 3.70% 19.30% 14.00% 5.30% 0.701983 16.30% 10.66% 5.64% 16.53% 10.66'7, 5.87% 0.961984 16.03% 11.97% 4.06% 15.72% 11.97% 3.75% 1.08
use the five-year prediction. 6 Therefore, we obtaineddata as of January 1 from Value Line for each of theDow Jones companies and then solved for k, the expected rate of return, in the following equation:
p = i D, + (DnO + gn»)( I)n (4)U t = 10 + k)' k - gn 1 + k .
Equation (4) is the standard nonconstant growth DCFmodel; Po is the current stock price; D, represents theforecasted dividends during the nonconstant growthperiod; n is the years of nonconstant growth; Dnis thefirst constant growth dividend; and gn is the constant,long-run growth rate after year n. Value Line providesD, values for t = 1 and t = 4, and we interpolated toobtain 02 and 03' Value Line also gives estimates for
"This is a debatable point. Cragg and Malkiel, as well as many practicing analysts, feel that most investors actually focus on five-year forecasts. Others, however, argue that five-year forecasts are too heavilyinfluenced by base-year conditions and/or other nonpermanent conditions for use in the DCF model. We note (i) that most published forecasts do indeed cover five years, (ii) that such forecasts are typically"normalized" in some fashion to alleviate the base-year problem. andiii) that for relatively stable companies like those in the Dow Jones
averages, it generally does not matter greatly if one uses a normalizedfive-year or a longer-term forecast. because these companies meet theConditions of the constant-growth DCF model rather well.
ROE and for the retention rate (b) in the terminal year,n, so we can forecast the long-term growth rate as gn =b(ROE). With all the values in Equation (4) specifiedexcept k, we can solve for k, which is the OCF rate ofreturn that would result if the Value Line forecastswere met, and, hence, the DCF rate of return impliedin the Value Line forecast. 7
Having estimated a k value for each of the electricand industrial companies, we averaged them (usingmarket-value weights) to obtain a k value for eachgroup, after which we subtracted RF (taken as the December 31 yield on twenty-year constant maturityTreasury bonds) to obtain the estimated risk premiumsshown in Exhibit 2. The premiums for the electrics areplotted in Exhibit 3, along with interest rates. Thefollowing points are worthy of note:
I. Risk premiums fluctuate over time, As we shall seein the next section, fluctuations are even widerwhen measured on a monthly basis.
2. The last column of Exhibit 2 shows that risk premi-
'Value Line actually makes an explicit price forecast for each stock. andone could use this price, along with the forecasted dividends, to developan expected rate of return. However, Value Line's forecasted stockprice builds in a forecasted change in k. 11terefore, the forecasted priceis inappropriate for use in estimating current values of k.
Workpaper No. 4565

31 FINANCIAL MANAGEMENT/SPRING 1985
Exhibit 3. Equity Risk Premiums for Electric Utilities and Yields on 20-Year Government Bonds, 1970-1984*Risk Premiums
and Interest Rates%
10.0
5.0
RP = 6.40% - O.llRF
: 1970-1984
(0.14)
l = 0.04
II
II
~
I IIYield on 20-year I IGovernment bond. '
RF \"f,," I
, I"" I... r
............ II
\\\
\ /e
\ "\ ,,"'t
RP = 0.96% + 0.65RF
: 1970-1979
(0.40)
r 2 = 0.25
RP = 12.49% - O. 63RF: 1980-1984(0.22)
r 2 =0.74
L..-_+--+--~-l---~-I---l---I---l---I---I---l---I---t-
1970 1984
'Standard errors of the coefficients are shown in parentheses below the coefficients.
urns for the utilities increased relative to those forthe industrials from the mid-1960s to the mid1970s. Subsequently, the perceived riskiness of thetwo groups has, on average, been about the same.
3. Exhibit 3 shows that, from 1970 through 1979,utility risk premiums tended to have a positive association with interest rates: when interest rates rose,so did risk premiums. and vice versa. However,beginning in 1980. an inverse relationship appeared: rising interest rates led to declining riskpremiums. We shall discuss this situation further inthe next section.
Monthly Data and Results, 1980-1984In early 1980, we began calculating risk premiums
on a monthly basis. At that time, our only source ofanalysts' forecasts was Value Line. but beginning in1981 we also obtained Merrill Lynch and SalomonBrothers' data, and then. in mid-1983. we obtained
IBES data. Because our focus was on utilities. werestricted our monthly analysis to that group.
Our 1980-1984 monthly risk premium data, alongwith Treasury bond yields, are shown in Exhibits 4 and5 and plotted in Exhibits 6, 7, and 8. Here are somecomments on these Exhibits:
I. Risk premiums, like interest rates and stock prices,are volatile. Our data indicate that it would not beappropriate to estimate the cost of equity by addingthe current cost of debt to a risk premium that hadbeen estimated in the past. Current risk premiumsshould be matched with current interest rates.
2. Exhibit 6 confirms the 1980-1984 section of Exhibit 3 in that it shows a strong inverse relationshipbetween interest rates and risk premiums; we shalldiscuss shortly why this relationship holds.
3. Exhibit 7 shows that while risk premiums based onValue Line. Merrill Lynch. and Salomon Brothers
Workpaper No. 4566

iJllGHAM, SHOME, VINSON/COST OF EQUITY MEASUREMENT 39
Exhibit 4. Estimated Monthly Risk Premiums for Electric Utilities Using Analysts' Growth Forecasts. JanuaryI980-June 1984
20·Year 20. YearTreasury Treasury
Bond BondYield. Yield.
Constant ConstantBeginning Value Merrill Salomon Average Maturity Beginning Value Merrill Salomon Average Maturityof Month Line Lynch Brothers Premiums Series of Month Line Lyndl Bmthers Premiums Series
Jan 1980 6.21'K NA NA 6.21'k 10.18'K Apr 1982 3.49'K 3.61 'k 4.29'1( 3.80'k 13.69'KFeb 1980 5.77'1r NA NA 5.77'k 10.86'i( May 1982 3.08'iC 4.25'1c 3.91'i( 3.75';( 13.47'i(Mar 1980 4.73'K NA NA 4.73'k 12.59'i( Jun 1982 3.16'i( 4.51'1< 4.n'k 4.13'k 13.53';(Apr 1980 5.02'1r NA NA 5.02'k 12.71'k Jul 1982 2.57'k 4.21<'k 4.21 'k 3.66'k 14.48<'kMay 1980 4.73'« NA NA 4.73';( 11'()4Ck Aug 1982 4.33'k 4.R3<'k 5.27<'k 4.81 '7, 13.69';(Jun 1980 5.09'K NA NA 5.09'K 10.37'k Sep 1982 4.08'if 5. I4 'if 5.58<'k 4.93'k 12.40'ifJul 1980 5.41'K NA NA 5.41 'if 9. 86'if Oct 1982 5.35'7c 5.24'1( 6.34<'k 5.64'k 11.95'ifAug 19RO 5.n';.0 NA NA 5.n'7c IO.29Ck Nov 1982 5.67'7c 5.95'i( 6.91'k 6.18'7c 1O.97<'kSep 1980 5.16';.0 NA NA 5.16<'k 11.41<'k Dec 1982 6.31'7c 6.71'7c 7.45'7c 6.82'k 10.52'kOct 1980 5.62'7c NA NA 5.62'k 11.75<'k
Annual Avg. 4.0()'if 4.54Ck 5.0 I '7c 4.52'7c 13 .(l9'ifNov 1980 5.09'1( NA NA 5.09'k 12.33'7cDec 1980 5.65<'k NA NA 5.65';.0 12.37'k Jan 1983 5. 64'if 6.04'k 6.81'7c 6.16% 10.66 'if
Annual Avg. 5.35<'k 5.35'k IUl'kFeb 1983 4.61Vk 5.99<'k 6.10% 5.59'k II.<WifMar 1983 4.99'if 6.89'1( 6.43'« 6.10'1( 10.71<;f
Jan 1981 5.62'7<, 4.76Ck 5.63'K 5.34'k 11.99'k Apr 1983 4.75'i( 5.82'7c 6.31<'k 5.63<'k 10.84'1(Feb 1981 4.R2'K 4.87<'k 5.16'k 4.95'7c 12.48'k May 1983 4.50'k 6.41'k 6.24'7c 5.n'7c HUNMar 1981 4.70'7c 3.73'« 4.97'7c 4.47'k 13.IO'k Jun 1983 4.29'k 5.21 'k 6.16'k 5.22'k 1O.9O'7cApr 1981 4.24<';.0 3.23Ck 4.52Ck 4.00'k 13.II'k Jul 1983 4. 78'ii 5.72'7c 6.42<'k 5.64'k 11.12'7cMay 1981 3.54'K 3.24'7c 4.24'7c 3.67<'k 13.51 'k Aug 1983 3.89'if 4.74'k 5.41'1( 4.68'k 11.78'kJun 1981 3.57'K 4.04'k 4.27'1( 3.96'7c 13.39'1( Sep 1983 4.07'7c 4.90'7c 5.57'k 4.85'7c II.7ICkJut 1981 3.61'7c 3.63'!c 4.16'7c 3.80'k 13.32'k Oct 1983 3.79'k 4.64'k 5.38'7c 4.60Ck 11.64'kAug 1981 3.17% 3.05% 3.04'k 3.09'if 14.23'k Nov 1983 2.R4'k 3.77'k 4.46<'k 3.69'« 11.90'kSep 1981 2.II'k 2.24'7, 2.35'1( 2.2Yk 14.99'k Dec 1983 3.36'k 4.17'k 5.00'k 4.21'k 11.83ckOct 1981 2.83'K 2.64'k 3.24'k 2.90'k 14.93'!c
Annual Avg. 4.30'k 5.37'if 5.86'k 5.17'K 11.22'kNov 1981 2.08'K 2.49'7c 3.03'k 2.53'k 15.27'kDec 1981 3.72'K 3.45'7c 4.24'k 3.80'k 13.I2'k Jan 1984 4.06'7c 5.04'k 5.65'1( 4.92'k 11.97<'k
Annual Avg. 3.67% 3.45'7<, 4.07'7, 3.73'« 13.62'7cFeb 1984 4.25'7c 5.37<'k 5.96<'k 5.19'7, 11.76%Mar 1984 4.73'k 6.05<'k 6.38'k 5.n'k 12.12ck
Jan 19R2 3.70'k 3.37'k 4.04<'k 3.70'k 14.00'k Apr 1984 4.78'« 5.33'if 6.32'k 5.48% 12.51 'HFeb 1982 3.05'k 3.37o/c 3.70'k 3.37<'k 14.37'if May 1984 4.36'k 5.30Ck 6.42'if 5.36'k 12.78'kMar 1982 3.15'k 3.28'k 3.75'k 3.39o/c 13.9h'k Jun 1984 3. 54'if 4.00o/c 5.63'« 4.39'k 13.60'k
Exhibit 5. Monthly Risk Premiums Based on IBES Data
Average ofMerrill Lynch.
SalomonBrothers. andValue Line IBES IBES Premiums
Beginning Premiums Premiums for Entire Beginningof for Dow Jones for Dow Jones Electric of
Month Electrics Electrics Industry Month
Aug 1983 4.68% 4.10% 4.16o/c Feb 1984Sep 1983 4.85'K 4.4.3% 4.27% Mar 1984Oct 1983 4.60'K 4.31% 3.90% Apr 1984Nov 1983 3.69% 3.36% 3.36% May 1984Dec 1983 4.21% 3.86'K 3.54% Jun 1984Jan 1984 4.92% 4.68% 4.18% Average
Premiums
Average ofMerrill Lynch.
SalomonBrothers. andValue LinePremiums
fill' Dow JonesElectrics
5.19<'k5.nck5.48'k5. 36<'k4.39'k
4.83<';.0
IBESPremiums
fill' Dow JonesElectrics
5.00'k5.35'k5.33'7<,5.26'1<4.47'«
4.56%
IRES Prcmiurmfor EntireElectricIndustry
4. 36'if4.45'k4.23'if4.30<'k3.40'if
4.01'k
Workpaper No. 4567

40
Exhibit 6. Utility Risk Premiums and Interest Rates, 1980-1984s
15
10
FINANCIAL MANAGIMENTISPRING 1985
/20-year T-bond yields
Note: The standard error of thecoefflcient is shown inparentheses below thecoefficient.
RP = 12.53% - 0.63 RFStandard Error (0.05)
R2 = 0.73
o LI-I-f--I-I-I-+-l-+-I---l--I~JF~1A~1JJA SOtlDJ F
1980 1981
I I I I l--+-+--i-I---+--t------j---l--l---l-I---l--l_l~-+-...j-I_l_j_+__t_l_+__T_I I I I I---l~.-+
1>1 A M J J A SON 0 J F t·1 A M J J A SON 0 J F ~1 A M J J A SON 0 J F MAil J1982 1983 1984
.---. Value line Premiums--- Merrill Lynch PremtUlls.--. SllOl1lOn Brothers PremiumsIJr--6 AverAge Pr..tulls
Exhibit 7. Monthly Risk Premiums, Electric Utilities, 1981-1984 (to Date)Risk
Prlllt...(S)
8.01.81.61.47.27.06.86.66.46.26.05.85.65.45.2S.O4.84.64.44.24.03.83.63.43.23.02.82.62.42.22.01.81.61.41.21.00.80.60.40.2
O.0 J~"'f---:M,...-.A,....-""M--:J,.-J.,--"'A.....,S,....,O,...-"".--::O"--J""'-"::"f--::M:--A""'-7.M--:J"--J""'-7A--=s--:o=-"".--=D"-J""'-"::"f-::."-A=-"'"M--:J--:J""'-7A--=S"--O:C--7.H--:D,....--r--r-'M:r-'--7.M--;J-m~m~~u~~~U~~~~~~~~~~~~~~~~~ro~~~~ro~~~MMMMMM
Workpaper No. 4568

BRIGHAM, SHOME, VINSON/COST OF EQUITY MEASUREMENT
Exhibit 8. Comparative Risk Premium Data
10
41
Jones Utility Index all have large nuclear investments, and this may cause them to be regarded asriskier than the industry average, which includesboth nuclear and non-nuclear companies.
Tests of the Reasonableness of the RiskPremium Estimates
So far our claims to the reasonableness of our riskpremium estimates have been based on the reasonableness of our variable measures, particularly the measures of expected dividend growth rates. Essentially,we have argued that since there is strong evidence inthe literature in support of analysts' forecasts, riskpremiums based on these forecasts are reasonable. Inthe spirit of positive economics. however. it is alsoimportant to demonstrate the reasonableness of ourresults more direct!y.
It is theoretically possible to test for the validity ofthe risk-premium estimates in a CAPM framework. Ina cross-sectional estimate of the CAPM equation,
I I
Aug Sep Oct Nov Dec Jan Feb Mar Apr May Jun1983 1984 (5)
.: Value Line, r·1L, SB: Dow Jones Electrics
.: lBES: Dow Jones Electrics": lBES: All Electric Utilities
do differ, the differences are not large given thenature of the estimates, and the premiums followone another closely over time. Since all of the analysts are examining essentially the same data andsince utility companies are not competitive withone another, and hence have relatively few secrets,the similarity among the analysts' forecasts is notsurprising.
4. The IBES data, presented in Exhibit 5 and plottedin Exhibit 8, contain too few observations to enableus to draw strong conclusions, but (i) the DowJones Electrics risk premiums based on our threeanalyst data have averaged 27 basis points abovepremiums based on the larger group of analystssurveyed by IBES and (ii) the premiums on the IIDow Jones Electrics have averaged 54 basis pointshigher than premiums for the entire utility industryfollowed by IBES. Given the variability in the data,we are, at this point, inclined to attribute thesedifferences to random fluctuations, but as moredata become available, it may tum out that thedifferences are statistically significant. In particular, the II electric utilities included in the Dow
we would expect
ao = 0 and al = kM - Rr = Market risk premium.
This test, of course, would be a joint test of both theCAPM and the reasonableness of our risk-premiumestimates. There is a great deal of evidence that questions the empirical validity of the CAPM, especiallywhen applied to regulated utilities. Under these conditions, it is obvious that no unambiguous conclusioncan be drawn regarding the efficacy of the premiumestimates from such a test. K
A simpler and less ambiguous test is to show that therisk premiums are higher for lower rated firms than forhigher rated firms. Using 1984 data. we classified the
"We carried out the test on a monthly basis for 1984 and found positivebut statistically insignificant coefficients. A typical result (for April1984) follows:
(k - Rr ); = 3.1675 + 1.8031 13;·(0.91) (144)
The figures in parentheses are standard errors. Utility risk premiums doincrease with betas. but the intercept term is not zero as the CAPMwould predict. and ct, is both less than the predicted value and notstatistically significant. Again. the observation that the coefficients donot conform to CAPM predictions could be as much a problem withCAPM specification for utilities as with the risk premium estimates.
A similar test was carried out by Friend. Westerfield. and Granito 19J.They tested the CAPM using expectational (survey) data rather than expost holding period returns. They actually found their coefficient of f3;to be negative in all their cross-sectional tests.
Workpaper No. 4569

42 FINANCIAL MANAGEMENT/SPRING 1985
Exhibit 9. Relationship between Risk Premiums and Bond Ratings, 1984*
Belo\\Month Aaa/AA AA Aa/A A A!BBB BBB BBB
Januaryt 2.6I',i( 3.06',i( 3.70'1, 5.07'';; 4.90',i( 9.45'';;February 2.9R'';; 3.17'';; 3. 36',i( 4.03'k 5. 26',i( 5.14<';; 7.97'';;Mareh 2.34'k 3.46<';; 3. 29',i( 4.06'';; 5.43',i( 5.02'1c R.2R'';;April 2.37'k .H)3'1c 3.29Cif 3.RS'ii 5.29'';; 4.97'k 6.96<';;May 2.()O'';; 2.48'1c 3.42'';; 3.72',i( 4.72'1c 6.64Cfc 8.81'1cJune 0.72'k 2.17',i( 2.46',i( 3.16'k 3.76'1c 5.00'';; 5.58',i(
Average 2.08'';; l.R2'';; 3.15'';; 3.76Cfc 4.92'';; 5.28Cfc 7.R4',i(
"The risk premiums are based on IBES data for the e1eetric utilities followed by botb IBES and Salomon Brothers.The Ilumber of electric utilities followed by both finns varies from 1110nth to 1110nth. For the period betweellJanuary and June 19H4. the number of electries followed by both firms ranged from 96 to 99 utilities.';'In January. there were no Aaa/AA companies. Subsequently. four utilities were upgraded to Aaa! AA.
utility industry into risk groups based on bond ratings.For each rating group, we estimated the average riskpremium. The results, presented in Exhibit 9, clearlyshow that the lower the bond rating, the higher the riskpremiums. Our premium estimates therefore wouldappear to pass this simple test of reasonableness.
Risk Premiums and Interest RatesTraditionally, stocks have been regarded as being
riskier than bonds because bondholders have a priorclaim on earnings and assets. That is, stockholdersstand at the end of the line and receive income and/orassets only after the claims of bondholders have beensatisfied. However, if interest rates fluctuate, then theholders of long-term bonds can suffer losses (eitherrealized or in an opportunity cost sense) even thoughthey receive all contractually due payments. Therefore, if investors' worries about "interest rate risk"versus "earning power risk" vary over time, then perceived risk differentials between stocks and bonds, andhence risk premiums, will also vary.
Any number of events could occur to cause the perceived riskiness of stocks versus bonds to change, butprobably the most pervasive factor, over the 19661984 period, is related to inflation. Inflationary expectations are, of course, reflected in interest rates. Therefore, one might expect to find a relationship betweenrisk premiums and interest rates. As we noted in ourdiscussion of Exhibit 3, risk premiums were positivelycorrelated with interest rates from 1966 through 1979,but, beginning in 1980, the relationship turned negative. A possible explanation for this change is givennext.
1966-1979 Period. During this period, inflationheated up, fuel prices soared, environmental problems
surfaced, and demand for electricity slowed even asexpensive new generating units were nearing completion. These cost increases required offsetting rate hikesto maintain profit levels. However. political pressure.combined with administrative procedures that were notdesigned to deal with a volatile economic environment, led to long periods of "regulatory lag" thatcaused utilities' earned ROEs to decline in absoluteterms and to fall far below the cost of equity. Thesefactors combined to cause utility stockholders to experience huge losses: S&P's Electric Index dropped froma Il}id-1960s high of 60.90 to a mid-1970s low of20.41, a decrease of 66.5%. Industrial stocks also suffered losses during this period, but, on average, theywere only one third as severe as the utilities' losses.Similarly, investors in long-term bonds had losses, butbond losses were less than half those of utility stocks.Note also that, during this period, (i) bond investorswere able to reinvest coupons and maturity paymentsat rising rates, whereas the earned returns on equity didnot rise, and (ii) utilities were providing a rising shareof their operating income to debtholders versus stockholders (interest expense/book value of debt was rising, while net income/common equity was declining).This led to a widespread belief that utility commissionswould provide enough revenues to keep utilities fromgoing bankrupt (barring a disaster), and hence to protect the bondholders, but that they would not necessarily provide enough revenues either to permit the expected rate of dividend growth to occur or, perhaps,even to allow the dividend to be maintained.
Because of these experiences, investors came to regard inflation as having a more negative effect onutility stocks than on bonds. Therefore, when fears ofinflation increased, utilities' measured risk premiums
Workpaper No. 4570

aRIGHAM, SHOME, VINSON/COST Of EQUITY MEASUREMENT
Exhibit 10. Relative Volatility* of Stocks and Bonds, 1965-1984
Volatil ityIndex
25S&P 500 \
High Grade/ Corporate Bonds
,.-_ .. -~....
•,- ...,,.,---, J"",--'------- - ..._.....--,- ..... ...",..,-----
~----- ...... -,5
20
15
10
o L19-6"'S-6"'6-6"'Y-6"'8-6"'9-Y"'"0-Y"'1-Y"2-Y"3-Y"4-Y&'S......Y6~~77~~Y8~~Y9=-~80~8~1:""""':8;".:2:-;8~3---;B~4-*Volatility is measured as the standard deviation of total returns over the last 5 years.Source: Merrill Lynch. Qualllitative Ana/."sis. May/June 1984.
also increased. A regression over the period1966-1979, using our Exhibit 2 data, produced thisresult:
This indicates that a one percentage point increase inthe Treasury bond rate produced, on average, a 0.73percentage point increase in the risk premium. andhence a 1.00 + 0.73 = 1.73 percentage point increasein the cost of equity for utilities.
1980-1984 Period. The situation changed dramatically in 1980 and thereafter. Except for a fewcompanies with nuclear construction problems, theutilities' financial situations stabilized in the early1980s, and then improved significantly from 1982 to1984. Both the companies and their regulators werelearning to live with inflation; many construction programs were completed; regulatory lags were shortened; and in general the situation was much better forutility equity investors. In the meantime, over most ofthe 1980-1984 period, interest rates and bond pricesfluctuated violently, both in an absolute sense and relative to common stocks. Exhibit 10 shows the volatilityof corporate bonds very clearly. Over most of the eighteen-year period, stock returns were much more volatile than returns on bonds. However, that situationchanged in October 1979, when the Fed began to focus
RP 0.30% + 0.73 RF;
(0.22)0.48.
on the money supply rather than on interest rates. Y
In the 1980-1984 period, an increase in inflationaryexpectations has had a more adverse effect on bondsthan on utility stocks. If the expected rate of inflationincreases, then interest rates will increase and bondprices will fall. Thus, uncertainty about inflation translates directly into risk in the bond markets. The effectof inflation on stocks. including utility stocks, is lessclear. If inflation increases, then utilities should. intheory, be able to obtain rate increases that wouldoffset increases in operating costs and also compensatefor the higher cost of equity. Thus, with "proper" regulation, utility stocks would provide a better hedgeagainst unanticipated inflation than would bonds. Thishedge did not work at all well during the 1966-1979period, because inflation-induced increases in operating and capital costs were not offset by timely rateincreases. However, as noted earlier, both the utilitiesand their regulators seem to have learned to live betterwith inflation during the 1980s.
Since inflation is today regarded as a major investment risk, and since utility stocks now seem to providea better hedge against unanticipated inflation than do
"Because the standard deviations in Exhibit 10 are based on the last fiveyears of data, even if bond returns stabilize. as they did beginning in1982. their reported volatility will remain high for several more years.Thus. Exhibit 10 gives a rough indication of the current relative riskiness of stocks versus bonds. but the measure is by no means precise ornecessarily indicative of future expectations.
Workpaper No. 4571

44 FINANCIAL MANAGEMENT/SPRING 1985
Thus, a one percentage point increase in the T-bondrate. on average. caused the risk premium to fall by0.63%, and hence it led to a 1.00 - 0.63 = 0.37percentage point increase in the cost of equity to anaverage utility. This contrasts sharply with the pre1980 period, when a one percentage point increase ininterest rates led. on average, to a 1.73 percentagepoint increase in the cost of equity.
bonds. the interest-rate risk inherent in bonds offsets.to a greater extent than was true earlier, the higheroperating risk that is inherent in equities. Therefore,when inflationary fears rise. the perceived riskiness ofbonds rises. helping to push up interest rates. However, since investors are today less concerned about inflation's impact on utility stocks than on bonds, the utilities' cost of equity does not rise as much as that ofdebt. so the observed risk premium tends to fall.
For the 1980-1984 period. we found the followingrelationship (set::. Exhibit 6):
Summary and ImplicationsWe began by reviewing a number of earlier studies.
From them. we concluded that, for cost of capitalestimation purposes, risk premiums must be based onexpectations, not on past realized holding period returns. Next, we noted that expectational risk premiumsmay be estimated either from surveys, such as the onesCharles Benore has conducted, or by use of DCF techniques. Further, we found that, although growth ratesfor use in the DCF model can be either developed fromtime-series data or obtained from security analysts,analysts' growth forecasts are more reflective of investors' views, and, hence. in our opinion are preferablefor use in risk-premium studies.
Using analysts' growth rates and the DCF model,we estimated risk premiums over several different periods. From 1966 to 1984, risk premiums for bothelectric utilities and industrial stocks varied widelyfrom year to year. Also, during the first half of theperiod, the utilities had smaller risk premiums than theindustrials, but after the mid-1970s, the risk premiumsfor the two groups were, on average, about equal.
The effects of changing interest rates on risk premiums shifted dramatically in 1980, at least for the utilities. From 1965 through 1979, inflation generally hada more severe adverse effect on utility stocks than onbonds, and, as a result, an increase in inflationaryexpectations, as reflected in interest rates, caused an
RP = 12.53% - 0.63 RF;
(0.05)0.73.
increase in equity risk premiums. However, in 1980and thereafter, rising inflation and interest rates increased the perceived riskiness of bonds more than thatof utility equities, so the relationship between interestrates and utility risk premiums shifted from positive tonegative. Earlier, a 1.00 percentage point increase ininterest rates had led, on average, to a 1.73% increasein the utilities' cost of equity, but after 1980 a 1.00percentage point increase in the cost of debt was associated with an increase of only 0.37% in the cost ofequity.
Our study also has implications for the use of theCAPM to estimate the cost of equity for utilities. TheCAPM studies that we have seen typically use eitherIbbotson-Sinquefield or similar historic holding periodreturns as the basis for estimating the market risk premium. Such usage implicitly assumes (i) that ex postreturns data can be used to proxy ex ante expectationsand Oi) that the market risk premium is relatively stable over time. Our analysis suggests that neither ofthese assumptions is correct; at least for utility stocks,ex post returns data do not appear to be reflective of exante expectations, and risk premiums are volatile, notstable.
Unstable risk premiums also make us question theFERC and FCC proposals to estimate a risk premiumfor the utilities every two years and then to add thispremium to a current Treasury bond rate to determine autility's cost of equity. Administratively, this proposalwould be easy to handle, but risk premiums are simplytoo volatile to be left in place for two years.
ReferencesI. C. Benore. A Survey ofInvestor Attitudes toward the Elec·
tric Power Industry, New York. Paine Webber MitchellHutchins. Inc .. May 1983.
2. E.F. Brigham and D.K. Shome. "The Risk Premium Approach to Estimating the Cost of Common Equity Capital."Proceedings of the Iowa State Regulatory Conference(May 1980), pp. 239-275.
3. -- "Estimating the Market Risk Premium:' in R.L.Crum and F.G.J. Derkinderin (eds.), Risk, Capital Costs,and Project Financing Decisions, Nijenrode Studies inBusiness. Boston, Martinus Nijhoff, 1981.
4. --"Equity Risk Premiums in the 1980s." in EarningsRegulation under Inflation. Washington, DC, Institute forthe Study of Regulation, 1982, pp. 166-181.
5. L.D. Brown and M.S. Rozeff, "The Superiority of Analysts' Forecasts as a Measure of Expectations: Evidencefrom Earnings," Journal of Finance (March 1978), pp.1-16.
Workpaper No. 4572

3RIGHAM, SHOME, VINSON/COST Of EQUITY MEASUREMENT
6. W.T. Carleton. D.R. Chambers, and J. Lakonishok. "Inflation Risk and Regulatory Lag," Journal ofFinance (May1983), pp. 419-431.
7. J.G. Cragg and B.G. MalkieL Expectations and the Structure of Share Prices, Chicago. The University of ChicagoPress, 1982.
8. E.F. Fama and W.G. Schwert. "Asset Returns and Inflation," Journal of Financial Economics, November 1977,pp. 115-146.
9. I. Friend. R. Westerfield. and M. Granito. "New Evidenceon the Capital Asset Pricing Model." Journal of Finance(June 1978), pp. 903-917.
10. M.J. Gordon and PJ. Halpern. "Bond Share Yield Spreadsunder Uncertain Inflation," American Economic Rel'ielt'(September 1976), pp. 559-565.
II. N.B. Gultekin. "Stock Market Returns and Inflation Forecasts," Journal of Finance (June 1983). pp. 663-673.
12. R.G. Ibbotson and R.A. Sinquefield. Stocks, Bonds. Bills,and Inflation: Historical Returns (1926-1978). Charlottes-
45
ville. VA. Financial Analysts Research Foundation, 1979.13. eM. Linke. "Estimating Growth Expectations for AT&T:
Survey Approach." Washington, DC. Advanced Seminaron Earnings Regulation. November 1981.
14. B.G. Malkiel. "The Capital Formation Problem in theUnited States." Journal of Finance. May 1979. pp.291-306.
15. A.A. Robichek. "Regulation and Modem Finance Theory." Journal of Finance (June 1978). pp. 693-705.
16. K.L. Stanley. W.G. Lewellen. and G.G. Schlarbaum."Further Evidence on the Value of Professional InvestmentResearch." Journal of Financial Research (Spring 1(81),pp. 1-9.
17. Touche. Ross, and Company. Proxy Disclosures alldStockholder Attitude Sun·ey. Washington. DC, NationalAssociation of Corporate Directors. May 1982.
18. R.F. Vandell and G.W. Kester. A History of Risk PremiaEstimates fl)r Equities: 1944-1978. Charlottesville, VA.Financial Analysts Research Foundation, 1983.
CALL FOR PAPERS
American Real Estate and Urban Economics Association1985 Annual MeetingsDecember 28--30, 1985
New York
Papers are being solicited for presentation at the 1985 AREUEA Meetings held as part of the Allied SocialSciences Associations (ASSA) Meetings in New York. The areas of interest to AREUEA are real estate andurban economics in their broadest sense to include theoretical and applied research on real estate finance, landand housing economics, real estate investment and valuation, real estate and mortgage markets along withgovernment policies related to these markets. Anyone wishing to present a paper should submit a completedmanuscript or abstract by no later than May 15, 1985 to the Program Chairman:
Professor George W. GauFaculty of Commerce and Business Administration
University of British ColumbiaVancouver, B.C.
V6T IY8Canada
604-228-5847
Workpaper No. 4573