cost recovery in urban water services - home | wsp · cost recovery in urban water services: select...
TRANSCRIPT

Cost Recovery in Urban Water Services:Select Experiences in Indian Cities
March 2011
WATER AND SANITATION PROGRAM: TECHNICAL PAPER
The Water and Sanitation Program (www.wsp.org) is a multi-donor partnership administered by the World Bank to support poor people in obtaining affordable, safe, and sustainable access to water and sanitation services.

WSP MISSION:WSP’s mission is to support poor people in obtaining affordable, safe, and sustainable
access to water and sanitation services.
WSP FUNDING PARTNERS:The Water and Sanitation Program (WSP) is a multi-donor partnership created in 1978 and
administered by the World Bank to support poor people in obtaining affordable, safe, and
sustainable access to water and sanitation services. WSP provides technical assistance,
facilitates knowledge exchange, and promotes evidence-based advancements in sector
dialogue. WSP has offices in 25 countries across Africa, East Asia and the Pacific, Latin
America and the Caribbean, South Asia, and in Washington, DC. WSP’s donors include
Australia, Austria, Canada, Denmark, Finland, France, the Bill and Melinda Gates Foundation,
Ireland, Luxembourg, Netherlands, Norway, Sweden, Switzerland, United Kingdom, United
States, and the World Bank. For more information, please visit www.wsp.org.
AusAID provides WSP-SA programmatic support.
ACKNOWLEDGMENTS:Peer reviewers: Lee Baker and Raghu Kesavan
Task Managers: Vandana Bhatnagar and Nicholas Pilgrim
Consultants: Ravi Kant Joshi and Chris Heymans
Edited by: Anjali Sen Gupta
Photo Credits: Sajid Darokhan
Created by: Roots Advertising Services Pvt Ltd
Printed by: Vashima Printers
CONTACT US:Water and Sanitation Program, The World Bank, 55 Lodi Estate,
New Delhi 110 003, India
Phone: (91-11) 24690488, 24690489; Fax: (91-11) 24628250
E-mail: [email protected]; Web site: www.wsp.org
The findings, interpretations, and conclusions expressed herein are entirely those of the author and should
not be attributed to the World Bank or its affi liated organizations, or to members of the Board of Executive
Directors of the World Bank or the governments they represent. The World Bank does not guarantee the
accuracy of the data included in this work. The boundaries, colors, denominations, and other information
shown on any map in this work do not imply any judgment on the part of the World Bank Group concerning
the legal status of any territory or the endorsement or acceptance of such boundaries.
The material in this publication is copyrighted. Requests for permission to reproduce portions of it should
be sent to [email protected]. WSP encourages the dissemination of its work and will normally grant
permission promptly. For more information, please visit www.wsp.org.
© 2011 Water and Sanitation Program

Cost Recovery in Urban Water Services:Select Experiences in Indian Cities
March 2011

ADB Asian Development Bank ARV Annual Rental Value ARWSP Accelerated Rural Water Supply ProgrammeASCI Administrative Staff College of IndiaAUWSP Accelerated Urban Water Supply ProgrammeBOT Build Operate TransferBPL Below the Poverty LineCAA Constitutional Amendment Act CAGR Compound Annual Growth Rate CDP City Development Plan GDP Gross domestic product GIS Geographic information systemGoI Government of India HMA Hyderabad Metropolitan Area HMWSSB Hyderabad Metropolitan Water Supply and
Sewerage Board HUDCO Housing and Urban Development
Corporation IMC Indore Municipal Corporation IT Information technology JNNURM Jawaharlal Nehru National Urban
Renewal MissionKMC Kochi Municipal Corporation KSUDP Kerala Urban Sustainable Development
Project KWA Kerala Water Authority LIC Life Insurance Corporation of India LMC Ludhiana Municipal Corporation
MCC Municipal Corporation of Chandigarh MCH Municipal Corporation of Hyderabad MoU Memorandum of UnderstandingMoUD Ministry of Urban DevelopmentMSW Municipal solid waste NABARD National Bank for Agriculture and
Rural DevelopmentNASSCOM National Association of Software and
Services Companies NRW Nonrevenue waterO&M Operation and maintenanceOHT Overhead tankPMC Pune Municipal Corporation SCADA Supervisory Control and Data Acquisition SE Superintending Engineer STP Sewage treatment plantSWM Solid waste managementUJS Uttarakhand Jal Sansthan ULB Urban local bodyUPJN Uttar Pradesh Jal NigamUWSEIP Urban Water Supply and Environment
Improvement Project VAT Value added tax WHO World Health OrganizationWTP Water treatment plantWSP Water and Sanitation ProgramWSS Water supply and sanitation
Acronyms and Abbreviations
ii Cost Recovery in Urban Water Services

Currency Conversion
US$1 = Rs. 42.8 (June 2008)
Units of Land Measurement Conversion 1 acre = 4,840 square yards, 4067.23 m², 43,560 square feet 1 hectare = 2.5 acres 1 kanal = 605 square yards, 0.125 acres, 506 m²1 square yard = 0.8361 m², 9 square feet
cm centimeterkl kiloliterkld kiloliter per day km kilometer km2 square kilometerlpcd liter per capita per daym metermg million gallons
mgd million gallons per dayml millilitermld million liters per day mm millimeterppm part per million sq ft square footsq km square kilometer
Units of Measure
www.wsp.org iii

ContentsAcronyms and Abbreviations ..................................................................................... iiUnits of Measure ....................................................................................................... iiiCurrency Conversion ................................................................................................. iiiUnits of Land Measurement Conversion .................................................................. iii1. Introduction and Background ............................................................................1 Cities Covered in the Study ............................................................................12. Operational Factors that Influence Cost Recovery ..........................................4 Service Coverage ...........................................................................................4 Water Losses and Nonrevenue Water .............................................................6 Metering, Billing, and Collection ......................................................................7 Staffing Levels ...............................................................................................83. Tariffs and Cost Recovery ................................................................................10 Objectives of an Optimal Water Tariff .............................................................10 Tariff Levels and Some Impacts ....................................................................10 The Significance of Tariff Structure ................................................................114. Affordability and Services to the Poor ............................................................13 Subsidies and Exemptions ...........................................................................13 The Costs of Connection ..............................................................................14 Standposts ...................................................................................................14 Coping Costs ...............................................................................................155. Implications ......................................................................................................17 A Strategic and Inclusive Process .................................................................17 Operational Improvements ............................................................................18 Reforming Tariffs through a Credible Process ................................................19 Build Supportive Institutions .........................................................................19 Summary ......................................................................................................19References ................................................................................................................21
iv Cost Recovery in Urban Water Services

www.wsp.org v
Boxes 1: Key Concepts .................................................................................................2 2: Some Initiatives to Improve Billing and Collection ............................................8
Figures 1: Net Revenue Potential from NRW ...................................................................7 2: Net Revenue Potential from Improved Collection Efficiency .............................7 3: Synergies Between Access for the Poor and Cost Recovery ........................13 4: Improving Operating Practices ......................................................................17 5: The Main Message in a Nutshell ...................................................................20
Tables 1: Revenue Potential of Operational Improvements in Seven ULBs .....................4 2: Revenue Potential of Increasing the Consumer Base ......................................5 3: Revenue Potential of Reducing Nonrevenue Water .........................................6 4: Revenue Potential of Improving Collection Efficiency .......................................9 5: Objectives of an Optimal Water Tariff .............................................................10 6: Equivalence between Tariff Rates for Metered and Unmetered Connections .12 7: Charge for Subsistence Level Consumption Compared with
Monthly Budget for People Living on the Poverty Line ..................................16
Select Experiences in Indian Cities | Contents


www.wsp.org 1
India’s Jawaharlal Nehru National Urban Renewal Mission (JNNURM) requires urban water service providers to recover the costs of their services through “reasonable user charges”. Internationally, the trend is for tariffs to cover the full costs of water supply and sanitation, including capital replacement and the remuneration of equity. In India, however, tariffs generally fall far short of recovering costs; even in as far as they attempt to do so, the common practice is one of operational cost recovery, and tariffs do not take into account capital costs. Box 1 elaborates on the difference between these approaches.
Setting adequate tariffs and improving tariff practice would therefore have to be part of urban service delivery reform. This field note argues, however, that even while tariff reform is still in progress, service providers could improve cost recovery considerably by introducing more efficient operational practices. The evidence shows that—even at existing tariff levels—none of the cities included in the study achieves its revenue, and some are as much as 80 percent below their potential. Greater efficiency can go a long way to redressing this problem, and improving service delivery and cost recovery.
The report draws on a Water and Sanitation Program (WSP) study from 20081 which made a comparative analysis of 23 urban local bodies (ULBs)—looking at seven cities in detail and another 16 based on secondary data2—to
I. Introduction and Background
understand the factors affecting cost recovery in India and provide an indication of current performance. It also draws out examples and lessons to inform reform approaches and guidelines for reform.
Cities Covered in the StudyThe study provides only a ‘snapshot’ of the sector. Generally, it was difficult to access reliable data from the seven cities, particularly for sewerage costs and revenue. As a result, most of the discussion concerns water supply services, although it incorporated sewerage data where possible. The lack of reliable data highlights the need for improved information management. For this reason, the Ministry of Urban Development (MoUD) has placed considerable emphasis on data management in its Service Level Benchmarking initiative, which now covers 28 pilot cities in several states.
Based on these observations, the first part of the paper (sections on ‘Operational Factors that Influence Cost Recovery’ and ‘Tariffs and Cost Recovery’) discusses operational and tariff-related factors that impede cost recovery by urban water service providers in India, especially low service coverage; high water losses and nonrevenue water; inefficient metering, billing and collection; and high staffing levels. It also shows that distorted tariff structures and subsidies undermine cost recovery further, and often benefit middle and upper income levels, rather than the poor.
1 WSP. Cost Recovery and Tariff Practices for Urban Water Supply and Sanitation in India (unpublished). 2 The study looked at seven ULBs in detail, and used secondary data from 16 cities covered in a 2007 Asian Development Bank (ADB)/Ministry of Urban Development (MoUD) document, Benchmarking and Data Book of Water Utilities in India.
Water and Sanitation Program (WSP) Study CitiesDehradun, Ludhiana, Chandigarh, Indore, Pune, Hyderabad, and Kochi
ADB-MoUD-GoI Study CitiesAhmedabad, Amritsar, Bengaluru, Bhopal, Chennai, Coimbatore, Jamshedpur, Kolkata, Mathura, Mumbai, Nagpur, Nasik, Rajkot, Varanasi, Vijayawada and Vishakhapatnam
Setting adequate tariffs and improving tariff practice should be part of urban service delivery reform. However, even while tariff reform is still in progress, service providers could improve cost recovery considerably by introducing more efficient operational practices.

2 Cost Recovery in Urban Water Services
BOx 1: KEy CONCEPTS
Cost Recovery Cost recovery in water supply and sanitation services means that the total revenue to the service provider equals (or exceeds) the cost of supply. A stable revenue stream helps prevent cash flow or financing difficulties for the utility. At least three types of cost recovery are relevant to this analysis: (a) operational cost recovery means that the revenues are at least equal to the operating expenses of providing a service; (b) full service cost recovery means that capital maintenance expenditure and costs of capital are also recovered: and (c) full environmental cost includes the external costs of a service, including any environmental damage.
In India, the Government of India or state governments have usually financed capital costs, so that the term cost recovery tends to refer to covering the operating expenses. The extent to which cities actually cover replacement, renewal, expansion, and other aspects of routine maintenance varies from city to city, and often capital maintenance is not included. Internationally, in many countries full service cost recovery is more common and, to enable this, service providers often are institutionally clearly separated from governments, and given substantial autonomy for operations, and proposing tariffs, within a clearly defined regulatory framework which provides for third party review of tariffs.
Tariff A tariff is the set of prices, charges, and taxes used to generate revenue. A well-designed tariff enables financially sustainable service delivery and encourages users to avoid wasteful consumption in one of the following ways:
a) Fixed charge. This means that the tariff level per unit remains the same whatever the volume of water consumed. It is commonly applied where consumption is not metered, or when the meters are faulty or not read.
b) Volumetric charge. Users are billed according to the volume of water consumed; this requires metering. Some service providers apply a flat rate per cubic meter (m3) irrespective of total consumption. Others use a Block Tariff, whereby one rate applies for consumption up to a certain level, while a different rate applies to consumption beyond that level. Many utilities use an Increasing Block Tariff in which the first ‘lifeline’ block costs less and equates to typical household consumption per month for essential purposes (typically 6-10 m3).This means that all households can access a basic level of service, while a higher tariff applies to consumption in the second block.
c) Two part charge. This comprises a fixed charge plus a volumetric component.
Economic EfficiencyUser charges should be sufficient to meet the marginal cost of supply. If the cost of supplying water from a new source is higher than for the existing source, it may be necessary to adjust the tariff. Water supply and sanitation improvement programs may result in changes in operating costs, which also need to be captured in revised tariffs. Elasticity of tariffs is important: tariffs should be responsive to changes in population, household income, and inflation, which affect demand and production costs. In the past, charges have remained fixed for long periods irrespective of these factors.
Select Experiences in Indian Cities | Introduction and Background
The second part of the note (sections on ‘Tariffs and Cost Recovery’ and ‘Affordability and Services to the Poor’) discusses policy reform and practical initiatives and options to
achieve improved cost recovery and, by implication, achieve service improvements, capital maintenance, and expansion of coverage. Box 1 explains some of the key concepts.

www.wsp.org 3
Equity and Affordability Equity in water and sanitation services means that user charges treat similar customers equally, and that customers in different situations are not treated the same. Subsidies are often used to achieve equity, enable low-income households to gain house connections, or to make services affordable for the poor. Commercially viable services and rational tariffs, however, often bring efficiency gains that may benefit customers more than subsidies. When assessing affordability, it is important to consider both the costs of access (installation of facilities and connection to the city network) and consumption charges. Most utilities can plan for phased increases in tariffs to be compatible with users’ willingness and ability to pay.
Operating Ratio The operating ratio is a primary indicator of efficiency, and expresses operating expenses divided by revenue. An operating ratio less than 1 indicates a surplus, while a ratio greater than 1 indicates a loss.
Nonrevenue Water This refers to water that is supplied free through standposts or under an exemption policy; is consumed without payment via theft or illegal connections; or is lost through leakage. The term ‘nonrevenue water’ thus includes water lost or which has not yielded revenue due to technical and nontechnical reasons. For better clarity of causes, this field note segregates it under technical and nontechnical categories.
Select Experiences in Indian Cities | Introduction and Background

4 Cost Recovery in Urban Water Services
In this section, the report takes up the implication of the JNNURM approach that cost recovery through “levy of reasonable user charges” does not simply mean tariff increases, but requires that service providers also address issues of operational efficiency. The key operating factors that affect cost recovery are discussed in more detail here, including the study’s findings with respect to the 23 ULBs. Table 1 provides an overview of the revenue potential of addressing these operational issues for the seven cities studied in detail.
Service CoverageMore customers (higher service coverage) mean a larger revenue base for the service provider.3 There is a significant potential market for utilities since most poor households
3 The estimate for increasing consumer coverage was reached in four steps: (1) Establishing the total number of households by dividing the current population figures by average family size; (2) From this figure, deducting urban poor households and adding commercial and institutional establishments; (3) Deducting from the total consumer base the actual consumers; and (4) Multiplying the difference between total and actual by the minimum water charge.
II. Operational Factors that Influence Cost Recovery
currently depend on limited standpost supplies or informal vendors. Where household connections do exist, low pressure and intermittent supply compromises the quality and measurability of services.
Among the cities covered in the wider sample for this study, Mumbai and Rajkot had the highest coverage through household connections at approximately 98 percent, followed by Kochi at 83 percent (Table 2). In most cities, however, coverage is much lower—in 15 of the cities studied, it was less than 50 percent, and in some cases even lower than 30 percent of estimated customers. Low service coverage means less revenue, which in turn results in higher operating ratios/less efficiency.
More customers (higher service coverage) mean a larger revenue base for the service provider. There is a significant potential market for utilities since most poor households currently depend on limited standpost supplies or informal vendors.
TABLE 1: REVENUE POTENTIAL OF OPERATIONAL IMPROVEMENTS IN SEVEN ULBS
Rupees in Million
Factors Dehradun Ludhiana Chandigarh Indore Pune Hyderabad Kochi
Reducing total nonrevenue water 21 181 146 35 164 348 21
Improving collection efficiency 37 165 34 280 410 1650 357
Increasing consumer base 90 252 36 391 119 144 23
Total revenue improvement potential (A) 148 598 216 706 693 2143 401
2006-07 Total operative income (B) 130 225 492 159 1015 2572 193
Potential for increase in operative income A/B (%) 114% 226% 44% 444% 68% 83% 208%

www.wsp.org 5
4In the case of four cities—Pune, Hyderabad, Cochin, and Chandigarh—extension of network is not required as cities have claimed 100 percent area coverage by water supply network (see Table 4); while in the case of three cities—Dehradun, Ludhiana, and Indore—extension of water supply network will be required for increasing the consumer base. This will involve capital investment but figures were not available.
Existing Status/Potential
15% undeclared area of city not serviced, potential water demand 62,000 kl Supplying water to industries, which are currently not served. Potential water demand 60,000 kl per day
Only 18,500 slum households paying water charge while 181,500 slum households do not pay any water charge Around 60,000 potential tax payers not in the water charge database
Around 100,000 potential consumers can be added as per estimate of service provider
Of potential 342,000 consumers, only 161,000 consumers are under water charges
Of potential 210,000 consumers, only 130,000 consumers are under water charges
Of potential 130,000 consumers, currently 108,000 consumers are under water coverage
Of potential 135,000 consumers, only 60,000 consumers are under water charge
City
Ludhiana
Pune
Hyderabad
Indore
Chandigarh
Kochi
Dehradun
Increase
Rs. 86 mn
Rs. 166 mn
Rs. 65 mn
Rs. 54 mn
Rs. 144 mn
Rs. 391 mn
Rs. 36 mn
Rs. 23 mn
Rs. 90 mn
Working of Revenue Potential
62,000 kiloliter per day (kld) water x Rs. 3.80 minimum rate x 36560,000 kld water x Rs. 7.60 minimum rate x 365
181,500 x Rs. 360 per year = Rs. 65 mn
60,000 x Rs. 900 per year minimum water charge
100,000 new consumers x 240 kl water per year consumption x Rs. 6 per kl water
181,000 potential consumers x Rs. 2160 per year minimum water charge
80,000 potential consumers less 30,000 slum dweller = 50,000 consumers x Rs. 720 per year minimum water charge
22,000 potential consumers x Rs. 1,080 per year minimum water charge (240 kl water per year consumption x Rs. 4.5 per kl water)
75,000 potential consumers less 25,000 slum dwellers x Rs. 1,800 per year minimum water and sewerage charge
In summary, most of the service providers in the 23 cities could expand their consumer base and improve their revenue generation by extending the distribution network and ensuring adequate bulk supply. For example, revenue in Ludhiana could (in theory) increase from Rs. 86 million to Rs. 252 million if the potential water demand of 62,000 kiloliters per day in unconnected poorer areas and 60,000 kiloliters per day for industries was taken up. Pune could achieve Rs. 120 million if it was able to bring some 181,500 slum households into the system, who do not pay any water charge, and around 60,000 existing taxpayers (that
is, businesses and registered households) who are currently not part of the customer base. In cities such as Nagpur and Nashik, the impact of extending coverage could be even greater, as less than 50 percent of their populations are currently connected.
The JNNURM scheme has assisted several cities to broaden coverage of water supply, and has encouraged ULBs to deliver services to more people and to develop sustainable systems for generating revenue by bringing more people into the formal networks. Often, even where network access
Select Experiences in Indian Cities | Operational Factors that Influence Cost Recovery
TABLE 2: REVENUE POTENTIAL OF INCREASING THE CONSUMER BASE4

6 Cost Recovery in Urban Water Services
5 WSP Benchmarking Project, Phase I, 2005.
Select Experiences in Indian Cities | Operational Factors that Influence Cost Recovery
has been provided, service providers have to make sustained efforts to encourage customers to obtain direct connections and not depend on public standposts or self-provision. However, to derive the full benefit from more customers, it would be important to address the other operational factors that currently impede cost recovery as described in the following paragraphs.
Water Losses and Nonrevenue Water
Nonrevenue water (NRW) refers to water that is produced but not sold to consumers. It arises from technical losses
Existing Status/ Potential Action
Reversing exemption of 72,000 households and imposing water and sewerage charge
Technical loss if reduced from 25% to 10% will save 150,000 kld water
Technical loss at 15% if brought down to 10% will save 63,100 kl water per day As per water audit, illegal consumption of water is 7% of total water supply (96,320 kl water per day).
Technical loss at 14.4% if brought down to 10% will save 8,000 kl water per day
Technical loss at 25% if brought down to 10% will save 52,627 kl water per day
Unutilized installed capacity is 8% (30,509 kl water per day) + 5% water through standposts (19,068 kl water per day)
Technical loss at 30% if brought down to 10% will save 29,814 kl water per day
Technical loss at 30% if brought down to 10% will save 21,372 kl water per day
City
Ludhiana
Pune
Hyderabad
Indore
Chandigarh
Kochi
Dehradun
Net Revenue Potential for the City (in Million Rupees)
181
164
348
35
149
22
21
Revenue Potential (in Million Rupees)
181
164
138
210
35
77
72
22
21
Working of Revenue Potential
Minimum annual water charge (Rs. 1,260) + sewerage charge (Rs. 1,260) = Rs. 2,520 x 72,000 households
150,000 kld water x Rs. 3 per kl x 365
63,100 kl water savings per day x 365 x Rs. 6 cost of production per kl
96,320 kl water per day x 365 x Rs. 6 cost of production per kl
8,000 kl water per day x 365 x Rs. 12 cost of production per kl
52,627 kl water per day x 365 x Rs. 4 water charge per kl
49577 kl water per day x 365 x Rs. 4 water charge per kl
29,814 kl water per day x 365 x Rs. 2 minimum tariff per kl
21,372 kl water per day x 365 x Rs. 2.66 average revenue per kl water
occurring during transmission and distribution, water provided free through standposts or under exemptions (often for the poor), and theft, including illegal connections. High levels of NRW are common throughout India. Delhi’s NRW was estimated to be as high as 55 percent at the outset of the JNNURM in 2005/06; Ahmedabad and Goa reported 36 percent and 47 percent respectively.5
For the service providers assessed in this study, NRW was estimated at 30–40 percent of production. This could not, however, be measured accurately, either because production
TABLE 3: REVENUE POTENTIAL OF REDUCING NONREVENUE WATER

www.wsp.org 7
FIGURE 1: NET REVENUE POTENTIAL FROM NRW
Rs 350 –
Rs 300 –
Rs 250 –
Rs 200 –
Rs 150 –
Rs 100 –
Rs 50 –
Rs 0 –Ludhiana Pune Hyderabad Indore Chandigarh Kochi Dehradun
NRW: Net Revenue Potential for the Cities
in M
illio
n R
upee
s
City
FIGURE 2: NET REVENUE POTENTIAL FROM IMPROVED COLLECTION EFFICIENCy
Rs 1,800 –Rs 1,600 – Rs 1,400 – Rs 1,200 – Rs 1,000 –
Rs 800 – Rs 600 – Rs 400 –
Rs 200 –Rs 0 –
Ludhiana Pune Hyderabad Indore Chandigarh Kochi Dehradun
Revenue Potential of Improved Collection Efficiency (in Million Rupees)
in M
illio
n R
upee
s
City
and consumption of water are not metered at all, or because meters are faulty. In the absence of hard data on NRW, it then becomes difficult to estimate the potential for revenue improvements. With these limitations in mind, Table 3 provides an estimate of the revenue potential of a hypothetical reduction in NRW. The positive gains appear to be substantial. While addressing some technical losses may require capital investment, the results show that other elements of NRW can be reduced significantly without added investment, as they primarily require improved maintenance and efficiency.
Metering, Billing, and Collection
As Box 2 shows, there have been some initiatives to improve billing and collection, but the impact is limited since metering is rarely in place across whole cities, equipment is not functional, customers are not informed, and penalties for nonpayment are still lenient. In some cities, billing and collection centers are only located at zonal level and therefore not easily accessible for households. Many customers are unaware of billing and payment procedures and often do not pay their bills on time. These are common problems in many cities.
In general, data on collection efficiency6 in the sample cities proved hard to come by (due to lack of metering) and data categories and definitions are not consistent. For example, while Kolkata reports 100 percent cost recovery, the data on collection reflects only collections from industry and business clients, since there are no user charges for domestic consumers. The cities with more reliable data typically are the ones that use volumetric metering on a larger scale, such as Jamshedpur (100 percent), Kolkata (100 percent), and Nasik (92 percent). The next best performers were Coimbatore (75 percent), Nagpur (80 percent), and Vishakhapatnam (86 percent). Ludhiana (16 percent) and Kochi (13 percent) had the lowest reported levels of collection.
More cities have been introducing meters, but the effectiveness varies. Inadequate maintenance is a common problem, aggravated by the malfunctioning of the meters under conditions of intermittent supply, tampering with meters, and irregular meter readings. As a result, many households that have meters still receive bills on a fixed charge basis, rather than tariffs reflecting incremental use of water. Only seven of the 23 cities in the sample used metering on a large scale, while four cities (Indore, Bhopal, Mathura, and Varanasi) have no meters at all.7
Select Experiences in Indian Cities | Operational Factors that Influence Cost Recovery
6 It is assumed that a municipal body will improve its collection efficiency to 90 percent of current demand from its current level of collection efficiency. Past arrears or dues not included in this working; any improvement in that respect will be additional.7 In the Indian context, as in most countries, the argument in favor of metering is that consumers are charged for what they use, and consumption is linked to actual costs of delivering the service. It should be noted that the question of metering and cost recovery as discussed here applies specifically to the drinking water service and not to broader water resources issues, and that other issues such as free standposts need to be managed and accounted for through systematic management of nonrevenue water.

8 Cost Recovery in Urban Water Services
Staffing Levels Appropriate staffing levels and efficient task allocation remain major challenges for most service providers. Of the cities studied, Indore had the highest number of staff per 1,000 connections at 18.7, while Pune has the lowest at just 1.94. The majority have a ratio of 5 or more.
There is a growing trend of outsourcing operations and maintenance (O&M) functions. For example, Rajkot has outsourced pumping operations, mains and lines maintenance, sluice valve operations, and leak repairs. Nearby Ahmedabad has outsourced production, operations and
maintenance through management contracts, and Nagpur has done so with billing and collection. The outsourced positions do not appear in staff counts and payrolls, but are included in various operating expenditure accounts. This makes it difficult to compare service providers, and the staff ratio may not fully reflect the number of people employed to deliver the service. Most ULBs that have outsourced say that it has brought efficiency gains. It continues mostly on a task-by-task basis and not as a ‘full service’ operator contract, in part because of public sector employment regulations, union resistance, and a lack of capacity among ULBs or service providers to manage the contracting process.
Select Experiences in Indian Cities | Operational Factors that Influence Cost Recovery
A number of Indian water service providers (urban local bodies or utilities) have taken the initiative to address billing and collection. Most have not achieved full cost recovery, in part because the service coverage is not wide enough and because tariffs remain very low (in the expectation that fiscal grants will continue to finance services). However, these initiatives do provide evidence of the kind of improvements that can be made to widen the customer base and improve revenues.
The Municipal Corporation of Chandigarh (MCC), for example, has a computerized bi-monthly billing system based on meter reading for the majority of customers, and a flat rate system for rehabilitation colonies, that is, areas for rehabilitation and resettlement of people affected by the acquisition of land for public projects or involuntary displacement due to other reasons. Bills can be paid at the MCC offices, cash collection centers, or e-centers. The MCC has also introduced a penalty mechanism and a disconnection clause, based on a one-time surcharge of 10 percent on current demand though no surcharge is levied on arrears. Since the penalty does not accumulate, the incentive
for consumers to settle their debts quickly is not very
powerful. In 2006, the MCC introduced additional
byelaws to assist revenue collection and since then
has registered 4,012 cases of disconnection for
nonpayment of bills.
In Hyderabad, bills are raised on a bi-monthly basis
for domestic users, and on a monthly basis for others.
Payments are accepted at e-centers across the city,
at designated cash collection counters of the utility
(HMWSSB), and can be paid online.
The Indore Municipal Corporation (IMC) introduced
stringent penalties in 2007 to reduce the number of
illegal connections. If an illegal connection is tracked
down, a charge of Rs. 2,500 is imposed for legalization,
in addition to payment of one year’s water tariff (Rs.
1,920). The water tariff of Rs. 1,920 can be paid in
three monthly installments. Up to March 31, 2008, on
self-disclosure of an illegal connection, the Rs. 2,500
had to be paid but the water charge was calculated
at a lower rate, subject to a minimum charge of three
months’ tariff or Rs. 480.
BOx 2: SOME INITIATIVES TO IMPROVE BILLING AND COLLECTION

www.wsp.org 9
Existing Status/Potential Action
Total collection efficiency stands less than 20%
Current collection efficiency 59%, current demand Rs. 1,333 million, and current collection Rs. 790 million
Current collection efficiency 54% against annual billing/demand of Rs. 4,536 million, and current collection of Rs. 2,433 million
Total collection efficiency 22%, andcurrent collection of Rs. 116 million
Current collection efficiency 66%, collection against past arrears 0%, and current demand Rs. 485.24 million
Total collection efficiency 13%, current collection is of Rs. 61 million, and current demand Rs. 465 million
Total collection efficiency 37%, andcurrent demand Rs. 130 million
City
Ludhiana
Pune
Hyderabad
Indore
Chandigarh
Kochi
Dehradun
Revenue Potential (in Million Rupees)
165
410
1,655
280
34
357
37
Working of Revenue Potential
90% of current demand of Rs. 169 million = Rs. 152 million + 20% of past arrears of Rs. 914 million = Rs. 183 million Making total potential recovery of Rs. 335 million less current recovery of Rs. 170 million.
90% of current demand of Rs. 1,333 million = Rs. 1,200 million less current collection of Rs. 790
90% of current demand of Rs. 4,536 million = Rs. 4,088 million less current collection of Rs. 2,433
90% of current demand of Rs. 440 million = Rs. 396 million less current collection of Rs. 116
90% of current demand of Rs. 485 million = Rs. 436 million less current collection of Rs. 402 million
90% of current demand of Rs. 465 million = Rs. 418 million less current collection of Rs. 61 million
90% of current demand of Rs. 130 million = Rs. 117 million and 20% of past arrears of Rs. 150 million = Rs. 30 million making total potential recovery of Rs. 147 million less current recovery of Rs. 110 million
Select Experiences in Indian Cities | Operational Factors that Influence Cost Recovery
Outsourcing is not a panacea though. Some ULBs that have outsourced operational tasks still have high staffing ratios. Bengaluru, for example, still has 4.8 staff per 1,000 connections, and Chennai has 13.3 despite outsourcing production and distribution. Workforce management can
remain a challenge even when services are outsourced; because the primary selection criteria is focused on technical expertise, the managerial capacities of potential contractors does not always receive adequate attention.
TABLE 4: REVENUE POTENTIAL OF IMPROVING COLLECTION EFFICIENCy

10 Cost Recovery in Urban Water Services
Objectives of an Optimal Water Tariff
Cost recovery is not possible unless water is priced correctly. Table 5 summarizes the objectives of an optimal water tariff and their implications, and the key issues identified here are discussed in more detail in the sections that follow.
Tariff Levels and Some Impacts
The analysis in the 23 cities shows that low tariff levels remain a major impediment to the financial sustainability of services and of service improvements. In Chandigarh, tariffs are so low that even poor households have no incentive to limit their consumption. In Hyderabad, the tariff structure reflects costs more realistically, but there are high technical losses and the meter default rate is 25 percent. In none of the cities did tariffs reflect the average cost of production or
III. Tariffs and Cost Recovery
the incremental cost of source augmentation and new water supply infrastructure Tariffs that are either fixed or set too low reduce the ability of service providers to recover costs, and to promote water conservation and the economic use of water. In the absence of effective metering, volumetric charges, even where these exist, are not implemented. Only a few cities like Bengaluru, Chandigarh, Pune, Kochi, and Mumbai have metered connections, but meters are often of low quality, inadequately maintained, and there is a lack of sanctions against tampering with meters. Intermittent water supply leads to meters running on air, which shortens their lifespan and causes metering errors. Continuous (24x7) supply and a clear standard for the quality of meters are among the possible solutions to these problems.
Source: WSP, 2006 research.
Implication
Operation and maintenance costs of supply should be recovered in full. There can be a gradual increase in recovery of capital maintenance costs and cost of capital. In addition, the revenue stream should be relatively stable and not cause cash flow or financing difficulties for the utility.
Prices should signal to consumers the costs that their decision to use water imposes on the rest of the system.
Prices should treat similar customers equally, and ensure that customers in different situations are not treated the same.
Prices should discourage excessive or wasteful use of water, thus promoting conservation.
To mitigate political controversy, customers and interest groups should be given due opportunity to provide inputs and raise concerns in the process of price determination.
A tariff design should be easy to understand as far as payers are concerned. Prices must also be determined in a transparent manner.
Objective
Cost recovery
Economic efficiency
Equity and fairness
Resource conservation
Acceptability
Simplicity and transparency
Generally, households with metered connections pay less, but they pay for what they use, whereas fixed charges result in huge wastage because people lack the incentive to contain their consumption.
TABLE 5: OBJECTIVES OF AN OPTIMAL WATER TARIFF

www.wsp.org 11
Transparency of tariffs lends credibility and helps ensure broad acceptance because it helps customers understand how tariffs are calculated, and it enhances the public and political leadership’s trust in the process. There have been some initiatives to achieve some of these attributes. For example, Hyderabad and Chandigarh adopted Citizen’s Charters to enable clear communication between the service provider and users, and both have complaints redressal systems. Pune’s tariff structure is user-friendly, with online self-calculation for property-based charges and bill payment possible through banks and kiosks in accessible locations. Indore set a tariff structure valid until 2010 that will enable the municipality to make long-term plans for revenue improvement, and that is open to public scrutiny. While the absence of data makes it difficult to track whether intentions have been met, and whether local conditions have been taken into account adequately, overall the subsidies for water and sanitation are complex and do not meet their equity objectives.
The Significance of Tariff Structure
In the absence of effective metering, the quality of data is weak, so that virtually all Indian cities apply fixed charges, based either on the diameter of the connection, or the assessed value or size of the dwelling. However, increasingly there is a mix of fixed and volumetric tariffs for water supply, and this is the case in 19 of the 23 cities included in the sample for this study. In some of the metropolitan cities, such as Bengaluru, Chennai, and Delhi, increasing block tariffs are common.
Fixed charges remain common practice, on the assumption that they generate revenue roughly equal to what volumetric tariffs would have done. However, this is rarely the case since fixed tariffs are mostly based on plot size or property tax rates, rather than household consumption or ability to pay. This places further constraints on revenue, as property tax assessments have not been updated in many Indian cities, and fixed charges rarely reflect inflation in the costs of delivering the service.
The numbers tell a powerful story on the implications of fixed charges. In Ludhiana, households with plot sizes of 50 to 125 square yards consume 30 kl per month on average, yet they are exempted from water charges. If these consumers had meters and were paying the volumetric tariff of Rs. 3.50 per kl, they would pay Rs. 105 per month. Pune
and Dehradun use fixed charges based on the annual rental value (ARV) of properties. Registered properties in Pune are charged between Rs. 75 to Rs. 208 per month and in Dehradun bills range from Rs. 80.50 to Rs. 172.50. Where large numbers of customers (like 40 percent of households in Dehradun) are not registered for property tax, substantial revenue losses occur. On the other hand, Pune Municipal Corporation has an updated property tax register, which has generated enough revenue to create an operating surplus despite a high level of NRW and low collection efficiency.
Industrial tariffs are generally higher than domestic ones, sometimes six or seven times higher. In Pune, for example, the domestic metered rate is Rs. 3 per kl against Rs. 21 per kl for nondomestic metered consumption. In Hyderabad, consumption up to 15 kl is available at Rs. 6 per kl, while general industries pay Rs. 35 per kl and water-intensive industries Rs. 60 per kl. In the light of these charges, bulk consumers often switch to alternative water sources if they become available. When this happens, public service providers lose substantial revenue and this can affect the recovery of O&M costs for the service as a whole.
Insights into the fixed charge tariff structures can be obtained by comparing what customers with unmetered and metered connections pay for the same monthly consumption, in the
Select Experiences in Indian Cities | Tariffs and Cost Recovery

12 Cost Recovery in Urban Water Services
same city—assuming both systems are in operation (see Table 6). Assuming that a typical household consumes 20 kl per month (130 lpcd), the analysis shows that Ludhiana charges more for unmetered connections (Rs. 105–140 per month per connection) than for metered ones (Rs. 76 per month per connection). The same is true in Pune, which charges Rs. 75–Rs. 208 per month per connection for unmetered connections, and Rs. 60 per month for metered ones.
Generally, households with metered connections pay less, but they pay for what they use, whereas fixed charges result in huge wastage because people lack the incentive to contain their consumption. This wastage is not captured accurately
8 For ½” connection on pro-rata basis.9 Kochi Municipal Corporation.10 Range based on frequency of water supply (once/twice a day).11 For regular domestic connection, while rates for below the poverty line (BPL) households are Rs. 50/month.
Select Experiences in Indian Cities | Tariffs and Cost Recovery
in the flat rate. Obviously then, having fixed charges is not good for conservation, but less obviously, yet significantly, having meters reduces monthly bills. If these good practices form part of a systematic program of metering, they can also help to increase the utilities’ revenues by increasing the number of households with a legal and registered connection, which is metered and therefore takes full account of the actual volumes of water consumed.
Table 6 shows that only in a few cities are charges for metered and unmetered connections broadly similar. The widespread use of unmetered connections is a significant barrier both to resource conservation and the recovery of O&M costs.
Minimum Fixed Charge per Month (in Rupees)
73.258
60–120
No fixed charge connections
60
100
50
50/tap/month
80.50–172.5
No fixed charge connections
160
120–360
Water supplied through standposts paid by KMC9
Free for domestic consumers
105–140
12.5% of ARV
12.5% of ARV
75–350
67.5–9010
75–208
40–120
30
80
8011
City
Ahmedabad
Amritsar
Bengaluru
Bhopal
Chandigarh
Chennai
Coimbatore
Dehradun
Hyderabad
Indore
Jamshedpur
Kochi
Kolkata
Ludhiana
Mathura
Mumbai
Nagpur
Nasik
Pune
Rajkot
Varanasi
Vijaywada
Vishakhapatnam
Volumetric charge for 20 kl Consumption per Month (in Rupees)
60
64
156
70
26.25
150
3 kl free +59.5
No volumetric charge for domestic consumers
130 + 190 minimum monthly charge
240
158
50 + 2 minimum monthly charge
Free for domestic consumers
76
No metered connections
45
115
70
60
240
40
240.25
80
TABLE 6: EqUIVALENCE BETWEEN TARIFF RATES FOR METERED AND UNMETERED CONNECTIONS
Particulars
www.wsp.org 13
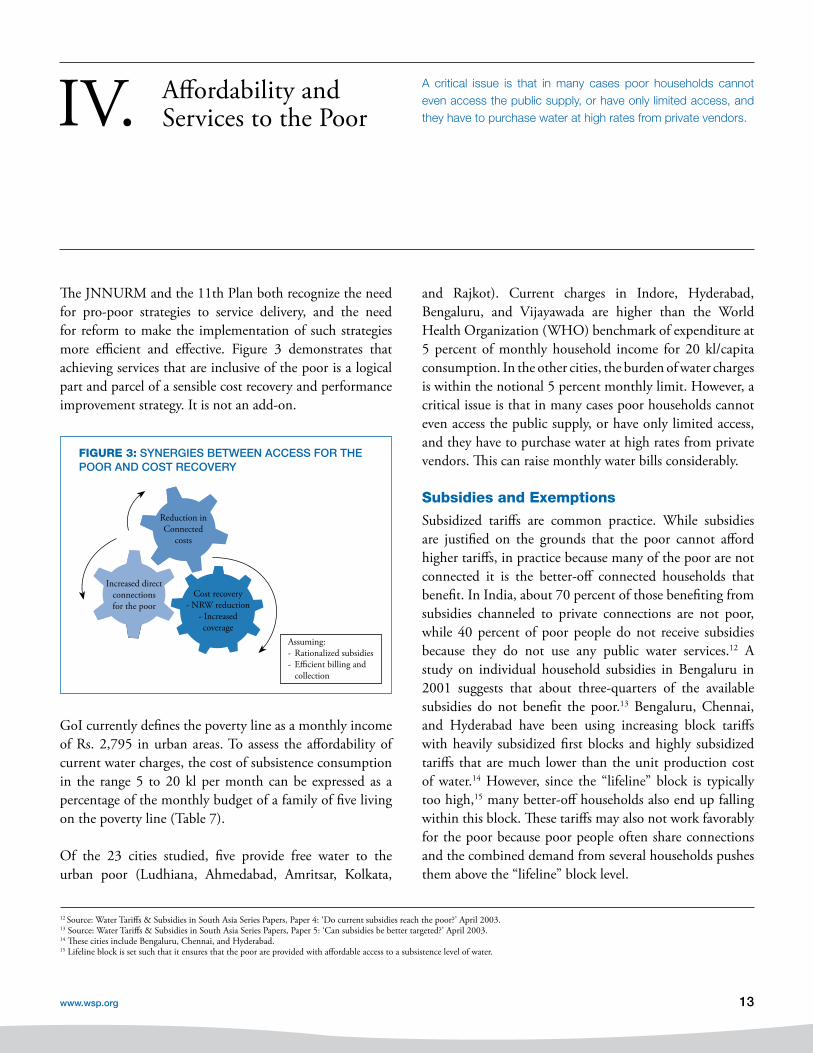
The JNNURM and the 11th Plan both recognize the need for pro-poor strategies to service delivery, and the need for reform to make the implementation of such strategies more efficient and effective. Figure 3 demonstrates that achieving services that are inclusive of the poor is a logical part and parcel of a sensible cost recovery and performance improvement strategy. It is not an add-on.
IV. Affordability and Services to the Poor
and Rajkot). Current charges in Indore, Hyderabad, Bengaluru, and Vijayawada are higher than the World Health Organization (WHO) benchmark of expenditure at 5 percent of monthly household income for 20 kl/capita consumption. In the other cities, the burden of water charges is within the notional 5 percent monthly limit. However, a critical issue is that in many cases poor households cannot even access the public supply, or have only limited access, and they have to purchase water at high rates from private vendors. This can raise monthly water bills considerably.
Subsidies and Exemptions
Subsidized tariffs are common practice. While subsidies are justified on the grounds that the poor cannot afford higher tariffs, in practice because many of the poor are not connected it is the better-off connected households that benefit. In India, about 70 percent of those benefiting from subsidies channeled to private connections are not poor, while 40 percent of poor people do not receive subsidies because they do not use any public water services.12 A study on individual household subsidies in Bengaluru in 2001 suggests that about three-quarters of the available subsidies do not benefit the poor.13 Bengaluru, Chennai, and Hyderabad have been using increasing block tariffs with heavily subsidized first blocks and highly subsidized tariffs that are much lower than the unit production cost of water.14 However, since the “lifeline” block is typically too high,15 many better-off households also end up falling within this block. These tariffs may also not work favorably for the poor because poor people often share connections and the combined demand from several households pushes them above the “lifeline” block level.
FIGURE 3: SyNERGIES BETWEEN ACCESS FOR THE POOR AND COST RECOVERy
GoI currently defines the poverty line as a monthly income of Rs. 2,795 in urban areas. To assess the affordability of current water charges, the cost of subsistence consumption in the range 5 to 20 kl per month can be expressed as a percentage of the monthly budget of a family of five living on the poverty line (Table 7).
Of the 23 cities studied, five provide free water to the urban poor (Ludhiana, Ahmedabad, Amritsar, Kolkata,
12 Source: Water Tariffs & Subsidies in South Asia Series Papers, Paper 4: ‘Do current subsidies reach the poor?’ April 2003.13 Source: Water Tariffs & Subsidies in South Asia Series Papers, Paper 5: ‘Can subsidies be better targeted?’ April 2003.14 These cities include Bengaluru, Chennai, and Hyderabad.15 Lifeline block is set such that it ensures that the poor are provided with affordable access to a subsistence level of water.
A critical issue is that in many cases poor households cannot even access the public supply, or have only limited access, and they have to purchase water at high rates from private vendors.
Assuming:- Rationalized subsidies- Efficient billing and collection
Reduction in Connected
costs
Increased direct connections for the poor
Cost recovery- NRW reduction
- Increased coverage

14 Cost Recovery in Urban Water Services
A number of cities offer full exemptions from user charges to poor customers. Dehradun, for example, has a fixed charge water tax with an exemption for people whose property tax rate is assessed at less than Rs. 360. However, anyone (rich or poor) who buys a house connection becomes subject to a basic monthly charge of Rs. 75. There is, therefore, a disincentive to taking a house connection, especially for those on low incomes. Chandigarh charges a fixed charge of Rs. 100 per month per dwelling unit for poor households with a house connection, but average monthly bills for nonpoor households with meters are only Rs. 79 for consumption of 30 KL water. In Pune, the tariff for poor households is Rs. 30 per month while other domestic consumers typically pay Rs. 75–Rs. 208. Interestingly, the poor households in Pune enjoy not only a lower tariff but a better level of service than others since poor settlements are mostly in low-lying areas were water pressure is higher and the supply operates for more hours per day.
Ludhiana is an unusual case. Here, the Government of Punjab grants complete exemption from water and sewerage charges for plots of 125 square yards (sq yd) or less. Since most poor households typically occupy plots no more than 40 sq yd in area,16 this exemption benefits not merely the poor but also a wide range of better-off consumers. Most poor families do not have house connections and were already using free standpost and tanker supplies before the exemption came into effect. Following the exemption, the poor continue to receive an inadequate service, without access to house connections.
The Costs of Connection
Connection charges show significant variation across the cities. High costs can inhibit access to the poor. A snapshot study for WSP by the Administrative Staff College of India (ASCI) in 2008 showed that on average Indian cities charge Rs. 1,000–Rs. 1,200 for a new connection, and that this mostly makes it difficult for poor people to access the service.17 Internationally, governments have also faced this problem, and there is now consensus that good practice is to have transparent and direct subsidies to poor households to
help them meet connection costs and some portion of their water bill. In this way, the utility can charge commercially appropriate rates for connections and water services without excluding the poor. The data suggests that there is substantial unexploited cost recovery. The fee charged by the 23 service providers for a new house connection is Rs. 2,594 on average while associated network expansion costs are three or four times higher, typically Rs. 7,500 to Rs. 10,000. Only Pune has a comparable connection fee, at Rs. 8,541, followed by Vijayawada at Rs. 5,500 and Dehradun at Rs. 4,090. Twelve cities have a connection charge between Rs. 1,000 and 3,000 while the remaining eight charge less than Rs. 1,000. The subsidies on connection charges (where provided) usually do not reach the poor, due to various other entry barriers including procedural complexities and documentation requirements. Only a few of the 23 cities currently offer assistance with connection charges. For instance, Vijayawada and Hyderabad have simplified procedures and allow payment in installments, which seems to have offered a pragmatic option that benefited poor customers.
Standposts
Nearly all the 23 cities provide free water through standposts for the benefit of poor residents, but find it difficult to ensure that only the poor use them. For example, in Kochi, the Kerala Water Authority (KWA) acknowledges that there is widespread exploitation of standposts by commercial users. In Hyderabad, free water is supplied via standposts and handpumps but there is no subsidized rate for the poor within the regular tariff. This discourages poor families from taking house connections, and partly explains the high number of illegal connections in poor areas. In Pune, more than 80 percent of slum households receive free standpost supplies, but another 12 percent formally registered as standpost users pay a fixed charge of Rs. 30 per month.
These examples highlight a lack of effectively targeted measures to help poor consumers. Either subsidies benefit too many nonpoor users, or there is free provision for the poor but with a very low level of service and few incentives
16 Average holding of poor people/slum dwellers is considered between 25 to 40 sq m.17 Unpublished ASCI note, 2008.
Select Experiences in Indian Cities | Affordability and Services to the Poor

www.wsp.org 15
Select Experiences in Indian Cities | Affordability and Services to the Poor
to take a higher level of service. The experience in countries like Chile and South Africa may be instructive here. In both countries, services are fully costed, but fiscal transfers are used to reimburse either the service provider or poor households and thereby make the services affordable to the poor. Currently none of the 23 Indian cities in our study and their state governments operate such a system. As a result, poor people do not receive adequate services, while service providers are missing an opportunity to increase revenue though expanding the number of house connections.
Coping Costs
An additional burden for all service users is the coping costs arising from inadequate public supplies. For those with house connections, and who have the resources, this usually
means installing ground or overhead storage tanks with pumps to cope with intermittent and low-pressure supplies, or developing alternative supplies such as tubewells. Poor consumers who have no taps and cannot afford tanks or their own private supply incur other costs by buying water from private vendors (usually at very high rates compared to municipal water) and spending long periods queuing at public taps. It was not possible to work out coping costs under this study and there are not many studies on this aspect. It was earlier estimated that households with private connections in Dehradun and Delhi bore a coping cost of Rs. 3.5 per kl against consumption charges of Rs. 1 per kl in Delhi and Rs. 3 per kl in Dehradun. During this study, discussions with users in Dehradun indicated that current coping costs are in the order of Rs. 200 to Rs. 250 per month compared to water charges of Rs. 85.

16 Cost Recovery in Urban Water Services
Select Experiences in Indian Cities | Affordability and Services to the Poor
City
W
ater
tar
iff
Wat
er t
ariff
W
ater
cha
rge
Wat
er c
harg
e F
ixed
cha
rge/
W
ater
cha
rge
Sew
erag
e S
ewer
age
fo
r 5
kl
for
20 k
l fo
r 5
kl a
s a
for
20 k
l as
a m
ont
h fo
r un
met
ered
ch
arg
e/ce
ss
char
ge
as %
cons
ump
tion
cons
ump
tion
% o
f m
ont
hly
%
of
mo
nthl
y
conn
ectio
n as
of
mo
nthl
y
bud
get
b
udg
et
%
of
mo
nthl
y
bud
get
b
udg
et
Ahm
edab
ad
Fr
ee w
ater
for
the
poo
r
Am
rits
ar
Fr
ee w
ater
for
the
poo
r th
roug
h p
ublic
tap
s
Ben
gal
uru
30
156
1%
19%
Bho
pal
17
.5
70
1%
3%
60
2%
Cha
ndig
arh
M
CC
is n
ow c
onve
rtin
g fix
ed c
harg
e co
nnec
tions
to
the
poo
r in
to m
eter
ed c
onne
ctio
ns
10
0 4%
5/
WC
/mon
th
0%
8.
75
26.2
5 0%
1%
Che
nnai
12
.5
150
0%
5%
50
2%
Co
imb
ato
re
3 kl
free
+ 7
3
kl fr
ee +
59.
5 0%
2%
Deh
rad
un
N
o m
eter
ing
in d
omes
tic s
ecto
r
116.
9118
3%
15
19
1%
Hyd
erab
ad
120
220
4%
8%
No
unm
eter
ed c
onne
ctio
ns
35%
of w
ater
sup
ply
cha
rges
Ind
ore
No
met
ered
con
nect
ions
in s
lum
s
170
6%
N
o ch
arge
Jam
shed
pur
No
met
ered
con
nect
ions
in p
oor
hous
ehol
ds
12
0 4%
Ko
chi
12
52
0%
2%
Thro
ugh
stan
dp
osts
pai
d
b
y m
unic
ipal
ity
No
char
ge
Ko
lkat
a
No
wat
er c
harg
e fo
r d
omes
tic u
sers
Lud
hian
a N
o m
eter
ed c
onne
ctio
ns in
slu
ms
Exe
mp
t up
to
125
sq y
ard
s E
xem
pt
up t
o 12
5 sq
. yar
ds
Par
ticul
ars
TAB
LE
7:
CH
AR
GE
FO
R S
UB
SIS
TE
NC
E L
EV
EL
CO
NS
UM
PT
ION
CO
MP
AR
ED
WIT
H M
ON
TH
Ly B
UD
GE
T F
OR
PE
OP
LE L
IVIN
G O
N T
HE
PO
VE
RT
y L
INE
18 B
ased
on
aver
age
of A
RV-b
ased
slab
rate
s for
wat
er c
harg
es fo
r reg
ister
ed d
omes
tic u
sers
.19
Bas
ed o
n av
erag
e of
ARV
-bas
ed sl
ab ra
tes f
or se
wer
age
char
ges f
or re
giste
red
dom
estic
use
rs.
Met
ered
Wat
er T
ariff
s U
nmet
ered
Wat
er T
ariff
s S
ewer
age
Tari
ffs

www.wsp.org 17
The previous sections discussed various dimensions of cost recovery, both through efficiency improvements and through restructuring tariffs. The analysis in 23 cities showed that some service providers (ULBs or utilities) have been introducing initiatives to get closer to some of these objectives. However, overall water and sanitation remains one of the weakest public service sectors in urban India, and its prospects for sustainable improvements are curbed by a lack of sustainable finance including cost recovery.
It is for this reason that the JNNURM guidelines require municipal service providers to reform the framework of user charges for water and sanitation services. This report is concerned with key elements of the strategy required to put services on a financially sustainable footing.
A Strategic and Inclusive Process
Perhaps no point is more vital than the need for a systemic set of reforms to change the rules of sector governance. This includes increasing tariffs to ensure that pricing reflects the cost of water, and being inclusive, that is, putting in place social policy measures to address the specific issues of access for the poor. Within such a framework, a multi-staged process of financial performance improvement and revenue-generation is needed to take reforms forward. This requires a combination of ‘quick win’ interventions, along with long-term shifts in management and planning systems.
No systematic change can be sufficiently coherent unless it starts with a detailed assessment of the current status of services, both operationally and financially. In this respect, the analysis shows the absence of data as a fundamental weakness in the water and sanitation sector in India. A review could highlight the scale of this problem, and the key steps required to change it in line with the MoUD initiative on Service Level Benchmarking and, in particular,
V. Implications
for Information System Improvement Plans. It also provides an opportunity to begin estimating the actual costs of services, from production or sourcing of water, transmission through to distribution, and understand variations between zones or regions and user groups. Figure 4 summarizes the links between such an assessment phase and the subsequent steps to introduce operational efficiency and performance improvements.
To ensure sustained cost recovery and efficient service delivery, decision makers need to make investment choices that are financially and operationally sustainable. A financial model provides the basis for longer term strategic planning in order to match engineering designs and costs with financing and customers’ willingness to pay. This brings transparency to the choices made with respect to improvement programs, available financing (including subsidies), and cost recovery from tariffs. Such financial models (business plans) can be used as the basis for applications for financing or as part of the regulatory process to set service standards and tariffs.
Significant revenue potential exists for service providers by just bringing about improvements in operational efficiency and without necessarily increasing the levels of tariffs.
FIGURE 4: IMPROVING OPERATING PRACTICES
Understand the present situation
1Estimate
cost of service provision
2 Measure revenue
improvement potential from
operational factors
3
Key parameters to analyze, include:- Coverage
- Production/consumption
- Nonrevenue water
- Metering
- Costs and staffing
- Billing and collection
- Financial health
- Equity
Estimate marginal cost of each dimension of service
Prepare a revenue performance improvement plan. Areas to focus on are:- Improving billing and collection
- Increasing customer base
- Reducing nonrevenue water

18 Cost Recovery in Urban Water Services
Operational Improvements
Significant revenue potential exists for service providers by just bringing about improvements in operational efficiency and without necessarily increasing the levels of tariffs. This could provide smaller ‘quick wins’, such as increased coverage, improving billing, meter reading, and collection. To the extent these translate into perceived improvements in services, it creates a more conducive environment for initiating tariff revisions.
Increasing service coverage. In many Indian cities, up to 50 percent of potential customers do not appear on the service provider’s database. Reasons include administrative inefficiency in tracing and registering all service users and operational policy that does not charge different users separately within buildings under multiple occupancy. Providers may also be unable to serve some households due to network limitations, and some households may be reluctant to apply for connections, or opt for illegal connections.
The consumer base could be expanded through a mix of improved administration, service delivery improvements, and the use of incentives. Clearly, surveys are required to identify existing service users, while regularization of illegal connections opens the way for increasing the number of paying customers. Separate metered connections to each user within buildings having multiple occupancy would make estimates more accurate and provide stronger incentives for them to pay.
Reducing water losses and NRW. In spite of its potential benefits, NRW reduction is not easy to implement since it requires a far greater attention to technical issues such as pipe laying, pipe joints, pressure testing, quality of meters, and improved management practices. For instance, to eliminate illegal connections that contribute to NRW requires that service providers have autonomy and discipline, and are made accountable to keep illegal connections under control.
NRW is a result of technical and operational inefficiency. Technical losses are a result of poor capital maintenance and weak incentives for water conservation. Commercial losses include less than 100 percent billing, distribution of free water (public standposts as well as illegal connections), and
lack of willingness of consumers to pay because the service is so bad. Reduction in NRW not only leads to revenue enhancement as free water starts getting sold at price but also to saving of water which translates into less need for water source augmentation and new water supply infrastructure.
Improving metering, billing, and collection. In the case studies, failure to collect the amount billed against services has resulted in revenue losses of up to 50 percent. Inefficiencies in billing and collection also carry opportunity cost, such as increased interest costs on overdrafts.
A starting point for improving billing and collection is to review the consumer database and current billing processes. This may reveal a variety of options, such as the need for a comprehensive survey of household connections, outsourcing the service through incentive-based contracts, consumer-friendly billing and payment options, and applying penalties for nonpayment.
Working meters are important for the effective implementation of volumetric tariffs as also for sustainable NRW management. Measuring the exact volume of NRW requires that both flow meters at production points and
Select Experiences in Indian Cities | Implications

www.wsp.org 19
20 Word Bank. 2006. Bridging the Gap between Water Supply and Infrastructure Services. Delhi. 21 WSP. 2010. 24x7 Water Supply is Achievable! The Karnataka Urban Water Sector Improvement Project.
consumer meters are in place, and are running. The study found that progress is occurring on this front: Bengaluru, Chandigarh, Chennai, Dehradun, Hyderabad, Jamshedpur, and Pune are among the few cities where the volume of water produced is now being measured with the help of flow meters.
Reforming Tariffs through a Credible Process
Increasing tariffs is politically difficult, with risks of consumer backlash. The message from the analysis is that part of this risk can be mitigated by becoming more efficient in other aspects of revenue management.
In fact, the findings of willingness to pay surveys show that households and businesses are willing to pay much more for a better service. Many are actually spending large amounts to develop and operate substitutes to cope with the substandard service provided by public utilities.20 Having a good communications strategy is key, since the rationale for tariff reforms needs to be set out clearly and agreement reached between the main stakeholders. Second, a concerted focus on viable service improvements by investing in improved efficiency makes it more legitimate to raise the prospect of tariff increases. In the latter case, the biggest opportunity open to the sector today is the move to 24x7, where experience shows that moving to 24x7 not only improves the quality of service but also leads to lower household bills and reduced water demand.21
The study showed that tariff structures are overly complex. A key challenge would therefore be to make tariffs understandable for customers, and to avoid complex subsidization rules and processes. Instead, subsidies need to be well targeted and transparent.
Build Supportive Institutions
In a typical urban water department in India, the roles of policy making, regulation, and service delivery are vested in a single entity—the ULB or the state-level Public Health Engineering Department. There are many overlapping roles
and responsibilities, a lack of clarity, lack of autonomy, lack of accountability, and multiple/conflicting objectives. In such an environment, it becomes impossible to hold underperformers to account.
The 74th Amendment provides the ULB with the responsibility to organize the delivery of water services and to set tariffs. There can be no financial empowerment, however, without clear assignments of both expenditure authority (for example, services such as water and sanitation and land management) and revenue-raising capacity, while setting clear expectations for improving ULB and service providers’ own revenue.
This will also require regulatory reform, to ensure independent setting, or reviews of requests for adjustment of water supply and sanitation (WSS) tariff to meet policy objectives in terms of service deliverables such as financial, economic, equity and simplicity objectives, and independent monitoring of service provider performance. Once again, the need for credible baseline data becomes important, to enable regulatory structures to monitor the performance of WSS service. It is unlikely though that a uniform approach would be feasible in India, and considerable state engagement would be needed to ensure that regulatory arrangements are suitable to their contexts. Summary
Water services in more than half of the 23 cities analyzed here are suffering substantial operational losses. None of these ULBS met their revenue potential, and most of them fail to cover their operational costs by up to 80 percent.
It is true that low tariffs are a reason for this: tariffs are mostly based on estimates rather than quantified costs and margins. However, the study draws attention to the fact that a large part of cost recovery concerns operational factors such as low coverage of registered connections, high levels of leakage and NRW, poor metering practices, and inefficient billing and collection.
Select Experiences in Indian Cities | Implications

20 Cost Recovery in Urban Water Services
What the study shows clearly is that (a) many of the solutions require improved management and operations; and (b) there is a need for improved fiscal and tariff discipline. Figure 5 captures this main message. The report has alluded to a number of MoUD initiatives that are moving the sector in the right direction, such as the Service Level Benchmarking initiative and associated Information System Improvement Plans and Service Improvement
FIGURE 5. THE MAIN MESSAGE IN A NUTSHELL
Address operational inefficiencies
Undertake tariff reform
- Develop rational basis for tariff calculations
- Demonstrated efficiency gains create conducive environment
for tariff reforms
Address cost recovery
reforms in context of
other reform options
and performance
improvement
Plans. It is clear from the analysis that cost recovery is unlikely if it is approached in isolation from broader reforms to improve governance, management, service delivery, and fiscal/tariff discipline. It is not merely about tariff increases; in fact, a focus on operational efficiency reduces upfront political resistance to cost recovery, and shifts the emphasis to improved services, inclusive of poor people.
Select Experiences in Indian Cities | Implications

www.wsp.org 21
ADB (Asian Development Bank). 2007. Benchmarking and Data Book of Water Utilities in India. Manila.
Boland, J. 1993. Pricing Urban Water: Principles and Compromises. Water Resource Update. Universities Council on Water Resource, Issue No. 92 (Summer 1993), pp. 7–10.
Whittington, D., J. Boland, and V. Foster. 2002. Understanding the Basics. Paper 1: Water Tariffs and
Subsidies in South Asia, World Bank-Water and Sanitation Program and Public-Private Infrastructure Advisory Facility. Washington (www.wsp.org, www.ppiaf.org).
World Bank. 2006. Bridging the Gap between Water Supply and Infrastructure Services. Delhi.
WSP. 2010. 24x7 Water Supply is Achievable! The Karnataka Urban Water Sector Improvement Project (unpublished).
References
Select Experiences in Indian Cities | References


