cost volume profit analysis · cost volume profit analysis a potent tool for managers to aid...
TRANSCRIPT

Cost Volume Profit analysis
A potent tool for managers to aid
decision making.

Cost drivers
• Identify activities and determine measures
of output for each activity.
• Then relate each output measure to the
resources necessary to produce it.
• Any output measure that causes cost is
called a cost driver.
For example
• Activity: spare parts delivery to production
shed
• Measure: number /Weight of parts received
• Drives: use of moving trolley/its fuel
costs

Cost drivers
• Research staff salaries- number of new
products proposals.
• Salaries of product engineers- complexicity
of new product.
• Labour wages- hours
• Supervisor salary- number supervised
• Depreciationof machinery: machine hours
Cost behaviour
• Understanding cost drivers and their influences on cost behavior is vital for CVP analysis.
• The effect of changes in environment,sales volume ,costs and thereby profitablity needs to addressed in all decisions.
• Breakeven analysis is therefore very vital in all business.
Variable viz fixed
• Variable costs change with variations in
their cost drivers but fixed costs don’t.
As Cost driver level changes
• Variable cost per unit is fixed
• Fixed costs are fixed but per unit varies..

concept
• This is a study of relationships between costs and
volume and their impact on profits.
• Volume refers to volume of activities either in
production, sales, process orders,number of
bills,number of admissions etc.
• It seeks to to determine the interrelationships of
the activity,costs,sales prices,and sales mix to
earnings.

Concepts…..
• The effect on profits due to changes in fixed costs,/variable costs/sales volume/sales prices/sales mix.
• Such a comprehensive dissection allows the manager to determine Relative profitability by examining incremental effect on CVP.
• Thus optimal utilization of resources is made possible.

equations
S= selling price per unit
V= variable cost per unit
F= fixed cost
P= operating profit
X= Number of units
P = (S-V)X – F.
S-V = Contribution margin = C

Incremental analysis
• The backbone of management accounting is
incremental analysis.
It must be understood that variable costs cause
incremental changes in the system while fixed
costs do not cause changes in the system within a
given cost range.
Hence for all practical purposes we use variable
costing with incremental analysis for decision
making

Contribution margin
C = F+P
C= S-V
C-F=P/L
This is relevant in ascertaining the breakeven
point.For this we need to know P/V ratio
and variable cost ratios.

P/V Ratio
• P/V = Contribution per unit divided by
selling price per unit
• Sales revenue minus variable costs divided
by sales revenue
• F+P divided Sales revenue
• Change in contribution divided by change
in sales.
Using p/v ratio
• Helps to eliminate non profit making lines
by indicating low p/v ratios or low volume.
• Helps in finding breakeven sales.

Variable cost ratio
• It is variable cost per unit in relation to the
selling price.
• 1 – P/V ratio = Variable cost ratio.
Break even analysis
• B-E point establishes the action volume which evenly breaks costs and revenues .
• It is defined as the output level where the profits are zero.
• It is the point where Total revenues = Total Costs
• Thus it is the minimum level of operations that the unit must sustain to avoid a loss.
Crisis point
• It is therefore understandable that the firm
has covered its variable and fixed costs i.e
all costs at this level.
• Indicates the level from where profit/loss
commences
• Calculated with formula/ through graphs
B-E formula
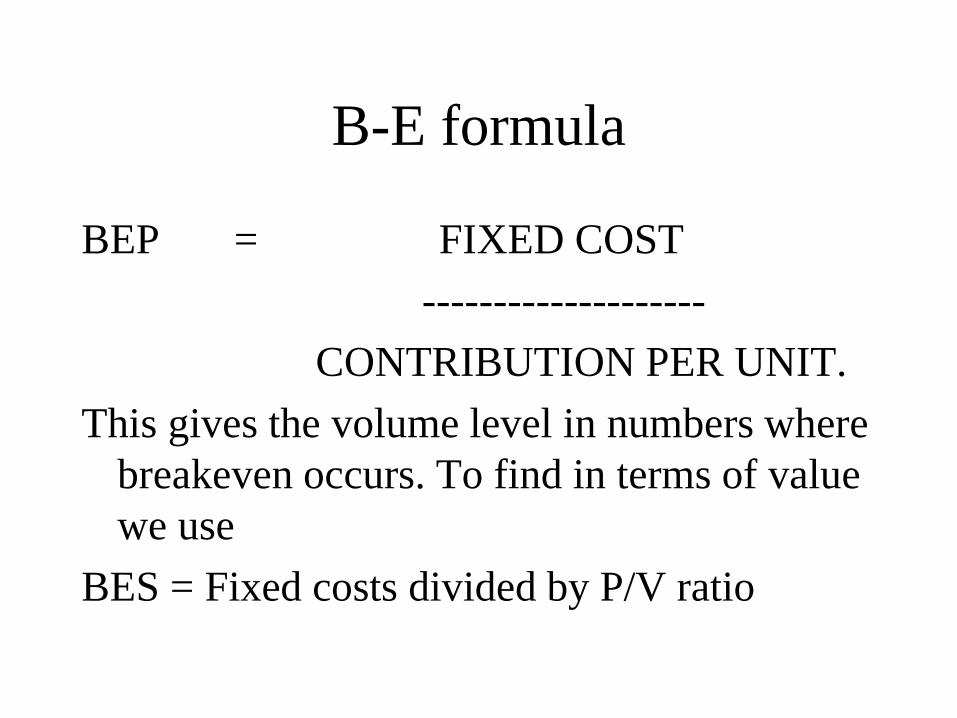
BEP = FIXED COST
--------------------
CONTRIBUTION PER UNIT.
This gives the volume level in numbers where
breakeven occurs. To find in terms of value
we use
BES = Fixed costs divided by P/V ratio

Margin of safety
• Difference between actual sales and
breakeven sales is called MOS.
• Allows the manager to know where he
stands from the BEP.

Marginal costing
• Allows net income to be measured as a
function of only one variable – sales volume
• Known as Marginal costing in UK, Direct
costing in USA now commonly referred to
as Variable Costing

MC defined
A principle whereby variable costs are charged to
cost units and the fixed cost attributable to the
relevant period is written off in full against the
contribution of that period.
Hence it represents the added costs,the additional
costs of production.These are the out of pocket
outlays which would not be incurred if a particular
product were eliminated.
Absorption costing
• Also called full costing as it absorbs or
includes both fixed and vriable costs. Also
called cost attach.
Conventional pattern
Profit= Sales Volume (selling price-full cost
price)

Absorption viz marginal
Cooper India is a single product firm.
The relevant data as follows.
Sales 20000 units @ 15 Rs. Each unit
Manufacturing costs:
Variable costs Rs.8 per unit,Fixed costs are rs40000.
Non manufacturing costs
Sales commission 5% of sales,distribution expenses 1 re per unit and fixed admin costs 50000Rs.Considering tax at 40 % show income statements in full and marginal costing formats.

As per Marginal costing
• Sales 20000x15 =3,00,000
• - variable cost@8 =1,60,000
• -sales commis@5% = 15,000
• -distri exp@1/- = 20,000
• ------------------------------------------------
• Contribution = 1,05,000
• -fixed costs = 50000
• Profit before tax = 55000
• Less tax@40% = 22000
• ------------------------------------------------
• Profit after tax = 33000