council improvement proposal - ipart€¦ · many of the recommendations contained in the...
TRANSCRIPT

Template 2
Council Improvement Proposal
(Existing structure)

Getting started . . .
Before you commence this template, please check the following:
You have chosen the correct template – only councils that have sufficient scale and capacity and who do
not intend to merge or become a Rural Council should complete this template (Template 2)
You have obtained a copy of the guidance material for Template 2 and instructions for completing each
question
You have completed the self-assessment of your current performance, using the tool provided
You have completed any supporting material and prepared attachments for your Proposal as PDF
documents. Please limit the number of attachments and ensure they are directly relevant to your proposal.
Specific references to the relevant page and/or paragraph in the attachments should also be included.
Your Proposal has been endorsed by a resolution of your Council.

Council name: Botany Bay City Council
Date of Council resolution endorsing this submission:
24 June 2015
1.1 Executive Summary
Provide a summary (up to 500 words) of the key points of your Proposal including current performance, the
issues facing your council and your planned improvement strategies and outcomes.
The City of Botany Bay provides this Council Improvement Proposal in response to the NSW Government’s Fit for the Future local government reform process.
Council had long advocated for a strong, effective and sustainable local government sector in NSW and has previously indicated its support for many of the recommendations contained in the Independent Local Government Panel’s (the Panel) Report ‘Revitalising Local Government’.
However we are strongly opposed to the recommendations of the Panel in relation to structural reform, particularly as they relate to the City of Botany Bay
We note that the Fit for the Future process has been designed to support voluntary council mergers and we welcome the State Government’s support to councils that need to merge in order to overcome structural and financial difficulties.
The City of Botany Bay rejects both the theory that the strategic capacity and economic viability of local government is related to its scale and the assessment approach adopted by the Fit for the Future process and IPART. This theory is contradicted by substantive evidence, data and by experience.
It is Council’s view that improvements to governance are significantly more important to the strategic capacity of local government than any
1

other change. In this regard, we believe we lead the way with a directly elected Mayor and single member wards, both of which maximise accountability and encourage decision making in the broad interests of the entire population.
Despite our views on the process, the City of Botany Bay has explored options in line with the Panel’s recommendations. Our analysis indicates that none of these alternatives offer an improved outcome for Council or our community, when assessed against our current position. We have not pursued the option of a Joint Organisation, given the NSW Government’s stated position on this for metropolitan councils.
Our self-assessment indicates that we currently (2013/2014) meet 4 out of the 7 benchmarks (we consider that despite being debt free, we meet this benchmark). Our improvement program has been developed by our Fit for the Future Committee and endorsed by Council. Financial modeling, including updated forecasting, has been undertaken by Independent consultants, Morrison Low.
Our Improvement program provides the strategies and means by which we will address our performance, and meet, the Fit for the Future benchmarks.
Our Council Improvement Proposal demonstrates that the City of Botany Bay is fit for the future and confirms that we are:
• financially sustainable;
• efficient;
• effectively managing our infrastructure and service delivery to the community; and
• we have appropriate scale and capacity
More important than any analysis are the views of our community members and key stakeholders. Significant land owners and employers such as Sydney Airport and Orica confirm the strategic capability of the City of Botany Bay. The Property Council of NSW has rated the City of Botany Bay an “A” for our achievement of housing growth targets.
Most importantly, our community strongly supports the City of Botany Bay remaining independent. We welcome their trust and confidence in our Council and our City’s future.

1.2 Scale and Capacity
Does your council have the scale and capacity broadly consistent with the recommendations of the Independent
Local Government Review Panel?
(ie, the Panel did not recommend your council needed to merge or become a Rural Council).
Yes / No
If No, please indicate why you are not proceeding with a voluntary merger or creation of a Rural Council as
recommended by the Independent Panel and demonstrate how your council has scale and capacity (up to 500
words).
The Independent Local Government Review Panel recommended that the City of Botany Bay merge with the councils of Randwick, Sydney, Waverley and Woollahra. We strongly reject the Panel’s view that the appropriate determinant of scale is population or residential rate base. Viewed through a broader definition of scale, we consider that we have sufficient scale for the following reasons:
We have a residential population of 44,742 and support a daily population (residents, workers and visitors) of between 250,000 and 300,000.
Our City has seen unprecedented growth over the past decade with a population increase of almost 20%. Significantly, almost half of this increase has occurred over the past three years.
Our total income base equates to $64,590 million
Our City generates $9.5 billion in Gross Regional Product (GRP) representing 2% of the State’s Gross State Product (GSP). We are located within the key economic corridor identified in the NSW Government’s Metropolitan Plan.
We generate and support employment opportunities for 63,250 local jobs
1

We house centres of employment and economic activity such as the Lakes Business Park (home to over fifty companies); Westfield Eastgardens (with over 11 million customer visits annually) and more than 4,500 small business operators.
Two of the main drivers of economic activity for the State and nation are located within our City’s boundary – Sydney Airport and Port Botany. Council has productive relationships with these entities and actively supports their operations. We are the only council in our region to recognise the Port and Airport in our Local Environmental Plan (LEP).
We are firmly of the view that any proposal to merge the City of Botany Bay into a larger entity would severely impact these relationships, result in a loss of expertise and a diversion and dilution of the capacity to effectively manage and support the continued growth of these two major economic drivers to the NSW economy. Regardless of scale, it is inarguable that the City of Botany Bay demonstrates and delivers strategic capacity. This capacity is evidenced primarily by:
Our relationship with the Port and Airport
Delivery on state and federal government priorities
An ability to building community capacity
Unambiguous community support and strong stakeholder engagement
Significant experience in environmental management
We believe that the source of this capacity is not scale but our robust and strong governance. Our democratic accountability to the community is unprecedented and achieved through a popularly elected mayor and single council member wards. We have demonstrated good governance over a sustained period of time, evidenced by our long term councillor relationships with the community, openness and transparency in our decision making and the strong governance frameworks we work within. We have had no code of conduct complaints raised against councillors or senior staff and there have been no suspensions, sackings or inquiries. The Panel has produced no evidence to show that strategic capacity is a function of the size or scale of a council, nor evidence to show that councils with larger populations are more efficient or effective in providing services to local communities. Good governance is the key elements in delivering capacity. Council is proud and confident of its scale and exceptional capacity to meet the needs of our local community now and well into the future.

2. Your council’s current position
2.1 About your local government area Explain the key characteristics of your local government area, your community’s goals and priorities and the challenges you face in the future (up to 500 words).
You should reference your Community Strategic Plan and any relevant demographic data for this section.
The City of Botany Bay is located in the inner south-eastern suburbs of Sydney, about 7km south of the Sydney CBD. Our City shares its boundaries with the Sydney LGA to the north, Randwick LGA to the east and Rockdale LGA to the south. Our area includes the suburbs of Banksmeadow, Botany, Daceyville, Eastgardens, Eastlakes, Hillsdale, Mascot, Pagewood and parts of Rosebery. The City is located in the Federal seat of Kingsford-Smith and the State seats of Heffron and Maroubra. The traditional owners of our land are the Bidegal and Gadigal people of the Eora Nation. We have 44,742 residents with a median age of 37 years. Our population has seen strong growth in recent years and this population growth is expected to exceed NSW Planning projections. Our community profile reflects a city and community with a strong and proud history, rich in cultural diversity, growing and prospering, liveable and contributing to with wider community and the NSW State. ABS Statistics show that 42.1% of our residents were born overseas, with 35.8% coming from non-English speaking backgrounds. The change in our City is reflected in the SEIFA index (985) which shows significant disadvantage in the areas of Daceyville, Hillsdale and Eastlakes and greater wealth in the Eastgardens, Pagewood and Mascot precincts. 10.1% of our residents reside in social housing and the median weekly income for Botany Bay residents is $1,245, significantly below other LGAs in the region. 21.3% of our residents are under 17 years of age. 17.5% are aged between 60-84yrs and the highest proportion of residents are 35-49 years age group (22.7%) followed by 25-34 years age group (16.10%). Family households are the highest in the region (46.8%). We have the highest average household number at 2.6.
2

61.1% of residents have lived in the local area for 5 years or more, reflecting the high liveability value of our City
Our local economy is strong. The number of businesses in the City has increased from 4,452 in 2013 to 4,520 in 2014. Our City provides employment opportunities in excess of the needs of our local community, with 2.8 jobs for each employed resident. We support key state and national infrastructure such as Sydney Airport and Port Botany, and associated industries, within our boundary.
Strong and increasing development activity has seen the construction of quality medium and high density residential housing, particularly around the Mascot Station Precinct. We coordinate development activity to the value of $613 million.
Challenges we face in the future include:
Maintenance and renewal of infrastructure to meet current and future community needs
Securing affordable, accessible, integrated transport options to connect communities
Responsibly working with the Port, Airport and local industry to manage the environmental and residential amenity of our City
Land remediation and managing the environmental impact of industry
Balancing the competing needs and aspirations of the community with strong population growth and changing demographics
Delivering the outcomes agreed with our community outlined in the Community Strategic Plan in a climate of uncertainty

2.2 Key challenges and opportunities
Strengths Weaknesses Strengths
Community trust – we foster an extremely high level of trust and credibility with our community.
Political leadership - experienced, qualified and cohesive.
Organisational capacity – experienced leadership team, qualified experienced and skilled staff, flexible resourcing, excellent staff retention, diverse workforce, strong corporate governance.
Financial Sustainability – strong operating income and well managed operating expenditure, robust long term financial plan.
Positive outlook for City – excellent access to Sydney CBD, highly desirable location, sustained population growth, high level of investment and development, significant investment in infrastructure.
Continuous improvement – Sustained financial performance, organisational change initiatives, service review program, self insurance, resource sharing arrangements.
Regional collaboration – leader and active contributor in region eg SSROC programs, Sydney Metropolitan Mayors, Business Enterprise Centre.
Australian Mayoral Aviation Council – advocacy and coordination of national aviation matters on behalf of local government.
Ageing workforce – a consequence of strong staff retention and employer of choice.
Lack of specialist staff – industry wide issue in particular professions.
Asset backlog – asset management has generally occurred on and ‘as required’ basis.
Regulatory, compliance and reporting burdens.
Reliance on cash – Council ‘no debt’ policy means higher utilisation of cash assets to fund projects and infrastructure.
2
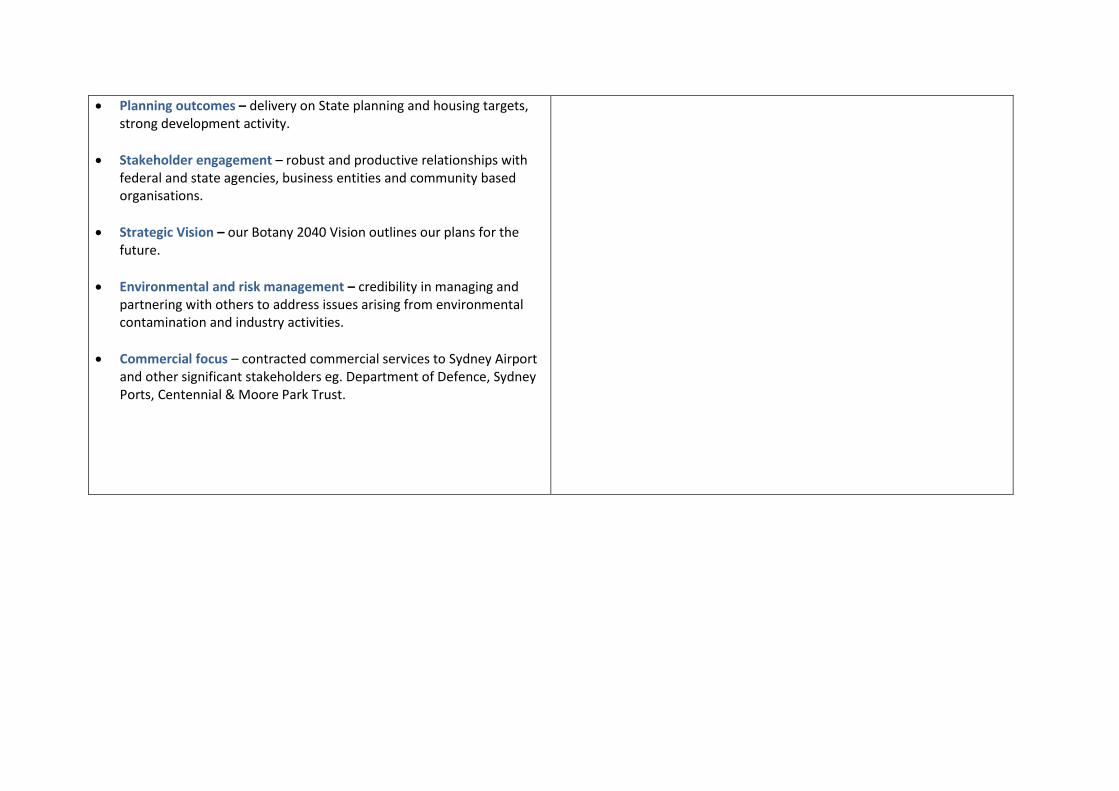
Planning outcomes – delivery on State planning and housing targets, strong development activity.
Stakeholder engagement – robust and productive relationships with federal and state agencies, business entities and community based organisations.
Strategic Vision – our Botany 2040 Vision outlines our plans for the future.
Environmental and risk management – credibility in managing and partnering with others to address issues arising from environmental contamination and industry activities.
Commercial focus – contracted commercial services to Sydney Airport and other significant stakeholders eg. Department of Defence, Sydney Ports, Centennial & Moore Park Trust.

Opportunities Threats Increased partnership with private entities.
No debt – ability to leverage borrowings.
Urban renewal – strong development activity and delivery of infrastructure.
Asset review – review existing assets and investigate potential for improved returns.
Fit for the Future – uncertainty regarding long term outlook and context following reform initiatives.
Loss of direct funding - from State and Federal agencies.
Cost shifting - from other levels of government.
External planning decisions – lack of local context and associated infrastructure provision.
Commercial contracts – non-renewal would impact financial position.
Economic downturn – impact on investment and development within the City.
2

2.3 Performance against the Fit for the Future benchmarks
Sustainability
Measure/ benchmark
2013 / 2014 performance
Achieves FFTF benchmark?
Forecast 2016 / 2017 performance
Achieves FFTF benchmark?
Operating Performance Ratio (Greater than or equal to break-even average over 3 years)
-2.7
No
1.4% Yes
Own Source Revenue Ratio (Greater than 60% average over 3 years)
71.8% Yes 71.6% Yes
Building and Infrastructure Asset Renewal Ratio (Greater than 100% average over 3 years)
62.1% No 178.4% Yes
If the Fit for the Future benchmarks are not being achieved, please indicate why. All benchmarks met
2

2.3 Performance against the Fit for the Future benchmarks
Infrastructure and service management
Measure/ benchmark
2013 /2014 performance
Achieves FFTF benchmark?
Forecast 2016 / 2017 performance
Achieves FFTF benchmark?
Infrastructure Backlog Ratio (Less than 2%)
6.93% No
2.8% No
Asset Maintenance Ratio (Greater than 100% average over 3 years)
130.3% Yes 100.0% Yes
Debt Service Ratio (Greater than 0% and less than or equal to 20% average over 3 years)
0.0% Yes 0% Yes
If the Fit for the Future benchmarks are not being achieved, please indicate why. Council’s Infrastructure backlog is decreasing and will attain benchmark of under 2% in 2017/2018. Council considers it meets the benchmark in respect of Debt Service Ratio despite being debt free
2
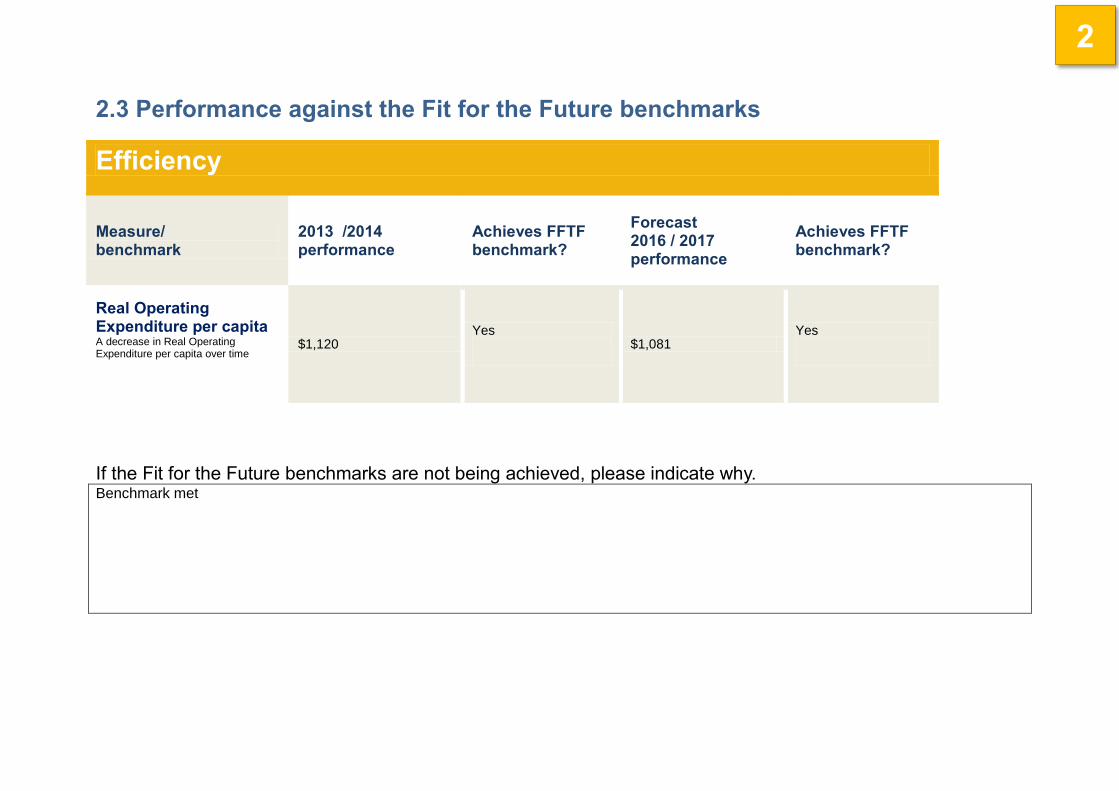
2.3 Performance against the Fit for the Future benchmarks
Efficiency
Measure/ benchmark
2013 /2014 performance
Achieves FFTF benchmark?
Forecast 2016 / 2017 performance
Achieves FFTF benchmark?
Real Operating Expenditure per capita A decrease in Real Operating Expenditure per capita over time
$1,120 Yes
$1,081 Yes
If the Fit for the Future benchmarks are not being achieved, please indicate why. Benchmark met
2
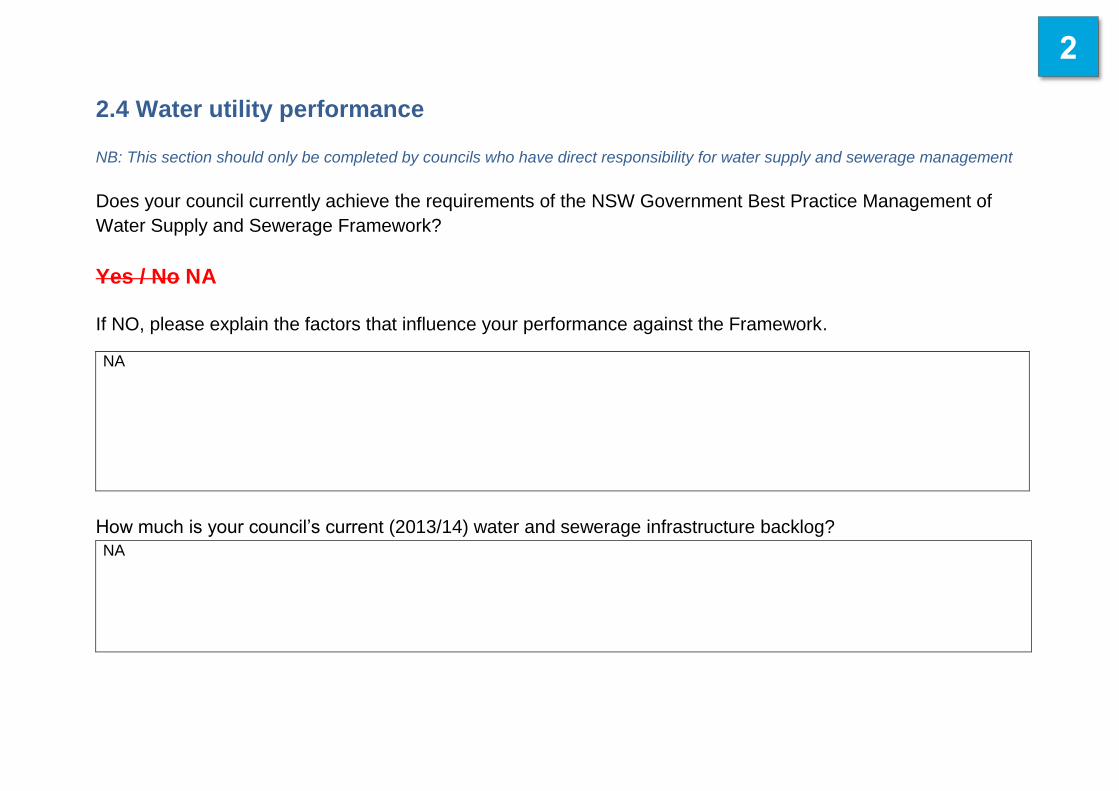
2.4 Water utility performance
NB: This section should only be completed by councils who have direct responsibility for water supply and sewerage management
Does your council currently achieve the requirements of the NSW Government Best Practice Management of
Water Supply and Sewerage Framework?
Yes / No NA
If NO, please explain the factors that influence your performance against the Framework.
NA
How much is your council’s current (2013/14) water and sewerage infrastructure backlog?
NA
2

2.4 Water utility performance
Identify any significant capital works (>$1m) proposed for your council’s water and sewer operations during the
2016-17 to 2019-20 period and any known grants or external funding to support these works.
Capital works
Proposed works Timeframe Cost Grants or external funding
NA
2

2.4 Water utility performance
Does your council currently manage its water and sewerage operations on at least a break-even basis?
Yes / No NA
If No, please explain the factors that influence your performance.
NA
2

2.4 Water utility performance
Identify some of your council’s strategies to improve the performance of its water and sewer operations in the
2016-17 to 2019-20 period.
Improvement strategies
Strategy Timeframe Anticipated outcome
1. NA
2
3. How will your council become/remain Fit for the Future?
3.1 Sustainability
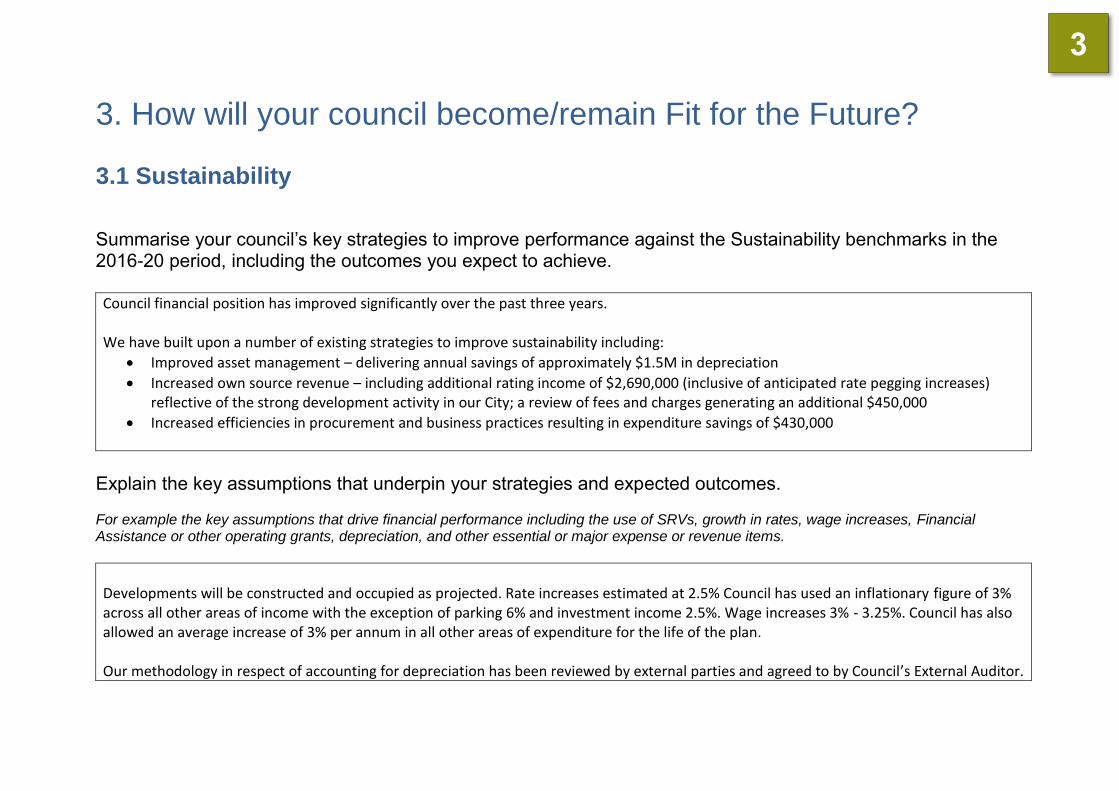
Summarise your council’s key strategies to improve performance against the Sustainability benchmarks in the 2016-20 period, including the outcomes you expect to achieve. Council financial position has improved significantly over the past three years. We have built upon a number of existing strategies to improve sustainability including:
Improved asset management – delivering annual savings of approximately $1.5M in depreciation
Increased own source revenue – including additional rating income of $2,690,000 (inclusive of anticipated rate pegging increases) reflective of the strong development activity in our City; a review of fees and charges generating an additional $450,000
Increased efficiencies in procurement and business practices resulting in expenditure savings of $430,000
Explain the key assumptions that underpin your strategies and expected outcomes. For example the key assumptions that drive financial performance including the use of SRVs, growth in rates, wage increases, Financial Assistance or other operating grants, depreciation, and other essential or major expense or revenue items.
Developments will be constructed and occupied as projected. Rate increases estimated at 2.5% Council has used an inflationary figure of 3% across all other areas of income with the exception of parking 6% and investment income 2.5%. Wage increases 3% - 3.25%. Council has also allowed an average increase of 3% per annum in all other areas of expenditure for the life of the plan. Our methodology in respect of accounting for depreciation has been reviewed by external parties and agreed to by Council’s External Auditor.
3

3.1 Sustainability
Outline your strategies and outcomes in the table below.
3.1 Sustainability
Objective Strategies Key milestones Outcome Impact on other measures
Operating performance measure
to meet or exceed benchmark
Improved performance
through increased Own
Source Revenue
performance
Annual review Fees and
Charges
identify potential new
fees
Internal Audit to
ensure fees are being
applied correctly
2015/2016
Fee categories with
stronger focus on cost
recovery/market rates
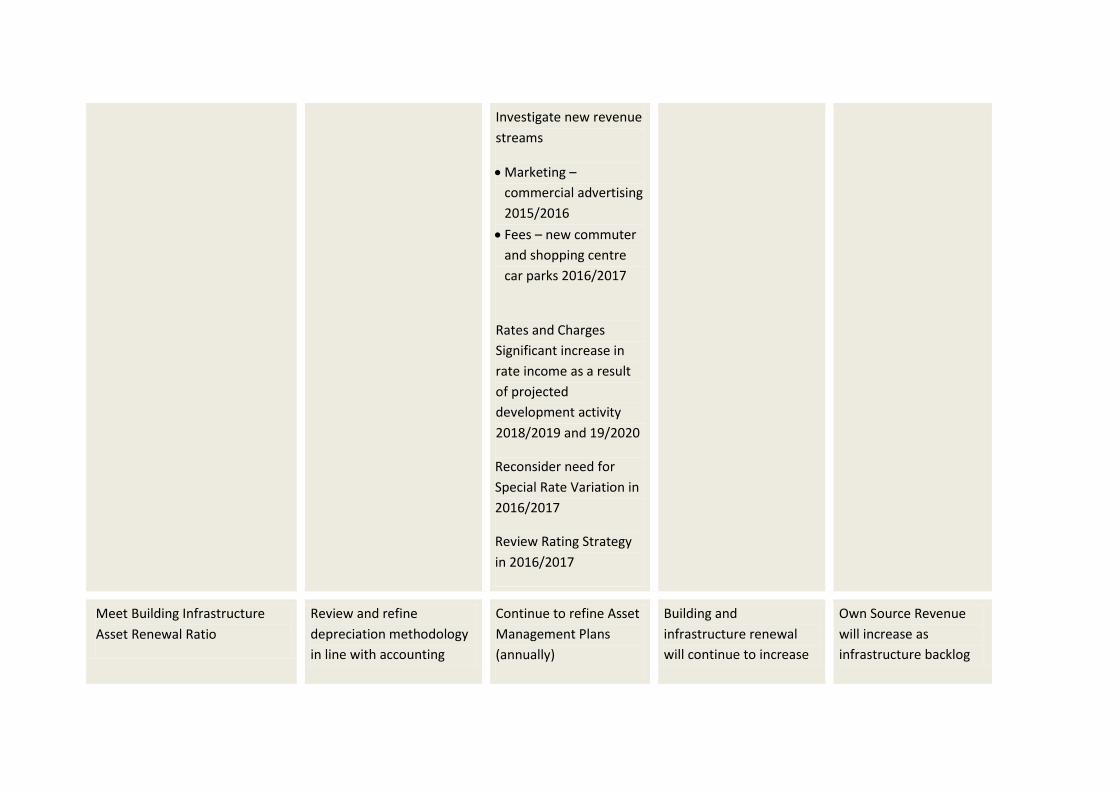
Investigate new revenue streams
Marketing – commercial advertising 2015/2016
Fees – new commuter
and shopping centre
car parks 2016/2017
Increased revenue
contributes to increased
operating performance
Continued non-reliance
on loan borrowings
Reduced reliance on grant
funding
Increased Own Source
Revenue
3

Rates and Charges Significant increase in rate income as a result of projected development activity 2018/2019 and 2019/2020
Reconsider need for
Special Rate Variation in
2016/2017
Review Rating Strategy
in 2016/2017
Review Asset Management
methodology
Review of depreciation
methodology for useful
life of assets 2015/2016
Review conditions of
assets 2015/2016
Revaluation of assets
2015/2016
Depreciation expense
significantly reduces from
2014/2015 onwards
contributes to increased
operating performance
Improvement in
Building and
Infrastructure Renewal
Ratio
Improvement in
Infrastructure Backlog
Ratio

Decrease in operating
expenditure through
improved efficiency
Undertake operational
reviews to improve
efficiency 2015/2016:
Fleet Management
Improved use of
technologies
Improved
environmental
sustainability
Rationalisation of
communication
After-hours cleaning
and maintenance
(overtime)
Decreased expenditure
contributes to increased
operating performance
Decrease in Real
Operating Expenditure
Per Capita
Own Source Revenue to meet or
exceed benchmark
Improved operating
performance through
additional revenue
Annual review Fees and
Charges
identify potential new
fees
Internal Audit to
ensure fees are being
applied correctly
2015/2016
Fee categories with
stronger focus on cost
recovery/market rates
Increased revenue
contributes to Own
Source Ratio benchmark
Continued non-reliance
on loan borrowings
Reduced reliance on grant
funding
Improved Operating
Performance Ratio
Investigate new revenue
streams
Marketing –
commercial advertising
2015/2016
Fees – new commuter
and shopping centre
car parks 2016/2017
Rates and Charges
Significant increase in
rate income as a result
of projected
development activity
2018/2019 and 19/2020
Reconsider need for
Special Rate Variation in
2016/2017
Review Rating Strategy
in 2016/2017
Meet Building Infrastructure
Asset Renewal Ratio
Review and refine
depreciation methodology
in line with accounting
Continue to refine Asset
Management Plans
(annually)
Building and
infrastructure renewal
will continue to increase
Own Source Revenue
will increase as
infrastructure backlog

standards and industry
practices
Review community
demand and community
need for assets
Review asset portfolio and
assess ongoing viability of
assets
Review need for new assets
in line with community
needs
Undertake condition of
asset review 2015/2016
Continue to review
useful life of assets
(annually)
Undertake Community
Facilities Review
2015/2016
Undertake Recreational
Needs Analysis
2015/2016
over the life of the Plan to
reduce infrastructure
backlog
Provide assets that are
well functioning and meet
community needs
declines
Asset Maintenance
Ratio reduces to
benchmark reflective of
less reactionary
maintenance
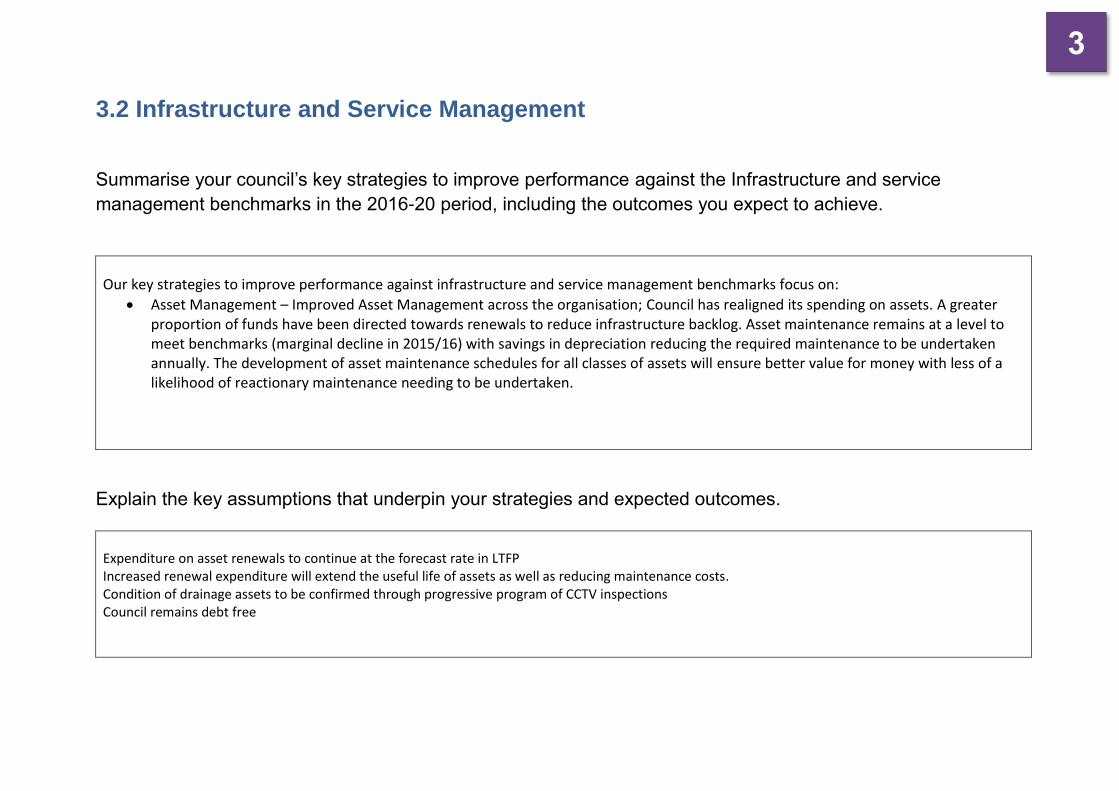
3.2 Infrastructure and Service Management
Summarise your council’s key strategies to improve performance against the Infrastructure and service
management benchmarks in the 2016-20 period, including the outcomes you expect to achieve.
Our key strategies to improve performance against infrastructure and service management benchmarks focus on:
Asset Management – Improved Asset Management across the organisation; Council has realigned its spending on assets. A greater proportion of funds have been directed towards renewals to reduce infrastructure backlog. Asset maintenance remains at a level to meet benchmarks (marginal decline in 2015/16) with savings in depreciation reducing the required maintenance to be undertaken annually. The development of asset maintenance schedules for all classes of assets will ensure better value for money with less of a likelihood of reactionary maintenance needing to be undertaken.
Explain the key assumptions that underpin your strategies and expected outcomes.
Expenditure on asset renewals to continue at the forecast rate in LTFP Increased renewal expenditure will extend the useful life of assets as well as reducing maintenance costs. Condition of drainage assets to be confirmed through progressive program of CCTV inspections Council remains debt free
3

3.2 Infrastructure and Service Management
Outline your strategies and outcomes in the table below.
3.2 Infrastructure and service management
Objective Strategies Key milestones Outcome Impact on other measures
To reduce infrastructure backlog
to meet benchmark
Refinement of asset
methodology to determine
and agree satisfactory
standard with the
community.
Refine Asset
Management Strategy
and Plans 2015/2016
Review Capital Works
Program annually
Consult annually with the
community as part of
IP&R Process
Greater proportion of
asset portfolio meeting
satisfactory standard
Better value for money
through less reactionary
asset maintenance
Reduced backlog
Increase in Building and
Infrastructure Renewal
ratio
Potential increase in
Operating Performance
ratio once infrastructure
backlog is reduced
allowing additional
funds for other
purposes
Asset Maintenance
Ratio should reduce
reflecting less
reactionary
maintenance
3
3

Maintain Asset Maintenance at
benchmark
Review Asset Management
Plans to inform
maintenance requirements
Maximise funds to achieve
balance between ‘renewal’
and ‘maintenance’
Finalise maintenance
schedules for all classes
of assets:
Buildings 2015/2016
Roads 2015/2016
Parks Infrastructure
2015/2016
Kerb & Gutter
2016/2017
Footpaths 2016/2017
Drainage 2016/2017
Greater proportion of
asset portfolio meeting
satisfactory standard
Better value for money
through less reactionary
asset maintenance
Provide assets that are
well functioning and meet
community needs
Building and
Infrastructure
increasing as funds
diverted from
maintenance to
renewals
Utilise debt responsibly and only
as required
Continue to reassess need
for loan borrowings to fund
major capital works projects
and for the equitable
distribution over the useful
life of the asset.
Review annually in
conjunction with Capital
Works Program
Infrastructure backlog
being reduced without the
need for loan borrowings
New community assets
being realised through use
of Section 94, VPA and
Revenue funds
Potentially increase
Operating Performance
and Cost per Capita
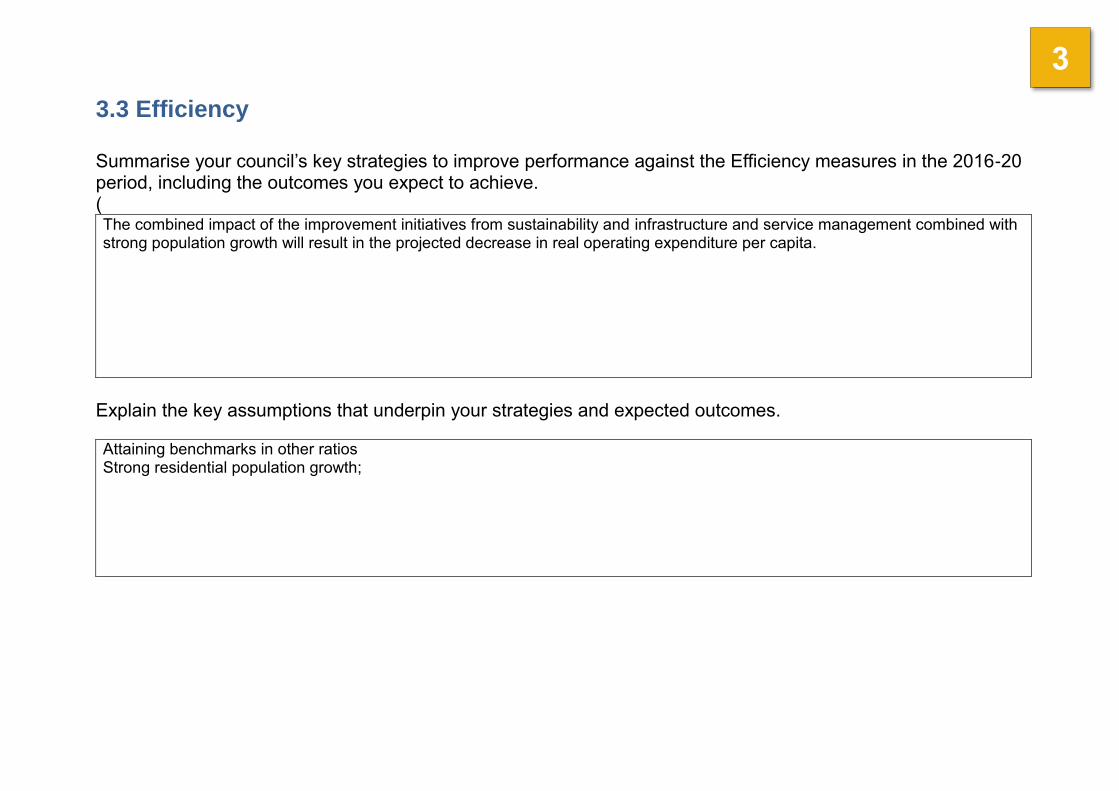
3.3 Efficiency Summarise your council’s key strategies to improve performance against the Efficiency measures in the 2016-20 period, including the outcomes you expect to achieve. ( The combined impact of the improvement initiatives from sustainability and infrastructure and service management combined with strong population growth will result in the projected decrease in real operating expenditure per capita.
Explain the key assumptions that underpin your strategies and expected outcomes. Attaining benchmarks in other ratios Strong residential population growth;
3

3.3 Efficiency
Outline your strategies and outcomes in the table below.
3.3 Efficiency
Objective Strategies Key milestones Outcome Impact on other measures
Maintain levels of services as
agreed with the community
Respond to changing
community needs and statutory
requirements
Maintain efficient and
effective service delivery
Continue to explore
efficiency gains through
regional collaboration
Monitor and review
financial performance
Plan for significant
increase in residential
growth
Benchmarking
Community Survey
Internal Business
Process Improvement
Program
Annual Operational Plan
Monthly Budget Review
Services and facilities
meet community needs
and aspirations
Efficient and effective
service delivery
Operating
Performance
3

3.4 Improvement Action Plan
Summarise the key improvement actions that will be achieved in the first year of your plan.
Action plan
Actions Milestones
1.Asset Management Continue to refine Asset Management Strategy and Plans including:
Review condition of assets
Revaluation of assets
Review service levels for assets
Finalise maintenance schedules for buildings, roads and parks infrastructure
Depreciation methodology
Conduct Community Facilities Review
Conduct Recreational Needs Analysis
June 2015 - June 2016
2. Revenue opportunities
Review fees and charges to identify potential new fees and charges
Revenue Policy to focus on cost recovery/market rates
IA to conduct audit to ensure fees are being applied correctly
Pursue marketing options for commercial advertising signage
Fees – new commuter car parks (construction 2016-2017)
Fees – additional parking income from new residential parking schemes
Fees and charges – additional income regulatory enforcement
January 2016-June 2016
3

Review Rating Strategy
3. Improved efficiencies
Review Fleet Management
Improved use of technologies
Improved environmental sustainability
Rationalisation of communications
Review after-hours cleaning and maintenance (overtime)
Sept 2015-June 2016
4. Quality Improvement and evaluation
Continue Business Improvement Program
Monthly Budget Review and Reporting to Executive Committee
Delivery Program and Quarterly Budget Review
Continue Training and Development program
Undertake Benchmarking opportunities
Undertake Community Survey
July 2015 – June 2016
* Please attach detailed action plan and supporting financial modelling
Outline the process that underpinned the development of your Action Plan.
This Action Plan was developed by the FFF Committee. An independent consultant, Morrison Low, was engaged to assist with financial forecasting, asset management and improvement program. Council adopted submission at Council Meeting on 24 June 2015.
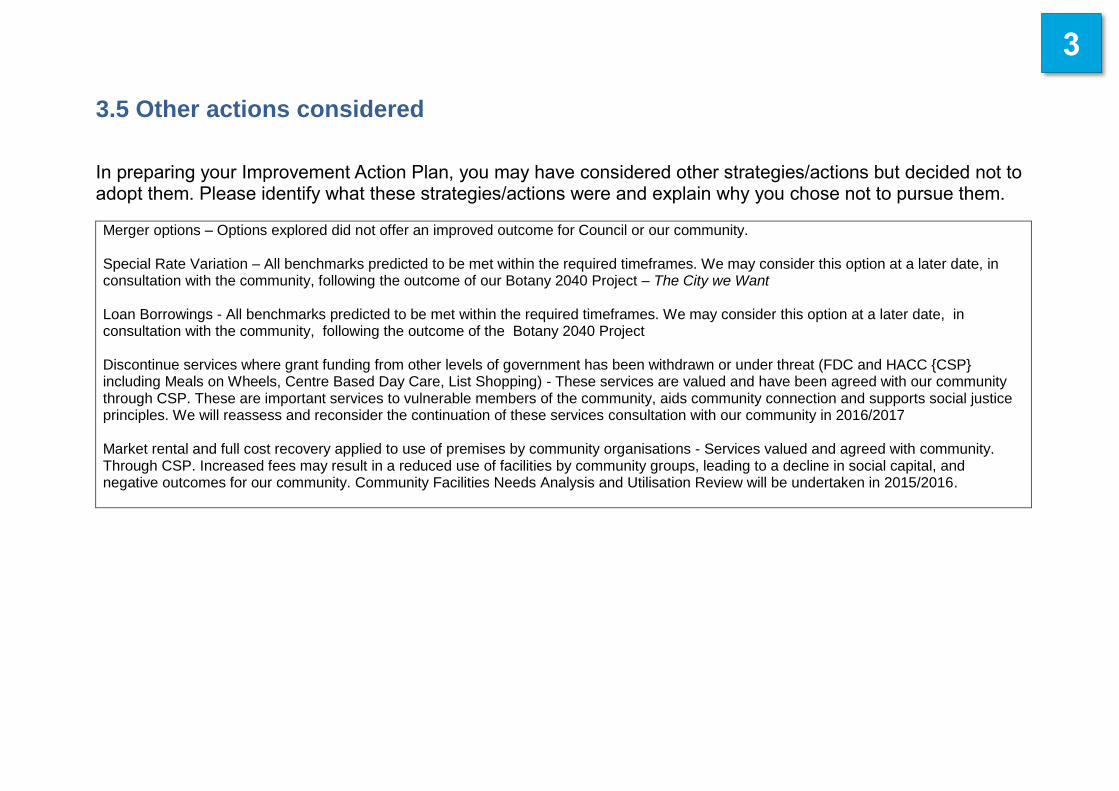
3.5 Other actions considered
In preparing your Improvement Action Plan, you may have considered other strategies/actions but decided not to adopt them. Please identify what these strategies/actions were and explain why you chose not to pursue them.
Merger options – Options explored did not offer an improved outcome for Council or our community. Special Rate Variation – All benchmarks predicted to be met within the required timeframes. We may consider this option at a later date, in consultation with the community, following the outcome of our Botany 2040 Project – The City we Want Loan Borrowings - All benchmarks predicted to be met within the required timeframes. We may consider this option at a later date, in consultation with the community, following the outcome of the Botany 2040 Project Discontinue services where grant funding from other levels of government has been withdrawn or under threat (FDC and HACC {CSP} including Meals on Wheels, Centre Based Day Care, List Shopping) - These services are valued and have been agreed with our community through CSP. These are important services to vulnerable members of the community, aids community connection and supports social justice principles. We will reassess and reconsider the continuation of these services consultation with our community in 2016/2017 Market rental and full cost recovery applied to use of premises by community organisations - Services valued and agreed with community. Through CSP. Increased fees may result in a reduced use of facilities by community groups, leading to a decline in social capital, and negative outcomes for our community. Community Facilities Needs Analysis and Utilisation Review will be undertaken in 2015/2016.
3
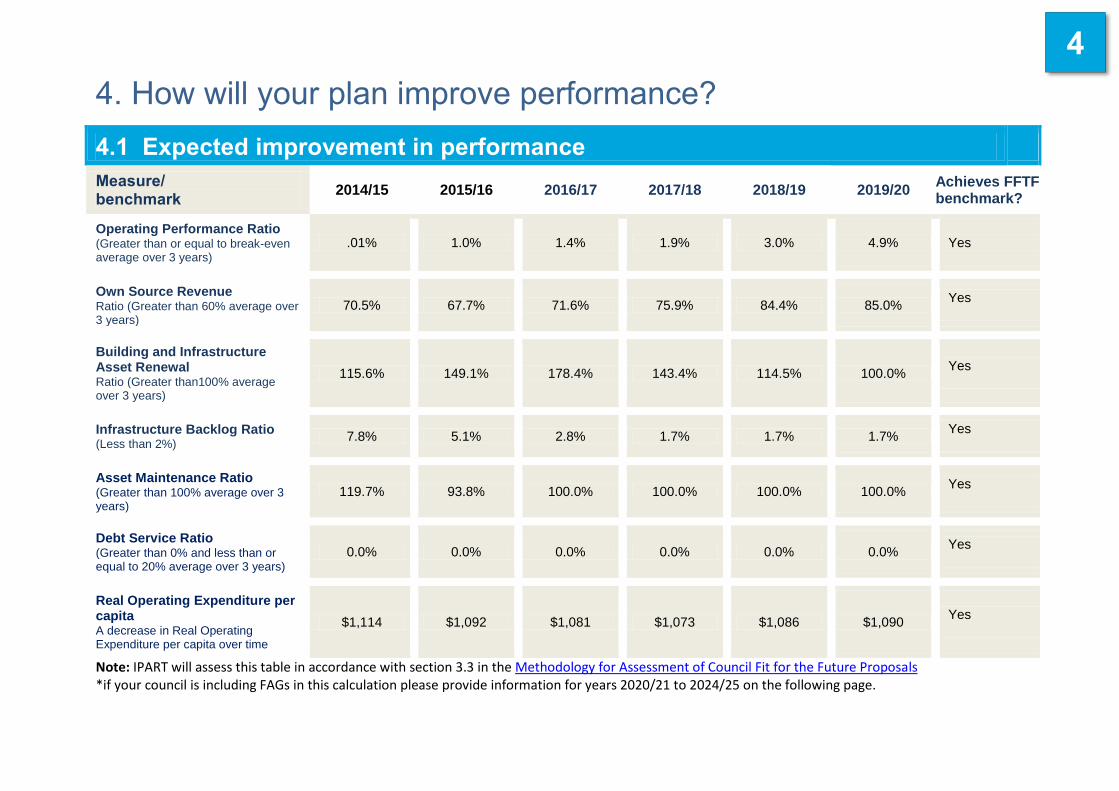
4. How will your plan improve performance?
4.1 Expected improvement in performance
Measure/ benchmark 2014/15 2015/16 2016/17 2017/18 2018/19 2019/20
Achieves FFTF benchmark?
Operating Performance Ratio (Greater than or equal to break-even average over 3 years)
.01% 1.0% 1.4% 1.9% 3.0% 4.9% Yes
Own Source Revenue Ratio (Greater than 60% average over 3 years)
70.5% 67.7% 71.6% 75.9% 84.4% 85.0% Yes
Building and Infrastructure Asset Renewal Ratio (Greater than100% average over 3 years)
115.6% 149.1% 178.4% 143.4% 114.5% 100.0% Yes
Infrastructure Backlog Ratio (Less than 2%) 7.8% 5.1% 2.8% 1.7% 1.7% 1.7%
Yes
Asset Maintenance Ratio (Greater than 100% average over 3 years)
119.7% 93.8% 100.0% 100.0% 100.0% 100.0% Yes
Debt Service Ratio (Greater than 0% and less than or equal to 20% average over 3 years)
0.0% 0.0% 0.0% 0.0% 0.0% 0.0% Yes
Real Operating Expenditure per capita A decrease in Real Operating Expenditure per capita over time
$1,114 $1,092 $1,081 $1,073 $1,086 $1,090 Yes
Note: IPART will assess this table in accordance with section 3.3 in the Methodology for Assessment of Council Fit for the Future Proposals *if your council is including FAGs in this calculation please provide information for years 2020/21 to 2024/25 on the following page.
4

4.1 Expected improvement in performance (rural with FAGS considered*) Measure/ benchmark 2020/21 2021/22 2022/23 2023/24 2024/25
Achieves FFTF benchmark?
Operating Performance Ratio (Greater than or equal to break-even average over 3 years)
Yes/No
Own Source Revenue Ratio (Greater than 60% average over 3 years)
Yes/No
*Includes councils in OLG groups 8,9, 10 and 11 only. See page 42 of IPARTs Methodology for Assessment of Council Fit for the Future Proposals

4.1 Expected improvement in performance
If, after implementing your plan, your council may still not achieve all of the Fit for the Future benchmarks, please explain the likely reasons why.
Council is confident, based on our financial modelling and an independent review by Morrison Low, that all benchmarks will be met within the required timeframe
4

5. Putting your plan into action How will your council implement your Improvement Action Plan?
The Fit for the Future Improvement Plan has been incorporated into our Integrated Planning and Reporting documents for 2015/2016. Included in this suit of documents is our Operational Plan for the forthcoming year adopted by Council in June 2015. Our submission, including our improvement program, was also adopted in June 2015. The General Manager is responsible for ensuring the Improvement Plan is implemented and communicated to all relevant staff. Each Director has responsibilities for delivering on relevant actions within the Plan. Progress under the Delivery Program is reviewed by Council twice a year. Financial reporting and review is undertaken by Council on a quarterly basis. The Executive Committee considers finance and performance matters at each fortnightly meeting with a full budget review undertaken monthly.
5