counting people and making people count: key sources of
TRANSCRIPT
The K4D helpdesk service provides brief summaries of current research, evidence, and lessons learned. Helpdesk reports are not rigorous or systematic reviews; they are intended to provide an introduction to the most important evidence related to a research question. They draw on a rapid desk-based review of published literature and consultation with subject specialists.
Helpdesk reports are commissioned by the UK Department for International Development and other Government departments, but the views and opinions expressed do not necessarily reflect those of DFID, the UK Government, K4D or any other contributing organisation. For further information, please contact [email protected].
Learning Journey Research Report
Counting people and making people count: Key sources of population projections
Kerry A. Millington, Liverpool School of Tropical Medicine
John Cleland, London School of Tropical Medicine
19 April 2017
Question
What are the key sources of information on population dynamics globally and for the countries
and regions where DFID works?
Contents
1. Key sources of information on Population Dynamics
2. How do organisations use population projections?
3. Other sources of information
4. References
1. Key sources of information on Population Dynamics
Centrally generated population projections
Three sources of centrally generated projections exist: The Population Division of the
Department of Economic and Social Affairs of the United Nations Secretariat, the World Bank
and the Wittgenstein Centre. As the World Bank relies heavily on the UN its role will not be
considered. The premier source of population projections is the UN Population Division. This
data is easily accessible and updated every two years. Five global datasets are produced by the
Division (i) World Population Prospects, (ii) World Urbanisation Prospects, (iii) World Population
Policies, (iv) Estimates of family planning indicators and (v) Estimates of the number of
international migrants.
2
United Nations, Department of Economic and Social Affairs, Population Division (2015). World Population Prospects: The 2015 Revision
https://esa.un.org/unpd/wpp/
The 2015 Revision of World Population Prospects is the twenty-fourth round of official UN’s
population estimates and projections. Key demographic indicators can be accessed for selected
periods or dates from 1950 to 2100, for the world, development groups, major areas, regions,
and countries or areas with more than 90,000 inhabitants in 2015. For countries or areas with
fewer than 90,000 inhabitants in 2015, only figures related to population size and growth are
provided. Data tables and figures for 1950-2015 are estimates and those thereafter are
projections. Population projections are essential in the assessment of future need. A projection is
a prediction made by extrapolating from past observations and shows what may happen if a set
of assumptions holds true. The assumptions can be varied to see how much difference they
make, thus producing a set of variant projections. These could include ‘best-case’ and ‘worst-
case’ scenarios.
The projections are presented for medium, high, low and constant-fertility variants. The main
results are presented in a series of Excel data files, maps, graphs and publications. Data can be
displayed for both sexes combined, male or female. At a regional level and over a period of a few
decades, the UN projections have a good track record of predictive validity (1). Figures for
specific countries though will be subject to greater error. The mean absolute error of the UN 1994
projections for the size of national populations in the year 2000 was 5%. The predictive accuracy
of national projections depends on: (1) accuracy of baseline data (typically a census), ability to
detect and adjust for errors; (2) correct mortality assumptions, usually not an important source of
error; (3) correct fertility assumptions, a more important source of error; and (4) migration
assumptions, which are intrinsically more difficult to forecast than mortality and fertility, but are
less problematic for large populations than small ones. Broadly, it is fair to claim that UN
projections are of sufficient quality for many planning purposes over a horizon of 10 to 20 years.
The following is a list of the indicators can be found on the World Population Prospects 2015
Revision. Examples of what cannot be obtained from this source include: future nature/size of
inequality, vulnerability, displaced people, occupational structure, educational level, number of
school leavers seeking work, sub-national populations etc.
Population indicators: total population by sex (thousands), average annual rate of population
change (percentage), rate of natural increase (per 1,000 population), population density,
population by age and sex, percentage of total population by broad age group, both sexes,
percentage of female population by broad age group, percentage of male population by broad
age group, median age of total population, sex ratio of total population.
Fertility indicators: crude birth rate, total fertility, age-specific fertility rates, mean age of
childbearing (years), net reproduction rate (surviving daughters per woman), number of births,
both sexes (thousands), number of birth by age of mother (thousands), sex ratio at birth (male
births per female births)
Mortality indicators: Crude death rate, life expectancy, infant mortality rate, under-five mortality,
adult mortality, number of deaths by age and sex

3
Migration indicators: net migration rate (per 1000 population), net numbers of migrants, both
sexes combined (thousands)
Dependency ratios: child dependency ratio, old-age dependency ratio, potential support ratio,
total dependency ratio
United Nations, Department of Economic and Social Affairs, Population Division (2014). World Urbanisation Prospects: The 2014 Revision
https://esa.un.org/Unpd/Wup/
Every two years since 1988, the Population Division has been issuing revised estimates and
projections of the urban and rural populations of all countries and of their major urban
agglomerations growth and size. The proportion of urban (and rural) population is estimated from
the most recently available census or official population estimate of each country. If this estimate
is only available for some time in the past, the proportion urban is extrapolated to the base year,
which in this case is 2014.
The Population Division does not use its own definition of “urban” but instead follows the
definition that is used in each country. The definitions are generally those used by national
statistical offices in carrying out the latest available census.
Wittgenstein Centre
http://www.wittgensteincentre.org/en/index.htm
The Wittgenstein Centre is a collaboration of three institutions: World Population Program of the
International Institute for Applied Systems Analysis (IIASA), the Vienna Institute of Demography
of the Austrian Academy of Sciences (VID/ÖAW) and the Demography Group and the Research
Institute on Human Capital and Development of the Vienna University of Economics and
Business (WU). In 2014 this Centre published projections for 195 countries, based on a blend of
expert judgment and advanced modelling (2). The major innovation was to include education in
addition to age and sex as a third demographic dimension in projection outputs, under the
rationale that education is a key determinant of fertility and mortality. Including educational
differentials in projections permitted the production of alternative projections under different
assumptions. For example, in most societies, particularly during the process of demographic
transition, women with more education have fewer children, both because they want fewer and
because they find better ways to pursue their goals. Another example is that better educated
men and women in most societies have lower mortality rates and their children have a better
chance of survival.
In a recent extension to this work, Abel et al. show how achievement of the Sustainable
Development Goals (SDGs), and in particular advances in female education and reproductive
health, can lower future population growth (3). The goals are translated into SDG population
scenarios, resulting in population sizes between 8.2 and 8.7 billion in 2100. Although this
analysis uses several assumptions about the implementation of the SDGs and the persistence of
educational, fertility, and mortality differentials, it quantitatively shows that ‘demography is not
destiny’ and that policies can make a decisive difference. The Centre continues to try and
understand challenges future societies will face. For example in a recently published paper, The
Centre uses a ‘demographic metabolism model’ to forecast important aspects of societal change
that affect adaptive capacity and specifically how the changing educational composition of future
populations can influence societies’ adaptive capacity to climate change (4).

4
It seems unlikely that the Wittgenstein Centre will have the resources to update projections every
two years, as the UN does.
Projections generated by countries
National censuses are ideally undertaken every 10 years. They are an essential tool for
policymakers to plan for resource scarcity and service provision. However, censuses are
complex and costly, requiring huge amounts of time and man power. Thus, many countries have
outdated or inaccurate information, especially regarding their most vulnerable populations, such
as women and girls and internally displaced persons. Details on census taking are available from
the UN Statistics Division. Most countries participated in the 2010 census round (report
E/CN.3/2015/6) and a list of censuses by country and date are also available
(https://unstats.un.org/unsd/demographic/sources/census/censusdates.htm).
At the end of the 2010 census, 22 out of the 32 DFID priority countries had conducted a
population and housing census for this round. Ten DFID priority countries did not participate in
the round, which resulted in an estimated 31 per cent of the population of DFID priority countries
not being enumerated (table). Six DFID priority countries have no population and housing census
planned for the next round (Afghanistan, Iraq, Lebanon, Somalia, Syria and Yemen) and these
six countries did not conduct a 2010 census either.
Table. Date of last census for DFID priority countries
DFID priority country 2010 round of censuses
2005-2014
2020 round of censuses
2015-2024
Afghanistan - (16)
-
Bangladesh 15 March 2011 (2021)
Burma 30 Mar-10 Apr 2014 (2024)
Democratic Republic of Congo - (2016)
Ethiopia 29 May-7 Jun 2007 (November 2017)
Ghana 26 Sep-10 Oct 2010 (22 March 2020)
India 9-28 February 2011 (9-28 February 2021)
Iraq - -
Jordan - 30 Nov-10 Dec 2015
Kenya 24-31 August 2009 (24 August 2019)
Kyrgyzstan 24 Mar-3 Apr 2009 (2019)
Lebanon - -
Liberia 21 Mar-30 Mar 2008 (2018)
Malawi 8-28 June 2008 (2018)

5
Mozambique 1-15 August 2007 (2017)
Nepal 22 June 2011 (2021)
Nigeria 21-27 March 2006 (2017)
Occupied Palestinian Territories 1-16 December 2007 (2017)
Pakistan - (2016)
Rwanda 16-30 August 2012 (2022)
Sierra Leone - 5-18 December 2015
Somalia -
South Africa 10 Oct-7 Nov 2011 (2021)
Sudan 21 Apr-6 May 2008 (April 2018)
South Sudan 21 Apr-5 Jun 2008 (2017)
Syria -
Tajikistan 21-30 September 2010 (2020)
United Republic of Tanzania 26 August 2012 (2022)
Uganda 27 Aug-6 Sep 2014 (2024)
Yemen -
Zambia 16 Oct-5 Nov 2010 (October 2020)
Zimbabwe 18-27 August 2012 (August 2022)
Symbols
(Date) It is expected that a census will be held on the date indicated
- No census taken or planned in the period indicated
Locally generated population projections complement UN projections mainly by generating
regional and district projections. Most countries with a national statistical office produce in one
form or another post-censal population projections either on their own or with some assistance
from some external consultant owing to a need for subnational focus on a shorter time horizon
for functional application. Spectrum or US census bureau international program software
applications are among the most popular among LMIC.
Spatial projections can be made in several ways, ranging from the very crude to the extremely
complex. Among the crude approaches are: (1) to assume that distribution of total population by
locality will remain constant; (2) to assume that the past relative growth of localities will remain
constant. A better approach is to make use of net migration rates between localities, along with
estimates of fertility and mortality for each locality. This was the approach used in Myanmar
based on the 2014 census. In addition to a national projection, projections were made for 15
6
regions. Net migration rates between regions for the year before the census were available from
the census along with region-specific birth and death data. The results of this exercise showed
implausibly high growth for one region and results were modified. Projections for each region
were finally adjusted to enforce consistency with the national projection.
Projections based on the 2007 Ethiopian census included forecasts for 11 regions. As census
data on inter-regional migration were not collected in the census, survey estimates were used.
The 2013 projection report notes that “the assumptions on migration used here are not based on
any detailed studies on the subject and are very subjective”. It may also be noted that the UN
estimates for Ethiopia’s total population are about 10 million higher than the figures used by
Ethiopia’s Central Statistical Office. The reason is unclear but may stem from a UN judgment that
the 2007 census suffered from under-enumeration. Such divergences between UN and locally
generated projections and estimates may be problematic for agencies such as DFID.
The gold standard method of making sub-national projections requires age-sex specific flows in
both directions of internal migrants between all regions but the number of computations required
to implement this ideal is excessive. The Myanmar and Ethiopian examples illustrate that sub-
national projections are a major and complex operation requiring skills that are often unavailable
within countries.
The utility of population projections can be vastly increased when linked to sector-specific data,
such as school enrolments, skilled attendance at childbirth, proportion of adults who are wage
earners etc. In these types of application, population projections by age and sex are combined
with forecasts of participation or demand to yield, for instance, the number of future
schools/teachers needed, the number of obstetricians/midwives required, and the likely tax
revenue from wage earners. Typically, the sector-specific data will come from specialist surveys,
such as the Demographic and Health Surveys, or from administrative records. However,
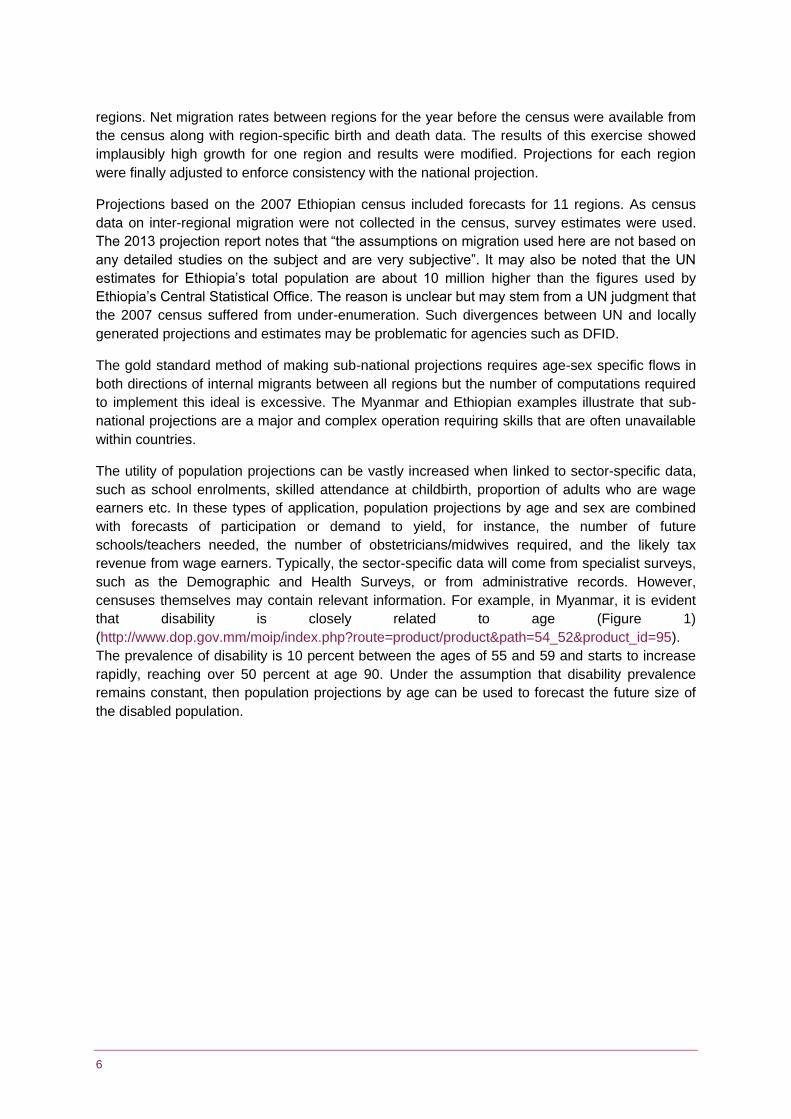
censuses themselves may contain relevant information. For example, in Myanmar, it is evident
that disability is closely related to age (Figure 1)
(http://www.dop.gov.mm/moip/index.php?route=product/product&path=54_52&product_id=95).
The prevalence of disability is 10 percent between the ages of 55 and 59 and starts to increase
rapidly, reaching over 50 percent at age 90. Under the assumption that disability prevalence
remains constant, then population projections by age can be used to forecast the future size of
the disabled population.
7
Figure 1: Proportion of the Population with Disability (prevalence rates) by Age and Sex
Source: 2014 Myanmar Population and Housing Census Report Volume 2
While it was beyond the scope of this report, it seems essential to find out the extent to which
Ministries in DFID priority countries make use of population projections in their planning.
The UN Population Division surveyed the national institutional capacity in 2008 to produce
population estimates and projections (5). The inquiry was carried out among National Statistical
Offices because in most countries they are the government unit in charge not only of collecting
and disseminating population statistics but also of carrying out population analysis and producing
population estimates and projections. The inquiry was carried out during 2008 of which 79 out of
192 National Statistical Offices responded. The analysis focusses on four issues: (a) the quantity
and quality of the human resources available in National Statistical Offices to carry out population
analysis; (b) the interest of National Statistical Offices in participating in capacity-building
activities at the regional or international levels; (c) the capacity of National Statistical Offices to
produce population projections, and (d) the capacity of National Statistical Offices to produce
reliable estimates of key demographic indicators. The analysis reveals that National Statistical
Offices in developing countries are not yet universally able to produce reliable demographic
indicators or detailed population projections, mainly because many of them have very few
professional staff with specialized training in demography. Deficits in trained personnel also
affect several countries with economies in transition and reduce their capacity to produce timely

8
population estimates and projections. Almost all National Statistical Offices were interested in
participating in capacity-building activities to either acquire or upgrade skills.
In recent years, the Population Division has organized training workshops including ‘Capacity
Development in Population Estimates and Projections in sub-Saharan Africa’ and ‘Capacity
Development on the use and Production of Migration Data’
(http://www.un.org/en/development/desa/population/theme/cooperation/index.shtml). The
Division seeks to expand its work in national capacity development to improve demographic data
and increase knowledge and understanding of population trends
(http://www.un.org/en/development/desa/population/pdf/commission/2017/documents/OpeningSt
atement_JohnWilmoth.pdf).
Changes in the availability and quality of demographic data due to new technologies
Accurate, up-to-date data of human population distributions, their characteristics and changes
over time on a national and subnational scale are needed to determine the impacts of population
growth, for monitoring changes and for planning interventions. In this Comment from Andrew
Tatem, WorldPop (www.worldpop.org) is described which aims to provide detailed and open
access spatial demographic datasets built using transparent data for low and middle-income
countries, as well as collaborating with and running training for many national statistical offices
and ministries of health around the world (6). Initiated in 2011 and growing from the AfriPop and
AsiaPop projects started in 2005, WorldPop develops methods for data integration and
disaggregation of traditional data sources such as census and surveys with satellite and cell
phone data, amongst others to produce gridded outputs. These methods undergo peer review
and the output datasets are made open access. Collection of timely, consistent, comparable and
spatially-detailed demographic data in low and middle income countries can be a challenge,
despite growing capacity to obtain these data. An up-to-date understanding of not only how many
people live in a country, but where people are, who they are and how things change is needed to
achieve the SDGs and ensure that ‘no-one is left behind’. Also, the broad focus of the SDGs
across climate change, disaster response and access to services is also driving a need to move
beyond administrative unit based analyses to enable flexible integration with datasets on land
use, flooding and service locations for example. The following provides examples of WorldPop
work.
Currently WorldPop work includes integrating UN projections (urban/rural, age, sex, births) with
mapping to construct disaggregated high-resolution versions of these projections. A recent
example of this work can be found in the UNFPA/WHO State of the World’s Midwifery Report (7).
To better understand urban growth dynamics in Africa and better predict the spatial pattern of
rural-urban conversion, Linard et al. developed a modelling approach at an intermediate scale,
between city and global level (5-10 km resolution), to identify factors that influence spatial
patterns of urban expansion in Africa (8). The most influential variables were the urban land
cover in a 1 km neighbourhood and the accessibility (measured through travel time) to the city
centre. The spatial pattern of small, compact and fast growing cities was easier to simulate than
cities with lower population densities and a lower growth rate. The simulation method described
in this paper is now being developed further and used to produce spatially detailed urban
expansion forecasts for 2020 to 2030 for Africa through the MAUPP project
(http://maupp.ulb.ac.be/), and globally 2000-2030 for WorldPop global mapping work with the Bill
and Melinda Gates Foundation (current research, personal communication from Andrew Tatem).

9
Sorichetta et al. describe the construction of internal migration estimates using models built on
census microdata, demographic features and geospatial covariates across all low and middle
income countries (Figure 2)(9). The estimates will be used to map connectivity for disease
elimination planning, but have value beyond this in for example trade, transportation and urban
planning.
Figure 2. Estimated internal human migration flows between subnational administrative units for every malaria endemic country in Africa.
Source: Sorichetta, A. et al. Mapping internal connectivity through human migration in malaria endemic countries. Sci Data 3, 160066 (2016).
The Flowminder Foundation (www.flowminder.org), a partner organization of WorldPop and a
non-profit organization based in Stockholm, Sweden, works with governments, inter-
governmental organizations and NGOs to also collect, aggregate, integrate and analyze
anonymous mobile operator data, satellite and household survey data to improve public health

10
outcomes. Analyses enable the mapping of the distributions and characteristics of vulnerable
populations in low- and middle-income countries. The following publications are examples of the
work both WorldPop and Flowminder are involved with.
Steele et al demonstrate (in Bangladesh) how public and private data sources that are commonly
available for LMICs can be used to provide novel insights into the spatial distribution of poverty
(10). The aim being to complement and update estimates between censuses. Each time a
subscriber makes a phone call with his or her mobile phone, a call detail record (CDR) is
generated in the system of the telecom operator. A CDR includes a timestamp of the call, the
mobile phone number and the mobile tower used to route the call. This data can be used to
analyse how phones move between towers between calls. The authors found that models using
mobile data only yielded comparable results to models using mobile phone data and available
geospatial data. Stratifying models into urban and rural areas highlighted the advantage of using
mobile data in urban areas and the need to use different data sources in different contexts.
An obstacle to developing effective national malaria control programs is a lack of understanding
of human movements, which are an important component of disease transmission. As mobile
phones have become increasingly ubiquitous, it is now possible to collect individual-level,
longitudinal data on human movements on a massive scale. Wesolowski et al. analyzed mobile
phone call data records representing the travel patterns of 15 million mobile phone owners in
Kenya over the course of a year (11). This was combined with a detailed malaria risk map, to
estimate malaria parasite movements across the country that could be caused by human
movement. This information enabled detailed analysis of parasite sources and sinks between
hundreds of local settlements. Estimates were compared with hospital data from Nairobi to show
that local pockets of transmission likely occur around the periphery of Nairobi, accounting for
locally acquired cases, contrary to the accepted idea that there is no transmission in the capital.
Similar analyses have been conducted by WorldPop/Flowminder in Namibia, Haiti, Tanzania and
Senegal.
The mapping of populations remains constrained by the complexity, cost and frequency of
censuses and surveys. Consequently, spatially detailed changes across scales of days, weeks,
months or even years are difficult to assess and limit the application of human population maps
in situations in which timely information is required, such as disasters, conflicts or epidemics.
Deville et al. demonstrate how data collected in Portugal and France by mobile phone network
operators can cost-effectively provide accurate and detailed maps of population distribution over
national scales and any period, while preserving the anonymity of mobile phone users (12).
WorldPop and Flowminder are working to extend the mobile data methods to many low and
middle income settings, along with assessments of alternative and complimentary datasources,
such as dynamic satellite data.
2. How do organisations use population projections?
DFID
A stocktake of how DFID is currently accessing and using information on population dynamics
has been explored through an e-survey and focus group discussions. Please refer to the
separate document on the findings.
UK Government Ministry of Defence

11
Strategic Trends Programme. Global Strategic Trends – Out to 2045. Fifth Edition. Ministry of Defence.
https://www.gov.uk/government/uploads/system/uploads/attachment_data/file/348164/20140821_DCDC_GST_5_Web_Secured.pdf
Global Strategic Trends (GST) describes a strategic context for those involved in developing
long-term plans, policies and capabilities. It describes those phenomena that could have a
significant impact on the future and combines these differing perspectives to produce a
multifaceted picture of possible outcomes. The GST identifies trends, for example growth in
world population, projects those trends, and analyses their potential consequences. These
components are combined to produce a strategic context against which policies, capabilities and
plans can be tested and refined. Key scenarios illustrate how these trends could interact and
shocks provide the reader with examples of how the strategic context could be radically altered
by unexpected events. In addition, alternative outcomes emphasise that there are several
possible ways trends could impact on the future.
The report details their methodology which includes a review of previous data, identifying gaps,
identifying research topics, breakdown, analysis and mapping to identify drivers, factors and
trends, consultation of drafts across Government, industry, think-tanks and academia and finally
consolidation of this work. The following graph illustrates the increasing uncertainty the further
the projection into the future.

12
One of the thirteen overarching themes is demography and alternatively trends by region e.g.
Sub-Saharan Africa are also presented. The following text is a summary of demographic trends.
The global population is likely to grow to between 8.3 and 10.4 billion by 2045, largely because of
increasing life-expectancy, declining levels of child mortality and continuing high birth rates in
many developing countries. Growth is not likely to be evenly distributed and will probably be
slower in developed countries. Some, including Japan and several European countries, are likely
to experience a decline in population. In developing countries, rapid population increase and
urbanisation will probably challenge stability. Age and gender imbalances may exacerbate
existing political and social tensions while a growing youth population, especially in the Middle
East, Central Asia and sub-Saharan Africa, could provide a reservoir of disaffected young
people. Conversely, if harnessed, they could provide a boost to their economies. Migration is
likely to increase, with people moving within, and outside, their country of origin to seek work or
to escape the effects of climate change.
U.S. Agency for International Development
USAID has been the most active of development agencies in the development of projection
methods and software, particularly for advocacy purposes. USAID has supported the
development of Spectrum, a suite of easy to use policy models which provide policymakers with
an analytical tool to support the decision-making process (http://www.avenirhealth.org/software-
spectrum). The socioeconomic impacts model in Spectrum, known as RAPID, is a computer
model for making projections of social and economic indicators for countries or regions. The
programme requires information on various social and economic indicators, such as the labour
force participation rate, the number of nurses per capita, combined with population projections
(created in the DemProj model of Spectrum) to project future requirements of the indicators, up
to 50 years ahead. These projections can be used as a basis for policy presentation to stimulate
policy dialogue about the importance of population factors to social and economic development.
The Rapid programme was designed in part to show the benefits of investing in family planning.
Moreland and Talbird showed how meeting unmet need for family planning can help countries
achieve the MDGs by reducing the size of the target population groups for the MDGs and
therefore lowering the cost of meeting the MDGs (13). A benefit-cost analysis was applied to 16
sub-Saharan African countries for selected targets and indicators of the MDGs: achieve universal
primary education, reduce child mortality, improve maternal health, ensure environmental
sustainability and combat HIV/AIDS, malaria and other disease. Population estimates were made
using the Demproj and FAMPLAN population projection programmes, that are part of the
Spectrum software package, for two population scenarios: one when current unmet need for
family planning is met and one when unmet need is not met. The cost of family planning and of
meeting selected targets of each of the five MDGs were estimated under both scenarios for each
country and the difference in costs between the two scenarios was calculated over the 10-year
period from 2005 to 2015. The additional cost of family planning was then compared with the
savings that family planning will generate in each of the selected MDG sectors to calculate
benefit-cost-ratios for each sector and for the country overall. This reports shows that while
increasing family planning use was not one of the MDGs, it can be a valuable role to complement
goals by freeing up resources.
Bill and Melinda Gates Foundation

13
One of the key principles that will underpin the effort to end malaria by 2040 is to ‘make
surveillance the backbone of elimination’ (http://endmalaria2040.org/). This reports uses
WorldPop and Flowminder’s analyses of combined malaria parasite prevalence data with
modelling of human movement patterns based on census data and mobile call data records
(CDRs) to produce high-resolution maps of parasite mobility within and between borders. Applied
to regional blocks like Southern Africa (shown below), this enables key decision-makers to co-
ordinate malaria policy for maximum impact and efficiency. This demonstrates how valuable
CDR research is to the fight against malaria.
3. Other sources of information
Global population projections
Publications available on the Population Divisions’ website are as follows.
United Nations, Department of Economic and Social Affairs, Population Division (2015). World Population Prospects: The 2015 Revision, Methodology of the United Nations Population Estimates and Projections. ESA/P/WP.242.
https://esa.un.org/unpd/wpp/Publications/Files/WPP2015_Methodology.pdf
Methodology of the United Nations Population Estimates and Projections
United Nations, Department of Economic and Social Affairs. Population Division (2015). World Population Prospects: Key findings & Advance Tables 2015. Working Paper No. ESA/P/WP.241.
https://esa.un.org/unpd/wpp/Publications/Files/Key_Findings_WPP_2015.pdf
Key findings and advance tables.
United Nations, Department of Economic and Social Affairs, Population Division (2015). World Population Prospects: The 2015 Revision, World Population 2015 Wallchart. ST/ESA/SER.A/378.
https://esa.un.org/unpd/wpp/Publications/Files/World_Population_2015_Wallchart.pdf

14
United Nations, Department of Economic and Social Affairs, Population Division (2015). World Population Prospects: The 2015 Revision, Volume I: Comprehensive Tables. ST/ESA/SER.A/379.
https://esa.un.org/unpd/wpp/Publications/Files/WPP2015_Volume-I_Comprehensive-Tables.pdf
United Nations, Department of Economic and Social Affairs, Population Division (2015). World
Population Prospects: The 2015 Revision, Volume II: Demographic Profiles (ST/ESA/SER.A/380)
https://esa.un.org/unpd/wpp/Publications/Files/WPP2015_Volume-II-Demographic-Profiles.pdf
United Nations, Department of Economic and Social Affairs, Population Division (2015). World Population Prospects: The 2015 Revision, Data Booklet. ST/ESA/SER.A/377.
https://esa.un.org/unpd/wpp/Publications/Files/WPP2015_DataBooklet.pdf
Population themes
http://www.un.org/en/development/desa/population/theme/
This webpage provides overviews of the Population Division's work in main thematic areas (see
list below), as well as links to key publications, data and events.
Adolescents and Youth, ageing, environment, family planning, fertility, HIV/AIDS, international
migration, marriage and unions, mortality, MDGs, population policies, population trends, SDGs,
urbanization
World Bank
http://databank.worldbank.org/data/reports.aspx?source=health-nutrition-and-population-statistics:-population-estimates-and-projections
The World Bank makes population projection data available on their HealthStats
portal and DataBank . The population projection database provides estimates and projections for
total population and other demographic indicators from 1960 to 2050. They are disaggregated by
age-group and sex and cover approximately 200 economies. The input data used for the
projections include a base year population estimate by age and sex, and assumptions of
mortality, fertility, and migration through 2050, mainly based on the UN Population Division's
World Population Prospects database of medium variant. The projections estimates are
produced by the World Bank's Development Data Group and are updated annually. Last update
was 4 October 2016.
Alexandratos, N. and J. Bruinsma. 2012. World agriculture towards 2030/2050: the 2012 revision. ESA Working paper No. 12-03. Rome, FAO.
http://www.fao.org/docrep/016/ap106e/ap106e.pdf
Fertility
UN Estimates and Projections of Family Planning Indicators 2016
http://www.un.org/en/development/desa/population/theme/family-planning/cp_model.shtml
15
The World Health Organization has produced two interactive maps illustrating maternal mortality
(deaths per 100,000 live births) and infant mortality (probability of dying between birth and age 1
per 1000 live births) rates around the world.
UN World Contraceptive Use 2016
http://www.un.org/en/development/desa/population/publications/dataset/contraception/wcu2016.shtml
Age dynamics
UN Populations Facts 2015: Youth population trends and sustainable development
http://www.un.org/en/development/desa/population/publications/pdf/popfacts/PopFacts_2015-1.pdf
UNICEF Division of Data, Research and Policy. August 2014. Generation 2030 Africa
https://www.unicef.org/publications/files/Generation_2030_Africa.pdf
Urbanisation
United Nations, Department of Economic and Social Affairs, Population Division (2014). World Urbanisation Prospects: The 2014 Revision
https://esa.un.org/Unpd/Wup/
The Population Division of the Department of Economic and Social Affairs of the United Nations
has been issuing, since 1988, every two years revised estimates and projections of the urban
and rural populations of all countries in the world and of their major urban agglomerations. This
web site presents the main findings of the 2014 Revision of World Urbanization Prospects which
are consistent with the size of the total population of each country as estimated or projected in
the 2012 Revision of World Population Prospects (United Nations, 2013). The World
Urbanization Prospects are used widely throughout the United Nations and by many international
organizations, research centers, academic researchers and the media.
United Nations, Department of Economic and Social Affairs, Population Division (2014). World Urbanization Prospects: The 2014 Revision, Highlights (ST/ESA/SER.A/352)
https://esa.un.org/unpd/wup/Publications/Files/WUP2014-Highlights.pdf
Migration
United Nations, Department of Economic and Social Affairs, Population Division (2016). International Migration Report 2015: Highlights.
http://www.un.org/en/development/desa/population/migration/publications/migrationreport/docs/MigrationReport2015_Highlights.pdf
Accurate, consistent and timely data on international migration are required to assess current
and future needs and for setting policy priorities to promote inclusive and equitable development
for all. The UN Population Division tracks systematically the levels and trends in international
migration and provides estimates of the number of international migrant stocks disaggregated by
age, sex and place of origin for all countries and areas of the world. This report, however, does

16
not provide projections of international migration. The UN Population Division has though
identified a necessity for migration forecasts.
Azose, J.J. & Raftery, A.E. Bayesian Probabilistic Projection of International Migration. Demography (2015) 52: 1627. doi:10.1007/s13524-015-0415-0
https://link.springer.com/article/10.1007/s13524-015-0415-0
This paper develops a model to produce probabilistic projections of future net migration for all
countries, disaggregated by age and sex.
Abel, G. J, and Sander N. Quantifying Global International Migration Flows. 2014. Science. 343: 1520
http://science.sciencemag.org/content/sci/343/6178/1520.full.pdf
Existing data on global bilateral migration flows are incomplete and incomparable because
national statistical agencies do not measure migration or variation in the way migration flows are
defined. Measurements of the number of people living in a country other than the one in which
they were born, are more widely available, but do not capture trends and patterns of global
migration flows. This paper presents data on bilateral flows between 196 countries from 1990
through 2010 providing an overview of international migration flows. The data suggests a stable
intensity of global 5-year migration flows at approximately 0.6 percent of world population since
1995. The authors estimate the largest movements to occur between South and West Asia, from
Latin to North America and within Africa.
Education
Lutz W, Butz WP & KC Samir (2014). World population & Human Capital in the Twenty-first Century.
http://www.oeaw.ac.at/fileadmin/subsites/Institute/VID/dataexplorer/index.html
Data of the global population projections by age, sex and education can be explored on the
Wittgenstein Centre Data Explorer. Data indicators of human capital include educational
attainment distribution, mean years of schooling, gender gap in mean years schooling and
gender gap in educational attainment.
UNESCO (2016) The effect of varying population estimates on the calculation of enrolment rates and out-of-school rates
http://uis.unesco.org/sites/default/files/documents/the-effect-of-varying-population-estimates-on-the-calculation-of-enrolment-rates-and-out-of-school-rates-2016-en_0.pdf
Burden of Disease
Mathers C.D. and Loncar D. Projections of Global Mortality and Burden of Disease from 2002 to 2030. PLoS Medicine 2006. 3(11):e442
http://journals.plos.org/plosmedicine/article/file?id=10.1371/journal.pmed.0030442&type=printable
17
This paper provides updated projections on the 1990 Global Burden of Diseases study of
mortality and burden of disease, up to 2030 starting from the 2002 WHO global estimates of
mortality and burden of disease. In the baseline and pessimistic scenarios, the researchers
predict that by 2030, the three leading causes of illness will be HIV/AIDS, depression and
ischaemic heart disease. In the optimistic scenario, road-traffic accidents will replace heart
disease as the third leading cause. The results depend strongly on the assumption that future
mortality trends in poor countries will have a relationship to economic and social development
like those that have occurred in the higher-income countries.
WHO and World Bank Group World Report on Disability. 2011
http://www.who.int/disabilities/world_report/2011/report.pdf
The first World report on disability highlights the different barriers that people with disabilities face
– attitudinal, physical and financial. The prevalence of disability is increasing due to ageing
populations and the higher risk of disability in older people as well as the global increase in
chronic health conditions such as diabetes, cardiovascular disease, cancer and mental health
disorders. Across the world, people with disabilities have poorer health outcomes, lower
education achievements, less economic participation and higher rates of poverty than people
without disabilities. This is partly because people with disabilities experience barriers in
accessing services that many of us have long taken for granted, including health, education,
employment, and transport as well as information. These difficulties are exacerbated in less
advantaged communities.
It is projected that there will continue to be large increases in non-communicable disease-related
Years Lost due to Disability (YLDs) in rapidly developing countries. This will be due to population
ageing, reduction in infectious conditions, lower fertility and changing lifestyles related to
tobacco, alcohol, diet and physical activity.
Food security
The key source on providing early warning and analysis on acute food insecurity is the Famine
Early Warning System (www.fews.net). Created in 1985 by USAID, FEWS NET provides
objective evidence-based analysis on more than 36 of the world’s most food-insecure countries
to help government decision-makers and relief agencies plan for and respond to humanitarian
crises.
Economics
Labour force surveys are the main source of statistics for monitoring labour market, labour under-
utilization including unemployment, and the quality of jobs and working condition of persons in
employment
International Labour Organization ILOSTAT
http://www.ilo.org/ilostat
Estimates and projections of the employed populations by the ILO.
CSA Ethiopia. National Labour Force Survey 2013
http://www.csa.gov.et/index.php/survey-report/category/34-nlfs-2013
18
4. References
Bongaarts J, Bulatao R. Beyond Six Billion: Forecasting the World's Population Washington DC:
National Academy Press; 2000.
Lutz W, Butz W, Samir K. World Population & Human Capital in the Twenty-first Century:
Executive Summary. Laxenburg, Austria: IIASA; 2014.
Abel GJ, Barakat B, Kc S, Lutz W. Meeting the Sustainable Development Goals leads to lower
world population growth. Proc Natl Acad Sci U S A. 2016;113(50):14294-9.
Lutz W, Muttarak R. Forecasting societies' adaptive capacities through a demographic
metabolism model. Nature Climate Change. 2017;7:177-84.
United Nations Department of Economic and Social Affairs Population Division. Report on the
Inquiry on National Institutional Capacity to Produce Population Estimates and Projections. 2010.
Tatem AJ. WorldPop, open data for spatial demography. Sci Data. 2017;4:170004.
UNFPA I, WHO,. The State of the World's Midwifery 2014: A Universal Pathway. A Woman's
Right to Health. 2014.
Linard C, Tatem AJ, Gilbert M. Modelling spatial patterns of urban growth in Africa. Appl Geogr.
2013;44:23-32.
Sorichetta A, Hornby GM, Stevens FR, Gaughan AE, Linard C, Tatem AJ. High-resolution
gridded population datasets for Latin America and the Caribbean in 2010, 2015, and 2020. Sci
Data. 2015;2:150045.
Steele JE, Sundsoy PR, Pezzulo C, Alegana VA, Bird TJ, Blumenstock J, et al. Mapping poverty
using mobile phone and satellite data. J R Soc Interface. 2017;14(127).
Wesolowski A, Eagle N, Tatem AJ, Smith DL, Noor AM, Snow RW, et al. Quantifying the impact
of human mobility on malaria. Science. 2012;338(6104):267-70.
Deville P, Linard C, Martin S, Gilbert M, Stevens FR, Gaughan AE, et al. Dynamic population
mapping using mobile phone data. Proc Natl Acad Sci U S A. 2014;111(45):15888-93.
Moreland S, Talbird S. Achieving the Millennium Development Goals: The contribution of fulfilling
the unmet need for family planning USAID; 2006.
Acknowledgements
We thank the following experts who voluntarily provided suggestions for relevant literature or
other advice to the author to support the preparation of this report. The content of the report is
the sole responsibility of the author and does not necessarily reflect the opinions of any of the
experts consulted.
Patrick Gerland, UN Population Division
Andrew Tatem, WorldPop and Flowminder Foundation

19
Suggested citation
Millington, K.A. and Cleland, J. (2017). Counting people and making people count: Key sources
of population projections. K4D Helpdesk Report. Liverpool, UK.
About this report
This report is based on five days of desk-based research. The K4D research helpdesk provides rapid syntheses
of a selection of recent relevant literature and international expert thinking in response to specific questions
relating to international development. For any enquiries, contact [email protected].
K4D services are provided by a consortium of leading organisations working in international development, led by
the Institute of Development Studies (IDS), with Education Development Trust, Itad, University of Leeds Nuffield
Centre for International Health and Development, Liverpool School of Tropical Medicine (LSTM), University of
Birmingham International Development Department (IDD) and the University of Manchester Humanitarian and
Conflict Response Institute (HCRI).
This report was prepared for the UK Government’s Department for International
Development (DFID) and its partners in support of pro-poor programmes. It is licensed for
non-commercial purposes only. K4D cannot be held responsible for errors or any
consequences arising from the use of information contained in this report. Any views and
opinions expressed do not necessarily reflect those of DFID, K4D or any other contributing
organisation. © DFID - Crown copyright 2017.