county opioid quarterly report published january, 2018 - new york … · new york state - county...
TRANSCRIPT

New York State - County Opioid Quarterly Report Published January, 2018
New York State Department of Health

(This page is intentionally left blank)

Table of ContentsIntroduction ...........................................................................................................................................5
Albany County .......................................................................................................................................8
Allegany County ....................................................................................................................................10
Broome County ...................................................................................................................................12
Cattaraugus County .................................................................................................................................14
Cayuga County ...................................................................................................................................16
Chautauqua County ................................................................................................................................18
Chemung County .................................................................................................................................20
Chenango County .................................................................................................................................22
Clinton County ......................................................................................................................................24
Columbia County ..................................................................................................................................26
Cortland County ....................................................................................................................................28
Delaware County ..................................................................................................................................30
Dutchess County ...................................................................................................................................32
Erie County .......................................................................................................................................34
Essex County .....................................................................................................................................36
Franklin County .....................................................................................................................................38
Fulton County ......................................................................................................................................40
Genesee County ..................................................................................................................................42
Greene County ....................................................................................................................................44
Hamilton County ...................................................................................................................................46
Herkimer County ...................................................................................................................................48
Jefferson County ....................................................................................................................................50
Lewis County ......................................................................................................................................52
Livingston County ...................................................................................................................................54
Madison County ...................................................................................................................................56
Monroe County ...................................................................................................................................58
Montgomery County ...............................................................................................................................60
Nassau County ...................................................................................................................................62
Niagara County ....................................................................................................................................64
Oneida County ....................................................................................................................................66
Onondaga County .................................................................................................................................68

Ontario County .....................................................................................................................................70
Orange County ....................................................................................................................................72
Orleans County ....................................................................................................................................74
Oswego County ..................................................................................................................................76
Otsego County ....................................................................................................................................78
Putnam County ...................................................................................................................................80
Rensselaer County .................................................................................................................................82
Rockland County ...................................................................................................................................84
St. Lawrence County ................................................................................................................................86
Saratoga County ...................................................................................................................................88
Schenectady County ................................................................................................................................90
Schoharie County ..................................................................................................................................92
Schuyler County ....................................................................................................................................94
Seneca County ...................................................................................................................................96
Steuben County ...................................................................................................................................98
Suffolk County ................................................................................................................................... 100
Sullivan County .................................................................................................................................. 102
Tioga County ................................................................................................................................... 104
Tompkins County ............................................................................................................................... 106
Ulster County ................................................................................................................................... 108
Warren County ................................................................................................................................. 110
Washington County ............................................................................................................................. 112
Wayne County ................................................................................................................................ 114
Westchester County ............................................................................................................................. 116
Wyoming County .............................................................................................................................. 118
Yates County ................................................................................................................................... 120
Bronx County .................................................................................................................................. 122
Kings County ................................................................................................................................... 124
New York County ............................................................................................................................... 126
Queens County ................................................................................................................................ 128
Richmond County .............................................................................................................................. 130
Methods ...................................................................................................................................... 132
Acknowledgments .............................................................................................................................. 138

Introduction In response to the growing opioid public health crisis, Governor Andrew M. Cuomo convened a Heroin and Opioid Task Force in May 2016. This group was charged with developing a comprehensive plan to fight against this epidemic in New York State.1 The Task Force gathered perspectives and information from communities across the state to produce a comprehensive report with actionable recommendations to target heroin and opioid abuse.2 One recommendation highlighted the need to improve the reporting and use of heroin and opioid data collected to help spot trends and respond to local needs. This recommendation was included in a comprehensive package of bills signed by Governor Cuomo, intended to combat opioid and heroin issues within the state by focusing on prevention, education, treatment, and recovery.3
Prevention efforts include improving timely opioid overdose reporting to key stakeholders. This information is a valuable tool for planning and can help identify where communities are struggling, help tailor interventions, and show improvements.
In accordance with the recommendations and legislation, the New York State Department of Health (NYSDOH) is providing opioid overdose information (deaths, emergency department (ED) visits, and hospitalizations) by county in this quarterly report. The reported cases are based on the county of residence. Opioids include both prescription opioid pain relievers, such as hydrocodone, oxycodone, and morphine, as well as heroin and opium. This report does not fully capture the burden of opioid abuse and dependence in New York State.
The New York State Office of Alcoholism and Substance Abuse Services (OASAS) is providing data on unique clients admitted for heroin and unique clients admitted for any opioid. This information comes from the OASAS Client Data System (CDS). The CDS collects data on every person admitted to an OASAS-certified chemical dependence treatment program. The reported cases are based on the county of residence at the time of admission. County residents admitted more than once per quarter or year are counted only once. The data are presented as two indicators:
• People admitted for heroin use (i.e., unique people by county of residence where heroin wasthe primary, secondary or tertiary substance of abuse at admission), and
• People admitted for the use of any opioid, including heroin (i.e., heroin or another opioid wasthe primary, secondary or tertiary substance of abuse at admission).
The CDS includes data for individuals served in the OASAS-certified treatment system. It does not have data for individuals who do not enter treatment, get treated by the U.S. Department of Veterans Affairs, go outside New York State for treatment, are admitted to hospitals but not to chemical dependence treatment, or receive an addictions medication from a physician outside the OASAS system of care.
This report also provides information on administrations of naloxone reported by Community Opioid Overdose Prevention (COOP) programs registered with the NYSDOH, by law enforcement agencies, and by Emergency Medical Services (EMS) agencies. Naloxone data in the report reflect the county in which the overdose response occurred and in which the naloxone was administered—not necessarily the county of the overdosed person’s residence.
1 https://www.governor.ny.gov/news/governor-cuomo-announces-statewide-task-force-combat-heroin-and-prescription-opioid-crisis 2 https://www.governor.ny.gov/sites/governor.ny.gov/files/atoms/files/HeroinTaskForceReport_3.pdf 3 https://www.governor.ny.gov/news/governor-cuomo-signs-legislation-combat-heroin-and-opioid-crisis
5

Since 2006, overdose programs registered with NYSDOH—to date, numbering more than 500 statewide—have trained community responders to recognize and respond to opioid overdoses pending the arrival of EMS personnel. That response includes the administration of naloxone. These efforts were broadened in 2014 to include law enforcement personnel who are frequently on the scene of an overdose before EMS arrives.
The data in this report have some limitations. Significant time lag in confirming and reporting the causes of death and patient information to the NYSDOH impact data completeness. For example, overdose mortalities take time to be confirmed because of factors such as toxicology tests. As a result, the mortality numbers in this report may not reflect all deaths that have occurred within a given quarter or year. Therefore, data in this report are not considered complete by the NYSDOH and should be used and interpreted with caution. Mortality, hospitalization, and ED data may change as deaths, hospitalizations, and ED visits are confirmed and reported. Subsequent quarterly reports may contain figures which differ from a previous report due to additional confirmations, updates and timing of data received. For example, there is a substantial increase in the 2016 figures for New York State excluding New York City in the reports published from October 2017 and later compared to reports published in July 2017 and prior. These differences were due largely to individuals with an undetermined cause of death having subsequently been determined to have died from opioid poisoning since the publication of the earlier reports.
The current 2016 figures also show a substantial increase in the number of opioid deaths as compared to figures for 2015 (not included in this report). While it seems likely that the actual number of opioid deaths have increased, it is possible that factors such as greater efficiency in collecting death records with the implementation of the Electronic Death Reporting System, improved reporting of drug and opioid involvement on the death certificate, and more frequent toxicological testing in light of greater awareness of the opioid epidemic, could have also contributed to the observed increase. Furthermore, due to the small frequencies, rates should be interpreted with caution. When rates are based on only a few cases, small changes in frequencies can produce large changes in the rates, making it difficult to discern true changes from chance fluctuation.4
Significant time lag in the electronic reporting of admissions to OASAS-certified treatment programs affect data completeness. Generally, admissions are not considered substantially complete until three months after the end of the clinical admission month. Therefore, data in this report are not considered complete by OASAS and should be used and interpreted with caution. Quarterly and yearly data may be updated as additional admissions are reported to OASAS by certified treatment programs. Subsequent reports may contain numbers for a quarter that differ from the previous report because they include additional reported admissions. The number of unique individuals admitted per year does not equal the sum of the people admitted each quarter. This is because an individual could be admitted to treatment in more than one quarter during the year.
Most EMS naloxone administration results in this report were generated from electronically submitted pre-hospital care reports (e-PCR), except for Suffolk County where results were obtained from Regional EMS Medical Control data. Starting in the third quarter of 2017, Nassau County naloxone data are provided from a combination of e-PCRs and additional reports of EMS services collected by the Nassau County Police Department. Nassau County counts of naloxone administrations for all quarters have been updated using this method and may differ from those published in previous reports. Approximately 90% of EMS care provided throughout New York State is reported through e-PCR; however, that should not be interpreted as 90% of care provided and documented in each county. Use of e-PCR is not uniformly distributed across the State. Please note that, as of the July
4 https://www.health.ny.gov/diseases/chronic/ratesmall.htm
6
2017 report, additional data validation steps were taken to de-duplicate 2016 administrations by multiple agencies for the same encounter. Therefore, reductions in the counts for selected counties are observed, as compared to the April 2017 report.
Law enforcement agencies and COOP programs are mandated by regulation to report naloxone administrations. All naloxone administration data are based on self-report. There are instances in which not all data fields are completed by the responder. There is often a lag in data reporting. Increases may represent program expansions, and may or may not indicate increases in overdose events. All data should be interpreted with caution. The law enforcement data in this report do not yet comprehensively include reports from law enforcement agencies in New York City and Nassau County. These agencies use distinct reporting mechanisms.
People with questions or requests for additional information should contact [email protected].
7
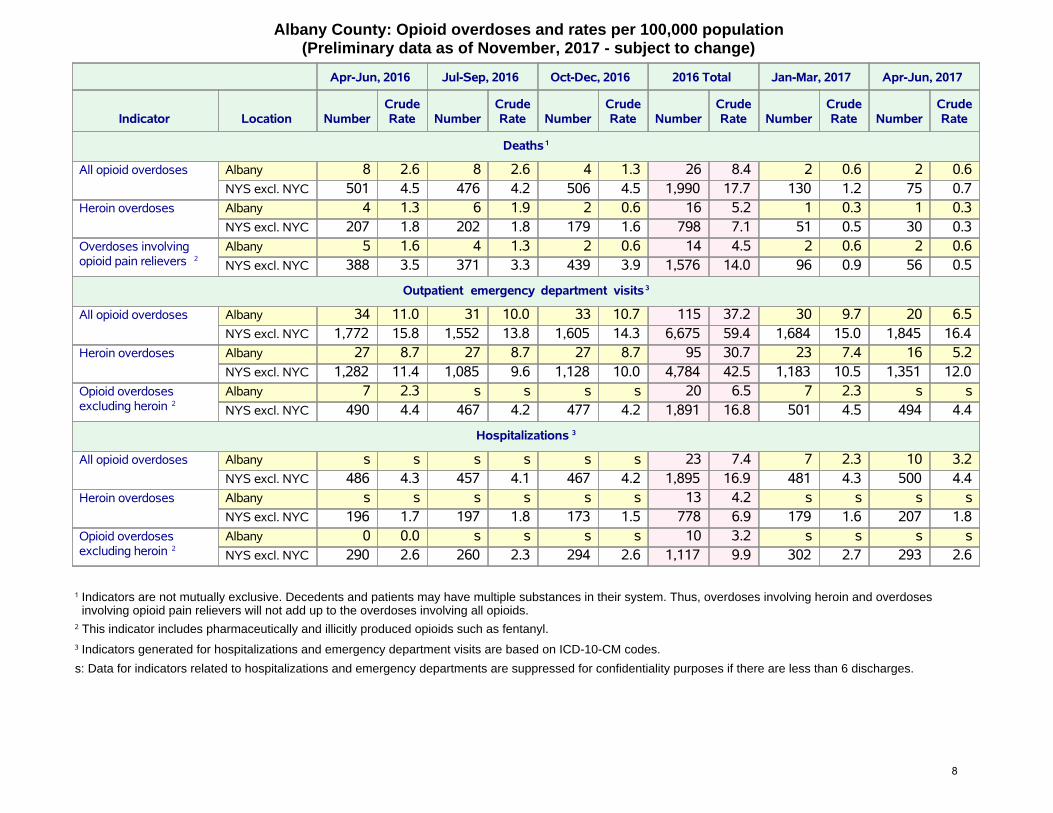
Albany County: Opioid overdoses and rates per 100,000 population (Preliminary data as of November, 2017 - subject to change)
Apr-Jun, 2016 Jul-Sep, 2016 Oct-Dec, 2016 2016 Total Jan-Mar, 2017 Apr-Jun, 2017
Indicator Location NumberCrudeRate Number
CrudeRate Number
CrudeRate Number
CrudeRate Number
CrudeRate Number
CrudeRate
Deaths 1
All opioid overdoses Albany 8 2.6 8 2.6 4 1.3 26 8.4 2 0.6 2 0.6NYS excl. NYC 501 4.5 476 4.2 506 4.5 1,990 17.7 130 1.2 75 0.7
Heroin overdoses Albany 4 1.3 6 1.9 2 0.6 16 5.2 1 0.3 1 0.3NYS excl. NYC 207 1.8 202 1.8 179 1.6 798 7.1 51 0.5 30 0.3
Overdoses involvingopioid pain relievers 2
Albany 5 1.6 4 1.3 2 0.6 14 4.5 2 0.6 2 0.6NYS excl. NYC 388 3.5 371 3.3 439 3.9 1,576 14.0 96 0.9 56 0.5
Outpatient emergency department visits 3
All opioid overdoses Albany 34 11.0 31 10.0 33 10.7 115 37.2 30 9.7 20 6.5NYS excl. NYC 1,772 15.8 1,552 13.8 1,605 14.3 6,675 59.4 1,684 15.0 1,845 16.4
Heroin overdoses Albany 27 8.7 27 8.7 27 8.7 95 30.7 23 7.4 16 5.2NYS excl. NYC 1,282 11.4 1,085 9.6 1,128 10.0 4,784 42.5 1,183 10.5 1,351 12.0
Opioid overdosesexcluding heroin 2
Albany 7 2.3 s s s s 20 6.5 7 2.3 s sNYS excl. NYC 490 4.4 467 4.2 477 4.2 1,891 16.8 501 4.5 494 4.4
Hospitalizations 3
All opioid overdoses Albany s s s s s s 23 7.4 7 2.3 10 3.2NYS excl. NYC 486 4.3 457 4.1 467 4.2 1,895 16.9 481 4.3 500 4.4
Heroin overdoses Albany s s s s s s 13 4.2 s s s sNYS excl. NYC 196 1.7 197 1.8 173 1.5 778 6.9 179 1.6 207 1.8
Opioid overdosesexcluding heroin 2
Albany 0 0.0 s s s s 10 3.2 s s s sNYS excl. NYC 290 2.6 260 2.3 294 2.6 1,117 9.9 302 2.7 293 2.6
1 Indicators are not mutually exclusive. Decedents and patients may have multiple substances in their system. Thus, overdoses involving heroin and overdosesinvolving opioid pain relievers will not add up to the overdoses involving all opioids.
2 This indicator includes pharmaceutically and illicitly produced opioids such as fentanyl.
3 Indicators generated for hospitalizations and emergency department visits are based on ICD-10-CM codes.
s: Data for indicators related to hospitalizations and emergency departments are suppressed for confidentiality purposes if there are less than 6 discharges.
8

Albany County: Unique clients admitted to OASAS-certified chemical dependence treatment programs 1,2
(Preliminary data as of October, 2017 - subject to change)
2015 2016 2017
Indicator Total Jan-Mar Apr-Jun Jul-Sep Oct-Dec Total Jan-Mar Apr-Jun
Unique clients admitted forheroin
972 297 309 333 305 972 308 347
Unique clients admitted for anyopioid (incl. heroin)
1,189 363 388 397 363 1,196 371 428
OASAS: Office of Alcoholism and Substance Abuse Services
1 The number of unique clients admitted per year does not equal the sum of the unique clients admitted each quarter. This is because an individual client can beadmitted to treatment in more than one quarter during the year.
2 Clients may have heroin, other opioids, or any other substance simultaneously recorded as the primary, secondary and tertiary substance of abuse at admission.
s: Data for indicators are suppressed for confidentiality purposes if there are less than 6 clients.
Albany County: Naloxone administration reports (Preliminary data as of November, 2017 - subject to change)
2015 2016 2017
Indicator Location Total Jan-Mar Apr-Jun Jul-Sep Oct-Dec Total Jan-Mar Apr-Jun Jul-Sep
Emergency Medical Services (EMS) naloxone administration reports 1,2
Naloxone administration reportby EMS
Albany 173 43 57 64 52 216 62 80 86NYS excl. NYC 6,115 1,730 2,009 1,747 1,542 7,028 1,518 1,710 1,702
Law enforcement naloxone administration reports 3
Naloxone administration reportby law enforcement
Albany 5 2 4 1 1 8 2 1 0NYS excl. NYC 956 404 402 392 346 1,544 336 443 331
Registered Community Opioid Overdose Prevention (COOP) program naloxone administration reports 3
Naloxone administration reportby registered COOP program
Albany 21 8 5 7 9 29 5 9 2NYS excl. NYC 489 255 248 224 176 903 182 239 107
1 County numbers displayed in the table represent only naloxone administration events reported electronically, therefore, actual numbers of events may be higher.
2 EMS reporting may have been affected by a change in documentation systems used by EMS agency/ies serving the area. Counts may decrease until updates to thedata are available in 2018, if applicable.
3 Numbers displayed in the table represent only naloxone administration reports submitted by law enforcement and registered COOP programs to the NYSDOH AIDSInstitute. The actual numbers of naloxone administration events may be higher.
9

Allegany County: Opioid overdoses and rates per 100,000 population (Preliminary data as of November, 2017 - subject to change)
Apr-Jun, 2016 Jul-Sep, 2016 Oct-Dec, 2016 2016 Total Jan-Mar, 2017 Apr-Jun, 2017
Indicator Location NumberCrudeRate Number
CrudeRate Number
CrudeRate Number
CrudeRate Number
CrudeRate Number
CrudeRate
Deaths 1
All opioid overdoses Allegany 1 2.1 0 0.0 0 0.0 2 4.2 0 0.0 0 0.0NYS excl. NYC 501 4.5 476 4.2 506 4.5 1,990 17.7 130 1.2 75 0.7
Heroin overdoses Allegany 0 0.0 0 0.0 0 0.0 0 0.0 0 0.0 0 0.0NYS excl. NYC 207 1.8 202 1.8 179 1.6 798 7.1 51 0.5 30 0.3
Overdoses involvingopioid pain relievers 2
Allegany 1 2.1 0 0.0 0 0.0 1 2.1 0 0.0 0 0.0NYS excl. NYC 388 3.5 371 3.3 439 3.9 1,576 14.0 96 0.9 56 0.5
Outpatient emergency department visits 3
All opioid overdoses Allegany 7 14.7 s s 7 14.7 32 67.4 s s 8 16.9NYS excl. NYC 1,772 15.8 1,552 13.8 1,605 14.3 6,675 59.4 1,684 15.0 1,845 16.4
Heroin overdoses Allegany s s s s s s 22 46.4 s s s sNYS excl. NYC 1,282 11.4 1,085 9.6 1,128 10.0 4,784 42.5 1,183 10.5 1,351 12.0
Opioid overdosesexcluding heroin 2
Allegany s s s s s s 10 21.1 s s s sNYS excl. NYC 490 4.4 467 4.2 477 4.2 1,891 16.8 501 4.5 494 4.4
Hospitalizations 3
All opioid overdoses Allegany s s 0 0.0 s s s s 0 0.0 s sNYS excl. NYC 486 4.3 457 4.1 467 4.2 1,895 16.9 481 4.3 500 4.4
Heroin overdoses Allegany s s 0 0.0 s s s s 0 0.0 0 0.0NYS excl. NYC 196 1.7 197 1.8 173 1.5 778 6.9 179 1.6 207 1.8
Opioid overdosesexcluding heroin 2
Allegany s s 0 0.0 s s s s 0 0.0 s sNYS excl. NYC 290 2.6 260 2.3 294 2.6 1,117 9.9 302 2.7 293 2.6
1 Indicators are not mutually exclusive. Decedents and patients may have multiple substances in their system. Thus, overdoses involving heroin and overdosesinvolving opioid pain relievers will not add up to the overdoses involving all opioids.
2 This indicator includes pharmaceutically and illicitly produced opioids such as fentanyl.
3 Indicators generated for hospitalizations and emergency department visits are based on ICD-10-CM codes.
s: Data for indicators related to hospitalizations and emergency departments are suppressed for confidentiality purposes if there are less than 6 discharges.
10

Allegany County: Unique clients admitted to OASAS-certified chemical dependence treatment programs 1,2
(Preliminary data as of October, 2017 - subject to change)
2015 2016 2017
Indicator Total Jan-Mar Apr-Jun Jul-Sep Oct-Dec Total Jan-Mar Apr-Jun
Unique clients admitted forheroin
94 40 30 29 35 109 33 38
Unique clients admitted for anyopioid (incl. heroin)
169 65 51 52 59 182 52 68
OASAS: Office of Alcoholism and Substance Abuse Services
1 The number of unique clients admitted per year does not equal the sum of the unique clients admitted each quarter. This is because an individual client can beadmitted to treatment in more than one quarter during the year.
2 Clients may have heroin, other opioids, or any other substance simultaneously recorded as the primary, secondary and tertiary substance of abuse at admission.
s: Data for indicators are suppressed for confidentiality purposes if there are less than 6 clients.
Allegany County: Naloxone administration reports (Preliminary data as of November, 2017 - subject to change)
2015 2016 2017
Indicator Location Total Jan-Mar Apr-Jun Jul-Sep Oct-Dec Total Jan-Mar Apr-Jun Jul-Sep
Emergency Medical Services (EMS) naloxone administration reports 1,2
Naloxone administration reportby EMS
Allegany 43 19 8 4 12 43 15 10 11NYS excl. NYC 6,115 1,730 2,009 1,747 1,542 7,028 1,518 1,710 1,702
Law enforcement naloxone administration reports 3
Naloxone administration reportby law enforcement
Allegany 3 1 0 1 0 2 2 1 1NYS excl. NYC 956 404 402 392 346 1,544 336 443 331
Registered Community Opioid Overdose Prevention (COOP) program naloxone administration reports 3
Naloxone administration reportby registered COOP program
Allegany 0 0 0 0 0 0 0 0 0NYS excl. NYC 489 255 248 224 176 903 182 239 107
1 County numbers displayed in the table represent only naloxone administration events reported electronically, therefore, actual numbers of events may be higher.
2 EMS reporting may have been affected by a change in documentation systems used by EMS agency/ies serving the area. Counts may decrease until updates to thedata are available in 2018, if applicable.
3 Numbers displayed in the table represent only naloxone administration reports submitted by law enforcement and registered COOP programs to the NYSDOH AIDSInstitute. The actual numbers of naloxone administration events may be higher.
11

Broome County: Opioid overdoses and rates per 100,000 population (Preliminary data as of November, 2017 - subject to change)
Apr-Jun, 2016 Jul-Sep, 2016 Oct-Dec, 2016 2016 Total Jan-Mar, 2017 Apr-Jun, 2017
Indicator Location NumberCrudeRate Number
CrudeRate Number
CrudeRate Number
CrudeRate Number
CrudeRate Number
CrudeRate
Deaths 1
All opioid overdoses Broome 8 4.1 16 8.1 15 7.6 57 29.0 4 2.0 3 1.5NYS excl. NYC 501 4.5 476 4.2 506 4.5 1,990 17.7 130 1.2 75 0.7
Heroin overdoses Broome 2 1.0 9 4.6 7 3.6 27 13.7 2 1.0 2 1.0NYS excl. NYC 207 1.8 202 1.8 179 1.6 798 7.1 51 0.5 30 0.3
Overdoses involvingopioid pain relievers 2
Broome 7 3.6 9 4.6 8 4.1 33 16.8 2 1.0 2 1.0NYS excl. NYC 388 3.5 371 3.3 439 3.9 1,576 14.0 96 0.9 56 0.5
Outpatient emergency department visits 3
All opioid overdoses Broome 54 27.5 55 28.0 43 21.9 193 98.2 78 39.7 56 28.5NYS excl. NYC 1,772 15.8 1,552 13.8 1,605 14.3 6,675 59.4 1,684 15.0 1,845 16.4
Heroin overdoses Broome 49 24.9 46 23.4 37 18.8 162 82.4 68 34.6 52 26.5NYS excl. NYC 1,282 11.4 1,085 9.6 1,128 10.0 4,784 42.5 1,183 10.5 1,351 12.0
Opioid overdosesexcluding heroin 2
Broome s s 9 4.6 s s 31 15.8 10 5.1 s sNYS excl. NYC 490 4.4 467 4.2 477 4.2 1,891 16.8 501 4.5 494 4.4
Hospitalizations 3
All opioid overdoses Broome 14 7.1 10 5.1 10 5.1 49 24.9 16 8.1 17 8.6NYS excl. NYC 486 4.3 457 4.1 467 4.2 1,895 16.9 481 4.3 500 4.4
Heroin overdoses Broome s s 8 4.1 s s 24 12.2 11 5.6 12 6.1NYS excl. NYC 196 1.7 197 1.8 173 1.5 778 6.9 179 1.6 207 1.8
Opioid overdosesexcluding heroin 2
Broome 8 4.1 s s 7 3.6 25 12.7 s s s sNYS excl. NYC 290 2.6 260 2.3 294 2.6 1,117 9.9 302 2.7 293 2.6
1 Indicators are not mutually exclusive. Decedents and patients may have multiple substances in their system. Thus, overdoses involving heroin and overdosesinvolving opioid pain relievers will not add up to the overdoses involving all opioids.
2 This indicator includes pharmaceutically and illicitly produced opioids such as fentanyl.
3 Indicators generated for hospitalizations and emergency department visits are based on ICD-10-CM codes.
s: Data for indicators related to hospitalizations and emergency departments are suppressed for confidentiality purposes if there are less than 6 discharges.
12

Broome County: Unique clients admitted to OASAS-certified chemical dependence treatment programs 1,2
(Preliminary data as of October, 2017 - subject to change)
2015 2016 2017
Indicator Total Jan-Mar Apr-Jun Jul-Sep Oct-Dec Total Jan-Mar Apr-Jun
Unique clients admitted forheroin
820 288 317 347 332 923 340 345
Unique clients admitted for anyopioid (incl. heroin)
972 350 363 404 384 1,093 377 383
OASAS: Office of Alcoholism and Substance Abuse Services
1 The number of unique clients admitted per year does not equal the sum of the unique clients admitted each quarter. This is because an individual client can beadmitted to treatment in more than one quarter during the year.
2 Clients may have heroin, other opioids, or any other substance simultaneously recorded as the primary, secondary and tertiary substance of abuse at admission.
s: Data for indicators are suppressed for confidentiality purposes if there are less than 6 clients.
Broome County: Naloxone administration reports (Preliminary data as of November, 2017 - subject to change)
2015 2016 2017
Indicator Location Total Jan-Mar Apr-Jun Jul-Sep Oct-Dec Total Jan-Mar Apr-Jun Jul-Sep
Emergency Medical Services (EMS) naloxone administration reports 1,2
Naloxone administration reportby EMS
Broome 317 70 58 106 54 288 124 96 70NYS excl. NYC 6,115 1,730 2,009 1,747 1,542 7,028 1,518 1,710 1,702
Law enforcement naloxone administration reports 3
Naloxone administration reportby law enforcement
Broome 17 7 13 15 15 50 11 11 9NYS excl. NYC 956 404 402 392 346 1,544 336 443 331
Registered Community Opioid Overdose Prevention (COOP) program naloxone administration reports 3
Naloxone administration reportby registered COOP program
Broome 32 28 55 49 3 135 10 5 5NYS excl. NYC 489 255 248 224 176 903 182 239 107
1 County numbers displayed in the table represent only naloxone administration events reported electronically, therefore, actual numbers of events may be higher.Additional data validation steps have been taken to de-duplicate 2016 administrations by multiple agencies for the same patient encounter.
2 EMS reporting may have been affected by a change in documentation systems used by EMS agency/ies serving the area. Counts may decrease until updates to thedata are available in 2018, if applicable.
3 Numbers displayed in the table represent only naloxone administration reports submitted by law enforcement and registered COOP programs to the NYSDOH AIDSInstitute. The actual numbers of naloxone administration events may be higher.
13

Cattaraugus County: Opioid overdoses and rates per 100,000 population (Preliminary data as of November, 2017 - subject to change)
Apr-Jun, 2016 Jul-Sep, 2016 Oct-Dec, 2016 2016 Total Jan-Mar, 2017 Apr-Jun, 2017
Indicator Location NumberCrudeRate Number
CrudeRate Number
CrudeRate Number
CrudeRate Number
CrudeRate Number
CrudeRate
Deaths 1
All opioid overdoses Cattaraugus 5 6.4 1 1.3 1 1.3 7 9.0 0 0.0 1 1.3NYS excl. NYC 501 4.5 476 4.2 506 4.5 1,990 17.7 130 1.2 75 0.7
Heroin overdoses Cattaraugus 2 2.6 0 0.0 0 0.0 2 2.6 0 0.0 1 1.3NYS excl. NYC 207 1.8 202 1.8 179 1.6 798 7.1 51 0.5 30 0.3
Overdoses involvingopioid pain relievers 2
Cattaraugus 4 5.1 1 1.3 1 1.3 6 7.7 0 0.0 1 1.3NYS excl. NYC 388 3.5 371 3.3 439 3.9 1,576 14.0 96 0.9 56 0.5
Outpatient emergency department visits 3
All opioid overdoses Cattaraugus 9 11.6 7 9.0 16 20.5 56 71.9 9 11.6 13 16.7NYS excl. NYC 1,772 15.8 1,552 13.8 1,605 14.3 6,675 59.4 1,684 15.0 1,845 16.4
Heroin overdoses Cattaraugus 8 10.3 s s 13 16.7 44 56.5 7 9.0 7 9.0NYS excl. NYC 1,282 11.4 1,085 9.6 1,128 10.0 4,784 42.5 1,183 10.5 1,351 12.0
Opioid overdosesexcluding heroin 2
Cattaraugus s s s s s s 12 15.4 s s s sNYS excl. NYC 490 4.4 467 4.2 477 4.2 1,891 16.8 501 4.5 494 4.4
Hospitalizations 3
All opioid overdoses Cattaraugus s s s s s s 10 12.8 s s s sNYS excl. NYC 486 4.3 457 4.1 467 4.2 1,895 16.9 481 4.3 500 4.4
Heroin overdoses Cattaraugus s s s s 0 0.0 s s s s 0 0.0NYS excl. NYC 196 1.7 197 1.8 173 1.5 778 6.9 179 1.6 207 1.8
Opioid overdosesexcluding heroin 2
Cattaraugus s s 0 0.0 s s s s s s s sNYS excl. NYC 290 2.6 260 2.3 294 2.6 1,117 9.9 302 2.7 293 2.6
1 Indicators are not mutually exclusive. Decedents and patients may have multiple substances in their system. Thus, overdoses involving heroin and overdosesinvolving opioid pain relievers will not add up to the overdoses involving all opioids.
2 This indicator includes pharmaceutically and illicitly produced opioids such as fentanyl.
3 Indicators generated for hospitalizations and emergency department visits are based on ICD-10-CM codes.
s: Data for indicators related to hospitalizations and emergency departments are suppressed for confidentiality purposes if there are less than 6 discharges.
14

Cattaraugus County: Unique clients admitted to OASAS-certified chemical dependence treatment programs 1,2
(Preliminary data as of October, 2017 - subject to change)
2015 2016 2017
Indicator Total Jan-Mar Apr-Jun Jul-Sep Oct-Dec Total Jan-Mar Apr-Jun
Unique clients admitted forheroin
152 65 67 82 68 236 75 71
Unique clients admitted for anyopioid (incl. heroin)
343 108 110 161 134 432 130 145
OASAS: Office of Alcoholism and Substance Abuse Services
1 The number of unique clients admitted per year does not equal the sum of the unique clients admitted each quarter. This is because an individual client can beadmitted to treatment in more than one quarter during the year.
2 Clients may have heroin, other opioids, or any other substance simultaneously recorded as the primary, secondary and tertiary substance of abuse at admission.
s: Data for indicators are suppressed for confidentiality purposes if there are less than 6 clients.
Cattaraugus County: Naloxone administration reports (Preliminary data as of November, 2017 - subject to change)
2015 2016 2017
Indicator Location Total Jan-Mar Apr-Jun Jul-Sep Oct-Dec Total Jan-Mar Apr-Jun Jul-Sep
Emergency Medical Services (EMS) naloxone administration reports 1,2
Naloxone administration reportby EMS
Cattaraugus 46 26 20 16 23 85 15 25 11NYS excl. NYC 6,115 1,730 2,009 1,747 1,542 7,028 1,518 1,710 1,702
Law enforcement naloxone administration reports 3
Naloxone administration reportby law enforcement
Cattaraugus 10 7 2 0 1 10 3 3 1NYS excl. NYC 956 404 402 392 346 1,544 336 443 331
Registered Community Opioid Overdose Prevention (COOP) program naloxone administration reports 3
Naloxone administration reportby registered COOP program
Cattaraugus 4 0 0 0 2 2 0 0 0NYS excl. NYC 489 255 248 224 176 903 182 239 107
1 County numbers displayed in the table represent only naloxone administration events reported electronically, therefore, actual numbers of events may be higher.
2 EMS reporting may have been affected by a change in documentation systems used by EMS agency/ies serving the area. Counts may decrease until updates to thedata are available in 2018, if applicable.
3 Numbers displayed in the table represent only naloxone administration reports submitted by law enforcement and registered COOP programs to the NYSDOH AIDSInstitute. The actual numbers of naloxone administration events may be higher.
15

Cayuga County: Opioid overdoses and rates per 100,000 population (Preliminary data as of November, 2017 - subject to change)
Apr-Jun, 2016 Jul-Sep, 2016 Oct-Dec, 2016 2016 Total Jan-Mar, 2017 Apr-Jun, 2017
Indicator Location NumberCrudeRate Number
CrudeRate Number
CrudeRate Number
CrudeRate Number
CrudeRate Number
CrudeRate
Deaths 1
All opioid overdoses Cayuga 4 5.1 3 3.8 5 6.4 16 20.4 1 1.3 1 1.3NYS excl. NYC 501 4.5 476 4.2 506 4.5 1,990 17.7 130 1.2 75 0.7
Heroin overdoses Cayuga 1 1.3 1 1.3 2 2.6 6 7.7 0 0.0 1 1.3NYS excl. NYC 207 1.8 202 1.8 179 1.6 798 7.1 51 0.5 30 0.3
Overdoses involvingopioid pain relievers 2
Cayuga 3 3.8 3 3.8 5 6.4 15 19.2 1 1.3 0 0.0NYS excl. NYC 388 3.5 371 3.3 439 3.9 1,576 14.0 96 0.9 56 0.5
Outpatient emergency department visits 3
All opioid overdoses Cayuga 17 21.7 26 33.2 14 17.9 77 98.4 20 25.5 7 8.9NYS excl. NYC 1,772 15.8 1,552 13.8 1,605 14.3 6,675 59.4 1,684 15.0 1,845 16.4
Heroin overdoses Cayuga 15 19.2 12 15.3 9 11.5 51 65.1 13 16.6 s sNYS excl. NYC 1,282 11.4 1,085 9.6 1,128 10.0 4,784 42.5 1,183 10.5 1,351 12.0
Opioid overdosesexcluding heroin 2
Cayuga s s 14 17.9 s s 26 33.2 7 8.9 s sNYS excl. NYC 490 4.4 467 4.2 477 4.2 1,891 16.8 501 4.5 494 4.4
Hospitalizations 3
All opioid overdoses Cayuga s s 0 0.0 s s 14 17.9 s s s sNYS excl. NYC 486 4.3 457 4.1 467 4.2 1,895 16.9 481 4.3 500 4.4
Heroin overdoses Cayuga s s 0 0.0 s s 8 10.2 s s 0 0.0NYS excl. NYC 196 1.7 197 1.8 173 1.5 778 6.9 179 1.6 207 1.8
Opioid overdosesexcluding heroin 2
Cayuga 0 0.0 0 0.0 s s s s s s s sNYS excl. NYC 290 2.6 260 2.3 294 2.6 1,117 9.9 302 2.7 293 2.6
1 Indicators are not mutually exclusive. Decedents and patients may have multiple substances in their system. Thus, overdoses involving heroin and overdosesinvolving opioid pain relievers will not add up to the overdoses involving all opioids.
2 This indicator includes pharmaceutically and illicitly produced opioids such as fentanyl.
3 Indicators generated for hospitalizations and emergency department visits are based on ICD-10-CM codes.
s: Data for indicators related to hospitalizations and emergency departments are suppressed for confidentiality purposes if there are less than 6 discharges.
16

Cayuga County: Unique clients admitted to OASAS-certified chemical dependence treatment programs 1,2
(Preliminary data as of October, 2017 - subject to change)
2015 2016 2017
Indicator Total Jan-Mar Apr-Jun Jul-Sep Oct-Dec Total Jan-Mar Apr-Jun
Unique clients admitted forheroin
268 85 88 95 93 290 80 101
Unique clients admitted for anyopioid (incl. heroin)
348 114 111 118 110 361 103 135
OASAS: Office of Alcoholism and Substance Abuse Services
1 The number of unique clients admitted per year does not equal the sum of the unique clients admitted each quarter. This is because an individual client can beadmitted to treatment in more than one quarter during the year.
2 Clients may have heroin, other opioids, or any other substance simultaneously recorded as the primary, secondary and tertiary substance of abuse at admission.
s: Data for indicators are suppressed for confidentiality purposes if there are less than 6 clients.
Cayuga County: Naloxone administration reports (Preliminary data as of November, 2017 - subject to change)
2015 2016 2017
Indicator Location Total Jan-Mar Apr-Jun Jul-Sep Oct-Dec Total Jan-Mar Apr-Jun Jul-Sep
Emergency Medical Services (EMS) naloxone administration reports 1,2
Naloxone administration reportby EMS
Cayuga 60 11 11 16 15 53 12 8 5NYS excl. NYC 6,115 1,730 2,009 1,747 1,542 7,028 1,518 1,710 1,702
Law enforcement naloxone administration reports 3
Naloxone administration reportby law enforcement
Cayuga 7 3 2 3 2 10 2 2 2NYS excl. NYC 956 404 402 392 346 1,544 336 443 331
Registered Community Opioid Overdose Prevention (COOP) program naloxone administration reports 3
Naloxone administration reportby registered COOP program
Cayuga 0 1 1 0 0 2 0 1 0NYS excl. NYC 489 255 248 224 176 903 182 239 107
1 County numbers displayed in the table represent only naloxone administration events reported electronically, therefore, actual numbers of events may be higher.
2 EMS reporting may have been affected by a change in documentation systems used by EMS agency/ies serving the area. Counts may decrease until updates to thedata are available in 2018, if applicable.
3 Numbers displayed in the table represent only naloxone administration reports submitted by law enforcement and registered COOP programs to the NYSDOH AIDSInstitute. The actual numbers of naloxone administration events may be higher.
17

Chautauqua County: Opioid overdoses and rates per 100,000 population (Preliminary data as of November, 2017 - subject to change)
Apr-Jun, 2016 Jul-Sep, 2016 Oct-Dec, 2016 2016 Total Jan-Mar, 2017 Apr-Jun, 2017
Indicator Location NumberCrudeRate Number
CrudeRate Number
CrudeRate Number
CrudeRate Number
CrudeRate Number
CrudeRate
Deaths 1
All opioid overdoses Chautauqua 4 3.1 9 6.9 3 2.3 24 18.4 2 1.5 4 3.1NYS excl. NYC 501 4.5 476 4.2 506 4.5 1,990 17.7 130 1.2 75 0.7
Heroin overdoses Chautauqua 2 1.5 5 3.8 0 0.0 11 8.4 1 0.8 2 1.5NYS excl. NYC 207 1.8 202 1.8 179 1.6 798 7.1 51 0.5 30 0.3
Overdoses involvingopioid pain relievers 2
Chautauqua 3 2.3 6 4.6 1 0.8 16 12.2 1 0.8 2 1.5NYS excl. NYC 388 3.5 371 3.3 439 3.9 1,576 14.0 96 0.9 56 0.5
Outpatient emergency department visits 3
All opioid overdoses Chautauqua 10 7.6 11 8.4 11 8.4 63 48.2 s s 18 13.8NYS excl. NYC 1,772 15.8 1,552 13.8 1,605 14.3 6,675 59.4 1,684 15.0 1,845 16.4
Heroin overdoses Chautauqua 9 6.9 8 6.1 8 6.1 52 39.8 s s 11 8.4NYS excl. NYC 1,282 11.4 1,085 9.6 1,128 10.0 4,784 42.5 1,183 10.5 1,351 12.0
Opioid overdosesexcluding heroin 2
Chautauqua s s s s s s 11 8.4 s s 7 5.4NYS excl. NYC 490 4.4 467 4.2 477 4.2 1,891 16.8 501 4.5 494 4.4
Hospitalizations 3
All opioid overdoses Chautauqua s s s s s s 22 16.8 s s 8 6.1NYS excl. NYC 486 4.3 457 4.1 467 4.2 1,895 16.9 481 4.3 500 4.4
Heroin overdoses Chautauqua 0 0.0 0 0.0 s s s s s s s sNYS excl. NYC 196 1.7 197 1.8 173 1.5 778 6.9 179 1.6 207 1.8
Opioid overdosesexcluding heroin 2
Chautauqua s s s s s s 18 13.8 s s 7 5.4NYS excl. NYC 290 2.6 260 2.3 294 2.6 1,117 9.9 302 2.7 293 2.6
1 Indicators are not mutually exclusive. Decedents and patients may have multiple substances in their system. Thus, overdoses involving heroin and overdosesinvolving opioid pain relievers will not add up to the overdoses involving all opioids.
2 This indicator includes pharmaceutically and illicitly produced opioids such as fentanyl.
3 Indicators generated for hospitalizations and emergency department visits are based on ICD-10-CM codes.
s: Data for indicators related to hospitalizations and emergency departments are suppressed for confidentiality purposes if there are less than 6 discharges.
18

Chautauqua County: Unique clients admitted to OASAS-certified chemical dependence treatment programs 1,2
(Preliminary data as of October, 2017 - subject to change)
2015 2016 2017
Indicator Total Jan-Mar Apr-Jun Jul-Sep Oct-Dec Total Jan-Mar Apr-Jun
Unique clients admitted forheroin
331 115 130 111 125 381 129 130
Unique clients admitted for anyopioid (incl. heroin)
571 167 193 169 173 576 187 180
OASAS: Office of Alcoholism and Substance Abuse Services
1 The number of unique clients admitted per year does not equal the sum of the unique clients admitted each quarter. This is because an individual client can beadmitted to treatment in more than one quarter during the year.
2 Clients may have heroin, other opioids, or any other substance simultaneously recorded as the primary, secondary and tertiary substance of abuse at admission.
s: Data for indicators are suppressed for confidentiality purposes if there are less than 6 clients.
Chautauqua County: Naloxone administration reports (Preliminary data as of November, 2017 - subject to change)
2015 2016 2017
Indicator Location Total Jan-Mar Apr-Jun Jul-Sep Oct-Dec Total Jan-Mar Apr-Jun Jul-Sep
Emergency Medical Services (EMS) naloxone administration reports 1,2
Naloxone administration reportby EMS
Chautauqua 88 23 19 26 26 94 19 39 31NYS excl. NYC 6,115 1,730 2,009 1,747 1,542 7,028 1,518 1,710 1,702
Law enforcement naloxone administration reports 3
Naloxone administration reportby law enforcement
Chautauqua 15 6 4 3 4 17 3 12 7NYS excl. NYC 956 404 402 392 346 1,544 336 443 331
Registered Community Opioid Overdose Prevention (COOP) program naloxone administration reports 3
Naloxone administration reportby registered COOP program
Chautauqua 1 0 1 1 0 2 0 0 0NYS excl. NYC 489 255 248 224 176 903 182 239 107
1 County numbers displayed in the table represent only naloxone administration events reported electronically, therefore, actual numbers of events may be higher.
2 EMS reporting may have been affected by a change in documentation systems used by EMS agency/ies serving the area. Counts may decrease until updates to thedata are available in 2018, if applicable.
3 Numbers displayed in the table represent only naloxone administration reports submitted by law enforcement and registered COOP programs to the NYSDOH AIDSInstitute. The actual numbers of naloxone administration events may be higher.
19

Chemung County: Opioid overdoses and rates per 100,000 population (Preliminary data as of November, 2017 - subject to change)
Apr-Jun, 2016 Jul-Sep, 2016 Oct-Dec, 2016 2016 Total Jan-Mar, 2017 Apr-Jun, 2017
Indicator Location NumberCrudeRate Number
CrudeRate Number
CrudeRate Number
CrudeRate Number
CrudeRate Number
CrudeRate
Deaths 1
All opioid overdoses Chemung 1 1.1 0 0.0 1 1.1 5 5.7 1 1.1 2 2.3NYS excl. NYC 501 4.5 476 4.2 506 4.5 1,990 17.7 130 1.2 75 0.7
Heroin overdoses Chemung 0 0.0 0 0.0 0 0.0 0 0.0 0 0.0 0 0.0NYS excl. NYC 207 1.8 202 1.8 179 1.6 798 7.1 51 0.5 30 0.3
Overdoses involvingopioid pain relievers 2
Chemung 1 1.1 0 0.0 1 1.1 5 5.7 1 1.1 2 2.3NYS excl. NYC 388 3.5 371 3.3 439 3.9 1,576 14.0 96 0.9 56 0.5
Outpatient emergency department visits 3
All opioid overdoses Chemung 19 21.8 13 14.9 s s 48 55.1 15 17.2 s sNYS excl. NYC 1,772 15.8 1,552 13.8 1,605 14.3 6,675 59.4 1,684 15.0 1,845 16.4
Heroin overdoses Chemung 11 12.6 7 8.0 s s 29 33.3 13 14.9 s sNYS excl. NYC 1,282 11.4 1,085 9.6 1,128 10.0 4,784 42.5 1,183 10.5 1,351 12.0
Opioid overdosesexcluding heroin 2
Chemung 8 9.2 s s 0 0.0 19 21.8 s s 0 0.0NYS excl. NYC 490 4.4 467 4.2 477 4.2 1,891 16.8 501 4.5 494 4.4
Hospitalizations 3
All opioid overdoses Chemung s s s s s s 16 18.4 0 0.0 s sNYS excl. NYC 486 4.3 457 4.1 467 4.2 1,895 16.9 481 4.3 500 4.4
Heroin overdoses Chemung s s s s 0 0.0 s s 0 0.0 s sNYS excl. NYC 196 1.7 197 1.8 173 1.5 778 6.9 179 1.6 207 1.8
Opioid overdosesexcluding heroin 2
Chemung s s s s s s 11 12.6 0 0.0 0 0.0NYS excl. NYC 290 2.6 260 2.3 294 2.6 1,117 9.9 302 2.7 293 2.6
1 Indicators are not mutually exclusive. Decedents and patients may have multiple substances in their system. Thus, overdoses involving heroin and overdosesinvolving opioid pain relievers will not add up to the overdoses involving all opioids.
2 This indicator includes pharmaceutically and illicitly produced opioids such as fentanyl.
3 Indicators generated for hospitalizations and emergency department visits are based on ICD-10-CM codes.
s: Data for indicators related to hospitalizations and emergency departments are suppressed for confidentiality purposes if there are less than 6 discharges.
20

Chemung County: Unique clients admitted to OASAS-certified chemical dependence treatment programs 1,2
(Preliminary data as of October, 2017 - subject to change)
2015 2016 2017
Indicator Total Jan-Mar Apr-Jun Jul-Sep Oct-Dec Total Jan-Mar Apr-Jun
Unique clients admitted forheroin
189 76 90 90 56 260 78 79
Unique clients admitted for anyopioid (incl. heroin)
334 124 130 131 98 406 113 130
OASAS: Office of Alcoholism and Substance Abuse Services
1 The number of unique clients admitted per year does not equal the sum of the unique clients admitted each quarter. This is because an individual client can beadmitted to treatment in more than one quarter during the year.
2 Clients may have heroin, other opioids, or any other substance simultaneously recorded as the primary, secondary and tertiary substance of abuse at admission.
s: Data for indicators are suppressed for confidentiality purposes if there are less than 6 clients.
Chemung County: Naloxone administration reports (Preliminary data as of November, 2017 - subject to change)
2015 2016 2017
Indicator Location Total Jan-Mar Apr-Jun Jul-Sep Oct-Dec Total Jan-Mar Apr-Jun Jul-Sep
Emergency Medical Services (EMS) naloxone administration reports 1,2
Naloxone administration reportby EMS
Chemung 123 23 33 48 26 130 25 58 32NYS excl. NYC 6,115 1,730 2,009 1,747 1,542 7,028 1,518 1,710 1,702
Law enforcement naloxone administration reports 3
Naloxone administration reportby law enforcement
Chemung 5 2 5 7 1 15 3 7 3NYS excl. NYC 956 404 402 392 346 1,544 336 443 331
Registered Community Opioid Overdose Prevention (COOP) program naloxone administration reports 3
Naloxone administration reportby registered COOP program
Chemung 0 2 1 0 0 3 0 0 0NYS excl. NYC 489 255 248 224 176 903 182 239 107
1 County numbers displayed in the table represent only naloxone administration events reported electronically, therefore, actual numbers of events may be higher.
2 EMS reporting may have been affected by a change in documentation systems used by EMS agency/ies serving the area. Counts may decrease until updates to thedata are available in 2018, if applicable.
3 Numbers displayed in the table represent only naloxone administration reports submitted by law enforcement and registered COOP programs to the NYSDOH AIDSInstitute. The actual numbers of naloxone administration events may be higher.
21

Chenango County: Opioid overdoses and rates per 100,000 population (Preliminary data as of November, 2017 - subject to change)
Apr-Jun, 2016 Jul-Sep, 2016 Oct-Dec, 2016 2016 Total Jan-Mar, 2017 Apr-Jun, 2017
Indicator Location NumberCrudeRate Number
CrudeRate Number
CrudeRate Number
CrudeRate Number
CrudeRate Number
CrudeRate
Deaths 1
All opioid overdoses Chenango 0 0.0 3 6.1 1 2.0 5 10.2 0 0.0 0 0.0NYS excl. NYC 501 4.5 476 4.2 506 4.5 1,990 17.7 130 1.2 75 0.7
Heroin overdoses Chenango 0 0.0 1 2.0 1 2.0 2 4.1 0 0.0 0 0.0NYS excl. NYC 207 1.8 202 1.8 179 1.6 798 7.1 51 0.5 30 0.3
Overdoses involvingopioid pain relievers 2
Chenango 0 0.0 2 4.1 0 0.0 3 6.1 0 0.0 0 0.0NYS excl. NYC 388 3.5 371 3.3 439 3.9 1,576 14.0 96 0.9 56 0.5
Outpatient emergency department visits 3
All opioid overdoses Chenango 8 16.4 8 16.4 s s 29 59.4 s s s sNYS excl. NYC 1,772 15.8 1,552 13.8 1,605 14.3 6,675 59.4 1,684 15.0 1,845 16.4
Heroin overdoses Chenango s s 7 14.3 s s 24 49.1 s s s sNYS excl. NYC 1,282 11.4 1,085 9.6 1,128 10.0 4,784 42.5 1,183 10.5 1,351 12.0
Opioid overdosesexcluding heroin 2
Chenango s s s s 0 0.0 s s s s s sNYS excl. NYC 490 4.4 467 4.2 477 4.2 1,891 16.8 501 4.5 494 4.4
Hospitalizations 3
All opioid overdoses Chenango s s s s s s 10 20.5 s s 0 0.0NYS excl. NYC 486 4.3 457 4.1 467 4.2 1,895 16.9 481 4.3 500 4.4
Heroin overdoses Chenango s s 0 0.0 s s s s s s 0 0.0NYS excl. NYC 196 1.7 197 1.8 173 1.5 778 6.9 179 1.6 207 1.8
Opioid overdosesexcluding heroin 2
Chenango s s s s 0 0.0 8 16.4 s s 0 0.0NYS excl. NYC 290 2.6 260 2.3 294 2.6 1,117 9.9 302 2.7 293 2.6
1 Indicators are not mutually exclusive. Decedents and patients may have multiple substances in their system. Thus, overdoses involving heroin and overdosesinvolving opioid pain relievers will not add up to the overdoses involving all opioids.
2 This indicator includes pharmaceutically and illicitly produced opioids such as fentanyl.
3 Indicators generated for hospitalizations and emergency department visits are based on ICD-10-CM codes.
s: Data for indicators related to hospitalizations and emergency departments are suppressed for confidentiality purposes if there are less than 6 discharges.
22

Chenango County: Unique clients admitted to OASAS-certified chemical dependence treatment programs 1,2
(Preliminary data as of October, 2017 - subject to change)
2015 2016 2017
Indicator Total Jan-Mar Apr-Jun Jul-Sep Oct-Dec Total Jan-Mar Apr-Jun
Unique clients admitted forheroin
141 55 46 50 36 153 34 33
Unique clients admitted for anyopioid (incl. heroin)
215 79 64 66 62 228 47 63
OASAS: Office of Alcoholism and Substance Abuse Services
1 The number of unique clients admitted per year does not equal the sum of the unique clients admitted each quarter. This is because an individual client can beadmitted to treatment in more than one quarter during the year.
2 Clients may have heroin, other opioids, or any other substance simultaneously recorded as the primary, secondary and tertiary substance of abuse at admission.
s: Data for indicators are suppressed for confidentiality purposes if there are less than 6 clients.
Chenango County: Naloxone administration reports (Preliminary data as of November, 2017 - subject to change)
2015 2016 2017
Indicator Location Total Jan-Mar Apr-Jun Jul-Sep Oct-Dec Total Jan-Mar Apr-Jun Jul-Sep
Emergency Medical Services (EMS) naloxone administration reports 1,2
Naloxone administration reportby EMS
Chenango 31 10 10 22 12 54 12 5 5NYS excl. NYC 6,115 1,730 2,009 1,747 1,542 7,028 1,518 1,710 1,702
Law enforcement naloxone administration reports 3
Naloxone administration reportby law enforcement
Chenango 4 1 2 1 1 5 0 2 0NYS excl. NYC 956 404 402 392 346 1,544 336 443 331
Registered Community Opioid Overdose Prevention (COOP) program naloxone administration reports 3
Naloxone administration reportby registered COOP program
Chenango 0 1 1 0 0 2 0 0 0NYS excl. NYC 489 255 248 224 176 903 182 239 107
1 County numbers displayed in the table represent only naloxone administration events reported electronically, therefore, actual numbers of events may be higher.
2 EMS reporting may have been affected by a change in documentation systems used by EMS agency/ies serving the area. Counts may decrease until updates to thedata are available in 2018, if applicable.
3 Numbers displayed in the table represent only naloxone administration reports submitted by law enforcement and registered COOP programs to the NYSDOH AIDSInstitute. The actual numbers of naloxone administration events may be higher.
23

Clinton County: Opioid overdoses and rates per 100,000 population (Preliminary data as of November, 2017 - subject to change)
Apr-Jun, 2016 Jul-Sep, 2016 Oct-Dec, 2016 2016 Total Jan-Mar, 2017 Apr-Jun, 2017
Indicator Location NumberCrudeRate Number
CrudeRate Number
CrudeRate Number
CrudeRate Number
CrudeRate Number
CrudeRate
Deaths 1
All opioid overdoses Clinton 1 1.2 2 2.5 4 4.9 8 9.8 0 0.0 2 2.5NYS excl. NYC 501 4.5 476 4.2 506 4.5 1,990 17.7 130 1.2 75 0.7
Heroin overdoses Clinton 0 0.0 2 2.5 0 0.0 2 2.5 0 0.0 0 0.0NYS excl. NYC 207 1.8 202 1.8 179 1.6 798 7.1 51 0.5 30 0.3
Overdoses involvingopioid pain relievers 2
Clinton 1 1.2 1 1.2 4 4.9 7 8.6 0 0.0 1 1.2NYS excl. NYC 388 3.5 371 3.3 439 3.9 1,576 14.0 96 0.9 56 0.5
Outpatient emergency department visits 3
All opioid overdoses Clinton 7 8.6 s s 10 12.3 24 29.5 s s s sNYS excl. NYC 1,772 15.8 1,552 13.8 1,605 14.3 6,675 59.4 1,684 15.0 1,845 16.4
Heroin overdoses Clinton s s s s s s 14 17.2 s s s sNYS excl. NYC 1,282 11.4 1,085 9.6 1,128 10.0 4,784 42.5 1,183 10.5 1,351 12.0
Opioid overdosesexcluding heroin 2
Clinton s s s s s s 10 12.3 s s s sNYS excl. NYC 490 4.4 467 4.2 477 4.2 1,891 16.8 501 4.5 494 4.4
Hospitalizations 3
All opioid overdoses Clinton s s s s 0 0.0 s s 0 0.0 0 0.0NYS excl. NYC 486 4.3 457 4.1 467 4.2 1,895 16.9 481 4.3 500 4.4
Heroin overdoses Clinton 0 0.0 0 0.0 0 0.0 0 0.0 0 0.0 0 0.0NYS excl. NYC 196 1.7 197 1.8 173 1.5 778 6.9 179 1.6 207 1.8
Opioid overdosesexcluding heroin 2
Clinton s s s s 0 0.0 s s 0 0.0 0 0.0NYS excl. NYC 290 2.6 260 2.3 294 2.6 1,117 9.9 302 2.7 293 2.6
1 Indicators are not mutually exclusive. Decedents and patients may have multiple substances in their system. Thus, overdoses involving heroin and overdosesinvolving opioid pain relievers will not add up to the overdoses involving all opioids.
2 This indicator includes pharmaceutically and illicitly produced opioids such as fentanyl.
3 Indicators generated for hospitalizations and emergency department visits are based on ICD-10-CM codes.
s: Data for indicators related to hospitalizations and emergency departments are suppressed for confidentiality purposes if there are less than 6 discharges.
24

Clinton County: Unique clients admitted to OASAS-certified chemical dependence treatment programs 1,2
(Preliminary data as of October, 2017 - subject to change)
2015 2016 2017
Indicator Total Jan-Mar Apr-Jun Jul-Sep Oct-Dec Total Jan-Mar Apr-Jun
Unique clients admitted forheroin
229 88 95 84 77 278 73 74
Unique clients admitted for anyopioid (incl. heroin)
443 158 159 133 141 480 138 135
OASAS: Office of Alcoholism and Substance Abuse Services
1 The number of unique clients admitted per year does not equal the sum of the unique clients admitted each quarter. This is because an individual client can beadmitted to treatment in more than one quarter during the year.
2 Clients may have heroin, other opioids, or any other substance simultaneously recorded as the primary, secondary and tertiary substance of abuse at admission.
s: Data for indicators are suppressed for confidentiality purposes if there are less than 6 clients.
Clinton County: Naloxone administration reports (Preliminary data as of November, 2017 - subject to change)
2015 2016 2017
Indicator Location Total Jan-Mar Apr-Jun Jul-Sep Oct-Dec Total Jan-Mar Apr-Jun Jul-Sep
Emergency Medical Services (EMS) naloxone administration reports 1,2
Naloxone administration reportby EMS
Clinton 19 6 5 3 8 22 7 0 3NYS excl. NYC 6,115 1,730 2,009 1,747 1,542 7,028 1,518 1,710 1,702
Law enforcement naloxone administration reports 3
Naloxone administration reportby law enforcement
Clinton 2 2 4 7 1 14 2 1 2NYS excl. NYC 956 404 402 392 346 1,544 336 443 331
Registered Community Opioid Overdose Prevention (COOP) program naloxone administration reports 3
Naloxone administration reportby registered COOP program
Clinton 20 14 6 25 22 67 21 14 3NYS excl. NYC 489 255 248 224 176 903 182 239 107
1 County numbers displayed in the table represent only naloxone administration events reported electronically, therefore, actual numbers of events may be higher.
2 EMS reporting may have been affected by a change in documentation systems used by EMS agency/ies serving the area. Counts may decrease until updates to thedata are available in 2018, if applicable.
3 Numbers displayed in the table represent only naloxone administration reports submitted by law enforcement and registered COOP programs to the NYSDOH AIDSInstitute. The actual numbers of naloxone administration events may be higher.
25
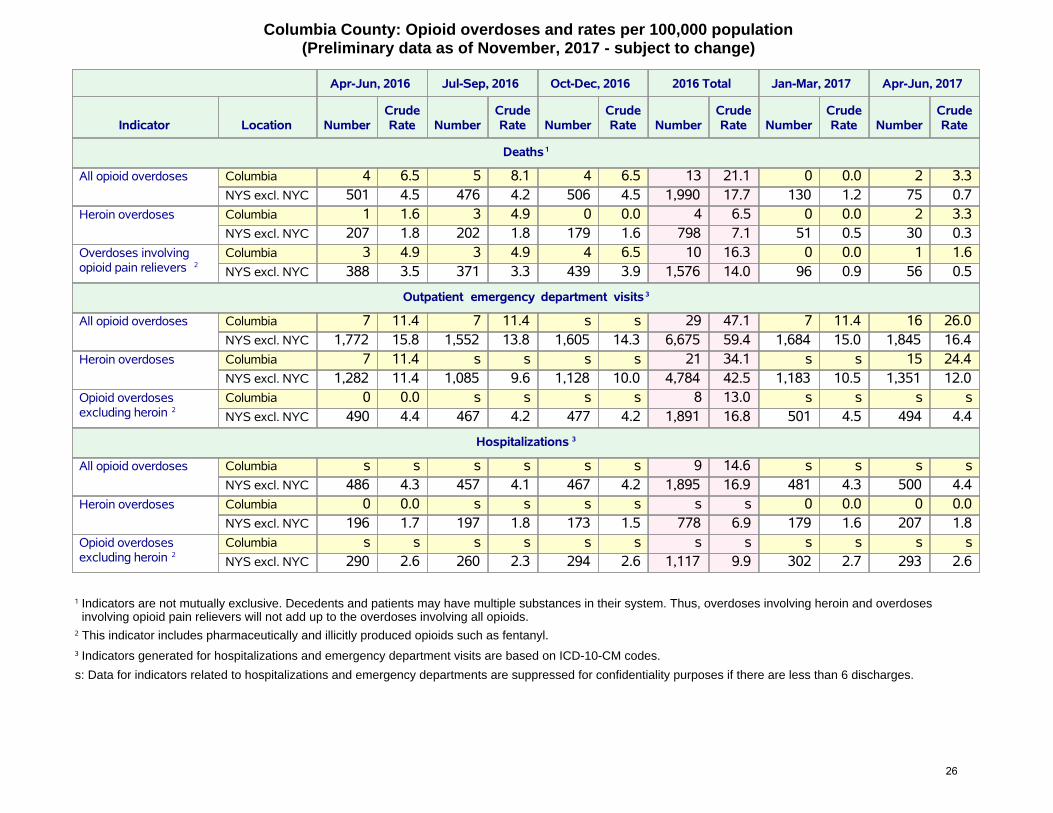
Columbia County: Opioid overdoses and rates per 100,000 population (Preliminary data as of November, 2017 - subject to change)
Apr-Jun, 2016 Jul-Sep, 2016 Oct-Dec, 2016 2016 Total Jan-Mar, 2017 Apr-Jun, 2017
Indicator Location NumberCrudeRate Number
CrudeRate Number
CrudeRate Number
CrudeRate Number
CrudeRate Number
CrudeRate
Deaths 1
All opioid overdoses Columbia 4 6.5 5 8.1 4 6.5 13 21.1 0 0.0 2 3.3NYS excl. NYC 501 4.5 476 4.2 506 4.5 1,990 17.7 130 1.2 75 0.7
Heroin overdoses Columbia 1 1.6 3 4.9 0 0.0 4 6.5 0 0.0 2 3.3NYS excl. NYC 207 1.8 202 1.8 179 1.6 798 7.1 51 0.5 30 0.3
Overdoses involvingopioid pain relievers 2
Columbia 3 4.9 3 4.9 4 6.5 10 16.3 0 0.0 1 1.6NYS excl. NYC 388 3.5 371 3.3 439 3.9 1,576 14.0 96 0.9 56 0.5
Outpatient emergency department visits 3
All opioid overdoses Columbia 7 11.4 7 11.4 s s 29 47.1 7 11.4 16 26.0NYS excl. NYC 1,772 15.8 1,552 13.8 1,605 14.3 6,675 59.4 1,684 15.0 1,845 16.4
Heroin overdoses Columbia 7 11.4 s s s s 21 34.1 s s 15 24.4NYS excl. NYC 1,282 11.4 1,085 9.6 1,128 10.0 4,784 42.5 1,183 10.5 1,351 12.0
Opioid overdosesexcluding heroin 2
Columbia 0 0.0 s s s s 8 13.0 s s s sNYS excl. NYC 490 4.4 467 4.2 477 4.2 1,891 16.8 501 4.5 494 4.4
Hospitalizations 3
All opioid overdoses Columbia s s s s s s 9 14.6 s s s sNYS excl. NYC 486 4.3 457 4.1 467 4.2 1,895 16.9 481 4.3 500 4.4
Heroin overdoses Columbia 0 0.0 s s s s s s 0 0.0 0 0.0NYS excl. NYC 196 1.7 197 1.8 173 1.5 778 6.9 179 1.6 207 1.8
Opioid overdosesexcluding heroin 2
Columbia s s s s s s s s s s s sNYS excl. NYC 290 2.6 260 2.3 294 2.6 1,117 9.9 302 2.7 293 2.6
1 Indicators are not mutually exclusive. Decedents and patients may have multiple substances in their system. Thus, overdoses involving heroin and overdosesinvolving opioid pain relievers will not add up to the overdoses involving all opioids.
2 This indicator includes pharmaceutically and illicitly produced opioids such as fentanyl.
3 Indicators generated for hospitalizations and emergency department visits are based on ICD-10-CM codes.
s: Data for indicators related to hospitalizations and emergency departments are suppressed for confidentiality purposes if there are less than 6 discharges.
26

Columbia County: Unique clients admitted to OASAS-certified chemical dependence treatment programs 1,2
(Preliminary data as of October, 2017 - subject to change)
2015 2016 2017
Indicator Total Jan-Mar Apr-Jun Jul-Sep Oct-Dec Total Jan-Mar Apr-Jun
Unique clients admitted forheroin
229 82 75 76 109 244 91 108
Unique clients admitted for anyopioid (incl. heroin)
281 109 98 96 126 311 114 127
OASAS: Office of Alcoholism and Substance Abuse Services
1 The number of unique clients admitted per year does not equal the sum of the unique clients admitted each quarter. This is because an individual client can beadmitted to treatment in more than one quarter during the year.
2 Clients may have heroin, other opioids, or any other substance simultaneously recorded as the primary, secondary and tertiary substance of abuse at admission.
s: Data for indicators are suppressed for confidentiality purposes if there are less than 6 clients.
Columbia County: Naloxone administration reports (Preliminary data as of November, 2017 - subject to change)
2015 2016 2017
Indicator Location Total Jan-Mar Apr-Jun Jul-Sep Oct-Dec Total Jan-Mar Apr-Jun Jul-Sep
Emergency Medical Services (EMS) naloxone administration reports 1,2
Naloxone administration reportby EMS
Columbia 57 13 13 18 19 63 12 16 15NYS excl. NYC 6,115 1,730 2,009 1,747 1,542 7,028 1,518 1,710 1,702
Law enforcement naloxone administration reports 3
Naloxone administration reportby law enforcement
Columbia 7 4 3 1 2 10 3 3 3NYS excl. NYC 956 404 402 392 346 1,544 336 443 331
Registered Community Opioid Overdose Prevention (COOP) program naloxone administration reports 3
Naloxone administration reportby registered COOP program
Columbia 2 2 0 0 0 2 0 3 0NYS excl. NYC 489 255 248 224 176 903 182 239 107
1 County numbers displayed in the table represent only naloxone administration events reported electronically, therefore, actual numbers of events may be higher.
2 EMS reporting may have been affected by a change in documentation systems used by EMS agency/ies serving the area. Counts may decrease until updates to thedata are available in 2018, if applicable.
3 Numbers displayed in the table represent only naloxone administration reports submitted by law enforcement and registered COOP programs to the NYSDOH AIDSInstitute. The actual numbers of naloxone administration events may be higher.
27

Cortland County: Opioid overdoses and rates per 100,000 population (Preliminary data as of November, 2017 - subject to change)
Apr-Jun, 2016 Jul-Sep, 2016 Oct-Dec, 2016 2016 Total Jan-Mar, 2017 Apr-Jun, 2017
Indicator Location NumberCrudeRate Number
CrudeRate Number
CrudeRate Number
CrudeRate Number
CrudeRate Number
CrudeRate
Deaths 1
All opioid overdoses Cortland 2 4.1 2 4.1 2 4.1 8 16.5 0 0.0 1 2.1NYS excl. NYC 501 4.5 476 4.2 506 4.5 1,990 17.7 130 1.2 75 0.7
Heroin overdoses Cortland 1 2.1 2 4.1 0 0.0 3 6.2 0 0.0 1 2.1NYS excl. NYC 207 1.8 202 1.8 179 1.6 798 7.1 51 0.5 30 0.3
Overdoses involvingopioid pain relievers 2
Cortland 1 2.1 1 2.1 2 4.1 6 12.4 0 0.0 0 0.0NYS excl. NYC 388 3.5 371 3.3 439 3.9 1,576 14.0 96 0.9 56 0.5
Outpatient emergency department visits 3
All opioid overdoses Cortland 12 24.7 12 24.7 14 28.9 43 88.7 11 22.7 s sNYS excl. NYC 1,772 15.8 1,552 13.8 1,605 14.3 6,675 59.4 1,684 15.0 1,845 16.4
Heroin overdoses Cortland 7 14.4 8 16.5 11 22.7 31 63.9 s s s sNYS excl. NYC 1,282 11.4 1,085 9.6 1,128 10.0 4,784 42.5 1,183 10.5 1,351 12.0
Opioid overdosesexcluding heroin 2
Cortland s s s s s s 12 24.7 s s s sNYS excl. NYC 490 4.4 467 4.2 477 4.2 1,891 16.8 501 4.5 494 4.4
Hospitalizations 3
All opioid overdoses Cortland s s 0 0.0 0 0.0 s s s s 0 0.0NYS excl. NYC 486 4.3 457 4.1 467 4.2 1,895 16.9 481 4.3 500 4.4
Heroin overdoses Cortland s s 0 0.0 0 0.0 s s s s 0 0.0NYS excl. NYC 196 1.7 197 1.8 173 1.5 778 6.9 179 1.6 207 1.8
Opioid overdosesexcluding heroin 2
Cortland s s 0 0.0 0 0.0 s s s s 0 0.0NYS excl. NYC 290 2.6 260 2.3 294 2.6 1,117 9.9 302 2.7 293 2.6
1 Indicators are not mutually exclusive. Decedents and patients may have multiple substances in their system. Thus, overdoses involving heroin and overdosesinvolving opioid pain relievers will not add up to the overdoses involving all opioids.
2 This indicator includes pharmaceutically and illicitly produced opioids such as fentanyl.
3 Indicators generated for hospitalizations and emergency department visits are based on ICD-10-CM codes.
s: Data for indicators related to hospitalizations and emergency departments are suppressed for confidentiality purposes if there are less than 6 discharges.
28

Cortland County: Unique clients admitted to OASAS-certified chemical dependence treatment programs 1,2
(Preliminary data as of October, 2017 - subject to change)
2015 2016 2017
Indicator Total Jan-Mar Apr-Jun Jul-Sep Oct-Dec Total Jan-Mar Apr-Jun
Unique clients admitted forheroin
151 80 107 83 88 261 100 97
Unique clients admitted for anyopioid (incl. heroin)
217 104 138 102 103 326 115 121
OASAS: Office of Alcoholism and Substance Abuse Services
1 The number of unique clients admitted per year does not equal the sum of the unique clients admitted each quarter. This is because an individual client can beadmitted to treatment in more than one quarter during the year.
2 Clients may have heroin, other opioids, or any other substance simultaneously recorded as the primary, secondary and tertiary substance of abuse at admission.
s: Data for indicators are suppressed for confidentiality purposes if there are less than 6 clients.
Cortland County: Naloxone administration reports (Preliminary data as of November, 2017 - subject to change)
2015 2016 2017
Indicator Location Total Jan-Mar Apr-Jun Jul-Sep Oct-Dec Total Jan-Mar Apr-Jun Jul-Sep
Emergency Medical Services (EMS) naloxone administration reports 1,2
Naloxone administration reportby EMS
Cortland 31 12 14 14 14 54 13 10 12NYS excl. NYC 6,115 1,730 2,009 1,747 1,542 7,028 1,518 1,710 1,702
Law enforcement naloxone administration reports 3
Naloxone administration reportby law enforcement
Cortland 13 2 7 5 2 16 2 1 1NYS excl. NYC 956 404 402 392 346 1,544 336 443 331
Registered Community Opioid Overdose Prevention (COOP) program naloxone administration reports 3
Naloxone administration reportby registered COOP program
Cortland 0 0 2 6 2 10 0 3 1NYS excl. NYC 489 255 248 224 176 903 182 239 107
1 County numbers displayed in the table represent only naloxone administration events reported electronically, therefore, actual numbers of events may be higher.
2 EMS reporting may have been affected by a change in documentation systems used by EMS agency/ies serving the area. Counts may decrease until updates to thedata are available in 2018, if applicable.
3 Numbers displayed in the table represent only naloxone administration reports submitted by law enforcement and registered COOP programs to the NYSDOH AIDSInstitute. The actual numbers of naloxone administration events may be higher.
29

Delaware County: Opioid overdoses and rates per 100,000 population (Preliminary data as of November, 2017 - subject to change)
Apr-Jun, 2016 Jul-Sep, 2016 Oct-Dec, 2016 2016 Total Jan-Mar, 2017 Apr-Jun, 2017
Indicator Location NumberCrudeRate Number
CrudeRate Number
CrudeRate Number
CrudeRate Number
CrudeRate Number
CrudeRate
Deaths 1
All opioid overdoses Delaware 3 6.5 4 8.7 1 2.2 10 21.7 0 0.0 0 0.0NYS excl. NYC 501 4.5 476 4.2 506 4.5 1,990 17.7 130 1.2 75 0.7
Heroin overdoses Delaware 2 4.3 3 6.5 0 0.0 5 10.9 0 0.0 0 0.0NYS excl. NYC 207 1.8 202 1.8 179 1.6 798 7.1 51 0.5 30 0.3
Overdoses involvingopioid pain relievers 2
Delaware 2 4.3 2 4.3 1 2.2 6 13.0 0 0.0 0 0.0NYS excl. NYC 388 3.5 371 3.3 439 3.9 1,576 14.0 96 0.9 56 0.5
Outpatient emergency department visits 3
All opioid overdoses Delaware s s 9 19.5 s s 24 52.1 s s s sNYS excl. NYC 1,772 15.8 1,552 13.8 1,605 14.3 6,675 59.4 1,684 15.0 1,845 16.4
Heroin overdoses Delaware s s s s s s 14 30.4 s s s sNYS excl. NYC 1,282 11.4 1,085 9.6 1,128 10.0 4,784 42.5 1,183 10.5 1,351 12.0
Opioid overdosesexcluding heroin 2
Delaware s s s s 0 0.0 10 21.7 s s s sNYS excl. NYC 490 4.4 467 4.2 477 4.2 1,891 16.8 501 4.5 494 4.4
Hospitalizations 3
All opioid overdoses Delaware s s s s s s 10 21.7 s s s sNYS excl. NYC 486 4.3 457 4.1 467 4.2 1,895 16.9 481 4.3 500 4.4
Heroin overdoses Delaware 0 0.0 s s s s s s 0 0.0 s sNYS excl. NYC 196 1.7 197 1.8 173 1.5 778 6.9 179 1.6 207 1.8
Opioid overdosesexcluding heroin 2
Delaware s s s s s s 7 15.2 s s s sNYS excl. NYC 290 2.6 260 2.3 294 2.6 1,117 9.9 302 2.7 293 2.6
1 Indicators are not mutually exclusive. Decedents and patients may have multiple substances in their system. Thus, overdoses involving heroin and overdosesinvolving opioid pain relievers will not add up to the overdoses involving all opioids.
2 This indicator includes pharmaceutically and illicitly produced opioids such as fentanyl.
3 Indicators generated for hospitalizations and emergency department visits are based on ICD-10-CM codes.
s: Data for indicators related to hospitalizations and emergency departments are suppressed for confidentiality purposes if there are less than 6 discharges.
30

Delaware County: Unique clients admitted to OASAS-certified chemical dependence treatment programs 1,2
(Preliminary data as of October, 2017 - subject to change)
2015 2016 2017
Indicator Total Jan-Mar Apr-Jun Jul-Sep Oct-Dec Total Jan-Mar Apr-Jun
Unique clients admitted forheroin
114 50 43 38 43 152 40 45
Unique clients admitted for anyopioid (incl. heroin)
163 64 59 52 51 195 54 64
OASAS: Office of Alcoholism and Substance Abuse Services
1 The number of unique clients admitted per year does not equal the sum of the unique clients admitted each quarter. This is because an individual client can beadmitted to treatment in more than one quarter during the year.
2 Clients may have heroin, other opioids, or any other substance simultaneously recorded as the primary, secondary and tertiary substance of abuse at admission.
s: Data for indicators are suppressed for confidentiality purposes if there are less than 6 clients.
Delaware County: Naloxone administration reports (Preliminary data as of November, 2017 - subject to change)
2015 2016 2017
Indicator Location Total Jan-Mar Apr-Jun Jul-Sep Oct-Dec Total Jan-Mar Apr-Jun Jul-Sep
Emergency Medical Services (EMS) naloxone administration reports 1,2
Naloxone administration reportby EMS
Delaware 11 4 10 7 7 28 2 10 4NYS excl. NYC 6,115 1,730 2,009 1,747 1,542 7,028 1,518 1,710 1,702
Law enforcement naloxone administration reports 3
Naloxone administration reportby law enforcement
Delaware 2 0 2 2 1 5 0 1 0NYS excl. NYC 956 404 402 392 346 1,544 336 443 331
Registered Community Opioid Overdose Prevention (COOP) program naloxone administration reports 3
Naloxone administration reportby registered COOP program
Delaware 1 1 1 3 1 6 0 1 0NYS excl. NYC 489 255 248 224 176 903 182 239 107
1 County numbers displayed in the table represent only naloxone administration events reported electronically, therefore, actual numbers of events may be higher.
2 EMS reporting may have been affected by a change in documentation systems used by EMS agency/ies serving the area. Counts may decrease until updates to thedata are available in 2018, if applicable.
3 Numbers displayed in the table represent only naloxone administration reports submitted by law enforcement and registered COOP programs to the NYSDOH AIDSInstitute. The actual numbers of naloxone administration events may be higher.
31

Dutchess County: Opioid overdoses and rates per 100,000 population (Preliminary data as of November, 2017 - subject to change)
Apr-Jun, 2016 Jul-Sep, 2016 Oct-Dec, 2016 2016 Total Jan-Mar, 2017 Apr-Jun, 2017
Indicator Location NumberCrudeRate Number
CrudeRate Number
CrudeRate Number
CrudeRate Number
CrudeRate Number
CrudeRate
Deaths 1
All opioid overdoses Dutchess 13 4.4 14 4.7 10 3.4 49 16.6 5 1.7 3 1.0NYS excl. NYC 501 4.5 476 4.2 506 4.5 1,990 17.7 130 1.2 75 0.7
Heroin overdoses Dutchess 10 3.4 5 1.7 4 1.4 26 8.8 3 1.0 2 0.7NYS excl. NYC 207 1.8 202 1.8 179 1.6 798 7.1 51 0.5 30 0.3
Overdoses involvingopioid pain relievers 2
Dutchess 5 1.7 12 4.1 8 2.7 33 11.2 2 0.7 2 0.7NYS excl. NYC 388 3.5 371 3.3 439 3.9 1,576 14.0 96 0.9 56 0.5
Outpatient emergency department visits 3
All opioid overdoses Dutchess 21 7.1 35 11.8 27 9.1 103 34.8 19 6.4 34 11.5NYS excl. NYC 1,772 15.8 1,552 13.8 1,605 14.3 6,675 59.4 1,684 15.0 1,845 16.4
Heroin overdoses Dutchess 13 4.4 25 8.5 16 5.4 68 23.0 14 4.7 27 9.1NYS excl. NYC 1,282 11.4 1,085 9.6 1,128 10.0 4,784 42.5 1,183 10.5 1,351 12.0
Opioid overdosesexcluding heroin 2
Dutchess 8 2.7 10 3.4 11 3.7 35 11.8 s s 7 2.4NYS excl. NYC 490 4.4 467 4.2 477 4.2 1,891 16.8 501 4.5 494 4.4
Hospitalizations 3
All opioid overdoses Dutchess 14 4.7 8 2.7 12 4.1 40 13.5 13 4.4 s sNYS excl. NYC 486 4.3 457 4.1 467 4.2 1,895 16.9 481 4.3 500 4.4
Heroin overdoses Dutchess s s s s s s 16 5.4 s s s sNYS excl. NYC 196 1.7 197 1.8 173 1.5 778 6.9 179 1.6 207 1.8
Opioid overdosesexcluding heroin 2
Dutchess 8 2.7 s s 8 2.7 24 8.1 8 2.7 s sNYS excl. NYC 290 2.6 260 2.3 294 2.6 1,117 9.9 302 2.7 293 2.6
1 Indicators are not mutually exclusive. Decedents and patients may have multiple substances in their system. Thus, overdoses involving heroin and overdosesinvolving opioid pain relievers will not add up to the overdoses involving all opioids.
2 This indicator includes pharmaceutically and illicitly produced opioids such as fentanyl.
3 Indicators generated for hospitalizations and emergency department visits are based on ICD-10-CM codes.
s: Data for indicators related to hospitalizations and emergency departments are suppressed for confidentiality purposes if there are less than 6 discharges.
32

Dutchess County: Unique clients admitted to OASAS-certified chemical dependence treatment programs 1,2
(Preliminary data as of October, 2017 - subject to change)
2015 2016 2017
Indicator Total Jan-Mar Apr-Jun Jul-Sep Oct-Dec Total Jan-Mar Apr-Jun
Unique clients admitted forheroin
1,202 399 402 447 394 1,178 387 424
Unique clients admitted for anyopioid (incl. heroin)
1,453 465 477 521 461 1,410 458 511
OASAS: Office of Alcoholism and Substance Abuse Services
1 The number of unique clients admitted per year does not equal the sum of the unique clients admitted each quarter. This is because an individual client can beadmitted to treatment in more than one quarter during the year.
2 Clients may have heroin, other opioids, or any other substance simultaneously recorded as the primary, secondary and tertiary substance of abuse at admission.
s: Data for indicators are suppressed for confidentiality purposes if there are less than 6 clients.
Dutchess County: Naloxone administration reports (Preliminary data as of November, 2017 - subject to change)
2015 2016 2017
Indicator Location Total Jan-Mar Apr-Jun Jul-Sep Oct-Dec Total Jan-Mar Apr-Jun Jul-Sep
Emergency Medical Services (EMS) naloxone administration reports 1,2
Naloxone administration reportby EMS
Dutchess 272 81 79 91 86 337 70 85 101NYS excl. NYC 6,115 1,730 2,009 1,747 1,542 7,028 1,518 1,710 1,702
Law enforcement naloxone administration reports 3
Naloxone administration reportby law enforcement
Dutchess 45 15 16 17 10 58 16 18 19NYS excl. NYC 956 404 402 392 346 1,544 336 443 331
Registered Community Opioid Overdose Prevention (COOP) program naloxone administration reports 3
Naloxone administration reportby registered COOP program
Dutchess 13 3 3 3 1 10 0 5 1NYS excl. NYC 489 255 248 224 176 903 182 239 107
1 County numbers displayed in the table represent only naloxone administration events reported electronically, therefore, actual numbers of events may be higher.Additional data validation steps have been taken to de-duplicate 2016 administrations by multiple agencies for the same patient encounter.
2 EMS reporting may have been affected by a change in documentation systems used by EMS agency/ies serving the area. Counts may decrease until updates to thedata are available in 2018, if applicable.
3 Numbers displayed in the table represent only naloxone administration reports submitted by law enforcement and registered COOP programs to the NYSDOH AIDSInstitute. The actual numbers of naloxone administration events may be higher.
33

Erie County: Opioid overdoses and rates per 100,000 population (Preliminary data as of November, 2017 - subject to change)
Apr-Jun, 2016 Jul-Sep, 2016 Oct-Dec, 2016 2016 Total Jan-Mar, 2017 Apr-Jun, 2017
Indicator Location NumberCrudeRate Number
CrudeRate Number
CrudeRate Number
CrudeRate Number
CrudeRate Number
CrudeRate
Deaths 1
All opioid overdoses Erie 65 7.0 48 5.2 63 6.8 274 29.7 19 2.1 9 1.0NYS excl. NYC 501 4.5 476 4.2 506 4.5 1,990 17.7 130 1.2 75 0.7
Heroin overdoses Erie 20 2.2 13 1.4 12 1.3 74 8.0 4 0.4 1 0.1NYS excl. NYC 207 1.8 202 1.8 179 1.6 798 7.1 51 0.5 30 0.3
Overdoses involvingopioid pain relievers 2
Erie 59 6.4 43 4.7 59 6.4 250 27.1 17 1.8 6 0.7NYS excl. NYC 388 3.5 371 3.3 439 3.9 1,576 14.0 96 0.9 56 0.5
Outpatient emergency department visits 3
All opioid overdoses Erie 275 29.8 144 15.6 224 24.3 1,105 119.8 242 26.2 262 28.4NYS excl. NYC 1,772 15.8 1,552 13.8 1,605 14.3 6,675 59.4 1,684 15.0 1,845 16.4
Heroin overdoses Erie 225 24.4 97 10.5 180 19.5 878 95.2 186 20.2 203 22.0NYS excl. NYC 1,282 11.4 1,085 9.6 1,128 10.0 4,784 42.5 1,183 10.5 1,351 12.0
Opioid overdosesexcluding heroin 2
Erie 50 5.4 47 5.1 44 4.8 227 24.6 56 6.1 59 6.4NYS excl. NYC 490 4.4 467 4.2 477 4.2 1,891 16.8 501 4.5 494 4.4
Hospitalizations 3
All opioid overdoses Erie 41 4.4 33 3.6 46 5.0 191 20.7 53 5.7 47 5.1NYS excl. NYC 486 4.3 457 4.1 467 4.2 1,895 16.9 481 4.3 500 4.4
Heroin overdoses Erie 14 1.5 18 2.0 16 1.7 83 9.0 25 2.7 21 2.3NYS excl. NYC 196 1.7 197 1.8 173 1.5 778 6.9 179 1.6 207 1.8
Opioid overdosesexcluding heroin 2
Erie 27 2.9 15 1.6 30 3.3 108 11.7 28 3.0 26 2.8NYS excl. NYC 290 2.6 260 2.3 294 2.6 1,117 9.9 302 2.7 293 2.6
1 Indicators are not mutually exclusive. Decedents and patients may have multiple substances in their system. Thus, overdoses involving heroin and overdosesinvolving opioid pain relievers will not add up to the overdoses involving all opioids.
2 This indicator includes pharmaceutically and illicitly produced opioids such as fentanyl.
3 Indicators generated for hospitalizations and emergency department visits are based on ICD-10-CM codes.
s: Data for indicators related to hospitalizations and emergency departments are suppressed for confidentiality purposes if there are less than 6 discharges.
34

Erie County: Unique clients admitted to OASAS-certified chemical dependence treatment programs 1,2
(Preliminary data as of October, 2017 - subject to change)
2015 2016 2017
Indicator Total Jan-Mar Apr-Jun Jul-Sep Oct-Dec Total Jan-Mar Apr-Jun
Unique clients admitted forheroin
2,631 860 953 939 863 2,696 899 883
Unique clients admitted for anyopioid (incl. heroin)
4,141 1,271 1,399 1,388 1,264 4,038 1,309 1,306
OASAS: Office of Alcoholism and Substance Abuse Services
1 The number of unique clients admitted per year does not equal the sum of the unique clients admitted each quarter. This is because an individual client can beadmitted to treatment in more than one quarter during the year.
2 Clients may have heroin, other opioids, or any other substance simultaneously recorded as the primary, secondary and tertiary substance of abuse at admission.
s: Data for indicators are suppressed for confidentiality purposes if there are less than 6 clients.
Erie County: Naloxone administration reports (Preliminary data as of November, 2017 - subject to change)
2015 2016 2017
Indicator Location Total Jan-Mar Apr-Jun Jul-Sep Oct-Dec Total Jan-Mar Apr-Jun Jul-Sep
Emergency Medical Services (EMS) naloxone administration reports 1,2
Naloxone administration reportby EMS
Erie 188 74 35 32 18 159 18 32 33NYS excl. NYC 6,115 1,730 2,009 1,747 1,542 7,028 1,518 1,710 1,702
Law enforcement naloxone administration reports 3
Naloxone administration reportby law enforcement
Erie 219 139 74 47 49 309 75 84 38NYS excl. NYC 956 404 402 392 346 1,544 336 443 331
Registered Community Opioid Overdose Prevention (COOP) program naloxone administration reports 3
Naloxone administration reportby registered COOP program
Erie 210 116 54 25 38 233 21 17 12NYS excl. NYC 489 255 248 224 176 903 182 239 107
1 County numbers displayed in the table represent only naloxone administration events reported electronically, therefore, actual numbers of events may be higher.
2 EMS reporting may have been affected by a change in documentation systems used by EMS agency/ies serving the area. Counts may decrease until updates to thedata are available in 2018, if applicable.
3 Numbers displayed in the table represent only naloxone administration reports submitted by law enforcement and registered COOP programs to the NYSDOH AIDSInstitute. The actual numbers of naloxone administration events may be higher.
35

Essex County: Opioid overdoses and rates per 100,000 population (Preliminary data as of November, 2017 - subject to change)
Apr-Jun, 2016 Jul-Sep, 2016 Oct-Dec, 2016 2016 Total Jan-Mar, 2017 Apr-Jun, 2017
Indicator Location NumberCrudeRate Number
CrudeRate Number
CrudeRate Number
CrudeRate Number
CrudeRate Number
CrudeRate
Deaths 1
All opioid overdoses Essex 1 2.6 0 0.0 2 5.2 4 10.4 0 0.0 0 0.0NYS excl. NYC 501 4.5 476 4.2 506 4.5 1,990 17.7 130 1.2 75 0.7
Heroin overdoses Essex 0 0.0 0 0.0 0 0.0 0 0.0 0 0.0 0 0.0NYS excl. NYC 207 1.8 202 1.8 179 1.6 798 7.1 51 0.5 30 0.3
Overdoses involvingopioid pain relievers 2
Essex 1 2.6 0 0.0 2 5.2 4 10.4 0 0.0 0 0.0NYS excl. NYC 388 3.5 371 3.3 439 3.9 1,576 14.0 96 0.9 56 0.5
Outpatient emergency department visits 3
All opioid overdoses Essex s s s s s s 10 26.0 0 0.0 s sNYS excl. NYC 1,772 15.8 1,552 13.8 1,605 14.3 6,675 59.4 1,684 15.0 1,845 16.4
Heroin overdoses Essex 0 0.0 0 0.0 s s s s 0 0.0 0 0.0NYS excl. NYC 1,282 11.4 1,085 9.6 1,128 10.0 4,784 42.5 1,183 10.5 1,351 12.0
Opioid overdosesexcluding heroin 2
Essex s s s s s s 8 20.8 0 0.0 s sNYS excl. NYC 490 4.4 467 4.2 477 4.2 1,891 16.8 501 4.5 494 4.4
Hospitalizations 3
All opioid overdoses Essex 0 0.0 s s 0 0.0 s s 0 0.0 0 0.0NYS excl. NYC 486 4.3 457 4.1 467 4.2 1,895 16.9 481 4.3 500 4.4
Heroin overdoses Essex 0 0.0 0 0.0 0 0.0 0 0.0 0 0.0 0 0.0NYS excl. NYC 196 1.7 197 1.8 173 1.5 778 6.9 179 1.6 207 1.8
Opioid overdosesexcluding heroin 2
Essex 0 0.0 s s 0 0.0 s s 0 0.0 0 0.0NYS excl. NYC 290 2.6 260 2.3 294 2.6 1,117 9.9 302 2.7 293 2.6
1 Indicators are not mutually exclusive. Decedents and patients may have multiple substances in their system. Thus, overdoses involving heroin and overdosesinvolving opioid pain relievers will not add up to the overdoses involving all opioids.
2 This indicator includes pharmaceutically and illicitly produced opioids such as fentanyl.
3 Indicators generated for hospitalizations and emergency department visits are based on ICD-10-CM codes.
s: Data for indicators related to hospitalizations and emergency departments are suppressed for confidentiality purposes if there are less than 6 discharges.
36

Essex County: Unique clients admitted to OASAS-certified chemical dependence treatment programs 1,2
(Preliminary data as of October, 2017 - subject to change)
2015 2016 2017
Indicator Total Jan-Mar Apr-Jun Jul-Sep Oct-Dec Total Jan-Mar Apr-Jun
Unique clients admitted forheroin
57 24 20 15 21 71 16 23
Unique clients admitted for anyopioid (incl. heroin)
130 49 55 40 43 160 56 67
OASAS: Office of Alcoholism and Substance Abuse Services
1 The number of unique clients admitted per year does not equal the sum of the unique clients admitted each quarter. This is because an individual client can beadmitted to treatment in more than one quarter during the year.
2 Clients may have heroin, other opioids, or any other substance simultaneously recorded as the primary, secondary and tertiary substance of abuse at admission.
s: Data for indicators are suppressed for confidentiality purposes if there are less than 6 clients.
Essex County: Naloxone administration reports (Preliminary data as of November, 2017 - subject to change)
2015 2016 2017
Indicator Location Total Jan-Mar Apr-Jun Jul-Sep Oct-Dec Total Jan-Mar Apr-Jun Jul-Sep
Emergency Medical Services (EMS) naloxone administration reports 1,2
Naloxone administration reportby EMS
Essex 10 6 2 2 0 10 2 3 3NYS excl. NYC 6,115 1,730 2,009 1,747 1,542 7,028 1,518 1,710 1,702
Law enforcement naloxone administration reports 3
Naloxone administration reportby law enforcement
Essex 3 0 1 0 0 1 0 2 0NYS excl. NYC 956 404 402 392 346 1,544 336 443 331
Registered Community Opioid Overdose Prevention (COOP) program naloxone administration reports 3
Naloxone administration reportby registered COOP program
Essex 2 0 0 0 0 0 0 0 0NYS excl. NYC 489 255 248 224 176 903 182 239 107
1 County numbers displayed in the table represent only naloxone administration events reported electronically, therefore, actual numbers of events may be higher.
2 EMS reporting may have been affected by a change in documentation systems used by EMS agency/ies serving the area. Counts may decrease until updates to thedata are available in 2018, if applicable.
3 Numbers displayed in the table represent only naloxone administration reports submitted by law enforcement and registered COOP programs to the NYSDOH AIDSInstitute. The actual numbers of naloxone administration events may be higher.
37

Franklin County: Opioid overdoses and rates per 100,000 population (Preliminary data as of November, 2017 - subject to change)
Apr-Jun, 2016 Jul-Sep, 2016 Oct-Dec, 2016 2016 Total Jan-Mar, 2017 Apr-Jun, 2017
Indicator Location NumberCrudeRate Number
CrudeRate Number
CrudeRate Number
CrudeRate Number
CrudeRate Number
CrudeRate
Deaths 1
All opioid overdoses Franklin 1 2.0 0 0.0 0 0.0 2 3.9 0 0.0 0 0.0NYS excl. NYC 501 4.5 476 4.2 506 4.5 1,990 17.7 130 1.2 75 0.7
Heroin overdoses Franklin 0 0.0 0 0.0 0 0.0 0 0.0 0 0.0 0 0.0NYS excl. NYC 207 1.8 202 1.8 179 1.6 798 7.1 51 0.5 30 0.3
Overdoses involvingopioid pain relievers 2
Franklin 1 2.0 0 0.0 0 0.0 2 3.9 0 0.0 0 0.0NYS excl. NYC 388 3.5 371 3.3 439 3.9 1,576 14.0 96 0.9 56 0.5
Outpatient emergency department visits 3
All opioid overdoses Franklin s s s s s s 10 19.7 s s s sNYS excl. NYC 1,772 15.8 1,552 13.8 1,605 14.3 6,675 59.4 1,684 15.0 1,845 16.4
Heroin overdoses Franklin 0 0.0 0 0.0 s s s s s s s sNYS excl. NYC 1,282 11.4 1,085 9.6 1,128 10.0 4,784 42.5 1,183 10.5 1,351 12.0
Opioid overdosesexcluding heroin 2
Franklin s s s s s s 7 13.8 s s s sNYS excl. NYC 490 4.4 467 4.2 477 4.2 1,891 16.8 501 4.5 494 4.4
Hospitalizations 3
All opioid overdoses Franklin 0 0.0 0 0.0 0 0.0 s s 0 0.0 s sNYS excl. NYC 486 4.3 457 4.1 467 4.2 1,895 16.9 481 4.3 500 4.4
Heroin overdoses Franklin 0 0.0 0 0.0 0 0.0 0 0.0 0 0.0 0 0.0NYS excl. NYC 196 1.7 197 1.8 173 1.5 778 6.9 179 1.6 207 1.8
Opioid overdosesexcluding heroin 2
Franklin 0 0.0 0 0.0 0 0.0 s s 0 0.0 s sNYS excl. NYC 290 2.6 260 2.3 294 2.6 1,117 9.9 302 2.7 293 2.6
1 Indicators are not mutually exclusive. Decedents and patients may have multiple substances in their system. Thus, overdoses involving heroin and overdosesinvolving opioid pain relievers will not add up to the overdoses involving all opioids.
2 This indicator includes pharmaceutically and illicitly produced opioids such as fentanyl.
3 Indicators generated for hospitalizations and emergency department visits are based on ICD-10-CM codes.
s: Data for indicators related to hospitalizations and emergency departments are suppressed for confidentiality purposes if there are less than 6 discharges.
38

Franklin County: Unique clients admitted to OASAS-certified chemical dependence treatment programs 1,2
(Preliminary data as of October, 2017 - subject to change)
2015 2016 2017
Indicator Total Jan-Mar Apr-Jun Jul-Sep Oct-Dec Total Jan-Mar Apr-Jun
Unique clients admitted forheroin
109 25 23 32 22 92 21 19
Unique clients admitted for anyopioid (incl. heroin)
280 85 86 93 85 300 86 78
OASAS: Office of Alcoholism and Substance Abuse Services
1 The number of unique clients admitted per year does not equal the sum of the unique clients admitted each quarter. This is because an individual client can beadmitted to treatment in more than one quarter during the year.
2 Clients may have heroin, other opioids, or any other substance simultaneously recorded as the primary, secondary and tertiary substance of abuse at admission.
s: Data for indicators are suppressed for confidentiality purposes if there are less than 6 clients.
Franklin County: Naloxone administration reports (Preliminary data as of November, 2017 - subject to change)
2015 2016 2017
Indicator Location Total Jan-Mar Apr-Jun Jul-Sep Oct-Dec Total Jan-Mar Apr-Jun Jul-Sep
Emergency Medical Services (EMS) naloxone administration reports 1,2
Naloxone administration reportby EMS
Franklin 8 1 4 5 7 17 2 5 6NYS excl. NYC 6,115 1,730 2,009 1,747 1,542 7,028 1,518 1,710 1,702
Law enforcement naloxone administration reports 3
Naloxone administration reportby law enforcement
Franklin 3 0 0 1 3 4 2 1 1NYS excl. NYC 956 404 402 392 346 1,544 336 443 331
Registered Community Opioid Overdose Prevention (COOP) program naloxone administration reports 3
Naloxone administration reportby registered COOP program
Franklin 1 0 1 0 0 1 0 4 2NYS excl. NYC 489 255 248 224 176 903 182 239 107
1 County numbers displayed in the table represent only naloxone administration events reported electronically, therefore, actual numbers of events may be higher.
2 EMS reporting may have been affected by a change in documentation systems used by EMS agency/ies serving the area. Counts may decrease until updates to thedata are available in 2018, if applicable.
3 Numbers displayed in the table represent only naloxone administration reports submitted by law enforcement and registered COOP programs to the NYSDOH AIDSInstitute. The actual numbers of naloxone administration events may be higher.
39

Fulton County: Opioid overdoses and rates per 100,000 population (Preliminary data as of November, 2017 - subject to change)
Apr-Jun, 2016 Jul-Sep, 2016 Oct-Dec, 2016 2016 Total Jan-Mar, 2017 Apr-Jun, 2017
Indicator Location NumberCrudeRate Number
CrudeRate Number
CrudeRate Number
CrudeRate Number
CrudeRate Number
CrudeRate
Deaths 1
All opioid overdoses Fulton 1 1.9 1 1.9 0 0.0 4 7.4 0 0.0 0 0.0NYS excl. NYC 501 4.5 476 4.2 506 4.5 1,990 17.7 130 1.2 75 0.7
Heroin overdoses Fulton 1 1.9 0 0.0 0 0.0 2 3.7 0 0.0 0 0.0NYS excl. NYC 207 1.8 202 1.8 179 1.6 798 7.1 51 0.5 30 0.3
Overdoses involvingopioid pain relievers 2
Fulton 1 1.9 1 1.9 0 0.0 2 3.7 0 0.0 0 0.0NYS excl. NYC 388 3.5 371 3.3 439 3.9 1,576 14.0 96 0.9 56 0.5
Outpatient emergency department visits 3
All opioid overdoses Fulton 7 13.0 s s s s 21 38.9 s s 7 13.0NYS excl. NYC 1,772 15.8 1,552 13.8 1,605 14.3 6,675 59.4 1,684 15.0 1,845 16.4
Heroin overdoses Fulton s s s s s s 15 27.8 s s s sNYS excl. NYC 1,282 11.4 1,085 9.6 1,128 10.0 4,784 42.5 1,183 10.5 1,351 12.0
Opioid overdosesexcluding heroin 2
Fulton s s s s s s s s s s s sNYS excl. NYC 490 4.4 467 4.2 477 4.2 1,891 16.8 501 4.5 494 4.4
Hospitalizations 3
All opioid overdoses Fulton s s 0 0.0 s s 7 13.0 0 0.0 s sNYS excl. NYC 486 4.3 457 4.1 467 4.2 1,895 16.9 481 4.3 500 4.4
Heroin overdoses Fulton s s 0 0.0 s s s s 0 0.0 s sNYS excl. NYC 196 1.7 197 1.8 173 1.5 778 6.9 179 1.6 207 1.8
Opioid overdosesexcluding heroin 2
Fulton s s 0 0.0 s s s s 0 0.0 s sNYS excl. NYC 290 2.6 260 2.3 294 2.6 1,117 9.9 302 2.7 293 2.6
1 Indicators are not mutually exclusive. Decedents and patients may have multiple substances in their system. Thus, overdoses involving heroin and overdosesinvolving opioid pain relievers will not add up to the overdoses involving all opioids.
2 This indicator includes pharmaceutically and illicitly produced opioids such as fentanyl.
3 Indicators generated for hospitalizations and emergency department visits are based on ICD-10-CM codes.
s: Data for indicators related to hospitalizations and emergency departments are suppressed for confidentiality purposes if there are less than 6 discharges.
40

Fulton County: Unique clients admitted to OASAS-certified chemical dependence treatment programs 1,2
(Preliminary data as of October, 2017 - subject to change)
2015 2016 2017
Indicator Total Jan-Mar Apr-Jun Jul-Sep Oct-Dec Total Jan-Mar Apr-Jun
Unique clients admitted forheroin
104 43 54 40 43 147 36 48
Unique clients admitted for anyopioid (incl. heroin)
157 61 75 53 56 204 57 74
OASAS: Office of Alcoholism and Substance Abuse Services
1 The number of unique clients admitted per year does not equal the sum of the unique clients admitted each quarter. This is because an individual client can beadmitted to treatment in more than one quarter during the year.
2 Clients may have heroin, other opioids, or any other substance simultaneously recorded as the primary, secondary and tertiary substance of abuse at admission.
s: Data for indicators are suppressed for confidentiality purposes if there are less than 6 clients.
Fulton County: Naloxone administration reports (Preliminary data as of November, 2017 - subject to change)
2015 2016 2017
Indicator Location Total Jan-Mar Apr-Jun Jul-Sep Oct-Dec Total Jan-Mar Apr-Jun Jul-Sep
Emergency Medical Services (EMS) naloxone administration reports 1,2
Naloxone administration reportby EMS
Fulton 3 0 0 1 1 2 7 7 8NYS excl. NYC 6,115 1,730 2,009 1,747 1,542 7,028 1,518 1,710 1,702
Law enforcement naloxone administration reports 3
Naloxone administration reportby law enforcement
Fulton 1 1 1 0 1 3 2 1 0NYS excl. NYC 956 404 402 392 346 1,544 336 443 331
Registered Community Opioid Overdose Prevention (COOP) program naloxone administration reports 3
Naloxone administration reportby registered COOP program
Fulton 0 0 1 2 2 5 1 1 1NYS excl. NYC 489 255 248 224 176 903 182 239 107
1 County numbers displayed in the table represent only naloxone administration events reported electronically, therefore, actual numbers of events may be higher.
2 EMS reporting may have been affected by a change in documentation systems used by EMS agency/ies serving the area. Counts may decrease until updates to thedata are available in 2018, if applicable.
3 Numbers displayed in the table represent only naloxone administration reports submitted by law enforcement and registered COOP programs to the NYSDOH AIDSInstitute. The actual numbers of naloxone administration events may be higher.
41
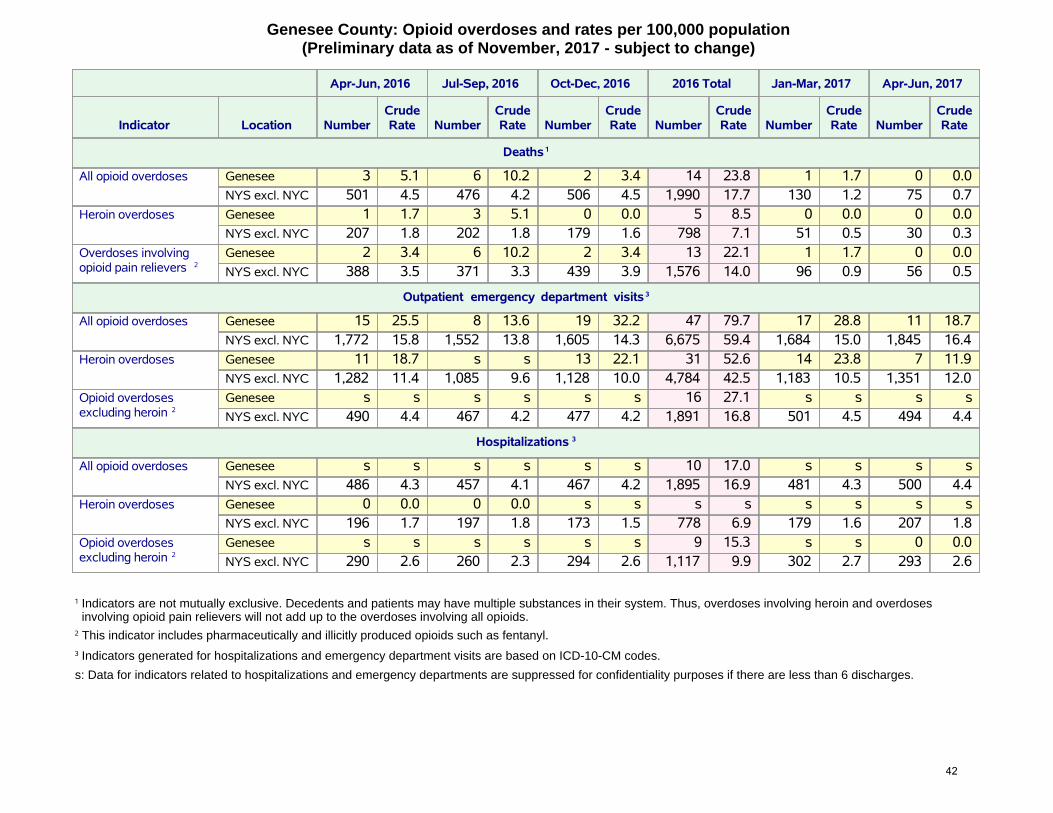
Genesee County: Opioid overdoses and rates per 100,000 population (Preliminary data as of November, 2017 - subject to change)
Apr-Jun, 2016 Jul-Sep, 2016 Oct-Dec, 2016 2016 Total Jan-Mar, 2017 Apr-Jun, 2017
Indicator Location NumberCrudeRate Number
CrudeRate Number
CrudeRate Number
CrudeRate Number
CrudeRate Number
CrudeRate
Deaths 1
All opioid overdoses Genesee 3 5.1 6 10.2 2 3.4 14 23.8 1 1.7 0 0.0NYS excl. NYC 501 4.5 476 4.2 506 4.5 1,990 17.7 130 1.2 75 0.7
Heroin overdoses Genesee 1 1.7 3 5.1 0 0.0 5 8.5 0 0.0 0 0.0NYS excl. NYC 207 1.8 202 1.8 179 1.6 798 7.1 51 0.5 30 0.3
Overdoses involvingopioid pain relievers 2
Genesee 2 3.4 6 10.2 2 3.4 13 22.1 1 1.7 0 0.0NYS excl. NYC 388 3.5 371 3.3 439 3.9 1,576 14.0 96 0.9 56 0.5
Outpatient emergency department visits 3
All opioid overdoses Genesee 15 25.5 8 13.6 19 32.2 47 79.7 17 28.8 11 18.7NYS excl. NYC 1,772 15.8 1,552 13.8 1,605 14.3 6,675 59.4 1,684 15.0 1,845 16.4
Heroin overdoses Genesee 11 18.7 s s 13 22.1 31 52.6 14 23.8 7 11.9NYS excl. NYC 1,282 11.4 1,085 9.6 1,128 10.0 4,784 42.5 1,183 10.5 1,351 12.0
Opioid overdosesexcluding heroin 2
Genesee s s s s s s 16 27.1 s s s sNYS excl. NYC 490 4.4 467 4.2 477 4.2 1,891 16.8 501 4.5 494 4.4
Hospitalizations 3
All opioid overdoses Genesee s s s s s s 10 17.0 s s s sNYS excl. NYC 486 4.3 457 4.1 467 4.2 1,895 16.9 481 4.3 500 4.4
Heroin overdoses Genesee 0 0.0 0 0.0 s s s s s s s sNYS excl. NYC 196 1.7 197 1.8 173 1.5 778 6.9 179 1.6 207 1.8
Opioid overdosesexcluding heroin 2
Genesee s s s s s s 9 15.3 s s 0 0.0NYS excl. NYC 290 2.6 260 2.3 294 2.6 1,117 9.9 302 2.7 293 2.6
1 Indicators are not mutually exclusive. Decedents and patients may have multiple substances in their system. Thus, overdoses involving heroin and overdosesinvolving opioid pain relievers will not add up to the overdoses involving all opioids.
2 This indicator includes pharmaceutically and illicitly produced opioids such as fentanyl.
3 Indicators generated for hospitalizations and emergency department visits are based on ICD-10-CM codes.
s: Data for indicators related to hospitalizations and emergency departments are suppressed for confidentiality purposes if there are less than 6 discharges.
42

Genesee County: Unique clients admitted to OASAS-certified chemical dependence treatment programs 1,2
(Preliminary data as of October, 2017 - subject to change)
2015 2016 2017
Indicator Total Jan-Mar Apr-Jun Jul-Sep Oct-Dec Total Jan-Mar Apr-Jun
Unique clients admitted forheroin
205 74 86 63 63 222 86 73
Unique clients admitted for anyopioid (incl. heroin)
352 102 129 114 107 351 142 119
OASAS: Office of Alcoholism and Substance Abuse Services
1 The number of unique clients admitted per year does not equal the sum of the unique clients admitted each quarter. This is because an individual client can beadmitted to treatment in more than one quarter during the year.
2 Clients may have heroin, other opioids, or any other substance simultaneously recorded as the primary, secondary and tertiary substance of abuse at admission.
s: Data for indicators are suppressed for confidentiality purposes if there are less than 6 clients.
Genesee County: Naloxone administration reports (Preliminary data as of November, 2017 - subject to change)
2015 2016 2017
Indicator Location Total Jan-Mar Apr-Jun Jul-Sep Oct-Dec Total Jan-Mar Apr-Jun Jul-Sep
Emergency Medical Services (EMS) naloxone administration reports 1,2
Naloxone administration reportby EMS
Genesee 36 12 13 8 9 42 10 14 20NYS excl. NYC 6,115 1,730 2,009 1,747 1,542 7,028 1,518 1,710 1,702
Law enforcement naloxone administration reports 3
Naloxone administration reportby law enforcement
Genesee 0 2 1 4 1 8 4 2 4NYS excl. NYC 956 404 402 392 346 1,544 336 443 331
Registered Community Opioid Overdose Prevention (COOP) program naloxone administration reports 3
Naloxone administration reportby registered COOP program
Genesee 0 1 2 2 2 7 0 1 0NYS excl. NYC 489 255 248 224 176 903 182 239 107
1 County numbers displayed in the table represent only naloxone administration events reported electronically, therefore, actual numbers of events may be higher.
2 EMS reporting may have been affected by a change in documentation systems used by EMS agency/ies serving the area. Counts may decrease until updates to thedata are available in 2018, if applicable.
3 Numbers displayed in the table represent only naloxone administration reports submitted by law enforcement and registered COOP programs to the NYSDOH AIDSInstitute. The actual numbers of naloxone administration events may be higher.
43

Greene County: Opioid overdoses and rates per 100,000 population (Preliminary data as of November, 2017 - subject to change)
Apr-Jun, 2016 Jul-Sep, 2016 Oct-Dec, 2016 2016 Total Jan-Mar, 2017 Apr-Jun, 2017
Indicator Location NumberCrudeRate Number
CrudeRate Number
CrudeRate Number
CrudeRate Number
CrudeRate Number
CrudeRate
Deaths 1
All opioid overdoses Greene 2 4.2 3 6.3 5 10.5 12 25.2 1 2.1 0 0.0NYS excl. NYC 501 4.5 476 4.2 506 4.5 1,990 17.7 130 1.2 75 0.7
Heroin overdoses Greene 1 2.1 3 6.3 2 4.2 7 14.7 1 2.1 0 0.0NYS excl. NYC 207 1.8 202 1.8 179 1.6 798 7.1 51 0.5 30 0.3
Overdoses involvingopioid pain relievers 2
Greene 1 2.1 2 4.2 5 10.5 9 18.9 0 0.0 0 0.0NYS excl. NYC 388 3.5 371 3.3 439 3.9 1,576 14.0 96 0.9 56 0.5
Outpatient emergency department visits 3
All opioid overdoses Greene 14 29.4 7 14.7 20 42.0 47 98.7 7 14.7 13 27.3NYS excl. NYC 1,772 15.8 1,552 13.8 1,605 14.3 6,675 59.4 1,684 15.0 1,845 16.4
Heroin overdoses Greene 10 21.0 s s 15 31.5 33 69.3 s s 11 23.1NYS excl. NYC 1,282 11.4 1,085 9.6 1,128 10.0 4,784 42.5 1,183 10.5 1,351 12.0
Opioid overdosesexcluding heroin 2
Greene s s s s s s 14 29.4 s s s sNYS excl. NYC 490 4.4 467 4.2 477 4.2 1,891 16.8 501 4.5 494 4.4
Hospitalizations 3
All opioid overdoses Greene s s 0 0.0 s s 8 16.8 0 0.0 s sNYS excl. NYC 486 4.3 457 4.1 467 4.2 1,895 16.9 481 4.3 500 4.4
Heroin overdoses Greene s s 0 0.0 0 0.0 s s 0 0.0 s sNYS excl. NYC 196 1.7 197 1.8 173 1.5 778 6.9 179 1.6 207 1.8
Opioid overdosesexcluding heroin 2
Greene s s 0 0.0 s s s s 0 0.0 s sNYS excl. NYC 290 2.6 260 2.3 294 2.6 1,117 9.9 302 2.7 293 2.6
1 Indicators are not mutually exclusive. Decedents and patients may have multiple substances in their system. Thus, overdoses involving heroin and overdosesinvolving opioid pain relievers will not add up to the overdoses involving all opioids.
2 This indicator includes pharmaceutically and illicitly produced opioids such as fentanyl.
3 Indicators generated for hospitalizations and emergency department visits are based on ICD-10-CM codes.
s: Data for indicators related to hospitalizations and emergency departments are suppressed for confidentiality purposes if there are less than 6 discharges.
44

Greene County: Unique clients admitted to OASAS-certified chemical dependence treatment programs 1,2
(Preliminary data as of October, 2017 - subject to change)
2015 2016 2017
Indicator Total Jan-Mar Apr-Jun Jul-Sep Oct-Dec Total Jan-Mar Apr-Jun
Unique clients admitted forheroin
163 65 69 63 74 214 71 60
Unique clients admitted for anyopioid (incl. heroin)
249 94 89 79 104 290 88 86
OASAS: Office of Alcoholism and Substance Abuse Services
1 The number of unique clients admitted per year does not equal the sum of the unique clients admitted each quarter. This is because an individual client can beadmitted to treatment in more than one quarter during the year.
2 Clients may have heroin, other opioids, or any other substance simultaneously recorded as the primary, secondary and tertiary substance of abuse at admission.
s: Data for indicators are suppressed for confidentiality purposes if there are less than 6 clients.
Greene County: Naloxone administration reports (Preliminary data as of November, 2017 - subject to change)
2015 2016 2017
Indicator Location Total Jan-Mar Apr-Jun Jul-Sep Oct-Dec Total Jan-Mar Apr-Jun Jul-Sep
Emergency Medical Services (EMS) naloxone administration reports 1,2
Naloxone administration reportby EMS
Greene 67 15 19 6 20 60 18 15 22NYS excl. NYC 6,115 1,730 2,009 1,747 1,542 7,028 1,518 1,710 1,702
Law enforcement naloxone administration reports 3
Naloxone administration reportby law enforcement
Greene 4 2 3 3 4 12 3 8 5NYS excl. NYC 956 404 402 392 346 1,544 336 443 331
Registered Community Opioid Overdose Prevention (COOP) program naloxone administration reports 3
Naloxone administration reportby registered COOP program
Greene 3 1 0 1 1 3 1 0 0NYS excl. NYC 489 255 248 224 176 903 182 239 107
1 County numbers displayed in the table represent only naloxone administration events reported electronically, therefore, actual numbers of events may be higher.
2 EMS reporting may have been affected by a change in documentation systems used by EMS agency/ies serving the area. Counts may decrease until updates to thedata are available in 2018, if applicable.
3 Numbers displayed in the table represent only naloxone administration reports submitted by law enforcement and registered COOP programs to the NYSDOH AIDSInstitute. The actual numbers of naloxone administration events may be higher.
45

Hamilton County: Opioid overdoses and rates per 100,000 population (Preliminary data as of November, 2017 - subject to change)
Apr-Jun, 2016 Jul-Sep, 2016 Oct-Dec, 2016 2016 Total Jan-Mar, 2017 Apr-Jun, 2017
Indicator Location NumberCrudeRate Number
CrudeRate Number
CrudeRate Number
CrudeRate Number
CrudeRate Number
CrudeRate
Deaths 1
All opioid overdoses Hamilton 0 0.0 0 0.0 0 0.0 1 21.2 0 0.0 0 0.0NYS excl. NYC 501 4.5 476 4.2 506 4.5 1,990 17.7 130 1.2 75 0.7
Heroin overdoses Hamilton 0 0.0 0 0.0 0 0.0 0 0.0 0 0.0 0 0.0NYS excl. NYC 207 1.8 202 1.8 179 1.6 798 7.1 51 0.5 30 0.3
Overdoses involvingopioid pain relievers 2
Hamilton 0 0.0 0 0.0 0 0.0 0 0.0 0 0.0 0 0.0NYS excl. NYC 388 3.5 371 3.3 439 3.9 1,576 14.0 96 0.9 56 0.5
Outpatient emergency department visits 3
All opioid overdoses Hamilton 0 0.0 0 0.0 0 0.0 0 0.0 0 0.0 0 0.0NYS excl. NYC 1,772 15.8 1,552 13.8 1,605 14.3 6,675 59.4 1,684 15.0 1,845 16.4
Heroin overdoses Hamilton 0 0.0 0 0.0 0 0.0 0 0.0 0 0.0 0 0.0NYS excl. NYC 1,282 11.4 1,085 9.6 1,128 10.0 4,784 42.5 1,183 10.5 1,351 12.0
Opioid overdosesexcluding heroin 2
Hamilton 0 0.0 0 0.0 0 0.0 0 0.0 0 0.0 0 0.0NYS excl. NYC 490 4.4 467 4.2 477 4.2 1,891 16.8 501 4.5 494 4.4
Hospitalizations 3
All opioid overdoses Hamilton 0 0.0 0 0.0 0 0.0 s s s s 0 0.0NYS excl. NYC 486 4.3 457 4.1 467 4.2 1,895 16.9 481 4.3 500 4.4
Heroin overdoses Hamilton 0 0.0 0 0.0 0 0.0 0 0.0 0 0.0 0 0.0NYS excl. NYC 196 1.7 197 1.8 173 1.5 778 6.9 179 1.6 207 1.8
Opioid overdosesexcluding heroin 2
Hamilton 0 0.0 0 0.0 0 0.0 s s s s 0 0.0NYS excl. NYC 290 2.6 260 2.3 294 2.6 1,117 9.9 302 2.7 293 2.6
1 Indicators are not mutually exclusive. Decedents and patients may have multiple substances in their system. Thus, overdoses involving heroin and overdosesinvolving opioid pain relievers will not add up to the overdoses involving all opioids.
2 This indicator includes pharmaceutically and illicitly produced opioids such as fentanyl.
3 Indicators generated for hospitalizations and emergency department visits are based on ICD-10-CM codes.
s: Data for indicators related to hospitalizations and emergency departments are suppressed for confidentiality purposes if there are less than 6 discharges.
46

Hamilton County: Unique clients admitted to OASAS-certified chemical dependence treatment programs 1,2
(Preliminary data as of October, 2017 - subject to change)
2015 2016 2017
Indicator Total Jan-Mar Apr-Jun Jul-Sep Oct-Dec Total Jan-Mar Apr-Jun
Unique clients admitted forheroin
s 0 s s s s 0 s
Unique clients admitted for anyopioid (incl. heroin)
s s s s s s 0 s
OASAS: Office of Alcoholism and Substance Abuse Services
1 The number of unique clients admitted per year does not equal the sum of the unique clients admitted each quarter. This is because an individual client can beadmitted to treatment in more than one quarter during the year.
2 Clients may have heroin, other opioids, or any other substance simultaneously recorded as the primary, secondary and tertiary substance of abuse at admission.
s: Data for indicators are suppressed for confidentiality purposes if there are less than 6 clients.
Hamilton County: Naloxone administration reports (Preliminary data as of November, 2017 - subject to change)
2015 2016 2017
Indicator Location Total Jan-Mar Apr-Jun Jul-Sep Oct-Dec Total Jan-Mar Apr-Jun Jul-Sep
Emergency Medical Services (EMS) naloxone administration reports 1,2
Naloxone administration reportby EMS
Hamilton 1 2 0 0 0 2 0 1 0NYS excl. NYC 6,115 1,730 2,009 1,747 1,542 7,028 1,518 1,710 1,702
Law enforcement naloxone administration reports 3
Naloxone administration reportby law enforcement
Hamilton 0 0 0 1 0 1 0 0 0NYS excl. NYC 956 404 402 392 346 1,544 336 443 331
Registered Community Opioid Overdose Prevention (COOP) program naloxone administration reports 3
Naloxone administration reportby registered COOP program
Hamilton 0 0 0 0 0 0 0 0 0NYS excl. NYC 489 255 248 224 176 903 182 239 107
1 County numbers displayed in the table represent only naloxone administration events reported electronically, therefore, actual numbers of events may be higher.
2 EMS reporting may have been affected by a change in documentation systems used by EMS agency/ies serving the area. Counts may decrease until updates to thedata are available in 2018, if applicable.
3 Numbers displayed in the table represent only naloxone administration reports submitted by law enforcement and registered COOP programs to the NYSDOH AIDSInstitute. The actual numbers of naloxone administration events may be higher.
47
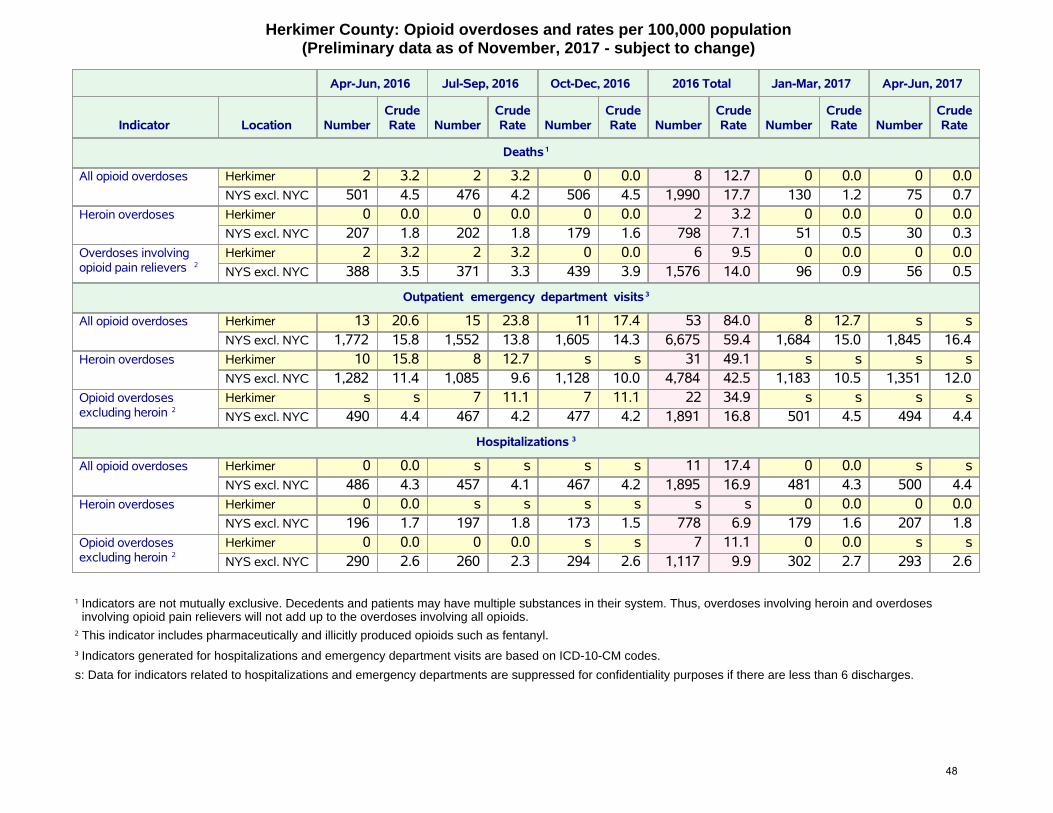
Herkimer County: Opioid overdoses and rates per 100,000 population (Preliminary data as of November, 2017 - subject to change)
Apr-Jun, 2016 Jul-Sep, 2016 Oct-Dec, 2016 2016 Total Jan-Mar, 2017 Apr-Jun, 2017
Indicator Location NumberCrudeRate Number
CrudeRate Number
CrudeRate Number
CrudeRate Number
CrudeRate Number
CrudeRate
Deaths 1
All opioid overdoses Herkimer 2 3.2 2 3.2 0 0.0 8 12.7 0 0.0 0 0.0NYS excl. NYC 501 4.5 476 4.2 506 4.5 1,990 17.7 130 1.2 75 0.7
Heroin overdoses Herkimer 0 0.0 0 0.0 0 0.0 2 3.2 0 0.0 0 0.0NYS excl. NYC 207 1.8 202 1.8 179 1.6 798 7.1 51 0.5 30 0.3
Overdoses involvingopioid pain relievers 2
Herkimer 2 3.2 2 3.2 0 0.0 6 9.5 0 0.0 0 0.0NYS excl. NYC 388 3.5 371 3.3 439 3.9 1,576 14.0 96 0.9 56 0.5
Outpatient emergency department visits 3
All opioid overdoses Herkimer 13 20.6 15 23.8 11 17.4 53 84.0 8 12.7 s sNYS excl. NYC 1,772 15.8 1,552 13.8 1,605 14.3 6,675 59.4 1,684 15.0 1,845 16.4
Heroin overdoses Herkimer 10 15.8 8 12.7 s s 31 49.1 s s s sNYS excl. NYC 1,282 11.4 1,085 9.6 1,128 10.0 4,784 42.5 1,183 10.5 1,351 12.0
Opioid overdosesexcluding heroin 2
Herkimer s s 7 11.1 7 11.1 22 34.9 s s s sNYS excl. NYC 490 4.4 467 4.2 477 4.2 1,891 16.8 501 4.5 494 4.4
Hospitalizations 3
All opioid overdoses Herkimer 0 0.0 s s s s 11 17.4 0 0.0 s sNYS excl. NYC 486 4.3 457 4.1 467 4.2 1,895 16.9 481 4.3 500 4.4
Heroin overdoses Herkimer 0 0.0 s s s s s s 0 0.0 0 0.0NYS excl. NYC 196 1.7 197 1.8 173 1.5 778 6.9 179 1.6 207 1.8
Opioid overdosesexcluding heroin 2
Herkimer 0 0.0 0 0.0 s s 7 11.1 0 0.0 s sNYS excl. NYC 290 2.6 260 2.3 294 2.6 1,117 9.9 302 2.7 293 2.6
1 Indicators are not mutually exclusive. Decedents and patients may have multiple substances in their system. Thus, overdoses involving heroin and overdosesinvolving opioid pain relievers will not add up to the overdoses involving all opioids.
2 This indicator includes pharmaceutically and illicitly produced opioids such as fentanyl.
3 Indicators generated for hospitalizations and emergency department visits are based on ICD-10-CM codes.
s: Data for indicators related to hospitalizations and emergency departments are suppressed for confidentiality purposes if there are less than 6 discharges.
48
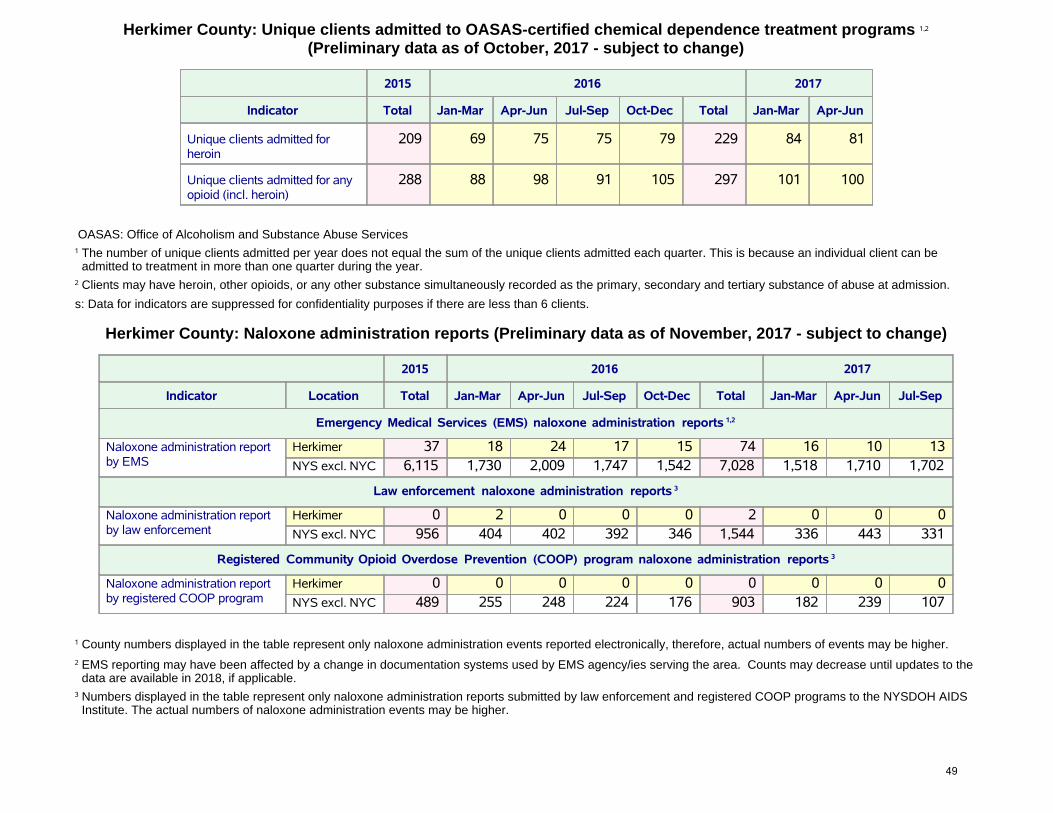
Herkimer County: Unique clients admitted to OASAS-certified chemical dependence treatment programs 1,2
(Preliminary data as of October, 2017 - subject to change)
2015 2016 2017
Indicator Total Jan-Mar Apr-Jun Jul-Sep Oct-Dec Total Jan-Mar Apr-Jun
Unique clients admitted forheroin
209 69 75 75 79 229 84 81
Unique clients admitted for anyopioid (incl. heroin)
288 88 98 91 105 297 101 100
OASAS: Office of Alcoholism and Substance Abuse Services
1 The number of unique clients admitted per year does not equal the sum of the unique clients admitted each quarter. This is because an individual client can beadmitted to treatment in more than one quarter during the year.
2 Clients may have heroin, other opioids, or any other substance simultaneously recorded as the primary, secondary and tertiary substance of abuse at admission.
s: Data for indicators are suppressed for confidentiality purposes if there are less than 6 clients.
Herkimer County: Naloxone administration reports (Preliminary data as of November, 2017 - subject to change)
2015 2016 2017
Indicator Location Total Jan-Mar Apr-Jun Jul-Sep Oct-Dec Total Jan-Mar Apr-Jun Jul-Sep
Emergency Medical Services (EMS) naloxone administration reports 1,2
Naloxone administration reportby EMS
Herkimer 37 18 24 17 15 74 16 10 13NYS excl. NYC 6,115 1,730 2,009 1,747 1,542 7,028 1,518 1,710 1,702
Law enforcement naloxone administration reports 3
Naloxone administration reportby law enforcement
Herkimer 0 2 0 0 0 2 0 0 0NYS excl. NYC 956 404 402 392 346 1,544 336 443 331
Registered Community Opioid Overdose Prevention (COOP) program naloxone administration reports 3
Naloxone administration reportby registered COOP program
Herkimer 0 0 0 0 0 0 0 0 0NYS excl. NYC 489 255 248 224 176 903 182 239 107
1 County numbers displayed in the table represent only naloxone administration events reported electronically, therefore, actual numbers of events may be higher.
2 EMS reporting may have been affected by a change in documentation systems used by EMS agency/ies serving the area. Counts may decrease until updates to thedata are available in 2018, if applicable.
3 Numbers displayed in the table represent only naloxone administration reports submitted by law enforcement and registered COOP programs to the NYSDOH AIDSInstitute. The actual numbers of naloxone administration events may be higher.
49

Jefferson County: Opioid overdoses and rates per 100,000 population (Preliminary data as of November, 2017 - subject to change)
Apr-Jun, 2016 Jul-Sep, 2016 Oct-Dec, 2016 2016 Total Jan-Mar, 2017 Apr-Jun, 2017
Indicator Location NumberCrudeRate Number
CrudeRate Number
CrudeRate Number
CrudeRate Number
CrudeRate Number
CrudeRate
Deaths 1
All opioid overdoses Jefferson 2 1.7 8 6.8 4 3.4 18 15.3 1 0.9 1 0.9NYS excl. NYC 501 4.5 476 4.2 506 4.5 1,990 17.7 130 1.2 75 0.7
Heroin overdoses Jefferson 0 0.0 4 3.4 0 0.0 7 6.0 0 0.0 1 0.9NYS excl. NYC 207 1.8 202 1.8 179 1.6 798 7.1 51 0.5 30 0.3
Overdoses involvingopioid pain relievers 2
Jefferson 2 1.7 5 4.3 3 2.6 13 11.1 1 0.9 0 0.0NYS excl. NYC 388 3.5 371 3.3 439 3.9 1,576 14.0 96 0.9 56 0.5
Outpatient emergency department visits 3
All opioid overdoses Jefferson 9 7.7 19 16.2 s s 43 36.6 13 11.1 s sNYS excl. NYC 1,772 15.8 1,552 13.8 1,605 14.3 6,675 59.4 1,684 15.0 1,845 16.4
Heroin overdoses Jefferson 7 6.0 15 12.8 s s 31 26.4 8 6.8 s sNYS excl. NYC 1,282 11.4 1,085 9.6 1,128 10.0 4,784 42.5 1,183 10.5 1,351 12.0
Opioid overdosesexcluding heroin 2
Jefferson s s s s s s 12 10.2 s s s sNYS excl. NYC 490 4.4 467 4.2 477 4.2 1,891 16.8 501 4.5 494 4.4
Hospitalizations 3
All opioid overdoses Jefferson s s s s s s 18 15.3 s s s sNYS excl. NYC 486 4.3 457 4.1 467 4.2 1,895 16.9 481 4.3 500 4.4
Heroin overdoses Jefferson 0 0.0 s s s s s s s s s sNYS excl. NYC 196 1.7 197 1.8 173 1.5 778 6.9 179 1.6 207 1.8
Opioid overdosesexcluding heroin 2
Jefferson s s s s s s 15 12.8 s s s sNYS excl. NYC 290 2.6 260 2.3 294 2.6 1,117 9.9 302 2.7 293 2.6
1 Indicators are not mutually exclusive. Decedents and patients may have multiple substances in their system. Thus, overdoses involving heroin and overdosesinvolving opioid pain relievers will not add up to the overdoses involving all opioids.
2 This indicator includes pharmaceutically and illicitly produced opioids such as fentanyl.
3 Indicators generated for hospitalizations and emergency department visits are based on ICD-10-CM codes.
s: Data for indicators related to hospitalizations and emergency departments are suppressed for confidentiality purposes if there are less than 6 discharges.
50

Jefferson County: Unique clients admitted to OASAS-certified chemical dependence treatment programs 1,2
(Preliminary data as of October, 2017 - subject to change)
2015 2016 2017
Indicator Total Jan-Mar Apr-Jun Jul-Sep Oct-Dec Total Jan-Mar Apr-Jun
Unique clients admitted forheroin
366 128 142 158 135 420 145 145
Unique clients admitted for anyopioid (incl. heroin)
492 172 193 208 182 563 194 192
OASAS: Office of Alcoholism and Substance Abuse Services
1 The number of unique clients admitted per year does not equal the sum of the unique clients admitted each quarter. This is because an individual client can beadmitted to treatment in more than one quarter during the year.
2 Clients may have heroin, other opioids, or any other substance simultaneously recorded as the primary, secondary and tertiary substance of abuse at admission.
s: Data for indicators are suppressed for confidentiality purposes if there are less than 6 clients.
Jefferson County: Naloxone administration reports (Preliminary data as of November, 2017 - subject to change)
2015 2016 2017
Indicator Location Total Jan-Mar Apr-Jun Jul-Sep Oct-Dec Total Jan-Mar Apr-Jun Jul-Sep
Emergency Medical Services (EMS) naloxone administration reports 1,2
Naloxone administration reportby EMS
Jefferson 41 9 13 7 10 39 27 24 19NYS excl. NYC 6,115 1,730 2,009 1,747 1,542 7,028 1,518 1,710 1,702
Law enforcement naloxone administration reports 3
Naloxone administration reportby law enforcement
Jefferson 3 8 9 13 9 39 15 7 4NYS excl. NYC 956 404 402 392 346 1,544 336 443 331
Registered Community Opioid Overdose Prevention (COOP) program naloxone administration reports 3
Naloxone administration reportby registered COOP program
Jefferson 2 2 0 0 1 3 0 0 0NYS excl. NYC 489 255 248 224 176 903 182 239 107
1 County numbers displayed in the table represent only naloxone administration events reported electronically, therefore, actual numbers of events may be higher.
2 EMS reporting may have been affected by a change in documentation systems used by EMS agency/ies serving the area. Counts may decrease until updates to thedata are available in 2018, if applicable.
3 Numbers displayed in the table represent only naloxone administration reports submitted by law enforcement and registered COOP programs to the NYSDOH AIDSInstitute. The actual numbers of naloxone administration events may be higher.
51
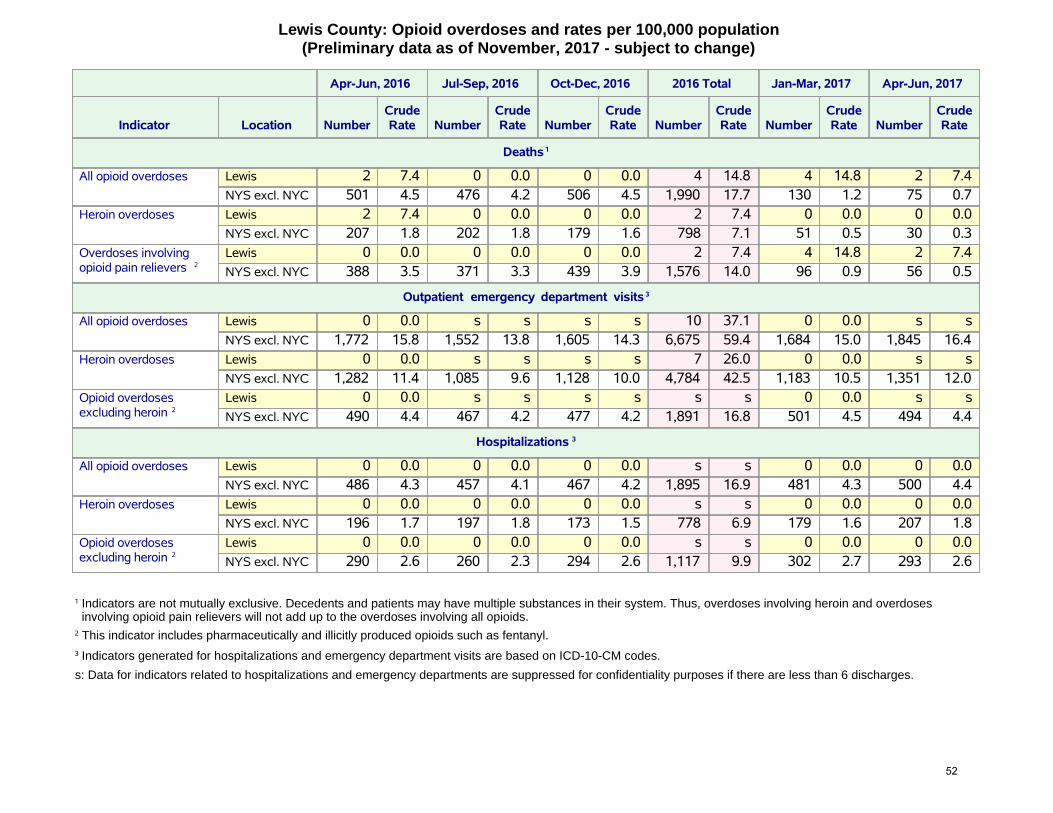
Lewis County: Opioid overdoses and rates per 100,000 population (Preliminary data as of November, 2017 - subject to change)
Apr-Jun, 2016 Jul-Sep, 2016 Oct-Dec, 2016 2016 Total Jan-Mar, 2017 Apr-Jun, 2017
Indicator Location NumberCrudeRate Number
CrudeRate Number
CrudeRate Number
CrudeRate Number
CrudeRate Number
CrudeRate
Deaths 1
All opioid overdoses Lewis 2 7.4 0 0.0 0 0.0 4 14.8 4 14.8 2 7.4NYS excl. NYC 501 4.5 476 4.2 506 4.5 1,990 17.7 130 1.2 75 0.7
Heroin overdoses Lewis 2 7.4 0 0.0 0 0.0 2 7.4 0 0.0 0 0.0NYS excl. NYC 207 1.8 202 1.8 179 1.6 798 7.1 51 0.5 30 0.3
Overdoses involvingopioid pain relievers 2
Lewis 0 0.0 0 0.0 0 0.0 2 7.4 4 14.8 2 7.4NYS excl. NYC 388 3.5 371 3.3 439 3.9 1,576 14.0 96 0.9 56 0.5
Outpatient emergency department visits 3
All opioid overdoses Lewis 0 0.0 s s s s 10 37.1 0 0.0 s sNYS excl. NYC 1,772 15.8 1,552 13.8 1,605 14.3 6,675 59.4 1,684 15.0 1,845 16.4
Heroin overdoses Lewis 0 0.0 s s s s 7 26.0 0 0.0 s sNYS excl. NYC 1,282 11.4 1,085 9.6 1,128 10.0 4,784 42.5 1,183 10.5 1,351 12.0
Opioid overdosesexcluding heroin 2
Lewis 0 0.0 s s s s s s 0 0.0 s sNYS excl. NYC 490 4.4 467 4.2 477 4.2 1,891 16.8 501 4.5 494 4.4
Hospitalizations 3
All opioid overdoses Lewis 0 0.0 0 0.0 0 0.0 s s 0 0.0 0 0.0NYS excl. NYC 486 4.3 457 4.1 467 4.2 1,895 16.9 481 4.3 500 4.4
Heroin overdoses Lewis 0 0.0 0 0.0 0 0.0 s s 0 0.0 0 0.0NYS excl. NYC 196 1.7 197 1.8 173 1.5 778 6.9 179 1.6 207 1.8
Opioid overdosesexcluding heroin 2
Lewis 0 0.0 0 0.0 0 0.0 s s 0 0.0 0 0.0NYS excl. NYC 290 2.6 260 2.3 294 2.6 1,117 9.9 302 2.7 293 2.6
1 Indicators are not mutually exclusive. Decedents and patients may have multiple substances in their system. Thus, overdoses involving heroin and overdosesinvolving opioid pain relievers will not add up to the overdoses involving all opioids.
2 This indicator includes pharmaceutically and illicitly produced opioids such as fentanyl.
3 Indicators generated for hospitalizations and emergency department visits are based on ICD-10-CM codes.
s: Data for indicators related to hospitalizations and emergency departments are suppressed for confidentiality purposes if there are less than 6 discharges.
52

Lewis County: Unique clients admitted to OASAS-certified chemical dependence treatment programs 1,2
(Preliminary data as of October, 2017 - subject to change)
2015 2016 2017
Indicator Total Jan-Mar Apr-Jun Jul-Sep Oct-Dec Total Jan-Mar Apr-Jun
Unique clients admitted forheroin
66 15 18 30 26 73 28 31
Unique clients admitted for anyopioid (incl. heroin)
99 21 24 39 31 95 36 36
OASAS: Office of Alcoholism and Substance Abuse Services
1 The number of unique clients admitted per year does not equal the sum of the unique clients admitted each quarter. This is because an individual client can beadmitted to treatment in more than one quarter during the year.
2 Clients may have heroin, other opioids, or any other substance simultaneously recorded as the primary, secondary and tertiary substance of abuse at admission.
s: Data for indicators are suppressed for confidentiality purposes if there are less than 6 clients.
Lewis County: Naloxone administration reports (Preliminary data as of November, 2017 - subject to change)
2015 2016 2017
Indicator Location Total Jan-Mar Apr-Jun Jul-Sep Oct-Dec Total Jan-Mar Apr-Jun Jul-Sep
Emergency Medical Services (EMS) naloxone administration reports 1,2
Naloxone administration reportby EMS
Lewis 10 3 1 2 1 7 5 4 5NYS excl. NYC 6,115 1,730 2,009 1,747 1,542 7,028 1,518 1,710 1,702
Law enforcement naloxone administration reports 3
Naloxone administration reportby law enforcement
Lewis 0 0 1 1 0 2 0 1 1NYS excl. NYC 956 404 402 392 346 1,544 336 443 331
Registered Community Opioid Overdose Prevention (COOP) program naloxone administration reports 3
Naloxone administration reportby registered COOP program
Lewis 0 0 0 0 0 0 0 0 0NYS excl. NYC 489 255 248 224 176 903 182 239 107
1 County numbers displayed in the table represent only naloxone administration events reported electronically, therefore, actual numbers of events may be higher.
2 EMS reporting may have been affected by a change in documentation systems used by EMS agency/ies serving the area. Counts may decrease until updates to thedata are available in 2018, if applicable.
3 Numbers displayed in the table represent only naloxone administration reports submitted by law enforcement and registered COOP programs to the NYSDOH AIDSInstitute. The actual numbers of naloxone administration events may be higher.
53

Livingston County: Opioid overdoses and rates per 100,000 population (Preliminary data as of November, 2017 - subject to change)
Apr-Jun, 2016 Jul-Sep, 2016 Oct-Dec, 2016 2016 Total Jan-Mar, 2017 Apr-Jun, 2017
Indicator Location NumberCrudeRate Number
CrudeRate Number
CrudeRate Number
CrudeRate Number
CrudeRate Number
CrudeRate
Deaths 1
All opioid overdoses Livingston 6 9.3 1 1.5 1 1.5 11 17.0 0 0.0 0 0.0NYS excl. NYC 501 4.5 476 4.2 506 4.5 1,990 17.7 130 1.2 75 0.7
Heroin overdoses Livingston 1 1.5 0 0.0 0 0.0 2 3.1 0 0.0 0 0.0NYS excl. NYC 207 1.8 202 1.8 179 1.6 798 7.1 51 0.5 30 0.3
Overdoses involvingopioid pain relievers 2
Livingston 5 7.7 1 1.5 1 1.5 9 13.9 0 0.0 0 0.0NYS excl. NYC 388 3.5 371 3.3 439 3.9 1,576 14.0 96 0.9 56 0.5
Outpatient emergency department visits 3
All opioid overdoses Livingston 9 13.9 8 12.4 13 20.1 35 54.1 10 15.5 s sNYS excl. NYC 1,772 15.8 1,552 13.8 1,605 14.3 6,675 59.4 1,684 15.0 1,845 16.4
Heroin overdoses Livingston s s s s 9 13.9 21 32.4 7 10.8 s sNYS excl. NYC 1,282 11.4 1,085 9.6 1,128 10.0 4,784 42.5 1,183 10.5 1,351 12.0
Opioid overdosesexcluding heroin 2
Livingston s s s s s s 14 21.6 s s s sNYS excl. NYC 490 4.4 467 4.2 477 4.2 1,891 16.8 501 4.5 494 4.4
Hospitalizations 3
All opioid overdoses Livingston s s s s s s 13 20.1 s s s sNYS excl. NYC 486 4.3 457 4.1 467 4.2 1,895 16.9 481 4.3 500 4.4
Heroin overdoses Livingston s s 0 0.0 s s s s s s s sNYS excl. NYC 196 1.7 197 1.8 173 1.5 778 6.9 179 1.6 207 1.8
Opioid overdosesexcluding heroin 2
Livingston s s s s 0 0.0 7 10.8 s s s sNYS excl. NYC 290 2.6 260 2.3 294 2.6 1,117 9.9 302 2.7 293 2.6
1 Indicators are not mutually exclusive. Decedents and patients may have multiple substances in their system. Thus, overdoses involving heroin and overdosesinvolving opioid pain relievers will not add up to the overdoses involving all opioids.
2 This indicator includes pharmaceutically and illicitly produced opioids such as fentanyl.
3 Indicators generated for hospitalizations and emergency department visits are based on ICD-10-CM codes.
s: Data for indicators related to hospitalizations and emergency departments are suppressed for confidentiality purposes if there are less than 6 discharges.
54

Livingston County: Unique clients admitted to OASAS-certified chemical dependence treatment programs 1,2
(Preliminary data as of October, 2017 - subject to change)
2015 2016 2017
Indicator Total Jan-Mar Apr-Jun Jul-Sep Oct-Dec Total Jan-Mar Apr-Jun
Unique clients admitted forheroin
162 53 69 52 72 204 61 54
Unique clients admitted for anyopioid (incl. heroin)
247 88 97 76 93 289 88 84
OASAS: Office of Alcoholism and Substance Abuse Services
1 The number of unique clients admitted per year does not equal the sum of the unique clients admitted each quarter. This is because an individual client can beadmitted to treatment in more than one quarter during the year.
2 Clients may have heroin, other opioids, or any other substance simultaneously recorded as the primary, secondary and tertiary substance of abuse at admission.
s: Data for indicators are suppressed for confidentiality purposes if there are less than 6 clients.
Livingston County: Naloxone administration reports (Preliminary data as of November, 2017 - subject to change)
2015 2016 2017
Indicator Location Total Jan-Mar Apr-Jun Jul-Sep Oct-Dec Total Jan-Mar Apr-Jun Jul-Sep
Emergency Medical Services (EMS) naloxone administration reports 1,2
Naloxone administration reportby EMS
Livingston 21 5 13 5 8 31 9 8 11NYS excl. NYC 6,115 1,730 2,009 1,747 1,542 7,028 1,518 1,710 1,702
Law enforcement naloxone administration reports 3
Naloxone administration reportby law enforcement
Livingston 5 2 4 1 3 10 1 2 3NYS excl. NYC 956 404 402 392 346 1,544 336 443 331
Registered Community Opioid Overdose Prevention (COOP) program naloxone administration reports 3
Naloxone administration reportby registered COOP program
Livingston 3 0 0 0 1 1 0 4 1NYS excl. NYC 489 255 248 224 176 903 182 239 107
1 County numbers displayed in the table represent only naloxone administration events reported electronically, therefore, actual numbers of events may be higher.Additional data validation steps have been taken to de-duplicate 2016 administrations by multiple agencies for the same patient encounter.
2 EMS reporting may have been affected by a change in documentation systems used by EMS agency/ies serving the area. Counts may decrease until updates to thedata are available in 2018, if applicable.
3 Numbers displayed in the table represent only naloxone administration reports submitted by law enforcement and registered COOP programs to the NYSDOH AIDSInstitute. The actual numbers of naloxone administration events may be higher.
55

Madison County: Opioid overdoses and rates per 100,000 population (Preliminary data as of November, 2017 - subject to change)
Apr-Jun, 2016 Jul-Sep, 2016 Oct-Dec, 2016 2016 Total Jan-Mar, 2017 Apr-Jun, 2017
Indicator Location NumberCrudeRate Number
CrudeRate Number
CrudeRate Number
CrudeRate Number
CrudeRate Number
CrudeRate
Deaths 1
All opioid overdoses Madison 5 7.0 2 2.8 3 4.2 14 19.5 0 0.0 0 0.0NYS excl. NYC 501 4.5 476 4.2 506 4.5 1,990 17.7 130 1.2 75 0.7
Heroin overdoses Madison 1 1.4 2 2.8 2 2.8 9 12.5 0 0.0 0 0.0NYS excl. NYC 207 1.8 202 1.8 179 1.6 798 7.1 51 0.5 30 0.3
Overdoses involvingopioid pain relievers 2
Madison 5 7.0 2 2.8 3 4.2 11 15.3 0 0.0 0 0.0NYS excl. NYC 388 3.5 371 3.3 439 3.9 1,576 14.0 96 0.9 56 0.5
Outpatient emergency department visits 3
All opioid overdoses Madison 9 12.5 13 18.1 15 20.9 53 73.8 8 11.1 s sNYS excl. NYC 1,772 15.8 1,552 13.8 1,605 14.3 6,675 59.4 1,684 15.0 1,845 16.4
Heroin overdoses Madison s s 10 13.9 10 13.9 36 50.1 s s s sNYS excl. NYC 1,282 11.4 1,085 9.6 1,128 10.0 4,784 42.5 1,183 10.5 1,351 12.0
Opioid overdosesexcluding heroin 2
Madison s s s s s s 17 23.7 s s s sNYS excl. NYC 490 4.4 467 4.2 477 4.2 1,891 16.8 501 4.5 494 4.4
Hospitalizations 3
All opioid overdoses Madison s s s s s s 16 22.3 s s s sNYS excl. NYC 486 4.3 457 4.1 467 4.2 1,895 16.9 481 4.3 500 4.4
Heroin overdoses Madison s s s s s s 7 9.7 s s 0 0.0NYS excl. NYC 196 1.7 197 1.8 173 1.5 778 6.9 179 1.6 207 1.8
Opioid overdosesexcluding heroin 2
Madison s s s s s s 9 12.5 s s s sNYS excl. NYC 290 2.6 260 2.3 294 2.6 1,117 9.9 302 2.7 293 2.6
1 Indicators are not mutually exclusive. Decedents and patients may have multiple substances in their system. Thus, overdoses involving heroin and overdosesinvolving opioid pain relievers will not add up to the overdoses involving all opioids.
2 This indicator includes pharmaceutically and illicitly produced opioids such as fentanyl.
3 Indicators generated for hospitalizations and emergency department visits are based on ICD-10-CM codes.
s: Data for indicators related to hospitalizations and emergency departments are suppressed for confidentiality purposes if there are less than 6 discharges.
56

Madison County: Unique clients admitted to OASAS-certified chemical dependence treatment programs 1,2
(Preliminary data as of October, 2017 - subject to change)
2015 2016 2017
Indicator Total Jan-Mar Apr-Jun Jul-Sep Oct-Dec Total Jan-Mar Apr-Jun
Unique clients admitted forheroin
210 81 68 76 76 241 79 53
Unique clients admitted for anyopioid (incl. heroin)
281 108 91 98 98 320 97 77
OASAS: Office of Alcoholism and Substance Abuse Services
1 The number of unique clients admitted per year does not equal the sum of the unique clients admitted each quarter. This is because an individual client can beadmitted to treatment in more than one quarter during the year.
2 Clients may have heroin, other opioids, or any other substance simultaneously recorded as the primary, secondary and tertiary substance of abuse at admission.
s: Data for indicators are suppressed for confidentiality purposes if there are less than 6 clients.
Madison County: Naloxone administration reports (Preliminary data as of November, 2017 - subject to change)
2015 2016 2017
Indicator Location Total Jan-Mar Apr-Jun Jul-Sep Oct-Dec Total Jan-Mar Apr-Jun Jul-Sep
Emergency Medical Services (EMS) naloxone administration reports 1,2
Naloxone administration reportby EMS
Madison 32 19 20 16 11 66 10 7 14NYS excl. NYC 6,115 1,730 2,009 1,747 1,542 7,028 1,518 1,710 1,702
Law enforcement naloxone administration reports 3
Naloxone administration reportby law enforcement
Madison 4 1 4 2 3 10 2 0 0NYS excl. NYC 956 404 402 392 346 1,544 336 443 331
Registered Community Opioid Overdose Prevention (COOP) program naloxone administration reports 3
Naloxone administration reportby registered COOP program
Madison 0 0 0 1 0 1 0 0 0NYS excl. NYC 489 255 248 224 176 903 182 239 107
1 County numbers displayed in the table represent only naloxone administration events reported electronically, therefore, actual numbers of events may be higher.
2 EMS reporting may have been affected by a change in documentation systems used by EMS agency/ies serving the area. Counts may decrease until updates to thedata are available in 2018, if applicable.
3 Numbers displayed in the table represent only naloxone administration reports submitted by law enforcement and registered COOP programs to the NYSDOH AIDSInstitute. The actual numbers of naloxone administration events may be higher.
57

Monroe County: Opioid overdoses and rates per 100,000 population (Preliminary data as of November, 2017 - subject to change)
Apr-Jun, 2016 Jul-Sep, 2016 Oct-Dec, 2016 2016 Total Jan-Mar, 2017 Apr-Jun, 2017
Indicator Location NumberCrudeRate Number
CrudeRate Number
CrudeRate Number
CrudeRate Number
CrudeRate Number
CrudeRate
Deaths 1
All opioid overdoses Monroe 49 6.5 32 4.3 42 5.6 149 19.9 5 0.7 1 0.1NYS excl. NYC 501 4.5 476 4.2 506 4.5 1,990 17.7 130 1.2 75 0.7
Heroin overdoses Monroe 27 3.6 13 1.7 14 1.9 65 8.7 5 0.7 0 0.0NYS excl. NYC 207 1.8 202 1.8 179 1.6 798 7.1 51 0.5 30 0.3
Overdoses involvingopioid pain relievers 2
Monroe 40 5.3 28 3.7 41 5.5 128 17.1 4 0.5 1 0.1NYS excl. NYC 388 3.5 371 3.3 439 3.9 1,576 14.0 96 0.9 56 0.5
Outpatient emergency department visits 3
All opioid overdoses Monroe 140 18.7 122 16.3 162 21.6 467 62.3 150 20.0 174 23.2NYS excl. NYC 1,772 15.8 1,552 13.8 1,605 14.3 6,675 59.4 1,684 15.0 1,845 16.4
Heroin overdoses Monroe 104 13.9 88 11.7 127 16.9 354 47.2 118 15.7 143 19.1NYS excl. NYC 1,282 11.4 1,085 9.6 1,128 10.0 4,784 42.5 1,183 10.5 1,351 12.0
Opioid overdosesexcluding heroin 2
Monroe 36 4.8 34 4.5 35 4.7 113 15.1 32 4.3 31 4.1NYS excl. NYC 490 4.4 467 4.2 477 4.2 1,891 16.8 501 4.5 494 4.4
Hospitalizations 3
All opioid overdoses Monroe 35 4.7 33 4.4 41 5.5 127 16.9 40 5.3 56 7.5NYS excl. NYC 486 4.3 457 4.1 467 4.2 1,895 16.9 481 4.3 500 4.4
Heroin overdoses Monroe 14 1.9 14 1.9 16 2.1 52 6.9 17 2.3 30 4.0NYS excl. NYC 196 1.7 197 1.8 173 1.5 778 6.9 179 1.6 207 1.8
Opioid overdosesexcluding heroin 2
Monroe 21 2.8 19 2.5 25 3.3 75 10.0 23 3.1 26 3.5NYS excl. NYC 290 2.6 260 2.3 294 2.6 1,117 9.9 302 2.7 293 2.6
1 Indicators are not mutually exclusive. Decedents and patients may have multiple substances in their system. Thus, overdoses involving heroin and overdosesinvolving opioid pain relievers will not add up to the overdoses involving all opioids.
2 This indicator includes pharmaceutically and illicitly produced opioids such as fentanyl.
3 Indicators generated for hospitalizations and emergency department visits are based on ICD-10-CM codes.
s: Data for indicators related to hospitalizations and emergency departments are suppressed for confidentiality purposes if there are less than 6 discharges.
58

Monroe County: Unique clients admitted to OASAS-certified chemical dependence treatment programs 1,2
(Preliminary data as of October, 2017 - subject to change)
2015 2016 2017
Indicator Total Jan-Mar Apr-Jun Jul-Sep Oct-Dec Total Jan-Mar Apr-Jun
Unique clients admitted forheroin
2,094 758 860 836 863 2,366 918 913
Unique clients admitted for anyopioid (incl. heroin)
2,712 966 1,064 1,011 1,053 2,983 1,115 1,101
OASAS: Office of Alcoholism and Substance Abuse Services
1 The number of unique clients admitted per year does not equal the sum of the unique clients admitted each quarter. This is because an individual client can beadmitted to treatment in more than one quarter during the year.
2 Clients may have heroin, other opioids, or any other substance simultaneously recorded as the primary, secondary and tertiary substance of abuse at admission.
s: Data for indicators are suppressed for confidentiality purposes if there are less than 6 clients.
Monroe County: Naloxone administration reports (Preliminary data as of November, 2017 - subject to change)
2015 2016 2017
Indicator Location Total Jan-Mar Apr-Jun Jul-Sep Oct-Dec Total Jan-Mar Apr-Jun Jul-Sep
Emergency Medical Services (EMS) naloxone administration reports 1,2
Naloxone administration reportby EMS
Monroe 500 112 285 114 91 602 69 83 125NYS excl. NYC 6,115 1,730 2,009 1,747 1,542 7,028 1,518 1,710 1,702
Law enforcement naloxone administration reports 3
Naloxone administration reportby law enforcement
Monroe 8 5 13 6 8 32 6 13 11NYS excl. NYC 956 404 402 392 346 1,544 336 443 331
Registered Community Opioid Overdose Prevention (COOP) program naloxone administration reports 3
Naloxone administration reportby registered COOP program
Monroe 29 10 12 14 22 58 39 35 0NYS excl. NYC 489 255 248 224 176 903 182 239 107
1 County numbers displayed in the table represent only naloxone administration events reported electronically, therefore, actual numbers of events may be higher.Additional data validation steps have been taken to de-duplicate 2016 administrations by multiple agencies for the same patient encounter.
2 EMS reporting for this county has been affected by a change in documentation systems used by a large EMS agency serving the area. Counts will likely show asharp decrease until updates to the data are available in 2018.
3 Numbers displayed in the table represent only naloxone administration reports submitted by law enforcement and registered COOP programs to the NYSDOH AIDSInstitute. The actual numbers of naloxone administration events may be higher.
59

Montgomery County: Opioid overdoses and rates per 100,000 population (Preliminary data as of November, 2017 - subject to change)
Apr-Jun, 2016 Jul-Sep, 2016 Oct-Dec, 2016 2016 Total Jan-Mar, 2017 Apr-Jun, 2017
Indicator Location NumberCrudeRate Number
CrudeRate Number
CrudeRate Number
CrudeRate Number
CrudeRate Number
CrudeRate
Deaths 1
All opioid overdoses Montgomery 0 0.0 0 0.0 3 6.0 3 6.0 0 0.0 0 0.0NYS excl. NYC 501 4.5 476 4.2 506 4.5 1,990 17.7 130 1.2 75 0.7
Heroin overdoses Montgomery 0 0.0 0 0.0 0 0.0 0 0.0 0 0.0 0 0.0NYS excl. NYC 207 1.8 202 1.8 179 1.6 798 7.1 51 0.5 30 0.3
Overdoses involvingopioid pain relievers 2
Montgomery 0 0.0 0 0.0 1 2.0 1 2.0 0 0.0 0 0.0NYS excl. NYC 388 3.5 371 3.3 439 3.9 1,576 14.0 96 0.9 56 0.5
Outpatient emergency department visits 3
All opioid overdoses Montgomery 8 16.1 s s 8 16.1 27 54.4 8 16.1 17 34.2NYS excl. NYC 1,772 15.8 1,552 13.8 1,605 14.3 6,675 59.4 1,684 15.0 1,845 16.4
Heroin overdoses Montgomery 8 16.1 s s s s 24 48.3 s s 11 22.2NYS excl. NYC 1,282 11.4 1,085 9.6 1,128 10.0 4,784 42.5 1,183 10.5 1,351 12.0
Opioid overdosesexcluding heroin 2
Montgomery 0 0.0 s s s s s s s s s sNYS excl. NYC 490 4.4 467 4.2 477 4.2 1,891 16.8 501 4.5 494 4.4
Hospitalizations 3
All opioid overdoses Montgomery s s s s s s s s 0 0.0 s sNYS excl. NYC 486 4.3 457 4.1 467 4.2 1,895 16.9 481 4.3 500 4.4
Heroin overdoses Montgomery 0 0.0 0 0.0 0 0.0 0 0.0 0 0.0 0 0.0NYS excl. NYC 196 1.7 197 1.8 173 1.5 778 6.9 179 1.6 207 1.8
Opioid overdosesexcluding heroin 2
Montgomery s s s s s s s s 0 0.0 s sNYS excl. NYC 290 2.6 260 2.3 294 2.6 1,117 9.9 302 2.7 293 2.6
1 Indicators are not mutually exclusive. Decedents and patients may have multiple substances in their system. Thus, overdoses involving heroin and overdosesinvolving opioid pain relievers will not add up to the overdoses involving all opioids.
2 This indicator includes pharmaceutically and illicitly produced opioids such as fentanyl.
3 Indicators generated for hospitalizations and emergency department visits are based on ICD-10-CM codes.
s: Data for indicators related to hospitalizations and emergency departments are suppressed for confidentiality purposes if there are less than 6 discharges.
60

Montgomery County: Unique clients admitted to OASAS-certified chemical dependence treatment programs 1,2
(Preliminary data as of October, 2017 - subject to change)
2015 2016 2017
Indicator Total Jan-Mar Apr-Jun Jul-Sep Oct-Dec Total Jan-Mar Apr-Jun
Unique clients admitted forheroin
187 64 82 81 65 222 65 78
Unique clients admitted for anyopioid (incl. heroin)
255 86 93 98 79 275 84 100
OASAS: Office of Alcoholism and Substance Abuse Services
1 The number of unique clients admitted per year does not equal the sum of the unique clients admitted each quarter. This is because an individual client can beadmitted to treatment in more than one quarter during the year.
2 Clients may have heroin, other opioids, or any other substance simultaneously recorded as the primary, secondary and tertiary substance of abuse at admission.
s: Data for indicators are suppressed for confidentiality purposes if there are less than 6 clients.
Montgomery County: Naloxone administration reports (Preliminary data as of November, 2017 - subject to change)
2015 2016 2017
Indicator Location Total Jan-Mar Apr-Jun Jul-Sep Oct-Dec Total Jan-Mar Apr-Jun Jul-Sep
Emergency Medical Services (EMS) naloxone administration reports 1,2
Naloxone administration reportby EMS
Montgomery 49 6 14 28 14 62 10 25 26NYS excl. NYC 6,115 1,730 2,009 1,747 1,542 7,028 1,518 1,710 1,702
Law enforcement naloxone administration reports 3
Naloxone administration reportby law enforcement
Montgomery 0 0 0 0 0 0 0 3 1NYS excl. NYC 956 404 402 392 346 1,544 336 443 331
Registered Community Opioid Overdose Prevention (COOP) program naloxone administration reports 3
Naloxone administration reportby registered COOP program
Montgomery 0 0 0 3 0 3 1 2 0NYS excl. NYC 489 255 248 224 176 903 182 239 107
1 County numbers displayed in the table represent only naloxone administration events reported electronically, therefore, actual numbers of events may be higher.Additional data validation steps have been taken to de-duplicate 2016 administrations by multiple agencies for the same patient encounter.
2 EMS reporting may have been affected by a change in documentation systems used by EMS agency/ies serving the area. Counts may decrease until updates to thedata are available in 2018, if applicable.
3 Numbers displayed in the table represent only naloxone administration reports submitted by law enforcement and registered COOP programs to the NYSDOH AIDSInstitute. The actual numbers of naloxone administration events may be higher.
61

Nassau County: Opioid overdoses and rates per 100,000 population (Preliminary data as of November, 2017 - subject to change)
Apr-Jun, 2016 Jul-Sep, 2016 Oct-Dec, 2016 2016 Total Jan-Mar, 2017 Apr-Jun, 2017
Indicator Location NumberCrudeRate Number
CrudeRate Number
CrudeRate Number
CrudeRate Number
CrudeRate Number
CrudeRate
Deaths 1
All opioid overdoses Nassau 53 3.9 40 2.9 53 3.9 188 13.8 16 1.2 5 0.4NYS excl. NYC 501 4.5 476 4.2 506 4.5 1,990 17.7 130 1.2 75 0.7
Heroin overdoses Nassau 20 1.5 12 0.9 10 0.7 56 4.1 7 0.5 2 0.1NYS excl. NYC 207 1.8 202 1.8 179 1.6 798 7.1 51 0.5 30 0.3
Overdoses involvingopioid pain relievers 2
Nassau 35 2.6 32 2.4 47 3.5 145 10.7 10 0.7 4 0.3NYS excl. NYC 388 3.5 371 3.3 439 3.9 1,576 14.0 96 0.9 56 0.5
Outpatient emergency department visits 3
All opioid overdoses Nassau 87 6.4 103 7.6 81 5.9 353 25.9 90 6.6 137 10.1NYS excl. NYC 1,772 15.8 1,552 13.8 1,605 14.3 6,675 59.4 1,684 15.0 1,845 16.4
Heroin overdoses Nassau 57 4.2 72 5.3 49 3.6 230 16.9 49 3.6 83 6.1NYS excl. NYC 1,282 11.4 1,085 9.6 1,128 10.0 4,784 42.5 1,183 10.5 1,351 12.0
Opioid overdosesexcluding heroin 2
Nassau 30 2.2 31 2.3 32 2.4 123 9.0 41 3.0 54 4.0NYS excl. NYC 490 4.4 467 4.2 477 4.2 1,891 16.8 501 4.5 494 4.4
Hospitalizations 3
All opioid overdoses Nassau 43 3.2 50 3.7 49 3.6 190 14.0 64 4.7 44 3.2NYS excl. NYC 486 4.3 457 4.1 467 4.2 1,895 16.9 481 4.3 500 4.4
Heroin overdoses Nassau 13 1.0 21 1.5 18 1.3 79 5.8 18 1.3 12 0.9NYS excl. NYC 196 1.7 197 1.8 173 1.5 778 6.9 179 1.6 207 1.8
Opioid overdosesexcluding heroin 2
Nassau 30 2.2 29 2.1 31 2.3 111 8.2 46 3.4 32 2.4NYS excl. NYC 290 2.6 260 2.3 294 2.6 1,117 9.9 302 2.7 293 2.6
1 Indicators are not mutually exclusive. Decedents and patients may have multiple substances in their system. Thus, overdoses involving heroin and overdosesinvolving opioid pain relievers will not add up to the overdoses involving all opioids.
2 This indicator includes pharmaceutically and illicitly produced opioids such as fentanyl.
3 Indicators generated for hospitalizations and emergency department visits are based on ICD-10-CM codes.
s: Data for indicators related to hospitalizations and emergency departments are suppressed for confidentiality purposes if there are less than 6 discharges.
62

Nassau County: Unique clients admitted to OASAS-certified chemical dependence treatment programs 1,2
(Preliminary data as of October, 2017 - subject to change)
2015 2016 2017
Indicator Total Jan-Mar Apr-Jun Jul-Sep Oct-Dec Total Jan-Mar Apr-Jun
Unique clients admitted forheroin
2,353 804 853 768 742 2,344 822 761
Unique clients admitted for anyopioid (incl. heroin)
3,121 1,051 1,090 1,004 986 3,159 1,036 1,004
OASAS: Office of Alcoholism and Substance Abuse Services
1 The number of unique clients admitted per year does not equal the sum of the unique clients admitted each quarter. This is because an individual client can beadmitted to treatment in more than one quarter during the year.
2 Clients may have heroin, other opioids, or any other substance simultaneously recorded as the primary, secondary and tertiary substance of abuse at admission.
s: Data for indicators are suppressed for confidentiality purposes if there are less than 6 clients.
Nassau County: Naloxone administration reports (Preliminary data as of November, 2017 - subject to change)
2015 2016 2017
Indicator Location Total Jan-Mar Apr-Jun Jul-Sep Oct-Dec Total Jan-Mar Apr-Jun Jul-Sep
Emergency Medical Services (EMS) naloxone administration reports 1,2
Naloxone administration reportby EMS
Nassau 633 138 148 138 177 601 151 186 168NYS excl. NYC 6,115 1,730 2,009 1,747 1,542 7,028 1,518 1,710 1,702
Law enforcement naloxone administration reports 3,4
Naloxone administration reportby law enforcement
Nassau 16 4 5 10 9 28 2 5 7NYS excl. NYC 956 404 402 392 346 1,544 336 443 331
Registered Community Opioid Overdose Prevention (COOP) program naloxone administration reports 4
Naloxone administration reportby registered COOP program
Nassau 5 1 0 1 3 5 2 4 6NYS excl. NYC 489 255 248 224 176 903 182 239 107
1 The counts for naloxone administration reports by EMS in Nassau County are a combination of data from e-PCRs and additional reports of EMS services collectedby the Nassau County Police Department. Counts for all quarters have been updated using this method and may differ from those published in previous reports.
2 EMS reporting may have been affected by a change in documentation systems used by EMS agency/ies serving the area. Counts may decrease until updates to thedata are available in 2018, if applicable.
3 Law enforcement naloxone administration reports for Nassau County are not yet comprehensively included in this report.4 Numbers displayed in the table represent only naloxone administration reports submitted by law enforcement and registered COOP programs to the NYSDOH AIDS
Institute. The actual numbers of naloxone administration events may be higher.
63

Niagara County: Opioid overdoses and rates per 100,000 population (Preliminary data as of November, 2017 - subject to change)
Apr-Jun, 2016 Jul-Sep, 2016 Oct-Dec, 2016 2016 Total Jan-Mar, 2017 Apr-Jun, 2017
Indicator Location NumberCrudeRate Number
CrudeRate Number
CrudeRate Number
CrudeRate Number
CrudeRate Number
CrudeRate
Deaths 1
All opioid overdoses Niagara 12 5.6 9 4.2 11 5.2 45 21.2 3 1.4 2 0.9NYS excl. NYC 501 4.5 476 4.2 506 4.5 1,990 17.7 130 1.2 75 0.7
Heroin overdoses Niagara 3 1.4 3 1.4 3 1.4 11 5.2 1 0.5 0 0.0NYS excl. NYC 207 1.8 202 1.8 179 1.6 798 7.1 51 0.5 30 0.3
Overdoses involvingopioid pain relievers 2
Niagara 11 5.2 7 3.3 11 5.2 41 19.3 3 1.4 2 0.9NYS excl. NYC 388 3.5 371 3.3 439 3.9 1,576 14.0 96 0.9 56 0.5
Outpatient emergency department visits 3
All opioid overdoses Niagara 47 22.1 25 11.8 47 22.1 227 106.7 61 28.7 47 22.1NYS excl. NYC 1,772 15.8 1,552 13.8 1,605 14.3 6,675 59.4 1,684 15.0 1,845 16.4
Heroin overdoses Niagara 23 10.8 20 9.4 34 16.0 146 68.7 39 18.3 34 16.0NYS excl. NYC 1,282 11.4 1,085 9.6 1,128 10.0 4,784 42.5 1,183 10.5 1,351 12.0
Opioid overdosesexcluding heroin 2
Niagara 24 11.3 s s 13 6.1 81 38.1 22 10.3 13 6.1NYS excl. NYC 490 4.4 467 4.2 477 4.2 1,891 16.8 501 4.5 494 4.4
Hospitalizations 3
All opioid overdoses Niagara 17 8.0 17 8.0 7 3.3 54 25.4 10 4.7 12 5.6NYS excl. NYC 486 4.3 457 4.1 467 4.2 1,895 16.9 481 4.3 500 4.4
Heroin overdoses Niagara s s s s s s 12 5.6 s s s sNYS excl. NYC 196 1.7 197 1.8 173 1.5 778 6.9 179 1.6 207 1.8
Opioid overdosesexcluding heroin 2
Niagara 13 6.1 14 6.6 s s 42 19.8 8 3.8 9 4.2NYS excl. NYC 290 2.6 260 2.3 294 2.6 1,117 9.9 302 2.7 293 2.6
1 Indicators are not mutually exclusive. Decedents and patients may have multiple substances in their system. Thus, overdoses involving heroin and overdosesinvolving opioid pain relievers will not add up to the overdoses involving all opioids.
2 This indicator includes pharmaceutically and illicitly produced opioids such as fentanyl.
3 Indicators generated for hospitalizations and emergency department visits are based on ICD-10-CM codes.
s: Data for indicators related to hospitalizations and emergency departments are suppressed for confidentiality purposes if there are less than 6 discharges.
64

Niagara County: Unique clients admitted to OASAS-certified chemical dependence treatment programs 1,2
(Preliminary data as of October, 2017 - subject to change)
2015 2016 2017
Indicator Total Jan-Mar Apr-Jun Jul-Sep Oct-Dec Total Jan-Mar Apr-Jun
Unique clients admitted forheroin
636 203 222 238 249 706 249 286
Unique clients admitted for anyopioid (incl. heroin)
1,286 399 394 434 436 1,282 426 475
OASAS: Office of Alcoholism and Substance Abuse Services
1 The number of unique clients admitted per year does not equal the sum of the unique clients admitted each quarter. This is because an individual client can beadmitted to treatment in more than one quarter during the year.
2 Clients may have heroin, other opioids, or any other substance simultaneously recorded as the primary, secondary and tertiary substance of abuse at admission.
s: Data for indicators are suppressed for confidentiality purposes if there are less than 6 clients.
Niagara County: Naloxone administration reports (Preliminary data as of November, 2017 - subject to change)
2015 2016 2017
Indicator Location Total Jan-Mar Apr-Jun Jul-Sep Oct-Dec Total Jan-Mar Apr-Jun Jul-Sep
Emergency Medical Services (EMS) naloxone administration reports 1,2
Naloxone administration reportby EMS
Niagara 7 4 3 6 5 18 5 6 9NYS excl. NYC 6,115 1,730 2,009 1,747 1,542 7,028 1,518 1,710 1,702
Law enforcement naloxone administration reports 3
Naloxone administration reportby law enforcement
Niagara 23 6 6 6 2 20 8 8 2NYS excl. NYC 956 404 402 392 346 1,544 336 443 331
Registered Community Opioid Overdose Prevention (COOP) program naloxone administration reports 3
Naloxone administration reportby registered COOP program
Niagara 10 10 4 1 1 16 8 11 1NYS excl. NYC 489 255 248 224 176 903 182 239 107
1 County numbers displayed in the table represent only naloxone administration events reported electronically, therefore, actual numbers of events may be higher.
2 EMS reporting may have been affected by a change in documentation systems used by EMS agency/ies serving the area. Counts may decrease until updates to thedata are available in 2018, if applicable.
3 Numbers displayed in the table represent only naloxone administration reports submitted by law enforcement and registered COOP programs to the NYSDOH AIDSInstitute. The actual numbers of naloxone administration events may be higher.
65

Oneida County: Opioid overdoses and rates per 100,000 population (Preliminary data as of November, 2017 - subject to change)
Apr-Jun, 2016 Jul-Sep, 2016 Oct-Dec, 2016 2016 Total Jan-Mar, 2017 Apr-Jun, 2017
Indicator Location NumberCrudeRate Number
CrudeRate Number
CrudeRate Number
CrudeRate Number
CrudeRate Number
CrudeRate
Deaths 1
All opioid overdoses Oneida 18 7.7 13 5.6 12 5.2 50 21.5 2 0.9 2 0.9NYS excl. NYC 501 4.5 476 4.2 506 4.5 1,990 17.7 130 1.2 75 0.7
Heroin overdoses Oneida 10 4.3 8 3.4 11 4.7 34 14.6 0 0.0 0 0.0NYS excl. NYC 207 1.8 202 1.8 179 1.6 798 7.1 51 0.5 30 0.3
Overdoses involvingopioid pain relievers 2
Oneida 15 6.5 7 3.0 8 3.4 34 14.6 2 0.9 2 0.9NYS excl. NYC 388 3.5 371 3.3 439 3.9 1,576 14.0 96 0.9 56 0.5
Outpatient emergency department visits 3
All opioid overdoses Oneida 52 22.4 45 19.4 51 21.9 185 79.6 44 18.9 46 19.8NYS excl. NYC 1,772 15.8 1,552 13.8 1,605 14.3 6,675 59.4 1,684 15.0 1,845 16.4
Heroin overdoses Oneida 38 16.3 34 14.6 35 15.1 137 58.9 27 11.6 30 12.9NYS excl. NYC 1,282 11.4 1,085 9.6 1,128 10.0 4,784 42.5 1,183 10.5 1,351 12.0
Opioid overdosesexcluding heroin 2
Oneida 14 6.0 11 4.7 16 6.9 48 20.6 17 7.3 16 6.9NYS excl. NYC 490 4.4 467 4.2 477 4.2 1,891 16.8 501 4.5 494 4.4
Hospitalizations 3
All opioid overdoses Oneida 11 4.7 20 8.6 18 7.7 67 28.8 7 3.0 10 4.3NYS excl. NYC 486 4.3 457 4.1 467 4.2 1,895 16.9 481 4.3 500 4.4
Heroin overdoses Oneida 8 3.4 11 4.7 11 4.7 39 16.8 s s s sNYS excl. NYC 196 1.7 197 1.8 173 1.5 778 6.9 179 1.6 207 1.8
Opioid overdosesexcluding heroin 2
Oneida s s 9 3.9 7 3.0 28 12.0 s s s sNYS excl. NYC 290 2.6 260 2.3 294 2.6 1,117 9.9 302 2.7 293 2.6
1 Indicators are not mutually exclusive. Decedents and patients may have multiple substances in their system. Thus, overdoses involving heroin and overdosesinvolving opioid pain relievers will not add up to the overdoses involving all opioids.
2 This indicator includes pharmaceutically and illicitly produced opioids such as fentanyl.
3 Indicators generated for hospitalizations and emergency department visits are based on ICD-10-CM codes.
s: Data for indicators related to hospitalizations and emergency departments are suppressed for confidentiality purposes if there are less than 6 discharges.
66

Oneida County: Unique clients admitted to OASAS-certified chemical dependence treatment programs 1,2
(Preliminary data as of October, 2017 - subject to change)
2015 2016 2017
Indicator Total Jan-Mar Apr-Jun Jul-Sep Oct-Dec Total Jan-Mar Apr-Jun
Unique clients admitted forheroin
897 356 366 374 397 1,073 358 364
Unique clients admitted for anyopioid (incl. heroin)
1,103 437 434 443 488 1,313 428 450
OASAS: Office of Alcoholism and Substance Abuse Services
1 The number of unique clients admitted per year does not equal the sum of the unique clients admitted each quarter. This is because an individual client can beadmitted to treatment in more than one quarter during the year.
2 Clients may have heroin, other opioids, or any other substance simultaneously recorded as the primary, secondary and tertiary substance of abuse at admission.
s: Data for indicators are suppressed for confidentiality purposes if there are less than 6 clients.
Oneida County: Naloxone administration reports (Preliminary data as of November, 2017 - subject to change)
2015 2016 2017
Indicator Location Total Jan-Mar Apr-Jun Jul-Sep Oct-Dec Total Jan-Mar Apr-Jun Jul-Sep
Emergency Medical Services (EMS) naloxone administration reports 1,2
Naloxone administration reportby EMS
Oneida 256 96 103 103 95 397 63 57 110NYS excl. NYC 6,115 1,730 2,009 1,747 1,542 7,028 1,518 1,710 1,702
Law enforcement naloxone administration reports 3
Naloxone administration reportby law enforcement
Oneida 11 7 10 7 15 39 5 4 14NYS excl. NYC 956 404 402 392 346 1,544 336 443 331
Registered Community Opioid Overdose Prevention (COOP) program naloxone administration reports 3
Naloxone administration reportby registered COOP program
Oneida 2 0 0 4 3 7 2 27 14NYS excl. NYC 489 255 248 224 176 903 182 239 107
1 County numbers displayed in the table represent only naloxone administration events reported electronically, therefore, actual numbers of events may be higher.Additional data validation steps have been taken to de-duplicate 2016 administrations by multiple agencies for the same patient encounter.
2 EMS reporting may have been affected by a change in documentation systems used by EMS agency/ies serving the area. Counts may decrease until updates to thedata are available in 2018, if applicable.
3 Numbers displayed in the table represent only naloxone administration reports submitted by law enforcement and registered COOP programs to the NYSDOH AIDSInstitute. The actual numbers of naloxone administration events may be higher.
67

Onondaga County: Opioid overdoses and rates per 100,000 population (Preliminary data as of November, 2017 - subject to change)
Apr-Jun, 2016 Jul-Sep, 2016 Oct-Dec, 2016 2016 Total Jan-Mar, 2017 Apr-Jun, 2017
Indicator Location NumberCrudeRate Number
CrudeRate Number
CrudeRate Number
CrudeRate Number
CrudeRate Number
CrudeRate
Deaths 1
All opioid overdoses Onondaga 32 6.8 29 6.2 31 6.6 128 27.3 3 0.6 4 0.9NYS excl. NYC 501 4.5 476 4.2 506 4.5 1,990 17.7 130 1.2 75 0.7
Heroin overdoses Onondaga 18 3.8 16 3.4 12 2.6 63 13.4 0 0.0 2 0.4NYS excl. NYC 207 1.8 202 1.8 179 1.6 798 7.1 51 0.5 30 0.3
Overdoses involvingopioid pain relievers 2
Onondaga 27 5.8 24 5.1 28 6.0 105 22.4 3 0.6 2 0.4NYS excl. NYC 388 3.5 371 3.3 439 3.9 1,576 14.0 96 0.9 56 0.5
Outpatient emergency department visits 3
All opioid overdoses Onondaga 133 28.4 118 25.2 77 16.4 484 103.3 72 15.4 64 13.7NYS excl. NYC 1,772 15.8 1,552 13.8 1,605 14.3 6,675 59.4 1,684 15.0 1,845 16.4
Heroin overdoses Onondaga 107 22.8 97 20.7 56 12.0 390 83.3 45 9.6 44 9.4NYS excl. NYC 1,282 11.4 1,085 9.6 1,128 10.0 4,784 42.5 1,183 10.5 1,351 12.0
Opioid overdosesexcluding heroin 2
Onondaga 26 5.6 21 4.5 21 4.5 94 20.1 27 5.8 20 4.3NYS excl. NYC 490 4.4 467 4.2 477 4.2 1,891 16.8 501 4.5 494 4.4
Hospitalizations 3
All opioid overdoses Onondaga 30 6.4 24 5.1 17 3.6 101 21.6 31 6.6 15 3.2NYS excl. NYC 486 4.3 457 4.1 467 4.2 1,895 16.9 481 4.3 500 4.4
Heroin overdoses Onondaga 18 3.8 15 3.2 7 1.5 54 11.5 10 2.1 7 1.5NYS excl. NYC 196 1.7 197 1.8 173 1.5 778 6.9 179 1.6 207 1.8
Opioid overdosesexcluding heroin 2
Onondaga 12 2.6 9 1.9 10 2.1 47 10.0 21 4.5 8 1.7NYS excl. NYC 290 2.6 260 2.3 294 2.6 1,117 9.9 302 2.7 293 2.6
1 Indicators are not mutually exclusive. Decedents and patients may have multiple substances in their system. Thus, overdoses involving heroin and overdosesinvolving opioid pain relievers will not add up to the overdoses involving all opioids.
2 This indicator includes pharmaceutically and illicitly produced opioids such as fentanyl.
3 Indicators generated for hospitalizations and emergency department visits are based on ICD-10-CM codes.
s: Data for indicators related to hospitalizations and emergency departments are suppressed for confidentiality purposes if there are less than 6 discharges.
68

Onondaga County: Unique clients admitted to OASAS-certified chemical dependence treatment programs 1,2
(Preliminary data as of October, 2017 - subject to change)
2015 2016 2017
Indicator Total Jan-Mar Apr-Jun Jul-Sep Oct-Dec Total Jan-Mar Apr-Jun
Unique clients admitted forheroin
1,801 682 715 727 668 1,930 658 694
Unique clients admitted for anyopioid (incl. heroin)
2,173 777 818 847 775 2,270 753 813
OASAS: Office of Alcoholism and Substance Abuse Services
1 The number of unique clients admitted per year does not equal the sum of the unique clients admitted each quarter. This is because an individual client can beadmitted to treatment in more than one quarter during the year.
2 Clients may have heroin, other opioids, or any other substance simultaneously recorded as the primary, secondary and tertiary substance of abuse at admission.
s: Data for indicators are suppressed for confidentiality purposes if there are less than 6 clients.
Onondaga County: Naloxone administration reports (Preliminary data as of November, 2017 - subject to change)
2015 2016 2017
Indicator Location Total Jan-Mar Apr-Jun Jul-Sep Oct-Dec Total Jan-Mar Apr-Jun Jul-Sep
Emergency Medical Services (EMS) naloxone administration reports 1,2
Naloxone administration reportby EMS
Onondaga 548 210 215 102 41 568 51 46 48NYS excl. NYC 6,115 1,730 2,009 1,747 1,542 7,028 1,518 1,710 1,702
Law enforcement naloxone administration reports 3
Naloxone administration reportby law enforcement
Onondaga 31 23 23 20 17 83 11 9 10NYS excl. NYC 956 404 402 392 346 1,544 336 443 331
Registered Community Opioid Overdose Prevention (COOP) program naloxone administration reports 3
Naloxone administration reportby registered COOP program
Onondaga 4 6 1 3 4 14 8 11 9NYS excl. NYC 489 255 248 224 176 903 182 239 107
1 County numbers displayed in the table represent only naloxone administration events reported electronically, therefore, actual numbers of events may be higher.Additional data validation steps have been taken to de-duplicate 2016 administrations by multiple agencies for the same patient encounter.
2 EMS reporting for this county has been affected by a change in documentation systems used by a large EMS agency serving the area. Counts will likely show asharp decrease until updates to the data are available in 2018.
3 Numbers displayed in the table represent only naloxone administration reports submitted by law enforcement and registered COOP programs to the NYSDOH AIDSInstitute. The actual numbers of naloxone administration events may be higher.
69
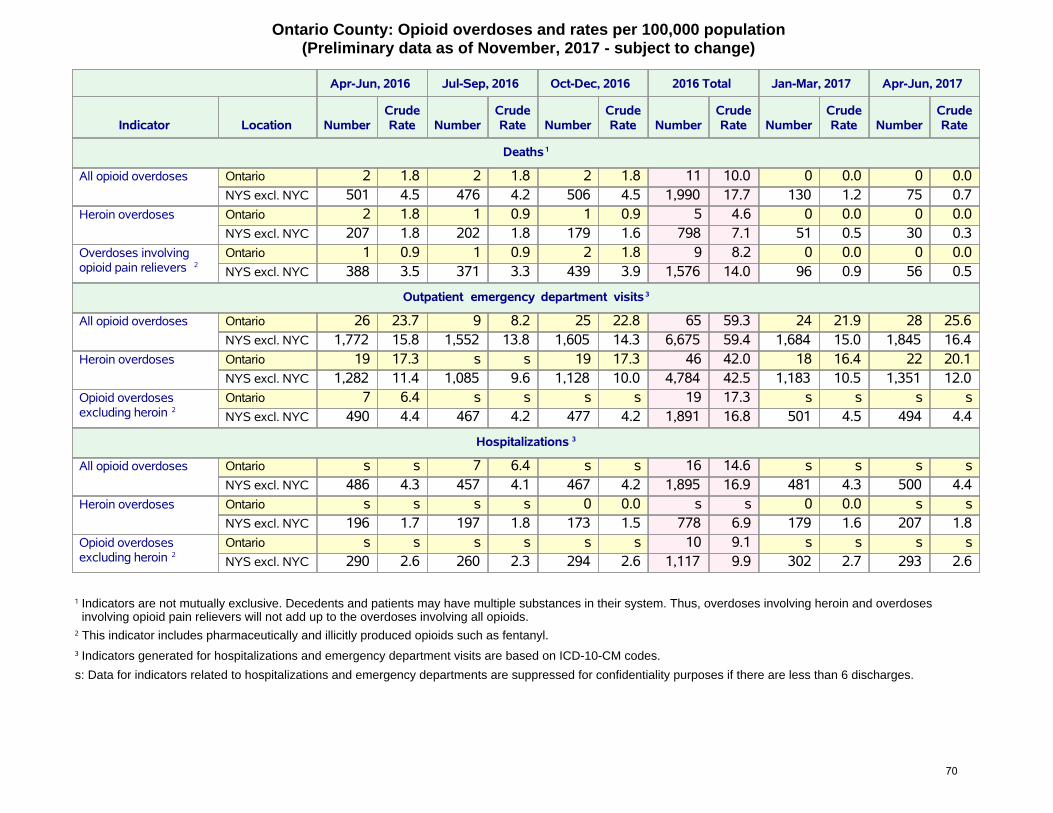
Ontario County: Opioid overdoses and rates per 100,000 population (Preliminary data as of November, 2017 - subject to change)
Apr-Jun, 2016 Jul-Sep, 2016 Oct-Dec, 2016 2016 Total Jan-Mar, 2017 Apr-Jun, 2017
Indicator Location NumberCrudeRate Number
CrudeRate Number
CrudeRate Number
CrudeRate Number
CrudeRate Number
CrudeRate
Deaths 1
All opioid overdoses Ontario 2 1.8 2 1.8 2 1.8 11 10.0 0 0.0 0 0.0NYS excl. NYC 501 4.5 476 4.2 506 4.5 1,990 17.7 130 1.2 75 0.7
Heroin overdoses Ontario 2 1.8 1 0.9 1 0.9 5 4.6 0 0.0 0 0.0NYS excl. NYC 207 1.8 202 1.8 179 1.6 798 7.1 51 0.5 30 0.3
Overdoses involvingopioid pain relievers 2
Ontario 1 0.9 1 0.9 2 1.8 9 8.2 0 0.0 0 0.0NYS excl. NYC 388 3.5 371 3.3 439 3.9 1,576 14.0 96 0.9 56 0.5
Outpatient emergency department visits 3
All opioid overdoses Ontario 26 23.7 9 8.2 25 22.8 65 59.3 24 21.9 28 25.6NYS excl. NYC 1,772 15.8 1,552 13.8 1,605 14.3 6,675 59.4 1,684 15.0 1,845 16.4
Heroin overdoses Ontario 19 17.3 s s 19 17.3 46 42.0 18 16.4 22 20.1NYS excl. NYC 1,282 11.4 1,085 9.6 1,128 10.0 4,784 42.5 1,183 10.5 1,351 12.0
Opioid overdosesexcluding heroin 2
Ontario 7 6.4 s s s s 19 17.3 s s s sNYS excl. NYC 490 4.4 467 4.2 477 4.2 1,891 16.8 501 4.5 494 4.4
Hospitalizations 3
All opioid overdoses Ontario s s 7 6.4 s s 16 14.6 s s s sNYS excl. NYC 486 4.3 457 4.1 467 4.2 1,895 16.9 481 4.3 500 4.4
Heroin overdoses Ontario s s s s 0 0.0 s s 0 0.0 s sNYS excl. NYC 196 1.7 197 1.8 173 1.5 778 6.9 179 1.6 207 1.8
Opioid overdosesexcluding heroin 2
Ontario s s s s s s 10 9.1 s s s sNYS excl. NYC 290 2.6 260 2.3 294 2.6 1,117 9.9 302 2.7 293 2.6
1 Indicators are not mutually exclusive. Decedents and patients may have multiple substances in their system. Thus, overdoses involving heroin and overdosesinvolving opioid pain relievers will not add up to the overdoses involving all opioids.
2 This indicator includes pharmaceutically and illicitly produced opioids such as fentanyl.
3 Indicators generated for hospitalizations and emergency department visits are based on ICD-10-CM codes.
s: Data for indicators related to hospitalizations and emergency departments are suppressed for confidentiality purposes if there are less than 6 discharges.
70
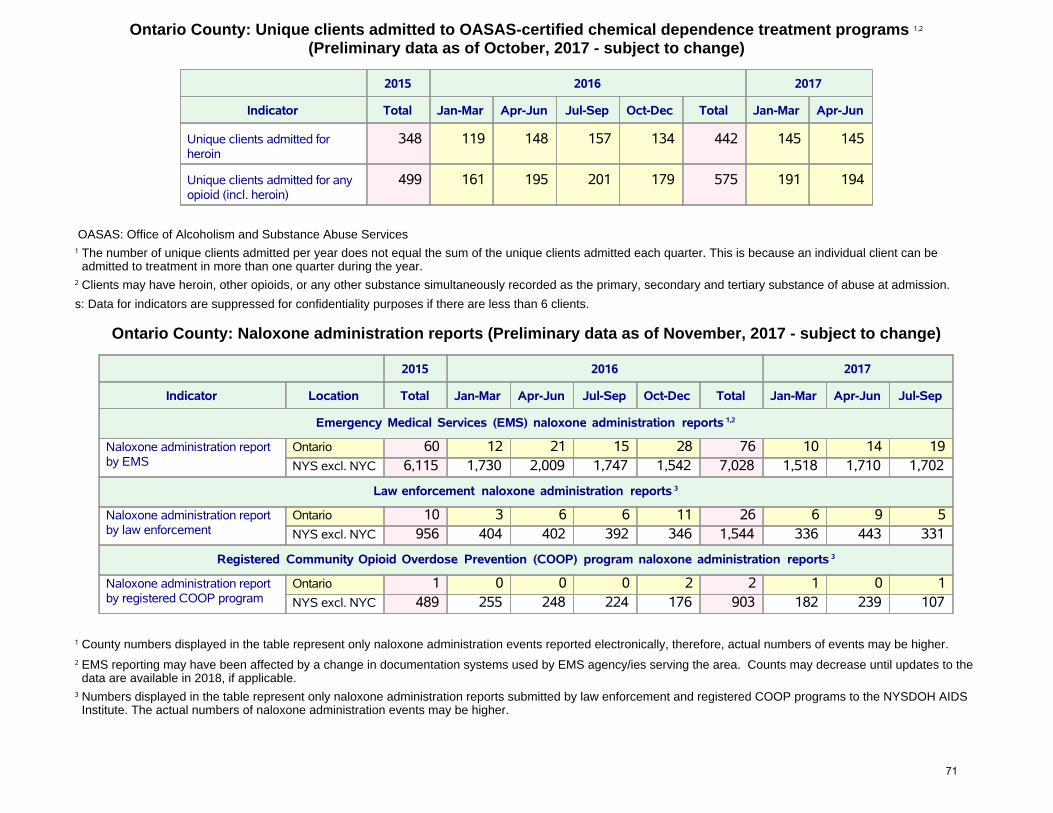
Ontario County: Unique clients admitted to OASAS-certified chemical dependence treatment programs 1,2
(Preliminary data as of October, 2017 - subject to change)
2015 2016 2017
Indicator Total Jan-Mar Apr-Jun Jul-Sep Oct-Dec Total Jan-Mar Apr-Jun
Unique clients admitted forheroin
348 119 148 157 134 442 145 145
Unique clients admitted for anyopioid (incl. heroin)
499 161 195 201 179 575 191 194
OASAS: Office of Alcoholism and Substance Abuse Services
1 The number of unique clients admitted per year does not equal the sum of the unique clients admitted each quarter. This is because an individual client can beadmitted to treatment in more than one quarter during the year.
2 Clients may have heroin, other opioids, or any other substance simultaneously recorded as the primary, secondary and tertiary substance of abuse at admission.
s: Data for indicators are suppressed for confidentiality purposes if there are less than 6 clients.
Ontario County: Naloxone administration reports (Preliminary data as of November, 2017 - subject to change)
2015 2016 2017
Indicator Location Total Jan-Mar Apr-Jun Jul-Sep Oct-Dec Total Jan-Mar Apr-Jun Jul-Sep
Emergency Medical Services (EMS) naloxone administration reports 1,2
Naloxone administration reportby EMS
Ontario 60 12 21 15 28 76 10 14 19NYS excl. NYC 6,115 1,730 2,009 1,747 1,542 7,028 1,518 1,710 1,702
Law enforcement naloxone administration reports 3
Naloxone administration reportby law enforcement
Ontario 10 3 6 6 11 26 6 9 5NYS excl. NYC 956 404 402 392 346 1,544 336 443 331
Registered Community Opioid Overdose Prevention (COOP) program naloxone administration reports 3
Naloxone administration reportby registered COOP program
Ontario 1 0 0 0 2 2 1 0 1NYS excl. NYC 489 255 248 224 176 903 182 239 107
1 County numbers displayed in the table represent only naloxone administration events reported electronically, therefore, actual numbers of events may be higher.
2 EMS reporting may have been affected by a change in documentation systems used by EMS agency/ies serving the area. Counts may decrease until updates to thedata are available in 2018, if applicable.
3 Numbers displayed in the table represent only naloxone administration reports submitted by law enforcement and registered COOP programs to the NYSDOH AIDSInstitute. The actual numbers of naloxone administration events may be higher.
71

Orange County: Opioid overdoses and rates per 100,000 population (Preliminary data as of November, 2017 - subject to change)
Apr-Jun, 2016 Jul-Sep, 2016 Oct-Dec, 2016 2016 Total Jan-Mar, 2017 Apr-Jun, 2017
Indicator Location NumberCrudeRate Number
CrudeRate Number
CrudeRate Number
CrudeRate Number
CrudeRate Number
CrudeRate
Deaths 1
All opioid overdoses Orange 19 5.0 14 3.7 18 4.8 68 18.0 6 1.6 8 2.1NYS excl. NYC 501 4.5 476 4.2 506 4.5 1,990 17.7 130 1.2 75 0.7
Heroin overdoses Orange 13 3.4 9 2.4 10 2.6 45 11.9 1 0.3 3 0.8NYS excl. NYC 207 1.8 202 1.8 179 1.6 798 7.1 51 0.5 30 0.3
Overdoses involvingopioid pain relievers 2
Orange 14 3.7 10 2.6 12 3.2 46 12.2 5 1.3 7 1.9NYS excl. NYC 388 3.5 371 3.3 439 3.9 1,576 14.0 96 0.9 56 0.5
Outpatient emergency department visits 3
All opioid overdoses Orange 80 21.2 70 18.5 62 16.4 251 66.5 33 8.7 52 13.8NYS excl. NYC 1,772 15.8 1,552 13.8 1,605 14.3 6,675 59.4 1,684 15.0 1,845 16.4
Heroin overdoses Orange 57 15.1 53 14.0 38 10.1 180 47.7 24 6.4 43 11.4NYS excl. NYC 1,282 11.4 1,085 9.6 1,128 10.0 4,784 42.5 1,183 10.5 1,351 12.0
Opioid overdosesexcluding heroin 2
Orange 23 6.1 17 4.5 24 6.4 71 18.8 9 2.4 9 2.4NYS excl. NYC 490 4.4 467 4.2 477 4.2 1,891 16.8 501 4.5 494 4.4
Hospitalizations 3
All opioid overdoses Orange 18 4.8 18 4.8 24 6.4 84 22.2 18 4.8 25 6.6NYS excl. NYC 486 4.3 457 4.1 467 4.2 1,895 16.9 481 4.3 500 4.4
Heroin overdoses Orange 12 3.2 8 2.1 8 2.1 38 10.1 s s s sNYS excl. NYC 196 1.7 197 1.8 173 1.5 778 6.9 179 1.6 207 1.8
Opioid overdosesexcluding heroin 2
Orange s s 10 2.6 16 4.2 46 12.2 14 3.7 19 5.0NYS excl. NYC 290 2.6 260 2.3 294 2.6 1,117 9.9 302 2.7 293 2.6
1 Indicators are not mutually exclusive. Decedents and patients may have multiple substances in their system. Thus, overdoses involving heroin and overdosesinvolving opioid pain relievers will not add up to the overdoses involving all opioids.
2 This indicator includes pharmaceutically and illicitly produced opioids such as fentanyl.
3 Indicators generated for hospitalizations and emergency department visits are based on ICD-10-CM codes.
s: Data for indicators related to hospitalizations and emergency departments are suppressed for confidentiality purposes if there are less than 6 discharges.
72

Orange County: Unique clients admitted to OASAS-certified chemical dependence treatment programs 1,2
(Preliminary data as of October, 2017 - subject to change)
2015 2016 2017
Indicator Total Jan-Mar Apr-Jun Jul-Sep Oct-Dec Total Jan-Mar Apr-Jun
Unique clients admitted forheroin
1,421 501 536 474 496 1,518 503 481
Unique clients admitted for anyopioid (incl. heroin)
1,733 581 628 573 600 1,829 611 583
OASAS: Office of Alcoholism and Substance Abuse Services
1 The number of unique clients admitted per year does not equal the sum of the unique clients admitted each quarter. This is because an individual client can beadmitted to treatment in more than one quarter during the year.
2 Clients may have heroin, other opioids, or any other substance simultaneously recorded as the primary, secondary and tertiary substance of abuse at admission.
s: Data for indicators are suppressed for confidentiality purposes if there are less than 6 clients.
Orange County: Naloxone administration reports (Preliminary data as of November, 2017 - subject to change)
2015 2016 2017
Indicator Location Total Jan-Mar Apr-Jun Jul-Sep Oct-Dec Total Jan-Mar Apr-Jun Jul-Sep
Emergency Medical Services (EMS) naloxone administration reports 1,2
Naloxone administration reportby EMS
Orange 333 97 135 104 80 416 53 90 81NYS excl. NYC 6,115 1,730 2,009 1,747 1,542 7,028 1,518 1,710 1,702
Law enforcement naloxone administration reports 3
Naloxone administration reportby law enforcement
Orange 74 16 24 25 20 85 20 21 15NYS excl. NYC 956 404 402 392 346 1,544 336 443 331
Registered Community Opioid Overdose Prevention (COOP) program naloxone administration reports 3
Naloxone administration reportby registered COOP program
Orange 18 9 13 18 10 50 3 12 10NYS excl. NYC 489 255 248 224 176 903 182 239 107
1 County numbers displayed in the table represent only naloxone administration events reported electronically, therefore, actual numbers of events may be higher.Additional data validation steps have been taken to de-duplicate 2016 administrations by multiple agencies for the same patient encounter.
2 EMS reporting may have been affected by a change in documentation systems used by EMS agency/ies serving the area. Counts may decrease until updates to thedata are available in 2018, if applicable.
3 Numbers displayed in the table represent only naloxone administration reports submitted by law enforcement and registered COOP programs to the NYSDOH AIDSInstitute. The actual numbers of naloxone administration events may be higher.
73

Orleans County: Opioid overdoses and rates per 100,000 population (Preliminary data as of November, 2017 - subject to change)
Apr-Jun, 2016 Jul-Sep, 2016 Oct-Dec, 2016 2016 Total Jan-Mar, 2017 Apr-Jun, 2017
Indicator Location NumberCrudeRate Number
CrudeRate Number
CrudeRate Number
CrudeRate Number
CrudeRate Number
CrudeRate
Deaths 1
All opioid overdoses Orleans 1 2.4 3 7.2 0 0.0 4 9.6 0 0.0 0 0.0NYS excl. NYC 501 4.5 476 4.2 506 4.5 1,990 17.7 130 1.2 75 0.7
Heroin overdoses Orleans 0 0.0 2 4.8 0 0.0 2 4.8 0 0.0 0 0.0NYS excl. NYC 207 1.8 202 1.8 179 1.6 798 7.1 51 0.5 30 0.3
Overdoses involvingopioid pain relievers 2
Orleans 1 2.4 3 7.2 0 0.0 4 9.6 0 0.0 0 0.0NYS excl. NYC 388 3.5 371 3.3 439 3.9 1,576 14.0 96 0.9 56 0.5
Outpatient emergency department visits 3
All opioid overdoses Orleans 14 33.7 s s 13 31.3 35 84.2 s s 10 24.0NYS excl. NYC 1,772 15.8 1,552 13.8 1,605 14.3 6,675 59.4 1,684 15.0 1,845 16.4
Heroin overdoses Orleans 12 28.9 s s 10 24.0 27 64.9 s s 8 19.2NYS excl. NYC 1,282 11.4 1,085 9.6 1,128 10.0 4,784 42.5 1,183 10.5 1,351 12.0
Opioid overdosesexcluding heroin 2
Orleans s s s s s s 8 19.2 s s s sNYS excl. NYC 490 4.4 467 4.2 477 4.2 1,891 16.8 501 4.5 494 4.4
Hospitalizations 3
All opioid overdoses Orleans s s s s s s s s 0 0.0 s sNYS excl. NYC 486 4.3 457 4.1 467 4.2 1,895 16.9 481 4.3 500 4.4
Heroin overdoses Orleans 0 0.0 0 0.0 s s s s 0 0.0 0 0.0NYS excl. NYC 196 1.7 197 1.8 173 1.5 778 6.9 179 1.6 207 1.8
Opioid overdosesexcluding heroin 2
Orleans s s s s s s s s 0 0.0 s sNYS excl. NYC 290 2.6 260 2.3 294 2.6 1,117 9.9 302 2.7 293 2.6
1 Indicators are not mutually exclusive. Decedents and patients may have multiple substances in their system. Thus, overdoses involving heroin and overdosesinvolving opioid pain relievers will not add up to the overdoses involving all opioids.
2 This indicator includes pharmaceutically and illicitly produced opioids such as fentanyl.
3 Indicators generated for hospitalizations and emergency department visits are based on ICD-10-CM codes.
s: Data for indicators related to hospitalizations and emergency departments are suppressed for confidentiality purposes if there are less than 6 discharges.
74

Orleans County: Unique clients admitted to OASAS-certified chemical dependence treatment programs 1,2
(Preliminary data as of October, 2017 - subject to change)
2015 2016 2017
Indicator Total Jan-Mar Apr-Jun Jul-Sep Oct-Dec Total Jan-Mar Apr-Jun
Unique clients admitted forheroin
109 32 36 51 44 137 47 48
Unique clients admitted for anyopioid (incl. heroin)
197 53 68 73 63 217 73 61
OASAS: Office of Alcoholism and Substance Abuse Services
1 The number of unique clients admitted per year does not equal the sum of the unique clients admitted each quarter. This is because an individual client can beadmitted to treatment in more than one quarter during the year.
2 Clients may have heroin, other opioids, or any other substance simultaneously recorded as the primary, secondary and tertiary substance of abuse at admission.
s: Data for indicators are suppressed for confidentiality purposes if there are less than 6 clients.
Orleans County: Naloxone administration reports (Preliminary data as of November, 2017 - subject to change)
2015 2016 2017
Indicator Location Total Jan-Mar Apr-Jun Jul-Sep Oct-Dec Total Jan-Mar Apr-Jun Jul-Sep
Emergency Medical Services (EMS) naloxone administration reports 1,2
Naloxone administration reportby EMS
Orleans 23 13 7 5 10 35 11 13 12NYS excl. NYC 6,115 1,730 2,009 1,747 1,542 7,028 1,518 1,710 1,702
Law enforcement naloxone administration reports 3
Naloxone administration reportby law enforcement
Orleans 0 0 0 0 0 0 0 0 1NYS excl. NYC 956 404 402 392 346 1,544 336 443 331
Registered Community Opioid Overdose Prevention (COOP) program naloxone administration reports 3
Naloxone administration reportby registered COOP program
Orleans 0 1 2 0 0 3 0 1 0NYS excl. NYC 489 255 248 224 176 903 182 239 107
1 County numbers displayed in the table represent only naloxone administration events reported electronically, therefore, actual numbers of events may be higher.
2 EMS reporting may have been affected by a change in documentation systems used by EMS agency/ies serving the area. Counts may decrease until updates to thedata are available in 2018, if applicable.
3 Numbers displayed in the table represent only naloxone administration reports submitted by law enforcement and registered COOP programs to the NYSDOH AIDSInstitute. The actual numbers of naloxone administration events may be higher.
75

Oswego County: Opioid overdoses and rates per 100,000 population (Preliminary data as of November, 2017 - subject to change)
Apr-Jun, 2016 Jul-Sep, 2016 Oct-Dec, 2016 2016 Total Jan-Mar, 2017 Apr-Jun, 2017
Indicator Location NumberCrudeRate Number
CrudeRate Number
CrudeRate Number
CrudeRate Number
CrudeRate Number
CrudeRate
Deaths 1
All opioid overdoses Oswego 3 2.5 3 2.5 9 7.5 23 19.1 0 0.0 2 1.7NYS excl. NYC 501 4.5 476 4.2 506 4.5 1,990 17.7 130 1.2 75 0.7
Heroin overdoses Oswego 0 0.0 1 0.8 5 4.2 10 8.3 0 0.0 1 0.8NYS excl. NYC 207 1.8 202 1.8 179 1.6 798 7.1 51 0.5 30 0.3
Overdoses involvingopioid pain relievers 2
Oswego 2 1.7 3 2.5 8 6.7 20 16.6 0 0.0 1 0.8NYS excl. NYC 388 3.5 371 3.3 439 3.9 1,576 14.0 96 0.9 56 0.5
Outpatient emergency department visits 3
All opioid overdoses Oswego 21 17.5 21 17.5 20 16.6 78 64.9 22 18.3 25 20.8NYS excl. NYC 1,772 15.8 1,552 13.8 1,605 14.3 6,675 59.4 1,684 15.0 1,845 16.4
Heroin overdoses Oswego 18 15.0 19 15.8 11 9.2 62 51.6 15 12.5 17 14.1NYS excl. NYC 1,282 11.4 1,085 9.6 1,128 10.0 4,784 42.5 1,183 10.5 1,351 12.0
Opioid overdosesexcluding heroin 2
Oswego s s s s 9 7.5 16 13.3 7 5.8 8 6.7NYS excl. NYC 490 4.4 467 4.2 477 4.2 1,891 16.8 501 4.5 494 4.4
Hospitalizations 3
All opioid overdoses Oswego 7 5.8 7 5.8 s s 18 15.0 8 6.7 s sNYS excl. NYC 486 4.3 457 4.1 467 4.2 1,895 16.9 481 4.3 500 4.4
Heroin overdoses Oswego s s s s s s 7 5.8 0 0.0 s sNYS excl. NYC 196 1.7 197 1.8 173 1.5 778 6.9 179 1.6 207 1.8
Opioid overdosesexcluding heroin 2
Oswego s s s s s s 11 9.2 8 6.7 s sNYS excl. NYC 290 2.6 260 2.3 294 2.6 1,117 9.9 302 2.7 293 2.6
1 Indicators are not mutually exclusive. Decedents and patients may have multiple substances in their system. Thus, overdoses involving heroin and overdosesinvolving opioid pain relievers will not add up to the overdoses involving all opioids.
2 This indicator includes pharmaceutically and illicitly produced opioids such as fentanyl.
3 Indicators generated for hospitalizations and emergency department visits are based on ICD-10-CM codes.
s: Data for indicators related to hospitalizations and emergency departments are suppressed for confidentiality purposes if there are less than 6 discharges.
76

Oswego County: Unique clients admitted to OASAS-certified chemical dependence treatment programs 1,2
(Preliminary data as of October, 2017 - subject to change)
2015 2016 2017
Indicator Total Jan-Mar Apr-Jun Jul-Sep Oct-Dec Total Jan-Mar Apr-Jun
Unique clients admitted forheroin
536 183 193 196 168 551 169 177
Unique clients admitted for anyopioid (incl. heroin)
719 234 249 246 220 706 230 222
OASAS: Office of Alcoholism and Substance Abuse Services
1 The number of unique clients admitted per year does not equal the sum of the unique clients admitted each quarter. This is because an individual client can beadmitted to treatment in more than one quarter during the year.
2 Clients may have heroin, other opioids, or any other substance simultaneously recorded as the primary, secondary and tertiary substance of abuse at admission.
s: Data for indicators are suppressed for confidentiality purposes if there are less than 6 clients.
Oswego County: Naloxone administration reports (Preliminary data as of November, 2017 - subject to change)
2015 2016 2017
Indicator Location Total Jan-Mar Apr-Jun Jul-Sep Oct-Dec Total Jan-Mar Apr-Jun Jul-Sep
Emergency Medical Services (EMS) naloxone administration reports 1,2
Naloxone administration reportby EMS
Oswego 99 29 22 23 36 110 25 39 25NYS excl. NYC 6,115 1,730 2,009 1,747 1,542 7,028 1,518 1,710 1,702
Law enforcement naloxone administration reports 3
Naloxone administration reportby law enforcement
Oswego 5 2 3 0 3 8 1 5 1NYS excl. NYC 956 404 402 392 346 1,544 336 443 331
Registered Community Opioid Overdose Prevention (COOP) program naloxone administration reports 3
Naloxone administration reportby registered COOP program
Oswego 0 0 0 0 0 0 0 1 1NYS excl. NYC 489 255 248 224 176 903 182 239 107
1 County numbers displayed in the table represent only naloxone administration events reported electronically, therefore, actual numbers of events may be higher.
2 EMS reporting may have been affected by a change in documentation systems used by EMS agency/ies serving the area. Counts may decrease until updates to thedata are available in 2018, if applicable.
3 Numbers displayed in the table represent only naloxone administration reports submitted by law enforcement and registered COOP programs to the NYSDOH AIDSInstitute. The actual numbers of naloxone administration events may be higher.
77

Otsego County: Opioid overdoses and rates per 100,000 population (Preliminary data as of November, 2017 - subject to change)
Apr-Jun, 2016 Jul-Sep, 2016 Oct-Dec, 2016 2016 Total Jan-Mar, 2017 Apr-Jun, 2017
Indicator Location NumberCrudeRate Number
CrudeRate Number
CrudeRate Number
CrudeRate Number
CrudeRate Number
CrudeRate
Deaths 1
All opioid overdoses Otsego 1 1.6 4 6.6 5 8.2 11 18.1 1 1.6 0 0.0NYS excl. NYC 501 4.5 476 4.2 506 4.5 1,990 17.7 130 1.2 75 0.7
Heroin overdoses Otsego 0 0.0 1 1.6 0 0.0 1 1.6 0 0.0 0 0.0NYS excl. NYC 207 1.8 202 1.8 179 1.6 798 7.1 51 0.5 30 0.3
Overdoses involvingopioid pain relievers 2
Otsego 1 1.6 4 6.6 4 6.6 10 16.5 1 1.6 0 0.0NYS excl. NYC 388 3.5 371 3.3 439 3.9 1,576 14.0 96 0.9 56 0.5
Outpatient emergency department visits 3
All opioid overdoses Otsego 11 18.1 12 19.8 s s 36 59.4 s s s sNYS excl. NYC 1,772 15.8 1,552 13.8 1,605 14.3 6,675 59.4 1,684 15.0 1,845 16.4
Heroin overdoses Otsego 9 14.8 7 11.5 s s 23 37.9 s s s sNYS excl. NYC 1,282 11.4 1,085 9.6 1,128 10.0 4,784 42.5 1,183 10.5 1,351 12.0
Opioid overdosesexcluding heroin 2
Otsego s s s s s s 13 21.4 s s s sNYS excl. NYC 490 4.4 467 4.2 477 4.2 1,891 16.8 501 4.5 494 4.4
Hospitalizations 3
All opioid overdoses Otsego s s 7 11.5 s s 17 28.0 s s 0 0.0NYS excl. NYC 486 4.3 457 4.1 467 4.2 1,895 16.9 481 4.3 500 4.4
Heroin overdoses Otsego s s s s s s 9 14.8 s s 0 0.0NYS excl. NYC 196 1.7 197 1.8 173 1.5 778 6.9 179 1.6 207 1.8
Opioid overdosesexcluding heroin 2
Otsego s s s s s s 8 13.2 0 0.0 0 0.0NYS excl. NYC 290 2.6 260 2.3 294 2.6 1,117 9.9 302 2.7 293 2.6
1 Indicators are not mutually exclusive. Decedents and patients may have multiple substances in their system. Thus, overdoses involving heroin and overdosesinvolving opioid pain relievers will not add up to the overdoses involving all opioids.
2 This indicator includes pharmaceutically and illicitly produced opioids such as fentanyl.
3 Indicators generated for hospitalizations and emergency department visits are based on ICD-10-CM codes.
s: Data for indicators related to hospitalizations and emergency departments are suppressed for confidentiality purposes if there are less than 6 discharges.
78

Otsego County: Unique clients admitted to OASAS-certified chemical dependence treatment programs 1,2
(Preliminary data as of October, 2017 - subject to change)
2015 2016 2017
Indicator Total Jan-Mar Apr-Jun Jul-Sep Oct-Dec Total Jan-Mar Apr-Jun
Unique clients admitted forheroin
144 53 49 50 67 178 71 53
Unique clients admitted for anyopioid (incl. heroin)
191 66 61 63 77 218 90 65
OASAS: Office of Alcoholism and Substance Abuse Services
1 The number of unique clients admitted per year does not equal the sum of the unique clients admitted each quarter. This is because an individual client can beadmitted to treatment in more than one quarter during the year.
2 Clients may have heroin, other opioids, or any other substance simultaneously recorded as the primary, secondary and tertiary substance of abuse at admission.
s: Data for indicators are suppressed for confidentiality purposes if there are less than 6 clients.
Otsego County: Naloxone administration reports (Preliminary data as of November, 2017 - subject to change)
2015 2016 2017
Indicator Location Total Jan-Mar Apr-Jun Jul-Sep Oct-Dec Total Jan-Mar Apr-Jun Jul-Sep
Emergency Medical Services (EMS) naloxone administration reports 1,2
Naloxone administration reportby EMS
Otsego 19 5 15 16 14 50 7 6 6NYS excl. NYC 6,115 1,730 2,009 1,747 1,542 7,028 1,518 1,710 1,702
Law enforcement naloxone administration reports 3
Naloxone administration reportby law enforcement
Otsego 4 2 3 0 2 7 2 3 2NYS excl. NYC 956 404 402 392 346 1,544 336 443 331
Registered Community Opioid Overdose Prevention (COOP) program naloxone administration reports 3
Naloxone administration reportby registered COOP program
Otsego 0 0 1 0 0 1 0 0 0NYS excl. NYC 489 255 248 224 176 903 182 239 107
1 County numbers displayed in the table represent only naloxone administration events reported electronically, therefore, actual numbers of events may be higher.
2 EMS reporting may have been affected by a change in documentation systems used by EMS agency/ies serving the area. Counts may decrease until updates to thedata are available in 2018, if applicable.
3 Numbers displayed in the table represent only naloxone administration reports submitted by law enforcement and registered COOP programs to the NYSDOH AIDSInstitute. The actual numbers of naloxone administration events may be higher.
79

Putnam County: Opioid overdoses and rates per 100,000 population (Preliminary data as of November, 2017 - subject to change)
Apr-Jun, 2016 Jul-Sep, 2016 Oct-Dec, 2016 2016 Total Jan-Mar, 2017 Apr-Jun, 2017
Indicator Location NumberCrudeRate Number
CrudeRate Number
CrudeRate Number
CrudeRate Number
CrudeRate Number
CrudeRate
Deaths 1
All opioid overdoses Putnam 9 9.1 5 5.0 5 5.0 21 21.2 0 0.0 1 1.0NYS excl. NYC 501 4.5 476 4.2 506 4.5 1,990 17.7 130 1.2 75 0.7
Heroin overdoses Putnam 4 4.0 3 3.0 3 3.0 11 11.1 0 0.0 1 1.0NYS excl. NYC 207 1.8 202 1.8 179 1.6 798 7.1 51 0.5 30 0.3
Overdoses involvingopioid pain relievers 2
Putnam 7 7.1 2 2.0 5 5.0 16 16.2 0 0.0 1 1.0NYS excl. NYC 388 3.5 371 3.3 439 3.9 1,576 14.0 96 0.9 56 0.5
Outpatient emergency department visits 3
All opioid overdoses Putnam 11 11.1 10 10.1 8 8.1 39 39.4 9 9.1 20 20.2NYS excl. NYC 1,772 15.8 1,552 13.8 1,605 14.3 6,675 59.4 1,684 15.0 1,845 16.4
Heroin overdoses Putnam 8 8.1 s s s s 29 29.3 s s 16 16.2NYS excl. NYC 1,282 11.4 1,085 9.6 1,128 10.0 4,784 42.5 1,183 10.5 1,351 12.0
Opioid overdosesexcluding heroin 2
Putnam s s s s s s 10 10.1 s s s sNYS excl. NYC 490 4.4 467 4.2 477 4.2 1,891 16.8 501 4.5 494 4.4
Hospitalizations 3
All opioid overdoses Putnam 9 9.1 s s s s 14 14.1 s s s sNYS excl. NYC 486 4.3 457 4.1 467 4.2 1,895 16.9 481 4.3 500 4.4
Heroin overdoses Putnam s s s s 0 0.0 s s s s s sNYS excl. NYC 196 1.7 197 1.8 173 1.5 778 6.9 179 1.6 207 1.8
Opioid overdosesexcluding heroin 2
Putnam s s s s s s 8 8.1 s s s sNYS excl. NYC 290 2.6 260 2.3 294 2.6 1,117 9.9 302 2.7 293 2.6
1 Indicators are not mutually exclusive. Decedents and patients may have multiple substances in their system. Thus, overdoses involving heroin and overdosesinvolving opioid pain relievers will not add up to the overdoses involving all opioids.
2 This indicator includes pharmaceutically and illicitly produced opioids such as fentanyl.
3 Indicators generated for hospitalizations and emergency department visits are based on ICD-10-CM codes.
s: Data for indicators related to hospitalizations and emergency departments are suppressed for confidentiality purposes if there are less than 6 discharges.
80
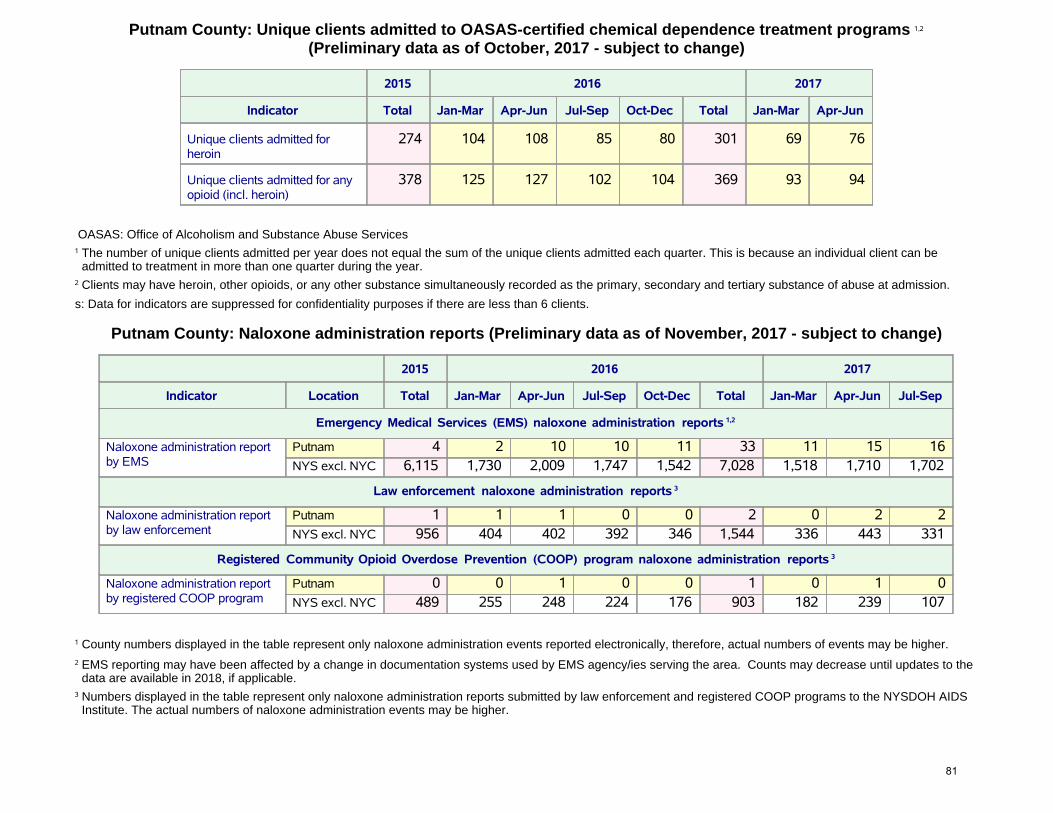
Putnam County: Unique clients admitted to OASAS-certified chemical dependence treatment programs 1,2
(Preliminary data as of October, 2017 - subject to change)
2015 2016 2017
Indicator Total Jan-Mar Apr-Jun Jul-Sep Oct-Dec Total Jan-Mar Apr-Jun
Unique clients admitted forheroin
274 104 108 85 80 301 69 76
Unique clients admitted for anyopioid (incl. heroin)
378 125 127 102 104 369 93 94
OASAS: Office of Alcoholism and Substance Abuse Services
1 The number of unique clients admitted per year does not equal the sum of the unique clients admitted each quarter. This is because an individual client can beadmitted to treatment in more than one quarter during the year.
2 Clients may have heroin, other opioids, or any other substance simultaneously recorded as the primary, secondary and tertiary substance of abuse at admission.
s: Data for indicators are suppressed for confidentiality purposes if there are less than 6 clients.
Putnam County: Naloxone administration reports (Preliminary data as of November, 2017 - subject to change)
2015 2016 2017
Indicator Location Total Jan-Mar Apr-Jun Jul-Sep Oct-Dec Total Jan-Mar Apr-Jun Jul-Sep
Emergency Medical Services (EMS) naloxone administration reports 1,2
Naloxone administration reportby EMS
Putnam 4 2 10 10 11 33 11 15 16NYS excl. NYC 6,115 1,730 2,009 1,747 1,542 7,028 1,518 1,710 1,702
Law enforcement naloxone administration reports 3
Naloxone administration reportby law enforcement
Putnam 1 1 1 0 0 2 0 2 2NYS excl. NYC 956 404 402 392 346 1,544 336 443 331
Registered Community Opioid Overdose Prevention (COOP) program naloxone administration reports 3
Naloxone administration reportby registered COOP program
Putnam 0 0 1 0 0 1 0 1 0NYS excl. NYC 489 255 248 224 176 903 182 239 107
1 County numbers displayed in the table represent only naloxone administration events reported electronically, therefore, actual numbers of events may be higher.
2 EMS reporting may have been affected by a change in documentation systems used by EMS agency/ies serving the area. Counts may decrease until updates to thedata are available in 2018, if applicable.
3 Numbers displayed in the table represent only naloxone administration reports submitted by law enforcement and registered COOP programs to the NYSDOH AIDSInstitute. The actual numbers of naloxone administration events may be higher.
81
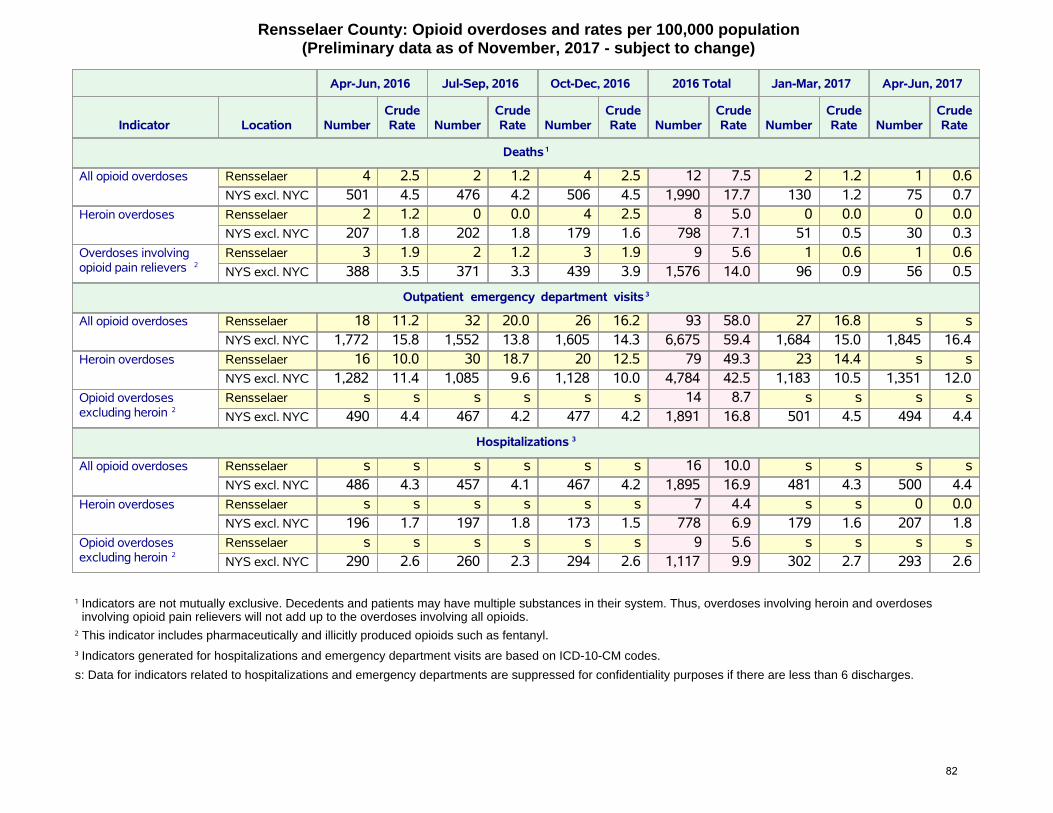
Rensselaer County: Opioid overdoses and rates per 100,000 population (Preliminary data as of November, 2017 - subject to change)
Apr-Jun, 2016 Jul-Sep, 2016 Oct-Dec, 2016 2016 Total Jan-Mar, 2017 Apr-Jun, 2017
Indicator Location NumberCrudeRate Number
CrudeRate Number
CrudeRate Number
CrudeRate Number
CrudeRate Number
CrudeRate
Deaths 1
All opioid overdoses Rensselaer 4 2.5 2 1.2 4 2.5 12 7.5 2 1.2 1 0.6NYS excl. NYC 501 4.5 476 4.2 506 4.5 1,990 17.7 130 1.2 75 0.7
Heroin overdoses Rensselaer 2 1.2 0 0.0 4 2.5 8 5.0 0 0.0 0 0.0NYS excl. NYC 207 1.8 202 1.8 179 1.6 798 7.1 51 0.5 30 0.3
Overdoses involvingopioid pain relievers 2
Rensselaer 3 1.9 2 1.2 3 1.9 9 5.6 1 0.6 1 0.6NYS excl. NYC 388 3.5 371 3.3 439 3.9 1,576 14.0 96 0.9 56 0.5
Outpatient emergency department visits 3
All opioid overdoses Rensselaer 18 11.2 32 20.0 26 16.2 93 58.0 27 16.8 s sNYS excl. NYC 1,772 15.8 1,552 13.8 1,605 14.3 6,675 59.4 1,684 15.0 1,845 16.4
Heroin overdoses Rensselaer 16 10.0 30 18.7 20 12.5 79 49.3 23 14.4 s sNYS excl. NYC 1,282 11.4 1,085 9.6 1,128 10.0 4,784 42.5 1,183 10.5 1,351 12.0
Opioid overdosesexcluding heroin 2
Rensselaer s s s s s s 14 8.7 s s s sNYS excl. NYC 490 4.4 467 4.2 477 4.2 1,891 16.8 501 4.5 494 4.4
Hospitalizations 3
All opioid overdoses Rensselaer s s s s s s 16 10.0 s s s sNYS excl. NYC 486 4.3 457 4.1 467 4.2 1,895 16.9 481 4.3 500 4.4
Heroin overdoses Rensselaer s s s s s s 7 4.4 s s 0 0.0NYS excl. NYC 196 1.7 197 1.8 173 1.5 778 6.9 179 1.6 207 1.8
Opioid overdosesexcluding heroin 2
Rensselaer s s s s s s 9 5.6 s s s sNYS excl. NYC 290 2.6 260 2.3 294 2.6 1,117 9.9 302 2.7 293 2.6
1 Indicators are not mutually exclusive. Decedents and patients may have multiple substances in their system. Thus, overdoses involving heroin and overdosesinvolving opioid pain relievers will not add up to the overdoses involving all opioids.
2 This indicator includes pharmaceutically and illicitly produced opioids such as fentanyl.
3 Indicators generated for hospitalizations and emergency department visits are based on ICD-10-CM codes.
s: Data for indicators related to hospitalizations and emergency departments are suppressed for confidentiality purposes if there are less than 6 discharges.
82

Rensselaer County: Unique clients admitted to OASAS-certified chemical dependence treatment programs 1,2
(Preliminary data as of October, 2017 - subject to change)
2015 2016 2017
Indicator Total Jan-Mar Apr-Jun Jul-Sep Oct-Dec Total Jan-Mar Apr-Jun
Unique clients admitted forheroin
587 169 157 193 175 548 214 175
Unique clients admitted for anyopioid (incl. heroin)
732 213 201 236 209 685 251 220
OASAS: Office of Alcoholism and Substance Abuse Services
1 The number of unique clients admitted per year does not equal the sum of the unique clients admitted each quarter. This is because an individual client can beadmitted to treatment in more than one quarter during the year.
2 Clients may have heroin, other opioids, or any other substance simultaneously recorded as the primary, secondary and tertiary substance of abuse at admission.
s: Data for indicators are suppressed for confidentiality purposes if there are less than 6 clients.
Rensselaer County: Naloxone administration reports (Preliminary data as of November, 2017 - subject to change)
2015 2016 2017
Indicator Location Total Jan-Mar Apr-Jun Jul-Sep Oct-Dec Total Jan-Mar Apr-Jun Jul-Sep
Emergency Medical Services (EMS) naloxone administration reports 1,2
Naloxone administration reportby EMS
Rensselaer 122 34 33 57 42 166 40 53 50NYS excl. NYC 6,115 1,730 2,009 1,747 1,542 7,028 1,518 1,710 1,702
Law enforcement naloxone administration reports 3
Naloxone administration reportby law enforcement
Rensselaer 5 3 1 5 8 17 3 3 5NYS excl. NYC 956 404 402 392 346 1,544 336 443 331
Registered Community Opioid Overdose Prevention (COOP) program naloxone administration reports 3
Naloxone administration reportby registered COOP program
Rensselaer 2 5 7 6 10 28 8 5 1NYS excl. NYC 489 255 248 224 176 903 182 239 107
1 County numbers displayed in the table represent only naloxone administration events reported electronically, therefore, actual numbers of events may be higher.
2 EMS reporting may have been affected by a change in documentation systems used by EMS agency/ies serving the area. Counts may decrease until updates to thedata are available in 2018, if applicable.
3 Numbers displayed in the table represent only naloxone administration reports submitted by law enforcement and registered COOP programs to the NYSDOH AIDSInstitute. The actual numbers of naloxone administration events may be higher.
83

Rockland County: Opioid overdoses and rates per 100,000 population (Preliminary data as of November, 2017 - subject to change)
Apr-Jun, 2016 Jul-Sep, 2016 Oct-Dec, 2016 2016 Total Jan-Mar, 2017 Apr-Jun, 2017
Indicator Location NumberCrudeRate Number
CrudeRate Number
CrudeRate Number
CrudeRate Number
CrudeRate Number
CrudeRate
Deaths 1
All opioid overdoses Rockland 10 3.1 10 3.1 9 2.8 37 11.3 3 0.9 2 0.6NYS excl. NYC 501 4.5 476 4.2 506 4.5 1,990 17.7 130 1.2 75 0.7
Heroin overdoses Rockland 4 1.2 4 1.2 6 1.8 16 4.9 2 0.6 0 0.0NYS excl. NYC 207 1.8 202 1.8 179 1.6 798 7.1 51 0.5 30 0.3
Overdoses involvingopioid pain relievers 2
Rockland 8 2.5 7 2.1 7 2.1 29 8.9 1 0.3 2 0.6NYS excl. NYC 388 3.5 371 3.3 439 3.9 1,576 14.0 96 0.9 56 0.5
Outpatient emergency department visits 3
All opioid overdoses Rockland 12 3.7 9 2.8 7 2.1 36 11.0 15 4.6 17 5.2NYS excl. NYC 1,772 15.8 1,552 13.8 1,605 14.3 6,675 59.4 1,684 15.0 1,845 16.4
Heroin overdoses Rockland s s s s s s 21 6.4 7 2.1 8 2.5NYS excl. NYC 1,282 11.4 1,085 9.6 1,128 10.0 4,784 42.5 1,183 10.5 1,351 12.0
Opioid overdosesexcluding heroin 2
Rockland s s s s s s 15 4.6 8 2.5 9 2.8NYS excl. NYC 490 4.4 467 4.2 477 4.2 1,891 16.8 501 4.5 494 4.4
Hospitalizations 3
All opioid overdoses Rockland 8 2.5 8 2.5 13 4.0 37 11.3 13 4.0 s sNYS excl. NYC 486 4.3 457 4.1 467 4.2 1,895 16.9 481 4.3 500 4.4
Heroin overdoses Rockland s s s s s s 13 4.0 s s s sNYS excl. NYC 196 1.7 197 1.8 173 1.5 778 6.9 179 1.6 207 1.8
Opioid overdosesexcluding heroin 2
Rockland s s s s 8 2.5 24 7.4 8 2.5 s sNYS excl. NYC 290 2.6 260 2.3 294 2.6 1,117 9.9 302 2.7 293 2.6
1 Indicators are not mutually exclusive. Decedents and patients may have multiple substances in their system. Thus, overdoses involving heroin and overdosesinvolving opioid pain relievers will not add up to the overdoses involving all opioids.
2 This indicator includes pharmaceutically and illicitly produced opioids such as fentanyl.
3 Indicators generated for hospitalizations and emergency department visits are based on ICD-10-CM codes.
s: Data for indicators related to hospitalizations and emergency departments are suppressed for confidentiality purposes if there are less than 6 discharges.
84

Rockland County: Unique clients admitted to OASAS-certified chemical dependence treatment programs 1,2
(Preliminary data as of October, 2017 - subject to change)
2015 2016 2017
Indicator Total Jan-Mar Apr-Jun Jul-Sep Oct-Dec Total Jan-Mar Apr-Jun
Unique clients admitted forheroin
433 130 141 139 139 427 161 154
Unique clients admitted for anyopioid (incl. heroin)
622 185 198 202 195 604 207 210
OASAS: Office of Alcoholism and Substance Abuse Services
1 The number of unique clients admitted per year does not equal the sum of the unique clients admitted each quarter. This is because an individual client can beadmitted to treatment in more than one quarter during the year.
2 Clients may have heroin, other opioids, or any other substance simultaneously recorded as the primary, secondary and tertiary substance of abuse at admission.
s: Data for indicators are suppressed for confidentiality purposes if there are less than 6 clients.
Rockland County: Naloxone administration reports (Preliminary data as of November, 2017 - subject to change)
2015 2016 2017
Indicator Location Total Jan-Mar Apr-Jun Jul-Sep Oct-Dec Total Jan-Mar Apr-Jun Jul-Sep
Emergency Medical Services (EMS) naloxone administration reports 1,2
Naloxone administration reportby EMS
Rockland 17 6 7 5 6 24 10 5 8NYS excl. NYC 6,115 1,730 2,009 1,747 1,542 7,028 1,518 1,710 1,702
Law enforcement naloxone administration reports 3
Naloxone administration reportby law enforcement
Rockland 29 12 13 13 16 54 20 17 6NYS excl. NYC 956 404 402 392 346 1,544 336 443 331
Registered Community Opioid Overdose Prevention (COOP) program naloxone administration reports 3
Naloxone administration reportby registered COOP program
Rockland 8 0 0 1 0 1 0 0 0NYS excl. NYC 489 255 248 224 176 903 182 239 107
1 County numbers displayed in the table represent only naloxone administration events reported electronically, therefore, actual numbers of events may be higher.
2 EMS reporting may have been affected by a change in documentation systems used by EMS agency/ies serving the area. Counts may decrease until updates to thedata are available in 2018, if applicable.
3 Numbers displayed in the table represent only naloxone administration reports submitted by law enforcement and registered COOP programs to the NYSDOH AIDSInstitute. The actual numbers of naloxone administration events may be higher.
85

St. Lawrence County: Opioid overdoses and rates per 100,000 population (Preliminary data as of November, 2017 - subject to change)
Apr-Jun, 2016 Jul-Sep, 2016 Oct-Dec, 2016 2016 Total Jan-Mar, 2017 Apr-Jun, 2017
Indicator Location NumberCrudeRate Number
CrudeRate Number
CrudeRate Number
CrudeRate Number
CrudeRate Number
CrudeRate
Deaths 1
All opioid overdoses St. Lawrence 3 2.7 2 1.8 5 4.5 14 12.6 1 0.9 1 0.9NYS excl. NYC 501 4.5 476 4.2 506 4.5 1,990 17.7 130 1.2 75 0.7
Heroin overdoses St. Lawrence 0 0.0 1 0.9 1 0.9 4 3.6 0 0.0 0 0.0NYS excl. NYC 207 1.8 202 1.8 179 1.6 798 7.1 51 0.5 30 0.3
Overdoses involvingopioid pain relievers 2
St. Lawrence 3 2.7 2 1.8 5 4.5 12 10.8 1 0.9 1 0.9NYS excl. NYC 388 3.5 371 3.3 439 3.9 1,576 14.0 96 0.9 56 0.5
Outpatient emergency department visits 3
All opioid overdoses St. Lawrence 15 13.5 13 11.7 16 14.4 48 43.2 11 9.9 7 6.3NYS excl. NYC 1,772 15.8 1,552 13.8 1,605 14.3 6,675 59.4 1,684 15.0 1,845 16.4
Heroin overdoses St. Lawrence 11 9.9 s s 9 8.1 27 24.3 s s s sNYS excl. NYC 1,282 11.4 1,085 9.6 1,128 10.0 4,784 42.5 1,183 10.5 1,351 12.0
Opioid overdosesexcluding heroin 2
St. Lawrence s s 7 6.3 7 6.3 21 18.9 s s s sNYS excl. NYC 490 4.4 467 4.2 477 4.2 1,891 16.8 501 4.5 494 4.4
Hospitalizations 3
All opioid overdoses St. Lawrence s s s s s s 18 16.2 s s s sNYS excl. NYC 486 4.3 457 4.1 467 4.2 1,895 16.9 481 4.3 500 4.4
Heroin overdoses St. Lawrence s s s s s s s s s s s sNYS excl. NYC 196 1.7 197 1.8 173 1.5 778 6.9 179 1.6 207 1.8
Opioid overdosesexcluding heroin 2
St. Lawrence s s s s s s 13 11.7 s s s sNYS excl. NYC 290 2.6 260 2.3 294 2.6 1,117 9.9 302 2.7 293 2.6
1 Indicators are not mutually exclusive. Decedents and patients may have multiple substances in their system. Thus, overdoses involving heroin and overdosesinvolving opioid pain relievers will not add up to the overdoses involving all opioids.
2 This indicator includes pharmaceutically and illicitly produced opioids such as fentanyl.
3 Indicators generated for hospitalizations and emergency department visits are based on ICD-10-CM codes.
s: Data for indicators related to hospitalizations and emergency departments are suppressed for confidentiality purposes if there are less than 6 discharges.
86

St. Lawrence County: Unique clients admitted to OASAS-certified chemical dependence treatment programs 1,2
(Preliminary data as of October, 2017 - subject to change)
2015 2016 2017
Indicator Total Jan-Mar Apr-Jun Jul-Sep Oct-Dec Total Jan-Mar Apr-Jun
Unique clients admitted forheroin
287 101 106 90 82 303 90 89
Unique clients admitted for anyopioid (incl. heroin)
662 217 199 210 196 644 195 193
OASAS: Office of Alcoholism and Substance Abuse Services
1 The number of unique clients admitted per year does not equal the sum of the unique clients admitted each quarter. This is because an individual client can beadmitted to treatment in more than one quarter during the year.
2 Clients may have heroin, other opioids, or any other substance simultaneously recorded as the primary, secondary and tertiary substance of abuse at admission.
s: Data for indicators are suppressed for confidentiality purposes if there are less than 6 clients.
St. Lawrence County: Naloxone administration reports (Preliminary data as of November, 2017 - subject to change)
2015 2016 2017
Indicator Location Total Jan-Mar Apr-Jun Jul-Sep Oct-Dec Total Jan-Mar Apr-Jun Jul-Sep
Emergency Medical Services (EMS) naloxone administration reports 1,2
Naloxone administration reportby EMS
St. Lawrence 34 5 9 15 23 52 23 8 14NYS excl. NYC 6,115 1,730 2,009 1,747 1,542 7,028 1,518 1,710 1,702
Law enforcement naloxone administration reports 3
Naloxone administration reportby law enforcement
St. Lawrence 9 1 3 1 3 8 7 4 2NYS excl. NYC 956 404 402 392 346 1,544 336 443 331
Registered Community Opioid Overdose Prevention (COOP) program naloxone administration reports 3
Naloxone administration reportby registered COOP program
St. Lawrence 0 0 1 0 0 1 1 3 3NYS excl. NYC 489 255 248 224 176 903 182 239 107
1 County numbers displayed in the table represent only naloxone administration events reported electronically, therefore, actual numbers of events may be higher.
2 EMS reporting may have been affected by a change in documentation systems used by EMS agency/ies serving the area. Counts may decrease until updates to thedata are available in 2018, if applicable.
3 Numbers displayed in the table represent only naloxone administration reports submitted by law enforcement and registered COOP programs to the NYSDOH AIDSInstitute. The actual numbers of naloxone administration events may be higher.
87
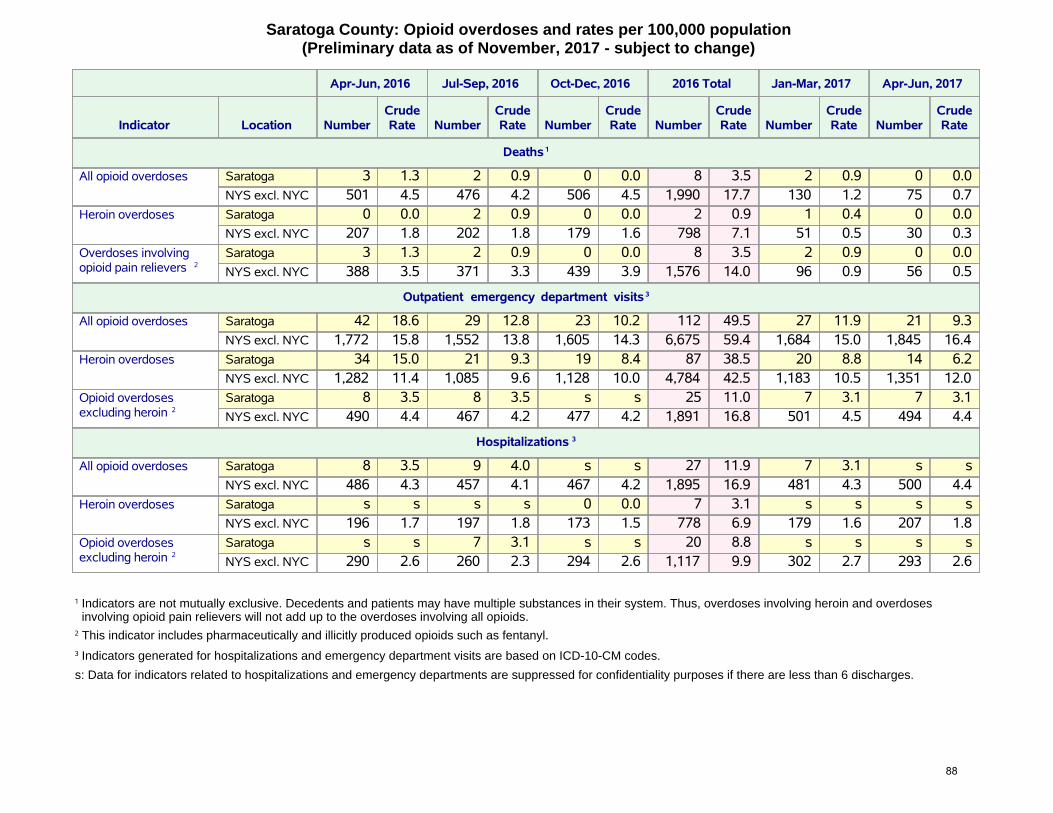
Saratoga County: Opioid overdoses and rates per 100,000 population (Preliminary data as of November, 2017 - subject to change)
Apr-Jun, 2016 Jul-Sep, 2016 Oct-Dec, 2016 2016 Total Jan-Mar, 2017 Apr-Jun, 2017
Indicator Location NumberCrudeRate Number
CrudeRate Number
CrudeRate Number
CrudeRate Number
CrudeRate Number
CrudeRate
Deaths 1
All opioid overdoses Saratoga 3 1.3 2 0.9 0 0.0 8 3.5 2 0.9 0 0.0NYS excl. NYC 501 4.5 476 4.2 506 4.5 1,990 17.7 130 1.2 75 0.7
Heroin overdoses Saratoga 0 0.0 2 0.9 0 0.0 2 0.9 1 0.4 0 0.0NYS excl. NYC 207 1.8 202 1.8 179 1.6 798 7.1 51 0.5 30 0.3
Overdoses involvingopioid pain relievers 2
Saratoga 3 1.3 2 0.9 0 0.0 8 3.5 2 0.9 0 0.0NYS excl. NYC 388 3.5 371 3.3 439 3.9 1,576 14.0 96 0.9 56 0.5
Outpatient emergency department visits 3
All opioid overdoses Saratoga 42 18.6 29 12.8 23 10.2 112 49.5 27 11.9 21 9.3NYS excl. NYC 1,772 15.8 1,552 13.8 1,605 14.3 6,675 59.4 1,684 15.0 1,845 16.4
Heroin overdoses Saratoga 34 15.0 21 9.3 19 8.4 87 38.5 20 8.8 14 6.2NYS excl. NYC 1,282 11.4 1,085 9.6 1,128 10.0 4,784 42.5 1,183 10.5 1,351 12.0
Opioid overdosesexcluding heroin 2
Saratoga 8 3.5 8 3.5 s s 25 11.0 7 3.1 7 3.1NYS excl. NYC 490 4.4 467 4.2 477 4.2 1,891 16.8 501 4.5 494 4.4
Hospitalizations 3
All opioid overdoses Saratoga 8 3.5 9 4.0 s s 27 11.9 7 3.1 s sNYS excl. NYC 486 4.3 457 4.1 467 4.2 1,895 16.9 481 4.3 500 4.4
Heroin overdoses Saratoga s s s s 0 0.0 7 3.1 s s s sNYS excl. NYC 196 1.7 197 1.8 173 1.5 778 6.9 179 1.6 207 1.8
Opioid overdosesexcluding heroin 2
Saratoga s s 7 3.1 s s 20 8.8 s s s sNYS excl. NYC 290 2.6 260 2.3 294 2.6 1,117 9.9 302 2.7 293 2.6
1 Indicators are not mutually exclusive. Decedents and patients may have multiple substances in their system. Thus, overdoses involving heroin and overdosesinvolving opioid pain relievers will not add up to the overdoses involving all opioids.
2 This indicator includes pharmaceutically and illicitly produced opioids such as fentanyl.
3 Indicators generated for hospitalizations and emergency department visits are based on ICD-10-CM codes.
s: Data for indicators related to hospitalizations and emergency departments are suppressed for confidentiality purposes if there are less than 6 discharges.
88

Saratoga County: Unique clients admitted to OASAS-certified chemical dependence treatment programs 1,2
(Preliminary data as of October, 2017 - subject to change)
2015 2016 2017
Indicator Total Jan-Mar Apr-Jun Jul-Sep Oct-Dec Total Jan-Mar Apr-Jun
Unique clients admitted forheroin
379 133 96 144 101 369 103 104
Unique clients admitted for anyopioid (incl. heroin)
520 191 147 184 144 532 154 158
OASAS: Office of Alcoholism and Substance Abuse Services
1 The number of unique clients admitted per year does not equal the sum of the unique clients admitted each quarter. This is because an individual client can beadmitted to treatment in more than one quarter during the year.
2 Clients may have heroin, other opioids, or any other substance simultaneously recorded as the primary, secondary and tertiary substance of abuse at admission.
s: Data for indicators are suppressed for confidentiality purposes if there are less than 6 clients.
Saratoga County: Naloxone administration reports (Preliminary data as of November, 2017 - subject to change)
2015 2016 2017
Indicator Location Total Jan-Mar Apr-Jun Jul-Sep Oct-Dec Total Jan-Mar Apr-Jun Jul-Sep
Emergency Medical Services (EMS) naloxone administration reports 1,2
Naloxone administration reportby EMS
Saratoga 110 35 49 44 31 159 42 52 34NYS excl. NYC 6,115 1,730 2,009 1,747 1,542 7,028 1,518 1,710 1,702
Law enforcement naloxone administration reports 3
Naloxone administration reportby law enforcement
Saratoga 10 7 5 3 1 16 1 4 2NYS excl. NYC 956 404 402 392 346 1,544 336 443 331
Registered Community Opioid Overdose Prevention (COOP) program naloxone administration reports 3
Naloxone administration reportby registered COOP program
Saratoga 2 3 4 0 0 7 0 0 2NYS excl. NYC 489 255 248 224 176 903 182 239 107
1 County numbers displayed in the table represent only naloxone administration events reported electronically, therefore, actual numbers of events may be higher.
2 EMS reporting may have been affected by a change in documentation systems used by EMS agency/ies serving the area. Counts may decrease until updates to thedata are available in 2018, if applicable.
3 Numbers displayed in the table represent only naloxone administration reports submitted by law enforcement and registered COOP programs to the NYSDOH AIDSInstitute. The actual numbers of naloxone administration events may be higher.
89

Schenectady County: Opioid overdoses and rates per 100,000 population (Preliminary data as of November, 2017 - subject to change)
Apr-Jun, 2016 Jul-Sep, 2016 Oct-Dec, 2016 2016 Total Jan-Mar, 2017 Apr-Jun, 2017
Indicator Location NumberCrudeRate Number
CrudeRate Number
CrudeRate Number
CrudeRate Number
CrudeRate Number
CrudeRate
Deaths 1
All opioid overdoses Schenectady 6 3.9 12 7.8 4 2.6 29 18.8 5 3.2 1 0.6NYS excl. NYC 501 4.5 476 4.2 506 4.5 1,990 17.7 130 1.2 75 0.7
Heroin overdoses Schenectady 6 3.9 5 3.2 3 1.9 17 11.0 2 1.3 0 0.0NYS excl. NYC 207 1.8 202 1.8 179 1.6 798 7.1 51 0.5 30 0.3
Overdoses involvingopioid pain relievers 2
Schenectady 1 0.6 6 3.9 1 0.6 10 6.5 5 3.2 1 0.6NYS excl. NYC 388 3.5 371 3.3 439 3.9 1,576 14.0 96 0.9 56 0.5
Outpatient emergency department visits 3
All opioid overdoses Schenectady 34 22.0 39 25.2 22 14.2 120 77.6 20 12.9 25 16.2NYS excl. NYC 1,772 15.8 1,552 13.8 1,605 14.3 6,675 59.4 1,684 15.0 1,845 16.4
Heroin overdoses Schenectady 25 16.2 31 20.1 18 11.6 90 58.2 18 11.6 19 12.3NYS excl. NYC 1,282 11.4 1,085 9.6 1,128 10.0 4,784 42.5 1,183 10.5 1,351 12.0
Opioid overdosesexcluding heroin 2
Schenectady 9 5.8 8 5.2 s s 30 19.4 s s s sNYS excl. NYC 490 4.4 467 4.2 477 4.2 1,891 16.8 501 4.5 494 4.4
Hospitalizations 3
All opioid overdoses Schenectady s s s s 9 5.8 25 16.2 s s 9 5.8NYS excl. NYC 486 4.3 457 4.1 467 4.2 1,895 16.9 481 4.3 500 4.4
Heroin overdoses Schenectady s s s s s s 16 10.3 s s s sNYS excl. NYC 196 1.7 197 1.8 173 1.5 778 6.9 179 1.6 207 1.8
Opioid overdosesexcluding heroin 2
Schenectady s s s s s s 9 5.8 s s s sNYS excl. NYC 290 2.6 260 2.3 294 2.6 1,117 9.9 302 2.7 293 2.6
1 Indicators are not mutually exclusive. Decedents and patients may have multiple substances in their system. Thus, overdoses involving heroin and overdosesinvolving opioid pain relievers will not add up to the overdoses involving all opioids.
2 This indicator includes pharmaceutically and illicitly produced opioids such as fentanyl.
3 Indicators generated for hospitalizations and emergency department visits are based on ICD-10-CM codes.
s: Data for indicators related to hospitalizations and emergency departments are suppressed for confidentiality purposes if there are less than 6 discharges.
90

Schenectady County: Unique clients admitted to OASAS-certified chemical dependence treatment programs 1,2
(Preliminary data as of October, 2017 - subject to change)
2015 2016 2017
Indicator Total Jan-Mar Apr-Jun Jul-Sep Oct-Dec Total Jan-Mar Apr-Jun
Unique clients admitted forheroin
618 220 218 246 194 641 200 220
Unique clients admitted for anyopioid (incl. heroin)
777 257 256 272 219 750 241 270
OASAS: Office of Alcoholism and Substance Abuse Services
1 The number of unique clients admitted per year does not equal the sum of the unique clients admitted each quarter. This is because an individual client can beadmitted to treatment in more than one quarter during the year.
2 Clients may have heroin, other opioids, or any other substance simultaneously recorded as the primary, secondary and tertiary substance of abuse at admission.
s: Data for indicators are suppressed for confidentiality purposes if there are less than 6 clients.
Schenectady County: Naloxone administration reports (Preliminary data as of November, 2017 - subject to change)
2015 2016 2017
Indicator Location Total Jan-Mar Apr-Jun Jul-Sep Oct-Dec Total Jan-Mar Apr-Jun Jul-Sep
Emergency Medical Services (EMS) naloxone administration reports 1,2
Naloxone administration reportby EMS
Schenectady 210 47 74 79 42 242 41 63 73NYS excl. NYC 6,115 1,730 2,009 1,747 1,542 7,028 1,518 1,710 1,702
Law enforcement naloxone administration reports 3
Naloxone administration reportby law enforcement
Schenectady 0 2 2 0 2 6 2 0 0NYS excl. NYC 956 404 402 392 346 1,544 336 443 331
Registered Community Opioid Overdose Prevention (COOP) program naloxone administration reports 3
Naloxone administration reportby registered COOP program
Schenectady 40 10 10 7 6 33 12 4 8NYS excl. NYC 489 255 248 224 176 903 182 239 107
1 County numbers displayed in the table represent only naloxone administration events reported electronically, therefore, actual numbers of events may be higher.
2 EMS reporting may have been affected by a change in documentation systems used by EMS agency/ies serving the area. Counts may decrease until updates to thedata are available in 2018, if applicable.
3 Numbers displayed in the table represent only naloxone administration reports submitted by law enforcement and registered COOP programs to the NYSDOH AIDSInstitute. The actual numbers of naloxone administration events may be higher.
91

Schoharie County: Opioid overdoses and rates per 100,000 population (Preliminary data as of November, 2017 - subject to change)
Apr-Jun, 2016 Jul-Sep, 2016 Oct-Dec, 2016 2016 Total Jan-Mar, 2017 Apr-Jun, 2017
Indicator Location NumberCrudeRate Number
CrudeRate Number
CrudeRate Number
CrudeRate Number
CrudeRate Number
CrudeRate
Deaths 1
All opioid overdoses Schoharie 1 3.2 2 6.4 1 3.2 4 12.8 0 0.0 0 0.0NYS excl. NYC 501 4.5 476 4.2 506 4.5 1,990 17.7 130 1.2 75 0.7
Heroin overdoses Schoharie 1 3.2 1 3.2 0 0.0 2 6.4 0 0.0 0 0.0NYS excl. NYC 207 1.8 202 1.8 179 1.6 798 7.1 51 0.5 30 0.3
Overdoses involvingopioid pain relievers 2
Schoharie 0 0.0 2 6.4 1 3.2 3 9.6 0 0.0 0 0.0NYS excl. NYC 388 3.5 371 3.3 439 3.9 1,576 14.0 96 0.9 56 0.5
Outpatient emergency department visits 3
All opioid overdoses Schoharie s s 9 28.7 s s 17 54.3 s s s sNYS excl. NYC 1,772 15.8 1,552 13.8 1,605 14.3 6,675 59.4 1,684 15.0 1,845 16.4
Heroin overdoses Schoharie s s s s s s 10 31.9 s s s sNYS excl. NYC 1,282 11.4 1,085 9.6 1,128 10.0 4,784 42.5 1,183 10.5 1,351 12.0
Opioid overdosesexcluding heroin 2
Schoharie s s s s s s 7 22.3 s s s sNYS excl. NYC 490 4.4 467 4.2 477 4.2 1,891 16.8 501 4.5 494 4.4
Hospitalizations 3
All opioid overdoses Schoharie s s s s 0 0.0 s s 0 0.0 s sNYS excl. NYC 486 4.3 457 4.1 467 4.2 1,895 16.9 481 4.3 500 4.4
Heroin overdoses Schoharie 0 0.0 s s 0 0.0 s s 0 0.0 0 0.0NYS excl. NYC 196 1.7 197 1.8 173 1.5 778 6.9 179 1.6 207 1.8
Opioid overdosesexcluding heroin 2
Schoharie s s 0 0.0 0 0.0 s s 0 0.0 s sNYS excl. NYC 290 2.6 260 2.3 294 2.6 1,117 9.9 302 2.7 293 2.6
1 Indicators are not mutually exclusive. Decedents and patients may have multiple substances in their system. Thus, overdoses involving heroin and overdosesinvolving opioid pain relievers will not add up to the overdoses involving all opioids.
2 This indicator includes pharmaceutically and illicitly produced opioids such as fentanyl.
3 Indicators generated for hospitalizations and emergency department visits are based on ICD-10-CM codes.
s: Data for indicators related to hospitalizations and emergency departments are suppressed for confidentiality purposes if there are less than 6 discharges.
92

Schoharie County: Unique clients admitted to OASAS-certified chemical dependence treatment programs 1,2
(Preliminary data as of October, 2017 - subject to change)
2015 2016 2017
Indicator Total Jan-Mar Apr-Jun Jul-Sep Oct-Dec Total Jan-Mar Apr-Jun
Unique clients admitted forheroin
61 25 38 29 23 93 27 20
Unique clients admitted for anyopioid (incl. heroin)
99 34 50 33 30 122 33 30
OASAS: Office of Alcoholism and Substance Abuse Services
1 The number of unique clients admitted per year does not equal the sum of the unique clients admitted each quarter. This is because an individual client can beadmitted to treatment in more than one quarter during the year.
2 Clients may have heroin, other opioids, or any other substance simultaneously recorded as the primary, secondary and tertiary substance of abuse at admission.
s: Data for indicators are suppressed for confidentiality purposes if there are less than 6 clients.
Schoharie County: Naloxone administration reports (Preliminary data as of November, 2017 - subject to change)
2015 2016 2017
Indicator Location Total Jan-Mar Apr-Jun Jul-Sep Oct-Dec Total Jan-Mar Apr-Jun Jul-Sep
Emergency Medical Services (EMS) naloxone administration reports 1,2
Naloxone administration reportby EMS
Schoharie 15 0 5 8 1 14 2 3 1NYS excl. NYC 6,115 1,730 2,009 1,747 1,542 7,028 1,518 1,710 1,702
Law enforcement naloxone administration reports 3
Naloxone administration reportby law enforcement
Schoharie 0 0 1 4 1 6 0 1 0NYS excl. NYC 956 404 402 392 346 1,544 336 443 331
Registered Community Opioid Overdose Prevention (COOP) program naloxone administration reports 3
Naloxone administration reportby registered COOP program
Schoharie 0 0 2 0 0 2 0 0 0NYS excl. NYC 489 255 248 224 176 903 182 239 107
1 County numbers displayed in the table represent only naloxone administration events reported electronically, therefore, actual numbers of events may be higher.
2 EMS reporting may have been affected by a change in documentation systems used by EMS agency/ies serving the area. Counts may decrease until updates to thedata are available in 2018, if applicable.
3 Numbers displayed in the table represent only naloxone administration reports submitted by law enforcement and registered COOP programs to the NYSDOH AIDSInstitute. The actual numbers of naloxone administration events may be higher.
93
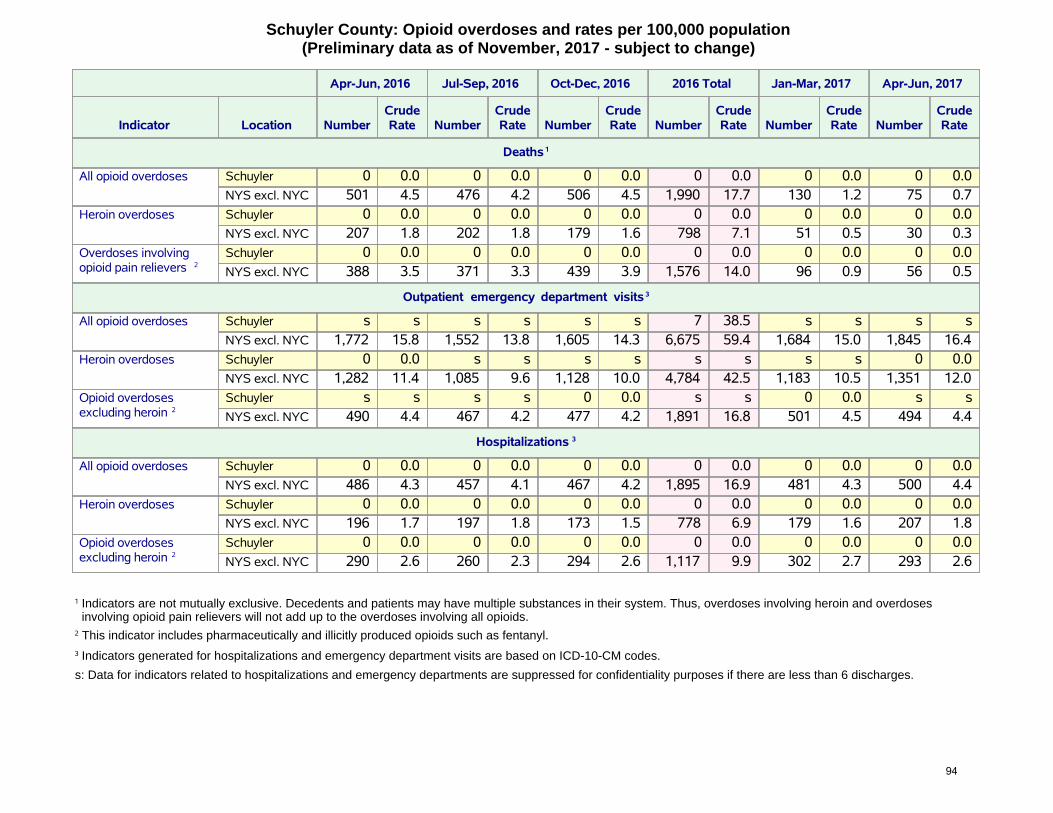
Schuyler County: Opioid overdoses and rates per 100,000 population (Preliminary data as of November, 2017 - subject to change)
Apr-Jun, 2016 Jul-Sep, 2016 Oct-Dec, 2016 2016 Total Jan-Mar, 2017 Apr-Jun, 2017
Indicator Location NumberCrudeRate Number
CrudeRate Number
CrudeRate Number
CrudeRate Number
CrudeRate Number
CrudeRate
Deaths 1
All opioid overdoses Schuyler 0 0.0 0 0.0 0 0.0 0 0.0 0 0.0 0 0.0NYS excl. NYC 501 4.5 476 4.2 506 4.5 1,990 17.7 130 1.2 75 0.7
Heroin overdoses Schuyler 0 0.0 0 0.0 0 0.0 0 0.0 0 0.0 0 0.0NYS excl. NYC 207 1.8 202 1.8 179 1.6 798 7.1 51 0.5 30 0.3
Overdoses involvingopioid pain relievers 2
Schuyler 0 0.0 0 0.0 0 0.0 0 0.0 0 0.0 0 0.0NYS excl. NYC 388 3.5 371 3.3 439 3.9 1,576 14.0 96 0.9 56 0.5
Outpatient emergency department visits 3
All opioid overdoses Schuyler s s s s s s 7 38.5 s s s sNYS excl. NYC 1,772 15.8 1,552 13.8 1,605 14.3 6,675 59.4 1,684 15.0 1,845 16.4
Heroin overdoses Schuyler 0 0.0 s s s s s s s s 0 0.0NYS excl. NYC 1,282 11.4 1,085 9.6 1,128 10.0 4,784 42.5 1,183 10.5 1,351 12.0
Opioid overdosesexcluding heroin 2
Schuyler s s s s 0 0.0 s s 0 0.0 s sNYS excl. NYC 490 4.4 467 4.2 477 4.2 1,891 16.8 501 4.5 494 4.4
Hospitalizations 3
All opioid overdoses Schuyler 0 0.0 0 0.0 0 0.0 0 0.0 0 0.0 0 0.0NYS excl. NYC 486 4.3 457 4.1 467 4.2 1,895 16.9 481 4.3 500 4.4
Heroin overdoses Schuyler 0 0.0 0 0.0 0 0.0 0 0.0 0 0.0 0 0.0NYS excl. NYC 196 1.7 197 1.8 173 1.5 778 6.9 179 1.6 207 1.8
Opioid overdosesexcluding heroin 2
Schuyler 0 0.0 0 0.0 0 0.0 0 0.0 0 0.0 0 0.0NYS excl. NYC 290 2.6 260 2.3 294 2.6 1,117 9.9 302 2.7 293 2.6
1 Indicators are not mutually exclusive. Decedents and patients may have multiple substances in their system. Thus, overdoses involving heroin and overdosesinvolving opioid pain relievers will not add up to the overdoses involving all opioids.
2 This indicator includes pharmaceutically and illicitly produced opioids such as fentanyl.
3 Indicators generated for hospitalizations and emergency department visits are based on ICD-10-CM codes.
s: Data for indicators related to hospitalizations and emergency departments are suppressed for confidentiality purposes if there are less than 6 discharges.
94

Schuyler County: Unique clients admitted to OASAS-certified chemical dependence treatment programs 1,2
(Preliminary data as of October, 2017 - subject to change)
2015 2016 2017
Indicator Total Jan-Mar Apr-Jun Jul-Sep Oct-Dec Total Jan-Mar Apr-Jun
Unique clients admitted forheroin
29 16 13 s 11 39 15 12
Unique clients admitted for anyopioid (incl. heroin)
80 22 17 17 21 68 17 20
OASAS: Office of Alcoholism and Substance Abuse Services
1 The number of unique clients admitted per year does not equal the sum of the unique clients admitted each quarter. This is because an individual client can beadmitted to treatment in more than one quarter during the year.
2 Clients may have heroin, other opioids, or any other substance simultaneously recorded as the primary, secondary and tertiary substance of abuse at admission.
s: Data for indicators are suppressed for confidentiality purposes if there are less than 6 clients.
Schuyler County: Naloxone administration reports (Preliminary data as of November, 2017 - subject to change)
2015 2016 2017
Indicator Location Total Jan-Mar Apr-Jun Jul-Sep Oct-Dec Total Jan-Mar Apr-Jun Jul-Sep
Emergency Medical Services (EMS) naloxone administration reports 1,2
Naloxone administration reportby EMS
Schuyler 5 0 0 0 0 0 0 1 0NYS excl. NYC 6,115 1,730 2,009 1,747 1,542 7,028 1,518 1,710 1,702
Law enforcement naloxone administration reports 3
Naloxone administration reportby law enforcement
Schuyler 0 0 0 0 0 0 0 0 1NYS excl. NYC 956 404 402 392 346 1,544 336 443 331
Registered Community Opioid Overdose Prevention (COOP) program naloxone administration reports 3
Naloxone administration reportby registered COOP program
Schuyler 0 0 0 0 0 0 0 0 0NYS excl. NYC 489 255 248 224 176 903 182 239 107
1 County numbers displayed in the table represent only naloxone administration events reported electronically, therefore, actual numbers of events may be higher.
2 EMS reporting may have been affected by a change in documentation systems used by EMS agency/ies serving the area. Counts may decrease until updates to thedata are available in 2018, if applicable.
3 Numbers displayed in the table represent only naloxone administration reports submitted by law enforcement and registered COOP programs to the NYSDOH AIDSInstitute. The actual numbers of naloxone administration events may be higher.
95

Seneca County: Opioid overdoses and rates per 100,000 population (Preliminary data as of November, 2017 - subject to change)
Apr-Jun, 2016 Jul-Sep, 2016 Oct-Dec, 2016 2016 Total Jan-Mar, 2017 Apr-Jun, 2017
Indicator Location NumberCrudeRate Number
CrudeRate Number
CrudeRate Number
CrudeRate Number
CrudeRate Number
CrudeRate
Deaths 1
All opioid overdoses Seneca 1 2.9 1 2.9 1 2.9 3 8.6 0 0.0 0 0.0NYS excl. NYC 501 4.5 476 4.2 506 4.5 1,990 17.7 130 1.2 75 0.7
Heroin overdoses Seneca 0 0.0 0 0.0 0 0.0 0 0.0 0 0.0 0 0.0NYS excl. NYC 207 1.8 202 1.8 179 1.6 798 7.1 51 0.5 30 0.3
Overdoses involvingopioid pain relievers 2
Seneca 1 2.9 1 2.9 1 2.9 3 8.6 0 0.0 0 0.0NYS excl. NYC 388 3.5 371 3.3 439 3.9 1,576 14.0 96 0.9 56 0.5
Outpatient emergency department visits 3
All opioid overdoses Seneca s s 8 23.0 s s 23 66.0 7 20.1 s sNYS excl. NYC 1,772 15.8 1,552 13.8 1,605 14.3 6,675 59.4 1,684 15.0 1,845 16.4
Heroin overdoses Seneca s s s s s s 17 48.8 s s s sNYS excl. NYC 1,282 11.4 1,085 9.6 1,128 10.0 4,784 42.5 1,183 10.5 1,351 12.0
Opioid overdosesexcluding heroin 2
Seneca s s s s 0 0.0 s s s s 0 0.0NYS excl. NYC 490 4.4 467 4.2 477 4.2 1,891 16.8 501 4.5 494 4.4
Hospitalizations 3
All opioid overdoses Seneca s s s s s s s s s s 0 0.0NYS excl. NYC 486 4.3 457 4.1 467 4.2 1,895 16.9 481 4.3 500 4.4
Heroin overdoses Seneca s s s s 0 0.0 s s 0 0.0 0 0.0NYS excl. NYC 196 1.7 197 1.8 173 1.5 778 6.9 179 1.6 207 1.8
Opioid overdosesexcluding heroin 2
Seneca 0 0.0 s s s s s s s s 0 0.0NYS excl. NYC 290 2.6 260 2.3 294 2.6 1,117 9.9 302 2.7 293 2.6
1 Indicators are not mutually exclusive. Decedents and patients may have multiple substances in their system. Thus, overdoses involving heroin and overdosesinvolving opioid pain relievers will not add up to the overdoses involving all opioids.
2 This indicator includes pharmaceutically and illicitly produced opioids such as fentanyl.
3 Indicators generated for hospitalizations and emergency department visits are based on ICD-10-CM codes.
s: Data for indicators related to hospitalizations and emergency departments are suppressed for confidentiality purposes if there are less than 6 discharges.
96

Seneca County: Unique clients admitted to OASAS-certified chemical dependence treatment programs 1,2
(Preliminary data as of October, 2017 - subject to change)
2015 2016 2017
Indicator Total Jan-Mar Apr-Jun Jul-Sep Oct-Dec Total Jan-Mar Apr-Jun
Unique clients admitted forheroin
84 43 35 38 46 132 56 59
Unique clients admitted for anyopioid (incl. heroin)
129 57 51 55 68 189 66 70
OASAS: Office of Alcoholism and Substance Abuse Services
1 The number of unique clients admitted per year does not equal the sum of the unique clients admitted each quarter. This is because an individual client can beadmitted to treatment in more than one quarter during the year.
2 Clients may have heroin, other opioids, or any other substance simultaneously recorded as the primary, secondary and tertiary substance of abuse at admission.
s: Data for indicators are suppressed for confidentiality purposes if there are less than 6 clients.
Seneca County: Naloxone administration reports (Preliminary data as of November, 2017 - subject to change)
2015 2016 2017
Indicator Location Total Jan-Mar Apr-Jun Jul-Sep Oct-Dec Total Jan-Mar Apr-Jun Jul-Sep
Emergency Medical Services (EMS) naloxone administration reports 1,2
Naloxone administration reportby EMS
Seneca 28 5 3 11 8 27 10 6 8NYS excl. NYC 6,115 1,730 2,009 1,747 1,542 7,028 1,518 1,710 1,702
Law enforcement naloxone administration reports 3
Naloxone administration reportby law enforcement
Seneca 11 0 0 4 1 5 1 4 3NYS excl. NYC 956 404 402 392 346 1,544 336 443 331
Registered Community Opioid Overdose Prevention (COOP) program naloxone administration reports 3
Naloxone administration reportby registered COOP program
Seneca 0 0 0 0 2 2 0 0 0NYS excl. NYC 489 255 248 224 176 903 182 239 107
1 County numbers displayed in the table represent only naloxone administration events reported electronically, therefore, actual numbers of events may be higher.
2 EMS reporting may have been affected by a change in documentation systems used by EMS agency/ies serving the area. Counts may decrease until updates to thedata are available in 2018, if applicable.
3 Numbers displayed in the table represent only naloxone administration reports submitted by law enforcement and registered COOP programs to the NYSDOH AIDSInstitute. The actual numbers of naloxone administration events may be higher.
97

Steuben County: Opioid overdoses and rates per 100,000 population (Preliminary data as of November, 2017 - subject to change)
Apr-Jun, 2016 Jul-Sep, 2016 Oct-Dec, 2016 2016 Total Jan-Mar, 2017 Apr-Jun, 2017
Indicator Location NumberCrudeRate Number
CrudeRate Number
CrudeRate Number
CrudeRate Number
CrudeRate Number
CrudeRate
Deaths 1
All opioid overdoses Steuben 0 0.0 5 5.1 6 6.1 16 16.4 0 0.0 1 1.0NYS excl. NYC 501 4.5 476 4.2 506 4.5 1,990 17.7 130 1.2 75 0.7
Heroin overdoses Steuben 0 0.0 2 2.0 2 2.0 5 5.1 0 0.0 1 1.0NYS excl. NYC 207 1.8 202 1.8 179 1.6 798 7.1 51 0.5 30 0.3
Overdoses involvingopioid pain relievers 2
Steuben 0 0.0 5 5.1 6 6.1 16 16.4 0 0.0 0 0.0NYS excl. NYC 388 3.5 371 3.3 439 3.9 1,576 14.0 96 0.9 56 0.5
Outpatient emergency department visits 3
All opioid overdoses Steuben s s 8 8.2 9 9.2 25 25.6 s s 7 7.2NYS excl. NYC 1,772 15.8 1,552 13.8 1,605 14.3 6,675 59.4 1,684 15.0 1,845 16.4
Heroin overdoses Steuben s s s s s s 9 9.2 s s s sNYS excl. NYC 1,282 11.4 1,085 9.6 1,128 10.0 4,784 42.5 1,183 10.5 1,351 12.0
Opioid overdosesexcluding heroin 2
Steuben s s s s 7 7.2 16 16.4 s s s sNYS excl. NYC 490 4.4 467 4.2 477 4.2 1,891 16.8 501 4.5 494 4.4
Hospitalizations 3
All opioid overdoses Steuben s s s s s s 9 9.2 s s s sNYS excl. NYC 486 4.3 457 4.1 467 4.2 1,895 16.9 481 4.3 500 4.4
Heroin overdoses Steuben 0 0.0 s s s s s s s s 0 0.0NYS excl. NYC 196 1.7 197 1.8 173 1.5 778 6.9 179 1.6 207 1.8
Opioid overdosesexcluding heroin 2
Steuben s s 0 0.0 s s 7 7.2 s s s sNYS excl. NYC 290 2.6 260 2.3 294 2.6 1,117 9.9 302 2.7 293 2.6
1 Indicators are not mutually exclusive. Decedents and patients may have multiple substances in their system. Thus, overdoses involving heroin and overdosesinvolving opioid pain relievers will not add up to the overdoses involving all opioids.
2 This indicator includes pharmaceutically and illicitly produced opioids such as fentanyl.
3 Indicators generated for hospitalizations and emergency department visits are based on ICD-10-CM codes.
s: Data for indicators related to hospitalizations and emergency departments are suppressed for confidentiality purposes if there are less than 6 discharges.
98

Steuben County: Unique clients admitted to OASAS-certified chemical dependence treatment programs 1,2
(Preliminary data as of October, 2017 - subject to change)
2015 2016 2017
Indicator Total Jan-Mar Apr-Jun Jul-Sep Oct-Dec Total Jan-Mar Apr-Jun
Unique clients admitted forheroin
143 62 57 58 52 197 59 59
Unique clients admitted for anyopioid (incl. heroin)
346 134 132 125 110 419 140 133
OASAS: Office of Alcoholism and Substance Abuse Services
1 The number of unique clients admitted per year does not equal the sum of the unique clients admitted each quarter. This is because an individual client can beadmitted to treatment in more than one quarter during the year.
2 Clients may have heroin, other opioids, or any other substance simultaneously recorded as the primary, secondary and tertiary substance of abuse at admission.
s: Data for indicators are suppressed for confidentiality purposes if there are less than 6 clients.
Steuben County: Naloxone administration reports (Preliminary data as of November, 2017 - subject to change)
2015 2016 2017
Indicator Location Total Jan-Mar Apr-Jun Jul-Sep Oct-Dec Total Jan-Mar Apr-Jun Jul-Sep
Emergency Medical Services (EMS) naloxone administration reports 1,2
Naloxone administration reportby EMS
Steuben 50 18 10 13 6 47 8 8 6NYS excl. NYC 6,115 1,730 2,009 1,747 1,542 7,028 1,518 1,710 1,702
Law enforcement naloxone administration reports 3
Naloxone administration reportby law enforcement
Steuben 2 1 0 1 3 5 4 3 9NYS excl. NYC 956 404 402 392 346 1,544 336 443 331
Registered Community Opioid Overdose Prevention (COOP) program naloxone administration reports 3
Naloxone administration reportby registered COOP program
Steuben 0 0 0 0 1 1 0 0 0NYS excl. NYC 489 255 248 224 176 903 182 239 107
1 County numbers displayed in the table represent only naloxone administration events reported electronically, therefore, actual numbers of events may be higher.
2 EMS reporting may have been affected by a change in documentation systems used by EMS agency/ies serving the area. Counts may decrease until updates to thedata are available in 2018, if applicable.
3 Numbers displayed in the table represent only naloxone administration reports submitted by law enforcement and registered COOP programs to the NYSDOH AIDSInstitute. The actual numbers of naloxone administration events may be higher.
99
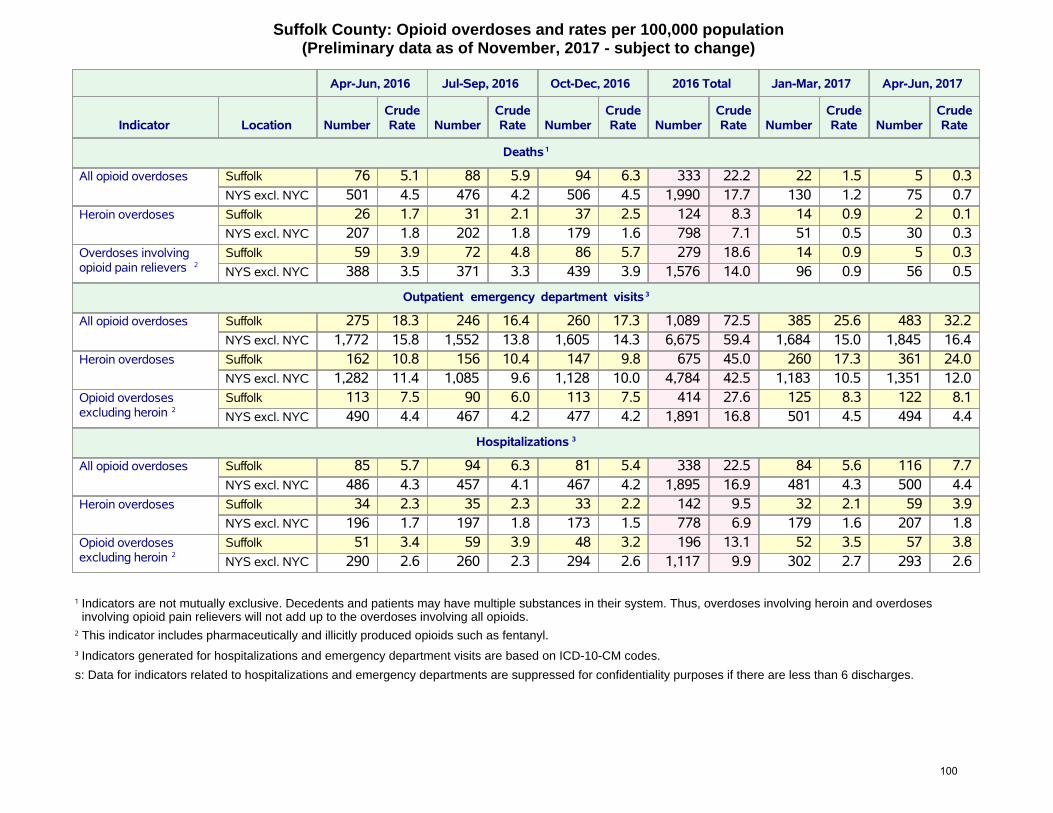
Suffolk County: Opioid overdoses and rates per 100,000 population (Preliminary data as of November, 2017 - subject to change)
Apr-Jun, 2016 Jul-Sep, 2016 Oct-Dec, 2016 2016 Total Jan-Mar, 2017 Apr-Jun, 2017
Indicator Location NumberCrudeRate Number
CrudeRate Number
CrudeRate Number
CrudeRate Number
CrudeRate Number
CrudeRate
Deaths 1
All opioid overdoses Suffolk 76 5.1 88 5.9 94 6.3 333 22.2 22 1.5 5 0.3NYS excl. NYC 501 4.5 476 4.2 506 4.5 1,990 17.7 130 1.2 75 0.7
Heroin overdoses Suffolk 26 1.7 31 2.1 37 2.5 124 8.3 14 0.9 2 0.1NYS excl. NYC 207 1.8 202 1.8 179 1.6 798 7.1 51 0.5 30 0.3
Overdoses involvingopioid pain relievers 2
Suffolk 59 3.9 72 4.8 86 5.7 279 18.6 14 0.9 5 0.3NYS excl. NYC 388 3.5 371 3.3 439 3.9 1,576 14.0 96 0.9 56 0.5
Outpatient emergency department visits 3
All opioid overdoses Suffolk 275 18.3 246 16.4 260 17.3 1,089 72.5 385 25.6 483 32.2NYS excl. NYC 1,772 15.8 1,552 13.8 1,605 14.3 6,675 59.4 1,684 15.0 1,845 16.4
Heroin overdoses Suffolk 162 10.8 156 10.4 147 9.8 675 45.0 260 17.3 361 24.0NYS excl. NYC 1,282 11.4 1,085 9.6 1,128 10.0 4,784 42.5 1,183 10.5 1,351 12.0
Opioid overdosesexcluding heroin 2
Suffolk 113 7.5 90 6.0 113 7.5 414 27.6 125 8.3 122 8.1NYS excl. NYC 490 4.4 467 4.2 477 4.2 1,891 16.8 501 4.5 494 4.4
Hospitalizations 3
All opioid overdoses Suffolk 85 5.7 94 6.3 81 5.4 338 22.5 84 5.6 116 7.7NYS excl. NYC 486 4.3 457 4.1 467 4.2 1,895 16.9 481 4.3 500 4.4
Heroin overdoses Suffolk 34 2.3 35 2.3 33 2.2 142 9.5 32 2.1 59 3.9NYS excl. NYC 196 1.7 197 1.8 173 1.5 778 6.9 179 1.6 207 1.8
Opioid overdosesexcluding heroin 2
Suffolk 51 3.4 59 3.9 48 3.2 196 13.1 52 3.5 57 3.8NYS excl. NYC 290 2.6 260 2.3 294 2.6 1,117 9.9 302 2.7 293 2.6
1 Indicators are not mutually exclusive. Decedents and patients may have multiple substances in their system. Thus, overdoses involving heroin and overdosesinvolving opioid pain relievers will not add up to the overdoses involving all opioids.
2 This indicator includes pharmaceutically and illicitly produced opioids such as fentanyl.
3 Indicators generated for hospitalizations and emergency department visits are based on ICD-10-CM codes.
s: Data for indicators related to hospitalizations and emergency departments are suppressed for confidentiality purposes if there are less than 6 discharges.
100

Suffolk County: Unique clients admitted to OASAS-certified chemical dependence treatment programs 1,2
(Preliminary data as of October, 2017 - subject to change)
2015 2016 2017
Indicator Total Jan-Mar Apr-Jun Jul-Sep Oct-Dec Total Jan-Mar Apr-Jun
Unique clients admitted forheroin
5,003 1,867 1,796 1,693 1,647 5,092 1,760 1,725
Unique clients admitted for anyopioid (incl. heroin)
6,405 2,333 2,204 2,108 2,036 6,470 2,131 2,112
OASAS: Office of Alcoholism and Substance Abuse Services
1 The number of unique clients admitted per year does not equal the sum of the unique clients admitted each quarter. This is because an individual client can beadmitted to treatment in more than one quarter during the year.
2 Clients may have heroin, other opioids, or any other substance simultaneously recorded as the primary, secondary and tertiary substance of abuse at admission.
s: Data for indicators are suppressed for confidentiality purposes if there are less than 6 clients.
Suffolk County: Naloxone administration reports (Preliminary data as of November, 2017 - subject to change)
2015 2016 2017
Indicator Location Total Jan-Mar Apr-Jun Jul-Sep Oct-Dec Total Jan-Mar Apr-Jun Jul-Sep
Emergency Medical Services (EMS) naloxone administration reports 1
Naloxone administration reportby EMS
Suffolk 378 148 98 106 130 482 150 185 123NYS excl. NYC 6,115 1,730 2,009 1,747 1,542 7,028 1,518 1,710 1,702
Law enforcement naloxone administration reports 2
Naloxone administration reportby law enforcement
Suffolk 205 66 64 58 62 250 41 98 59NYS excl. NYC 956 404 402 392 346 1,544 336 443 331
Registered Community Opioid Overdose Prevention (COOP) program naloxone administration reports 2
Naloxone administration reportby registered COOP program
Suffolk 13 5 7 7 19 38 21 47 16NYS excl. NYC 489 255 248 224 176 903 182 239 107
1 Data for naloxone administration reports by EMS in Suffolk County reflect Regional Medical Control Data.2 Numbers displayed in the table represent only naloxone administration reports submitted by law enforcement and registered COOP programs to the NYSDOH AIDS
Institute. The actual numbers of naloxone administration events may be higher.
101

Sullivan County: Opioid overdoses and rates per 100,000 population (Preliminary data as of November, 2017 - subject to change)
Apr-Jun, 2016 Jul-Sep, 2016 Oct-Dec, 2016 2016 Total Jan-Mar, 2017 Apr-Jun, 2017
Indicator Location NumberCrudeRate Number
CrudeRate Number
CrudeRate Number
CrudeRate Number
CrudeRate Number
CrudeRate
Deaths 1
All opioid overdoses Sullivan 3 4.0 6 8.0 1 1.3 16 21.4 5 6.7 1 1.3NYS excl. NYC 501 4.5 476 4.2 506 4.5 1,990 17.7 130 1.2 75 0.7
Heroin overdoses Sullivan 0 0.0 1 1.3 1 1.3 4 5.3 1 1.3 1 1.3NYS excl. NYC 207 1.8 202 1.8 179 1.6 798 7.1 51 0.5 30 0.3
Overdoses involvingopioid pain relievers 2
Sullivan 3 4.0 6 8.0 1 1.3 13 17.4 4 5.3 1 1.3NYS excl. NYC 388 3.5 371 3.3 439 3.9 1,576 14.0 96 0.9 56 0.5
Outpatient emergency department visits 3
All opioid overdoses Sullivan 22 29.4 26 34.7 15 20.0 76 101.5 14 18.7 15 20.0NYS excl. NYC 1,772 15.8 1,552 13.8 1,605 14.3 6,675 59.4 1,684 15.0 1,845 16.4
Heroin overdoses Sullivan 20 26.7 14 18.7 10 13.4 54 72.1 11 14.7 11 14.7NYS excl. NYC 1,282 11.4 1,085 9.6 1,128 10.0 4,784 42.5 1,183 10.5 1,351 12.0
Opioid overdosesexcluding heroin 2
Sullivan s s 12 16.0 s s 22 29.4 s s s sNYS excl. NYC 490 4.4 467 4.2 477 4.2 1,891 16.8 501 4.5 494 4.4
Hospitalizations 3
All opioid overdoses Sullivan 8 10.7 s s 8 10.7 23 30.7 s s s sNYS excl. NYC 486 4.3 457 4.1 467 4.2 1,895 16.9 481 4.3 500 4.4
Heroin overdoses Sullivan s s s s s s 7 9.3 s s s sNYS excl. NYC 196 1.7 197 1.8 173 1.5 778 6.9 179 1.6 207 1.8
Opioid overdosesexcluding heroin 2
Sullivan s s s s s s 16 21.4 s s s sNYS excl. NYC 290 2.6 260 2.3 294 2.6 1,117 9.9 302 2.7 293 2.6
1 Indicators are not mutually exclusive. Decedents and patients may have multiple substances in their system. Thus, overdoses involving heroin and overdosesinvolving opioid pain relievers will not add up to the overdoses involving all opioids.
2 This indicator includes pharmaceutically and illicitly produced opioids such as fentanyl.
3 Indicators generated for hospitalizations and emergency department visits are based on ICD-10-CM codes.
s: Data for indicators related to hospitalizations and emergency departments are suppressed for confidentiality purposes if there are less than 6 discharges.
102
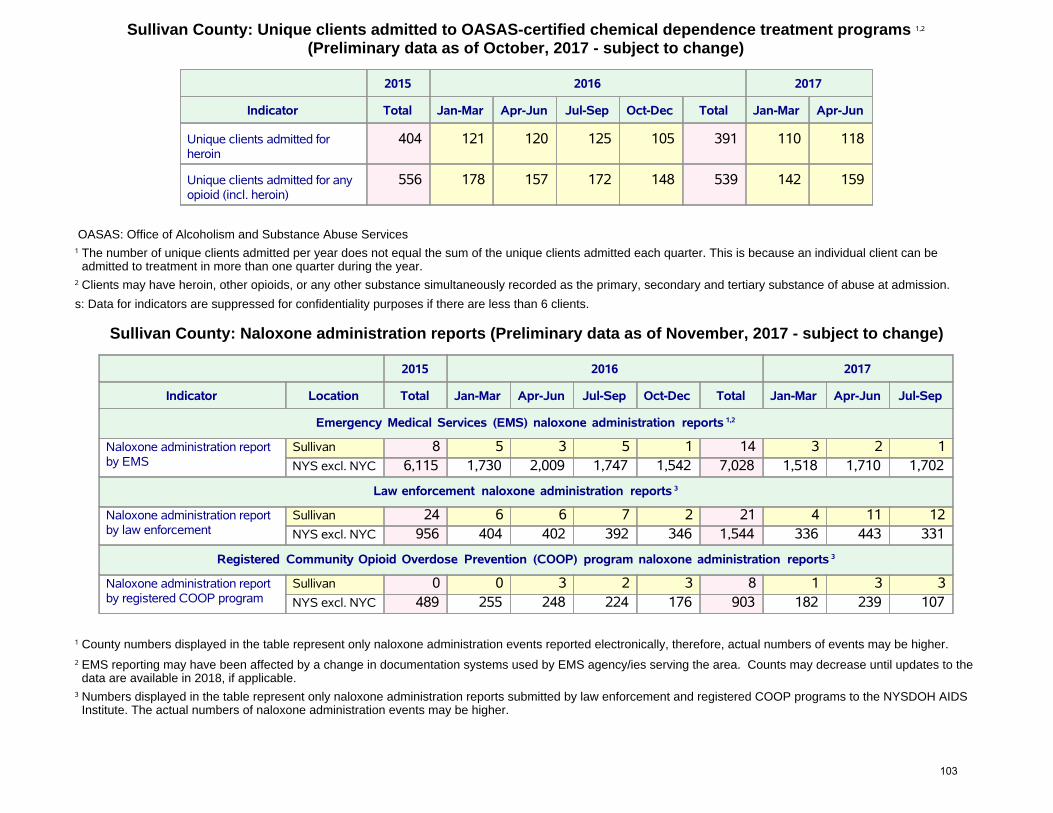
Sullivan County: Unique clients admitted to OASAS-certified chemical dependence treatment programs 1,2
(Preliminary data as of October, 2017 - subject to change)
2015 2016 2017
Indicator Total Jan-Mar Apr-Jun Jul-Sep Oct-Dec Total Jan-Mar Apr-Jun
Unique clients admitted forheroin
404 121 120 125 105 391 110 118
Unique clients admitted for anyopioid (incl. heroin)
556 178 157 172 148 539 142 159
OASAS: Office of Alcoholism and Substance Abuse Services
1 The number of unique clients admitted per year does not equal the sum of the unique clients admitted each quarter. This is because an individual client can beadmitted to treatment in more than one quarter during the year.
2 Clients may have heroin, other opioids, or any other substance simultaneously recorded as the primary, secondary and tertiary substance of abuse at admission.
s: Data for indicators are suppressed for confidentiality purposes if there are less than 6 clients.
Sullivan County: Naloxone administration reports (Preliminary data as of November, 2017 - subject to change)
2015 2016 2017
Indicator Location Total Jan-Mar Apr-Jun Jul-Sep Oct-Dec Total Jan-Mar Apr-Jun Jul-Sep
Emergency Medical Services (EMS) naloxone administration reports 1,2
Naloxone administration reportby EMS
Sullivan 8 5 3 5 1 14 3 2 1NYS excl. NYC 6,115 1,730 2,009 1,747 1,542 7,028 1,518 1,710 1,702
Law enforcement naloxone administration reports 3
Naloxone administration reportby law enforcement
Sullivan 24 6 6 7 2 21 4 11 12NYS excl. NYC 956 404 402 392 346 1,544 336 443 331
Registered Community Opioid Overdose Prevention (COOP) program naloxone administration reports 3
Naloxone administration reportby registered COOP program
Sullivan 0 0 3 2 3 8 1 3 3NYS excl. NYC 489 255 248 224 176 903 182 239 107
1 County numbers displayed in the table represent only naloxone administration events reported electronically, therefore, actual numbers of events may be higher.
2 EMS reporting may have been affected by a change in documentation systems used by EMS agency/ies serving the area. Counts may decrease until updates to thedata are available in 2018, if applicable.
3 Numbers displayed in the table represent only naloxone administration reports submitted by law enforcement and registered COOP programs to the NYSDOH AIDSInstitute. The actual numbers of naloxone administration events may be higher.
103

Tioga County: Opioid overdoses and rates per 100,000 population (Preliminary data as of November, 2017 - subject to change)
Apr-Jun, 2016 Jul-Sep, 2016 Oct-Dec, 2016 2016 Total Jan-Mar, 2017 Apr-Jun, 2017
Indicator Location NumberCrudeRate Number
CrudeRate Number
CrudeRate Number
CrudeRate Number
CrudeRate Number
CrudeRate
Deaths 1
All opioid overdoses Tioga 0 0.0 3 6.1 1 2.0 5 10.1 0 0.0 0 0.0NYS excl. NYC 501 4.5 476 4.2 506 4.5 1,990 17.7 130 1.2 75 0.7
Heroin overdoses Tioga 0 0.0 0 0.0 1 2.0 1 2.0 0 0.0 0 0.0NYS excl. NYC 207 1.8 202 1.8 179 1.6 798 7.1 51 0.5 30 0.3
Overdoses involvingopioid pain relievers 2
Tioga 0 0.0 3 6.1 0 0.0 4 8.1 0 0.0 0 0.0NYS excl. NYC 388 3.5 371 3.3 439 3.9 1,576 14.0 96 0.9 56 0.5
Outpatient emergency department visits 3
All opioid overdoses Tioga s s 7 14.2 7 14.2 19 38.4 s s s sNYS excl. NYC 1,772 15.8 1,552 13.8 1,605 14.3 6,675 59.4 1,684 15.0 1,845 16.4
Heroin overdoses Tioga s s s s 7 14.2 16 32.4 s s s sNYS excl. NYC 1,282 11.4 1,085 9.6 1,128 10.0 4,784 42.5 1,183 10.5 1,351 12.0
Opioid overdosesexcluding heroin 2
Tioga s s s s 0 0.0 s s s s s sNYS excl. NYC 490 4.4 467 4.2 477 4.2 1,891 16.8 501 4.5 494 4.4
Hospitalizations 3
All opioid overdoses Tioga s s 0 0.0 s s 7 14.2 s s 0 0.0NYS excl. NYC 486 4.3 457 4.1 467 4.2 1,895 16.9 481 4.3 500 4.4
Heroin overdoses Tioga 0 0.0 0 0.0 s s s s 0 0.0 0 0.0NYS excl. NYC 196 1.7 197 1.8 173 1.5 778 6.9 179 1.6 207 1.8
Opioid overdosesexcluding heroin 2
Tioga s s 0 0.0 s s s s s s 0 0.0NYS excl. NYC 290 2.6 260 2.3 294 2.6 1,117 9.9 302 2.7 293 2.6
1 Indicators are not mutually exclusive. Decedents and patients may have multiple substances in their system. Thus, overdoses involving heroin and overdosesinvolving opioid pain relievers will not add up to the overdoses involving all opioids.
2 This indicator includes pharmaceutically and illicitly produced opioids such as fentanyl.
3 Indicators generated for hospitalizations and emergency department visits are based on ICD-10-CM codes.
s: Data for indicators related to hospitalizations and emergency departments are suppressed for confidentiality purposes if there are less than 6 discharges.
104

Tioga County: Unique clients admitted to OASAS-certified chemical dependence treatment programs 1,2
(Preliminary data as of October, 2017 - subject to change)
2015 2016 2017
Indicator Total Jan-Mar Apr-Jun Jul-Sep Oct-Dec Total Jan-Mar Apr-Jun
Unique clients admitted forheroin
94 24 46 41 36 127 32 33
Unique clients admitted for anyopioid (incl. heroin)
141 37 64 52 44 168 45 45
OASAS: Office of Alcoholism and Substance Abuse Services
1 The number of unique clients admitted per year does not equal the sum of the unique clients admitted each quarter. This is because an individual client can beadmitted to treatment in more than one quarter during the year.
2 Clients may have heroin, other opioids, or any other substance simultaneously recorded as the primary, secondary and tertiary substance of abuse at admission.
s: Data for indicators are suppressed for confidentiality purposes if there are less than 6 clients.
Tioga County: Naloxone administration reports (Preliminary data as of November, 2017 - subject to change)
2015 2016 2017
Indicator Location Total Jan-Mar Apr-Jun Jul-Sep Oct-Dec Total Jan-Mar Apr-Jun Jul-Sep
Emergency Medical Services (EMS) naloxone administration reports 1,2
Naloxone administration reportby EMS
Tioga 20 8 7 4 5 24 9 5 5NYS excl. NYC 6,115 1,730 2,009 1,747 1,542 7,028 1,518 1,710 1,702
Law enforcement naloxone administration reports 3
Naloxone administration reportby law enforcement
Tioga 1 0 2 3 2 7 3 4 4NYS excl. NYC 956 404 402 392 346 1,544 336 443 331
Registered Community Opioid Overdose Prevention (COOP) program naloxone administration reports 3
Naloxone administration reportby registered COOP program
Tioga 5 5 11 9 1 26 3 1 0NYS excl. NYC 489 255 248 224 176 903 182 239 107
1 County numbers displayed in the table represent only naloxone administration events reported electronically, therefore, actual numbers of events may be higher.
2 EMS reporting may have been affected by a change in documentation systems used by EMS agency/ies serving the area. Counts may decrease until updates to thedata are available in 2018, if applicable.
3 Numbers displayed in the table represent only naloxone administration reports submitted by law enforcement and registered COOP programs to the NYSDOH AIDSInstitute. The actual numbers of naloxone administration events may be higher.
105

Tompkins County: Opioid overdoses and rates per 100,000 population (Preliminary data as of November, 2017 - subject to change)
Apr-Jun, 2016 Jul-Sep, 2016 Oct-Dec, 2016 2016 Total Jan-Mar, 2017 Apr-Jun, 2017
Indicator Location NumberCrudeRate Number
CrudeRate Number
CrudeRate Number
CrudeRate Number
CrudeRate Number
CrudeRate
Deaths 1
All opioid overdoses Tompkins 9 8.6 3 2.9 1 1.0 17 16.2 1 1.0 0 0.0NYS excl. NYC 501 4.5 476 4.2 506 4.5 1,990 17.7 130 1.2 75 0.7
Heroin overdoses Tompkins 0 0.0 0 0.0 0 0.0 2 1.9 0 0.0 0 0.0NYS excl. NYC 207 1.8 202 1.8 179 1.6 798 7.1 51 0.5 30 0.3
Overdoses involvingopioid pain relievers 2
Tompkins 6 5.7 2 1.9 0 0.0 10 9.5 0 0.0 0 0.0NYS excl. NYC 388 3.5 371 3.3 439 3.9 1,576 14.0 96 0.9 56 0.5
Outpatient emergency department visits 3
All opioid overdoses Tompkins 18 17.2 16 15.2 15 14.3 58 55.3 10 9.5 7 6.7NYS excl. NYC 1,772 15.8 1,552 13.8 1,605 14.3 6,675 59.4 1,684 15.0 1,845 16.4
Heroin overdoses Tompkins 15 14.3 11 10.5 11 10.5 45 42.9 s s s sNYS excl. NYC 1,282 11.4 1,085 9.6 1,128 10.0 4,784 42.5 1,183 10.5 1,351 12.0
Opioid overdosesexcluding heroin 2
Tompkins s s s s s s 13 12.4 s s s sNYS excl. NYC 490 4.4 467 4.2 477 4.2 1,891 16.8 501 4.5 494 4.4
Hospitalizations 3
All opioid overdoses Tompkins s s s s s s 16 15.2 8 7.6 s sNYS excl. NYC 486 4.3 457 4.1 467 4.2 1,895 16.9 481 4.3 500 4.4
Heroin overdoses Tompkins s s s s 0 0.0 8 7.6 s s s sNYS excl. NYC 196 1.7 197 1.8 173 1.5 778 6.9 179 1.6 207 1.8
Opioid overdosesexcluding heroin 2
Tompkins s s s s s s 8 7.6 s s 0 0.0NYS excl. NYC 290 2.6 260 2.3 294 2.6 1,117 9.9 302 2.7 293 2.6
1 Indicators are not mutually exclusive. Decedents and patients may have multiple substances in their system. Thus, overdoses involving heroin and overdosesinvolving opioid pain relievers will not add up to the overdoses involving all opioids.
2 This indicator includes pharmaceutically and illicitly produced opioids such as fentanyl.
3 Indicators generated for hospitalizations and emergency department visits are based on ICD-10-CM codes.
s: Data for indicators related to hospitalizations and emergency departments are suppressed for confidentiality purposes if there are less than 6 discharges.
106

Tompkins County: Unique clients admitted to OASAS-certified chemical dependence treatment programs 1,2
(Preliminary data as of October, 2017 - subject to change)
2015 2016 2017
Indicator Total Jan-Mar Apr-Jun Jul-Sep Oct-Dec Total Jan-Mar Apr-Jun
Unique clients admitted forheroin
273 108 133 107 90 321 100 86
Unique clients admitted for anyopioid (incl. heroin)
377 141 159 140 123 416 127 114
OASAS: Office of Alcoholism and Substance Abuse Services
1 The number of unique clients admitted per year does not equal the sum of the unique clients admitted each quarter. This is because an individual client can beadmitted to treatment in more than one quarter during the year.
2 Clients may have heroin, other opioids, or any other substance simultaneously recorded as the primary, secondary and tertiary substance of abuse at admission.
s: Data for indicators are suppressed for confidentiality purposes if there are less than 6 clients.
Tompkins County: Naloxone administration reports (Preliminary data as of November, 2017 - subject to change)
2015 2016 2017
Indicator Location Total Jan-Mar Apr-Jun Jul-Sep Oct-Dec Total Jan-Mar Apr-Jun Jul-Sep
Emergency Medical Services (EMS) naloxone administration reports 1,2
Naloxone administration reportby EMS
Tompkins 80 24 24 15 18 81 28 28 20NYS excl. NYC 6,115 1,730 2,009 1,747 1,542 7,028 1,518 1,710 1,702
Law enforcement naloxone administration reports 3
Naloxone administration reportby law enforcement
Tompkins 5 4 1 3 3 11 5 2 5NYS excl. NYC 956 404 402 392 346 1,544 336 443 331
Registered Community Opioid Overdose Prevention (COOP) program naloxone administration reports 3
Naloxone administration reportby registered COOP program
Tompkins 24 8 32 15 1 56 0 0 0NYS excl. NYC 489 255 248 224 176 903 182 239 107
1 County numbers displayed in the table represent only naloxone administration events reported electronically, therefore, actual numbers of events may be higher.
2 EMS reporting may have been affected by a change in documentation systems used by EMS agency/ies serving the area. Counts may decrease until updates to thedata are available in 2018, if applicable.
3 Numbers displayed in the table represent only naloxone administration reports submitted by law enforcement and registered COOP programs to the NYSDOH AIDSInstitute. The actual numbers of naloxone administration events may be higher.
107

Ulster County: Opioid overdoses and rates per 100,000 population (Preliminary data as of November, 2017 - subject to change)
Apr-Jun, 2016 Jul-Sep, 2016 Oct-Dec, 2016 2016 Total Jan-Mar, 2017 Apr-Jun, 2017
Indicator Location NumberCrudeRate Number
CrudeRate Number
CrudeRate Number
CrudeRate Number
CrudeRate Number
CrudeRate
Deaths 1
All opioid overdoses Ulster 12 6.7 14 7.8 11 6.1 52 28.9 5 2.8 1 0.6NYS excl. NYC 501 4.5 476 4.2 506 4.5 1,990 17.7 130 1.2 75 0.7
Heroin overdoses Ulster 4 2.2 5 2.8 6 3.3 24 13.3 1 0.6 0 0.0NYS excl. NYC 207 1.8 202 1.8 179 1.6 798 7.1 51 0.5 30 0.3
Overdoses involvingopioid pain relievers 2
Ulster 10 5.6 10 5.6 10 5.6 38 21.1 4 2.2 1 0.6NYS excl. NYC 388 3.5 371 3.3 439 3.9 1,576 14.0 96 0.9 56 0.5
Outpatient emergency department visits 3
All opioid overdoses Ulster 22 12.2 29 16.1 31 17.2 107 59.4 27 15.0 23 12.8NYS excl. NYC 1,772 15.8 1,552 13.8 1,605 14.3 6,675 59.4 1,684 15.0 1,845 16.4
Heroin overdoses Ulster 15 8.3 21 11.7 21 11.7 68 37.7 19 10.5 18 10.0NYS excl. NYC 1,282 11.4 1,085 9.6 1,128 10.0 4,784 42.5 1,183 10.5 1,351 12.0
Opioid overdosesexcluding heroin 2
Ulster 7 3.9 8 4.4 10 5.6 39 21.6 8 4.4 s sNYS excl. NYC 490 4.4 467 4.2 477 4.2 1,891 16.8 501 4.5 494 4.4
Hospitalizations 3
All opioid overdoses Ulster 12 6.7 8 4.4 8 4.4 36 20.0 7 3.9 s sNYS excl. NYC 486 4.3 457 4.1 467 4.2 1,895 16.9 481 4.3 500 4.4
Heroin overdoses Ulster s s s s s s 10 5.6 0 0.0 s sNYS excl. NYC 196 1.7 197 1.8 173 1.5 778 6.9 179 1.6 207 1.8
Opioid overdosesexcluding heroin 2
Ulster 9 5.0 s s s s 26 14.4 7 3.9 s sNYS excl. NYC 290 2.6 260 2.3 294 2.6 1,117 9.9 302 2.7 293 2.6
1 Indicators are not mutually exclusive. Decedents and patients may have multiple substances in their system. Thus, overdoses involving heroin and overdosesinvolving opioid pain relievers will not add up to the overdoses involving all opioids.
2 This indicator includes pharmaceutically and illicitly produced opioids such as fentanyl.
3 Indicators generated for hospitalizations and emergency department visits are based on ICD-10-CM codes.
s: Data for indicators related to hospitalizations and emergency departments are suppressed for confidentiality purposes if there are less than 6 discharges.
108

Ulster County: Unique clients admitted to OASAS-certified chemical dependence treatment programs 1,2
(Preliminary data as of October, 2017 - subject to change)
2015 2016 2017
Indicator Total Jan-Mar Apr-Jun Jul-Sep Oct-Dec Total Jan-Mar Apr-Jun
Unique clients admitted forheroin
602 227 252 257 233 734 214 213
Unique clients admitted for anyopioid (incl. heroin)
843 300 328 323 291 949 280 283
OASAS: Office of Alcoholism and Substance Abuse Services
1 The number of unique clients admitted per year does not equal the sum of the unique clients admitted each quarter. This is because an individual client can beadmitted to treatment in more than one quarter during the year.
2 Clients may have heroin, other opioids, or any other substance simultaneously recorded as the primary, secondary and tertiary substance of abuse at admission.
s: Data for indicators are suppressed for confidentiality purposes if there are less than 6 clients.
Ulster County: Naloxone administration reports (Preliminary data as of November, 2017 - subject to change)
2015 2016 2017
Indicator Location Total Jan-Mar Apr-Jun Jul-Sep Oct-Dec Total Jan-Mar Apr-Jun Jul-Sep
Emergency Medical Services (EMS) naloxone administration reports 1,2
Naloxone administration reportby EMS
Ulster 188 34 49 32 32 147 36 49 77NYS excl. NYC 6,115 1,730 2,009 1,747 1,542 7,028 1,518 1,710 1,702
Law enforcement naloxone administration reports 3
Naloxone administration reportby law enforcement
Ulster 25 2 5 24 9 40 8 5 23NYS excl. NYC 956 404 402 392 346 1,544 336 443 331
Registered Community Opioid Overdose Prevention (COOP) program naloxone administration reports 3
Naloxone administration reportby registered COOP program
Ulster 1 0 0 2 0 2 2 1 0NYS excl. NYC 489 255 248 224 176 903 182 239 107
1 County numbers displayed in the table represent only naloxone administration events reported electronically, therefore, actual numbers of events may be higher.
2 EMS reporting may have been affected by a change in documentation systems used by EMS agency/ies serving the area. Counts may decrease until updates to thedata are available in 2018, if applicable.
3 Numbers displayed in the table represent only naloxone administration reports submitted by law enforcement and registered COOP programs to the NYSDOH AIDSInstitute. The actual numbers of naloxone administration events may be higher.
109

Warren County: Opioid overdoses and rates per 100,000 population (Preliminary data as of November, 2017 - subject to change)
Apr-Jun, 2016 Jul-Sep, 2016 Oct-Dec, 2016 2016 Total Jan-Mar, 2017 Apr-Jun, 2017
Indicator Location NumberCrudeRate Number
CrudeRate Number
CrudeRate Number
CrudeRate Number
CrudeRate Number
CrudeRate
Deaths 1
All opioid overdoses Warren 1 1.5 0 0.0 1 1.5 4 6.2 0 0.0 0 0.0NYS excl. NYC 501 4.5 476 4.2 506 4.5 1,990 17.7 130 1.2 75 0.7
Heroin overdoses Warren 1 1.5 0 0.0 0 0.0 3 4.6 0 0.0 0 0.0NYS excl. NYC 207 1.8 202 1.8 179 1.6 798 7.1 51 0.5 30 0.3
Overdoses involvingopioid pain relievers 2
Warren 0 0.0 0 0.0 1 1.5 1 1.5 0 0.0 0 0.0NYS excl. NYC 388 3.5 371 3.3 439 3.9 1,576 14.0 96 0.9 56 0.5
Outpatient emergency department visits 3
All opioid overdoses Warren 8 12.4 10 15.5 s s 27 41.7 9 13.9 7 10.8NYS excl. NYC 1,772 15.8 1,552 13.8 1,605 14.3 6,675 59.4 1,684 15.0 1,845 16.4
Heroin overdoses Warren s s 8 12.4 s s 19 29.4 s s s sNYS excl. NYC 1,282 11.4 1,085 9.6 1,128 10.0 4,784 42.5 1,183 10.5 1,351 12.0
Opioid overdosesexcluding heroin 2
Warren s s s s s s 8 12.4 s s s sNYS excl. NYC 490 4.4 467 4.2 477 4.2 1,891 16.8 501 4.5 494 4.4
Hospitalizations 3
All opioid overdoses Warren s s s s s s 17 26.3 s s 0 0.0NYS excl. NYC 486 4.3 457 4.1 467 4.2 1,895 16.9 481 4.3 500 4.4
Heroin overdoses Warren s s 0 0.0 s s s s s s 0 0.0NYS excl. NYC 196 1.7 197 1.8 173 1.5 778 6.9 179 1.6 207 1.8
Opioid overdosesexcluding heroin 2
Warren s s s s s s 15 23.2 s s 0 0.0NYS excl. NYC 290 2.6 260 2.3 294 2.6 1,117 9.9 302 2.7 293 2.6
1 Indicators are not mutually exclusive. Decedents and patients may have multiple substances in their system. Thus, overdoses involving heroin and overdosesinvolving opioid pain relievers will not add up to the overdoses involving all opioids.
2 This indicator includes pharmaceutically and illicitly produced opioids such as fentanyl.
3 Indicators generated for hospitalizations and emergency department visits are based on ICD-10-CM codes.
s: Data for indicators related to hospitalizations and emergency departments are suppressed for confidentiality purposes if there are less than 6 discharges.
110

Warren County: Unique clients admitted to OASAS-certified chemical dependence treatment programs 1,2
(Preliminary data as of October, 2017 - subject to change)
2015 2016 2017
Indicator Total Jan-Mar Apr-Jun Jul-Sep Oct-Dec Total Jan-Mar Apr-Jun
Unique clients admitted forheroin
159 54 56 57 56 176 53 39
Unique clients admitted for anyopioid (incl. heroin)
247 82 82 82 83 266 81 72
OASAS: Office of Alcoholism and Substance Abuse Services
1 The number of unique clients admitted per year does not equal the sum of the unique clients admitted each quarter. This is because an individual client can beadmitted to treatment in more than one quarter during the year.
2 Clients may have heroin, other opioids, or any other substance simultaneously recorded as the primary, secondary and tertiary substance of abuse at admission.
s: Data for indicators are suppressed for confidentiality purposes if there are less than 6 clients.
Warren County: Naloxone administration reports (Preliminary data as of November, 2017 - subject to change)
2015 2016 2017
Indicator Location Total Jan-Mar Apr-Jun Jul-Sep Oct-Dec Total Jan-Mar Apr-Jun Jul-Sep
Emergency Medical Services (EMS) naloxone administration reports 1,2
Naloxone administration reportby EMS
Warren 59 13 13 21 10 57 11 7 14NYS excl. NYC 6,115 1,730 2,009 1,747 1,542 7,028 1,518 1,710 1,702
Law enforcement naloxone administration reports 3
Naloxone administration reportby law enforcement
Warren 2 0 1 6 2 9 1 1 0NYS excl. NYC 956 404 402 392 346 1,544 336 443 331
Registered Community Opioid Overdose Prevention (COOP) program naloxone administration reports 3
Naloxone administration reportby registered COOP program
Warren 0 1 0 2 1 4 7 0 3NYS excl. NYC 489 255 248 224 176 903 182 239 107
1 County numbers displayed in the table represent only naloxone administration events reported electronically, therefore, actual numbers of events may be higher.
2 EMS reporting may have been affected by a change in documentation systems used by EMS agency/ies serving the area. Counts may decrease until updates to thedata are available in 2018, if applicable.
3 Numbers displayed in the table represent only naloxone administration reports submitted by law enforcement and registered COOP programs to the NYSDOH AIDSInstitute. The actual numbers of naloxone administration events may be higher.
111
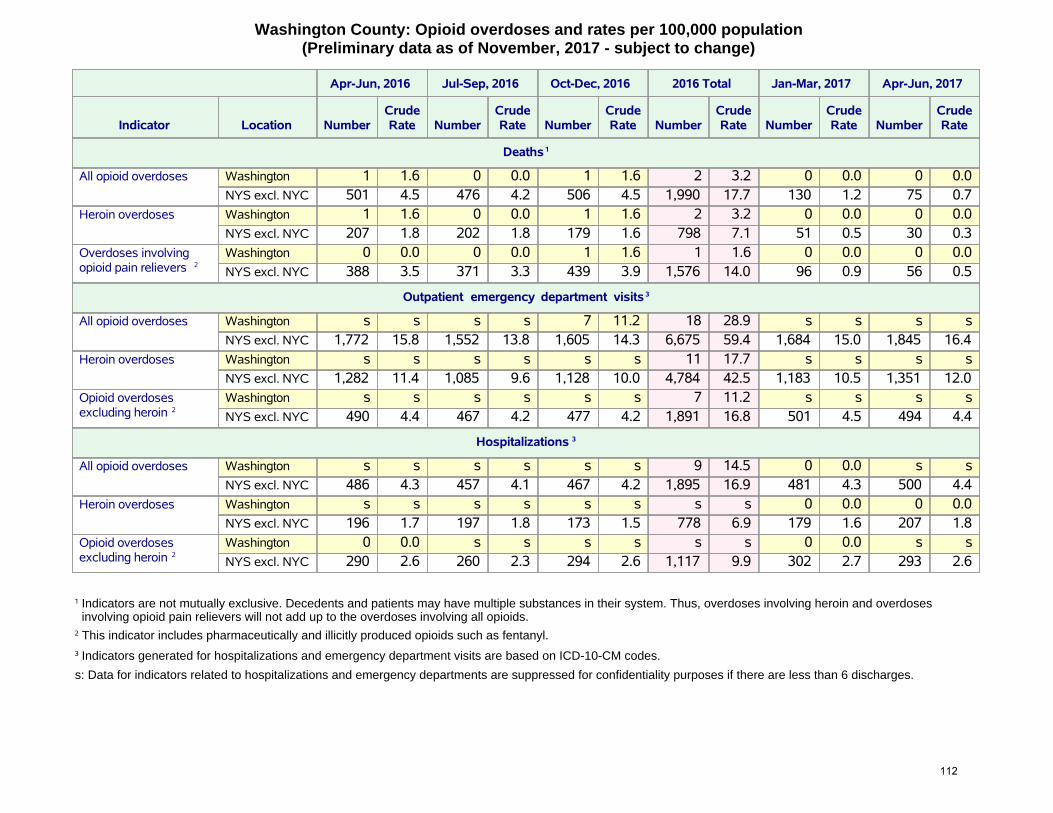
Washington County: Opioid overdoses and rates per 100,000 population (Preliminary data as of November, 2017 - subject to change)
Apr-Jun, 2016 Jul-Sep, 2016 Oct-Dec, 2016 2016 Total Jan-Mar, 2017 Apr-Jun, 2017
Indicator Location NumberCrudeRate Number
CrudeRate Number
CrudeRate Number
CrudeRate Number
CrudeRate Number
CrudeRate
Deaths 1
All opioid overdoses Washington 1 1.6 0 0.0 1 1.6 2 3.2 0 0.0 0 0.0NYS excl. NYC 501 4.5 476 4.2 506 4.5 1,990 17.7 130 1.2 75 0.7
Heroin overdoses Washington 1 1.6 0 0.0 1 1.6 2 3.2 0 0.0 0 0.0NYS excl. NYC 207 1.8 202 1.8 179 1.6 798 7.1 51 0.5 30 0.3
Overdoses involvingopioid pain relievers 2
Washington 0 0.0 0 0.0 1 1.6 1 1.6 0 0.0 0 0.0NYS excl. NYC 388 3.5 371 3.3 439 3.9 1,576 14.0 96 0.9 56 0.5
Outpatient emergency department visits 3
All opioid overdoses Washington s s s s 7 11.2 18 28.9 s s s sNYS excl. NYC 1,772 15.8 1,552 13.8 1,605 14.3 6,675 59.4 1,684 15.0 1,845 16.4
Heroin overdoses Washington s s s s s s 11 17.7 s s s sNYS excl. NYC 1,282 11.4 1,085 9.6 1,128 10.0 4,784 42.5 1,183 10.5 1,351 12.0
Opioid overdosesexcluding heroin 2
Washington s s s s s s 7 11.2 s s s sNYS excl. NYC 490 4.4 467 4.2 477 4.2 1,891 16.8 501 4.5 494 4.4
Hospitalizations 3
All opioid overdoses Washington s s s s s s 9 14.5 0 0.0 s sNYS excl. NYC 486 4.3 457 4.1 467 4.2 1,895 16.9 481 4.3 500 4.4
Heroin overdoses Washington s s s s s s s s 0 0.0 0 0.0NYS excl. NYC 196 1.7 197 1.8 173 1.5 778 6.9 179 1.6 207 1.8
Opioid overdosesexcluding heroin 2
Washington 0 0.0 s s s s s s 0 0.0 s sNYS excl. NYC 290 2.6 260 2.3 294 2.6 1,117 9.9 302 2.7 293 2.6
1 Indicators are not mutually exclusive. Decedents and patients may have multiple substances in their system. Thus, overdoses involving heroin and overdosesinvolving opioid pain relievers will not add up to the overdoses involving all opioids.
2 This indicator includes pharmaceutically and illicitly produced opioids such as fentanyl.
3 Indicators generated for hospitalizations and emergency department visits are based on ICD-10-CM codes.
s: Data for indicators related to hospitalizations and emergency departments are suppressed for confidentiality purposes if there are less than 6 discharges.
112

Washington County: Unique clients admitted to OASAS-certified chemical dependence treatment programs 1,2
(Preliminary data as of October, 2017 - subject to change)
2015 2016 2017
Indicator Total Jan-Mar Apr-Jun Jul-Sep Oct-Dec Total Jan-Mar Apr-Jun
Unique clients admitted forheroin
140 55 54 64 48 181 55 45
Unique clients admitted for anyopioid (incl. heroin)
217 84 72 88 66 262 80 68
OASAS: Office of Alcoholism and Substance Abuse Services
1 The number of unique clients admitted per year does not equal the sum of the unique clients admitted each quarter. This is because an individual client can beadmitted to treatment in more than one quarter during the year.
2 Clients may have heroin, other opioids, or any other substance simultaneously recorded as the primary, secondary and tertiary substance of abuse at admission.
s: Data for indicators are suppressed for confidentiality purposes if there are less than 6 clients.
Washington County: Naloxone administration reports (Preliminary data as of November, 2017 - subject to change)
2015 2016 2017
Indicator Location Total Jan-Mar Apr-Jun Jul-Sep Oct-Dec Total Jan-Mar Apr-Jun Jul-Sep
Emergency Medical Services (EMS) naloxone administration reports 1,2
Naloxone administration reportby EMS
Washington 44 10 10 8 9 37 11 3 6NYS excl. NYC 6,115 1,730 2,009 1,747 1,542 7,028 1,518 1,710 1,702
Law enforcement naloxone administration reports 3
Naloxone administration reportby law enforcement
Washington 4 1 3 1 0 5 4 0 2NYS excl. NYC 956 404 402 392 346 1,544 336 443 331
Registered Community Opioid Overdose Prevention (COOP) program naloxone administration reports 3
Naloxone administration reportby registered COOP program
Washington 3 0 2 0 1 3 4 0 0NYS excl. NYC 489 255 248 224 176 903 182 239 107
1 County numbers displayed in the table represent only naloxone administration events reported electronically, therefore, actual numbers of events may be higher.
2 EMS reporting may have been affected by a change in documentation systems used by EMS agency/ies serving the area. Counts may decrease until updates to thedata are available in 2018, if applicable.
3 Numbers displayed in the table represent only naloxone administration reports submitted by law enforcement and registered COOP programs to the NYSDOH AIDSInstitute. The actual numbers of naloxone administration events may be higher.
113

Wayne County: Opioid overdoses and rates per 100,000 population (Preliminary data as of November, 2017 - subject to change)
Apr-Jun, 2016 Jul-Sep, 2016 Oct-Dec, 2016 2016 Total Jan-Mar, 2017 Apr-Jun, 2017
Indicator Location NumberCrudeRate Number
CrudeRate Number
CrudeRate Number
CrudeRate Number
CrudeRate Number
CrudeRate
Deaths 1
All opioid overdoses Wayne 1 1.1 3 3.3 1 1.1 7 7.7 0 0.0 0 0.0NYS excl. NYC 501 4.5 476 4.2 506 4.5 1,990 17.7 130 1.2 75 0.7
Heroin overdoses Wayne 0 0.0 0 0.0 0 0.0 0 0.0 0 0.0 0 0.0NYS excl. NYC 207 1.8 202 1.8 179 1.6 798 7.1 51 0.5 30 0.3
Overdoses involvingopioid pain relievers 2
Wayne 1 1.1 3 3.3 1 1.1 7 7.7 0 0.0 0 0.0NYS excl. NYC 388 3.5 371 3.3 439 3.9 1,576 14.0 96 0.9 56 0.5
Outpatient emergency department visits 3
All opioid overdoses Wayne 19 20.8 10 10.9 17 18.6 58 63.4 10 10.9 10 10.9NYS excl. NYC 1,772 15.8 1,552 13.8 1,605 14.3 6,675 59.4 1,684 15.0 1,845 16.4
Heroin overdoses Wayne 16 17.5 s s 12 13.1 42 45.9 8 8.7 8 8.7NYS excl. NYC 1,282 11.4 1,085 9.6 1,128 10.0 4,784 42.5 1,183 10.5 1,351 12.0
Opioid overdosesexcluding heroin 2
Wayne s s s s s s 16 17.5 s s s sNYS excl. NYC 490 4.4 467 4.2 477 4.2 1,891 16.8 501 4.5 494 4.4
Hospitalizations 3
All opioid overdoses Wayne s s 7 7.7 s s 19 20.8 s s s sNYS excl. NYC 486 4.3 457 4.1 467 4.2 1,895 16.9 481 4.3 500 4.4
Heroin overdoses Wayne s s s s s s s s s s s sNYS excl. NYC 196 1.7 197 1.8 173 1.5 778 6.9 179 1.6 207 1.8
Opioid overdosesexcluding heroin 2
Wayne s s s s s s 13 14.2 s s s sNYS excl. NYC 290 2.6 260 2.3 294 2.6 1,117 9.9 302 2.7 293 2.6
1 Indicators are not mutually exclusive. Decedents and patients may have multiple substances in their system. Thus, overdoses involving heroin and overdosesinvolving opioid pain relievers will not add up to the overdoses involving all opioids.
2 This indicator includes pharmaceutically and illicitly produced opioids such as fentanyl.
3 Indicators generated for hospitalizations and emergency department visits are based on ICD-10-CM codes.
s: Data for indicators related to hospitalizations and emergency departments are suppressed for confidentiality purposes if there are less than 6 discharges.
114
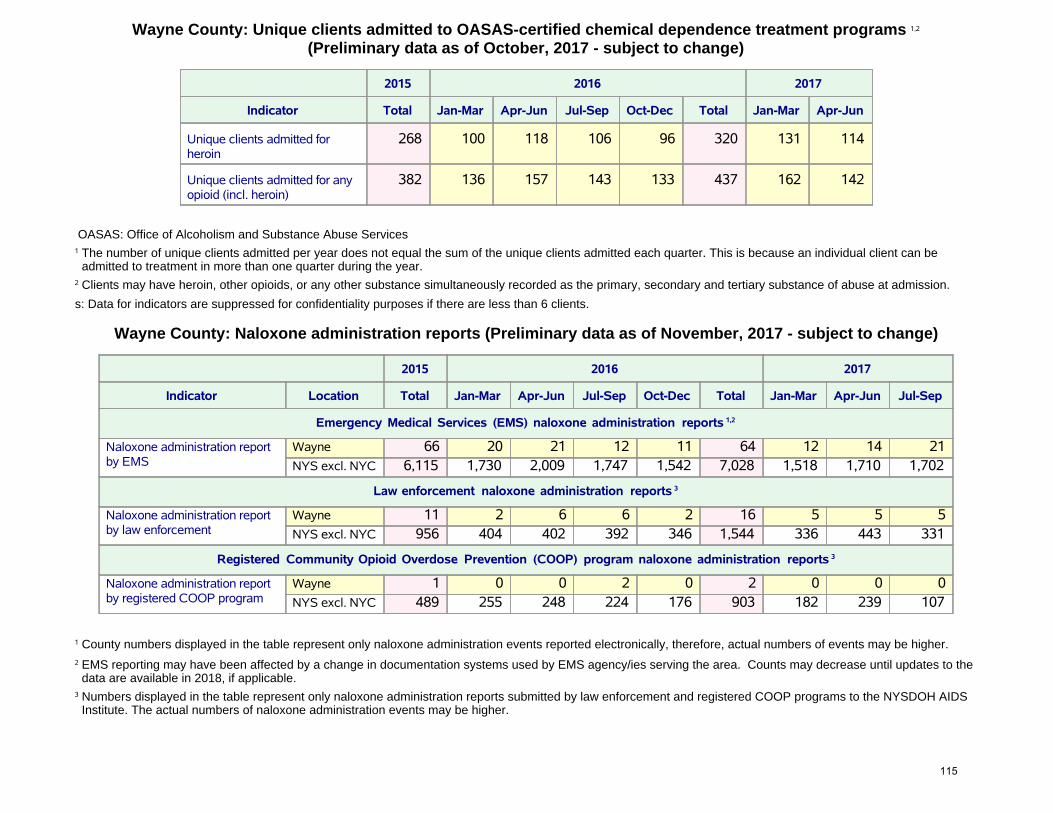
Wayne County: Unique clients admitted to OASAS-certified chemical dependence treatment programs 1,2
(Preliminary data as of October, 2017 - subject to change)
2015 2016 2017
Indicator Total Jan-Mar Apr-Jun Jul-Sep Oct-Dec Total Jan-Mar Apr-Jun
Unique clients admitted forheroin
268 100 118 106 96 320 131 114
Unique clients admitted for anyopioid (incl. heroin)
382 136 157 143 133 437 162 142
OASAS: Office of Alcoholism and Substance Abuse Services
1 The number of unique clients admitted per year does not equal the sum of the unique clients admitted each quarter. This is because an individual client can beadmitted to treatment in more than one quarter during the year.
2 Clients may have heroin, other opioids, or any other substance simultaneously recorded as the primary, secondary and tertiary substance of abuse at admission.
s: Data for indicators are suppressed for confidentiality purposes if there are less than 6 clients.
Wayne County: Naloxone administration reports (Preliminary data as of November, 2017 - subject to change)
2015 2016 2017
Indicator Location Total Jan-Mar Apr-Jun Jul-Sep Oct-Dec Total Jan-Mar Apr-Jun Jul-Sep
Emergency Medical Services (EMS) naloxone administration reports 1,2
Naloxone administration reportby EMS
Wayne 66 20 21 12 11 64 12 14 21NYS excl. NYC 6,115 1,730 2,009 1,747 1,542 7,028 1,518 1,710 1,702
Law enforcement naloxone administration reports 3
Naloxone administration reportby law enforcement
Wayne 11 2 6 6 2 16 5 5 5NYS excl. NYC 956 404 402 392 346 1,544 336 443 331
Registered Community Opioid Overdose Prevention (COOP) program naloxone administration reports 3
Naloxone administration reportby registered COOP program
Wayne 1 0 0 2 0 2 0 0 0NYS excl. NYC 489 255 248 224 176 903 182 239 107
1 County numbers displayed in the table represent only naloxone administration events reported electronically, therefore, actual numbers of events may be higher.
2 EMS reporting may have been affected by a change in documentation systems used by EMS agency/ies serving the area. Counts may decrease until updates to thedata are available in 2018, if applicable.
3 Numbers displayed in the table represent only naloxone administration reports submitted by law enforcement and registered COOP programs to the NYSDOH AIDSInstitute. The actual numbers of naloxone administration events may be higher.
115

Westchester County: Opioid overdoses and rates per 100,000 population (Preliminary data as of November, 2017 - subject to change)
Apr-Jun, 2016 Jul-Sep, 2016 Oct-Dec, 2016 2016 Total Jan-Mar, 2017 Apr-Jun, 2017
Indicator Location NumberCrudeRate Number
CrudeRate Number
CrudeRate Number
CrudeRate Number
CrudeRate Number
CrudeRate
Deaths 1
All opioid overdoses Westchester 23 2.4 31 3.2 40 4.1 124 12.7 6 0.6 4 0.4NYS excl. NYC 501 4.5 476 4.2 506 4.5 1,990 17.7 130 1.2 75 0.7
Heroin overdoses Westchester 13 1.3 19 1.9 15 1.5 65 6.7 3 0.3 3 0.3NYS excl. NYC 207 1.8 202 1.8 179 1.6 798 7.1 51 0.5 30 0.3
Overdoses involvingopioid pain relievers 2
Westchester 17 1.7 21 2.2 33 3.4 89 9.1 3 0.3 3 0.3NYS excl. NYC 388 3.5 371 3.3 439 3.9 1,576 14.0 96 0.9 56 0.5
Outpatient emergency department visits 3
All opioid overdoses Westchester 55 5.6 48 4.9 45 4.6 180 18.4 48 4.9 56 5.7NYS excl. NYC 1,772 15.8 1,552 13.8 1,605 14.3 6,675 59.4 1,684 15.0 1,845 16.4
Heroin overdoses Westchester 30 3.1 32 3.3 34 3.5 114 11.7 32 3.3 33 3.4NYS excl. NYC 1,282 11.4 1,085 9.6 1,128 10.0 4,784 42.5 1,183 10.5 1,351 12.0
Opioid overdosesexcluding heroin 2
Westchester 25 2.6 16 1.6 11 1.1 66 6.8 16 1.6 23 2.4NYS excl. NYC 490 4.4 467 4.2 477 4.2 1,891 16.8 501 4.5 494 4.4
Hospitalizations 3
All opioid overdoses Westchester 19 1.9 28 2.9 15 1.5 80 8.2 15 1.5 30 3.1NYS excl. NYC 486 4.3 457 4.1 467 4.2 1,895 16.9 481 4.3 500 4.4
Heroin overdoses Westchester s s 12 1.2 s s 31 3.2 s s 11 1.1NYS excl. NYC 196 1.7 197 1.8 173 1.5 778 6.9 179 1.6 207 1.8
Opioid overdosesexcluding heroin 2
Westchester 15 1.5 16 1.6 10 1.0 49 5.0 11 1.1 19 1.9NYS excl. NYC 290 2.6 260 2.3 294 2.6 1,117 9.9 302 2.7 293 2.6
1 Indicators are not mutually exclusive. Decedents and patients may have multiple substances in their system. Thus, overdoses involving heroin and overdosesinvolving opioid pain relievers will not add up to the overdoses involving all opioids.
2 This indicator includes pharmaceutically and illicitly produced opioids such as fentanyl.
3 Indicators generated for hospitalizations and emergency department visits are based on ICD-10-CM codes.
s: Data for indicators related to hospitalizations and emergency departments are suppressed for confidentiality purposes if there are less than 6 discharges.
116

Westchester County: Unique clients admitted to OASAS-certified chemical dependence treatment programs 1,2
(Preliminary data as of October, 2017 - subject to change)
2015 2016 2017
Indicator Total Jan-Mar Apr-Jun Jul-Sep Oct-Dec Total Jan-Mar Apr-Jun
Unique clients admitted forheroin
1,742 634 609 566 554 1,745 600 611
Unique clients admitted for anyopioid (incl. heroin)
2,159 763 741 700 656 2,162 731 718
OASAS: Office of Alcoholism and Substance Abuse Services
1 The number of unique clients admitted per year does not equal the sum of the unique clients admitted each quarter. This is because an individual client can beadmitted to treatment in more than one quarter during the year.
2 Clients may have heroin, other opioids, or any other substance simultaneously recorded as the primary, secondary and tertiary substance of abuse at admission.
s: Data for indicators are suppressed for confidentiality purposes if there are less than 6 clients.
Westchester County: Naloxone administration reports (Preliminary data as of November, 2017 - subject to change)
2015 2016 2017
Indicator Location Total Jan-Mar Apr-Jun Jul-Sep Oct-Dec Total Jan-Mar Apr-Jun Jul-Sep
Emergency Medical Services (EMS) naloxone administration reports 1,2
Naloxone administration reportby EMS
Westchester 378 81 122 101 102 406 96 58 49NYS excl. NYC 6,115 1,730 2,009 1,747 1,542 7,028 1,518 1,710 1,702
Law enforcement naloxone administration reports 3
Naloxone administration reportby law enforcement
Westchester 44 18 31 34 26 109 11 26 15NYS excl. NYC 956 404 402 392 346 1,544 336 443 331
Registered Community Opioid Overdose Prevention (COOP) program naloxone administration reports 3
Naloxone administration reportby registered COOP program
Westchester 2 0 1 2 1 4 0 1 1NYS excl. NYC 489 255 248 224 176 903 182 239 107
1 County numbers displayed in the table represent only naloxone administration events reported electronically, therefore, actual numbers of events may be higher.
2 EMS reporting may have been affected by a change in documentation systems used by EMS agency/ies serving the area. Counts may decrease until updates to thedata are available in 2018, if applicable.
3 Numbers displayed in the table represent only naloxone administration reports submitted by law enforcement and registered COOP programs to the NYSDOH AIDSInstitute. The actual numbers of naloxone administration events may be higher.
117

Wyoming County: Opioid overdoses and rates per 100,000 population (Preliminary data as of November, 2017 - subject to change)
Apr-Jun, 2016 Jul-Sep, 2016 Oct-Dec, 2016 2016 Total Jan-Mar, 2017 Apr-Jun, 2017
Indicator Location NumberCrudeRate Number
CrudeRate Number
CrudeRate Number
CrudeRate Number
CrudeRate Number
CrudeRate
Deaths 1
All opioid overdoses Wyoming 2 4.9 0 0.0 3 7.3 7 17.1 1 2.4 0 0.0NYS excl. NYC 501 4.5 476 4.2 506 4.5 1,990 17.7 130 1.2 75 0.7
Heroin overdoses Wyoming 0 0.0 0 0.0 1 2.4 2 4.9 1 2.4 0 0.0NYS excl. NYC 207 1.8 202 1.8 179 1.6 798 7.1 51 0.5 30 0.3
Overdoses involvingopioid pain relievers 2
Wyoming 2 4.9 0 0.0 3 7.3 6 14.6 1 2.4 0 0.0NYS excl. NYC 388 3.5 371 3.3 439 3.9 1,576 14.0 96 0.9 56 0.5
Outpatient emergency department visits 3
All opioid overdoses Wyoming s s s s 7 17.1 23 56.1 7 17.1 s sNYS excl. NYC 1,772 15.8 1,552 13.8 1,605 14.3 6,675 59.4 1,684 15.0 1,845 16.4
Heroin overdoses Wyoming s s s s 7 17.1 18 43.9 s s s sNYS excl. NYC 1,282 11.4 1,085 9.6 1,128 10.0 4,784 42.5 1,183 10.5 1,351 12.0
Opioid overdosesexcluding heroin 2
Wyoming s s s s 0 0.0 s s s s s sNYS excl. NYC 490 4.4 467 4.2 477 4.2 1,891 16.8 501 4.5 494 4.4
Hospitalizations 3
All opioid overdoses Wyoming s s 0 0.0 s s 11 26.8 s s s sNYS excl. NYC 486 4.3 457 4.1 467 4.2 1,895 16.9 481 4.3 500 4.4
Heroin overdoses Wyoming s s 0 0.0 s s 8 19.5 s s 0 0.0NYS excl. NYC 196 1.7 197 1.8 173 1.5 778 6.9 179 1.6 207 1.8
Opioid overdosesexcluding heroin 2
Wyoming s s 0 0.0 s s s s 0 0.0 s sNYS excl. NYC 290 2.6 260 2.3 294 2.6 1,117 9.9 302 2.7 293 2.6
1 Indicators are not mutually exclusive. Decedents and patients may have multiple substances in their system. Thus, overdoses involving heroin and overdosesinvolving opioid pain relievers will not add up to the overdoses involving all opioids.
2 This indicator includes pharmaceutically and illicitly produced opioids such as fentanyl.
3 Indicators generated for hospitalizations and emergency department visits are based on ICD-10-CM codes.
s: Data for indicators related to hospitalizations and emergency departments are suppressed for confidentiality purposes if there are less than 6 discharges.
118

Wyoming County: Unique clients admitted to OASAS-certified chemical dependence treatment programs 1,2
(Preliminary data as of October, 2017 - subject to change)
2015 2016 2017
Indicator Total Jan-Mar Apr-Jun Jul-Sep Oct-Dec Total Jan-Mar Apr-Jun
Unique clients admitted forheroin
82 21 31 33 35 99 35 30
Unique clients admitted for anyopioid (incl. heroin)
131 45 44 42 50 149 51 45
OASAS: Office of Alcoholism and Substance Abuse Services
1 The number of unique clients admitted per year does not equal the sum of the unique clients admitted each quarter. This is because an individual client can beadmitted to treatment in more than one quarter during the year.
2 Clients may have heroin, other opioids, or any other substance simultaneously recorded as the primary, secondary and tertiary substance of abuse at admission.
s: Data for indicators are suppressed for confidentiality purposes if there are less than 6 clients.
Wyoming County: Naloxone administration reports (Preliminary data as of November, 2017 - subject to change)
2015 2016 2017
Indicator Location Total Jan-Mar Apr-Jun Jul-Sep Oct-Dec Total Jan-Mar Apr-Jun Jul-Sep
Emergency Medical Services (EMS) naloxone administration reports 1,2
Naloxone administration reportby EMS
Wyoming 31 6 5 7 5 23 7 3 4NYS excl. NYC 6,115 1,730 2,009 1,747 1,542 7,028 1,518 1,710 1,702
Law enforcement naloxone administration reports 3
Naloxone administration reportby law enforcement
Wyoming 2 0 2 2 2 6 2 1 3NYS excl. NYC 956 404 402 392 346 1,544 336 443 331
Registered Community Opioid Overdose Prevention (COOP) program naloxone administration reports 3
Naloxone administration reportby registered COOP program
Wyoming 4 1 0 0 0 1 0 0 0NYS excl. NYC 489 255 248 224 176 903 182 239 107
1 County numbers displayed in the table represent only naloxone administration events reported electronically, therefore, actual numbers of events may be higher.
2 EMS reporting may have been affected by a change in documentation systems used by EMS agency/ies serving the area. Counts may decrease until updates to thedata are available in 2018, if applicable.
3 Numbers displayed in the table represent only naloxone administration reports submitted by law enforcement and registered COOP programs to the NYSDOH AIDSInstitute. The actual numbers of naloxone administration events may be higher.
119

Yates County: Opioid overdoses and rates per 100,000 population (Preliminary data as of November, 2017 - subject to change)
Apr-Jun, 2016 Jul-Sep, 2016 Oct-Dec, 2016 2016 Total Jan-Mar, 2017 Apr-Jun, 2017
Indicator Location NumberCrudeRate Number
CrudeRate Number
CrudeRate Number
CrudeRate Number
CrudeRate Number
CrudeRate
Deaths 1
All opioid overdoses Yates 2 8.0 0 0.0 0 0.0 3 12.0 0 0.0 0 0.0NYS excl. NYC 501 4.5 476 4.2 506 4.5 1,990 17.7 130 1.2 75 0.7
Heroin overdoses Yates 0 0.0 0 0.0 0 0.0 0 0.0 0 0.0 0 0.0NYS excl. NYC 207 1.8 202 1.8 179 1.6 798 7.1 51 0.5 30 0.3
Overdoses involvingopioid pain relievers 2
Yates 2 8.0 0 0.0 0 0.0 3 12.0 0 0.0 0 0.0NYS excl. NYC 388 3.5 371 3.3 439 3.9 1,576 14.0 96 0.9 56 0.5
Outpatient emergency department visits 3
All opioid overdoses Yates 7 27.9 s s s s 22 87.8 s s s sNYS excl. NYC 1,772 15.8 1,552 13.8 1,605 14.3 6,675 59.4 1,684 15.0 1,845 16.4
Heroin overdoses Yates s s s s s s 16 63.9 s s s sNYS excl. NYC 1,282 11.4 1,085 9.6 1,128 10.0 4,784 42.5 1,183 10.5 1,351 12.0
Opioid overdosesexcluding heroin 2
Yates s s s s 0 0.0 s s 0 0.0 0 0.0NYS excl. NYC 490 4.4 467 4.2 477 4.2 1,891 16.8 501 4.5 494 4.4
Hospitalizations 3
All opioid overdoses Yates s s s s s s s s 0 0.0 s sNYS excl. NYC 486 4.3 457 4.1 467 4.2 1,895 16.9 481 4.3 500 4.4
Heroin overdoses Yates s s s s 0 0.0 s s 0 0.0 s sNYS excl. NYC 196 1.7 197 1.8 173 1.5 778 6.9 179 1.6 207 1.8
Opioid overdosesexcluding heroin 2
Yates s s 0 0.0 s s s s 0 0.0 s sNYS excl. NYC 290 2.6 260 2.3 294 2.6 1,117 9.9 302 2.7 293 2.6
1 Indicators are not mutually exclusive. Decedents and patients may have multiple substances in their system. Thus, overdoses involving heroin and overdosesinvolving opioid pain relievers will not add up to the overdoses involving all opioids.
2 This indicator includes pharmaceutically and illicitly produced opioids such as fentanyl.
3 Indicators generated for hospitalizations and emergency department visits are based on ICD-10-CM codes.
s: Data for indicators related to hospitalizations and emergency departments are suppressed for confidentiality purposes if there are less than 6 discharges.
120

Yates County: Unique clients admitted to OASAS-certified chemical dependence treatment programs 1,2
(Preliminary data as of October, 2017 - subject to change)
2015 2016 2017
Indicator Total Jan-Mar Apr-Jun Jul-Sep Oct-Dec Total Jan-Mar Apr-Jun
Unique clients admitted forheroin
70 34 26 31 25 92 24 24
Unique clients admitted for anyopioid (incl. heroin)
119 41 37 41 35 126 36 35
OASAS: Office of Alcoholism and Substance Abuse Services
1 The number of unique clients admitted per year does not equal the sum of the unique clients admitted each quarter. This is because an individual client can beadmitted to treatment in more than one quarter during the year.
2 Clients may have heroin, other opioids, or any other substance simultaneously recorded as the primary, secondary and tertiary substance of abuse at admission.
s: Data for indicators are suppressed for confidentiality purposes if there are less than 6 clients.
Yates County: Naloxone administration reports (Preliminary data as of November, 2017 - subject to change)
2015 2016 2017
Indicator Location Total Jan-Mar Apr-Jun Jul-Sep Oct-Dec Total Jan-Mar Apr-Jun Jul-Sep
Emergency Medical Services (EMS) naloxone administration reports 1,2
Naloxone administration reportby EMS
Yates 16 2 8 4 4 18 1 5 3NYS excl. NYC 6,115 1,730 2,009 1,747 1,542 7,028 1,518 1,710 1,702
Law enforcement naloxone administration reports 3
Naloxone administration reportby law enforcement
Yates 7 1 0 1 0 2 0 1 0NYS excl. NYC 956 404 402 392 346 1,544 336 443 331
Registered Community Opioid Overdose Prevention (COOP) program naloxone administration reports 3
Naloxone administration reportby registered COOP program
Yates 0 0 0 0 0 0 0 1 0NYS excl. NYC 489 255 248 224 176 903 182 239 107
1 County numbers displayed in the table represent only naloxone administration events reported electronically, therefore, actual numbers of events may be higher.
2 EMS reporting may have been affected by a change in documentation systems used by EMS agency/ies serving the area. Counts may decrease until updates to thedata are available in 2018, if applicable.
3 Numbers displayed in the table represent only naloxone administration reports submitted by law enforcement and registered COOP programs to the NYSDOH AIDSInstitute. The actual numbers of naloxone administration events may be higher.
121
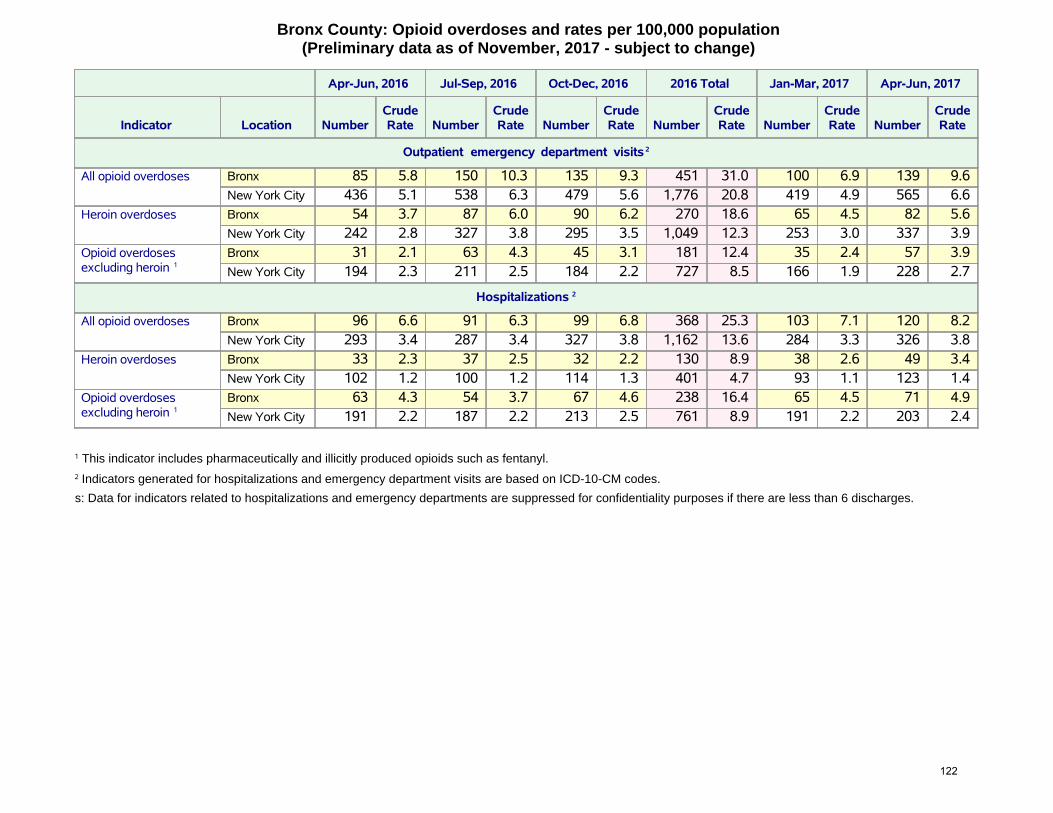
Bronx County: Opioid overdoses and rates per 100,000 population (Preliminary data as of November, 2017 - subject to change)
Apr-Jun, 2016 Jul-Sep, 2016 Oct-Dec, 2016 2016 Total Jan-Mar, 2017 Apr-Jun, 2017
Indicator Location NumberCrudeRate Number
CrudeRate Number
CrudeRate Number
CrudeRate Number
CrudeRate Number
CrudeRate
Outpatient emergency department visits 2
All opioid overdoses Bronx 85 5.8 150 10.3 135 9.3 451 31.0 100 6.9 139 9.6New York City 436 5.1 538 6.3 479 5.6 1,776 20.8 419 4.9 565 6.6
Heroin overdoses Bronx 54 3.7 87 6.0 90 6.2 270 18.6 65 4.5 82 5.6New York City 242 2.8 327 3.8 295 3.5 1,049 12.3 253 3.0 337 3.9
Opioid overdosesexcluding heroin 1
Bronx 31 2.1 63 4.3 45 3.1 181 12.4 35 2.4 57 3.9New York City 194 2.3 211 2.5 184 2.2 727 8.5 166 1.9 228 2.7
Hospitalizations 2
All opioid overdoses Bronx 96 6.6 91 6.3 99 6.8 368 25.3 103 7.1 120 8.2New York City 293 3.4 287 3.4 327 3.8 1,162 13.6 284 3.3 326 3.8
Heroin overdoses Bronx 33 2.3 37 2.5 32 2.2 130 8.9 38 2.6 49 3.4New York City 102 1.2 100 1.2 114 1.3 401 4.7 93 1.1 123 1.4
Opioid overdosesexcluding heroin 1
Bronx 63 4.3 54 3.7 67 4.6 238 16.4 65 4.5 71 4.9New York City 191 2.2 187 2.2 213 2.5 761 8.9 191 2.2 203 2.4
1 This indicator includes pharmaceutically and illicitly produced opioids such as fentanyl.
2 Indicators generated for hospitalizations and emergency department visits are based on ICD-10-CM codes.
s: Data for indicators related to hospitalizations and emergency departments are suppressed for confidentiality purposes if there are less than 6 discharges.
122

Bronx County: Unique clients admitted to OASAS-certified chemical dependence treatment programs 1,2
(Preliminary data as of October, 2017 - subject to change)
2015 2016 2017
Indicator Total Jan-Mar Apr-Jun Jul-Sep Oct-Dec Total Jan-Mar Apr-Jun
Unique clients admitted forheroin
6,637 2,173 2,177 2,231 2,154 6,765 2,117 2,198
Unique clients admitted for anyopioid (incl. heroin)
7,080 2,321 2,331 2,373 2,290 7,274 2,260 2,366
OASAS: Office of Alcoholism and Substance Abuse Services
1 The number of unique clients admitted per year does not equal the sum of the unique clients admitted each quarter. This is because an individual client can beadmitted to treatment in more than one quarter during the year.
2 Clients may have heroin, other opioids, or any other substance simultaneously recorded as the primary, secondary and tertiary substance of abuse at admission.
s: Data for indicators are suppressed for confidentiality purposes if there are less than 6 clients.
Bronx County: Naloxone administration reports (Preliminary data as of November, 2017 - subject to change)
2015 2016 2017
Indicator Location Total Jan-Mar Apr-Jun Jul-Sep Oct-Dec Total Jan-Mar Apr-Jun Jul-Sep
Emergency Medical Services (EMS) naloxone administration reports 1,2
Naloxone administration reportby EMS
Bronx 1,122 351 503 725 510 2,089 411 464 601New York City 5,088 1,433 1,943 2,383 1,908 7,667 1,727 1,884 1,951
Registered Community Opioid Overdose Prevention (COOP) program naloxone administration reports 3
Naloxone administration reportby registered COOP program
Bronx 36 5 10 5 9 29 17 17 6New York City 143 40 53 85 65 243 82 96 21
1 County numbers displayed in the table represent only naloxone administration events reported electronically, therefore, actual numbers of events may be higher.Additional data validation steps have been taken to de-duplicate 2016 administrations by multiple agencies for the same patient encounter.
2 EMS reporting may have been affected by a change in documentation systems used by EMS agency/ies serving the area. Counts may decrease until updates to thedata are available in 2018, if applicable.
3 Numbers displayed in the table represent only naloxone administration reports submitted by registered COOP programs to the NYSDOH AIDS Institute. The actualnumbers of naloxone administration events may be higher.
123

Kings County: Opioid overdoses and rates per 100,000 population (Preliminary data as of November, 2017 - subject to change)
Apr-Jun, 2016 Jul-Sep, 2016 Oct-Dec, 2016 2016 Total Jan-Mar, 2017 Apr-Jun, 2017
Indicator Location NumberCrudeRate Number
CrudeRate Number
CrudeRate Number
CrudeRate Number
CrudeRate Number
CrudeRate
Outpatient emergency department visits 2
All opioid overdoses Kings 138 5.2 146 5.5 150 5.7 519 19.7 126 4.8 157 6.0New York City 436 5.1 538 6.3 479 5.6 1,776 20.8 419 4.9 565 6.6
Heroin overdoses Kings 73 2.8 94 3.6 93 3.5 310 11.8 77 2.9 98 3.7New York City 242 2.8 327 3.8 295 3.5 1,049 12.3 253 3.0 337 3.9
Opioid overdosesexcluding heroin 1
Kings 65 2.5 52 2.0 57 2.2 209 7.9 49 1.9 59 2.2New York City 194 2.3 211 2.5 184 2.2 727 8.5 166 1.9 228 2.7
Hospitalizations 2
All opioid overdoses Kings 68 2.6 75 2.8 92 3.5 294 11.2 75 2.8 68 2.6New York City 293 3.4 287 3.4 327 3.8 1,162 13.6 284 3.3 326 3.8
Heroin overdoses Kings 23 0.9 26 1.0 34 1.3 102 3.9 23 0.9 25 0.9New York City 102 1.2 100 1.2 114 1.3 401 4.7 93 1.1 123 1.4
Opioid overdosesexcluding heroin 1
Kings 45 1.7 49 1.9 58 2.2 192 7.3 52 2.0 43 1.6New York City 191 2.2 187 2.2 213 2.5 761 8.9 191 2.2 203 2.4
1 This indicator includes pharmaceutically and illicitly produced opioids such as fentanyl.
2 Indicators generated for hospitalizations and emergency department visits are based on ICD-10-CM codes.
s: Data for indicators related to hospitalizations and emergency departments are suppressed for confidentiality purposes if there are less than 6 discharges.
124

Kings County: Unique clients admitted to OASAS-certified chemical dependence treatment programs 1,2
(Preliminary data as of October, 2017 - subject to change)
2015 2016 2017
Indicator Total Jan-Mar Apr-Jun Jul-Sep Oct-Dec Total Jan-Mar Apr-Jun
Unique clients admitted forheroin
6,678 2,032 2,121 2,028 1,953 6,374 1,944 1,985
Unique clients admitted for anyopioid (incl. heroin)
7,330 2,223 2,331 2,211 2,136 6,996 2,117 2,167
OASAS: Office of Alcoholism and Substance Abuse Services
1 The number of unique clients admitted per year does not equal the sum of the unique clients admitted each quarter. This is because an individual client can beadmitted to treatment in more than one quarter during the year.
2 Clients may have heroin, other opioids, or any other substance simultaneously recorded as the primary, secondary and tertiary substance of abuse at admission.
s: Data for indicators are suppressed for confidentiality purposes if there are less than 6 clients.
Kings County: Naloxone administration reports (Preliminary data as of November, 2017 - subject to change)
2015 2016 2017
Indicator Location Total Jan-Mar Apr-Jun Jul-Sep Oct-Dec Total Jan-Mar Apr-Jun Jul-Sep
Emergency Medical Services (EMS) naloxone administration reports 1,2
Naloxone administration reportby EMS
Kings 1,492 369 546 641 521 2,077 452 529 460New York City 5,088 1,433 1,943 2,383 1,908 7,667 1,727 1,884 1,951
Registered Community Opioid Overdose Prevention (COOP) program naloxone administration reports 3
Naloxone administration reportby registered COOP program
Kings 46 16 14 32 24 86 18 10 2New York City 143 40 53 85 65 243 82 96 21
1 County numbers displayed in the table represent only naloxone administration events reported electronically, therefore, actual numbers of events may be higher.Additional data validation steps have been taken to de-duplicate 2016 administrations by multiple agencies for the same patient encounter.
2 EMS reporting may have been affected by a change in documentation systems used by EMS agency/ies serving the area. Counts may decrease until updates to thedata are available in 2018, if applicable.
3 Numbers displayed in the table represent only naloxone administration reports submitted by registered COOP programs to the NYSDOH AIDS Institute. The actualnumbers of naloxone administration events may be higher.
125

New York County: Opioid overdoses and rates per 100,000 population (Preliminary data as of November, 2017 - subject to change)
Apr-Jun, 2016 Jul-Sep, 2016 Oct-Dec, 2016 2016 Total Jan-Mar, 2017 Apr-Jun, 2017
Indicator Location NumberCrudeRate Number
CrudeRate Number
CrudeRate Number
CrudeRate Number
CrudeRate Number
CrudeRate
Outpatient emergency department visits 2
All opioid overdoses New York 49 3.0 78 4.7 51 3.1 235 14.3 67 4.1 103 6.3New York City 436 5.1 538 6.3 479 5.6 1,776 20.8 419 4.9 565 6.6
Heroin overdoses New York 27 1.6 46 2.8 23 1.4 127 7.7 32 1.9 60 3.6New York City 242 2.8 327 3.8 295 3.5 1,049 12.3 253 3.0 337 3.9
Opioid overdosesexcluding heroin 1
New York 22 1.3 32 1.9 28 1.7 108 6.6 35 2.1 43 2.6New York City 194 2.3 211 2.5 184 2.2 727 8.5 166 1.9 228 2.7
Hospitalizations 2
All opioid overdoses New York 56 3.4 54 3.3 62 3.8 223 13.6 59 3.6 74 4.5New York City 293 3.4 287 3.4 327 3.8 1,162 13.6 284 3.3 326 3.8
Heroin overdoses New York 19 1.2 18 1.1 20 1.2 73 4.4 19 1.2 29 1.8New York City 102 1.2 100 1.2 114 1.3 401 4.7 93 1.1 123 1.4
Opioid overdosesexcluding heroin 1
New York 37 2.2 36 2.2 42 2.6 150 9.1 40 2.4 45 2.7New York City 191 2.2 187 2.2 213 2.5 761 8.9 191 2.2 203 2.4
1 This indicator includes pharmaceutically and illicitly produced opioids such as fentanyl.
2 Indicators generated for hospitalizations and emergency department visits are based on ICD-10-CM codes.
s: Data for indicators related to hospitalizations and emergency departments are suppressed for confidentiality purposes if there are less than 6 discharges.
126

New York County: Unique clients admitted to OASAS-certified chemical dependence treatment programs 1,2
(Preliminary data as of October, 2017 - subject to change)
2015 2016 2017
Indicator Total Jan-Mar Apr-Jun Jul-Sep Oct-Dec Total Jan-Mar Apr-Jun
Unique clients admitted forheroin
6,890 2,218 2,209 2,208 2,142 6,881 2,119 2,057
Unique clients admitted for anyopioid (incl. heroin)
7,453 2,357 2,355 2,371 2,294 7,373 2,290 2,221
OASAS: Office of Alcoholism and Substance Abuse Services
1 The number of unique clients admitted per year does not equal the sum of the unique clients admitted each quarter. This is because an individual client can beadmitted to treatment in more than one quarter during the year.
2 Clients may have heroin, other opioids, or any other substance simultaneously recorded as the primary, secondary and tertiary substance of abuse at admission.
s: Data for indicators are suppressed for confidentiality purposes if there are less than 6 clients.
New York County: Naloxone administration reports (Preliminary data as of November, 2017 - subject to change)
2015 2016 2017
Indicator Location Total Jan-Mar Apr-Jun Jul-Sep Oct-Dec Total Jan-Mar Apr-Jun Jul-Sep
Emergency Medical Services (EMS) naloxone administration reports 1,2
Naloxone administration reportby EMS
New York 1,431 363 498 599 469 1,929 513 534 484New York City 5,088 1,433 1,943 2,383 1,908 7,667 1,727 1,884 1,951
Registered Community Opioid Overdose Prevention (COOP) program naloxone administration reports 3
Naloxone administration reportby registered COOP program
New York 38 8 12 31 24 75 29 51 10New York City 143 40 53 85 65 243 82 96 21
1 County numbers displayed in the table represent only naloxone administration events reported electronically, therefore, actual numbers of events may be higher.Additional data validation steps have been taken to de-duplicate 2016 administrations by multiple agencies for the same patient encounter.
2 EMS reporting may have been affected by a change in documentation systems used by EMS agency/ies serving the area. Counts may decrease until updates to thedata are available in 2018, if applicable.
3 Numbers displayed in the table represent only naloxone administration reports submitted by registered COOP programs to the NYSDOH AIDS Institute. The actualnumbers of naloxone administration events may be higher.
127

Queens County: Opioid overdoses and rates per 100,000 population (Preliminary data as of November, 2017 - subject to change)
Apr-Jun, 2016 Jul-Sep, 2016 Oct-Dec, 2016 2016 Total Jan-Mar, 2017 Apr-Jun, 2017
Indicator Location NumberCrudeRate Number
CrudeRate Number
CrudeRate Number
CrudeRate Number
CrudeRate Number
CrudeRate
Outpatient emergency department visits 2
All opioid overdoses Queens 102 4.4 75 3.2 90 3.8 318 13.6 83 3.5 98 4.2New York City 436 5.1 538 6.3 479 5.6 1,776 20.8 419 4.9 565 6.6
Heroin overdoses Queens 50 2.1 48 2.1 56 2.4 185 7.9 49 2.1 55 2.4New York City 242 2.8 327 3.8 295 3.5 1,049 12.3 253 3.0 337 3.9
Opioid overdosesexcluding heroin 1
Queens 52 2.2 27 1.2 34 1.5 133 5.7 34 1.5 43 1.8New York City 194 2.3 211 2.5 184 2.2 727 8.5 166 1.9 228 2.7
Hospitalizations 2
All opioid overdoses Queens 46 2.0 48 2.1 54 2.3 189 8.1 26 1.1 50 2.1New York City 293 3.4 287 3.4 327 3.8 1,162 13.6 284 3.3 326 3.8
Heroin overdoses Queens 22 0.9 15 0.6 18 0.8 70 3.0 11 0.5 17 0.7New York City 102 1.2 100 1.2 114 1.3 401 4.7 93 1.1 123 1.4
Opioid overdosesexcluding heroin 1
Queens 24 1.0 33 1.4 36 1.5 119 5.1 15 0.6 33 1.4New York City 191 2.2 187 2.2 213 2.5 761 8.9 191 2.2 203 2.4
1 This indicator includes pharmaceutically and illicitly produced opioids such as fentanyl.
2 Indicators generated for hospitalizations and emergency department visits are based on ICD-10-CM codes.
s: Data for indicators related to hospitalizations and emergency departments are suppressed for confidentiality purposes if there are less than 6 discharges.
128

Queens County: Unique clients admitted to OASAS-certified chemical dependence treatment programs 1,2
(Preliminary data as of October, 2017 - subject to change)
2015 2016 2017
Indicator Total Jan-Mar Apr-Jun Jul-Sep Oct-Dec Total Jan-Mar Apr-Jun
Unique clients admitted forheroin
3,170 954 1,022 959 937 3,001 967 965
Unique clients admitted for anyopioid (incl. heroin)
3,638 1,110 1,161 1,087 1,074 3,484 1,109 1,108
OASAS: Office of Alcoholism and Substance Abuse Services
1 The number of unique clients admitted per year does not equal the sum of the unique clients admitted each quarter. This is because an individual client can beadmitted to treatment in more than one quarter during the year.
2 Clients may have heroin, other opioids, or any other substance simultaneously recorded as the primary, secondary and tertiary substance of abuse at admission.
s: Data for indicators are suppressed for confidentiality purposes if there are less than 6 clients.
Queens County: Naloxone administration reports (Preliminary data as of November, 2017 - subject to change)
2015 2016 2017
Indicator Location Total Jan-Mar Apr-Jun Jul-Sep Oct-Dec Total Jan-Mar Apr-Jun Jul-Sep
Emergency Medical Services (EMS) naloxone administration reports 1,2
Naloxone administration reportby EMS
Queens 785 262 319 304 319 1,204 277 282 345New York City 5,088 1,433 1,943 2,383 1,908 7,667 1,727 1,884 1,951
Registered Community Opioid Overdose Prevention (COOP) program naloxone administration reports 3
Naloxone administration reportby registered COOP program
Queens 12 5 7 4 3 19 3 6 2New York City 143 40 53 85 65 243 82 96 21
1 County numbers displayed in the table represent only naloxone administration events reported electronically, therefore, actual numbers of events may be higher.Additional data validation steps have been taken to de-duplicate 2016 administrations by multiple agencies for the same patient encounter.
2 EMS reporting may have been affected by a change in documentation systems used by EMS agency/ies serving the area. Counts may decrease until updates to thedata are available in 2018, if applicable.
3 Numbers displayed in the table represent only naloxone administration reports submitted by registered COOP programs to the NYSDOH AIDS Institute. The actualnumbers of naloxone administration events may be higher.
129

Richmond County: Opioid overdoses and rates per 100,000 population (Preliminary data as of November, 2017 - subject to change)
Apr-Jun, 2016 Jul-Sep, 2016 Oct-Dec, 2016 2016 Total Jan-Mar, 2017 Apr-Jun, 2017
Indicator Location NumberCrudeRate Number
CrudeRate Number
CrudeRate Number
CrudeRate Number
CrudeRate Number
CrudeRate
Outpatient emergency department visits 2
All opioid overdoses Richmond 62 13.1 89 18.8 53 11.2 253 53.3 43 9.1 68 14.3New York City 436 5.1 538 6.3 479 5.6 1,776 20.8 419 4.9 565 6.6
Heroin overdoses Richmond 38 8.0 52 11.0 33 7.0 157 33.1 30 6.3 42 8.9New York City 242 2.8 327 3.8 295 3.5 1,049 12.3 253 3.0 337 3.9
Opioid overdosesexcluding heroin 1
Richmond 24 5.1 37 7.8 20 4.2 96 20.2 13 2.7 26 5.5New York City 194 2.3 211 2.5 184 2.2 727 8.5 166 1.9 228 2.7
Hospitalizations 2
All opioid overdoses Richmond 27 5.7 19 4.0 20 4.2 88 18.5 21 4.4 14 3.0New York City 293 3.4 287 3.4 327 3.8 1,162 13.6 284 3.3 326 3.8
Heroin overdoses Richmond s s s s 10 2.1 26 5.5 s s s sNew York City 102 1.2 100 1.2 114 1.3 401 4.7 93 1.1 123 1.4
Opioid overdosesexcluding heroin 1
Richmond 22 4.6 15 3.2 10 2.1 62 13.1 19 4.0 11 2.3New York City 191 2.2 187 2.2 213 2.5 761 8.9 191 2.2 203 2.4
1 This indicator includes pharmaceutically and illicitly produced opioids such as fentanyl.
2 Indicators generated for hospitalizations and emergency department visits are based on ICD-10-CM codes.
s: Data for indicators related to hospitalizations and emergency departments are suppressed for confidentiality purposes if there are less than 6 discharges.
130

Richmond County: Unique clients admitted to OASAS-certified chemical dependence treatment programs 1,2
(Preliminary data as of October, 2017 - subject to change)
2015 2016 2017
Indicator Total Jan-Mar Apr-Jun Jul-Sep Oct-Dec Total Jan-Mar Apr-Jun
Unique clients admitted forheroin
1,742 610 586 597 575 1,795 610 609
Unique clients admitted for anyopioid (incl. heroin)
2,276 767 743 745 699 2,254 755 745
OASAS: Office of Alcoholism and Substance Abuse Services
1 The number of unique clients admitted per year does not equal the sum of the unique clients admitted each quarter. This is because an individual client can beadmitted to treatment in more than one quarter during the year.
2 Clients may have heroin, other opioids, or any other substance simultaneously recorded as the primary, secondary and tertiary substance of abuse at admission.
s: Data for indicators are suppressed for confidentiality purposes if there are less than 6 clients.
Richmond County: Naloxone administration reports (Preliminary data as of November, 2017 - subject to change)
2015 2016 2017
Indicator Location Total Jan-Mar Apr-Jun Jul-Sep Oct-Dec Total Jan-Mar Apr-Jun Jul-Sep
Emergency Medical Services (EMS) naloxone administration reports 1,2
Naloxone administration reportby EMS
Richmond 258 88 77 114 89 368 74 75 61New York City 5,088 1,433 1,943 2,383 1,908 7,667 1,727 1,884 1,951
Registered Community Opioid Overdose Prevention (COOP) program naloxone administration reports 3
Naloxone administration reportby registered COOP program
Richmond 11 6 10 13 5 34 15 12 1New York City 143 40 53 85 65 243 82 96 21
1 County numbers displayed in the table represent only naloxone administration events reported electronically, therefore, actual numbers of events may be higher.Additional data validation steps have been taken to de-duplicate 2016 administrations by multiple agencies for the same patient encounter.
2 EMS reporting may have been affected by a change in documentation systems used by EMS agency/ies serving the area. Counts may decrease until updates to thedata are available in 2018, if applicable.
3 Numbers displayed in the table represent only naloxone administration reports submitted by registered COOP programs to the NYSDOH AIDS Institute. The actualnumbers of naloxone administration events may be higher.
131

Methods Measures
Indicator
Definition
ICD Codes/Detailed Explanation
Data Source
All overdose deaths involving opioids
All poisoning deaths involving opioids, all manners, using all causes of death
Underlying cause of death, determined from the field designated as such, or, where missing or unknown, from the first-listed multiple cause of death field: X40-X44, X60-X64, X85, Y10-Y14 AND Any opioid in all other causes of death: T40.0, T40.1, T40.2, T40.3, T40.4, T40.6
Vital Statistics
Overdose deaths involving heroin
Poisoning deaths involving heroin, all manners, using all causes of death
Underlying cause of death, determined from the field designated as such, or, where missing or unknown, from the first-listed multiple cause of death field: X40-X44, X60-X64, X85, Y10-Y14 AND Heroin in all other causes of death: T40.1
Vital Statistics
Overdose deaths involving opioid pain relievers
Poisoning deaths involving opioid pain relievers, all manners, using all causes of death
Underlying cause of death, determined from the field designated as such, or, where missing or unknown, from the first-listed multiple cause of death field: X40-X44, X60-X64, X85, Y10-Y14 AND Any opioid pain relievers in all other causes of death: T40.2, T40.3, T40.4
Vital Statistics
All emergency department visits involving opioid overdose
All outpatient (not being admitted) emergency department visits involving opioid poisonings, all manners, principal diagnosis or first-listed cause of injury
ICD-9-CM: Principal Diagnosis: 96500, 96501, 96502, 96509 OR First-listed External Cause of Injury: E8500, E8501, E8502 ICD-10-CM: Principal Diagnosis: T40.0, T40.1, T40.2, T40.3, T40.4, T40.6 (Excludes ‘adverse effect’ or ‘underdosing’ as indicated by the values of 5 and 6 in the 6th character; and ‘sequela’ as indicated by the value of ‘S’ in the 7th character; e.g. T400X5S, T400X6S)
SPARCS
Emergency department visits involving heroin overdose
Outpatient (not being admitted) emergency department visits involving heroin poisoning, all manners, principal diagnosis or first-listed cause of injury
ICD-9-CM: Principal Diagnosis: 96501 OR First-listed External Cause of Injury: E8500 ICD-10-CM: Principal Diagnosis: T40.1 (Excludes ‘adverse effect’ or ‘underdosing’ as indicated by the values of 5 and 6 in the 6th character; and ‘sequela’ as indicated by the value of ‘S’ in the 7th character; e.g. T401X5S, T401X6S)
SPARCS
Emergency department visits involving opioid overdose excluding heroin
Outpatient (not being admitted) emergency department visits involving opioid poisonings except heroin, all manners, principal diagnosis or first-listed cause of injury
ICD-9-CM: Principal Diagnosis: 96500, 96502, 96509 OR First-listed External Cause of Injury: E8501, E8502 ICD-10-CM: Principal Diagnosis: T40.0, T40.2, T40.3, T40.4, T40.6 (Excludes ‘adverse effect’ or ‘underdosing’ as indicated by the values of 5 and 6 in the 6th character; and ‘sequela’ as indicated by the value of ‘S’ in the 7th character; e.g. T400X5S, T400X6S)
SPARCS
132
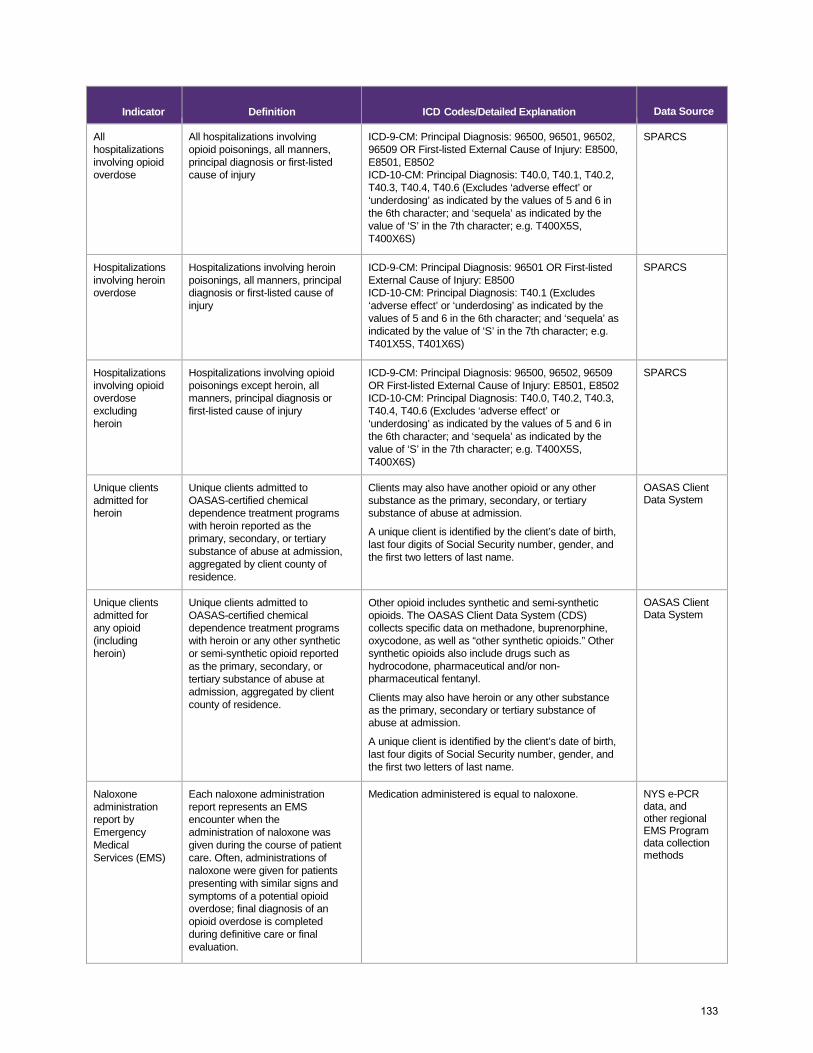
Indicator
Definition
ICD Codes/Detailed Explanation
Data Source
All hospitalizations involving opioid overdose
All hospitalizations involving opioid poisonings, all manners, principal diagnosis or first-listed cause of injury
ICD-9-CM: Principal Diagnosis: 96500, 96501, 96502, 96509 OR First-listed External Cause of Injury: E8500, E8501, E8502 ICD-10-CM: Principal Diagnosis: T40.0, T40.1, T40.2, T40.3, T40.4, T40.6 (Excludes ‘adverse effect’ or ‘underdosing’ as indicated by the values of 5 and 6 in the 6th character; and ‘sequela’ as indicated by the value of ‘S’ in the 7th character; e.g. T400X5S, T400X6S)
SPARCS
Hospitalizations involving heroin overdose
Hospitalizations involving heroin poisonings, all manners, principal diagnosis or first-listed cause of injury
ICD-9-CM: Principal Diagnosis: 96501 OR First-listed External Cause of Injury: E8500 ICD-10-CM: Principal Diagnosis: T40.1 (Excludes ‘adverse effect’ or ‘underdosing’ as indicated by the values of 5 and 6 in the 6th character; and ‘sequela’ as indicated by the value of ‘S’ in the 7th character; e.g. T401X5S, T401X6S)
SPARCS
Hospitalizations involving opioid overdose excluding heroin
Hospitalizations involving opioid poisonings except heroin, all manners, principal diagnosis or first-listed cause of injury
ICD-9-CM: Principal Diagnosis: 96500, 96502, 96509 OR First-listed External Cause of Injury: E8501, E8502 ICD-10-CM: Principal Diagnosis: T40.0, T40.2, T40.3, T40.4, T40.6 (Excludes ‘adverse effect’ or ‘underdosing’ as indicated by the values of 5 and 6 in the 6th character; and ‘sequela’ as indicated by the value of ‘S’ in the 7th character; e.g. T400X5S, T400X6S)
SPARCS
Unique clients admitted for heroin
Unique clients admitted to OASAS-certified chemical dependence treatment programs with heroin reported as the primary, secondary, or tertiary substance of abuse at admission, aggregated by client county of residence.
Clients may also have another opioid or any other substance as the primary, secondary, or tertiary substance of abuse at admission.
A unique client is identified by the client’s date of birth, last four digits of Social Security number, gender, and the first two letters of last name.
OASAS Client Data System
Unique clients admitted for any opioid (including heroin)
Unique clients admitted to OASAS-certified chemical dependence treatment programs with heroin or any other synthetic or semi-synthetic opioid reported as the primary, secondary, or tertiary substance of abuse at admission, aggregated by client county of residence.
Other opioid includes synthetic and semi-synthetic opioids. The OASAS Client Data System (CDS) collects specific data on methadone, buprenorphine, oxycodone, as well as “other synthetic opioids.” Other synthetic opioids also include drugs such as hydrocodone, pharmaceutical and/or non-pharmaceutical fentanyl.
Clients may also have heroin or any other substance as the primary, secondary or tertiary substance of abuse at admission.
A unique client is identified by the client’s date of birth, last four digits of Social Security number, gender, and the first two letters of last name.
OASAS Client Data System
Naloxone administration report by Emergency Medical Services (EMS)
Each naloxone administration report represents an EMS encounter when the administration of naloxone was given during the course of patient care. Often, administrations of naloxone were given for patients presenting with similar signs and symptoms of a potential opioid overdose; final diagnosis of an opioid overdose is completed during definitive care or final evaluation.
Medication administered is equal to naloxone. NYS e-PCR data, and other regional EMS Program data collection methods
133

Indicator
Definition
ICD Codes/Detailed Explanation
Data Source
Naloxone administration report by law enforcement
Each naloxone administration report represents a naloxone administration instance in which a trained law enforcement officer administered one or more doses of naloxone to a person suspected of an opioid overdose.
Not applicable
NYS Law Enforcement Naloxone Administration Database
Naloxone administration report by registered COOP program
Each naloxone administration report represents a naloxone administration instance in which a trained responder administered one or more doses of naloxone to a person suspected of an opioid overdose. Naloxone administration instances that are not reported to the AIDS Institute by the registered COOP programs are excluded from the county report.
Not applicable
NYS Community Opioid Overdose Prevention Naloxone Administration Database
Data Sources Vital Records (Vital Statistics) Vital Event Registration: New York State consists of two registration areas, New York City (NYC) and New York State Exclusive of New York City (also referred to as Rest of State). NYC includes the five counties of Bronx, Kings (Brooklyn), New York (Manhattan), Queens and Richmond (Staten Island); the remaining 57 counties comprise New York State Exclusive of NYC. The NYSDOH’s Bureau of Vital Records processes data from live birth, death, fetal death and marriage certificates recorded in New York State Exclusive of NYC. Through a cooperative agreement, the NYSDOH receives data on live births, deaths, and fetal deaths recorded in NYC from the New York City Department of Health and Mental Hygiene (NYCDOHMH), and on live births and deaths recorded outside of New York State to residents of New York State from other states and Canada. In general, vital event indicators for NYC geographical areas reported by the NYSDOH and the NYCDOHMH may be different because the former includes possibly all NYC residents' events, regardless of where they took place, and the latter reports events to NYC residents that took place in NYC. Vital statistics mortality data include up to 20 causes of death. Frequencies are based on decedents’ county of residence, not the county where death occurred. This report’s mortality indicators reflect all manners and all causes of death. Data are frequently updated as additional confirmations on the causes of death and new records for all NYS resident deaths are received. Therefore, the frequencies published in subsequent reports may also differ due to timing and/or completeness of data. Statewide Planning and Research Cooperative System (SPARCS): SPARCS collects information about hospitalizations and ED visits through the patient discharge data system. Outpatient ED visits are events that did not result in admission to the hospital. Each hospitalization and outpatient ED visit receives an ICD-10-CM code at discharge that indicates the primary reason for the occurrence. There is also a first-listed cause, external cause of injury, and up to 24 other diagnosis codes recorded to further describe the hospitalization or ED visits.
134
Statistics in these tables are based on the primary diagnosis and first-listed cause of injury unless otherwise noted. An individual can have more than one hospitalization or ED visit. Numbers and rates are based on the number of discharges and not on the number of individuals seen. The frequencies are based on patients’ county of residence, not the county where the incident occurred. County of residence was assigned based on ZIP code for cases in which patient county of residence was listed as unknown or missing, but a valid NY ZIP code was present. For indicators related to the ED data, the numbers represent ED visits for opioid overdose patients who were not subsequently admitted into the hospital. New York State Office of Alcoholism and Substance Abuse Services (OASAS) Client Data System (CDS): NYS OASAS collects data on people treated in all OASAS-certified chemical dependence treatment programs. Data are collected through the OASAS CDS. Data are collected at admission and discharge from a level of care within a provider. Levels of care include crisis, residential, inpatient, outpatient, and opioid treatment. An individual admitted to more than one level of care during a quarter or a year would count as one unique admission. The primary, secondary and tertiary substance of abuse is collected for all clients admitted. Not all clients have a secondary or tertiary substance of abuse. Numbers are based on the number of unique people admitted during the quarter or year, and not on the number of individuals treated. A person admitted in a previous quarter or year could still be receiving treatment in subsequent quarters or years, but would not be shown as an admission for the new quarter or year. New York State Emergency Medical Services (EMS) Data: New York State maintains an EMS patient care data repository, in which all e-PCR data are captured from across the State. Data for Suffolk County come from Regional EMS Medical Control to which all medication administrations by EMS–including naloxone–are required to be reported. Data from Nassau County are provided by the Nassau County Police Department based on reports submitted by Nassau County first response agencies and most ambulance transport agencies. The EMS data from Nassau County Police Department are combined with e-PCR data submitted by other agencies not included in the Nassau County Police Department reporting. As of this January 2018 report, EMS naloxone administrations for Nassau County have been updated with the Nassau County Police Department data for all quarters and years shown, and are likely to show increases compared to previously-issued data. New York State Law Enforcement Naloxone Administration Dataset: The NYS Law Enforcement Naloxone Administration dataset provides information on naloxone administrations by law enforcement officers in the case of a suspected opioid overdose. The form collects the age and gender of the individual receiving naloxone, the county and ZIP code where the suspected opioid overdose occurred, aided status before and after naloxone administration, the suspected drug used, the number of naloxone vials administered by the officer and whether the person lived. Initial trainings of law enforcement began in 2014 and are ongoing. The data do not yet comprehensively include the New York City Police Department and the Nassau County Police Department, which use a distinct reporting mechanism. New York State Community Opioid Overdose Prevention (COOP) Program Dataset: The NYS COOP program dataset provides information on naloxone administrations by lay persons trained by registered NYS COOP programs in the case of a suspected opioid overdose. Naloxone administration reports are submitted by registered COOP programs, not individual lay persons. The form collects information including age and gender of the individual receiving naloxone, the county and ZIP code where the suspected opioid overdose occurred, aided status before naloxone
135
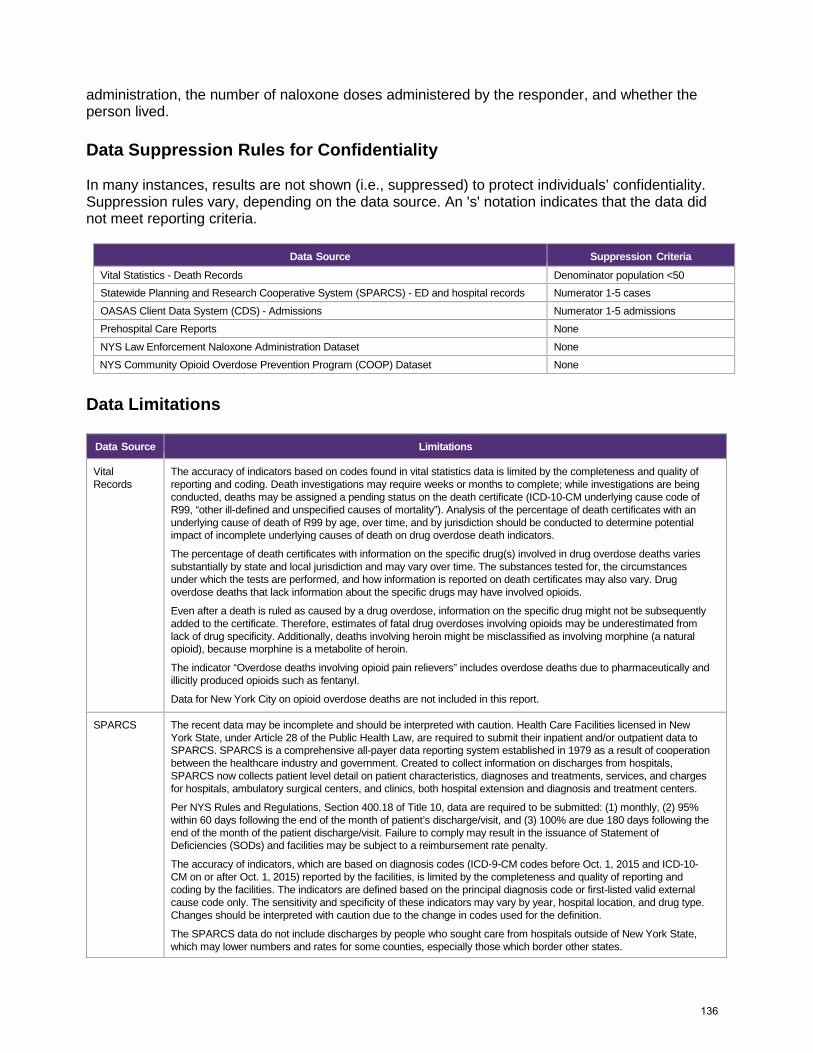
administration, the number of naloxone doses administered by the responder, and whether the person lived. Data Suppression Rules for Confidentiality In many instances, results are not shown (i.e., suppressed) to protect individuals’ confidentiality. Suppression rules vary, depending on the data source. An 's' notation indicates that the data did not meet reporting criteria.
Data Source Suppression Criteria
Vital Statistics - Death Records Denominator population <50 Statewide Planning and Research Cooperative System (SPARCS) - ED and hospital records Numerator 1-5 cases
OASAS Client Data System (CDS) - Admissions Numerator 1-5 admissions
Prehospital Care Reports None
NYS Law Enforcement Naloxone Administration Dataset None
NYS Community Opioid Overdose Prevention Program (COOP) Dataset None
Data Limitations
Data Source Limitations
Vital Records
The accuracy of indicators based on codes found in vital statistics data is limited by the completeness and quality of reporting and coding. Death investigations may require weeks or months to complete; while investigations are being conducted, deaths may be assigned a pending status on the death certificate (ICD-10-CM underlying cause code of R99, “other ill-defined and unspecified causes of mortality”). Analysis of the percentage of death certificates with an underlying cause of death of R99 by age, over time, and by jurisdiction should be conducted to determine potential impact of incomplete underlying causes of death on drug overdose death indicators.
The percentage of death certificates with information on the specific drug(s) involved in drug overdose deaths varies substantially by state and local jurisdiction and may vary over time. The substances tested for, the circumstances under which the tests are performed, and how information is reported on death certificates may also vary. Drug overdose deaths that lack information about the specific drugs may have involved opioids.
Even after a death is ruled as caused by a drug overdose, information on the specific drug might not be subsequently added to the certificate. Therefore, estimates of fatal drug overdoses involving opioids may be underestimated from lack of drug specificity. Additionally, deaths involving heroin might be misclassified as involving morphine (a natural opioid), because morphine is a metabolite of heroin.
The indicator “Overdose deaths involving opioid pain relievers” includes overdose deaths due to pharmaceutically and illicitly produced opioids such as fentanyl.
Data for New York City on opioid overdose deaths are not included in this report.
SPARCS The recent data may be incomplete and should be interpreted with caution. Health Care Facilities licensed in New York State, under Article 28 of the Public Health Law, are required to submit their inpatient and/or outpatient data to SPARCS. SPARCS is a comprehensive all-payer data reporting system established in 1979 as a result of cooperation between the healthcare industry and government. Created to collect information on discharges from hospitals, SPARCS now collects patient level detail on patient characteristics, diagnoses and treatments, services, and charges for hospitals, ambulatory surgical centers, and clinics, both hospital extension and diagnosis and treatment centers.
Per NYS Rules and Regulations, Section 400.18 of Title 10, data are required to be submitted: (1) monthly, (2) 95% within 60 days following the end of the month of patient’s discharge/visit, and (3) 100% are due 180 days following the end of the month of the patient discharge/visit. Failure to comply may result in the issuance of Statement of Deficiencies (SODs) and facilities may be subject to a reimbursement rate penalty.
The accuracy of indicators, which are based on diagnosis codes (ICD-9-CM codes before Oct. 1, 2015 and ICD-10-CM on or after Oct. 1, 2015) reported by the facilities, is limited by the completeness and quality of reporting and coding by the facilities. The indicators are defined based on the principal diagnosis code or first-listed valid external cause code only. The sensitivity and specificity of these indicators may vary by year, hospital location, and drug type. Changes should be interpreted with caution due to the change in codes used for the definition.
The SPARCS data do not include discharges by people who sought care from hospitals outside of New York State, which may lower numbers and rates for some counties, especially those which border other states.
136

Data Source Limitations
OASAS Client Data System (CDS)
The recent data may be incomplete and should be interpreted with caution. The CDS includes data for individuals served in the OASAS-certified treatment system. It does not have data for individuals who do not enter treatment, get treated by the U.S. Department of Veterans Affairs, go outside New York State for treatment, are admitted to hospitals but not to substance use disorder (SUD) treatment, get diverted to other systems, or receive an addictions medication from a physician outside the OASAS system of care. OASAS-certified chemical dependence treatment programs are required to submit their admissions data to the CDS not later than the fifth of the month following the clinical admission transaction. Data are considered to be substantially complete three months after the due date, but are able to be updated indefinitely.
The accuracy of measures, which are based on data reported by the programs, is limited by the completeness, consistency and quality of reporting and coding by the programs. The sensitivity and specificity of these indicators may vary by provider, program, and possible substances reported.
Opioid admissions data are not direct measures of the prevalence of opioid use.
The availability of chemical dependence treatment services within a county may affect the number of admissions of county residents to programs offering those services.
Counties will not sum to the State. Clients are unique within a county.
EMS Patient Care Reports
Documentation data entry errors can occur, and may result in ‘naloxone administered’ being recorded when a different medication had actually been administered.
Patients who present as unresponsive or with an altered mental status with unknown etiology may be administered naloxone, as part of the treatment protocol, while attempts are being made to determine the cause of the patient’s current unresponsive state or altered mental status.
Electronic PCR data currently capture 85%-90% of all EMS data statewide, from 45%-50% of all certified EMS agencies. The remaining data are reported via paper PCR, from which extracting narcotic/heroin overdoses and naloxone administrations is impractical.
The Suffolk County results in this report do not include patients recorded as ‘unresponsive/unknown’ who received a treatment protocol that includes naloxone; the Suffolk County results in this report only include patients who received naloxone alone for suspected opioid overdose.
NYS Law Enforcement Naloxone Administration Dataset
All data are self-reported by the responding officer at the scene. Not all data fields are completed by the responding officer. There is often a lag in data reporting. All data should be interpreted with caution.
It is possible that not all naloxone administrations reported are for an opioid overdose. There are not toxicology reports to confirm suspected substances used.
Increase may represent expansion of program and may or may not indicate an increase in overdose events.
Data for New York City on naloxone administration reports by law enforcement are not included in this report. Data displayed for Nassau County on naloxone administration reports by law enforcement are not complete due to the use of an alternate reporting system.
NYS Community Opioid Overdose Prevention (COOP) Program Dataset
All data are self-reported by the responder on the scene. Not all data fields are completed by the responder. There is often a lag in data reporting. All data should be interpreted with caution.
Increase may represent expansion of program and may or may not indicate an increase in overdose events.
Reporting administrations of naloxone to the NYSDOH is one of the mandated responsibilities of registered COOP program directors. The actual number of incidents of naloxone administrations in the community may be higher than the number reported to the NYSDOH due to the delay in reporting.
The actual number of naloxone administrations is likely to substantially exceed the number reported to the NYSDOH.
137

Acknowledgments: New York State Department of Health Office of Public Health: Office of Public Health Practice AIDS Institute Center for Environmental Health Office of Quality and Patient Safety Bureau of Emergency Medical Services and Trauma Systems Bureau of Narcotic Enforcement Office of Governmental Affairs New York State Office of Alcoholism and Substance Abuse Services
138