coupled fem-dbem simulation of 3d crack growth under
TRANSCRIPT

ScienceDirect
Available online at www.sciencedirect.com
Available online at www.sciencedirect.com
ScienceDirect
Structural Integrity Procedia 00 (2016) 000–000 www.elsevier.com/locate/procedia
2452-3216 © 2016 The Authors. Published by Elsevier B.V. Peer-review under responsibility of the Scientific Committee of PCF 2016.
XV Portuguese Conference on Fracture, PCF 2016, 10-12 February 2016, Paço de Arcos, Portugal
Thermo-mechanical modeling of a high pressure turbine blade of an airplane gas turbine engine
P. Brandãoa, V. Infanteb, A.M. Deusc* aDepartment of Mechanical Engineering, Instituto Superior Técnico, Universidade de Lisboa, Av. Rovisco Pais, 1, 1049-001 Lisboa,
Portugal bIDMEC, Department of Mechanical Engineering, Instituto Superior Técnico, Universidade de Lisboa, Av. Rovisco Pais, 1, 1049-001 Lisboa,
Portugal cCeFEMA, Department of Mechanical Engineering, Instituto Superior Técnico, Universidade de Lisboa, Av. Rovisco Pais, 1, 1049-001 Lisboa,
Portugal
Abstract
During their operation, modern aircraft engine components are subjected to increasingly demanding operating conditions, especially the high pressure turbine (HPT) blades. Such conditions cause these parts to undergo different types of time-dependent degradation, one of which is creep. A model using the finite element method (FEM) was developed, in order to be able to predict the creep behaviour of HPT blades. Flight data records (FDR) for a specific aircraft, provided by a commercial aviation company, were used to obtain thermal and mechanical data for three different flight cycles. In order to create the 3D model needed for the FEM analysis, a HPT blade scrap was scanned, and its chemical composition and material properties were obtained. The data that was gathered was fed into the FEM model and different simulations were run, first with a simplified 3D rectangular block shape, in order to better establish the model, and then with the real 3D mesh obtained from the blade scrap. The overall expected behaviour in terms of displacement was observed, in particular at the trailing edge of the blade. Therefore such a model can be useful in the goal of predicting turbine blade life, given a set of FDR data. © 2016 The Authors. Published by Elsevier B.V. Peer-review under responsibility of the Scientific Committee of PCF 2016.
Keywords: High Pressure Turbine Blade; Creep; Finite Element Method; 3D Model; Simulation.
* Corresponding author. Tel.: +351 218419991.
E-mail address: [email protected]
2452-3216 © 2016, PROSTR (Procedia Structural Integrity) Hosting by Elsevier Ltd. All rights reserved.Peer review under responsibility of the Scientific Committee of PCF 2016.10.1016/j.prostr.2016.06.329
Procedia Structural Integrity 2 (2016) 2631–2642
© 2016, PROSTR (Procedia Structural Integrity) Hosting by Elsevier Ltd. All rights reserved.Peer-review under responsibility of the Scientific Committee of PCF 2016.
10.1016/j.prostr.2016.06.329
Available online at www.sciencedirect.com
ScienceDirect
Structural Integrity Procedia 00 (2016) 000–000 www.elsevier.com/locate/procedia
2452-3216 © 2016 The Authors. Published by Elsevier B.V. Peer-review under responsibility of the Scientific Committee of ECF21.
21st European Conference on Fracture, ECF21, 20-24 June 2016, Catania, Italy
Coupled FEM-DBEM Simulation of 3D Crack Growth under Fatigue Load Spectrum
R. Citarellaa, M. Leporea, M. Perrellaa, R.Sepeb*, G. Cricrìa aDept. of Industrial Engineering, University of Salerno, via G. Paolo II, 132 - 84084 Fisciano, Italy.
bDept. of Industrial and Information Engineering, Second University of Naples, Via Roma, 29 - 81031 Aversa, Italy.
Abstract
Numerical predictions of fatigue crack growth under load spectrum are obtained by coupled FEM-DBEM approach. An initial part-through corner crack, in a pre-notched specimen undergoing a traction fatigue load, propagates becoming through the thickness. A two parameter crack growth law (“Unified Approach”) is calibrated by in house made constant amplitude experimental tests and the crack growth retardation after an overload application is reproduced. The residual stresses responsible for such retardation are calculated by a sequence of elastic-plastic static FEM analysis; such stresses are then applied to the crack faces for the propagation simulation in a DBEM environment. A satisfactory agreement between numerical and experimental crack growth rates are displayed, for both part-through crack and through the thickness crack. This approach provide general modeling capabilities, with allowance for general crack front shape and fully automatic propagation. © 2016 The Authors. Published by Elsevier B.V. Peer-review under responsibility of the Scientific Committee of ECF21.
Keywords: Coupled FEM-DBEM, Load spectrum, Crack growth retardation, Residual stresses.
1. Introduction
Damage Tolerance is used in the design of many types of structures, such as bridges, military ships, commercial aircraft, space vehicle and merchant ships. Damage tolerant design requires accurate prediction of fatigue crack growth under service conditions and typically this is accomplished with the aid of a numerical code. Many aspects of fracture mechanics are more complicated in practice than in two-dimensional laboratory tests, textbook examples,
* Corresponding author. Tel.: +39-081-501-03-18.
E-mail address: [email protected].

2632 R. Citarella et al. / Procedia Structural Integrity 2 (2016) 2631–2642 R. Citarella et al./ Structural Integrity Procedia 00 (2016) 000–000 3
Fig. 2. Notch and crack front: (a) part through and (b) through crack.
Table 1. Load spectrum.
Block cycle 1 2 3 4 5
Number of cycles 27000 40 15000 40 10000
Pmax [kN] 17 22.1 17 24.65 17
Pmin [kN] 1.7 1.7 1.7 1.7 1.7
2.2. FEM and DBEM models
The aforementioned specimen is modeled by FEM, with the constraints provided by the machine grips simulated by proper boundary conditions at the two extremities. Such model is afterward imported in the DBEM environment by using interface routines that operate the skinning on the volumetric mesh and produce a boundary mesh (Fig. 3). The starting point for the crack propagation simulation is the first visible experimental crack (Calì et al., 2003): a corner crack with semielliptical axis a = 2.7 mm and c = 2.4 mm (the latter is the size measured along the thickness). The corresponding DBEM mesh is based on 3295 quadratic elements, with an overall number of degrees of freedom (dof’s) equal to 25491. After 27000 fatigue cycles the numerical corner crack dimensions become a = 3.75 mm and c = 3.45 mm and an overloading is introduced in the load spectrum (Table 1), so that an elastic-plastic analysis is needed to calculate the arising residual stresses. To this aim a FEM mesh, based on 71000 tetrahedral quadratic elements (ten nodes per element and three degree of freedom for each node) is produced, with a strong refinement nearby the crack front.
Fig. 3. DBEM model mesh and boundary conditions.
a) b)
2 R. Citarella et al./ Structural Integrity Procedia 00 (2016) 000–000
or overly simplified computer programs. Load spectrum, threshold effects, environmental conditions, microstructural effects, small crack effects, Multiple Site Damage (MSD) conditions, material parameters scatter, mixed loading conditions and complex three dimensional geometry, all complicate the process of predicting fatigue crack growth in real world applications. This paper focuses on some of these complications: load spectrum influence, complex three dimensional geometry, fatigue material parameters assessment.
A coupled approach based on the two numerical methodologies, Finite Element Method (FEM) and Dual Boundary Element Method (DBEM) (Mi and Aliabadi, 1992; Calì et al., 2003; Citarella and Perrella, 2005; Sepe et al., 2015), is designed and implemented to assess the fatigue behavior of a cracked component when a general load spectrum is applied.
The adopted crack growth law is based on the Unified Approach (Sadananda et al., 1999; Sadananda and Vasudevan, 2004, 2005). In particular a coupled usage of FEM and DBEM is proposed in order to take advantage of the main capabilities of the two methods (Citarella and Cricrì, 2009; Carlone et al., 2015; Citarella et al., 2014, 2015; Carlone et al., 2016): FEM is more efficient for elastic-plastic analysis (needed to assess the residual stresses induced by the load spectrum) whilst DBEM allows an efficient and accurate automatic crack propagation, especially for complex geometry and mixed mode conditions. DBEM, as implemented in the commercial code BEASY, is adopted for the crack propagation simulation whilst the FEM code ANSYS is used to calculate the residual stresses. The procedure validation comes from comparison with experimental data (Calì et al., 2003). With such approach there are no restrictions on the test specimen and shapes of evolving crack fronts that can be reproduced in a fully automatic crack growth simulation.
2. Problem description and numerical models
2.1. Experimental test
An aluminum alloy specimen is machined in the central part in order to reduce the resistant section and facilitate the crack initiation from a triangular notch obtained with a thin saw cut (Figs. 1-2). The application of a fatigue load spectrum (Table 1) causes the initiation and propagation of a part through crack that becomes through the thickness (Fig. 2) and keeps on propagating up to the specimen failure (Fig. 2) (Calì et al., 2003).
Fig. 1. Specimen geometry.

R. Citarella et al. / Procedia Structural Integrity 2 (2016) 2631–2642 2633 R. Citarella et al./ Structural Integrity Procedia 00 (2016) 000–000 3
Fig. 2. Notch and crack front: (a) part through and (b) through crack.
Table 1. Load spectrum.
Block cycle 1 2 3 4 5
Number of cycles 27000 40 15000 40 10000
Pmax [kN] 17 22.1 17 24.65 17
Pmin [kN] 1.7 1.7 1.7 1.7 1.7
2.2. FEM and DBEM models
The aforementioned specimen is modeled by FEM, with the constraints provided by the machine grips simulated by proper boundary conditions at the two extremities. Such model is afterward imported in the DBEM environment by using interface routines that operate the skinning on the volumetric mesh and produce a boundary mesh (Fig. 3). The starting point for the crack propagation simulation is the first visible experimental crack (Calì et al., 2003): a corner crack with semielliptical axis a = 2.7 mm and c = 2.4 mm (the latter is the size measured along the thickness). The corresponding DBEM mesh is based on 3295 quadratic elements, with an overall number of degrees of freedom (dof’s) equal to 25491. After 27000 fatigue cycles the numerical corner crack dimensions become a = 3.75 mm and c = 3.45 mm and an overloading is introduced in the load spectrum (Table 1), so that an elastic-plastic analysis is needed to calculate the arising residual stresses. To this aim a FEM mesh, based on 71000 tetrahedral quadratic elements (ten nodes per element and three degree of freedom for each node) is produced, with a strong refinement nearby the crack front.
Fig. 3. DBEM model mesh and boundary conditions.
a) b)
2 R. Citarella et al./ Structural Integrity Procedia 00 (2016) 000–000
or overly simplified computer programs. Load spectrum, threshold effects, environmental conditions, microstructural effects, small crack effects, Multiple Site Damage (MSD) conditions, material parameters scatter, mixed loading conditions and complex three dimensional geometry, all complicate the process of predicting fatigue crack growth in real world applications. This paper focuses on some of these complications: load spectrum influence, complex three dimensional geometry, fatigue material parameters assessment.
A coupled approach based on the two numerical methodologies, Finite Element Method (FEM) and Dual Boundary Element Method (DBEM) (Mi and Aliabadi, 1992; Calì et al., 2003; Citarella and Perrella, 2005; Sepe et al., 2015), is designed and implemented to assess the fatigue behavior of a cracked component when a general load spectrum is applied.
The adopted crack growth law is based on the Unified Approach (Sadananda et al., 1999; Sadananda and Vasudevan, 2004, 2005). In particular a coupled usage of FEM and DBEM is proposed in order to take advantage of the main capabilities of the two methods (Citarella and Cricrì, 2009; Carlone et al., 2015; Citarella et al., 2014, 2015; Carlone et al., 2016): FEM is more efficient for elastic-plastic analysis (needed to assess the residual stresses induced by the load spectrum) whilst DBEM allows an efficient and accurate automatic crack propagation, especially for complex geometry and mixed mode conditions. DBEM, as implemented in the commercial code BEASY, is adopted for the crack propagation simulation whilst the FEM code ANSYS is used to calculate the residual stresses. The procedure validation comes from comparison with experimental data (Calì et al., 2003). With such approach there are no restrictions on the test specimen and shapes of evolving crack fronts that can be reproduced in a fully automatic crack growth simulation.
2. Problem description and numerical models
2.1. Experimental test
An aluminum alloy specimen is machined in the central part in order to reduce the resistant section and facilitate the crack initiation from a triangular notch obtained with a thin saw cut (Figs. 1-2). The application of a fatigue load spectrum (Table 1) causes the initiation and propagation of a part through crack that becomes through the thickness (Fig. 2) and keeps on propagating up to the specimen failure (Fig. 2) (Calì et al., 2003).
Fig. 1. Specimen geometry.

2634 R. Citarella et al. / Procedia Structural Integrity 2 (2016) 2631–2642 R. Citarella et al./ Structural Integrity Procedia 00 (2016) 000–000 5
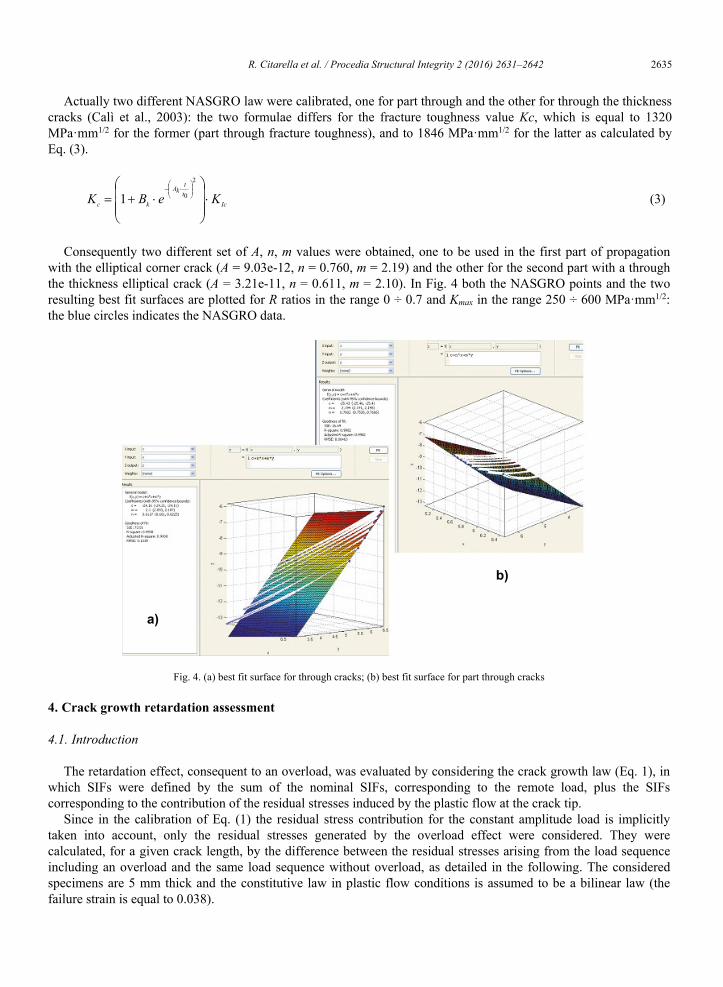
Actually two different NASGRO law were calibrated, one for part through and the other for through the thickness cracks (Calì et al., 2003): the two formulae differs for the fracture toughness value Kc, which is equal to 1320 MPa·mm1/2 for the former (part through fracture toughness), and to 1846 MPa·mm1/2 for the latter as calculated by Eq. (3).
Ictt
kA
kc KeBK
2
01 (3)
Consequently two different set of A, n, m values were obtained, one to be used in the first part of propagation with the elliptical corner crack (A = 9.03e-12, n = 0.760, m = 2.19) and the other for the second part with a through the thickness elliptical crack (A = 3.21e-11, n = 0.611, m = 2.10). In Fig. 4 both the NASGRO points and the two resulting best fit surfaces are plotted for R ratios in the range 0 ÷ 0.7 and Kmax in the range 250 ÷ 600 MPa·mm1/2: the blue circles indicates the NASGRO data.
Fig. 4. (a) best fit surface for through cracks; (b) best fit surface for part through cracks
4. Crack growth retardation assessment
4.1. Introduction
The retardation effect, consequent to an overload, was evaluated by considering the crack growth law (Eq. 1), in which SIFs were defined by the sum of the nominal SIFs, corresponding to the remote load, plus the SIFs corresponding to the contribution of the residual stresses induced by the plastic flow at the crack tip.
Since in the calibration of Eq. (1) the residual stress contribution for the constant amplitude load is implicitly taken into account, only the residual stresses generated by the overload effect were considered. They were calculated, for a given crack length, by the difference between the residual stresses arising from the load sequence including an overload and the same load sequence without overload, as detailed in the following. The considered specimens are 5 mm thick and the constitutive law in plastic flow conditions is assumed to be a bilinear law (the failure strain is equal to 0.038).
a)
b)
4 R. Citarella et al./ Structural Integrity Procedia 00 (2016) 000–000
3. Crack growth law
3.1. Introduction
The load spectrum effects arise due to perturbation of the stress distribution ahead of the crack tip with respect the steady-state stress field: for example, in presence of an overload, the stress field at crack tip is altered by residual stresses generated by the enhanced plastic deformations. The basic effect of these residual stresses is to change the effective values of the total Stress Intensity Factor (SIF) at the crack tip, with both Kmin and Kmax generally affected in the same way, so as to leave unchanged the parameter ΔK. Consequently, the primary effects of residual stresses on crack growth rates are related to Kmax variations rather than to ΔK variations. This is accounted for by the aforementioned unified approach (Sadananda et al., 1999; Sadananda and Vasudevan, 2004, 2005). According to this theory, fatigue crack growth can be viewed, fundamentally, as a two-parametric problem, where two driving forces, Kmax and ΔK, drive the growth of a fatigue crack (Eq. 1). Since it is assumed that, in presence of an overload, Kmax also enters as the major driving force for fatigue crack growth (in addition to the classical parameter, ΔK), the corresponding residual stresses can affect crack growth rate even if they do not affect the parameter ΔK. In addition, the theory assumes that there are two fatigue thresholds, K*
max,th and ΔK*th corresponding to the two driving forces.
These are asymptotic values in the ΔK–Kmax graphs of the fatigue curves: both the driving forces must be simultaneously larger than the relative thresholds for fatigue crack growth to occur. Since overload residual stress effects manifest primarily through a reduction in Kmax levels, a crack growth rate retardation generally follows the overload and an arrest in crack growth can occur if these stresses are sufficiently high (i.e. Kmax falls below Kmax,th).
The crack growth law is assumed to be of the form:
n
th
m
th KKKKAdNda *
max,max* (1)
and is calibrated by best fitting the material parameters A, n, m based on available experimental data (Calì et al., 2003). It is remarkable that the two parameter crack growth law, whose validity is expected to be extended to any overload ratio, is calibrated using only experimental data from constant amplitude test. The threshold parameters K*
max,th, ΔK*th are not available for the considered aluminium alloy and consequently they were initially
approximated using the values corresponding to the Al 2024 T351, evaluated in (Citarella and Cricrì, 2009) and equal to: ΔK*
th = 50 MPa/mm1/2 and K*max,th = 96 MPa/mm1/2 (specific tests for the material under analysis are
currently being performed to provide an accurate assessment of such thresholds).
3.2. Determination of the material parameters (A, n, m)
In order to obtain the material parameters (A, n, m), Eq. (1) was fitted, in a LabView environment, to data generated from a previously (Calì et al., 2003; Citarella and Perrella, 2005) calibrated NASGRO 2 law Eq. (2), whose parameters are reported in Table 2.
61.2 ;1126.4
11
1
neC
KRK
KKKC
dNda
q
C
p
thn
(2)
Table 2. Material parameters adopted for crack growth simulation.
E
[MPa]
ν σYS
[MPa]
σUTS
[MPa]
KIC
[MPa·mm1/2]
ΔK0
[MPa·mm1/2]
a0
[mm]
Ak, Bk p, q RC1
72000 0.3 283 309 938 120 0.102 1 1 0.7
R. Citarella et al. / Procedia Structural Integrity 2 (2016) 2631–2642 2635 R. Citarella et al./ Structural Integrity Procedia 00 (2016) 000–000 5
Actually two different NASGRO law were calibrated, one for part through and the other for through the thickness cracks (Calì et al., 2003): the two formulae differs for the fracture toughness value Kc, which is equal to 1320 MPa·mm1/2 for the former (part through fracture toughness), and to 1846 MPa·mm1/2 for the latter as calculated by Eq. (3).
Ictt
kA
kc KeBK
2
01 (3)
Consequently two different set of A, n, m values were obtained, one to be used in the first part of propagation with the elliptical corner crack (A = 9.03e-12, n = 0.760, m = 2.19) and the other for the second part with a through the thickness elliptical crack (A = 3.21e-11, n = 0.611, m = 2.10). In Fig. 4 both the NASGRO points and the two resulting best fit surfaces are plotted for R ratios in the range 0 ÷ 0.7 and Kmax in the range 250 ÷ 600 MPa·mm1/2: the blue circles indicates the NASGRO data.
Fig. 4. (a) best fit surface for through cracks; (b) best fit surface for part through cracks
4. Crack growth retardation assessment
4.1. Introduction
The retardation effect, consequent to an overload, was evaluated by considering the crack growth law (Eq. 1), in which SIFs were defined by the sum of the nominal SIFs, corresponding to the remote load, plus the SIFs corresponding to the contribution of the residual stresses induced by the plastic flow at the crack tip.
Since in the calibration of Eq. (1) the residual stress contribution for the constant amplitude load is implicitly taken into account, only the residual stresses generated by the overload effect were considered. They were calculated, for a given crack length, by the difference between the residual stresses arising from the load sequence including an overload and the same load sequence without overload, as detailed in the following. The considered specimens are 5 mm thick and the constitutive law in plastic flow conditions is assumed to be a bilinear law (the failure strain is equal to 0.038).
a)
b)
4 R. Citarella et al./ Structural Integrity Procedia 00 (2016) 000–000
3. Crack growth law
3.1. Introduction
The load spectrum effects arise due to perturbation of the stress distribution ahead of the crack tip with respect the steady-state stress field: for example, in presence of an overload, the stress field at crack tip is altered by residual stresses generated by the enhanced plastic deformations. The basic effect of these residual stresses is to change the effective values of the total Stress Intensity Factor (SIF) at the crack tip, with both Kmin and Kmax generally affected in the same way, so as to leave unchanged the parameter ΔK. Consequently, the primary effects of residual stresses on crack growth rates are related to Kmax variations rather than to ΔK variations. This is accounted for by the aforementioned unified approach (Sadananda et al., 1999; Sadananda and Vasudevan, 2004, 2005). According to this theory, fatigue crack growth can be viewed, fundamentally, as a two-parametric problem, where two driving forces, Kmax and ΔK, drive the growth of a fatigue crack (Eq. 1). Since it is assumed that, in presence of an overload, Kmax also enters as the major driving force for fatigue crack growth (in addition to the classical parameter, ΔK), the corresponding residual stresses can affect crack growth rate even if they do not affect the parameter ΔK. In addition, the theory assumes that there are two fatigue thresholds, K*
max,th and ΔK*th corresponding to the two driving forces.
These are asymptotic values in the ΔK–Kmax graphs of the fatigue curves: both the driving forces must be simultaneously larger than the relative thresholds for fatigue crack growth to occur. Since overload residual stress effects manifest primarily through a reduction in Kmax levels, a crack growth rate retardation generally follows the overload and an arrest in crack growth can occur if these stresses are sufficiently high (i.e. Kmax falls below Kmax,th).
The crack growth law is assumed to be of the form:
n
th
m
th KKKKAdNda *
max,max* (1)
and is calibrated by best fitting the material parameters A, n, m based on available experimental data (Calì et al., 2003). It is remarkable that the two parameter crack growth law, whose validity is expected to be extended to any overload ratio, is calibrated using only experimental data from constant amplitude test. The threshold parameters K*
max,th, ΔK*th are not available for the considered aluminium alloy and consequently they were initially
approximated using the values corresponding to the Al 2024 T351, evaluated in (Citarella and Cricrì, 2009) and equal to: ΔK*
th = 50 MPa/mm1/2 and K*max,th = 96 MPa/mm1/2 (specific tests for the material under analysis are
currently being performed to provide an accurate assessment of such thresholds).
3.2. Determination of the material parameters (A, n, m)
In order to obtain the material parameters (A, n, m), Eq. (1) was fitted, in a LabView environment, to data generated from a previously (Calì et al., 2003; Citarella and Perrella, 2005) calibrated NASGRO 2 law Eq. (2), whose parameters are reported in Table 2.
61.2 ;1126.4
11
1
neC
KRK
KKKC
dNda
q
C
p
thn
(2)
Table 2. Material parameters adopted for crack growth simulation.
E
[MPa]
ν σYS
[MPa]
σUTS
[MPa]
KIC
[MPa·mm1/2]
ΔK0
[MPa·mm1/2]
a0
[mm]
Ak, Bk p, q RC1
72000 0.3 283 309 938 120 0.102 1 1 0.7

2636 R. Citarella et al. / Procedia Structural Integrity 2 (2016) 2631–2642 R. Citarella et al./ Structural Integrity Procedia 00 (2016) 000–000 7
4.3. Residual stress effect on SIFs
Following Linear Elastic Fracture Mechanics (LEFM), in presence of residual stresses the parameter K can be expressed as:
Ktot = Kapplied load + Kresid. stress. (6)
Since the residual stress Kres has the same values for both maximum and minimum baseline load, it is possible to write:
Kmax,tot = Kmax,appl + Kres. (7)
and
Kmin,tot = Kmin,appl + Kres, so it follows that ΔKtot = ΔKappl. (8)
For small R ratios the minimum total SIF can become negative. Since this fact indicates that the crack tip is closed, the corresponding SIF is assumed to be zero. Taking into account the above consideration, the SIF and the driving parameters used in the following, will be adjusted:
Kmax,tot = Kmax,appl + Kres and Kmin,tot = max{Kmin,appl + Kres, 0}. (9)
The resulting Kmax,tot values (MPa·mm1/2), calculated by DBEM with the J-Integral technique (Mi and Aliabadi, 1992), are shown in Fig. 7: it is interesting to observe that while in the first stage of crack propagation (block cycle N. 1 in Table 1) the absence of residual stresses determine always increasing KI values along with the crack advance, in the second stage (block cycle N. 3), due to the residual stresses (Fig. 6), KI values are decreasing from the incr. 0 to the incr. 3 and are increasing from incr. 3 to 11. The same hold true considering the second overload (for the through crack), as detailed in the following. The propagation precedes in pure mode I so that the only KI values are displayed in the SIF graphs.
Fig. 7. (a) KI along the front with block cycle N.1; (b) KI along the front with block cycle N.3
4.4. Overall FEM-DBEM procedure
The Bueckner approach is adopted as derived from an application of the superposition principle so that the residual stress effect on the SIF values can be equivalently modelled by a distribution of tractions on the advancing crack edges (Fig. 8). Such tractions are obtained from the residual stresses, calculated by FEM on the virtual surface
a) b)
6 R. Citarella et al./ Structural Integrity Procedia 00 (2016) 000–000
4.2. Introduction
The overload residual stress calculation (Citarella and Cricrì, 2009) requires a sequence of elastic-plastic FEM simulations (Fig. 5): first, the baseline constant amplitude cycle was imposed on the specimen model (1’) so that, after load removal (2’), the material surrounding the crack tip was affected by the residual stress field corresponding to the constant amplitude load plastic zone; then, the spike load was applied and (after load removal) the corresponding residual stress field, enhanced by the overload effect, was evaluated.
Fig. 5. Applied cycles in the FEM model residual stress calculations.
Assuming that the principle of superposition holds true, it is possible to assume that the stress field after the removal of the spike load (2’’ and 1’’ in Fig. 5), is the sum of the stress field produced by the current remote load plus the residual stress field inherited by the application of the previous spike load (as a first approximation we are interested in the residual stresses which are normal to the crack faces):
σz,tot = σz,appl + σz,res. (4)
Consequently it is possible to write:
z,res(1)= z
(1’’)- z(1’) or z,res
(2)= z(2’’)- z
(2’). (5)
Results from the elastic-plastic FEM analysis, are shown in Fig. 6 for a load applied along z direction as defined in the load spectrum in Table 1, for respectively a corner and a through crack.
Fig. 6. Residual stresses (MPa) calculated along the z direction (normal to the crack plane): (a) after the first overloading (block cycle N. 2); (b) after the second overloading.
Pmax
Pov. load
Pmin = Pmax *R
P
t
1
2
1
2
1
MN
MX
XY Z
-137.24-115.427
-93.613-71.799
-49.986-28.172
-6.35915.455
37.26959.082
JUL 26 201115:33:15
NODAL SOLUTIONSTEP=9999SZ (AVG)RSYS=0DMX =.978E-03SMN =-137.24SMX =59.082
1
MN
MX
XYZ
-290.632-245.222
-199.813-154.404
-108.995-63.585
-18.17627.233
72.642118.052
JUL 26 201115:36:28
NODAL SOLUTIONSTEP=9999SZ (AVG)RSYS=0DMX =.008851SMN =-290.632SMX =118.052
a) b)

R. Citarella et al. / Procedia Structural Integrity 2 (2016) 2631–2642 2637 R. Citarella et al./ Structural Integrity Procedia 00 (2016) 000–000 7
4.3. Residual stress effect on SIFs
Following Linear Elastic Fracture Mechanics (LEFM), in presence of residual stresses the parameter K can be expressed as:
Ktot = Kapplied load + Kresid. stress. (6)
Since the residual stress Kres has the same values for both maximum and minimum baseline load, it is possible to write:
Kmax,tot = Kmax,appl + Kres. (7)
and
Kmin,tot = Kmin,appl + Kres, so it follows that ΔKtot = ΔKappl. (8)
For small R ratios the minimum total SIF can become negative. Since this fact indicates that the crack tip is closed, the corresponding SIF is assumed to be zero. Taking into account the above consideration, the SIF and the driving parameters used in the following, will be adjusted:
Kmax,tot = Kmax,appl + Kres and Kmin,tot = max{Kmin,appl + Kres, 0}. (9)
The resulting Kmax,tot values (MPa·mm1/2), calculated by DBEM with the J-Integral technique (Mi and Aliabadi, 1992), are shown in Fig. 7: it is interesting to observe that while in the first stage of crack propagation (block cycle N. 1 in Table 1) the absence of residual stresses determine always increasing KI values along with the crack advance, in the second stage (block cycle N. 3), due to the residual stresses (Fig. 6), KI values are decreasing from the incr. 0 to the incr. 3 and are increasing from incr. 3 to 11. The same hold true considering the second overload (for the through crack), as detailed in the following. The propagation precedes in pure mode I so that the only KI values are displayed in the SIF graphs.
Fig. 7. (a) KI along the front with block cycle N.1; (b) KI along the front with block cycle N.3
4.4. Overall FEM-DBEM procedure
The Bueckner approach is adopted as derived from an application of the superposition principle so that the residual stress effect on the SIF values can be equivalently modelled by a distribution of tractions on the advancing crack edges (Fig. 8). Such tractions are obtained from the residual stresses, calculated by FEM on the virtual surface
a) b)
6 R. Citarella et al./ Structural Integrity Procedia 00 (2016) 000–000
4.2. Introduction
The overload residual stress calculation (Citarella and Cricrì, 2009) requires a sequence of elastic-plastic FEM simulations (Fig. 5): first, the baseline constant amplitude cycle was imposed on the specimen model (1’) so that, after load removal (2’), the material surrounding the crack tip was affected by the residual stress field corresponding to the constant amplitude load plastic zone; then, the spike load was applied and (after load removal) the corresponding residual stress field, enhanced by the overload effect, was evaluated.
Fig. 5. Applied cycles in the FEM model residual stress calculations.
Assuming that the principle of superposition holds true, it is possible to assume that the stress field after the removal of the spike load (2’’ and 1’’ in Fig. 5), is the sum of the stress field produced by the current remote load plus the residual stress field inherited by the application of the previous spike load (as a first approximation we are interested in the residual stresses which are normal to the crack faces):
σz,tot = σz,appl + σz,res. (4)
Consequently it is possible to write:
z,res(1)= z
(1’’)- z(1’) or z,res
(2)= z(2’’)- z
(2’). (5)
Results from the elastic-plastic FEM analysis, are shown in Fig. 6 for a load applied along z direction as defined in the load spectrum in Table 1, for respectively a corner and a through crack.
Fig. 6. Residual stresses (MPa) calculated along the z direction (normal to the crack plane): (a) after the first overloading (block cycle N. 2); (b) after the second overloading.
Pmax
Pov. load
Pmin = Pmax *R
P
t
1
2
1
2
1
MN
MX
XY Z
-137.24-115.427
-93.613-71.799
-49.986-28.172
-6.35915.455
37.26959.082
JUL 26 201115:33:15
NODAL SOLUTIONSTEP=9999SZ (AVG)RSYS=0DMX =.978E-03SMN =-137.24SMX =59.082
1
MN
MX
XYZ
-290.632-245.222
-199.813-154.404
-108.995-63.585
-18.17627.233
72.642118.052
JUL 26 201115:36:28
NODAL SOLUTIONSTEP=9999SZ (AVG)RSYS=0DMX =.008851SMN =-290.632SMX =118.052
a) b)

2638 R. Citarella et al. / Procedia Structural Integrity 2 (2016) 2631–2642 R. Citarella et al./ Structural Integrity Procedia 00 (2016) 000–000 9
Fig. 10. Through crack: initial (a) and after two crack increments corresponding to 2000 cycles (b).
At this point a FEM elastic-plastic simulation provides the residual stresses (Fig. 6.b), induced by such second overload, to be imported on the crack faces in the DBEM environment to continue the crack propagation simulation (Fig. 11); again it is interesting to observe that the maximum compressive stresses are introduced after three increments consistently with the “delayed retardation” phenomenon.
Fig. 11. Normal tractions (MPa) on the through crack: (a) after eight crack increments; (b) after three crack increments.
From Fig. 12.a, looking at the initially decreasing KI values against crack advance, it is clear the beneficial effect of the compressive residual stresses generated at the crack tip by the overload. Such phenomena is also evident from Fig. 12.b where the crack opening displacement (COD) reduction is visible in correspondence of that part of crack experiencing compressive residual stresses: for such third stage of crack propagation the crack is all through, the second overload has been already applied and the propagation goes on for additional 12000 cycles. For the initial part (up to increment N. 8) of the through crack propagation the average advance along the crack front is equal to 0.15 mm; afterward, as the residual stress gradients becomes less pronounced, it is gradually increased together with a decrease of crack mesh refinement and consequent beneficial effects on computational burden.
a) b)
8 R. Citarella et al./ Structural Integrity Procedia 00 (2016) 000–000
traced by the advancing crack (the material is not yet cracked when the FEM elastic-plastic analysis is done). The following step is the DBEM crack propagation simulation, with the stress intensity factors (SIFs) and crack growth rates automatically calculated by DBEM, when the chosen crack propagation law (Eq. 1) is implemented. The DBEM modelled specimen has an initial crack corresponding to the configuration existing when the first overload is applied. Such specimen undergoes a remote traction load as dictated by the load spectrum (Table 1). The residual stresses are transferred from FEM to DBEM environment and automatically applied on the crack faces during the propagation. In Fig. 9 it is possible to see the residual stresses applied on the corner crack faces for the DBEM analysis, after one, and three crack increments. The average advance along the crack front is set equal to 0.15 mm for the initial five increments and 0.25 mm for the subsequent steps. It is interesting to point out that the maximum compressive stresses are applied on the crack at the second increment, and this is consistent with the experimental aspect of the so called “delayed retardation” (the crack growth rate minimum value is not reached immediately after the overload).
After 40000 cycles the crack becomes through the thickness; the c letter will now be replaced by b that will represent the crack length at the break through point measured along the specimen width (the analogous of a but measured on the opposite specimen side): such length, for the simulation of the through crack propagation, is initially set equal to the experimental value after 40000 cycles (b = 3.8 mm), because when the crack in on the verge to become through the thickness LEFM is not anymore applicable. With such assumption the initial through crack is characterised by an elliptical front with b = 3.8 mm and a = 4.9 mm (the latter value is obtained by the corner crack numerical simulation) and propagates for the last 2000 cycles of block N. 3 (Fig. 10), up to the second overload (block cycle N. 4).
Fig. 8. Superposition principle for SIFs assessment.
Fig. 9. Normal tractions (MPa) on the crack faces: after one (a) or three crack increments (b).
a) b)

R. Citarella et al. / Procedia Structural Integrity 2 (2016) 2631–2642 2639 R. Citarella et al./ Structural Integrity Procedia 00 (2016) 000–000 9
Fig. 10. Through crack: initial (a) and after two crack increments corresponding to 2000 cycles (b).
At this point a FEM elastic-plastic simulation provides the residual stresses (Fig. 6.b), induced by such second overload, to be imported on the crack faces in the DBEM environment to continue the crack propagation simulation (Fig. 11); again it is interesting to observe that the maximum compressive stresses are introduced after three increments consistently with the “delayed retardation” phenomenon.
Fig. 11. Normal tractions (MPa) on the through crack: (a) after eight crack increments; (b) after three crack increments.
From Fig. 12.a, looking at the initially decreasing KI values against crack advance, it is clear the beneficial effect of the compressive residual stresses generated at the crack tip by the overload. Such phenomena is also evident from Fig. 12.b where the crack opening displacement (COD) reduction is visible in correspondence of that part of crack experiencing compressive residual stresses: for such third stage of crack propagation the crack is all through, the second overload has been already applied and the propagation goes on for additional 12000 cycles. For the initial part (up to increment N. 8) of the through crack propagation the average advance along the crack front is equal to 0.15 mm; afterward, as the residual stress gradients becomes less pronounced, it is gradually increased together with a decrease of crack mesh refinement and consequent beneficial effects on computational burden.
a) b)
8 R. Citarella et al./ Structural Integrity Procedia 00 (2016) 000–000
traced by the advancing crack (the material is not yet cracked when the FEM elastic-plastic analysis is done). The following step is the DBEM crack propagation simulation, with the stress intensity factors (SIFs) and crack growth rates automatically calculated by DBEM, when the chosen crack propagation law (Eq. 1) is implemented. The DBEM modelled specimen has an initial crack corresponding to the configuration existing when the first overload is applied. Such specimen undergoes a remote traction load as dictated by the load spectrum (Table 1). The residual stresses are transferred from FEM to DBEM environment and automatically applied on the crack faces during the propagation. In Fig. 9 it is possible to see the residual stresses applied on the corner crack faces for the DBEM analysis, after one, and three crack increments. The average advance along the crack front is set equal to 0.15 mm for the initial five increments and 0.25 mm for the subsequent steps. It is interesting to point out that the maximum compressive stresses are applied on the crack at the second increment, and this is consistent with the experimental aspect of the so called “delayed retardation” (the crack growth rate minimum value is not reached immediately after the overload).
After 40000 cycles the crack becomes through the thickness; the c letter will now be replaced by b that will represent the crack length at the break through point measured along the specimen width (the analogous of a but measured on the opposite specimen side): such length, for the simulation of the through crack propagation, is initially set equal to the experimental value after 40000 cycles (b = 3.8 mm), because when the crack in on the verge to become through the thickness LEFM is not anymore applicable. With such assumption the initial through crack is characterised by an elliptical front with b = 3.8 mm and a = 4.9 mm (the latter value is obtained by the corner crack numerical simulation) and propagates for the last 2000 cycles of block N. 3 (Fig. 10), up to the second overload (block cycle N. 4).
Fig. 8. Superposition principle for SIFs assessment.
Fig. 9. Normal tractions (MPa) on the crack faces: after one (a) or three crack increments (b).
a) b)

2640 R. Citarella et al. / Procedia Structural Integrity 2 (2016) 2631–2642 R. Citarella et al./ Structural Integrity Procedia 00 (2016) 000–000 11
considering the through crack propagation phase (Fig. 14). On the contrary at this stage the propagation is less sensitive to SIF threshold values.
Fig. 14. Crack length vs. number of cycles for the corner crack and for the through crack.
6. Conclusions
A satisfactory agreement was obtained between numerical and experimental crack propagation rates when using the two parameter formula, with the related constants provided by in house made experimental tests. Such formula turned out to be sufficiently accurate for variable amplitude load cycles, as applied to the considered specimens, because able to keep into account the retardation phenomena induced by the introduction of the residual stresses generated by the load spectrum.
It is remarkable the extreme flexibility and efficiency of the methodology adopted, because the two methodologies (FEM and DBEM) are complementary for such kind of problems: FEM is more efficient for elastic-plastic analysis whereas the accuracy typical of the Boundary Element Method applied to fracture mechanics is well known, with the three dimensional crack propagation proceeding in a fully automatic way.
Further development will see the fulfillment of all the needed test in order to rigorously assess the Kmax,th values for the analyzed material.
References
Calì C., Citarella R., Perrella M., 2003. Three-dimensional crack growth: numerical evaluations and experimental tests. In Biaxial/Multiaxial Fatigue and Fracture, ESIS Pubblication 31, Ed. Elsevier, 341-360.
Calì C., Citarella R., Perrella M.,2003. Crack growth under general load spectrum: numerical simulation and experimental tests. Proc. of CMEM 2003, 11th International Conference, Halkidiki, Greece, Vol. 1, 159-170.
Carlone P., Citarella R., Lepore M., Palazzo G.S., 2015. A FEM-DBEM investigation of the influence of process parameters on crack growth in aluminium friction stir welded butt joints. International Journal of Material Forming 8 (4), 591-599.
Carlone P., Citarella R., Sonne M. R., Hattel J. H., 2016. Multiple crack growth prediction in AA2024-T3 friction stir welded joints, including manufacturing effects. International Journal of Fatigue 90, 69–77.
10 R. Citarella et al./ Structural Integrity Procedia 00 (2016) 000–000
Fig. 12. (a) values KI along the through crack front; (b) crack opening reduction due to closure phenomenon.
5. Numerical-experimental comparison
Crack growth rates can be predicted, as written before, by using Eq. (1) where ΔKtot and Kmax,tot include the contributions from both applied and internal (residual) stresses. In Fig. 13 the crack length, measured at break through points, vs. number of cycles is plotted for comparison between experimental and numerical results. The retardation on crack advances is evident for both the corner crack (after 27000 cycles) and especially for the through crack (after 42000 cycles). After 42000 cycles the two length a and b get sufficiently close each other so that for sake of simplicity they were both assumed equal to (a+b) /2 in the numerical simulation and this is the reason for only one curve is plotted for the numerical simulation after 42000 cycles (the simulation is anyway still three-dimensional). The retardation phenomenon due to the first overload (block 2) is slightly more prominent in the numerical simulation than from the experiment and in general all the corner crack numerical propagation is slightly slower: this is likely due to the approximations induced by the lack of knowledge of the specific thresholds for the considered aluminum. As a matter of fact, considering the non-exhausting outcomes (just one stress ratio R = 0.1 has been tested up to now) of an experimental campaign (Fig. 13), aimed at calculating the specific Kmax,th for the considered material, it is possible to forecast a lower value for the Kmax,th. This can be envisaged because the upper bound value of 94 MPa·mm1/2 obtained for R = 0.1 from the aforementioned experimental threshold tests is already lower than the value of 96 MPa·mm1/2 adopted for the calculations (further test are needed with different R values).
Fig. 13. Specimen with crack gauges to evaluate the Kmax,th for analyzed material.
It is clear that using lower Kmax,th it is possible to increase the numerical crack growth rates and consequently get improved correlations, especially in the first stage of part through crack propagation (more sensitive to Kmax,th values), without compromising the very accurate numerical-experimental correlation already available when
a) b)

R. Citarella et al. / Procedia Structural Integrity 2 (2016) 2631–2642 2641 R. Citarella et al./ Structural Integrity Procedia 00 (2016) 000–000 11
considering the through crack propagation phase (Fig. 14). On the contrary at this stage the propagation is less sensitive to SIF threshold values.
Fig. 14. Crack length vs. number of cycles for the corner crack and for the through crack.
6. Conclusions
A satisfactory agreement was obtained between numerical and experimental crack propagation rates when using the two parameter formula, with the related constants provided by in house made experimental tests. Such formula turned out to be sufficiently accurate for variable amplitude load cycles, as applied to the considered specimens, because able to keep into account the retardation phenomena induced by the introduction of the residual stresses generated by the load spectrum.
It is remarkable the extreme flexibility and efficiency of the methodology adopted, because the two methodologies (FEM and DBEM) are complementary for such kind of problems: FEM is more efficient for elastic-plastic analysis whereas the accuracy typical of the Boundary Element Method applied to fracture mechanics is well known, with the three dimensional crack propagation proceeding in a fully automatic way.
Further development will see the fulfillment of all the needed test in order to rigorously assess the Kmax,th values for the analyzed material.
References
Calì C., Citarella R., Perrella M., 2003. Three-dimensional crack growth: numerical evaluations and experimental tests. In Biaxial/Multiaxial Fatigue and Fracture, ESIS Pubblication 31, Ed. Elsevier, 341-360.
Calì C., Citarella R., Perrella M.,2003. Crack growth under general load spectrum: numerical simulation and experimental tests. Proc. of CMEM 2003, 11th International Conference, Halkidiki, Greece, Vol. 1, 159-170.
Carlone P., Citarella R., Lepore M., Palazzo G.S., 2015. A FEM-DBEM investigation of the influence of process parameters on crack growth in aluminium friction stir welded butt joints. International Journal of Material Forming 8 (4), 591-599.
Carlone P., Citarella R., Sonne M. R., Hattel J. H., 2016. Multiple crack growth prediction in AA2024-T3 friction stir welded joints, including manufacturing effects. International Journal of Fatigue 90, 69–77.
10 R. Citarella et al./ Structural Integrity Procedia 00 (2016) 000–000
Fig. 12. (a) values KI along the through crack front; (b) crack opening reduction due to closure phenomenon.
5. Numerical-experimental comparison
Crack growth rates can be predicted, as written before, by using Eq. (1) where ΔKtot and Kmax,tot include the contributions from both applied and internal (residual) stresses. In Fig. 13 the crack length, measured at break through points, vs. number of cycles is plotted for comparison between experimental and numerical results. The retardation on crack advances is evident for both the corner crack (after 27000 cycles) and especially for the through crack (after 42000 cycles). After 42000 cycles the two length a and b get sufficiently close each other so that for sake of simplicity they were both assumed equal to (a+b) /2 in the numerical simulation and this is the reason for only one curve is plotted for the numerical simulation after 42000 cycles (the simulation is anyway still three-dimensional). The retardation phenomenon due to the first overload (block 2) is slightly more prominent in the numerical simulation than from the experiment and in general all the corner crack numerical propagation is slightly slower: this is likely due to the approximations induced by the lack of knowledge of the specific thresholds for the considered aluminum. As a matter of fact, considering the non-exhausting outcomes (just one stress ratio R = 0.1 has been tested up to now) of an experimental campaign (Fig. 13), aimed at calculating the specific Kmax,th for the considered material, it is possible to forecast a lower value for the Kmax,th. This can be envisaged because the upper bound value of 94 MPa·mm1/2 obtained for R = 0.1 from the aforementioned experimental threshold tests is already lower than the value of 96 MPa·mm1/2 adopted for the calculations (further test are needed with different R values).
Fig. 13. Specimen with crack gauges to evaluate the Kmax,th for analyzed material.
It is clear that using lower Kmax,th it is possible to increase the numerical crack growth rates and consequently get improved correlations, especially in the first stage of part through crack propagation (more sensitive to Kmax,th values), without compromising the very accurate numerical-experimental correlation already available when
a) b)

2642 R. Citarella et al. / Procedia Structural Integrity 2 (2016) 2631–264212 R. Citarella et al./ Structural Integrity Procedia 00 (2016) 000–000
Citarella R., Perrella M., 2005. Multiple surface crack propagation: numerical simulations and experimental tests. Fatigue and Fracture of Engineering Material and Structures 28, 135-148.
Citarella R, Cricrì G, 2009. A two-parameter model for crack growth simulation by combined FEM-DBEM approach. Advances in Engineering Software 40 (5), 363–377.
Citarella, R., Carlone, P., Sepe, R., Lepore, M.; (2014). Multiple crack propagation in friction stir welded aluminium joints. Civil-Comp Proceedings, 105.
Citarella R., Cricrì G., Lepore M., Perrella M., 2014. Assessment of crack growth from a cold worked hole by coupled FEM-DBEM approach. Key Engineering Materials 577-578, 669-672.
Citarella R., Carlone P., Lepore M., Palazzo G.S., 2015. Numerical–experimental crack growth analysis in AA2024-T3 FSWed butt joints. Advances in Engineering Software 80, 47–57.
Citarella R., Carlone P., Sepe R., Lepore M., 2015. DBEM crack propagation in friction stir welded aluminum joints. Advances in Engineering Software, doi:10.1016/j.advengsoft.2015.12.002.
Mi,Y., Aliabadi, M.H. 1992. Dual Boundary Element Method for three dimensional fracture mechanics analysis. Engineering Analysis with Boundary Elements 10, 161-171.
Sadananda K., Vasudevan A.K., Holtz R.L., Lee E.U., 1999. Analysis of overload effects and related phenomena. International Journal of Fatigue 21, 233–246.
Sadananda K., Vasudevan A.K., 2004. Crack tip driving forces and crack growth representation under Fatigue, International Journal of Fatigue 26, 39–47.
Sadananda K., Vasudevan A.K., 2004. Non propagating incipient cracks from sharp notches under fatigue, Acta Materialia 52, 4239–4249. Sadananda K., Vasudevan A.K., 2005. Fatigue crack growth behavior of titanium alloys. International Journal of Fatigue 27, 1255–1266. Sepe R., Armentani E., Di Lascio P., Citarella R., 2015. Crack growth behaviour of welded stiffened panel. Procedia Engineering 109, 473-483.