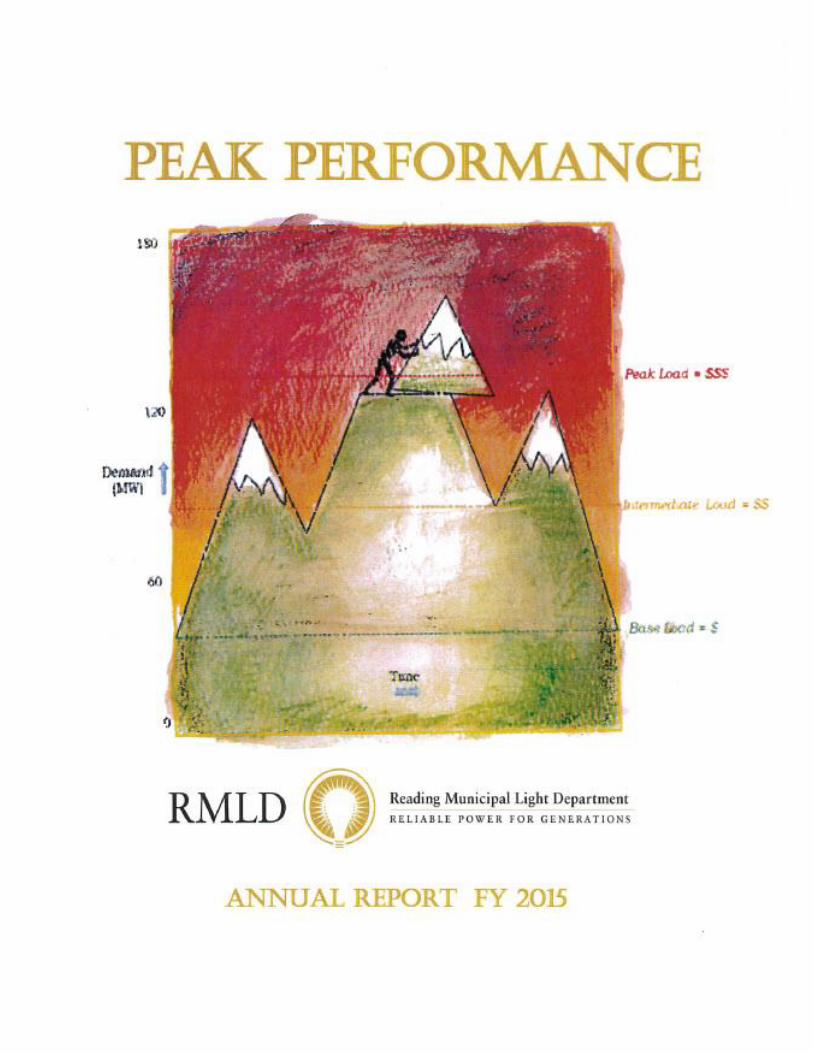
cover design by rmld integrated resource engineer rahul shah
TRANSCRIPT

2
Cover design by RMLD
Integrated Resource Engineer Rahul Shah

3
To our customers, The path to the peak can be a combination of addressing hardened trails, rocky terrain and vertical climbs. RMLD made great strides over the last year assessing its present position and plotting out its course to meet the challenges of the utility industry, present and future. A completion of the Reliability Study and the Organizational Study, the analysis of, and the commitments to the recommendations have helped form a solid route. A quality electric utility must have the ability to be proactive in all disciplines of planning, including
system function and operation, staffing, succession and skill training. It must have the ability to be reactive through planned reaction procedures to unforeseen events, such as weather and power market volatility. It must be diligent in ensuring that their plans and strategies are reviewed at such a frequency to ensure that the utility stays aligned with the path of success. The RMLD staff has been working hard to review, develop and implement all of the necessary actions to ensure a high level of quality. Any change or transitioning phase in a company on its path to the peak, can be a bit overwhelming for some. For others it can be exhilarating to be an integral asset in the charge to improve efficiencies, talent management, implement best utility practices in financial, system function, customer programs, etc. Through continued communication and leadership, within the company, with our service towns and with our customers, the end result will be … peak performance. Regarding the stabilization of rates, peak performance means climbing a mountain to discover the peak and then shaving off the summit to a flat and stable surface. Peak energy prices have a premium. Together with our customers, RMLD has developed new programs that will help to shave the summit and stabilize rates. The electric utility industry is going through its own changes and transitioning. The impact of imminent capacity and transmission increases in the New England area, the move towards solar power and electric vehicles are just some of the changes which impact utilities. RMLD has worked, and will continue to work diligently, to proactively address any impact the changes bring. Sincerely,
Coleen O’Brien General Manager
4
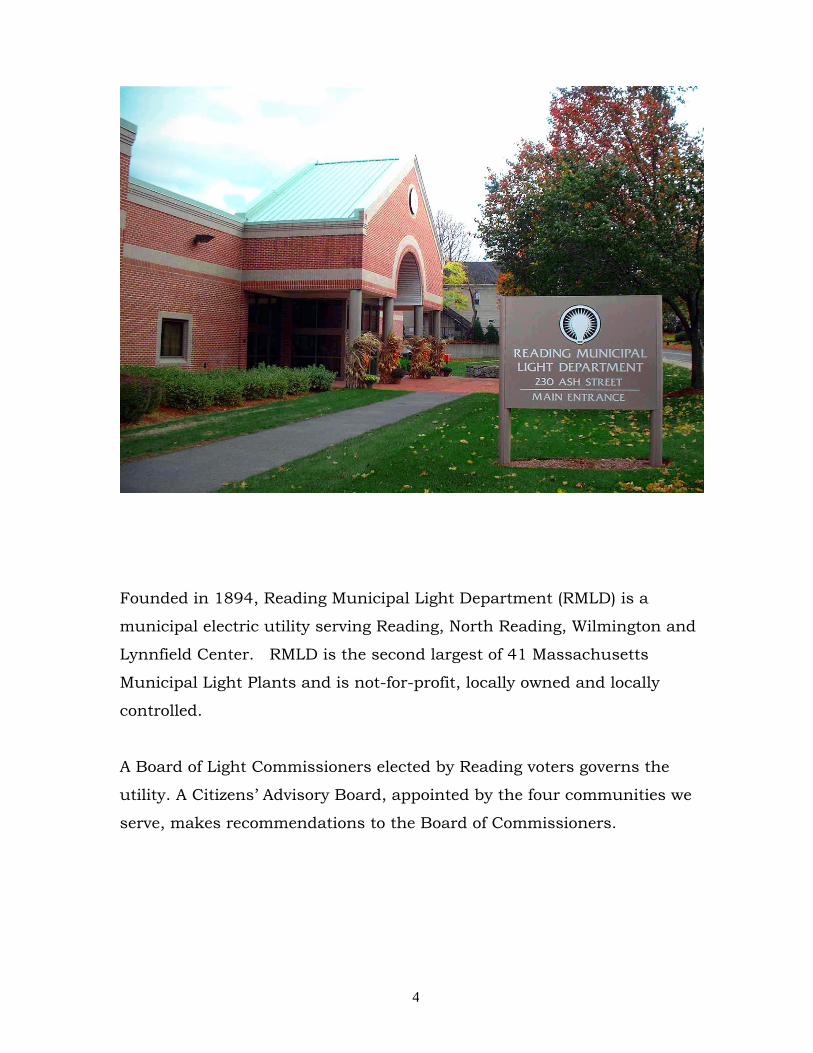
Founded in 1894, Reading Municipal Light Department (RMLD) is a
municipal electric utility serving Reading, North Reading, Wilmington and
Lynnfield Center. RMLD is the second largest of 41 Massachusetts
Municipal Light Plants and is not-for-profit, locally owned and locally
controlled.
A Board of Light Commissioners elected by Reading voters governs the
utility. A Citizens’ Advisory Board, appointed by the four communities we
serve, makes recommendations to the Board of Commissioners.

5
RMLD Board of Commissioners
RMLD Citizens’ Advisory Board
David Talbot Vice Chair Vice Chair
Philip Pacino Commissioner
David Hennessey
Commissioner
Thomas O’Rourke
Chair
George Hooper, Chair - Wilmington (seated, left) David Nelson, Vice Chair – Lynnfield (missing from photo) David Mancuso, Secretary – Reading (standing, left) Dennis P. Kelley – Wilmington (seated, right) Mark Chrisos - North Reading (standing, right)
John Stempeck
Commissioner

6
FOCUSING ON PEAK PERFORMANCE
In our continuing effort to bring RMLD to the forefront of the demanding
electrical utility industry, we consistently strive to improve efficiency to
attain peak performance. RMLD not only delivers electricity to our
customers, but provides a resource of information, support and incentive
programs on energy awareness, electrical safety, and electrical efficiency to
help keep costs down. Our employees are working to ensure peak
performance in all aspects of the electric utility business.
In FY 2015, many initiatives were implemented to increase the overall
electric system performance, organizational efficiency and productivity by
providing a technology roadmap, conducting a system Reliability and
Organizational Study, starting the transitioning toward Asset Manage-ment
Strategy, developing a comprehensive seven-point maintenance plan and
developing a peak shaving model/portfolio with our newly reorganized
Integrated Resources Division (IRD).
IRD combines energy services, the purchase of power, the creation of new
efficiency programs and the marketing of these programs, all related to
lowering RMLD’s peak usage (and yours) to keep rates stable and to help
save you money on your electric bill.
The electric demand (kW or Mw) is a measure of the rate of energy used by
electrical equipment during a specific period of time. The rate of energy
used is based on the number and size of electrical equipment used
simultaneously. The amount of equipment connected and running

7
at the same time will determine the rate of electricity or demand used at
any given time. The electric meter constantly measures the amount of
current flowing through the meter and totals within 15-minute intervals,
which registers on the meter.
Demand reduction results in cost benefits and a decrease in capacity,
transmission and energy costs. RMLD incentives for peak reduction are
the basis for our rebate structure, Demand Response and the Peak
Demand Reduction (PDR) programs. The reduction of peak demand
translates to lower electric bills for our customers, as does our Time-of-Use
(TOU) rate and Hot Water Heater Program rate.
RMLD encourages the efficient use of electricity by interacting with
customers, building relationships, educating customers, promoting energy
awareness and familiarizing customers about lighting, HVAC, motors and
compressors.
RMLD has embraced and utilized advanced technologies by using Smart
Grid technology and offering rebates on residential electric vehicle charging
stations. Our IRD and Engineering groups keep on top of industry
challenges on the distribution and generation side, where we are currently
researching the cost benefit and integration of such technologies as gas
peaking units, community solar power and battery storage, into our
portfolio as a means of diversity and peak reduction.
The key in making all of these improvements, programs, incentives, etc.
successful is communication. Internally and externally we continue to
meet our goal from last year. The Be Efficient, Get Greener, Go Paperless
campaign is addressed in every aspect of the business. Our newsletter In
Brief is now digital, customers can read it on our website or receive a

8
link via email. This Annual Report was designed and written in-house and
100% paperless.
Efficient communications in the world changes rapidly. Establishing and
maintaining a consistent two-way communication path is often challeng-
ing. More and more people are discontinuing their landline phones at their
homes and turning to the internet to get their information. This translates
to RMLD continuing its effort to keep contact information up to date. We
have made a concerted effort to ask our customers to provide their
information and have been successful in increasing our database from
5,000 emails or texts to 15,000 in just this year. Having a means to
communicate paperless with each and every one of our customers will lend
itself to the success of sharing knowledge, program updates, customer
feedback and electric system status.
FY 2015 Statistics System peak demand 157,252 kW on Friday, July 2, 2014, at 4pm. This is 8.84% lower
than the highest peak demand of 172,493 kW set in August 2006.
Retail sales 689,722,742 kWh
Customer calls for service 1,506
Pole installations 186
Meter replacements 158
DigSafe calls 4,291
New services Reading – 58 residential; 7 commercial/industrial
North Reading – 27 residential; 9 commercial/industrial
Lynnfield – 9 residential; 1 commercial/industrial
Wilmington – 30 residential; 17 commercial/industrial
TOTAL: 124 new residential services represent a 26% decrease
from these services from FY 2014
34 new commercial/industrial services were installed representing
a 36% decrease from these services in FY 2014
9
FY 2015 PEAK PERFORMANCE ACCOMPLISHMENTS
It’s all about moving from reactive to proactive. Peak performance is
achieved through planned efforts and proper communication. A Cost of
Service Study, a restructuring of rates, an Organizational and Reliability
Study, commencing talent management, policy and procedure develop-
ment and updates, and the creation of short-and-long term plans and
roadmaps, are just the bold highlights of this year’s successes on our
journey to the peak. Here is staff’s detailed peak journey highlights:
BUSINESS AND FINANCIAL
Upgrading financial and billing software and hardware,
Reformatted financials to incorporate budget to actual on unbundled
rate structure,
Budget prepared Capital and Expense and presented (six-year
projections),
Performed annual audit with no management letter,
Implemented Cost of Service Study recommendations,
Created more flexible payment options through software upgrades,
Instituted monthly detailed financial meetings.
EFFICIENCY MEASURES
Successfully applied for $250,000 LED grant from Department of
Energy (DOE); split between streetlights in all four towns and to LED non-municipal,
Completed LED Pilot Program installation and met with Town officials for feedback,
Paperless business strategy,
Successfully applied for grant and developed partnership on electric
charging stations with customer,
Installed three charging stations at Analog Devices,
Continued to develop economic incentive programs to attract and/or retain customers,
Updated all residential and commercial rebate and incentive programs.
10
SYSTEM RELIABILITY
Established Request for Proposal (RFP) Review Committee for
Reliability Study (system condition assessment, GIS, integration, Outage Management System, planned capacity, etc.) and awarded to
Booth and Associates,
Completed Reliability Study,
Prepared RFP for 500 Club Advanced Metering Infrastructure (AMI) meters,
Designed AMI mesh network overlay to fixed network system,
Developed long-term roadmap for distribution automation,
Upgraded hardware and software for Survalent SCADA system to
enable system automation,
Formalized Safety Program and Safety Committee,
Ensured NERC compliance and applicable safety and industry standards,
Developed Environmental Assessment and recommendations,
Implemented double pole tracking software with Verizon, Comcast
and fire,
Developed GIS data collection specification,
Developed and implemented new comprehensive system mainten-
ance programs:
o Pole testing,
o Manhole inspections, o Transformer Load Management analysis and replacement
scheduling,
o Porcelain cutout replacement, o Asset Management Database for predictive and preventative
maintenance, o Developed RFP for new Tree Trimming Program, awarded
contract to Mayer Tree Company,
o Developed new Vegetation Management Program, o Completed all baseline substation maintenance,
o Performed quarterly inspection of distribution feeders.
Implemented System reliability Design software “Pole Forman” to
follow NESC code,
Performed Arc Flash study to bring RMLD in compliance with OSHA
and NFPA codes.

11
Key industry standard metrics have been identified to enable the RMLD to measure and track system reliability.
SAIDI (System Average Interruption Duration Index) is defined as the average interruption duration (in minutes) for customers served by the utility system during a specific time period. SAIDI = the sum of all customer interruption durations within the specified timeframe ÷ average number of customers served during that period. SAIFI (System Average Interruption Frequency) is defined as the average number of instances a customer on the utility system will experience an interruption during a specific time period. SAIFI = the total number of customer interruptions ÷ average number of customers served during
that period.
CAIDI (Customer Average Interruption Duration Index) is defined as the average duration (in minutes) of an interruption experienced by customers during a specific timeframe. CAIDI = the sum of all customer interruption durations during that time period ÷ the number of customers that experienced one or more interruptions during that time period.
.
System Reliability Indicies
12
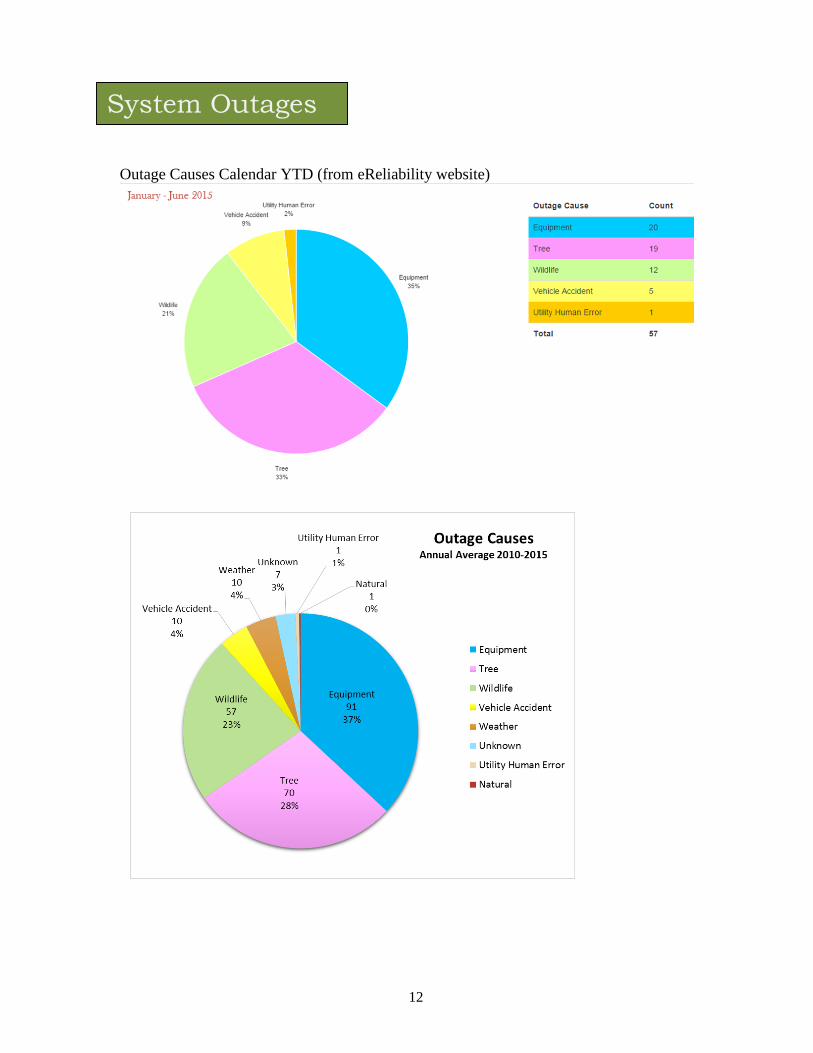
Outage Causes Calendar YTD (from eReliability website)
System Outages
13
LEADERSHIP
Established RFP Review Committee for Organizational Study
(organizational assessment of structure, skill sets, career development plans, succession planning and best utility business
practices) and awarded to Leidos Engineering,
Completed Organizational Study,
Continued to delegate, monitor, mentor and support the impact of culture changes as a result of transitioning company from reactive to
proactive,
Continued the full policy review for legal compliance,
Continued identification and development of the absence of best practices procedures,
Communicated effectively and frequently, and with transparency, to educate and inform the RMLD Board of Commissioners and the
Citizens Advisory Board (CAB), on the general information pertaining to the health and operations of RMLD, along with any issues relating
to governance or unusual situations.
COMMUNICATIONS AND COMMUNITY RELATIONS
INTERNAL
o Windows 365 completed,
o Completed development of intranet, SharePoint, o Commenced development of Division Dashboards,
o Increased regular senior staff meetings, o Continued quarterly company meetings.
EXTERNAL
o Developed Communications roadmap, o Met with each of the town safety officers (police and fire) and
determined appropriate emergency response data for Reverse 911 on major outages, power warnings, etc.,
o Continued Be Efficient, Get Greener, Go Paperless public
relations campaign, o Met with Town Managers and Boards of Selectman bi-annually
and provided presentation updates,

14
o Worked to develop a strong communication effort between Town Selectmen, RMLD Board of Commissioners and CAB members,
o Held 2nd Annual Public Power Open House, o Continued working relationships with state and national utility
associations,
o Communicated effectively with community and business
interests in the four towns,
o Actively involved in industry changes at federal and state levels
to mitigate impact. Issues included REGGIE refund money,
transmission and capacity increases, behind-the-fence
generation and reconstitution.
EMPLOYEE SAFETY AND RELATIONS
Completed Career Development Plans (CDP) for each job description
and restructured organizational chart for optimal efficiency, safety and succession,
Initiated Phase II, Change Management, sync CDPs with job descriptions with wage scales,
Fully implemented Lineworker Operations restructuring with a new qualified performance based apprentice lineworker journeyman
program,
Fully implemented new Technical Services restructuring with a new
qualified performance based apprentice technician journey-man program,
Fully implemented Control Room Operator positions,
Established Assistant General Line Foreman position,
Restructured Energy Services Division to Integrated Resources Division,
Mandated National Electrical Safety Code Training (NESC),
Performed mandated Arc Flash study and implementing results.
HUMAN RESOURCES
Improving all aspects of Talent Management,
Working to ensure all appropriate training is provided for staff in
accordance with CDPs to ensure appropriate skill sets,
Working to develop healthy MIIA program offerings to employees,
Uploaded all union contracts, forms, benefits, etc. to Sharepoint,

15
POWER SUPPLY/RATES
Unbundled rates, provided Reading Cable TV (RCTV) presentation and issued new formatted bills effective July 1, 2014,
Developed and implemented new LED streetlight rate and low income rate,
Provided budget input projections for electricity line items to towns for appropriate segue to budget process,
Continued laddering and layering approach for power supply procurement strategy, including renewable projects,
Continued Renewable Energy Credit (REC) sales, Signed a four-year energy Power Supply Agreement (PSA)(2015-2018)
with Shell Energy for 463,067 Mwh for a total of $29,215,832,
Signed a four-year energy PSA (2016-2019) with Exelon (2016-2018)
and NextEra (2019) for 404,505 Mwhs for a total of $19,095,949,
Attended ISO-NE’s Participant Committee Annual Meeting with State
Regulators and ISO-NE Board members,
30 Energy and Lighting Commercial Rebate Projects,
$226,119.66 energy conservation fund dollars used, resulting in 1,132,702 kWh, 345.500kW savings,
Two government grants (Municipal Light Plant [MLP] $250k, [$125k for streetlights, $75k for internal and external commercial LEDs and
$50k for residential LEDs] and Mass Electric Vehicle Incentive Program [EVIP] $9,785.25),
MLP LED Grant resulted in $75,000 distributed to 15 companies, 650,052 kWh, 148.056 kW saved,
Mass EVIP $9,785.25 furnished and installed six RMLD-owned Electric Vehicle Supply Equipment in Wilmington, resulting in
$773.48 added revenue since Jan 2015,
o 4.148 (MWh) Energy Use,
o 1,742 (kg) GHG gases saved, o 520.622 (gallons) Gasoline saved,
o 618 Total charge-ups.
Launched Peak Demand Reduction (PDR) Program for our 500 Club,
commercial and industrial and our municipal customers. To date, 13 customers have formally signed onto the PDR Program and our load-
shedding results have been in the 500 kW to 1 MW range,

16
Collaborated with Engineering Division to specify the first 2MW
Distributed Generation (DG) peak shaving system to be installed at an RMLD substation,
Coordinated efforts to work with some of our largest customers, to site DG assets at their facilities,
Commenced to develop a detailed plan for RMLD’s version of a Community Shared Solar Program. Our program will be called Solar Choice and replaces our Green Choice program. Plan is to issue an RFP by end of October 2015 to solicit a solar developer to
build the first array,
Actively participated in Towns’ economic development discussions,
Attended several technical seminars on Energy Storage applications for the Utility Industry,
Attended industry training on Interconnecting Distributed Generation,
Collaborated with Engineering to apply for a state grant to fund an Energy Storage pilot project,
Completed Account Manager training workshop through APPA.
Millstone #3, 6.2%
Seabrook , 9.9%
Stonybrook Intermediate,
2.4%
Shell Energy, 20.2%
NextEra, 15.4%
NYPA, 3.2%
ISO Interchang
e , 9.8%
BP Energy, 16.3%
Hydro Projects,
0.6%
Braintree Watson Unit, 0.4%
Saddleback Wind, 0.3%
Exelon, 15.1%
Stonybrook Peaking, 0.0%
RMLD Energy by Resources
17
CONSTRUCTION
Construction throughout the system is performed to provide reliability
enhancement, to connect new loads, or to address areas requiring
upgrades. This work includes both overhead and underground cable
installation, service installation and upgrades, installation and removal of
poles, transfers of electrical equipment, and performing work related to
Massachusetts Highway Projects (Force
Accounts).
Reading:
Circuit Upgrades:
Approximately 400 feet of primary cable and secondary cable were
installed at 184 Woburn Street,
Approximately 1,300 feet of primary cable and secondary cable were
installed on Mark Avenue and Laurel Lane,
Approximately 650 feet of secondary cable were installed on Mineral
Street,
Circuit 4W12: Reconductored 300 circuit feet of underground cable
with 15 kV, 750 mcm CU underground cable.
Commercial/Industrial:
Notable examples of new service additions or upgrades:
St. Agnes Church Parish Center – 184 Woburn Street,
Cumberland Farms – 303 Salem Street.
Force Account Projects:
West Street – replaced, relocated and transferred 35 poles for the
Mass DOT West Street roadway project,
Route 129 Rotary – replaced and relocated one pole for the widening
of the Haverhill Street access road.
Wilmington:
Circuit Upgrades:

18
Circuit 5W6: Reconductored 250 circuit feet of underground cable with 15 kV, 750 mcm CU underground cable,
Approximately 1,200 feet of primary underground and two pad-mount transformers were installed on Quail Run,
Approximately 250 feet of primary and 600 feet of secondary cable were installed on Muse Avenue and Cross Street.
Pole Line Upgrade:
Replaced 29 poles, transferred five primary circuits, secondary cable, streetlights, and services on Lowell Street between West and Woburn
Streets.
Commercial/Industrial:
Notable examples of new service additions or upgrades:
Kirkwood Printing – 904 Main Street,
Commercial Building – 110 Eames Street,
Burlington Self Storage – 114 West Street,
ConforMIS – 600 Research Drive,
Dunkin’ Donuts – 206 Ballardvale Street.
North Reading:
Circuit Upgrades:
Commercial/Industrial:
Firestone – 157 Main Street,
UPS Store – 151 Main Street,
Hillview Country Club (irrigation pump) – North Street.
Lynnfield Center:
Circuit Upgrades:
Installed approximately 4,000 feet of duct bank along Cooks Farm
Lane, Cortland Lane and Tophet Road as part of an area upgrade project.
Commercial/Industrial:
There were no notable new service additions or upgrades.

19
TOWN OF READING, MASSACHUSETTS
READING MUNICIPAL LIGHT DEPARTMENT
Annual Financial Statements
For the Year Ended June 30, 2015
Reading Municipal Light Department
TABLE OF CONTENTS PAGE INDEPENDENT AUDITORS’ REPORT 1 MANAGEMENT’S DISCUSSION AND ANALYSIS 3 BASIC FINANCIAL STATEMENTS: Proprietary Fund: Statements of Net Position 6 Statements of Revenues, Expenses, and Changes in Net Position 7 Statements of Cash Flows 8 Fiduciary Funds: Statements of Fiduciary Net Position 9 Statements of Changes in Fiduciary Net Position 10 Notes to Financial Statements 11 REQUIRED SUPPLEMENTARY INFORMATION Schedule of Funding Progress 34 Schedule of Proportionate Share of the Net Pension Liability 35 Schedule of Contributions 36

INDEPENDENT AUDITORS’ REPORT
To the Municipal Light Board Town of Reading Municipal Light Department
Report on the Financial Statements
We have audited the accompanying financial statements of the business-type activities and the aggregate remaining fund information of the Town of Reading Municipal Light Department (“the Department”) (an enterprise fund of the Town of Reading, Massachusetts), as of and for the year ended June 30, 2015 and the related notes to the financial statements, which collectively comprise the Department’s basic financial statements as listed in the Table of Contents. Management’s Responsibility for the Financial Statements
The Department’s management is responsible for the preparation and fair presenta-tion of these financial statements in accordance with accounting principles generally accepted in the United States of America; this includes the design, implementation, and maintenance of internal control relevant to the preparation and fair presentation of financial statements that are free from material misstatement, whether due to fraud or error. Auditor’s Responsibility
Our responsibility is to express opinions on these financial statements based on our audit. We conducted our audit in accordance with auditing standards generally accepted in the United States of America. Those standards require that we plan and perform the audit to obtain reasonable assurance about whether the financial state-ments are free from material misstatement. An audit involves performing procedures to obtain audit evidence about the amounts and disclosures in the financial statements. The procedures selected depend on the auditor’s judgment, including the assessment of the risks of material misstatement of the financial statements, whether due to fraud or error. In making those risk assess-ments, the auditor considers internal control relevant to the entity’s preparation and fair presentation of the financial statements in order to design audit procedures that are appropriate in the circumstances, but not for the purpose of expressing an opinion on the effectiveness of the entity’s internal control. Accordingly, we express no such opinion. An audit also includes evaluating the appropriateness of accounting policies

2
used and the reasonableness of significant accounting estimates made by manage-ment, as well as evaluating the overall presentation of the financial statements. We believe that the audit evidence we have obtained is sufficient and appropriate to provide a basis for our audit opinions. Opinions
In our opinion, the financial statements referred to above present fairly, in all material respects, the respective financial position of the business-type activities and the aggregate remaining fund information of the Town of Reading Municipal Light Department as of June 30, 2015, and the respective changes in financial position and, where applicable, cash flows thereof for the year then ended in accordance with accounting principles generally accepted in the United States of America. Report on Summarized Comparative Information
We have previously audited the Department’s fiscal year 2014 financial statements, and we expressed an unmodified audit opinion on those audited financial statements in our report dated October 2, 2014. In our opinion, the summarized comparative information presented herein as of and for the fiscal year ended June 30, 2014 is con-sistent, in all material respects, with the audited financial statements from which it has been derived. Other Matters
Required Supplementary Information
Accounting principles generally accepted in the United States of America require that the Management’s Discussion and Analysis, Schedule of Funding Progress, Schedule of Proportionate Share of the Net Pension Liability, and Schedule of Contributions be presented to supplement the basic financial statements. Such information, although not a part of the basic financial statements, is required by the Governmental Accounting Standards Board, who considers it to be an essential part of financial reporting for placing the basic financial statements in an appropriate operational, economic, or historical context. We have applied certain limited proce-dures to the required supplementary information in accordance with auditing stand-ards generally accepted in the United States of America, which consisted of inquiries of management about the methods of preparing the information and comparing the information for consistency with management’s responses to our inquiries, the basic financial statements, and other knowledge we obtained during our audit of the basic financial statements. We do not express an opinion or provide any assurance on the information because the limited procedures do not provide us with evidence suffi-cient to express an opinion or provide any assurance.
October 29, 2015
3
MANAGEMENT’S DISCUSSION AND ANALYSIS
Within this section of the Town of Reading Municipal Light Department’s (“the Department”) annual financial report, management provides a narrative discussion and analysis of the Department’s financial activities for the year ended June 30, 2015. The Department’s performance is discussed and analyzed within the context of the accompanying financial statements and disclosures following this section.
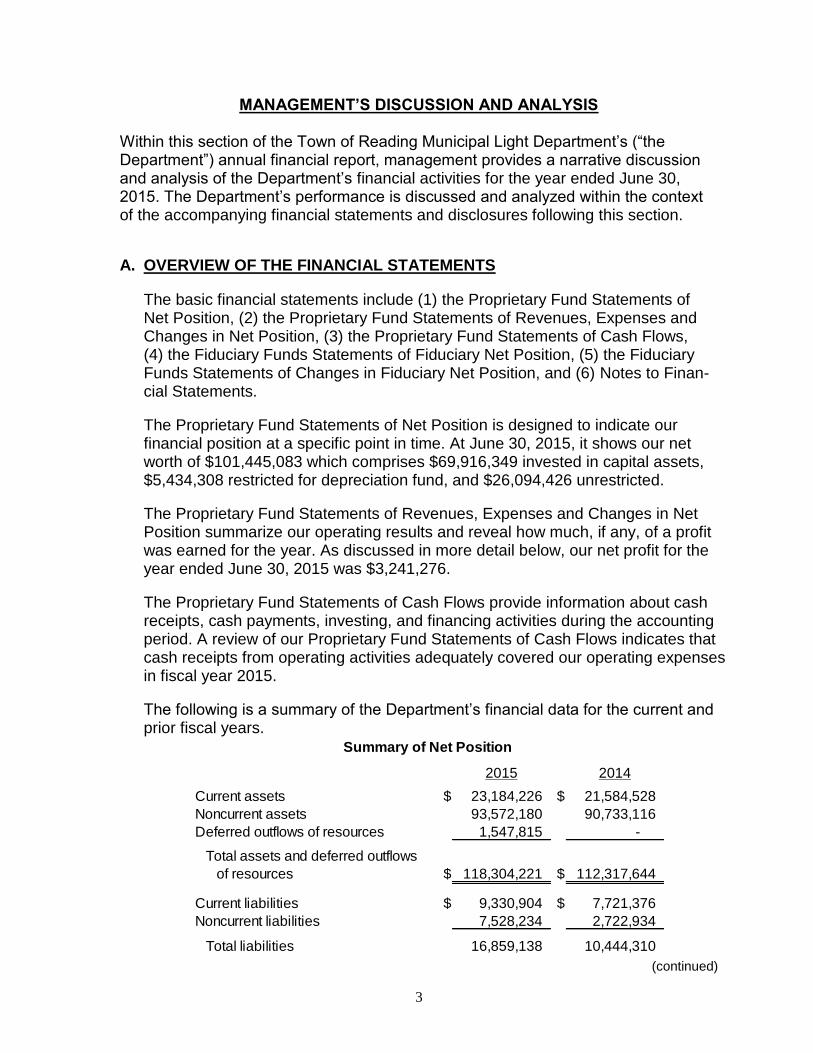
A. OVERVIEW OF THE FINANCIAL STATEMENTS
The basic financial statements include (1) the Proprietary Fund Statements of Net Position, (2) the Proprietary Fund Statements of Revenues, Expenses and Changes in Net Position, (3) the Proprietary Fund Statements of Cash Flows, (4) the Fiduciary Funds Statements of Fiduciary Net Position, (5) the Fiduciary Funds Statements of Changes in Fiduciary Net Position, and (6) Notes to Finan-cial Statements.
The Proprietary Fund Statements of Net Position is designed to indicate our financial position at a specific point in time. At June 30, 2015, it shows our net worth of $101,445,083 which comprises $69,916,349 invested in capital assets, $5,434,308 restricted for depreciation fund, and $26,094,426 unrestricted.
The Proprietary Fund Statements of Revenues, Expenses and Changes in Net Position summarize our operating results and reveal how much, if any, of a profit was earned for the year. As discussed in more detail below, our net profit for the year ended June 30, 2015 was $3,241,276.
The Proprietary Fund Statements of Cash Flows provide information about cash receipts, cash payments, investing, and financing activities during the accounting period. A review of our Proprietary Fund Statements of Cash Flows indicates that cash receipts from operating activities adequately covered our operating expenses in fiscal year 2015.
The following is a summary of the Department’s financial data for the current and prior fiscal years.
(continued)
2015 2014
Current assets $ 23,184,226 $ 21,584,528
Noncurrent assets 93,572,180 90,733,116
Deferred outflows of resources 1,547,815 -
$ 118,304,221 $ 112,317,644
Current liabilities $ 9,330,904 $ 7,721,376
Noncurrent liabilities 7,528,234 2,722,934
Total liabilities 16,859,138 10,444,310
Net position:
69,916,349 70,194,105
Restricted for depreciation fund 5,434,308 4,130,585
Unrestricted 26,094,426 27,548,644
Total net position 101,445,083 101,873,334
Total liabilities and net position $ 118,304,221 $ 112,317,644
Summary of Net Position
Net investment in capital assets
Total assets and deferred outflows
of resources
4
(continued)
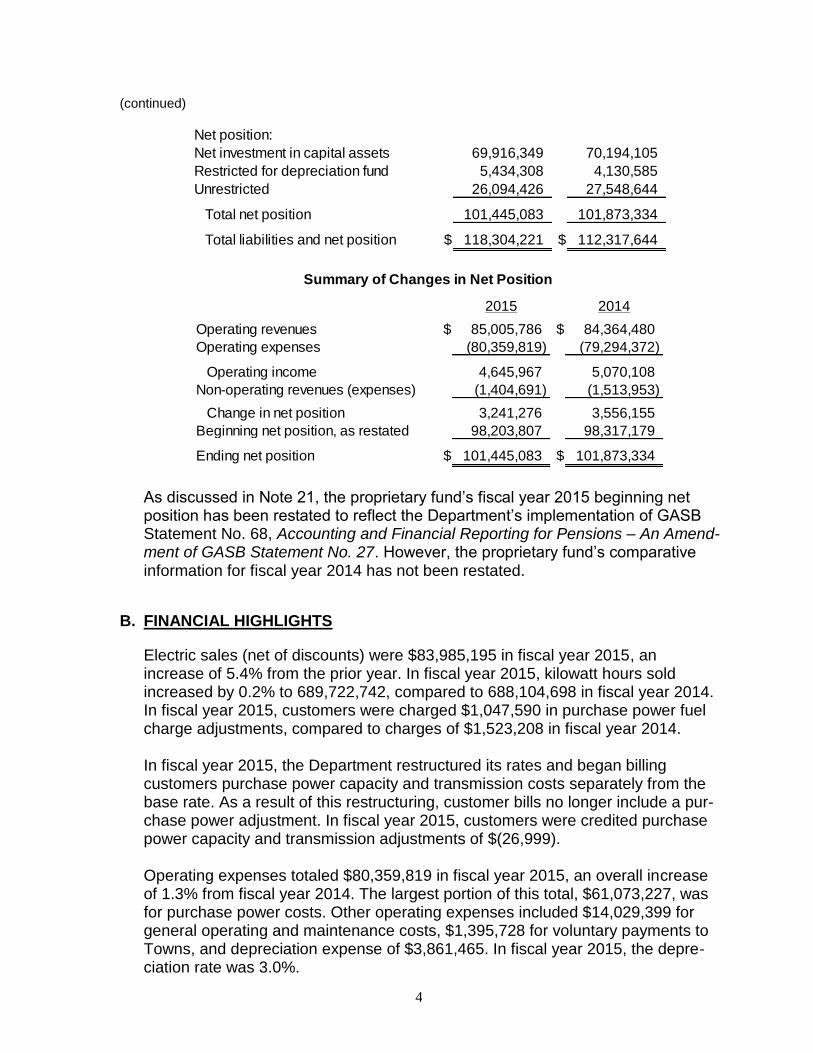
As discussed in Note 21, the proprietary fund’s fiscal year 2015 beginning net position has been restated to reflect the Department’s implementation of GASB Statement No. 68, Accounting and Financial Reporting for Pensions – An Amend-ment of GASB Statement No. 27. However, the proprietary fund’s comparative information for fiscal year 2014 has not been restated.
B. FINANCIAL HIGHLIGHTS
Electric sales (net of discounts) were $83,985,195 in fiscal year 2015, an increase of 5.4% from the prior year. In fiscal year 2015, kilowatt hours sold increased by 0.2% to 689,722,742, compared to 688,104,698 in fiscal year 2014. In fiscal year 2015, customers were charged $1,047,590 in purchase power fuel charge adjustments, compared to charges of $1,523,208 in fiscal year 2014. In fiscal year 2015, the Department restructured its rates and began billing customers purchase power capacity and transmission costs separately from the base rate. As a result of this restructuring, customer bills no longer include a pur-chase power adjustment. In fiscal year 2015, customers were credited purchase power capacity and transmission adjustments of $(26,999). Operating expenses totaled $80,359,819 in fiscal year 2015, an overall increase of 1.3% from fiscal year 2014. The largest portion of this total, $61,073,227, was for purchase power costs. Other operating expenses included $14,029,399 for general operating and maintenance costs, $1,395,728 for voluntary payments to Towns, and depreciation expense of $3,861,465. In fiscal year 2015, the depre-ciation rate was 3.0%.
2015 2014
Current assets $ 23,184,226 $ 21,584,528
Noncurrent assets 93,572,180 90,733,116
Deferred outflows of resources 1,547,815 -
$ 118,304,221 $ 112,317,644
Current liabilities $ 9,330,904 $ 7,721,376
Noncurrent liabilities 7,528,234 2,722,934
Total liabilities 16,859,138 10,444,310
Net position:
69,916,349 70,194,105
Restricted for depreciation fund 5,434,308 4,130,585
Unrestricted 26,094,426 27,548,644
Total net position 101,445,083 101,873,334
Total liabilities and net position $ 118,304,221 $ 112,317,644
Summary of Net Position
Net investment in capital assets
Total assets and deferred outflows
of resources
2015 2014
Operating revenues $ 85,005,786 $ 84,364,480
Operating expenses (80,359,819) (79,294,372)
Operating income 4,645,967 5,070,108
Non-operating revenues (expenses) (1,404,691) (1,513,953)
Change in net position 3,241,276 3,556,155
98,203,807 98,317,179
Ending net position $ 101,445,083 $ 101,873,334
Summary of Changes in Net Position
Beginning net position, as restated

5
In fiscal year 2015, the Department contributed $1,500,000 to the Reading Municipal Light Department Employees’ Retirement Trust (“Pension Trust”) and the Pension Trust contributed $1,401,638 to the Town of Reading Contributory Retirement System on behalf of the Department’s employees. In fiscal year 2015, the Department contributed $345,382 to the Other Post-Employment Benefits Trust (“OPEB Trust”), which was equal to its actuarially determined liability at June 30, 2015. As a result, the Department had no unfunded OPEB liability at June 30, 2015. Additional information on the Department’s OPEB contributions can be found in Note 16 on pages 21-24 of this report.
C. CAPITAL ASSET AND DEBT ADMINISTRATION
Capital assets. Total investment in land at year end amounted to $1,265,842; there was no change from the prior year. Total investment in depreciable capital assets at year-end amounted to $68,650,507(net of accumulated depreciation), a decrease of $(277,756) from the prior year. This investment in depreciable capital assets includes structures and improvements, equipment and furnishings, and infrastructure assets. Debt and other long-term liabilities. At the end of the current fiscal year, the Department had no outstanding bonded debt. Additional information on capital assets and other long-term liabilities can be found in the Notes to Financial Statements.
REQUESTS FOR INFORMATION
This financial report is designed to provide a general overview of the Town of Reading Municipal Light Department’s finances for all those with an interest in the Department’s finances. Questions concerning any of the information provided in this report or requests for additional financial information should be addressed to:
Accounting/Business Manager
Town of Reading Municipal Light Department
230 Ash Street
Reading, Massachusetts 01867

6
2015 2014
Current:
Unrestricted cash and short-term investments $ 13,151,862 $ 11,533,212
Receivables, net of allowance for uncollectable 7,314,059 7,871,050
Prepaid expenses 1,137,898 772,766
Inventory 1,580,407 1,407,500
Total current assets 23,184,226 21,584,528
Noncurrent:
Restricted cash and short-term investments 22,344,776 19,219,111
Restricted investments 1,284,061 1,292,906
Investment in associated companies 26,994 26,994
Land 1,265,842 1,265,842
Capital assets, net of accumulated depreciation 68,650,507 68,928,263
Total noncurrent assets 93,572,180 90,733,116
DEFERRED OUTFLOWS OF RESOURCES 1,547,815 -
118,304,221 112,317,644
LIABILITIES
Current:
Accounts payable 5,097,838 4,407,535
Accrued liabilities 585,104 592,810
Customer deposits 846,361 749,900
Customer advances for construction 889,774 400,656
Due to Pension Trust 1,500,000 1,374,538
Due to OPEB Trust 345,382 -
Current portion of long-term liabilities:
Accrued employee compensated absences 66,445 195,937
Total current liabilities 9,330,904 7,721,376
Noncurrent:
Accrued employee compensated absences 3,004,043 2,722,934
Net pension liability 4,524,191 -
Total noncurrent liabilities 7,528,234 2,722,934
TOTAL LIABILITIES 16,859,138 10,444,310
NET POSITION
Net investment in capital assets 69,916,349 70,194,105
Restricted for depreciation fund 5,434,308 4,130,585
Unrestricted 26,094,426 27,548,644
TOTAL NET POSITION $ 101,445,083 $ 101,873,334
The accompanying notes are an integral part of these financial statements.
TOTAL ASSETS AND DEFERRED OUTFLOWS
OF RESOURCES
JUNE 30, 2015 AND 2014
ASSETS
TOWN OF READING, MASSACHUSETTS
MUNICIPAL LIGHT DEPARTMENT
BUSINESS-TYPE PROPRIETARY FUND
STATEMENTS OF NET POSITION

7
2015 2014
Operating Revenues:
Electric sales, net of discounts of $2,953,502
and $4,475,920 respectively $ 83,985,195 $ 79,689,061
Purchase power adjustments:
Fuel charge adjustment 1,047,590 1,523,208
Capacity and transmission adjustment (26,999) 3,152,211
Total Operating Revenues 85,005,786 84,364,480
Operating Expenses:
Purchase power 61,073,227 60,823,626
Operating 11,606,195 11,002,998
Maintenance 2,423,204 2,290,843
Voluntary payments to towns 1,395,728 1,397,270
Depreciation 3,861,465 3,779,635
Total Operating Expenses 80,359,819 79,294,372
Operating Income 4,645,967 5,070,108
Nonoperating Revenues (Expenses):
Interest income 122,693 120,832
MMWEC surplus 212,689 391,726
Intergovernmental grants 62,500 -
Contributions in aid of construction 64,474 24,117
Return on investment to Town of Reading (2,332,863) (2,301,221)
Loss on disposal of capital assets (58,296) (114,960)
Other 524,112 365,553
Total Nonoperating Revenues (Expenses), Net (1,404,691) (1,513,953)
Change in Net Position 3,241,276 3,556,155
Net Position at Beginning of Year, as restated 98,203,807 98,317,179
Net Position at End of Year $ 101,445,083 $ 101,873,334
The accompanying notes are an integral part of these financial statements.
FOR THE YEARS ENDED JUNE 30, 2015 AND 2014
TOWN OF READING, MASSACHUSETTS
MUNICIPAL LIGHT DEPARTMENT
BUSINESS-TYPE PROPRIETARY FUND
STATEMENTS OF REVENUES, EXPENSES, AND CHANGES IN NET POSITION

8
2015 2014
Cash Flows From Operating Activities:
Receipts from customers and users $ 84,638,647 $ 80,249,266
Payments to vendors and employees (76,424,486) (74,778,752)
Customer purchase power adjustments 1,020,591 4,675,419
Net Cash Provided By (Used For) Operating Activities 9,234,752 10,145,933
Cash Flows From Noncapital Financing Activities:
Return on investment to Town of Reading (2,332,863) (2,301,221)
MMWEC surplus 212,689 391,726
Other 524,112 365,553
Net Cash Provided By (Used For) Noncapital Financing Activities (1,596,062) (1,543,942)
Cash Flows From Capital and Related Financing Activities:
Acquisition and construction of capital assets (3,642,005) (3,894,282)
Contributions in aid of construction 553,592 19,619
Intergovernmental revenues 62,500 -
Net Cash Provided By (Used For) Capital and Related Financing Activities (3,025,913) (3,874,663)
Cash Flows From Investing Activities:
Investment income 122,693 120,832
(Increase) decrease in restricted cash and investments (3,116,820) (2,466,799)
Net Cash Provided By (Used For) Investing Activities (2,994,127) (2,345,967)
Net Change in Unrestricted Cash and Short-Term Investments 1,618,650 2,381,361
Unrestricted Cash and Short-Term Investments, Beginning of Year 11,533,212 9,151,851
Unrestricted Cash and Short-Term Investments, End of Year $ 13,151,862 $ 11,533,212
Reconciliation of Operating Income to Net Cash:
Operating income $ 4,645,967 $ 5,070,108
Adjustments to reconcile operating income to net cash
provided by (used for) operating activities:
Depreciation expense 3,861,465 3,779,635
(Increase) decrease in:
Accounts receivable 556,991 510,327
Prepaid and other assets (365,132) (81,321)
Inventory (172,907) 161,530
Accounts payable and accrued liabilities 834,214 (718,762)
Due to pension trust 125,462 1,374,538
Due to other postemployment benefits trust 345,382 -
Net pension liability (519,874) -
Other (76,816) 49,878
Net Cash Provided By (Used For) Operating Activities $ 9,234,752 $ 10,145,933
The accompanying notes are an integral part of these financial statements.
FOR THE YEARS ENDED JUNE 30, 2015 AND 2014
TOWN OF READING, MASSACHUSETTS
MUNICIPAL LIGHT DEPARTMENT
BUSINESS-TYPE PROPRIETARY FUND
STATEMENTS OF CASH FLOWS

9
2015 2014 2015 2014
ASSETS
Cash and short-term investments $ 2,666,772 $ 2,632,367 $ 1,857,738 $ 1,846,042
Investments 1,284,061 1,292,906 - -
Due from proprietary fund 1,500,000 1,374,538 345,382 -
TOTAL ASSETS 5,450,833 5,299,811 2,203,120 1,846,042
NET POSITION
Total net position held in trust $ 5,450,833 $ 5,299,811 $ 2,203,120 $ 1,846,042
The accompanying notes are an integral part of these financial statements.
Pension Trust OPEB Trust
TOWN OF READING, MASSACHUSETTS
MUNICIPAL LIGHT DEPARTMENT
FIDUCIARY FUNDS
STATEMENTS OF FIDUCIARY NET POSITION
JUNE 30, 2015 AND 2014

10
2015 2014 2015 2014
Additions:
$ 1,500,000 $ 1,374,538 $ 345,382 $ 343,095
52,660 74,220 11,696 7,436
Total additions 1,552,660 1,448,758 357,078 350,531
Deductions:
1,401,638 1,346,039 - -
Total deductions 1,401,638 1,346,039 - -
Increase in net position 151,022 102,719 357,078 350,531
Net position:
Net Position, Beginning of Year 5,299,811 5,197,092 1,846,042 1,495,511
Net Position, End of Year $ 5,450,833 $ 5,299,811 $ 2,203,120 $ 1,846,042
The accompanying notes are an integral part of these financial statements.
Contributions from Reading
Municipal Light Department
Paid to Reading Contributory
Retirement System
Investment income and
change in fair value
Pension Trust OPEB Trust
TOWN OF READING, MASSACHUSETTS
MUNICIPAL LIGHT DEPARTMENT
FIDUCIARY FUNDS
STATEMENTS OF CHANGES IN FIDUCIARY NET POSITION
FOR THE YEARS ENDED JUNE 30, 2015 AND 2014
11
Town of Reading, Massachusetts Municipal Light Department
Notes to Financial Statements
1. Summary of Significant Accounting Policies
The significant accounting policies of the Town of Reading Municipal Light Department (“the Department”) (an enterprise fund of the Town of Reading, Massachusetts) are as follows: A. Business Activity - The Department purchases electricity for distribution to
more than 25,000 customers within the towns of Reading, North Reading, Wilmington, and Lynnfield.
B. Regulation and Basis of Accounting - Under Massachusetts General Laws, the Department’s electric rates are set by the Municipal Light Board. Electric rates, excluding the purchase power fuel charge and the purchase power capacity and transmission charge, cannot be changed more than once every three months. Rate schedules are filed with the Massachusetts Department of Public Utilities (DPU). While the DPU exercises general supervisory authority over the Department, the Department's rates are not subject to DPU approval. The Department's policy is to prepare its financial statements in conformity with generally accepted accounting principles. Proprietary funds distinguish operating revenues and expenses from non-operating items. Operating revenues and expenses generally result from providing services and producing and delivering goods in connection with a proprietary fund’s principal ongoing operations. The principal operating revenues of the Department’s proprietary fund are charges to customers for electric sales and services. Operating expenses for the Department’s proprietary fund include the cost of sales and services, administrative expenses and depreciation on capital assets. All revenues and expenses not meeting this definition are reported as non-operating revenues and expenses.
C. Concentrations - The Department operates within the electric utility industry. In 1998, the Commonwealth of Massachusetts enacted energy deregulation legislation that restructured the Commonwealth’s electricity industry to foster competition and promote reduced electric rates. Energy deregulation created a separation between the supply and delivery por-tions of electricity service and enabled consumers to purchase their energy from a retail supplier of their choice. Municipal utilities are not currently subject to this legislation.
D. Retirement Trust - The Reading Municipal Light Department Employees’
Retirement Trust (the “Pension Trust”) was established by the Reading Municipal Light Board on December 30, 1966, pursuant to Chapter 64 of the General Laws of the Commonwealth of Massachusetts.
12
The Pension Trust constitutes the principal instrument of a plan estab-lished by the Municipal Light Board to fund the Department’s annual required contribution to the Town of Reading Contributory Retirement System (the System), a cost sharing, multi-employer public employee retirement system.
E. Other Post-Employment Benefits Trust - The Other Post-Employment Benefits Liability Trust Fund (the “OPEB Trust”) was established by the Reading Municipal Light Board pursuant to Chapter 32B, Section 20 of the General Laws of the Commonwealth of Massachusetts.The OPEB Trust constitutes the principal instrument of a plan established by the Municipal Light Board to fund the Department’s annual actuarially determined OPEB contribution for future retirees.
F. Revenues - Revenues are based on rates established by the Department and filed with the DPU. Revenues from sales of electricity are recorded on the basis of bills rendered from monthly meter readings taken on a cycle basis and are stated net of discounts. Recognition is given to the amount of sales to customers which are unbilled at the end of the fiscal period.
G. Cash and Short-term Investments - For the purposes of the Statements of Cash Flows, the Department considers unrestricted cash on deposit with the Town Treasurer to be cash or short-term investments. For purposes of the Statements of Net Position, both the proprietary funds and fiduciary funds consider unrestricted and restricted investments with original maturities of three months or less to be short-term investments.
H. Investments - State and local statutes place certain limitations on the nature of deposits and investments available. Deposits in any financial institution may not exceed certain levels within the financial institution. Non-fiduciary fund investments can be made in securities issued or unconditionally guaranteed by the U.S. Government or agencies that have a maturity of one year or less from the date of purchase and repurchase agreements guaranteed by such securities with maturity dates of no more than 90 days from date of purchase. Investments for the Department and the Pension Trust consist of domestic and foreign fixed income bonds which the Department intends to hold to maturity. These investments are reported at fair market value in the proprietary fund and fiduciary fund financial statements.
I. Inventory - Inventory consists of parts and accessories purchased for use in the utility business for construction, operation, and maintenance pur-poses and is stated at average cost. Meters and transformers are capi-talized when purchased.

13
J. Capital Assets and Depreciation - Capital assets, which include property, plant, equipment, and utility plant infrastructure, are recorded at historical cost or estimated historical cost when purchased or constructed. Donated capital assets are recorded at estimated fair market value at the date of the donation. The cost of normal maintenance and repairs that do not add to the value of the asset or materially extend asset lives are not capitalized. Major outlays for capital assets and improvements are capitalized as they are acquired or constructed. Interest incurred during the construction
phase of proprietary fund capital assets is included as part of the
capitalized value of the constructed asset. When capital assets are retired, the cost of the retired asset, less accumulated depreciation, salvage value and any cash proceeds, is charged to the Department’s unrestricted net position. Massachusetts General Laws require utility plant in service to be depreci-ated at a minimum annual rate of 3%. To change this rate, the Department must obtain approval from the DPU. Changes in annual depreciation rates may be made for financial factors relating to cash flow for plant expansion, rather than engineering factors relating to estimates of useful lives.
K. Accrued Compensated Absences - Employee vacation leave is vested annually but may only be carried forward to the succeeding year with supervisor approval and, if appropriate, within the terms of the applicable Department policy or union contract. Generally, sick leave may accumu-late according to union and Department contracts and policy, and is paid upon normal termination at the current rate of pay. The Department’s policy is to recognize vacation costs at the time payments are made. The Department records accumulated, unused, vested sick pay as a liability. The amount recorded is the amount to be paid upon normal termination at the current rate of pay.
L. Long-Term Obligations - The proprietary fund financial statements report long-term debt and other long-term obligations as liabilities in the State-ments of Net Position.
M. Use of Estimates - The preparation of financial statements in conformity with generally accepted accounting principles requires management to make estimates and assumptions that affect the reported amounts of assets and liabilities and disclosures for contingent assets and liabilities at the date of the financial statements, and the reported amounts of the revenues and expenses during the fiscal year. Actual results could vary from estimates that were used.
N. Rate of Return - The Department’s rates must be set such that earnings attributable to electric operations do not exceed eight percent of the net cost of plant. The Department’s audited financial statements are prepared
14
in accordance with auditing standards generally accepted in the United States of America. To determine the net income subject to the rate of return limitations, the Department performs the following calculation. Using the net income per the audited financial statements, the return on invest-ment to the Town of Reading is added back, the fuel charge adjustment is added or deducted, and miscellaneous debits/credits (i.e., gain/loss on disposal of fixed assets, etc.) are added or deducted, leaving an adjusted net income figure for rate of return purposes. Investment interest income and bond principal payments are then deducted from this figure to deter-mine the net income subject to the rate of return. The net income subject to the rate of return is then subtracted from the allowable eight percent rate of return, which is calculated by adding the book value of net plant and the investment in associated companies less the contributions in aid of construction multiplied by eight percent. From this calculation, the Municipal Light Board will determine what cash transfers need to be made at the end of the fiscal year.
O. Comparative Financial Information - The Department’s financial statements include certain prior-year comparative information. Such information does not include sufficient detail to constitute a presentation in conformity with generally accepted accounting principles. Accordingly, such information should be read in conjunction with the Department’s financial statements for the year ended June 30, 2014, from which the summarized information was derived.
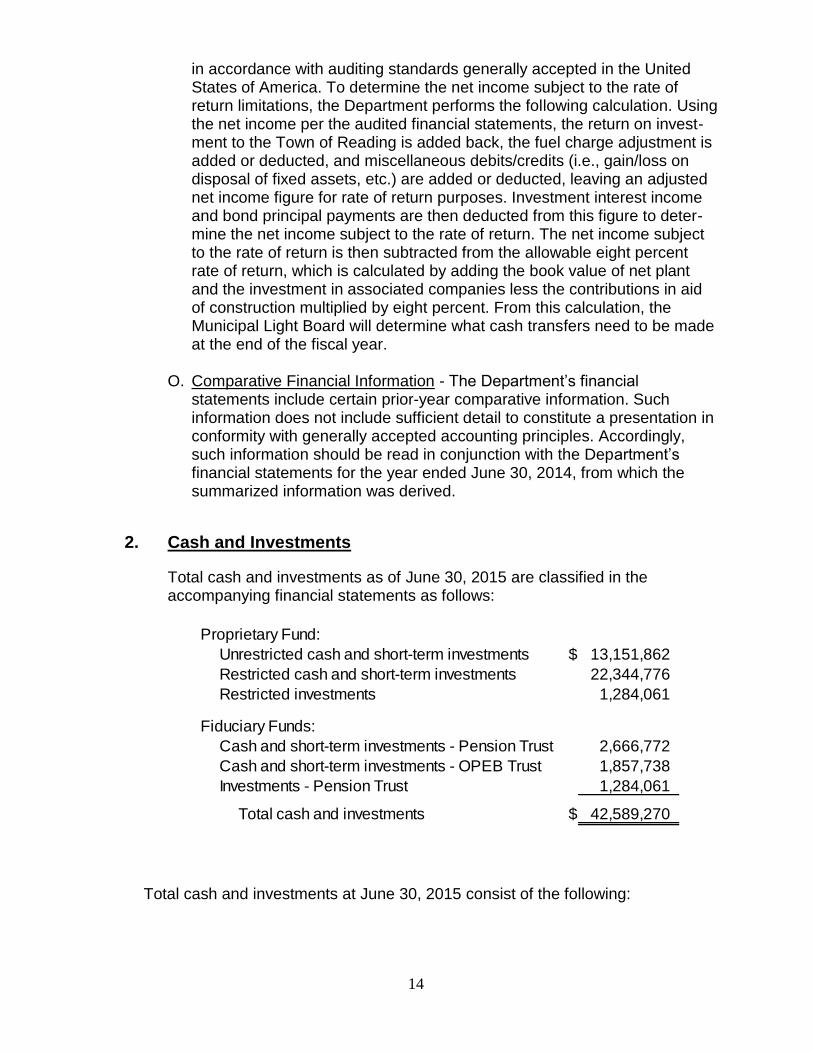
2. Cash and Investments
Total cash and investments as of June 30, 2015 are classified in the accompanying financial statements as follows:
Total cash and investments at June 30, 2015 consist of the following:
Proprietary Fund:
Unrestricted cash and short-term investments $ 13,151,862
Restricted cash and short-term investments 22,344,776
Restricted investments 1,284,061
Fiduciary Funds:
Cash and short-term investments - Pension Trust 2,666,772
Cash and short-term investments - OPEB Trust 1,857,738
Investments - Pension Trust 1,284,061
Total cash and investments $ 42,589,270
15
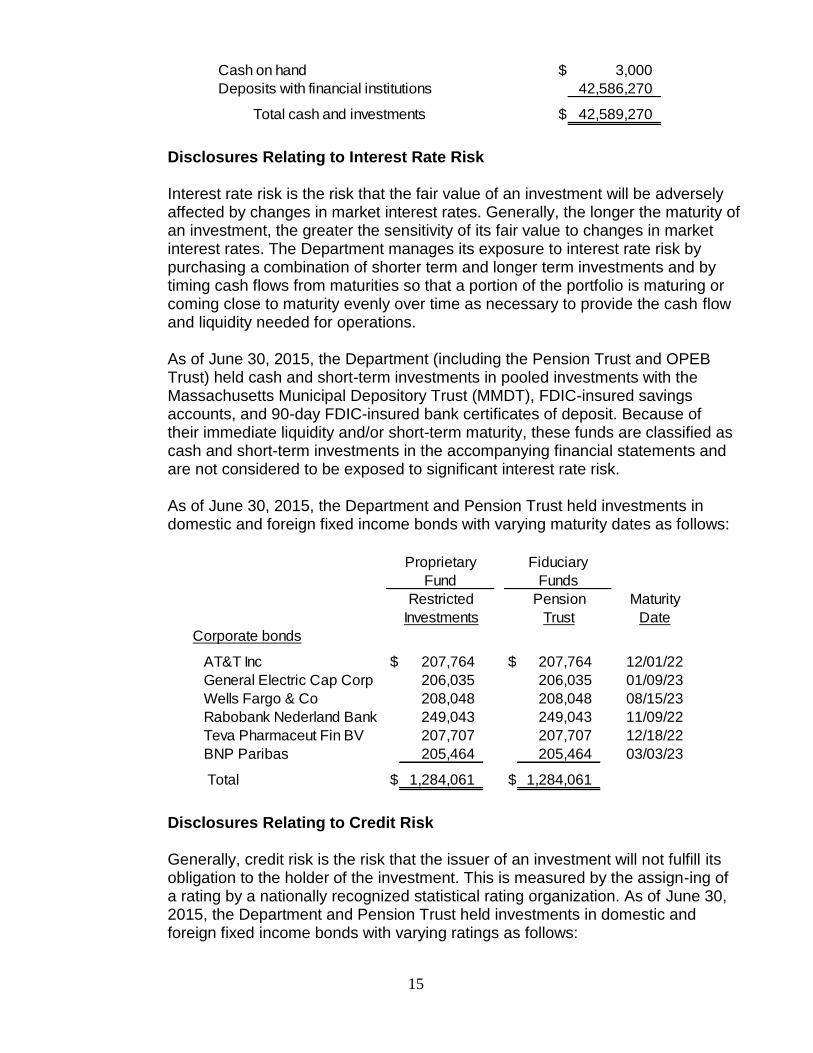
Disclosures Relating to Interest Rate Risk
Interest rate risk is the risk that the fair value of an investment will be adversely affected by changes in market interest rates. Generally, the longer the maturity of an investment, the greater the sensitivity of its fair value to changes in market interest rates. The Department manages its exposure to interest rate risk by purchasing a combination of shorter term and longer term investments and by timing cash flows from maturities so that a portion of the portfolio is maturing or coming close to maturity evenly over time as necessary to provide the cash flow and liquidity needed for operations. As of June 30, 2015, the Department (including the Pension Trust and OPEB Trust) held cash and short-term investments in pooled investments with the Massachusetts Municipal Depository Trust (MMDT), FDIC-insured savings accounts, and 90-day FDIC-insured bank certificates of deposit. Because of their immediate liquidity and/or short-term maturity, these funds are classified as cash and short-term investments in the accompanying financial statements and are not considered to be exposed to significant interest rate risk. As of June 30, 2015, the Department and Pension Trust held investments in domestic and foreign fixed income bonds with varying maturity dates as follows:
Disclosures Relating to Credit Risk
Generally, credit risk is the risk that the issuer of an investment will not fulfill its obligation to the holder of the investment. This is measured by the assign-ing of a rating by a nationally recognized statistical rating organization. As of June 30, 2015, the Department and Pension Trust held investments in domestic and foreign fixed income bonds with varying ratings as follows:
Cash on hand $ 3,000
Deposits with financial institutions 42,586,270
Total cash and investments $ 42,589,270
Restricted Pension Maturity
Investments Trust Date
Corporate bonds
AT&T Inc $ 207,764 $ 207,764 12/01/22
General Electric Cap Corp 206,035 206,035 01/09/23
Wells Fargo & Co 208,048 208,048 08/15/23
Rabobank Nederland Bank 249,043 249,043 11/09/22
Teva Pharmaceut Fin BV 207,707 207,707 12/18/22
BNP Paribas 205,464 205,464 03/03/23
Total $ 1,284,061 $ 1,284,061
Proprietary
Fund
Fiduciary
Funds

16
Concentration of Credit Risk
The Department follows the Town of Reading’s investment policy, which does not limit the amount that can be invested in any one issuer beyond that stipulated by Massachusetts General Laws. At June 30, 2015, the Department and Pension Trust investments were held in domestic and foreign fixed income bonds, as detailed in the sections above. Five of the bonds each individually represent approximately 16% of the Department’s and System’s total investments, while the investment in Rabobank Nederland Bank represents approximately 20%. Custodial Credit Risk Custodial Credit Risk for deposits is the risk that, in the event of the failure of a depository financial institution, the Department will not be able to recover its deposits or will not be able to recover collateral securities that are in the possession of an outside party. The custodial credit risk for investments is the risk that, in the event of the failure of the counterparty (e.g., broker-dealer) to a transaction, the Department will not be able to recover the value of its investments or collateral securities that are in the possession of another party. Massachusetts General Laws, Chapter 44, Section 55, limits deposits “in a bank or trust company or banking company to an amount not exceeding sixty per cent of the capital and surplus of such bank or trust company or banking company, unless satisfactory security is given to it by such bank or trust company or banking company for such excess.” The Department follows the Massachusetts statute as written, as well as the Town of Reading’s deposit policy for custodial credit risk. As of June 30, 2015, none of the Department’s (including Pension Trust and OPEB Trust) cash and short-term investments was exposed to custodial credit risk. As of June 30, 2015, none of the Department or Pension Trust investments were exposed to custodial credit risk because the related securities are registered in the Department’s name.
Restricted Pension Moody's
Investment Type Investments Trust Rating
Corporate bonds:
AT&T Inc $ 207,764 $ 207,764 BAA1
General Electric Cap Corp 206,035 206,035 A1
Wells Fargo & Co 208,048 208,048 A3
Rabobank Nederland Bank 249,043 249,043 A3
Teva Pharmaceut Fin BV 207,707 207,707 A3
BNP Paribas 205,464 205,464 A1
Total $ 1,284,061 $ 1,284,061
Proprietary
Fund
Fiduciary
Funds

17
3. Restricted Cash and Investments
The Department’s proprietary fund restricted cash and investment balances represent the following reserves:
The Department maintains the following reserves:
- Depreciation fund - The Department is normally required to reserve
3.0% of capital assets each year to fund capital improvements.
- Construction fund – This represents additional funds set aside to fund capital expenditures.
- Deferred fuel reserve - The Department transfers the difference between the customers’ monthly fuel charge adjustment and actual fuel costs into this account to be used in the event of a sudden increase in fuel costs.
- Deferred energy conservation reserve - This account is used to reserve monies collected from a special energy charge added to customer bills. Customers who undertake measures to conserve and improve energy efficiency can apply for rebates that are paid from this account.
- Rate stabilization - This represents amounts set aside to help stabilize cost increases resulting from fluctuations in purchase power costs.
- Reserve for uncollectible accounts - This account was set up to offset a portion of the Department’s bad debt reserve.
- Sick leave benefits - This account is used to offset the Department’s actuarially determined compensated absence liability.
- Hazardous waste fund -This reserve was set up by the Board of Commissioners to cover the Department’s insurance deductible in the event of a major hazardous materials incident.
- Customer deposits - Customer deposits that are held in escrow.
Cash Investments Cash Investments
Depreciation fund $ 5,434,308 $ - $ 4,130,585 $ -
Construction fund 1,400,000 - 1,000,000 -
Deferred fuel reserve 5,180,285 - 4,132,695 -
Deferred energy
conservation reserve 584,606 - 457,261 -
Rate stabilization 6,771,634 - 6,723,797 -
Reserve for uncollectible
accounts 200,000 - 200,000 -
Sick leave benefits 1,777,582 1,284,061 1,674,873 1,292,906
Hazardous waste fund 150,000 - 150,000 -
Customer deposits 846,361 - 749,900 -
Total $ 22,344,776 $ 1,284,061 $ 19,219,111 $ 1,292,906
6/30/15 6/30/14

18
4. Accounts Receivable
Accounts receivable consists of the following at June 30, 2015:
5. Prepaid Expenses
Prepaid expenses consist of the following:
6. Inventory
Inventory is comprised of supplies and materials at June 30, 2015, and is valued using the average cost method.
7. Investment in Associated Companies
Under agreements with the New England Hydro-Transmission Electric Company, Inc. (NEH) and the New England Hydro-Transmission Corporation (NHH), the Department has made the following advances to fund its equity requirements for the Hydro-Quebec Phase II interconnection. The Department is carrying its
Customer Accounts:
Billed $ 1,947,170
Less allowances:
Uncollectible accounts (200,000)
Sales discounts (86,174)
Total billed 1,660,996
Unbilled, net 5,166,350
Total customer accounts 6,827,346
Other Accounts:
Merchandise sales 150,805
MMWEC surplus 212,689
Intergovernmental grants 103,886
Liens and other 19,333
Total other accounts 486,713
Total net receivables $ 7,314,059
Insurance and other $ 292,268
Purchase power 294,455
NYPA prepayment fund 307,573
WC Fuel - Watson 243,602
Total $ 1,137,898

19
investment at cost, reduced by shares repurchased. The Department’s equity position in the Project is less than one-half of one percent.
Investment in associated companies consists of the following, at June 30, 2015:
8. Capital Assets
The following is a summary of fiscal year 2015 activity in capital assets (in thousands):
9. Deferred Outflows of Resources
Deferred outflows of resources represent the Department’s consumption of net position that is applicable to future reporting periods. Deferred outflows of resources have a positive effect on net position, similar to assets.
New England Hydro-Transmission (NEH & NHH) $ 26,994
Business-Type Activities:
Capital assets, being depreciated:
Structures and improvements $ 14,183 $ 363 $ - $ 14,546
Equipment and furnishings 31,787 309 (371) 31,725
Infrastructure 82,739 2,970 (487) 85,222
Total capital assets, being depreciated 128,709 3,642 (858) 131,493
Less accumulated depreciation for:
Structures and improvements (8,136) (389) - (8,525)
Equipment and furnishings (19,490) (971) 371 (20,090)
Infrastructure (32,155) (2,502) 429 (34,228)
Total accumulated depreciation (59,781) (3,862) 800 (62,843)
Total capital assets, being depreciated, net 68,928 (220) (58) 68,650
Capital assets, not being depreciated:
Land 1,266 - - 1,266
Total capital assets, not being depreciated 1,266 - - 1,266
Capital assets, net $ 70,194 $ (220) $ (58) $ 69,916
Beginning
Balance Increases Decreases
Ending
Balance
20
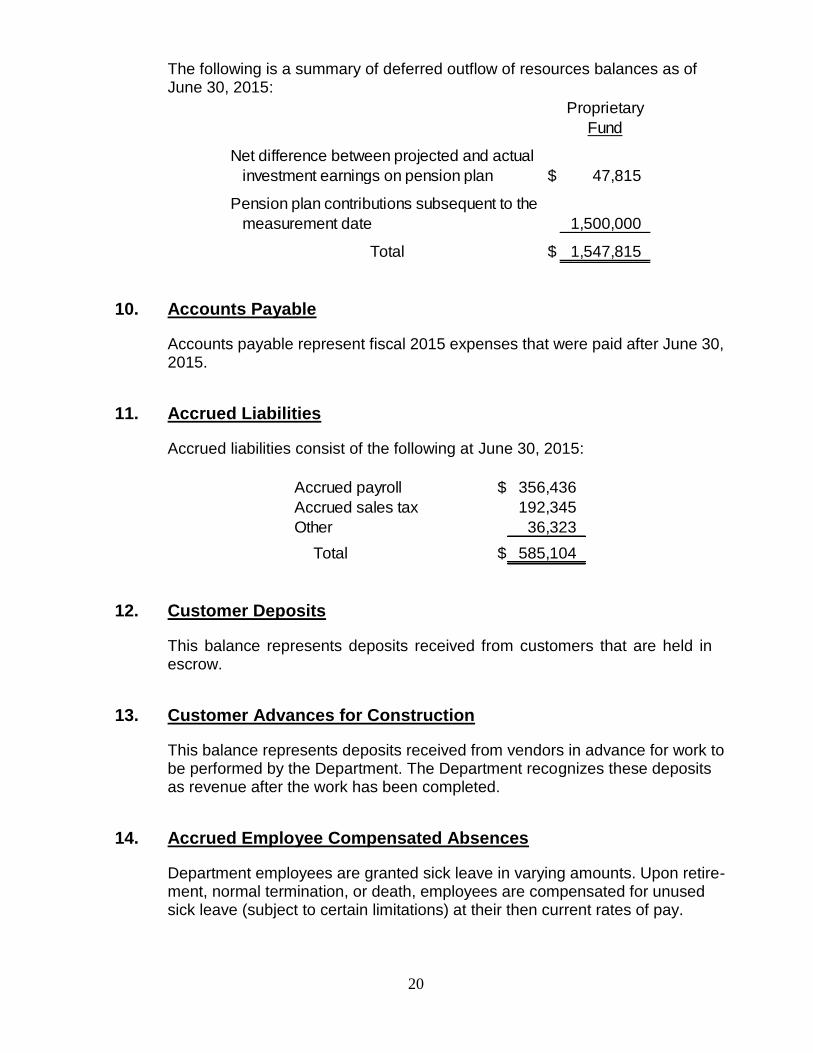
The following is a summary of deferred outflow of resources balances as of June 30, 2015:
10. Accounts Payable
Accounts payable represent fiscal 2015 expenses that were paid after June 30, 2015.
11. Accrued Liabilities
Accrued liabilities consist of the following at June 30, 2015:
12. Customer Deposits
This balance represents deposits received from customers that are held in escrow.
13. Customer Advances for Construction
This balance represents deposits received from vendors in advance for work to be performed by the Department. The Department recognizes these deposits as revenue after the work has been completed.
14. Accrued Employee Compensated Absences
Department employees are granted sick leave in varying amounts. Upon retire-ment, normal termination, or death, employees are compensated for unused sick leave (subject to certain limitations) at their then current rates of pay.
Proprietary
Fund
Net difference between projected and actual
investment earnings on pension plan $ 47,815
Pension plan contributions subsequent to the
measurement date 1,500,000
Total $ 1,547,815
Accrued payroll $ 356,436
Accrued sales tax 192,345
Other 36,323
Total $ 585,104

21
15. Restricted Net Position
The proprietary fund financial statements report restricted net position when external constraints are placed on net position. Specifically, restricted net position represents depreciation fund reserves, which are restricted for future capital costs.
16. Post-Employment Health Care and Life Insurance Benefits
Other Post-Employment Benefits
The Department follows GASB Statement No. 45, Accounting and Financial Reporting by Employers for Post-Employment Benefits Other Than Pensions. Statement No. 45 requires governments to account for other post-employment benefits (OPEB), primarily healthcare, on an accrual basis rather than on a pay-as-you-go basis. The effect is the recognition of an actuarially required contribution as an expense on the proprietary fund Statements of Revenues, Expenses, and Changes in Net Position when a future retiree earns their post-employment benefits, rather than when they use them. To the extent that an entity does not fund their actuarially required contribution, a post-employment benefit liability is recognized on the proprietary fund Statements of Net Position over time.
A. Plan Description
In addition to providing the pension benefits described in Note 17, the Department provides post-employment health and life insurance benefits to retired employees through the Town of Reading’s participation in the Massachusetts Interlocal Insurance Association (MIIA) Health Benefits Trust. Benefits, benefit levels, employee contributions and employer con-tributions are governed by Chapter 32 of the Massachusetts General Laws. As of June 30, 2014, the actuarial valuation measurement date, approximately 87 retirees and 51 active employees meet the eligibility requirements. The plan does not issue a separate financial report.
B. Benefits Provided
The Department provides post-employment medical, prescription drug, and life insurance benefits to all eligible retirees and their surviving spouses. All active employees who retire from the Department and meet the appropriate criteria are eligible to receive these benefits.
C. Funding Policy
As of the June 30, 2014, the actuarial valuation measurement date, retirees are required to contribute 29% of the cost of the medical and prescription drug plan, as determined by the MIIA Health Benefits Trust. Retirees also contribute 50% of the premium for a $5,000 life insurance benefit. The

22
Department contributes the remainder of the medical, prescription drug, and life insurance plan costs on a pay-as-you-go basis.
D. Annual OPEB Costs and Net OPEB Obligation
The Department’s fiscal 2015 annual OPEB expense is calculated based on the annual required contribution of the employer (ARC), an amount actuarially determined in accordance with the parameters of GASB State-ment No. 45. The ARC represents a level of funding that, if paid on an ongoing basis, is projected to cover the normal cost per year and amortize the unfunded actuarial liability over a remaining period of sixteen years. The following table shows the components of the Department’s annual OPEB cost for the year ending June 30, 2015, the amount actually contributed to the plan, and the change in the Department’s net OPEB obligation based on an actuarial valuation as of June 30, 2014.
The Department’s annual OPEB cost, the percentage of annual OPEB cost contributed to the plan, and the net OPEB obligation for fiscal year 2015 and the two preceding fiscal years were as follows:
Annual Required Contribution (ARC) $ 540,456
Interest on net OPEB obligation 218,069
Annual OPEB cost 758,525
Projected benefit payments (413,143)
Increase in net OPEB obligation 345,382
Net OPEB obligation - beginning of year -
Contributions to OPEB Trust (345,382)
(1) Net OPEB obligation - end of year $ -
(1) See Part E for additional information
Fiscal Year Ended
Annual
OPEB
Cost
Percentage of
OPEB
Cost Contributed
Net OPEB
Obligation
2015 758,525$ 100.00% -$
2014 768,378$ 100.00% -$
2013 604,987$ 100.00% -$

23
E. Funded Status and Funding Progress
The funded status of the plan as of June 30, 2014, the most recent actuarial valuation measurement date was as follows:
In 2010, the Department’s Municipal Light Board voted to accept the provi-sions of Chapter 32B §20 of Massachusetts General Laws and create an Other Post-Employment Benefits Liability Trust Fund as a mechanism to set aside monies to fund its OPEB liability. In 2013, the Commissioners voted to create an OPEB trust instrument in alignment with the Town of Reading. In fiscal year 2015, the Department contributed $345,382 to this trust, which was equal to all of its actuarially determined annual contributions through June 30, 2015. The assets and net position of this trust are reported in the Department’s Fiduciary Funds Statements of Fiduciary Net Position. Actuarial valuations of an ongoing plan involve estimates of the value of reported amounts and assumptions about the probability of events far into the future. Examples include assumptions about future employment, mor-tality, and the healthcare cost trend. Amounts determined regarding the funded status of the plan and the annual required contributions of the employer are subject to continual revision as actual results are compared to past expectations and new estimates are made about the future. The schedule of funding progress, presented as required supplementary infor-mation following the notes to the financial statements, presents multi-year trend information about whether the actuarial value of plan assets is increasing or decreasing over time relative to the actuarial accrued liability.
F. Actuarial Methods and Assumptions
Projections of benefits for financial reporting purposes are based on the plan as understood by the Department and the plan members and include the types of benefits provided at the time of each actuarial valuation and the historical pattern of sharing of benefit costs between the Department and plan members to that point. The actuarial methods and assumptions used include techniques that are designed to reduce short-term volatility in actuarial accrued liabilities and the actuarial value of assets, consistent with the long-term perspective of the calculations.
Actuarial accrued liability (AAL) $ 7,726,667
Actuarial value of plan assets 1,846,042
Unfunded actuarial accrued liability (UAAL) $ 5,880,625
Funded ratio (actuarial value of plan assets/AAL) 23.89%
Covered payroll (active plan members) N/A
UAAL as a percentage of covered payroll N/A

24
In the June 30, 2014 actuarial valuation, the Projected Unit Credit actuarial cost method was used. The Department’s actuarial value of plan assets was $1,846,042. The actuarial assumptions included a 7.75% investment rate of return and an initial annual health care cost trend rate of 8.0% which decreases by 0.5% for six years to an ultimate level of 5.0% per year. The amortization costs for the initial UAAL is a level percentage of payroll amortization, with amortization payments increasing at 2.5% per year for a remaining period of 16 years.
17. Reading Contributory Retirement System
The Department follows the provisions of GASB Statement No. 68, Accounting and Financial Reporting for Pensions – An Amendment of GASB Statement No. 27, with respect to the employees’ retirement funds.
A. Plan Description
Substantially all employees of the Department are members of the Town of Reading Contributory Retirement System (the System), a cost sharing, multiple-employer public employee retirement system (PERS). Eligible employees must participate in the System. The pension plan provides pension benefits, deferred allowances, and death and disability benefits. Chapter 32 of the Massachusetts General Laws establishes the authority of the System, as well as contribution percentages and benefits paid. The System Retirement Board does not have the authority to amend benefit provisions. Additional information is disclosed in the System’s annual financial reports, which are publically available from the System’s admin-istrative offices located at Reading Town Hall, 16 Lowell Street, Reading, Massachusetts, 01867.
B. Benefits Provided
The System provides for retirement allowance benefits up to a maximum of 80% of a member's highest three-year average annual rate of regular compensation. Benefit payments are based upon a member's age, length of creditable service, level of compensation and group classification. Members become vested after 10 years of creditable service. A retirement allowance may be received upon reaching age 65 or upon attaining 20 years of ser-vice. The plan also provides for early retirement at age 55 if the participant (1) has a record of 10 years of creditable service, (2) was on the Depart-ment payroll on January 1, 1978, (3) voluntarily left Department employment on or after that date, and (4) left accumulated annuity deductions in the fund. A retirement allowance consists of two parts: an annuity and a pen-sion. A member’s accumulated total deductions and a portion of the interest they generate constitute the annuity. The difference between the total retire-ment allowance and the annuity is the pension. The average retirement benefit is approximately 80-85% pension and 15-20% annuity.

25
Per Chapter 176 of the Acts of 2011, for members who retire on or after April 2, 2012, if in the 5 years of creditable service immediately preceding retirement, the difference in the annual rate of regular compensation between any 2 consecutive years exceeds 100 percent, the normal yearly amount of the retirement allowance shall be based on the average annual rate of regular compensation received by the member during the period of 5 consecutive years preceding retirement.
Employees who resign from service and who are not eligible to receive a retirement allowance or are under the age of 55 are entitled to request a refund of their accumulated total deductions. In addition, depending upon the number of years of creditable service, such employees are entitled to receive zero, fifty, or one hundred percent of the regular interest which has accrued upon those deductions. However, effective July 1, 2010, members voluntarily withdrawing with less than 10 years of service get credited interest each year at a rate of 3% and do not forfeit any interest previously earned on contributions.
C. Contributions
Participants contribute a set percentage of their gross regular com-pensation annually. Employee contribution percentages are specified in Chapter 32 of the Massachusetts General Laws. The employee’s individual contribution percentage is determined by their date of entry into the system. In addition, all employees hired after January 1, 1979 contribute an additional 2% on all gross regular compensation over the rate of $30,000 per year. The percentages are as follows:
Employers are required to contribute at actuarially determined rates as accepted by the Public Employee Retirement Administration Commission (PERAC). The Department’s contribution to the System for the year ended June 30, 2015 was $1,401,638, which was equal to its annual required contribution.
D. Summary of Significant Accounting Policies
For purposes of measuring the net pension liability, deferred outflows of resources and deferred inflows of resources related to pensions, and pen-sion expense, information about the fiduciary net position of the System and additions to/deductions from System’s fiduciary net position have been determined on the same basis as they are reported by System. For this purpose, benefit payments (including refunds of employee contribu-
Before January 1, 1975 5%
January 1, 1975 - December 31, 1983 7%
January 1, 1984 - June 30, 1996 8%
Beginning July 1, 1996 9%

26
tions) are recognized when due and payable in accordance with benefit terms. Investments are reported at fair value.
E. Pension Liabilities, Pension Expense, and Deferred Outflows of Resources and Deferred Inflows of Resources Related to Pensions
At June 30, 2015, the Department reported a liability of $4,524,191 for its proportionate share of the System’s net pension liability. The net pension liability was measured as of December 31, 2014, and the total pension liability used to calculate the net pension liability was determined by an actuarial valuation as of July 1, 2013 rolled forward to December 31, 2014. The Department’s proportion of the net pension liability was based on an actuarially determined projection of the Department’s long-term share of contributions to the pension plan relative to the projected contributions of all participating employers. At December 31, 2014, the Department’s proportion was 28.25%.
Town of Reading Municipal Light Department Employees’ Retirement Trust (“Pension Trust”): The Department has established an irrevocable trust for the purpose of currently funding its annual required contribution to the Town of Reading Contributory Retirement System (RCRS). Annual contributions to the trust are actuarially determined to be the net normal cost for funding the Department’s liability for pension benefits for covered employees, and both the principal and income of the trust is restricted for the exclusive benefit of Department employees and their beneficiaries. This Pension Trust is reported as a fiduciary fund type in the Department’s basic financial statements.
As noted in the first paragraph of this section, the Department’s propor-tionate share of the RCRS net pension liability was determined by an actuarial valuation as of July 1, 2013 rolled forward to December 31, 2014. However, the actuarial valuation does not take into account the fiduciary net position of the Department’s Pension Trust at December 31, 2014 (the measurement date). Accordingly, the following reconciliation is provided:
2015
Net pension liability, per actuarial valuation $ 8,464,663
Pension Trust Net Position (5,450,833)
Pension Trust contributions subsequent to the net
pension liability measurement date (reported as
deferred outflows of resources in the proprietary
fund Statements of Net Position) 1,500,000
Pension Trust investment income and fair value
changes subsequent to the net pension liability
measurement date 10,361
Net pension liability, as reported on the proprietary
fund Statements of Net Position $ 4,524,191

27
For the year ended June 30, 2015, the Department recognized pension expense of $833,949. In addition, the Department reported deferred outflows of resources related to pensions from the following sources:
Deferred outflows of resources related to pensions resulting from contri-butions subsequent to the measurement date will be recognized as a reduction of the Department’s net pension liability in the year ended June 30, 2016. Amounts reported as deferred outflows of resources related to pensions will be recognized in the Department’s pension expense as follows:
Actuarial assumptions: The total pension liability was determined by an actuarial valuation as of July 1, 2013, rolled forward to the measurement date of December 31, 2014 using the following actuarial assumptions, applied to all periods included in the measurement:
Mortality rates were based on the RP-2000 Mortality Table projected to 2012 with Scale AA. For disabled lives, the mortality rates were based on the RP-2000 Mortality Table set forward five years.
Deferred
Outflows of
Resources
$ 47,815
1,500,000
Total $ 1,547,815
Net difference between projected and actual
earnings on pension plan investments
Contributions subsequent to the measurement
date
Year ended June 30:
2016 $ 1,511,954
2017 11,954
2018 11,954
2019 11,953
Total $ 1,547,815
Inflation
Salary increases
Investment rate of return
Based on years of service, 7.00% - 4.75% for
Group 1 members and 8.00% - 5.25% for
Group 4 members
7.75%, net of pension plan investment expense,
3.75% per year
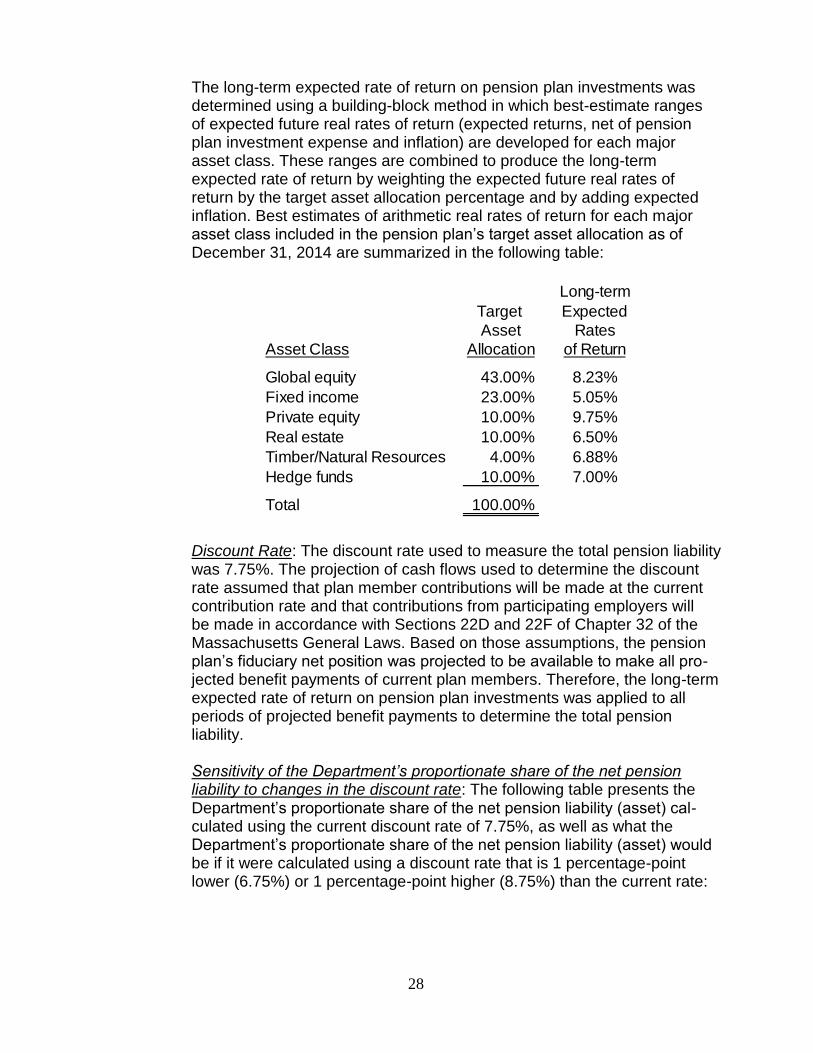
28
The long-term expected rate of return on pension plan investments was determined using a building-block method in which best-estimate ranges of expected future real rates of return (expected returns, net of pension plan investment expense and inflation) are developed for each major asset class. These ranges are combined to produce the long-term expected rate of return by weighting the expected future real rates of return by the target asset allocation percentage and by adding expected inflation. Best estimates of arithmetic real rates of return for each major asset class included in the pension plan’s target asset allocation as of December 31, 2014 are summarized in the following table:
Discount Rate: The discount rate used to measure the total pension liability was 7.75%. The projection of cash flows used to determine the discount rate assumed that plan member contributions will be made at the current contribution rate and that contributions from participating employers will be made in accordance with Sections 22D and 22F of Chapter 32 of the Massachusetts General Laws. Based on those assumptions, the pension plan’s fiduciary net position was projected to be available to make all pro-jected benefit payments of current plan members. Therefore, the long-term expected rate of return on pension plan investments was applied to all periods of projected benefit payments to determine the total pension liability. Sensitivity of the Department’s proportionate share of the net pension liability to changes in the discount rate: The following table presents the Department’s proportionate share of the net pension liability (asset) cal-culated using the current discount rate of 7.75%, as well as what the Department’s proportionate share of the net pension liability (asset) would be if it were calculated using a discount rate that is 1 percentage-point lower (6.75%) or 1 percentage-point higher (8.75%) than the current rate:
Long-term
Target Expected
Asset Rates
Asset Class Allocation of Return
Global equity 43.00% 8.23%
Fixed income 23.00% 5.05%
Private equity 10.00% 9.75%
Real estate 10.00% 6.50%
Timber/Natural Resources 4.00% 6.88%
Hedge funds 10.00% 7.00%
Total 100.00%
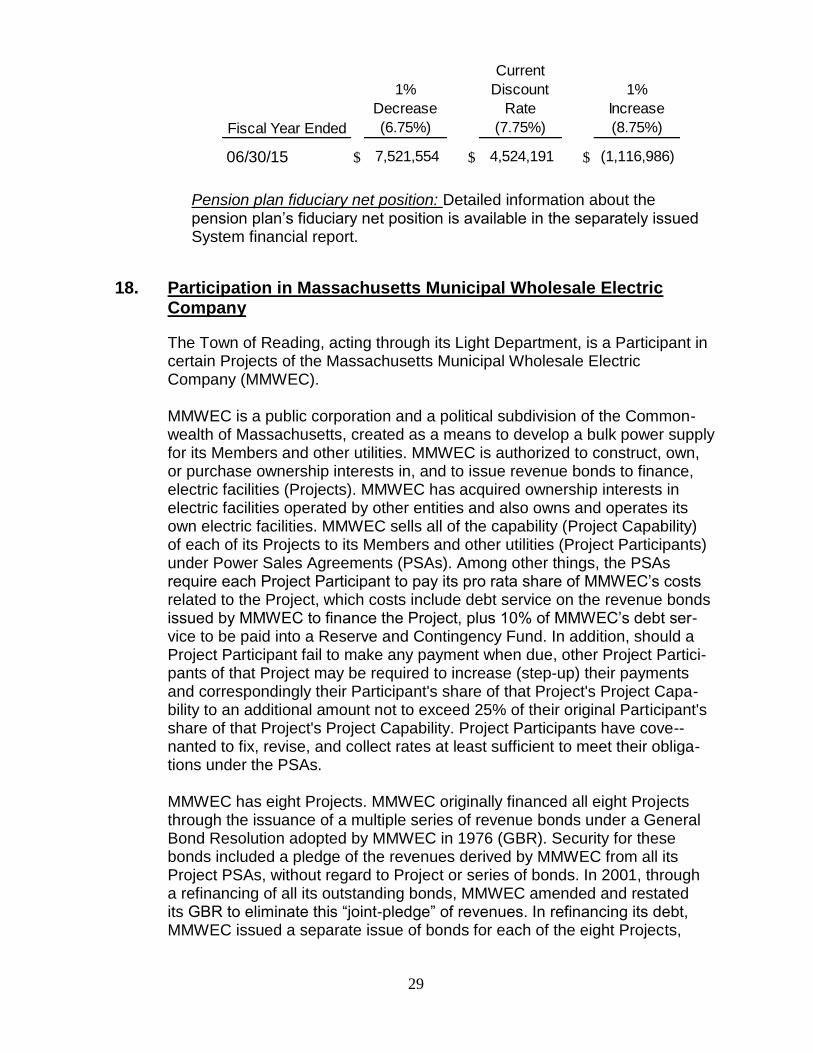
29
Pension plan fiduciary net position: Detailed information about the pension plan’s fiduciary net position is available in the separately issued System financial report.
18. Participation in Massachusetts Municipal Wholesale Electric Company
The Town of Reading, acting through its Light Department, is a Participant in certain Projects of the Massachusetts Municipal Wholesale Electric Company (MMWEC). MMWEC is a public corporation and a political subdivision of the Common-wealth of Massachusetts, created as a means to develop a bulk power supply for its Members and other utilities. MMWEC is authorized to construct, own, or purchase ownership interests in, and to issue revenue bonds to finance, electric facilities (Projects). MMWEC has acquired ownership interests in electric facilities operated by other entities and also owns and operates its own electric facilities. MMWEC sells all of the capability (Project Capability) of each of its Projects to its Members and other utilities (Project Participants) under Power Sales Agreements (PSAs). Among other things, the PSAs require each Project Participant to pay its pro rata share of MMWEC’s costs related to the Project, which costs include debt service on the revenue bonds issued by MMWEC to finance the Project, plus 10% of MMWEC’s debt ser-vice to be paid into a Reserve and Contingency Fund. In addition, should a Project Participant fail to make any payment when due, other Project Partici-pants of that Project may be required to increase (stepup) their payments and correspondingly their Participant's share of that Project's Project Capa-bility to an additional amount not to exceed 25% of their original Participant's share of that Project's Project Capability. Project Participants have cove--nanted to fix, revise, and collect rates at least sufficient to meet their obliga-tions under the PSAs. MMWEC has eight Projects. MMWEC originally financed all eight Projects through the issuance of a multiple series of revenue bonds under a General Bond Resolution adopted by MMWEC in 1976 (GBR). Security for these bonds included a pledge of the revenues derived by MMWEC from all its Project PSAs, without regard to Project or series of bonds. In 2001, through a refinancing of all its outstanding bonds, MMWEC amended and restated its GBR to eliminate this “joint-pledge” of revenues. In refinancing its debt, MMWEC issued a separate issue of bonds for each of the eight Projects,
Fiscal Year Ended
1%
Decrease
(6.75%)
Current
Discount
Rate
(7.75%)
1%
Increase
(8.75%)
06/30/15 $ 7,521,554 $ 4,524,191 $ (1,116,986)

30
which are payable solely from, and secured solely by, the revenues derived from the Project to which such issue relates plus available funds pledged under the Amended and Restated GBR with respect to the bonds of such issue. The MMWEC revenues derived from each Project are used solely to provide for the payment of the bonds of any bond issue relating to such Project and to pay MMWEC's cost of owning and operating such Project and are not used to provide for the payment of the bonds of any bond issue relating to any other Project. MMWEC operates the Stony Brook Intermediate Project and the Stony Brook Peaking Project, both fossil-fueled power plants. MMWEC has a 22.7 MW interest in the W. F. Wyman Unit No. 4 plant, owned and operated by subsid-iaries of Florida Power & Light and a 4.8% ownership interest in the Millstone Unit 3 nuclear unit operated by Dominion Nuclear Connecticut, Inc. (DNCI), a subsidiary of Dominion Resources, Inc. DNCI has stated its intention to file an application with the Nuclear Regulatory Commission (NRC) for an extension of the Millstone Unit 3 operating license, which currently will expire in 2025. DNCI has not yet filed its application with the NRC. MMWEC has an 11.6% ownership interest in the Seabrook Station nuclear generating unit, which represents a substantial portion of its plant investment and financing program. On November 1, 2002, an indirect subsidiary of FPL Group Inc., FPL Energy Seabrook, LLC purchased an approximate 88% share in the Seabrook nuclear plant from seven other owners. MMWEC is now one of three, minority non-operating owners of Seabrook Station. Pursuant to the PSAs, the MMWEC Seabrook and Millstone Project Partici-pants are liable for their proportionate share of the costs associated with decommissioning the plants, which is being funded through monthly Project billings. The Project Participants are also liable for their proportionate share of the uninsured costs of a nuclear incident that might be imposed under the Price-Anderson Act (Act). By its terms, the Act expired in August 2002. Congress is currently considering extending the Act. In November 1997, the Commonwealth of Massachusetts enacted legislation effective March 1, 1998 to restructure the electric utility industry. MMWEC and the municipal light departments, including the Massachusetts Project Participants, are not specifically subject to this legislation. However, it is management’s belief that industry restructuring and customer choice promulgated by the legislation will have an effect on MMWEC and the Participants’ operations. The Reading Municipal Light Department has entered into PSAs and Power Purchase Agreements (PPAs) with MMWEC. Under both the PSAs and PPAs, the Department is required to make certain payments to MMWEC payable solely from Department revenues. Under the PSAs, each Participant is unconditionally obligated to make payments due to MMWEC whether or not

31
the Project(s) is completed or operating and notwithstanding the suspension or interruption of the output of the Project(s). MMWEC is involved in various legal actions. In the opinion of management, the outcome of such litigation or claims will not have a material adverse effect on the financial position of the company. After the July 1, 2015 principal payment, total capital expenditures amounted to $1,682,341,000, of which $125,343,000 represents the amount associated with the Department's Project Capability. MMWEC's debt outstanding for the Projects from Power Supply System Revenue Bonds totals $167,110,000, of which $6,373,000 is associated with the Department's share of Project Capability. After the July 1, 2015 principal payment, MMWEC's total future debt service requirement on outstanding bonds issued for the Projects is $121,353,000, of which $4,362,000 is anticipated to be billed to the Department in the future. The aggregate amount of the Department's required payments under the PSAs and PPAs, exclusive of the Reserve and Contingency Fund billings, to MMWEC at June 30, 2015 and estimated for future years is shown below.
In addition, under the PSAs, the Department is required to pay to MMWEC its share of the Operation and Maintenance (O& M) costs of the Projects in which it participates. The Department's total O& M costs including debt service under the PSAs were $12,475,000 and $14,021,000 for the years ended June 30, 2015 and 2014, respectively.
19. Renewable Energy Certificates
In 2003, the Massachusetts Department of Energy and Environmental Affairs adopted the Massachusetts Renewable Energy Portfolio Standard (RPS), a regulation that requires Investor Owned Utilities (IOUs) to purchase mandated amounts of energy generated by renewable resources (Green Energy) as a percentage of their overall electricity sales. The Massachusetts RPS applies only to IOUs, so the Department is currently exempt from this mandate. Energy suppliers meet their annual RPS obligations by acquiring a sufficient quantity of RPS-qualified renewable energy certificates (RECs) that are created and recorded at the New England Power Pool (NEPOOL) Generation
For years ended June 30, 2016 $ 2,700,000
2017 1,472,000
2018 190,000
Total $ 4,362,000
Annual Costs
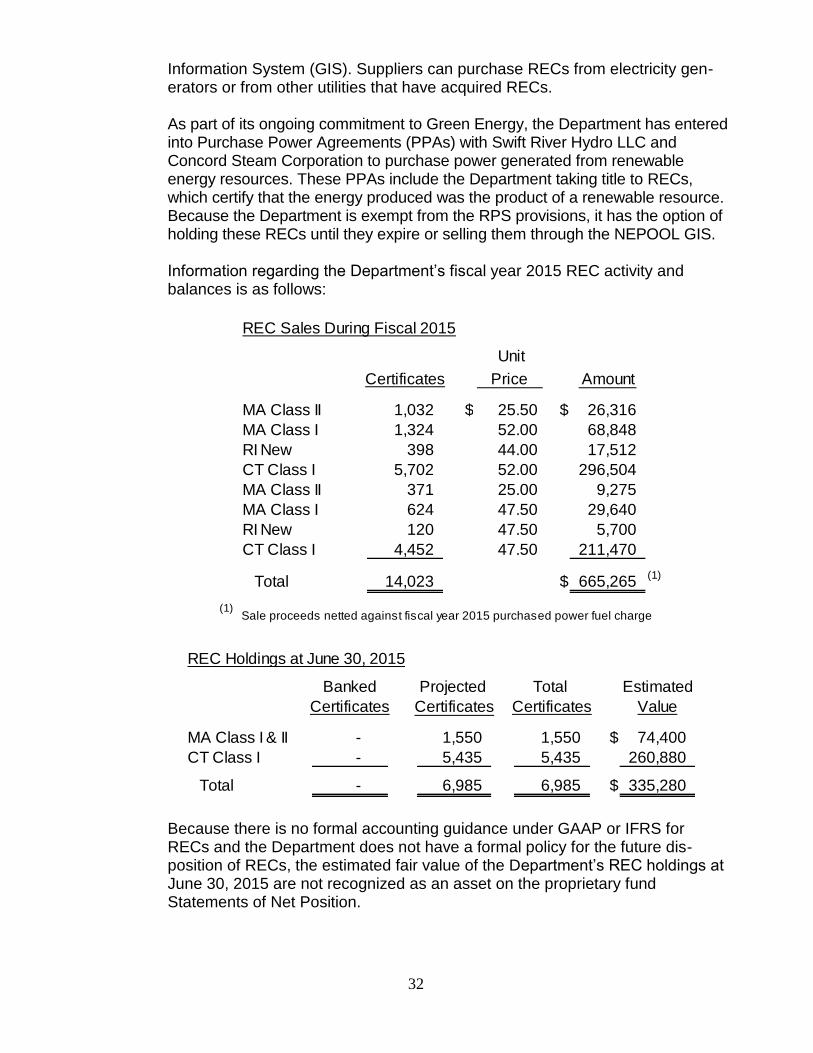
32
Information System (GIS). Suppliers can purchase RECs from electricity gen-erators or from other utilities that have acquired RECs. As part of its ongoing commitment to Green Energy, the Department has entered into Purchase Power Agreements (PPAs) with Swift River Hydro LLC and Concord Steam Corporation to purchase power generated from renewable energy resources. These PPAs include the Department taking title to RECs, which certify that the energy produced was the product of a renewable resource. Because the Department is exempt from the RPS provisions, it has the option of holding these RECs until they expire or selling them through the NEPOOL GIS. Information regarding the Department’s fiscal year 2015 REC activity and balances is as follows:
Because there is no formal accounting guidance under GAAP or IFRS for RECs and the Department does not have a formal policy for the future dis-position of RECs, the estimated fair value of the Department’s REC holdings at June 30, 2015 are not recognized as an asset on the proprietary fund Statements of Net Position.
REC Sales During Fiscal 2015
Certificates
Unit
Price Amount
MA Class II 1,032 $ 25.50 $ 26,316
MA Class I 1,324 52.00 68,848
RI New 398 44.00 17,512
CT Class I 5,702 52.00 296,504
MA Class II 371 25.00 9,275
MA Class I 624 47.50 29,640
RI New 120 47.50 5,700
CT Class I 4,452 47.50 211,470
Total 14,023 $ 665,265 (1)
(1) Sale proceeds netted against fiscal year 2015 purchased power fuel charge
REC Holdings at June 30, 2015
Banked Total Estimated
Certificates Certificates Value
MA Class I & II - 1,550 1,550 $ 74,400
CT Class I - 5,435 5,435 260,880
Total - 6,985 6,985 $ 335,280
Projected
Certificates

33
20. Leases
Related Party Transaction - Property Sub-Lease
The Department is the lessor of facilities that are currently sub-leased to the Reading Town Employees Federal Credit Union. The original sub-lease agreement commenced in December 2000 and was extended by various amendments through November 30, 2015. Following is the future minimum rental income to be received by the Department under the terms of this lease for the year ending June 30:
Operating Lease - Warehouse
The Department is the lessee of a warehouse facility owned by JCM Real Estate Trust. The original lease agreement for this facility commenced in December 1998 and was extended by various amendments through May 31, 2016. Under the terms of the most recent lease amendment, the Department has the option to extend the lease for an additional 24 months until May 31, 2018. Following is the future minimum rental expense to be paid by the Department for the year ending June 30:
21. Beginning Net Position Restatement
In fiscal year 2015, the Department implemented GASB Statement No. 68, Accounting and Financial Reporting for Pensions – An Amendment of GASB Statement No. 27. As a result of this implementation, the beginning (July 1, 2014) net position of the Department’s proprietary fund has been restated as follows:
2016 $ 4,084
Total $ 4,084
2016 $ 147,902
Total $ 147,902
Proprietary
Fund
As previously reported $ 101,873,334
GASB 68 Implementation (3,669,527)
As restated $ 98,203,807
Business-Type Activities

34
Actuarial UAAL as
Accrued a Percent-
Actuarial Liability Unfunded age of
Actuarial Value of (AAL) - AAL Funded Covered Covered
Valuation Assets Entry Age (UAAL) Ratio Payroll Payroll
Date (a) (b) (b-a) (a/b) (c) [(b-a)/c]
06/30/14 1,846,042$ 7,726,667$ 5,880,625$ 23.89% N/A N/A
06/30/13 1,495,511$ 7,588,993$ 6,093,482$ 19.71% N/A N/A
06/30/11 1,167,161$ 8,643,438$ 7,476,277$ 13.50% N/A N/A
06/30/08 -$ 8,085,388$ 8,085,388$ 0.00% N/A N/A
See Independent Auditors' Report.
Other Post-Employment Benefits
TOWN OF READING, MASSACHUSETTS, MUNICIPAL LIGHT DEPARTMENT
SCHEDULE OF FUNDING PROGRESS
REQUIRED SUPPLEMENTARY INFORMATION
June 30, 2015
(Unaudited)
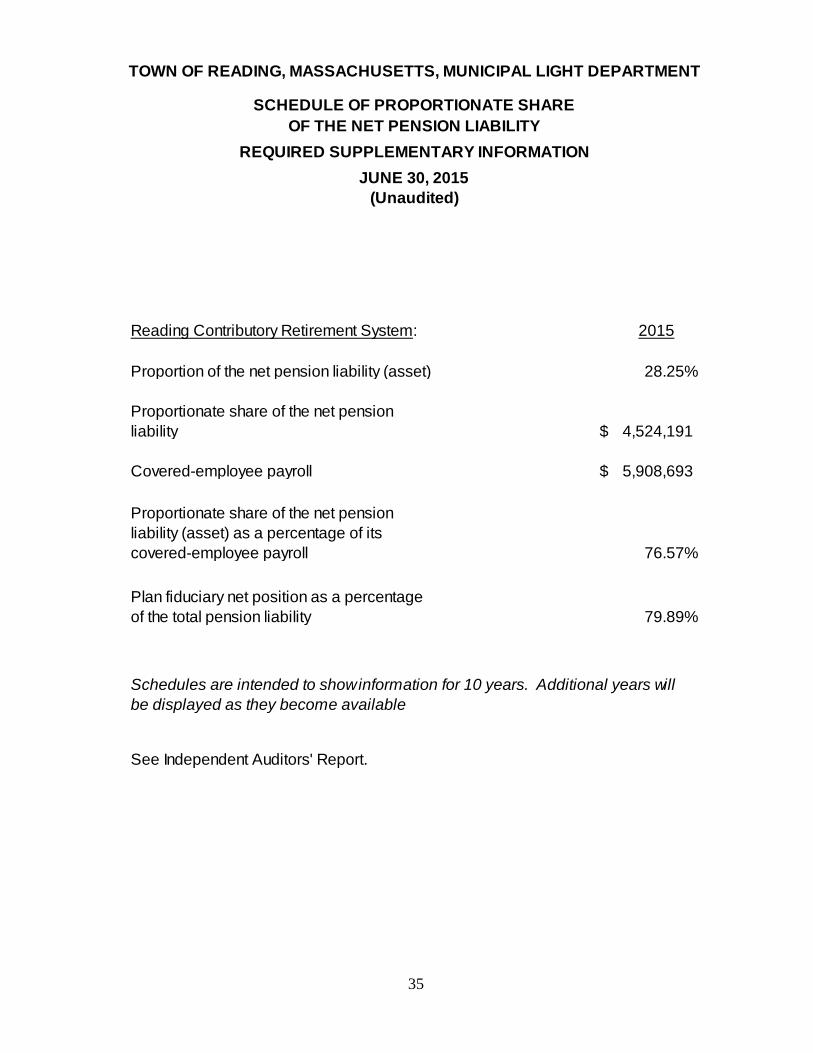
35
Reading Contributory Retirement System: 2015
28.25%
$ 4,524,191
$ 5,908,693
76.57%
79.89%
See Independent Auditors' Report.
Proportionate share of the net pension
liability
Covered-employee payroll
Proportionate share of the net pension
liability (asset) as a percentage of its
covered-employee payroll
Plan fiduciary net position as a percentage
of the total pension liability
Schedules are intended to show information for 10 years. Additional years will
be displayed as they become available
Proportion of the net pension liability (asset)
TOWN OF READING, MASSACHUSETTS, MUNICIPAL LIGHT DEPARTMENT
SCHEDULE OF PROPORTIONATE SHARE
OF THE NET PENSION LIABILITY
REQUIRED SUPPLEMENTARY INFORMATION
JUNE 30, 2015
(Unaudited)
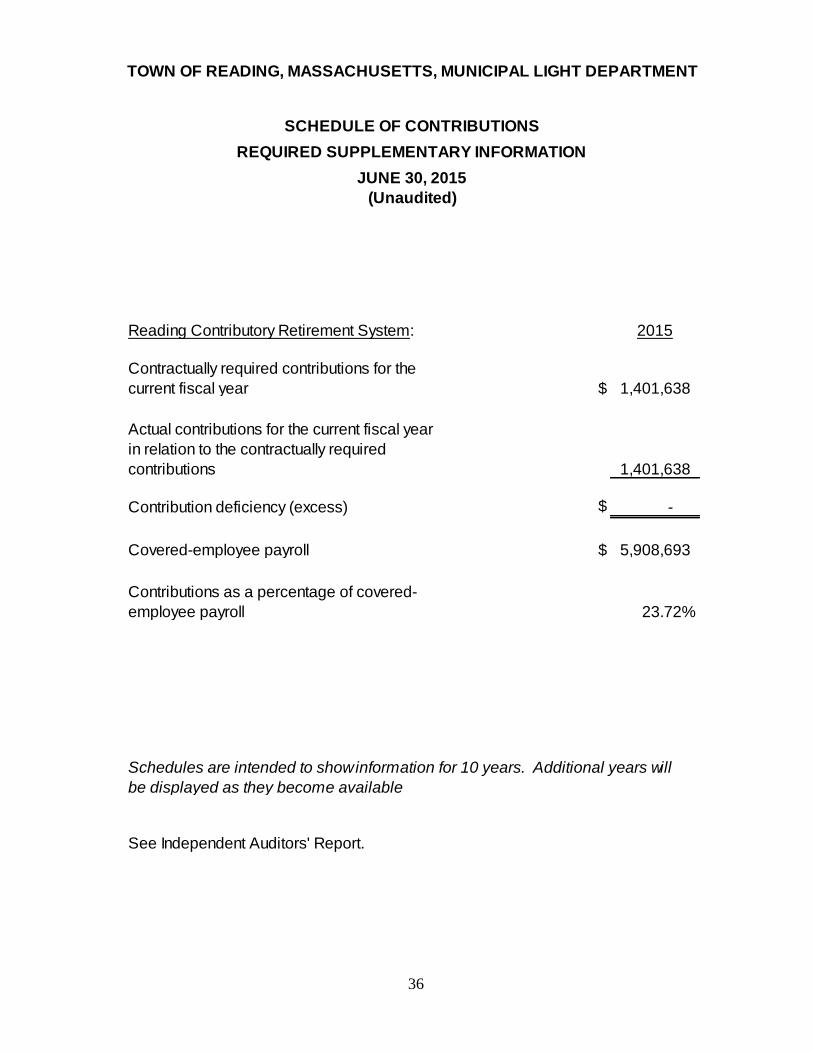
36
Reading Contributory Retirement System: 2015
$ 1,401,638
1,401,638
$ -
$ 5,908,693
23.72%
See Independent Auditors' Report.
Actual contributions for the current fiscal year
in relation to the contractually required
contributions
Contribution deficiency (excess)
Covered-employee payroll
Contributions as a percentage of covered-
employee payroll
Schedules are intended to show information for 10 years. Additional years will
be displayed as they become available
Contractually required contributions for the
current fiscal year
TOWN OF READING, MASSACHUSETTS, MUNICIPAL LIGHT DEPARTMENT
SCHEDULE OF CONTRIBUTIONS
REQUIRED SUPPLEMENTARY INFORMATION
JUNE 30, 2015
(Unaudited)