coverage initiation
TRANSCRIPT
FOR IMPORTANT DISCLOSURE INFORMATION, INCLUDING DISCLOSURES RELATED TO THE U.S. DISTRIBUTOR OF THIS REPORT, PLEASE REFER TO THE FINAL PAGES OF THIS REPORT - Please refer to the final pages of this report for important disclosures, analyst certifications and additional information. Espirito Santo Investment Bank does and seeks to do business with companies covered in its research reports. As a result, investors should be aware that the firm may have a conflict of interest that could affect the objectivity of this report. Investors should consider this report as only a single factor in making their investment decision. This research report has been prepared in whole or in part by research analysts based outside the US who are not registered/qualified as research analysts with FINRA (v1.0.5.2)
COVERAGE INITIATION
India | Cement | Large Cap | 20-September-2013
Cement
Concrete recovery ahead
The Cement industry is amongst those few sectors that act as a proxy to
both India's consumption and infrastructure growth story. While
regulatory headwinds have stunted infrastructure growth, our detailed
bottom-up demand analysis points to a 7.5% CAGR for cement demand
in India over FY13-16E. Further, post-monsoon demand and pre-election
spending should revive demand in 2H13. Owing to capacity additions
over FY08-13, naysayers raise the spectre of an imminent price war to
talk down the cement industry. However, we think the industry is mature
enough to maintain its supply discipline and price ―sanity‖, as is evident
from the low correlation between utilization levels/margins over the
past 20 years. Moderation in capacity additions, rising capital costs,
enlarged balance sheets (for marginal players) and rising raw material
costs should also extend cost push support. We initiate with a BUY
rating on Ultratech, Ambuja and ACC and a NEUTRAL on Shree Cement.
Demand: Underlying drivers intact; India – yet to ride the global curve
Our detailed bottom-up demand analysis points to demand growth at a 7.5% CAGR
over FY13-16E, with housing (67% of total demand) to grow at 8.8% and
Infrastructure (comprising irrigation, railways and water sanitation) to grow at 7.5%
CAGR. In 2H13 we expect a good monsoon to spur consumption which, along with
pre-election spending (10 state assembly and a general election), should drive
demand revival. Rising state spending on cement-intensive sectors, increasing
share of construction & real estate spend (as a % of GDP) and stable cement
intensity bolster our faith in India‖s cement story. With per capita consumption at
40% of the global average, we think India has yet to ride the global curve. In our
view, cement is a good proxy to Indian‖s infra and consumption growth story.
Expect price sanity to prevail, not because they are Good Samaritans
We think supply discipline generally prevails, not because the cement players are
Good Samaritans but due to plain economics which captures operational/financial
leverage. Whilst economic rationality isn‖t everything, we think the Indian cement
industry has matured with no (price) war of attrition. Higher capital costs,
increasing debt burden for marginal players, cost inflation and moderating capacity
additions also point to the continuation of pricing ―sanity‖.
Cost inflation is here to stay; cost efficiencies — order of the day
Raw material prices (fly ash/gypsum/limestone), power/coal costs (grid/linkage)
and freight rates (rail/road) all look set to move up. Increasing under-recoveries
should increase diesel prices, while price pooling could push coal prices up.
Analysing historical cement prices/margins, we find cement makers have
successfully passed on cost increases in the past. We also think cement makers
have the potential to expand margins via increased usage of AFR, WHR systems
and higher blending (fly ash/slag). We estimate that such cost-cutting initiatives
could boost cumulative EBITDA for covered companies by 24% (see Figure 82)
Initiate with BUY on Ultratech, Ambuja, ACC; NEUTRAL on Shree Cement
We initiate on Ultratech (UTCEM IN, FV Rs 2221, 10x FY15E EV/OP), Ambuja (ACEM
IN, FV Rs 206, 9x CY14E EV/OP) and ACC (ACC IN, FV Rs 1397, CY14E 9x EV/OP)
with BUY ratings and on Shree Cement (SRCM IN, FV Rs 4199, FY14E 8x EV/OP +
NPV) with a NEUTRAL. We assign above industry average target multiples to our
top 4 as they offer: 1) Significantly higher market share (combined top 4 hold 40%
of India cement production), 2) Superior growth visibility (i.e. 61% of total additions
over FY14-16E), 3) Healthy balance sheets (UTCEM IN at ~0.2x vs. industry average
at 1.5x; other 3 net cash) and importantly 4) above industry return ratios (at 16-17%
vs. industry average at ~10%)
Ultratech Cements
BUY 29% upside
Fair Value Rs2,221.00
Bloomberg ticker UTCEM IN
Share Price Rs1,720.00
Market Capitalisation Rs471,280.00m
Free Float 40%
Ambuja Cements
BUY 14% upside
Fair Value Rs206.00
Bloomberg ticker ACEM IN
Share Price Rs180.00
Market Capitalisation Rs276,840.00m
Free Float 50%
ACC
BUY 31% upside
Fair Value Rs1,397.00
Bloomberg ticker ACC IN
Share Price Rs1,065.00
Market Capitalisation Rs200,220.00m
Free Float 50%
Shree Cement
NEUTRAL 6% upside
Fair Value Rs4,199.00
Bloomberg ticker SRCM IN
Share Price Rs3,964.00
Market Capitalisation Rs137,947.20m
Free Float 25%
Source: Espirito Santo Investment Bank Research, Company
Data, Bloomberg
Analysts Ritesh Shah +91 22 4315 6831 [email protected] Espirito Santo Securities India Private Limited Anshuman Atri +91 22 4315 6825 [email protected] Espirito Santo Securities India Private Limited
Key fundamental metrics indicate Ultratech as
top pick, followed by Ambuja & ACC
Source: ESIBR, Company Data
*Full green coloured circle = 4 (best), full white = 0 is worst
(Relative to these 4)
Comparison Table Ultratech ACC Ambuja Shree
Return, Leverage & Growth 4 3 3 3
Operational Characteristics 4 3 3 3
Market Position 4 3 3 2
Overall 4 3 3 2

Page 2 of 47
Contents India demand - macro drivers & impact on multi-regional market ............................................................................................................................... 3
Multi-regional market – high freight cost induces regionalism ...................................................................................................................................... 4
Regional cement curve - east and central yet to ride the curve: .............................................................................................................................. 4
Cement consumption – regional demand trends: ............................................................................................................................................................. 5
Strong state spends & stable cement intensity across regions ..................................................................................................................................6
Regional Supply – Demand imbalance continues…. ......................................................................................................................................................... 7
Leading to Inter-regional movement: .................................................................................................................................................................................... 8
Price/volume tradeoff – a delicate equilibrium ......................................................................................................................................................................9
Large players – wary of not pushing smaller ones to the brink: .................................................................................................................................9
Smaller players have higher sensitivity to price/volume tradeoffs:........................................................................................................................ 10
Large vs. Small - no clear winner or loser over FY09-12 on market share: .......................................................................................................... 10
Utilization, EBITDA Margin & RoCE trend point to supply discipline ...................................................................................................................... 11
(Price) War of attrition – not visible in Indian industry ................................................................................................................................................. 11
However, economic rationale isn‖t always the Holy Grail ............................................................................................................................................. 11
High debt, capacity moderation & cost push to support pricing ................................................................................................................................. 12
High debt in system to impact capacity addition ........................................................................................................................................................... 12
Capacity addition moderation – a reality ........................................................................................................................................................................... 12
Constraints on capacity – nameplate capacity vs. name-sake capacity ............................................................................................................... 13
Input cost inflation – is here to stay; embrace it ............................................................................................................................................................. 13
Cost reduction opportunities: multiple avenues exist ....................................................................................................................................................... 15
More often than not, cost is passed through ........................................................................................................................................................................ 17
Cement supply discipline – is it a cartel? ................................................................................................................................................................................ 17
Choose players – where they stand, what they offer? ..................................................................................................................................................... 20
Operational characteristics & opportunities .................................................................................................................................................................... 20
Regional capacity and market share trends, P/V tradeoffs ...................................................................................................................................... 23
Financial metrics........................................................................................................................................................................................................................... 27
Appendix
Company Section ............................................................................................................................................................................................................................ 33

Page 3 of 47
Figure 1 With 67% of total consumption,
Housing is the key growth driver (2012)
Source: Espirito Santo Investment Bank Research, CMA
We expect housing to remain a
structural growth driver not only
because of a massive housing shortage
(~20 urban + ~40 rural) but also due to
low cement usage in existing housing
construction.
Figure 3 Average Cement Growth/GDP
Growth Ratio is 1.2 over the past 10 years
Source: Espirito Santo Investment Bank Research, CMA, RBI
0.0
0.5
1.0
1.5
2.0
2.5
Cement Growth vs. GDP Growth (x) Average
India demand — macro drivers & impact on multi-regional market
Macro drivers: The Indian cement consumption story is primarily being driven
by housing demand, which accounts for 67% of total consumption, followed
by infrastructure at 13%, commercial construction at 11% and Industrial
construction at 9%. Housing, which commands the lion's share of total
consumption, is likely to remain the key growth driver, as only 29% of the
existing 247mn households have concrete roofs and the remaining 71%
present an untapped opportunity. India‖s push to improve its ailing
infrastructure is also expected by us to remain a key driver for cement
demand. The GOI has an ambitious outlay of $1tn for infrastructure spending
in the XIIth
plan, which is double that allotted in the XIth
plan. Other macro
drivers that inspire faith in the long-term demand growth story include a)
rising state spending on cement intensive sectors, b) increasing share of
construction & real estate spending as a % of GDP, c) stable cement intensity
(cement consumption per Rs Mn of construction + real estate spending) and
d) GOI's renewed impetus on addressing urban housing & infrastructure
needs.
Figure 2 ESIB bottom-up India cement consumption model: Housing to remain the key growth driver
Source: Espirito Santo Investment Bank Research for estimates, Company Data
India demand analysis – top down & bottom up: India‖s cement demand
growth has tracked the GDP growth rate (Figure 3), with the 10-year average
cement/GDP growth at 1.2x. Our bottom up analysis — which considers the
four key segments a) Housing, b) Industrial, c) Infrastructure and d)
Commercial construction growth — implies FY14E cement demand growth of
5.8%. Factoring long term cement intensity (1.2x) and our bottom up cement
growth (at 5.9%), we infer expected GDP growth at 4.8%, which is
substantially lower than most recent (September 13th
, 2013) PMEAC‖s guidance
at 5.3% leaving upside risk to our estimates.
a) Housing demand: We expect demand for cement from housing to
grow at CAGR of 8.8% over FY13-FY16E, with rural to outpace urban.
Our model assumes a new housing loan disbursement rate of 15% and
urban share of total mortgage at 70%. Since 65% of the population
resides in rural areas, we apportion cement demand between rural
and urban areas in a similar ratio, implying a rural dominated
consumption play. We expect housing to remain a structural growth
driver not only because of a massive housing shortage (~20mn urban
+ ~40mn rural, MoHUPA) but also due to low cement usage in existing
housing construction.
b) Infrastructure growth: We have divided infrastructure cement
consumption into 4 sub segments, namely irrigation, railways, water
supply & sanitation and others. Irrigation demand is driven by state
spending, with a planned outlay of INR~710bn in FY13, implying ~20mt
0% 20% 40% 60% 80% 100%
Rural Housing
Urban Housing
Housing
Irrigation
Railway
Water Supply & Sanitation
Others Infrastructure
Infrastructure
Energy
Others Industrial
Industrial
Commercial
Total
0% 5% 10% 15%
Growth FY14E
0% 10% 20%
Growth FY15E
0% 5% 10% 15%
Growth FY16E
Page 3 of 73

Page 4 of 47
We expect irrigation & railways to
driver infrastructure growth at 7.5%
CAGR over FY13-16E.
Figure 4 Under Implementation projects as
per CMIE remains strong
Source: Espirito Santo Investment Bank Research, CMIE
0.0
0.5
1.0
1.5
2.0
2.5
3.0
3.5
4.0
4.5
-
10
20
30
40
50
60
70
80
90
FY
96
FY
97
FY
98
FY
99
FY
00
FY
01
FY
02
FY
03
FY
04
FY
05
FY
06
FY
07
FY
08
FY
09
FY
10
FY
11
FY
12
FY
13
Rs T
rill
ion
Rs T
rill
ion
Announced Under Implementation Completed
We expect total cement demand to
grow at 7.5% CAGR over FY13-16E,
which may be further boosted by a
faster than expected recovery in
infrastructure demand.
Cement industry is regional in nature,
as cement is a high volume/low value
product and freight accounts for a
significant portion of total cost (~20-
25% of total).
Cement per capita demand across
state varies from a low of 69kg (in
Assam) to a high of 437kg (in
Chandigarh).
We expect two key trends to emerge
as various states ride through the
cement curve (Figure 141), 1)
movement along the curve and 2)
upward shift of the curve.
of cement demand. Irrigation spending by states show a clear
uptrend and is expected by us to register strong growth of 8% over
FY13-16E. As per the planning commission, India has ultimate
irrigation potential of ~140mn ha, of which ~101mn ha has been
created till the end of the Xth
plan, implying significant investment
potential ahead. As per planning commission, railways are expected
to increase planned spending in the XIIth
plan to 2.5x that of the last
plan, which implies ~6-7mt of annual cement consumption. Water
supply & sanitation is another state-spend based cement demand
driver which contributes to ~2mt of annual cement demand. We
expect increasing state spend in this sub segment to drive growth at
a 7% CAGR over FY13-16E. We further expect others to grow at a
meagre 2% over the same period. On an aggregate basis, we expect
irrigation & railways to drive infrastructure growth at 7.5% CAGR over
FY13-16E.
c) Industrial construction growth: We have divided industrial
construction demand into energy and others. Owing to a slowdown in
power execution, we expect cement demand in this segment to drop
by 2/3rd
of the FY10 level to ~3.5mt in FY14E and then grow at a
meagre 1% for the next two years. We further expect others to grow
at the 5% level owing to moderation in new industrial project
implementation.
d) Commercial construction growth: Owing to a moderation in
commercial construction in urban areas, we expect commercial
growth to remain at a 3% CAGR over FY13-16E.
We expect total cement demand to grow at a 7.5% CAGR over FY13-16E,
which may be further boosted by a faster than expected recovery in
infrastructure demand.
Under-implementation pipeline remains strong: We use the annual Centre
for Monitoring Indian Economy (CMIE) data on announced projects, under
implementation projects and completed projects across all sectors, (including
manufacturing, textiles, chemicals, consumer goods, construction material,
metals & mining, machinery, transport & transport equipment and construction
& real estate) to gauge the impact of macro drivers on capital spend. CMIE
data (Figure 4) for total announced projects, under implementation projects
and completed projects in value terms show a strong correlation among two
year lagged curves for these three categories. Further, the average ratio of
completed to two year lagged under implementation projects over FY00-11
stands at 8%. Considering Rs77tn of projects under implementation as of FY12
and 8% completion to under implementation ratio, FY14 project completion
will reach Rs6tn in FY14 vs. Rs3.4tn in FY13. Even assuming a 5% rate achieved
in FY13, the FY14 project completion would be Rs3.8tn, i.e., 12% higher than
that of FY13. With the under implementation pipeline still strong, we believe
cement demand can be expected to remain strong in near term.
Multi-regional market — high freight cost induces regionalism
The cement industry is largely regional in nature, as cement is a high
volume/low value product and freight accounts for a significant portion of
total cost (~20-25% of total). The Indian cement industry is accordingly
divided into five regions, viz. East, West, North, South and Central (Appendix
5, Figure 196). Cement demand across regions is driven by the same macro
factors as discussed above; however, the quantum of investment varies.
Regional cement curve — East and Central yet to ride the curve:
The cement per capita demand across states/UTs varies from a low of 69kg
(in Assam) to a high of 437kg (in Chandigarh). State-wise cement
consumption (Figure 5) shows a similar trend to the international cement
curve (Figure 173). Union territories represent the high end of the curve, while
key growth states like Gujarat, Maharashtra, Tamil Nadu, Andhra Pradesh and
Page 4 of 73

Page 5 of 47
We expect cement demand to pick up
as ten Indian States get into assembly
election mode over 2013-14 and
impending general elections in May
2014. Empirical evidence indicates
pick-up in cement demand before
elections.
Karnataka represent the mid portion of the curve and eastern & central states
represent the low end of the curve. We expect two key trends to emerge as
various states ride through the cement curve (Figure 5): the first a movement
along the curve and the second an upward shift of the curve. Leading states
will try to catch up with world average, leading to an upward shift; while
followers will move along the curve. The progress of the Indian cement story
will be outlined by continued growth of key growth states (mid curve) and
renewed growth from eastern & central states as they embark upon a rapid
growth trajectory.
Figure 5 East and Central states yet to ride the cement curve Figure 6 Concrete roofing as % of total is at a low 29% across India
Source: Espirito Santo Investment Bank Research, CRISIL, RBI, 2010 Data Source: Espirito Santo Investment Bank Research, Planning Commission
Cement consumption – regional demand trends
We expect demand to pick up in H2FY14 and factor a high single digit growth
in FY15E & FY16E. We estimate state wise growth trends in Figure 9, with key
growth drivers as outlined above (Figure 2). Cement growth tends to grow in
election years (Figure 7). A look at the past six general elections shows that
cement demand growth in the six months prior to an election generally
exceeds that of the corresponding period in the prior year. To put this into
context, 10 states are slated for assembly elections in 2013-14, which as per
CMA, together accounted for 43% of total cement consumption in FY12. We
think general elections, combined with state assembly elections in 10 states,
will lead to higher state/central spending on housing and infrastructure
projects, which in turn lead to increased cement demand.
Our bottom up demand approach estimates election-bound states are likely to
register high single digit growth rates. States like Madhya Pradesh in the
Central region; New Delhi & Rajasthan in the North; Chhattisgarh, Odisha &
Sikkim in the East and Andhra Pradesh in the South are poll-bound within the
next one-year period and are generally expected to be demand drivers in
respective regions.
Figure 7 Cement demand generally spurts before election Figure 8 Elections in top cement consuming states in 2013-14
Source: Espirito Santo Investment Bank Research, ECI, DIPP Source: Espirito Santo Investment Bank Research, ECI
Andhra Pradesh
Assam
Bihar
Chandigarh
Chhattisgarh
Delhi
Goa
Gujarat, Tamil Nadu
Haryana
Himachal Pradesh
Jammu & Kashmir
Jharkhand
KarnatakaKerala
Madhya Pradesh
Maharashtra
Odisha
Puducherry
Punjab
Rajasthan
Uttarakhand
Uttar Pradesh
West Bengal
India
-
50
100
150
200
250
300
350
400
450
500
0 20,000 40,000 60,000 80,000 100,000 120,000 140,000 160,000
Cement Consumption Per Capita (Kg) Trend (Cement Consumption Per Capita (Kg))
Per Capita Cement Consumption (Kg)
GPD Per Person (Rs)
Andhra Pradesh
Assam
Bihar
Chandigarh
Chhattisgarh
Delhi
Goa
Gujarat
Haryana
Himachal Pradesh
J & KJharkhand
Karnataka
Kerala
Madhya Pradesh
Maharashtra
Odisha
Puducherry
Punjab
Rajasthan
Tamil NaduUttarakhand
Uttar Pradesh
West Bengal
0%
10%
20%
30%
40%
50%
60%
70%
80%
90%
- 5 10 15 20 25 30 35
% of Concrete Roof Trend (% of Concrete Roof)No of households (Millions)
India Average
% Concrete Roofs
0%
2%
4%
6%
8%
10%
12%
14%
16%
18%
20%
May 91 Apr 96 Feb 98 Sep 99 Apr 04 Apr 09
Cement Growth in 6 Months in Previous Year
Cement Growth in 6 Months before Election
Year Region State Year Region State
Dec-13 Central Madhya Pradesh Jan-14 East Chhattisgarh
Dec-13 North Delhi Nov-14 East Arunachal Pradesh
Dec-13 North Rajasthan Jun-14 East Odisha
May-14 East Sikkim
Dec-14 West Maharashtra
Oct-14 North Haryana
Jun-14 South Andhra Pradesh
Page 5 of 73

Page 6 of 47
High expenditure to outlay ratio along
with rising state spending points to
stable and strong state level cement
demand drivers
Our bottom up analysis indicates state
spending accounted for ~15% of total
cement demand in FY13
Figure 9 Expect domestic demand to pick up in H2FY14
Source: Espirito Santo Investment Bank Research for estimates, Company Data
Strong state spending & stable cement intensity across regions
We have analysed region wise, state and total spending trends on
construction & real estate to ascertain the impact on cement demand. The
three key trends that emerge are a) increasing state spending on cement
intensive sectors, b) stable cement intensity across regions and c) rising share
of construction + real estate spending as a % of GDP, implying strong cement
demand.
State spending - a key demand driver for cement consumption
State expenditure in irrigation, Energy, Transport & Urban Development has
remained strong across regions, with these combined contributing to 73-85%
of total spending in cement intensive sectors. In addition, states‖ expenditure
to outlay ratio remains over 80% in FY08-FY11, indicating a higher degree of
utilization of funds. Assuming civil works as 30% of total spending and cement
cost at 20% of total civil works, it translates to 35Mt, or 15% of total cement
demand in FY13. State spending in these sectors not only remains strong but is
also rising on a yoy basis across regions, implying a stable source of
consumption for cement.
Domestic Consumption Growth Region FY06 FY07 FY08 FY09 FY10 FY11 FY12 FY13 FY14E FY15E FY16E
Uttarakhand North 25% 21% 14% -4% 3% 0% 9% 9% 8% 9% 9%
Haryana North 16% 13% 24% 4% -6% -1% 15% 10% 5% 8% 10%
Punjab North 8% 15% 2% -5% 5% 13% 8% 9% 3% 9% 9%
Rajasthan North 19% 10% 13% 6% 13% 3% 11% 10% 8% 9% 10%
Himachal Pradesh North 10% 17% 1% 2% 193% 20% 3% 9% 3% 9% 9%
Chandigarh North 40% 38% 16% 2% -1% -42% -56% 9% 3% 9% 9%
Delhi North -7% -15% 19% 34% -11% -12% 5% 8% 8% 8% 8%
Jammu & Kashmir North 7% 22% 1% -14% -51% -16% 4% 8% 3% 8% 8%
North - Total North 12% 11% 12% 5% 12% 4% 9% 9% 6% 9% 9%
Assam East -6% -4% -26% 124% 2% 26% -3% 5% 4% 5% 5%
Meghalaya East -16% 12% 7% -30% -9% -17% -20% 5% 4% 5% 5%
Tripura East - - - - -6% -13% 20% 10% 5% 10% 10%
Manipur East - - - - 15% -27% 117% 10% 5% 10% 10%
Nagaland East - - - - -9% 60% -27% 5% 4% 5% 5%
Arunachal Pradesh East - - - - 32% 21% 3% 10% 9% 10% 10%
Mizoram East - - - - 19% 10% -19% 5% 4% 5% 5%
Sikkim East - - - - 0% 0% -8% 5% 4% 5% 5%
Bihar East 15% 3% 1% 12% 18% 11% 1% 10% 7% 10% 10%
Jharkhand East 14% 0% 2% 16% 34% 6% -2% 8% 4% 8% 8%
Odisha East 7% 8% 6% 15% 12% 5% 13% 12% 9% 12% 12%
West Bengal East 6% 5% 5% 6% 13% 11% 6% 8% 7% 8% 8%
Chhattisgarh East 49% 14% 8% 9% 39% 1% 12% 12% 9% 12% 12%
East - Total East 11% 6% 3% 14% 19% 8% 5% 10% 7% 10% 10%
Andhra Pradesh South 47% 13% 20% 18% -1% -16% 4% 6% 4% 6% 6%
Tamil Nadu South 22% 17% 13% 10% 15% 4% 3% 5% 4% 5% 5%
Karnataka South 22% 19% 8% 1% 32% 2% 15% 10% 5% 10% 10%
Kerala South 7% 8% 2% 11% -8% -1% 5% 5% 4% 5% 5%
Pondicherry South 31% 19% 9% 2% 9% -7% -5% 5% 4% 5% 5%
Andaman & Nicobar South 53% 45% -3% -4% -6% -23% 14% 10% 4% 10% 10%
Goa South -36% -11% 14% 1% -32% 12% 10% 10% 4% 9% 10%
South - Total South 25% 15% 12% 11% 9% -4% 7% 7% 4% 7% 7%
Gujarat West 5% 10% 16% 4% 38% 9% 13% 8% 6% 8% 8%
Maharashtra West 6% 8% 13% 9% -6% 9% 11% 8% 6% 8% 8%
West - Total West 6% 9% 14% 7% 10% 9% 12% 8% 6% 8% 8%
Uttar Pradesh Central 1% 12% 2% 10% 8% 13% 9% 9% 7% 9% 9%
Mahdya Pradesh Central 1% 3% 15% 12% -3% 10% 10% 10% 8% 9% 10%
Central - Total Central 1% 9% 6% 11% 5% 12% 9% 9% 7% 9% 9%
India - Total India 12.0% 10.4% 10.3% 9.3% 10.5% 4.2% 8.1% 8.4% 5.9% 8.3% 8.5%
Page 6 of 73

Page 7 of 47
Figure 15 Cement demand has recovered
sharply from the lows of FY11
Source: Espirito Santo Investment Bank Research
0%
2%
4%
6%
8%
10%
12%
14%
0
50
100
150
200
250
300
FY05 FY06 FY07 FY08 FY09 FY10 FY11 FY12 FY13
Cement Production (Mt) % Change (YoY) - RHS
Figure 16 FY10/11 demand slowdown owing to
lower demand in South
Source: Espirito Santo Investment Bank Research
-5%
0%
5%
10%
15%
20%
25%
FY06 FY07 FY08 FY09 FY10 FY11 FY12
East West North South Central India
Cement intensity has still not reached
the diminishing returns stage, which
implies incremental spending on
construction & real estate will translate
into a proportionate increase in cement
consumption.
Figure 10 Irrigation, Energy, Transport & Urban Development are key growth
contributors to state plans
Figure 11 Eastern states are increasing state based
infrastructure/housing spending
Source: Espirito Santo Investment Bank Research, GOI, * Planned outlay Source: Espirito Santo Investment Bank Research, GOI
Rising construction & real estate spend as a % of GDP augurs well
Construction (Figure 12) and real estate (Figure 13) spending, over FY00-FY11,
as a % of real Gross State Domestic Product (GSDP) is increasing steadily
across regions. In addition, cement intensity (cement consumption T/(Rs
million) of construction + real estate spends) has remained stable over the
years, with average norm of ~30t/(Rs million). Cement intensity has still not
reached the diminishing returns stage, which implies incremental spending on
construction & real estate will translate into a proportionate increase in
cement consumption.
Figure 12 Construction spending as a % of GDP
is increasing across regions
Figure 13 Real Estate spending as a % of GDP
is strong in South, North & West
Figure 14 Cement Intensity is stable across
regions
Source: Espirito Santo Investment Bank Research, RBI Source: Espirito Santo Investment Bank Research, RBI Source: Espirito Santo Investment Bank Research, RBI, CMA
Based on FY11 real GDP (FY05 base) and regional cement consumption
volumes, we estimate that for every 1% increase in Construction or Real Estate
spending as a % of GDP, cement demand increases by ~3mt per region (or
~15mt at India level).
Construction spending as a % of GDP across regions is in a narrow band of 8-
11%; however, there is a wide disparity in real estate spending between
East/Central (6-7%) and South (14%). We thus see large potential in the East
and Central regions as they catch up with the South. A 7 percentage point
increase (to match the 14% level in South) in real estate spending (Figure 13)
in the Central & Eastern regions implies a 42mt opportunity, assuming a 3mt
increase in demand per 1% increase in spending.
Demand drops, but pops up again
Further, looking at historical cement demand, we find it plummeted in FY11 &
FY12 due to a steep decline in cement consumption in Southern states. In
FY12, cement demand in the state of Andhra Pradesh declined by 11%, leading
to a 1% decline in total Southern demand. We think the sharp demand drop
was primarily due to the unrest over demand for creation of a new state in the
Telangana region. Post this, cement demand recovered from low 4.5% growth
in FY11 to an impressive 9.3% in FY13 (Figure 15).
Regional Supply – Demand imbalance continues….
The Southern & Western regions, comprising 6 large states, have traditionally
been strong consumers of cement, together accounting for 48% of total
demand in FY13. In FY13, the South was the largest cement consumer (at 28%
of the total), followed by the West at 20%, the North at 20% and the East at
-
100
200
300
400
500
600
700
800
FY
08
FY
09
FY
10
FY
11
FY
12*
FY
13*
FY
08
FY
09
FY
10
FY
11
FY
12*
FY
13*
FY
08
FY
09
FY
10
FY
11
FY
12*
FY
13*
FY
08
FY
09
FY
10
FY
11
FY
12*
FY
13*
FY
08
FY
09
FY
10
FY
11
FY
12*
FY
13*
East West North South Central
Rs B
illi
on
Rural Development Irrigation Energy
Industry & Minerals Transport Tourism
Water Supply & Sanitation Housing Urban Development
17% 17% 17% 16% 18% 22%
18% 19% 20% 21% 20%21%
20% 19% 19% 18% 20%18%
30% 29% 28% 28%28% 26%
15% 16% 16% 16% 14% 14%
0%
10%
20%
30%
40%
50%
60%
70%
80%
90%
100%
FY08 FY09 FY10 FY11 FY12 FY13
East West North South Central
5%
6%
7%
8%
9%
10%
11%
12%
FY00 FY01 FY02 FY03 FY04 FY05 FY06 FY07 FY08 FY09 FY10 FY11
East West North South Central
Construction as % of GDP
4%
6%
8%
10%
12%
14%
FY00 FY01 FY02 FY03 FY04 FY05 FY06 FY07 FY08 FY09 FY10 FY11
East West North South Central
Real Estate as % of GDP
-
5
10
15
20
25
30
35
40
45
FY05 FY06 FY07 FY08 FY09 FY10 FY11
East West North South Central
Cement Intensity (T/Rs Mn Construction + Real Estate Spend)
Page 7 of 73

Page 8 of 47
Regulatory issues, higher capital costs,
rising interest rates have translated
into moderation in capacity addition.
Implementation of land acquisition bill
will translate to higher land acquisition
cost and hinder capacity additions in
our view.
17%, while Central was the lowest (at 15%). In terms of capacity, the South
leads the pack at 40% of the total in FY13, followed by the North at 20%, East
at 14%, West at 14%, and Central at 12%. Cement capacity variance across
regions can be attributed to a combination of both cement demand and
limestone availability. Abundance of limestone reserves in the South (~50% of
total) with strong consumption demand makes this region a leader in capacity
addition. Despite having the second-largest limestone reserves (at 18%) East
has only 14% of total capacity. We expect South & West to remain demand
leaders, while laggards like the East & Central regions will likely try to make up
for lost time with renewed growth drivers.
Figure 17 Expect West, East & Central to remain in deficit
Figure 18 We expect strong production growth across
all regions
Source: Espirito Santo Investment Bank Research for estimates, Company Data, CMIE, CMA Source: Espirito Santo Investment Bank Research for estimates, Company Data, CMA,
CMIE
Capacity additions — moderation a reality: East looks set to lead….
In comparison with massive capacity additions of 164mt over FY08-13, we
expect capacity additions to moderate over FY14E-16E at ~47mt. We expect
maximum capacity additions in the Eastern region at ~19mt, followed by the
North at 12mt, South at 9mt, Central at 5mt and the lowest additions in the
Western region at 2mt. Capacity additions by private players in the Eastern
region are expected by us to outpace other regions owing to excess demand
and better realization. It is interesting to note that the South will continue to
add capacity despite utilization rates remaining at sub-60%. We expect supply
discipline to prevail despite capacity additions owing to the higher sensitivity
of EBITDA in the sector to pricing than to utilization.
Figure 19 East to see maximum capacity addition to tap
newfound opportunity
Figure 20 South to West - key inter-regional
movement
Source: Espirito Santo Investment Bank Research, Company Data, CMA, CMIE Source: Espirito Santo Investment Bank Research, Company Data, CMA, CMIE
Leading to Inter-regional movement:
A mismatch between cement capacity & consumption across regions is
resulting in inter-regional cement movement. A closer look at inter-regional
cement movement over FY09-13 (Figure 20) reveals that the South & North –
as surplus capacity regions – are key suppliers, while the West dominates
inter-regional consumption. We expect demand to remain strong across
regions, with demand continuing to outstrip supply in the West, East & Central
regions (Figure 17 & 18). South will remain a key supplier of interregional trade
-
50
100
150
200
250
300
350 Regional Cement Demand (Mt)
North East South West Central
-
50
100
150
200
250
300
350 Regional Cement Supply (CMA + Non-CMA)
(Mt)
North East South West Central
-
50
100
150
200
250
300
350
400
450 Regional Cement Capacity (Mt)
North East South West Central
(40)
(30)
(20)
(10)
-
10
20
30
40 Inter Regional Cement Movement (Mt)
North East South West Central
Page 8 of 73

Page 9 of 47
Supply discipline not because cement
players are acting selflessly, but due to
plain economics.
Figure 22 Tepid growth in south leading to
moderation in demand
Source: Espirito Santo Investment Bank Research, Company Data
0%
2%
4%
6%
8%
10%
12%
14%
0
50
100
150
200
250
300
FY05 FY06 FY07 FY08 FY09 FY10 FY11 FY12 FY13
Cement Production (Mt) % Change (YoY) - RHS
Figure 23 Supply discipline - guiding factors
Source: Espirito Santo Investment Bank Research, Company Data
Lower utilization Higher Utilization
Lower
Utilization
1. Price sanity
2. Supply discipline
1. Large player gains as
price remains stable
Higher
Utilization
1. Small player gains
as price remains
stable
1. Both suffer loss due
to excess production
2. Prices crash
Sm
all
Pla
yer
Large Player
South & North being surplus capacity
regions are key suppliers, while West
dominates inter-regional consumption
owing to surplus capacity and sustained capacity additions, while the West
should remain the key consumer of interregional trade.
We expect the pace of capacity additions to sharply reduce over FY14-16E to
an average of ~16mtpa (47mt) vs. ~33mtpa (164mt) over FY08-13. Further, we
do not rule out downside risk as certain capacity additions might face delays.
Planned capacity additions over FY14-16E, which are asymmetrical across
regions, should further increase interregional movement. Overall, we expect
cement capacity additions to slow and demand to improve from now on with
a likely pick up in public expenditure (in light of upcoming elections), pent up
demand on the back of extended and healthy monsoons and stable housing
demand. Hence, we believe a gradual increase in capacity utilization and price
increases can be factored in from here on. The figure below highlights our key
assumptions for cement supply, demand and utilization levels.
Figure 21 India - Demand & Supply model - expect gradual increase in utilization
Source: Espirito Santo Investment Bank Research for estimates, Company Data
Price/volume tradeoff – a delicate equilibrium
Cement prices have remained steady over FY08-13 despite massive capacity
additions and demand moderation, which we think can be attributed to supply
discipline. The Indian cement industry has seen moderation in cement demand
to sub 10% annual growth and excessive capacity additions of 160 Mt over
FY08-FY13. We think the moderation can be attributed primarily to tepid
demand in the southern region, which in FY13 accounted for 40% of total
capacity and 28% of consumption.
We explore various factors that should lead to supply discipline in Indian
cement industry. Figure 23 shows four possible scenarios that could arise for
small and large players based on their decision to increase or decrease
utilization. The best case for a large or small player arises when it increases
utilization and another player reduces utilization, leading to stable prices and
supply. However, the other player knows that its competitor can react by
increasing utilization, thereby leading to excess supply, resulting in a price
crash. Thus it is in the best interest of all the players to maintain supply
discipline, translating into stable prices. Since smaller players are more
susceptible to price drops (Figure 25 & 27), we think it‖s in their best interest
to avoid engaging in a price/volume war.
Large players – wary of not pushing smaller ones to the brink:
Cement players achieve a delicate balance of price and capacity utilization as
dictated by regional market dynamics. Supply discipline generally prevails, not
because the cement players are acting selflessly, but due to the higher
sensitivity of their operating profits to realization vs. utilization levels. We
simulate the operational leverage structure for a large scale cement player for
a 1MT facility to capture the sensitivity impact. Our scenario analysis assumes
1MT cement plant with low fixed costs (at Rs223/t), higher variable costs (at
Rs3138/t) and generating EBITDA/T of Rs1075 at 100% utilization levels. Our
base case assumes 75% utilization, which implies EBITDA/T of Rs1,000. We
find that a 10% increase in utilization from the base case (of 75%) and a 6%
drop in realization results in a 23% drop at the absolute EBITDA level. This
indicates that it would not be in the best interest of any player to wage a price
war to gain market share, as larger players with lower operational leverage
can sustain themselves for a prolonged period.
FY05 FY06 FY07 FY08 FY09 FY10 FY11 FY12 FY13 FY14E FY15E FY16E
Year End Capacity (Mt) 155 163 170 195 220 256 299 335 359 377 393 406
Total Supply (Mt) 128 143 155 168 185 205 214 231 248 260 283 307
Domestic Demand (Mt) 122 136 150 166 181 200 209 226 245 259 280 304
Exports (Mt) 6 6 6 4 4 2 2 2 2 1 2 3
Utilization (Year End) % 83% 87% 92% 86% 84% 80% 71% 69% 69% 69% 72% 76%
Utilization (Average) % 90% 93% 92% 89% 86% 77% 73% 71% 71% 73% 77%
Page 9 of 73

Page 10 of 47
Contrary to the popular belief that
larger players typically accommodate
smaller ones (through production cuts)
to maintain supply discipline, we see
no such trends.
Figure 24 Larger player has lower fixed cost and
lower sensitivity to price Figure 25 Price/volume tradeoff sensitivity
Source: Espirito Santo Investment Bank Research, Company Data Source: Espirito Santo Investment Bank Research, Company Data
Smaller players have higher sensitivity to price/volume tradeoffs: To
gauge the price/volume impact for a smaller player, we look at a smaller
capacity cement plant, with relatively higher fixed costs (Rs445/t) and
variable costs at Rs2824/t. A higher fixed cost of Rs445/T (vs. a larger
producer at Rs223/T) can be attributed to higher per tonne SG&A costs. Our
base case assumes 75% utilization, implying EBITDA of Rs516/T. It shows that
a 10% increase in utilization from the base case (of 75%) & a 6% drop in
realization results in a 34% drop at the absolute EBITDA level. Further, if a
smaller player is more leveraged compared to a larger player, then the price
drop may also impact its ability to meet interest payment requirements.
Figure 26 Smaller players like Heidelberg have
higher fixed cost per tonne of capacity
Figure 27 Higher utilization is unlikely to materialize in higher absolute EBITDA if price
drops
Source: Espirito Santo Investment Bank Research, Company Data Source: Espirito Santo Investment Bank Research, Company Data
Large vs. Small - no clear winner or loser over FY09-12 on market share:
Contrary to the commonly-held belief that larger players typically
accommodate smaller ones (through production cuts) to maintain supply
discipline, we see no such trends. Market share (Figure 28) over FY09-12
across various categories (<5mt, 5-10mt & >10mt) doesn‖t indicate any clear
trend of large players ceding market share to smaller ones. We have divided
CMA members into three categories: a) those with <5mtpa capacity, b)
capacity between 5-10mtpa and c) capacity >10mtpa to analyse the impact of
major capacity additions over the same period. As per CMA, close to 50% of
FY09 capacity was added over FY09-12. Cement players in <5mtpa capacity
lost market share across regions, 5-10mtpa category gained in the Central &
Southern regions, while >10mtpa gained in all other regions.
Figure 28 No clear winner or loser in market share
Source: Espirito Santo Investment Bank Research, CMA
0
500
1000
1500
2000
2500
3000
3500
4000
70% 75% 80% 85% 90% 95% 100% 105%
-2% 7% 9% 11% 12% 14% 15% 16% 17%
-1% 2% 4% 6% 8% 9% 11% 12% 13%
0% -2% 0% 2% 3% 5% 6% 7% 8%
2% -11% -9% -7% -5% -4% -3% -1% 0%
6% -29% -27% -25% -23% -22% -20% -19% -18%
12% -55% -53% -51% -50% -48% -47% -46% -45%
EBITDA (% Change) Utilization level
Pri
ce D
rop
(%
)
0
500
1000
1500
2000
2500
3000
3500
70% 75% 80% 85% 90% 95% 100% 105%
-2% 8% 15% 21% 26% 31% 35% 38% 42%
-1% 1% 7% 13% 18% 23% 27% 31% 34%
0% -7% 0% 6% 11% 16% 20% 23% 27%
2% -22% -15% -9% -4% 1% 5% 8% 12%
6% -52% -45% -39% -34% -29% -25% -22% -18%
12% -96% -90% -84% -79% -74% -70% -66% -63%
EBITDA (% Change) Utilization level
Pri
ce D
rop
(%
)
0%
10%
20%
30%
40%
50%
60%
70%
<
5Mt
5Mt -
10Mt
>
10Mt
<
5Mt
5Mt -
10Mt
>
10Mt
<
5Mt
5Mt -
10Mt
>
10Mt
<
5Mt
5Mt -
10Mt
>
10Mt
<
5Mt
5Mt -
10Mt
>
10Mt
East West North South Central
Market Share (%)
FY09 FY10 FY11 FY12
Page 10 of 73

Page 11 of 47
Figure 33 Sagar cement cannot sustain prolonged price war
either
Source: Espirito Santo Investment Bank Research, Company Data
70% 75% 80% 85% 90% 95% 100% 105%
0% -3% 0% 2% 5% 6% 8% 10% 11%
3% -18% -16% -13% -11% -9% -7% -6% -4%
6% -34% -31% -29% -26% -25% -23% -21% -20%
9% -49% -47% -44% -42% -40% -38% -37% -35%
12% -65% -62% -60% -57% -56% -54% -52% -51%
15% -80% -78% -75% -73% -71% -69% -68% -66%
EBITDA (% Change) Utilization level
Pri
ce D
rop
(%
)
The cement industry‖s EBITDA margin
vs. capacity utilization over the past 20
years shows a weak positive
relationship, with a correlation
coefficient of 0.28, while RoCE vs.
capacity utilization shows a strong
positive relationship, with a correlation
coefficient of 0.53.
The Indian cement industry, post
deregulation in 1989, hasn‖t seen a
prolonged price war, with the last
decade seeing an exceptionally lower
(1.36 vs. 4.67 since 1987) number of
cement players registering under the
Board for Industrial & Financial
Reconstruction (BIFR).
Utilization, EBITDA Margin & RoCE trend point to supply discipline
The cement industry‖s EBITDA margin vs. capacity utilization over the past 20
years shows a weak positive relationship, with a correlation coefficient of 0.28,
while RoCE vs. capacity utilization shows a strong positive relationship, with a
correlation coefficient of 0.53. Weak correlation between EBITDA margins vs.
utilization clearly suggests that supply discipline prevails even during periods
of low capacity utilization, implying the absence of any prolonged price wars.
Strong correlation in the case of RoCE vs. Utilization can be largely attributed
to a higher denominator effect (higher capital employed).
Figure 29 EBITDA vs. Utilization shows a low
correlation of 0.3
Figure 30 Capacity utilization & RoCE - show positive
relationship
Source: Espirito Santo Investment Bank Research, Company Data, CMA, Ace Equity Source: Espirito Santo Investment Bank Research, Company Data, CMA, Ace Equity
(Price) War of attrition – not visible in the Indian industry
The Indian cement industry, post deregulation in 1989, hasn‖t seen a prolonged
price war. A prolonged price war can lead to expulsion of marginal players
from an industry or a war of attrition. Taking the number of distressed cement
companies registering under the Board for Industrial & Financial
Reconstruction (BIFR) as a proxy for a prolonged price war, we see that the
number is virtually zero post 2010, despite significant capacity additions
during FY09-FY12. In the last decade, the number of cement players
registering under BIFR has also fallen significantly (1.36 vs. 4.67 since 1987).
Further, there is no correlation between capacity utilization and the number of
cement companies filing for BIFR, which also indicates that a price war isn‖t
prevalent during periods of low capacity utilization. We therefore conclude
that the Indian cement industry has achieved maturity in terms of supply
discipline and pricing sanity.
Figure 31 No. of cement companies approaching BIFR
below historical mean in past decade
Figure 32 No correlation between capacity utilization
and no. of cement BIFR cases
Source: Espirito Santo Investment Bank Research, Company Data Source: Espirito Santo Investment Bank Research, Company Data
However, economic rationale isn‖t everything
Whilst our thesis indicates that price/volume equilibrium should be maintained
in the long term, we don‖t rule out abrupt price drops in certain pockets based
on regional demand/supply dynamics. We witnessed one such price war as
recently as March 2013 in the state of Andhra Pradesh; however pricing ―sanity‖
eventually returned (by June 2013).
AP price crash - eventually back to normal
Cement prices in Andhra Pradesh dipped in March 2013 by 6.3% on YoY basis,
and were 26% lower than in India on average. This was attributed to new
50%
55%
60%
65%
70%
75%
80%
85%
90%
95%
100%
0%
5%
10%
15%
20%
25%
30%
35%
EBITDA Margin (%) Utilization (%) - RHS
50%
55%
60%
65%
70%
75%
80%
85%
90%
95%
100%
0%
5%
10%
15%
20%
25%
30%
35%
40%
45%
RoCE (%) Utilization (%) - RHS
-2.0%
0.0%
2.0%
4.0%
6.0%
8.0%
10.0%
0
2
4
6
8
10
12
14
16
198
7
198
8
198
9
199
0
199
1
199
2
199
3
199
4
199
5
199
6
199
7
199
8
199
9
20
00
20
01
20
02
20
03
20
04
20
05
20
06
20
07
20
08
20
09
20
10
20
11
20
12
20
13
No of BIFR Cement Cases Cement as % of Total BIFR - RHS
-1.0%
0.0%
1.0%
2.0%
3.0%
4.0%
5.0%
6.0%
7.0%
8.0%
9.0%
60%
65%
70%
75%
80%
85%
90%
95%
100%
199
4
199
5
199
6
199
7
199
8
199
9
20
00
20
01
20
02
20
03
20
04
20
05
20
06
20
07
20
08
20
09
20
10
20
11
20
12
20
13
Utilization (%) Cement as % of Total BIFR - RHS
Page 11 of 73

Page 12 of 47
With majority of incremental capacity
additions expected by our top 4, we
think pricing ―sanity‖ will prevail even as
balance additions are on a higher
leverage basis
As per CMIE, though the list of under implementation projects remain high, a detailed analysis shows only ~47mt (Figure 35) of incremental additions are therefore likely to become operational over FY14-FY16E.
entrants resorting to price wars. We have analyzed AP-based cement
producer, Sagar Cement (SGC IN, Not rated) on its ability to wage & sustain a
price war. Figure 33 shows that a 10% increase in utilization from 75% to 85%
and a 6% drop in prices (as happened in March 2013), results in a 26% decline
in absolute EBITDA. As there were no winners in this price war, pricing ―sanity‖
finally prevailed and discipline returned to the market by June 2013.
High debt, capacity moderation & cost push to support pricing
We explore other possible factors that should help players to maintain supply
discipline and price rationality. We expect factors like a) constraints on power
availability, b) moderation in capacity addition, c) high debt in the system and
d) input cost increases to force players to maintain economic rationality in the
market.
High debt in system to impact capacity additions
As per the RBI, total credit outstanding to the cement industry from
scheduled commercial banks (SCBs) increased by 3x over CY08-CY12 and
stood at Rs435bn as of Jan 2013. Over the same period, cement capacity has
increased by 160mt. Gross debt per tonne of capacity for Ultratech, ACC,
Ambuja & Shree Cement combined stands at Rs680/t (Jan 2013), whereas the
combined total for the remaining players (Figure 34) is 2.3x that of the top
four, at Rs1,563/t (Jan 2013).
Cement producers (Ex. ACC, Ambuja, Ultratech & Shree; which are our top 4)
are making similar weighted average EBITDA/T, but their average Net
debt/EBITDA CY12/FY13 stands at 5.3x vs. -0.4x for our top four. Interest
coverage for our top four is also at a healthy 22.1x vs. 3.3x for the other
players. We think pricing discipline is likely to prevail, as we would expect
relatively debt free players to be able to withstand a pricing war for longer
than their leveraged counterparts.
Figure 34 High debt likely to deter others from pricing based competition
Source: Espirito Santo Investment Bank Research, Factset, Company Data, Capacity, Realization, EBITDA, net debt as of CY12/FY13
Capacity addition moderation – a reality
The confluence of significant capacity additions over the past 5 years (164mt
in FY08-13), high leverage, slower GDP growth, rising cost of capacity
additions and increasing input costs are forcing players to defer or cancel
incremental capacity additions. As per CMIE, although the list of under-
implementation projects remains high, our detailed analysis shows only ~47mt
(Figure 35) of incremental additions are likely to become operational over
FY14E-FY16E.
Company Ticker Capacity (Mt)
Realization
(Rs/T) EBITDA (Rs/T)
Net Debt (Rs
Mn)
Net Debt/
Capacity (Rs/T)
Net Debt/
EBITDA
Interest
Coverage
Ultratech Cement UTCEM IN 50.9 4,133 949 30,847 606 0.66 14.5
Ambuja Cement ACEM IN 28.0 4,410 1,088 (37,436) (1,339) (1.50) 49.6
ACC Cement ACC IN 30.6 4,497 930 (28,949) (946) (1.45) 18.0
Shree Cement SRCM IN 13.5 3,719 1,032 453 34 0.03 3.5
Wt. Average 30.7 4,241 985 (2,895) (285) (0.4) 22.1
JP Assoicates JPA IN 32.6 3,815 671 522,573 16,054 7.91 1.1
Madras Cements MC IN 12.5 4,202 1,331 19,272 1,543 1.99 3.8
Century Textiles CENT IN 10.0 4,170 1,097 47,968 4,797 9.06 0.4
India Cements ICEM IN 15.9 3,415 971 29,814 1,881 3.12 1.7
JK Lakshmi Cement JKLC IN 5.3 4,084 930 7,506 1,416 1.75 3.3
Birla Corp BCORP IN 5.8 3,901 779 5,699 986 1.56 3.4
JK Cement JKCE IN 7.5 5,145 1,075 10,028 1,337 1.82 3.1
Kesoram Industries KSI IN 7.3 4,170 1,097 43,215 5,961 14.95 (0.0)
Prism Cement PRSC IN 5.6 3,950 340 17,730 3,166 5.68 0.6
Heidelberg Cement HEIM IN 6.0 3,823 304 9,598 1,600 11.57 12.3
Mangalam Cement MGC IN 2.0 3,853 673 1,187 593 0.96 20.3
Wt. Average 10.0 3,973 864 170,624 6,477 6.0 2.7
Wt. Average (Less JP) 7.8 4,039 945 23,318 2,469 5.3 3.3
Under Coverage
Others
Page 12 of 73

Page 13 of 47
Figure 38 26% of total power shortage above
21 hours/week
Source: Espirito Santo Investment Bank Research, FICCI
< 1 Hr,
37%
1-5 Hr,
15%
6-10 Hr,
16%
11-20 Hr,
6%
21-30 Hr,
5%
31-40 Hr,
18%
> 40 Hr,
3%
Figure 39 AP & TN seeing severe industrial
power outages
Source: Espirito Santo Investment Bank Research, FICCI
0%
10%
20%
30%
40%
50%
60%
70%
80%
90%
100%
AP Delhi Guj JHK KAR MP MAH ODI TN WB
< 1 Hr 1-5 Hr 6-10 Hr 11-20 Hr 21-30 Hr 31-40 Hr > 40 Hr
Fly Ash: Stringent measures for
utilization of fly ash being generated
by thermal power plants could help
rein in price increases.
Figure 35 Capacity additions moderating Figure 36 Cement investment peaked in 2010 Figure 37 Existing addition high on debt
Source: Espirito Santo Investment Bank Research, CMA, CMIE Source: Espirito Santo Investment Bank Research, CMIE Source: Espirito Santo Investment Bank Research, Bloomberg
Constraints on capacity – nameplate capacity vs. name-sake capacity
Some industry participants frequently raise the spectre of a supply glut to
counter price stability, which can lead to suggestions of a price war ahead.
The issue is more pronounced in the Southern region, which is home to 40% of
Indian cement capacity, and where lower capacity utilization (~60%) is being
attributed to tepid demand growth. We think the industrial power shortage is
a key issue in the states of Andhra Pradesh & Tamil Nadu, which limits actual
available capacity vs. nameplate capacity. In its annual report, South-based
cement producer Sagar Cement mentioned that “severe shortage of power in
Andhra Pradesh is leading to frequent power cuts resulting in stoppage of
production”. A recent FICCI report on power shortages shows that 26% of
industrial power shortages across India fall under the 21+ hours per week of
outages category. The impact is more pronounced in the states of Andhra
Pradesh & Tamil Nadu (Figure 39) and we think this is one of the contributors
to maintaining supply discipline.
Second, the capacity information provided in the companies‖ annual reports is
not audited. Annual Capacity is certified by the management and, being a
technical matter, is accepted by the auditors as is. This can lead to
discrepancies between name-sake (as reported) vs. nameplate (actual)
capacity.
Input cost inflation is here to stay; embrace it
Raw material cost: Cement prices increased by 26% over FY07-13 (Figure 50),
while prices for two key raw material inputs, coal and lime, increased by 69%
and 41% respectively over the same period. Although most large players in
India have access to captive limestone mines, limestone prices have increased
by 21% (Figure 42) during FY07-11, while Gypsum cost has increased by 36%,
Fly Ash cost by 23% and slag cost by 64% during the same period. From a
cost structure perspective, raw materials account for ~15% of costs for Indian
cement producers (with Shree a typical example).
Figure 40 Shree - breakdown of raw material
cost (FY12) Figure 41 Shree - cost breakdown (Q4FY13)
Source: Espirito Santo Investment Bank Research, Company Data Source: Espirito Santo Investment Bank Research, Company Data
Fly ash cost increasing despite availability: Fly ash prices increased by 23%
over FY07-FY11, despite excess supply across regions. As per CEA, only 55%
of total fly ash being produced is currently being utilized, with cement
accounting for 48% of total consumption. Further, as per the Electricity Act of
2009, all coal/lignite based thermal power stations or expansion units in
operation before the date of this act are expected to achieve a target of 100
percent utilization of fly ash within five years of issue of the notification. As
-
5
10
15
20
25
30
35
40
45
50
Capacity Addition (Mt)
-
10,000
20,000
30,000
40,000
50,000
60,000
70,000
80,000
90,000
100,000
Ju
n-9
5
Ap
r-9
6
Fe
b-9
7
De
c-9
7
Oct-
98
Au
g-9
9
Ju
n-0
0
Ap
r-0
1
Fe
b-0
2
De
c-0
2
Oct-
03
Au
g-0
4
Ju
n-0
5
Ap
r-0
6
Fe
b-0
7
De
c-0
7
Oct-
08
Au
g-0
9
Ju
n-1
0
Ap
r-11
Fe
b-1
2
De
c-1
2
Oct-
13
Cement Comleted Projects (Rs Mn)
-
5,000
10,000
15,000
20,000
25,000
30,000
35,000
40,000
45,000
50,000
Ma
y-0
7
Se
p-0
7
Jan
-08
Ma
y-0
8
Se
p-0
8
Jan
-09
Ma
y-0
9
Se
p-0
9
Jan
-10
Ma
y-1
0
Se
p-1
0
Jan
-11
Ma
y-1
1
Se
p-1
1
Jan
-12
Ma
y-1
2
Se
p-1
2
Jan
-13
India Scheduled Commercial Banks Gross Bank Credit to
Cement (Rs 10Mn)
Limestone ,
42%
Gypsum , 13%
Fly Ash , 35%
Slag , 2%
Iron Ore &
Bauxite etc. , 1%
Others (Rs
Mn) , 7%
Raw
Materials, 17%
Power & Fuel,
21%
Outward
Freight, 28%
Employee,
11%
Others, 23%
~47mt
3x increase CY08-13
Page 13 of 73

Page 14 of 47
Figure 45 Fly Ash to remain in surplus
Source: Espirito Santo Investment Bank Research, Planning Commission
-
50
100
150
200
250
300
Xith Plan XIIth Plan
Thermal Capacity at end of Plan (GW)
Fly Ash generation at the end of Plan (Mt)
Reducing linkage availability is leading
to high dependence on e-auction &
imported coal. It is imperative for
cement producers to lower power &
fuel cost through access to captive
blocks, WHR and AFRs
per CEA, total annual fly ash generation at the end of the XIIth plan is
expected to increase by 58% to 271mt, and is expected to remain in surplus.
We think the fly ash price increase partly reflects increasing freight costs and
is partly due to suppliers taking price increases.
Figure 42 RM prices have increased by 21-64%
over FY07-11
Figure 43 Only 55% of available fly ash being
used
Figure 44 Cement is the biggest consumer of
fly ash at 48%
Source: Espirito Santo Investment Bank Research, Company Data Source: Espirito Santo Investment Bank Research, Company Data Source: Espirito Santo Investment Bank Research, Company Data
Limestone & Gypsum - focus on captive lime & synthetic gypsum:
Limestone costs for Ultratech increased by 48% (to Rs125/t) over FY07-11,
which implies an increase of Rs39/t in PPC cement making cost. Whilst the
impact of limestone cost increases should be limited for integrated players,
the impact on non-integrated players could be 3-4x higher. Existing limestone
reserves of 175bt (57% is cement grade) bode well for the industry; however,
regulatory hurdles may affect brownfield & greenfield mine expansions going
forward. (See Appendix 8)
Gypsum costs increased by 12% over FY07-11 (to Rs1,393/t) for Ultratech,
which implies an increase of Rs8/t in cement making cost. In India, gypsum
reserves are concentrated in Rajasthan, with supply and mining monopolized
by government organizations. This has resulted in a competitive scenario in
gypsum procurement. Geographically concentrated reserves also make it
difficult for cement players in far off states to procure the mineral and lead to
higher logistics costs. Players like Ambuja and Shree cement are working on
developing synthetic gypsum to rein in price volatility. The current quantum of
synthetic gypsum being produced is <10% of these two companies‖ total
requirements (See Appendix 9).
Figure 46 50% of limestone reserves in
Southern region (FY11)
Figure 47 96% of gypsum R&R in
Northern region (FY11)
Figure 48 Only 12% of gypsum is of
cement grade (FY11)
Source: Espirito Santo Investment Bank Research, Company Data Source: Espirito Santo Investment Bank Research, Company Data Source: Espirito Santo Investment Bank Research, Company Data
Coal & Power: Coal through linkage declined (Figure 49) by 20% over FY05-11
(to 12MT), while cement production during the same period increased by 64%
(to 216MT). Coal India‖s dispatch to the cement industry as a percentage of
total dispatch has declined from 4.7% in FY05 to 2.8% in FY11 (to 12MT).
Cement companies are now increasingly dependent on e-auction and
imported coal to meet their coal demand. Grid power costs across regions
have increased (Figure 51) by 16-30% over FY08 to FY12, with the central
region registering the maximum increase of 30%. With exception of Shree
Cement, most cement players are dependent on grid power to the tune of ~10-
40% of their total requirement and therefore have been affected by the grid
power cost increase. From a cost structure perspective, coal/power costs
account for ~25-30% of cement-makers‖ total costs.
100
300
500
700
900
1,100
1,300
1,500
FY07 FY08 FY09 FY10 FY11
Lime Stone (Rs/T) Fly Ash (Rs/T) Slag (Rs/T) Gypsum (Rs/T)
-
5
10
15
20
25
East West North South Central
Fly Ash availability (H1FY12) Mt Fly Ash Utilization (H1FY12) Mt
48%
13%
7%
7%
9%
1%
16%
Fly Ash utilization H1FY11
Cement
Roads & Embankments
Minefilling
Bricks
Reclamation
Agriculture
Others
East, 18%
West, 12%
North, 16%
South, 50%
Central, 4%
West, 1%
North, 96%
South, 2% Surgical
plaster, 0%
Fertilizer/Pott
ery, 82%
Cement/Paint
, 12%
Soil
reclamation,
1%
Unclassified,
3%
Not-
known,
2%
Page 14 of 73

Page 15 of 47
Figure 55 Fly ash consumption picked up pace
since 2000s
Source: Espirito Santo Investment Bank Research, CMA
-
5.0
10.0
15.0
20.0
25.0
30.0
35.0
40.0
1995 1996 1997 1998 1999 2000 2004 2005 2006 2007
Fly Ash Consumed (Mt) Slag Consumed (Mt)
Total Fly Ash + Slag (Mt) Clinker Substitution (Mt)
Figure 56 Cement to clinker ratio is well below
permissible limit of 1.7x
Source: Espirito Santo Investment Bank Research, CMA
1.22
1.23
1.24
1.25
1.26
1.27
1.28
1.29
1.30
1.31
1.32
FY09 FY10 FY11 FY12
Cement/Clinker Ratio (x)
Rail‖s share of cement transportation
has seen a secular decline from 53% in
FY93 to ~35% in FY11, while the base
fare has increased by ~40% in FY08-
FY13
Figure 49 FSA + Linkage on a decline on
absolute and % basis
Figure 50 Cement prices tracking raw material
prices
Figure 51 Average region wise grid power
increased by 16-30%
Source: Espirito Santo Investment Bank Research, Company Data Source: Espirito Santo Investment Bank Research, Company Data Source: Espirito Santo Investment Bank Research, Company Data
Freight cost on the rise – A combination of declining share of cement
transport through rail and the rising base fare is hurting cement players. Rail‖s
share of cement transportation has seen a secular decline from 53% in FY93 to
~35% in FY11, while the base fare has increased by ~40% over FY08-FY13.
Freight cost via road has followed suit, with a ~49% increase over the same
period. Freight cost accounts for 20-25% of total cement cost. Rising freight
costs combined with increasing lead distance are hurting margins across
industry, especially for players like India Cements (ICEM IN, Not Rated) that
are targeting other regions in search of better realizations.
Figure 52 Rail as transport mode remain at sub
40%
Figure 53 Rail base rate has increased by an
average of 40% over FY08-13
Figure 54 Road freight rates have increased by
an average of 49% over FY08-FY13
Source: ESIB Research, CMA, * Excluding ACC & Ambuja Source: Espirito Santo Investment Bank Research, Company Data Source: Espirito Santo Investment Bank Research, Company Data
We expect rail & road freight cost increases to have a similar impact on most
players owing to their limited control over this factor. Further, Indian oil
marketing companies have recently started to raise diesel prices by 1% per
month, putting direct pressure on road freight and indirect pressure on rail
freight. A few players (like Ambuja & Ultratech) have access to low-cost sea
based transportation, but this accounts for only 10-15% of their total volumes.
Like other cost push factors, we expect rising freight costs to be passed
through to customers.
Cost reduction opportunities: Multiple avenues exist
Rising raw material & freight costs have forced cement producers to look for
cost saving opportunities. We explore several possible cost savings
opportunities and the progress being made on these fronts. We think a)
clinker to fly ash substitution, b) usage of alternative fuels & pet-coke, c)
waste heat recovery installations, d) access to captive coal blocks, and e)
water transport modes are a few avenues that could help in cost reduction.
Raw Material – substitution
Blended cement (PPC – Portland Pozzolana Cement & Portland Slag Cement)
currently commands 2/3rd
of total market share in India. We think there are
two opportunities for clinker to fly ash substitution: a) Ordinary Portland
Cement (OPC) being replaced by PPC; and b) higher fly ash content in PPC.
As per Bureau of Indian Standards (BIS) IS:1489, fly ash content in PPC can be
as high as 35%, implying a cement to clinker ratio of 1.7x, as compared with
1.31x for the industry as of FY12 end. We expect the cement to clinker ratio to
inch towards the permissible limit in future as the cost of clinker is ~2.5-2.6x
that of fly ash (for a player like Ambuja). Second, we expect the trend of
substitution from OPC to PPC to continue, leading to increased usage of fly
ash in place of clinker (as OPC requires ~95% clinker vs. ~65% in PPC).
2.0%
2.5%
3.0%
3.5%
4.0%
4.5%
5.0%
-
50
100
150
200
250
300
350
400
450
FY05 FY06 FY07 FY08 FY09 FY10 FY11
Coal India Dispatch (Mt) Cement FSA Receipt (Mt)
Coal to Cement Industry (%)
85
105
125
145
165
185
205
225
May
-04
Oct-
04
Mar-
05
Au
g-0
5
Jan
-06
Ju
n-0
6
No
v-0
6
Ap
r-0
7
Se
p-0
7
Fe
b-0
8
Ju
l-0
8
De
c-0
8
May
-09
Oct-
09
Mar-
10
Au
g-1
0
Jan
-11
Ju
n-1
1
No
v-1
1
Ap
r-12
Se
p-1
2
Fe
b-1
3
India Wholesale Price Grey Cement Index (Base FY05)
India Wholesale Price Lime Index (Base FY05)
India Wholesale Price Coal Index (Base FY05)
3.00
3.50
4.00
4.50
5.00
5.50
6.00
FY08 FY09 FY10P FY11E FY12E
Average Industry Power Tariff (Rs/Kwh)
East West North South Central
30%
35%
40%
45%
50%
55%
% Rail to Total Dispatches
200
400
600
800
1,000
1,200
Ap
r-0
0S
ep
-00
Fe
b-0
1Ju
l-0
1D
ec-0
1M
ay-0
2O
ct-
02
Mar-
03
Au
g-0
3Jan
-04
Ju
n-0
4N
ov-0
4A
pr-
05
Se
p-0
5F
eb
-06
Ju
l-0
6D
ec-0
6M
ay-0
7O
ct-
07
Ma
r-0
8A
ug
-08
Jan
-09
Ju
n-0
9N
ov-0
9A
pr-
10S
ep
-10
Fe
b-1
1Ju
l-11
De
c-1
1M
ay-1
2O
ct-
12M
ar-
13
250 Kms 500 Kms 600 Kms 750 Kms 1000 Kms
Rail Base Rate - Rs/x Kms
-
0.5
1.0
1.5
2.0
2.5
3.0
3.5
Ap
r-0
8
Ju
l-0
8
Oct-
08
Jan
-09
Ap
r-0
9
Ju
l-0
9
Oct-
09
Jan
-10
Ap
r-10
Ju
l-10
Oct-
10
Jan
-11
Ap
r-11
Ju
l-11
Oct-
11
Jan
-12
Ap
r-12
Ju
l-12
Oct-
12
Jan
-13
Ap
r-13
North East West South Central
Road Freight /Km/T
Page 15 of 73

Page 16 of 47
Figure 59 AFR is still in its infancy in India
Source: Espirito Santo Investment Bank Research, Company Data
0.00%
2.00%
4.00%
6.00%
8.00%
10.00%
12.00%
14.00%
16.00%
India Holcim Lafarge
Thermal substitution rate by alternative fuels (%)
Figure 57 Increasing dependence on imported
coal, e-auction and pet-coke
Source: Espirito Santo Investment Bank Research, Company Data
0%
10%
20%
30%
40%
50%
60%
70%
80%
90%
100%
Coal Receipt Against Linkage Open Market Purchase
Imported Coal Lignite & Pet Coke
Figure 58 Pet-coke expected to remain in
surplus
Source: Espirito Santo Investment Bank Research, Company Data
-
10.0
20.0
30.0
40.0
50.0
60.0
70.0
World Pet Coke Producion 2011
Usage of alternative fuels & pet-coke
Pet Coke: The Indian cement sector‖s reliance on imported/e-auction coal has
continued to increase over time, increasing at a 16% CAGR over FY95-2010 to
7MT as of FY10. While most of the plants located in the hinterland continue to
prefer e-auction coal, cement plants located in Gujarat, Rajasthan and South
India have begun to utilize pet coke, imported coal and lignite. While the
usage of lignite has remained limited due to its poor calorific value, the
quantum of imported coal and pet coke has increased over time. Our channel
checks indicate that several cement makers now prefer pet coke over
imported thermal coal to realize cost benefits on per heat realizations. Our
back-of-the-envelope calculation indicates that imported pet coke with high
calorific value is ~25% less expensive than imported thermal coal. We
understand that companies like Shree cement currently have six month fixed
price volume contracts with Reliance Industries (RIL IN, Not rated) and Essar
Oil (ESOIL IN, Not Rated). Although one might expect pet coke prices to
move up with the commissioning of RIL‖s gasification unit by 2016-17, we think
incremental refining capacities in India (planned additional pet coke
generation of 10MT by 2016) and the Midwest will keep global pet coke prices
in check.
AFR - potential cost reduction source: Alternative fuels (AFR), like tyres, waste
industrial oil and household & agricultural wastes are being used aggressively
globally to substitute conventional fuel sources (coal, diesel oil) as cement
producers look to reduce costs. In 2012, AFR accounted for 15% of the total
fuel input used by global cement producer Lafarge cement and the company
says it plans to increase this to 30% by 2015 and 50% by 2020. In contrast,
Indian industry is still in its infancy in terms of AFR usage. For instance, in 2012
Ambuja Cement used 1.4% alternative fuels in kiln, while ACC used 1%. We
expect Indian cement makers to aggressively invest in the usage of alternative
fuels to mitigate production cost increases due to higher coal costs.
The widespread usage of waste fuels has not yet caught on in India, primarily
on account of a lack of organized collection systems. Municipal and
agricultural wastes appear to have the most significant usage potential. Given
the shortages foreseen in conventional fuel, the availability of facilitating
combustion technologies and the presence of international majors with past
experience in waste fuel usage, we think future utilisation will increase. With
pioneering attempts already afoot, we expect leading players to substitute ~4-
5% of their thermal inputs with AFR in the near future.
Figure 60 AFR accounts for 8% of total fuel
input at Ambuja's Lakheri plant - FY11
Figure 61 AFR fuel substituion is as
high as 83% - FY11
Figure 62 Lafarge targets to increase AFR to 50% by
2020
Source: Espirito Santo Investment Bank Research, Company Data Source: Espirito Santo Investment Bank Research, Company Data Source: Espirito Santo Investment Bank Research, Company Data
Waste heat recovery: An untapped cheap energy source
The cement manufacturing process releases 30-40% of total heat input in the
form of waste heat from exit gases. These can be tapped to create a feedback
loop in order to achieve better fuel efficiency. The entire industry currently has
co-generation potential of around 400MW. Although the capital cost of co-
generation, which works on waste heat gas, is around Rs100-120mn per MW, it
scores on the operational front as the per unit power generation cost is only
Rs0.30-0.40 vs. Rs3-4/Kwh for a coal based power plant. We expect more
ACC Lakheri Cement
Works
Quantity
(T)
Energy
(Kwh or
Ton/Kl of
fuel)
Waste Fuel
as % of Total
Energy
Soya bean Waste 3 2 0.0
Saw dust 174 88 0.7
Mustard Husk 721 412 3.5
Scrap tyre cutting 207 368 3.1
Animal Waste 21 9 0.1
Nevia Waste products 71 46 0.4
ETP bio solid sludge 41 13 0.1
White Coal 28 19 0.2
MSW 0 0 -
Total AFR 1,267 957 8.0
Plant Location Substitution (%)
Austria 46%
Germany 42%
France 34%
Netherland 83%
Switzerland 48%
Norway 45%
Substitution of Fossil Fuels by
Waste Derived Fuels
0.00%
10.00%
20.00%
30.00%
40.00%
50.00%
60.00%
1990 2010 2011 2012
Coal Coke Oil Gas Alternative Fuels
Page 16 of 73

Page 17 of 47
Figure 65 East provides similar opportunity as
West
Source: Espirito Santo Investment Bank Research, Company Data
Figure 66 Ambuja - Realization has kept pace
with cost increase
Source: Espirito Santo Investment Bank Research for estimates, Company Data
3,000
3,200
3,400
3,600
3,800
4,000
4,200
4,400
4,600
4,800
CY8 CY9 CY10 CY11 CY12 CY13E CY14E
Realization (Rs/T)
Realization (Rs/T)
Figure 67 EBITDA/T largely flat - expect gains
from cost saving initiatives
Source: Espirito Santo Investment Bank Research for estimates, Company
Data
-
200
400
600
800
1,000
1,200
CY8 CY9 CY10 CY11 CY12 CY13E CY14E
EBITDA (Rs/T)
EBITDA (Rs/T)
Though the capital cost of co-
generation system, which works on
waste heat gas, is around Rs100-120mn
per MW, it scores on the operational
front as per unit power generation cost
is only Rs0.30-0.40 vs. Rs3-4/Kwh for
a coal based power plant.
players to adopt a waste recovery mechanism to boost fuel efficiency and
lower the power cost per tonne of cement production.
Captive coal blocks – the cheapest source of coal
Cement producers were allocated captive coal blocks as early as FY08;
however none of the coal blocks are currently operational. Coal blocks given
to Grasim, ACC & Ambuja Cements have been de-allocated due to
unsatisfactory progress. These players have challenged the de-allocation in
court and encashment of associated bank guarantees have been suspended.
We expect increasing participation of cement producers in future coal block
auctions as access to captive coal should provide a stable input source at the
lowest possible price.
Figure 63 None of the capitve coal blocks is operational
Figure 64 Only Ultratech & Ambuja are using sea
routes
Source: Espirito Santo Investment Bank Research, Company Data Source: Espirito Santo Investment Bank Research, Company Data
Sea/Inland water transport - limited usage of the cheapest transport mode
Sea is the cheapest mode of transport available, but only Ultratech & Ambuja
are currently taking advantage of this. Ambuja is able to target the coastal
markets of Surat, Mumbai, Mangalore and Cochin from its Junagarh-based
facility, with lead distances as high as ~760 nautical miles compared to an
average lead distance of ~600kms by rail. The eastern coast provides a similar
opportunity to south-based players to the target coastal Odisha & West
Bengal market. We expect cement players to increase their focus on sea and
inland waterways as rising rail & road freight costs force them to explore
cheaper alternatives. Our industry channel checks indicate that the cost of
transport via sea is half that of rail.
More often than not, cost is passed through
We expect cost inflation to be the order of the day. Raw material prices (fly
ash/gypsum/limestone), power/coal costs (grid/auction/linkage) and freight
rates (rail/road) are all expected by us to move up. Further, with 1.) Indian oil
marketing companies widely expected to increase diesel prices more
frequently (i.e. INR0.40-50/litre on a monthly basis (ex-VAT) and sale of bulk
diesel at market rates) as a result of the depreciating rupee & increasing under
recoveries and 2.) an expected increase in Coal India‖s linkage coal pricing as
it eventually resorts to price pooling, pushing the average price up, we think
cost inflation is here to stay. Interestingly, analysing historical cement
prices/cost pressures, we infer that cement companies have been successful
in passing on cost increases in the past, excluding periods in which demand
growth has been weak (as seen in FY11, Figure 15). We believe Indian cement
makers have been pro-active, enabling them to realize some gains on the back
of several cost saving initiatives (raw material substitution, blending, alternate
fuels, waste heat recovery, etc.) As cost inflation persists, we think Indian
cement makers will enjoy at least stable margins as demand picks up. Besides,
a continued focus on cost optimization should result in gradual margin
expansion.
Cement supply discipline – is it a cartel?
The Competition Commission of India (CCI) has alleged that 11 players, along
with the Cement Manufacturers Association (CMA), were operating a cartel to
limit supply & artificially inflate prices over FY10-11. The parameters used by
Company Allotment Reserves Block Coalfield State Status
Prism Cement Limited 29-May-07 30 Sial Ghoghri Wardha Madhya Pradesh Non-Operational
Jaiprakash Associates 17-Sep-07 195 Mandla North Pench Kannan Madhya Pradesh
Birla Corporation 12-Aug-08 21 Bikram Sohagpur Madhya Pradesh
Kesoram Industries 21-Nov-08 45 Gondkhari Kamptee Maharashtra
Revati Cement 21-Nov-08 14 Thesgora-B/ Rudrapuri Pench Kannan Madhya Pradesh
Century Textiles & Industries 29-May-09 47 Bander Bander Maharashtra
J.K.Cement 29-May-09 47 Bander Bander Maharashtra
Dalmia Cement (Bharat) 29-May-09 31 Khappa & Extn. Kamptee Maharashtra
Gujarat Ambuja 17-Jun-09 36 Dahegaon/Makardhokra IV Umerer Maharashtra Non-Operational
Lafarge India 17-Jun-09 25 Dahegaon/Makardhokra IV Umerer Maharashtra Non-Operational
Rashmi Cement 3-Jul-09 233 Andal East Raniganj West Bengal
ACC 6-Oct-09 Moira-Madhujore Raniganj West Bengal
Grasim 21-Nov-08 Bhaskarpara Jhilimili Chhattisgarh Non-Operational
0%
10%
20%
30%
40%
50%
60%
70%
80%
90%
100%
Rail Road Sea
Page 17 of 73

Page 18 of 47
Figure 69 According to CMA, taxes and levies
constitute 60% or more of the ex-factory price
Source: Espirito Santo Investment Bank Research, Company Data
Item
Rs/Tonne of
Cement
Average Excise Duty 490
VAT 500 Royalty and Cess on
Limestone 84
Royalty on Coal 33
Electricity Duty 23
Others including Clean
Energy Cess on Fuel 30
Total 1,160
Empirical analysis of retail gasoline
markets in Midwestern United States
suggests regional market leaders use
price signalling to maintain pricing
discipline.
Owing to the homogenous nature of
product, competitors quickly follow
pricing decisions of the market leader
with a large majority of stations
jumping to the exact same price within
a 24-hour period.
the CCI to ascertain the existence of a cartel are as follows: a) the existence of
price parallelism among these parties; b) price increases after CMA meetings;
c) low levels of capacity utilization & reduced production; d) existence of
dispatch parallelism; and e) super normal profits earned by these players. The
CCI imposed a penalty of 0.5x net profit for FY10 (from 20th
Feb 2009) and
FY11 of these players, amounting to Rs63.2bn. The criteria used to ascertain
the quantum of penalty was the higher of: a) 3 times profit; or b) 10% of
revenue over the period of the cartel‖s existence. In this case, 3x profits was
higher than 10% of revenues during the period mentioned above, but the CCI
limited the penalty to 0.5x profits.
Figure 68 CCI's arguments vs. Cement companies' counter-arguments
Source: Espirito Santo Investment Bank Research, Company Data, CCI
The CCI cited high prices, production & dispatch parallelism, lower utilization
and high EBITDA margins in their arguments vs. the cement companies. It is
interesting to note that for a country that produced 252mt (including mini
plants) of cement in FY13, the system inventory remains at a meagre 1-2mt
(Figure 71). System inventory remains low because cement is a low-
value/high-volume product with high storage cost as a percentage of total
value. Cement players frequently adjust production volumes based on market
demand, which (combined with low inventory levels) may give the illusion of
production & dispatch parallelism.
On the pricing front, though the CCI accepts that there is no single market
leader, it mentions that all regions are dominated by one or two players who
use price signalling to control prices. Price signalling is used in other industries
too, generally by a market leader, as a tactical business tool. For example, an
empirical study on retail gasoline markets in the Midwestern United States
published by Ohio State University found that regional market leaders use
price signalling to maintain pricing discipline. Owing to the homogenous
nature of the product, competitors quickly follow pricing decisions of the
market leader with a large majority of stations jumping to the exact same
price within a 24 hour period, but this doesn‖t necessarily imply any collusive
behaviour in the retail gasoline industry.
On the super normal profits argument, high operating margins is not a tool to
ascertain returns in our view. In addition, we think the lack of any specification
about what defines super normal profits further weakens the CCI‖s argument.
The CCI has also argued that retail cement prices in India are among the
highest in the world. However, this does not seem to be the case (see Figure
70) and according to the CMA, high cement prices in India can be attributed
to high taxes, which account for ~60% of the ex-factory price.
Finally, the CCI has not been able to prove the existence of any agreement
(Appendix 6: as per definition of cartel) between these parties to limit supply.
Considering the number of players – 49 large players along with numerous
mini plants – we think it would be a herculean task to co-ordinate price,
production and supply on a weekly basis.
Parameter CCI's arguments Accused's counter-arguments
Price parallelism
# Cement prices move in same direction of these parties in different zones
# Cement prices same across parties, despite different cost structure
# Co-ordinated behavior to control prices
# Price parallelism is expected in an industry like cement with commoditized product
# As per DG, there are 49 companies operating more than 173 large plants. It is
impossible to coordinate prices across such large number of parties
Price increase after CMA
meetings # Cement prices increased after CMA meetings
# Cement prices also decreased after few meetings. CCI considered only those
meetings after which prices increased
Low capacity utilization
& reduced production
# Capacity utilization of cement companies down to 73% during FY11 from
83% in FY10
# Production growth not commensurate with capacity addition
# Lower utilization due to scarcity of key raw materials, erratic power supply,
breakdown of machinery or stoppage of plants for up gradation, high inventory of
clinker, logistic constraints, demand growth and labor disturbance
# Lower utilization due to time required for stabilization of new plants
# Indian capacity utilization in line with global capacity utilization at 82%
Dispatch parallelism
# Demand is inelastic, whatever is produced will be consumed
# Lower dispatch to control supply
# Dispatch parallelism due owing to cyclical nature of cement industry and ability of
companies to intelligently respond to actions of competitors
Super normal profits
# Companies trying to maximize EBITDA margins
# High operating profit margins in the range of 20-48% implies super normal
profit
# EBITDA margin is not a metric to calculate returns. Should use RoIC/RoE, IRR
# There is no benchmark against which 20-48% operating margin can be considered
super normal
# Quarterly results ending 31st March 2010 indicate many companies reporting net
losses
Page 18 of 73

Page 19 of 47
Figure 70 Indian cement prices near global median
Figure 71 System inventory remains in the 1-2
million tonne range
Figure 72 CCI levied a fine of Rs63.2bn
on these players
Source: Espirito Santo Investment Bank Research, Cemnet, Year 2011 Source: Espirito Santo Investment Bank Research, CMA Source: Espirito Santo Investment Bank Research, Planning
commission
Despite the CMA‖s counter-arguments, the CCI & members of the Builders
Association of India maintain their view that there is a cement cartel (CCI June
2012 Verdict). As per the builders‖ association, supply control helps cement
producers maintain high cement prices and earn super normal profits. The
builder‖s association has also provided anecdotal evidence of artificial
shortages created by cement producers, but CCI hasn't been able to prove the
existence of an agreement amongst cement producers. Furthermore, the
existence of a large number of producers (49 large), falling industry EBITDA
margins (from 29% in FY08 to 17% in FY11) and RoCE (from 37% in FY08 to
12% in FY11) suggests otherwise to us. Both sides are unwilling to concede
defeat and they are awaiting COMPAT's final ruling. Cement producers haven‖t
provisioned for the fine imposed by the CCI. In the worst case scenario, we
estimate this could have a per share impact of Rs.8/Share for Ambuja,
Rs.61/Share for ACC, Rs.43/Share for Ultratech and Rs.10/Share for Shree
Cements.
-
20
40
60
80
100
120
140
160
180
US
A
Bo
livia
Me
xic
oC
hile
Bra
zil
Fra
nce
Gre
at
Bri
tain
Ge
rman
yR
ussia
Ita
lyS
pain
Po
lan
dT
urk
ey
Iraq
Sau
di
Ara
bia
Eg
yp
tIr
an
UA
E
Ind
on
esia
Jap
an
Ma
laysia
Ind
iaP
hil
ipin
es
Pa
kis
tan
Taiw
an
Th
ailan
dS
ou
th K
ore
aV
ietn
am
Ch
ina
NA Latin
America
Europe MENA Asia
Spot Price, 2011 ($/t)
0.7
0.9
1.1
1.3
1.5
1.7
1.9
Ma
y-0
3
Oct-
03
Ma
r-0
4
Au
g-0
4
Jan
-05
Ju
n-0
5
No
v-0
5
Ap
r-0
6
Se
p-0
6
Fe
b-0
7
Ju
l-0
7
De
c-0
7
Ma
y-0
8
Oct-
08
Ma
r-0
9
Au
g-0
9
Jan
-10
Ju
n-1
0
No
v-1
0
Ap
r-11
Se
p-1
1
Fe
b-1
2
India CMA Cement Closing Stock (Million Tonnes)
Company Total (Rs Bn)
ACC Ltd 11.5
Ambuja Cements Ltd 11.6
Binani Cements Ltd 1.7
Century Textiles Ltd 2.7
India Cements Ltd 1.9
JK Cements Ltd 1.3
Lafarge India Pvt. Ltd 4.9
Madras Cements Ltd 2.6
Ultratech Cement Ltd 11.8
Jaiprakash Associates Ltd 13.2
Total 63.2
Page 19 of 73
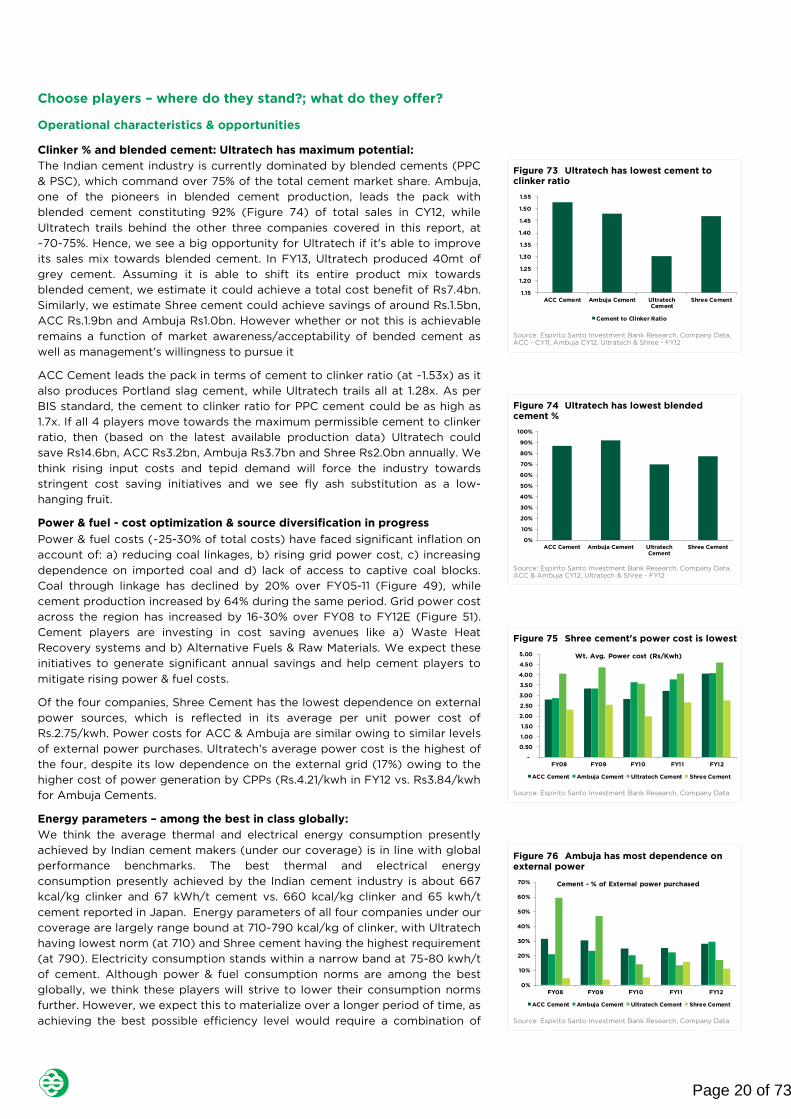
Page 20 of 47
Figure 73 Ultratech has lowest cement to
clinker ratio
Source: Espirito Santo Investment Bank Research, Company Data, ACC - CY11, Ambuja CY12, Ultratech & Shree - FY12
1.15
1.20
1.25
1.30
1.35
1.40
1.45
1.50
1.55
ACC Cement Ambuja Cement UltratechCement
Shree Cement
Cement to Clinker Ratio
Figure 74 Ultratech has lowest blended
cement %
Source: Espirito Santo Investment Bank Research, Company Data, ACC & Ambuja CY12, Ultratech & Shree - FY12
0%
10%
20%
30%
40%
50%
60%
70%
80%
90%
100%
ACC Cement Ambuja Cement Ultratech
Cement
Shree Cement
Figure 75 Shree cement's power cost is lowest
Source: Espirito Santo Investment Bank Research, Company Data
-
0.50
1.00
1.50
2.00
2.50
3.00
3.50
4.00
4.50
5.00
FY08 FY09 FY10 FY11 FY12
Wt. Avg. Power cost (Rs/Kwh)
ACC Cement Ambuja Cement Ultratech Cement Shree Cement
Figure 76 Ambuja has most dependence on
external power
Source: Espirito Santo Investment Bank Research, Company Data
0%
10%
20%
30%
40%
50%
60%
70%
FY08 FY09 FY10 FY11 FY12
Cement - % of External power purchased
ACC Cement Ambuja Cement Ultratech Cement Shree Cement
Choose players – where do they stand?; what do they offer?
Operational characteristics & opportunities
Clinker % and blended cement: Ultratech has maximum potential:
The Indian cement industry is currently dominated by blended cements (PPC
& PSC), which command over 75% of the total cement market share. Ambuja,
one of the pioneers in blended cement production, leads the pack with
blended cement constituting 92% (Figure 74) of total sales in CY12, while
Ultratech trails behind the other three companies covered in this report, at
~70-75%. Hence, we see a big opportunity for Ultratech if it's able to improve
its sales mix towards blended cement. In FY13, Ultratech produced 40mt of
grey cement. Assuming it is able to shift its entire product mix towards
blended cement, we estimate it could achieve a total cost benefit of Rs7.4bn.
Similarly, we estimate Shree cement could achieve savings of around Rs.1.5bn,
ACC Rs.1.9bn and Ambuja Rs1.0bn. However whether or not this is achievable
remains a function of market awareness/acceptability of bended cement as
well as management‖s willingness to pursue it
ACC Cement leads the pack in terms of cement to clinker ratio (at ~1.53x) as it
also produces Portland slag cement, while Ultratech trails all at 1.28x. As per
BIS standard, the cement to clinker ratio for PPC cement could be as high as
1.7x. If all 4 players move towards the maximum permissible cement to clinker
ratio, then (based on the latest available production data) Ultratech could
save Rs14.6bn, ACC Rs3.2bn, Ambuja Rs3.7bn and Shree Rs2.0bn annually. We
think rising input costs and tepid demand will force the industry towards
stringent cost saving initiatives and we see fly ash substitution as a low-
hanging fruit.
Power & fuel - cost optimization & source diversification in progress
Power & fuel costs (~25-30% of total costs) have faced significant inflation on
account of: a) reducing coal linkages, b) rising grid power cost, c) increasing
dependence on imported coal and d) lack of access to captive coal blocks.
Coal through linkage has declined by 20% over FY05-11 (Figure 49), while
cement production increased by 64% during the same period. Grid power cost
across the region has increased by 16-30% over FY08 to FY12E (Figure 51).
Cement players are investing in cost saving avenues like a) Waste Heat
Recovery systems and b) Alternative Fuels & Raw Materials. We expect these
initiatives to generate significant annual savings and help cement players to
mitigate rising power & fuel costs.
Of the four companies, Shree Cement has the lowest dependence on external
power sources, which is reflected in its average per unit power cost of
Rs.2.75/kwh. Power costs for ACC & Ambuja are similar owing to similar levels
of external power purchases. Ultratech‖s average power cost is the highest of
the four, despite its low dependence on the external grid (17%) owing to the
higher cost of power generation by CPPs (Rs.4.21/kwh in FY12 vs. Rs3.84/kwh
for Ambuja Cements.
Energy parameters – among the best in class globally:
We think the average thermal and electrical energy consumption presently
achieved by Indian cement makers (under our coverage) is in line with global
performance benchmarks. The best thermal and electrical energy
consumption presently achieved by the Indian cement industry is about 667
kcal/kg clinker and 67 kWh/t cement vs. 660 kcal/kg clinker and 65 kwh/t
cement reported in Japan. Energy parameters of all four companies under our
coverage are largely range bound at 710-790 kcal/kg of clinker, with Ultratech
having lowest norm (at 710) and Shree cement having the highest requirement
(at 790). Electricity consumption stands within a narrow band at 75-80 kwh/t
of cement. Although power & fuel consumption norms are among the best
globally, we think these players will strive to lower their consumption norms
further. However, we expect this to materialize over a longer period of time, as
achieving the best possible efficiency level would require a combination of
Page 20 of 73

Page 21 of 47
Ultratech has launched a major
initiative on WHR and has identified
multiple plants (in AP, MH, CTG, Raj &
UAE) with generation potential of
90MW (or ~9mt cement, at 90%
utilization).
ACC, one of the pioneers of AFR in
India, is planning to substitute 5% of
coal input in kiln by AFR, from current
levels of 1%.
Though cement players talk about
ample supply of limestone in India, the
cost for a non-integrated producer can
be as high as 3-4x that of integrated
ones.
input mix optimization, change in existing machinery configuration & capex on
new machinery.
Figure 77 Consumption norms - range bound
Figure 78 Shree's cost higher due to pet coke
usage
Figure 79 Shree has no coal linkages
Source: Espirito Santo Investment Bank Research, Company Data Source: Espirito Santo Investment Bank Research, Company Data Source: Espirito Santo Investment Bank Research, Company Data
Waste Heat Recovery (WHR) & AFR – near-term optimization targets
WHR – In the near term, we think all four players will focus on WHR &
alternative fuels to cut costs. The per unit cost for WHR is in the range of
~Rs0.4/Kwh vs. grid power at Rs5-6/Kwh. Ultratech has launched a major
initiative on WHR and has identified multiple plants (in AP, MH, CTG, Raj &
UAE) with generation potential of 90MW (or ~9mt cement, at 90% utilization).
The company says it aims to substitute 10-12% of its total power requirement
with WHR. Currently ~50MW of WHR projects at multiple plants in the states
of Rajasthan, Maharashtra, Karnataka and Chhattisgarh are under
implementation. We think, these plants combined can save around Rs~2bn
annually, once operational. Ambuja has launched WHR initiatives in Rajasthan
& Maharashtra with total capex of Rs1.65bn (~12-15MW), which the company
plans to commission over 2012-14. We estimate this to provide annual cost
benefit of Rs500mn. ACC has a 7MW WHR plant under implementation in the
state of Himachal Pradesh which once operational is expected to generate ~45
million units of power per year translating into annual cost savings of
~Rs250m. Shree cement operates one of the largest WHR systems with 46MW
capacity, which in FY12 helped it save 0.36mt of fuel.
AFR - Alternative Fuels & Raw Materials - Although it is still in its infancy in
India, we expect AFR to become one of the major cost saving avenues in the
near future. As per ACC, currently only 0.6% of its total fossil fuel input in its
kilns is substituted by AFR. ACC, one of the pioneers of AFR in India, is
planning to substitute 5% of coal input in kilns with AFR, up from the current
level of 1%. We think the incremental 4% substitution translates into Rs600m
in annual savings. In 2011, ACC re-launched its Waste Management services
under the brand name of “Geocycle”, encompassing all activities concerning
the utilization of Alternative Fuels and Raw Materials (AFR) in cement plants
across the country. This is the Holcim group‖s umbrella brand for extending
co-processing solutions for the management of wastes using cement kilns.
Ambuja is also part of Holcim's "Geocycle" initiative (See Appendix 12); in
2012, it co-processed more than 0.1mt of waste (of which 50% was biomass)
as alternative fuels in its cement kilns. Ultratech has also undertaken numerous
initiatives for cost savings through AFR. In FY13, it used 130kt of alternative
fuel, of which 70kt was biomass, which helped Ultratech to reduce its coal
intake by 75kt. We think there is immense cost saving potential through the
usage of AFR. For instance, global cement producer Lafarge cement – which
in 2012 used 15% of total fuel input as AFR – says it plans to increase it to 30%
by 2015 and 50% by 2020.
Raw material cost - limestone cost at minimum levels; gypsum cost savings a
possibility: Owing to access to captive limestone mines, the cost per tonne for
most producers remains below Rs150. Although cement players say there is
ample supply of limestone in India, the cost for a non-integrated producer can
be as high as 3-4x that of an integrated producer. Ambuja purchased ~4% of
its total limestone requirement in CY12 at ~Rs440/t. Since limestone forms the
bulk of cement inputs, lack of access to a captive source can dent profitability. For
instance, limestone cost for Ultratech (an integrated player) increased by 48%
72.00
74.00
76.00
78.00
80.00
82.00
84.00
86.00
660
680
700
720
740
760
780
800
820
ACC Cement AmbujaCement
UltratechCement
Shree Cement
Coal (Kcal/kg of Clinker) Electricity (Kwh/T of Cement) - RHS
-
1,000
2,000
3,000
4,000
5,000
6,000
7,000
8,000
FY08 FY09 FY10 FY11 FY12
Coal/Pet coke Cost (Rs/T)
ACC Cement Ambuja Cement Ultratech Cement Shree Cement
0
0.5
1
1.5
2
2.5
3
3.5
ACC Cement Ambuja Cement UltratechCement
Shree Cement
Coal linkages (mt) Coal receipt (mt)
Page 21 of 73

Page 22 of 47
Figure 80 Ambuja & Ultratech have access to
sea route
Source: Espirito Santo Investment Bank Research, Company Data
0%
10%
20%
30%
40%
50%
60%
70%
80%
90%
100%
ACC Cement Ambuja Cement UltratechCement
Shree Cement
Rail Road Sea
Freight cost, which accounts for 20-
25% of total cement cost, has seen
steep rise over past 5 years.
Railway base fare has increased by
~40% in FY08-FY13 while road rates
have increased by ~49% during the
same period. Deregulation of diesel
rates will further put pressure on these
rates.
over FY07-11, which implies a Rs39/t increase in cost of PPC. For a non-integrated
producer, the same % increase would have increased limestone cost by ~Rs120/t.
Cement producers are focusing on raw material cost reduction through synthetic
gypsum. Gypsum accounts for 5% of cement by weight and costs Rs1,200-
2,000/t. In India, substantial sources of mineral gypsum are currently available
only in Rajasthan, where the mineral‖s supply and mining is monopolized by
government organizations. Even these reserves have been producing lower
quantities in recent years, leading to a highly competitive scenario in gypsum
procurement. Players like Ambuja and Shree Cement are working on synthetic
gypsum projects to cut down on gypsum costs.
Freight cost - focus on railways & sea
Freight cost, which accounts for 20-25% of total cement cost, has increased
significantly over the past 5 years. The railway base fare has increased by
~40% in FY08-FY13 while road rates have increased by ~49% during the same
period. Deregulation of diesel rates should put further pressure on these rates.
On a per tonne/kilometer basis, rail freight rates are ~36% lower than road
freight rates, thereby making cement producers focus on rail linkages. Rail
carries ~35% of total cement production, while road carries most of the rest.
Sea accounts for a very small share of total cement transportation. Ambuja is
undertaking various rail linkages & loading projects to increase rail share and
at the same time investing in sea transport modes to target the coastal part of
southern region. Ultratech is also investing in sea transport. Since the cost of
transportation through the rail route is 2/3rd that of road and sea is half as
expensive as rail, cement players can achieve significant cost savings by
increasing their use of the sea mode. For a lead distance of 500kms, road will
cost Rs1,160/t and rail Rs735/t, while the sea mode would cost Rs368/t.
Cost mitigation: potential benefits – While we expect cost inflationary
pressures to persist, we also believe this should be offset by price increases on
the back of improving demand, leading to stable margins. We highlight below
the impact of key cost heads on the companies under our coverage. We
expect diesel price hikes to have the greatest impact on Ultratech & Ambuja
(assuming road freight hike as proxy), while higher rail fares should hit ACC
the most (45% freight share). On the other hand, a decline in pet coke prices is
most advantageous to Shree, though a depreciating rupee tends to offset the
cost gains. Please see the figure below for detailed cost impact analysis.
We also highlight some of the potential cost saving measures that we think
these companies could undertake over time. While the management teams of
these companies have refrained from divulging exact cost optimization
targets, we see no reason to believe that this shouldn‖t be a key theme for
them in the forthcoming years. As Ultratech has the lowest blend ratio of the
four companies (at 1.3x), it stands to benefit most from an increase in the
blending ratio. We think a shift from the current 1.3x to the permissible limit of
1.7x could lead to Rs359/t of cost savings. Ambuja‖s blended cement mix of
92% is the highest of the four and thus it has limited potential on this front.
WHR is another potential cost saving avenue. Ultratech‖s 90MW projects can
help it save Rs49/t. On the AFR front, ACC has taken the lead and we expect
its recent plan to substitute 5% of coal for kiln substitution to provide a benefit
of Rs25/t. Cement producers have long realized that cost leadership is the
best way to build a competitive advantage and are exploring various avenues.
We think AFR is still in its infancy in India and can provide a substantial cost
benefit in the future.
Page 22 of 73

Page 23 of 47
HHI index, based on production (In
FY13) across regions is in the range of
7%-17%, with lowest in South & highest
in West and Central regions. HHI index
for East, North & South indicates no
concentration, while that of West &
Central region indicates moderate
concentration.
We estimate Eastern region to witness
maximum capacity addition over FY14-
16 at 19mt, i.e. 40% total incremental
capacity in India.
Figure 81 Cost Impact - more sensitive to power & freight costs than to RM
Source: Espirito Santo Investment Bank Research for estimates, Company Data
Figure 82 Ultratech has maximium cost saving potential
Source: Espirito Santo Investment Bank Research for estimates, Company Data
Figure 83 Operational Characteristics: Ultratech looks best positioned to maintain its market leadership
Source: Espirito Santo Investment Bank Research, Company Data for estimates, Full green = 4 is best while Full white = 0 is worst, (Best & Worst is relative for these 4 companies)
Regional capacity and market share trends, P/V tradeoffs
Capacity & production market share trends (over FY04-FY13), along with the
growing number of players across regions, indicate to us that the cement
industry is competitive. The HHI index, based on production (In FY13) across
regions is in the range of 7%-17%, with lowest in the South & highest in the
West and Central regions. The HHI index for the East, North & South indicates
no concentration, while that of the West & Central regions indicates moderate
concentration. The South remains the most competitive market with as many
as 38 players; while the Central region has the lowest number of players, at 9.
Our estimates & detailed analysis of region wise capacity addition and
utilization is described below.
East: Capacity chasing realization (to see maximum addition FY14-16E) – We
expect the Eastern region to see the largest capacity additions over FY14E-
16E, at 19mt, i.e. 40% total incremental capacity in India. We expect Ultratech
to consolidate its market share with addition of ~4mt in FY14, which will
increase its capacity share to 20%. We see Ultratech‖s capacity addition in the
East as a welcome move as it is already operating at ~100% capacity
utilization. Market leadership in the supply deficit market bodes well for
Ultratech, which will help it achieve higher realization gains. Owing to no
Cost Impact (Rs/T of Cement) Ultratech ACC Ambuja Shree
Freight
5% Shift in Road to Rail 22 21 24 14
5% Increase in Road Freight 34 29 34 30
5% Increase in Rail Freight 15 18 7 5
5% Increase in Avg. Lead Distance 49 47 42 35
Power
5% Increase in External Power Purchase 9 4 5 9
5% Increase in Own Power Cost 17 18 16 10
5% Increase in Kiln Coal Cost 31 30 29 27
Raw Material
5% Increase in Fly Ash Cost 4 10 6 8
5% Increase in Gypsum Cost 3 6 5 4
5% Increase in Limestone Cost 7 2 4 7
Cost savings opportunities (Rs/T) Ultratech ACC Ambuja Shree Comments
Savings from increase in proportion of blended cement 181 78 48 136 Ambuja has highest PPC/Total Ratio
Savings from increase in blending ratio 359 133 175 184 Ultratech has lowest blending ratio of 1.28x
Savings from WHR implementations 49 10 23 - Ultratech undertaking 90MW of WHR
Savings from AFR coal replacement 6 25 6 5 ACC to replace 5% of coal input by WHR
Comparison Table Ultratech Cement ACC Cement Ambuja Cement Shree Cement
Operational Characteristics
Clinker Substitution Potential 4 1 2 3
Wt. Avg. Power Cost 2 3 3 4
External Power Purchased (%) 3 2 1 4
Clinker Energy Consumption Norm 4 3 3 2
Cement Electricity Consumption Norm 3 2 3 4
WHR Initiatives 4 2 2 3
AFR Initiatives 3 4 3 1
Transport Mix 4 3 2 1
Average Lead Distance 3 3 3 4
Page 23 of 73
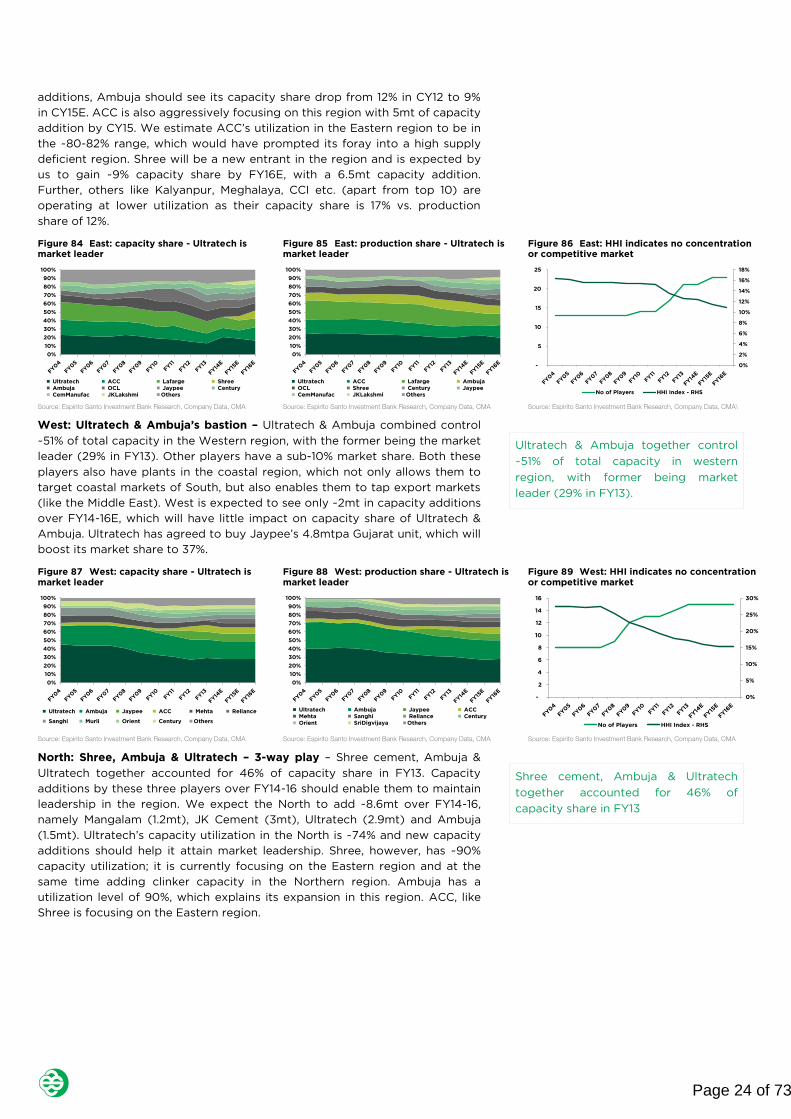
Page 24 of 47
Ultratech & Ambuja together control
~51% of total capacity in western
region, with former being market
leader (29% in FY13).
Shree cement, Ambuja & Ultratech
together accounted for 46% of
capacity share in FY13
additions, Ambuja should see its capacity share drop from 12% in CY12 to 9%
in CY15E. ACC is also aggressively focusing on this region with 5mt of capacity
addition by CY15. We estimate ACC‖s utilization in the Eastern region to be in
the ~80-82% range, which would have prompted its foray into a high supply
deficient region. Shree will be a new entrant in the region and is expected by
us to gain ~9% capacity share by FY16E, with a 6.5mt capacity addition.
Further, others like Kalyanpur, Meghalaya, CCI etc. (apart from top 10) are
operating at lower utilization as their capacity share is 17% vs. production
share of 12%.
Figure 84 East: capacity share - Ultratech is
market leader
Figure 85 East: production share - Ultratech is
market leader
Figure 86 East: HHI indicates no concentration
or competitive market
Source: Espirito Santo Investment Bank Research, Company Data, CMA Source: Espirito Santo Investment Bank Research, Company Data, CMA Source: Espirito Santo Investment Bank Research, Company Data, CMA\
West: Ultratech & Ambuja‖s bastion – Ultratech & Ambuja combined control
~51% of total capacity in the Western region, with the former being the market
leader (29% in FY13). Other players have a sub-10% market share. Both these
players also have plants in the coastal region, which not only allows them to
target coastal markets of South, but also enables them to tap export markets
(like the Middle East). West is expected to see only ~2mt in capacity additions
over FY14-16E, which will have little impact on capacity share of Ultratech &
Ambuja. Ultratech has agreed to buy Jaypee‖s 4.8mtpa Gujarat unit, which will
boost its market share to 37%.
Figure 87 West: capacity share - Ultratech is
market leader
Figure 88 West: production share - Ultratech is
market leader
Figure 89 West: HHI indicates no concentration
or competitive market
Source: Espirito Santo Investment Bank Research, Company Data, CMA Source: Espirito Santo Investment Bank Research, Company Data, CMA Source: Espirito Santo Investment Bank Research, Company Data, CMA
North: Shree, Ambuja & Ultratech – 3-way play – Shree cement, Ambuja &
Ultratech together accounted for 46% of capacity share in FY13. Capacity
additions by these three players over FY14-16 should enable them to maintain
leadership in the region. We expect the North to add ~8.6mt over FY14-16,
namely Mangalam (1.2mt), JK Cement (3mt), Ultratech (2.9mt) and Ambuja
(1.5mt). Ultratech‖s capacity utilization in the North is ~74% and new capacity
additions should help it attain market leadership. Shree, however, has ~90%
capacity utilization; it is currently focusing on the Eastern region and at the
same time adding clinker capacity in the Northern region. Ambuja has a
utilization level of 90%, which explains its expansion in this region. ACC, like
Shree is focusing on the Eastern region.
0%
10%
20%
30%
40%
50%
60%
70%
80%
90%
100%
Ultratech ACC Lafarge Shree
Ambuja OCL Jaypee Century
CemManufac JKLakshmi Others
0%
10%
20%
30%
40%
50%
60%
70%
80%
90%
100%
Ultratech ACC Lafarge Ambuja
OCL Shree Century Jaypee
CemManufac JKLakshmi Others
0%
2%
4%
6%
8%
10%
12%
14%
16%
18%
-
5
10
15
20
25
No of Players HHI Index - RHS
0%
10%
20%
30%
40%
50%
60%
70%
80%
90%
100%
Ultratech Ambuja Jaypee ACC Mehta Reliance
Sanghi Murli Orient Century Others
0%
10%
20%
30%
40%
50%
60%
70%
80%
90%
100%
Ultratech Ambuja Jaypee ACC
Mehta Sanghi Reliance Century
Orient SriDigvijaya Others
0%
5%
10%
15%
20%
25%
30%
-
2
4
6
8
10
12
14
16
No of Players HHI Index - RHS
Page 24 of 73

Page 25 of 47
Southern region is most fragmented
market, wherein others (apart from top
10 players) command an impressive
39% of total market share.
Jaypee is clear market leader in central
region (with 30% capacity share in
FY13), while next two have half the
capacity.
All these players are worse off in a
declining price and utilization
environment and with decline being
more sensitive to price than volume;
we believe none of them would ideally
like to play market share game at the
cost of price decline.
Figure 90 North: capacity share - Shree cement
is market leader
Figure 91 North: production share - Shree
cement is market leader
Figure 92 North: HHI indicates no concentration
or competitive market
Source: Espirito Santo Investment Bank Research, Company Data, CMA Source: Espirito Santo Investment Bank Research, Company Data, CMA Source: Espirito Santo Investment Bank Research, Company Data, CMA
South: Most fragmented market – The Southern region is the most
fragmented market, wherein others (aside from the top-10 players) command
an impressive 39% of total market share. The top 5 players have market shares
in the 7-9% range. With incremental addition of ~4mt capacity in FY14,
Ultratech should attain capacity leadership in this market too and breach the
10% mark. It is interesting to note that Ultratech continued to operate above
average regional utilization, with FY12 utilization of 73% vs. that of 54% for the
region.
Figure 93 South: capacity share - India Cements
is market leader
Figure 94 South: production share - India
Cements is market leader
Figure 95 South: HHI indicates no concentration
or competitive market
Source: Espirito Santo Investment Bank Research, Company Data, CMA Source: Espirito Santo Investment Bank Research, Company Data, CMA Source: Espirito Santo Investment Bank Research, Company Data, CMA
Central: Jaypee is market leader by wide margin - Jaypee is the clear market
leader in the Central region (with 30% capacity share in FY13), while the next
two have half the capacity. If the proposed Ambuja-HIPL merger goes
through, then combined entity will achieve a number two position (with an
20% market share). This region has the lowest number of players and the top
5 combined accounted for 81% of total market share in FY13. The central
region is expected by us to add 8mt of capacity over FY14-16E, namely
Ambuja (3mt) and Reliance (5mt). We expect Ambuja, despite operating at
~73% capacity utilization, to add another 3mt in the central region.
Figure 96 Central: capacity share - Jaypee is
market leader
Figure 97 Central: production share - Jaypee is
market leader
Figure 98 Central: HHI indicates no concentration
or competitive market
Source: Espirito Santo Investment Bank Research, Company Data, CMA Source: Espirito Santo Investment Bank Research, Company Data, CMA Source: Espirito Santo Investment Bank Research, Company Data, CMA
Price volume tradeoffs: Whilst we see volume growth and market share as the
primary themes, we highlight the impact of price/volume trade-offs in a
scenario with increasing/declining prices and utilization levels. Owing to
legacy issues, ACC has the highest fixed costs amongst the four companies
under our coverage. The variable cost for ACC, Ambuja and Ultratech is in the
range of ~Rs3,000-Rs 3,100/t, while Shree has significantly lower costs (at
0%
10%
20%
30%
40%
50%
60%
70%
80%
90%
100%
Ultratech Ambuja Shree JKCement
Jaypee Binani ACC JKLakshmi
Mangalam Birla Others
0%
10%
20%
30%
40%
50%
60%
70%
80%
90%
100%
Shree Ambuja Ultratech JKCement
Binani ACC Jaypee JKLakshmi
Birla Mangalam Others
11%
11%
12%
12%
13%
13%
14%
-
2
4
6
8
10
12
14
16
No of Players HHI Index - RHS
0%
10%
20%
30%
40%
50%
60%
70%
80%
90%
100%
Ultratech IndiaCem Madras Chettinad
ACC Dalmia Kesoram Penna
Vicat JSW Others
0%
10%
20%
30%
40%
50%
60%
70%
80%
90%
100%
Ultratech IndiaCem Madras ACC
Chettinad Dalmia Kesoram Zuari
Vicat JSW Others
0%
2%
4%
6%
8%
10%
12%
-
5
10
15
20
25
30
35
40
45
No of Players HHI Index - RHS
0%
10%
20%
30%
40%
50%
60%
70%
80%
90%
100%
Jaypee Prism Ultratech Reliance
Heidelberg ACC Century Birla
Ambuja CCI Others
0%
10%
20%
30%
40%
50%
60%
70%
80%
90%
100%
Jaypee Ultratech Prism ACC Century
Reliance Heidelberg Birla Ambuja Others
0%
2%
4%
6%
8%
10%
12%
14%
16%
18%
20%
-
1
2
3
4
5
6
7
8
9
10
No of Players HHI Index - RHS
Page 25 of 73

Page 26 of 47
Overall, Ultratech is a pan India player
and we expect it to attain market
leadership in 4 (E, W, N, S) out of 5 (E,
W, N, S, C) regions post expansion
over FY14-16E.
ACC has launched AFR & WHR
initiatives to combat cost inflation. We
think 5% substitution of kiln coal is just
the beginning and expect more to be
in the offing.
Rs2,400/t) owing to lower power & freight costs. Ambuja has the lowest
sensitivity to a drop in price and utilization (Figure 100), so it is least affected
in a declining price/volume environment. Overall, all of these players are
worse off in a declining price and utilization environment and with decline
being more sensitive to price than volume, we think none of them would
ideally like to play the market share game at the cost of a price decline.
Figure 99 ACC - high sensitivity owing to higher fixed cost Figure 100 Ambuja - least sensitive to price and volume drop
Source: Espirito Santo Investment Bank Research, Company Data Source: Espirito Santo Investment Bank Research, Company Data
Figure 101 Shree - low cost helps in better margins Figure 102 Ultratech - second least sensitive
Source: Espirito Santo Investment Bank Research, Company Data Source: Espirito Santo Investment Bank Research, Company Data
Figure 103 Ultratech looks best positioned to maintain its market leadership
Source: Espirito Santo Investment Bank Research, Company Data, Full green = 4 is best while Full white = 0 is worst, (Best & Worst is relative for these 4 companies)
Growth & Cost saving opportunities: Ultratech has the most potential
Ultratech: Ultratech, which is a pan-India player, should attain market
leadership in 4 (E, W, N, S) out of 5 (E, W, N, S, C) regions post expansion over
FY14-16E. We think its plans for capacity additions in the supply-deficient
Eastern region where its plants are operating at full utilization bodes well for
the company. In terms of cost saving initiatives, Ultratech has launched a
90MW WHR expansion and plans to substitute 10-14% of conventional power
source through this medium. In terms of operational metrics, it has maximum
potential as its blending ratio, at 1.3x, is the lowest amongst these 4
companies. Finally, it is the second-least sensitive of the four to price &
utilization drops (Figure 102), which should help it better sustain profitability
in a declining pricing environment.
ACC: ACC‖s capacity additions in the Eastern region should help it achieve 2nd
place in the region by CY15E. No capacity additions in other regions should
result in a capacity share drop by 1-2 percentage points (North – decline from
8% in CY12 to 7% in CY15E, Central – decline from 11% in CY12 to 9% in CY15E).
ACC has launched AFR & WHR initiatives to combat cost inflation. We think
5% substitution of kiln coal is just a beginning and we expect more to be in the
offing. On the blending front, it has limited scope as its ratio, at 1.53x, is one of
the highest in the industry. ACC is the most sensitive to price & utilization
drops owing to its higher fixed costs, which we think can be addressed
through a modernization drive in the future.
Ambuja: Ambuja‖s capacity additions in the central region, with lower capacity
utilization may result in a suboptimal utilization level for the company;
however, capacity additions in the North bode well (~90% utilization).
Ambuja‖s blended cement ratio of 92% leaves limited room for further cost
improvement on this front, but WHR & AFR initiatives will be key avenues
70% 75% 80% 85% 90% 95% 100% 105%
-2% 6% 11% 17% 21% 25% 28% 32% 34%
-1% 0% 6% 11% 15% 19% 23% 26% 29%
0% -6% 0% 5% 9% 13% 17% 20% 23%
3% -23% -17% -12% -8% -4% 0% 3% 6%
6% -40% -34% -29% -25% -21% -18% -14% -11%
12% -75% -69% -64% -59% -56% -52% -49% -46%
EBITDA (% Change) Utilization level
Pri
ce D
rop
(%
)
70% 75% 80% 85% 90% 95% 100% 105%
-2% 7% 10% 12% 14% 16% 17% 19% 20%
-1% 2% 5% 7% 9% 11% 13% 14% 15%
0% -3% 0% 2% 4% 6% 8% 9% 10%
3% -17% -15% -12% -10% -8% -7% -5% -4%
6% -32% -29% -27% -25% -23% -21% -20% -19%
12% -61% -58% -56% -54% -52% -51% -49% -48%
EBITDA (% Change) Utilization level
Pri
ce D
rop
(%
)
70% 75% 80% 85% 90% 95% 100% 105%
-2% 5% 11% 15% 19% 23% 26% 29% 32%
-1% 0% 5% 10% 14% 18% 21% 24% 26%
0% -5% 0% 5% 9% 12% 16% 19% 21%
3% -21% -16% -11% -7% -4% 0% 3% 5%
6% -37% -32% -27% -23% -20% -16% -13% -11%
12% -69% -64% -59% -55% -51% -48% -45% -43%
EBITDA (% Change) Utilization level
Pri
ce D
rop
(%
)
70% 75% 80% 85% 90% 95% 100% 105%
-2% 8% 11% 13% 15% 17% 19% 20% 22%
-1% 3% 5% 8% 10% 12% 13% 15% 16%
0% -3% 0% 2% 5% 6% 8% 10% 11%
3% -19% -16% -13% -11% -9% -8% -6% -5%
6% -34% -32% -29% -27% -25% -24% -22% -21%
12% -66% -63% -61% -59% -57% -55% -54% -52%
EBITDA (% Change) Utilization level
Pri
ce D
rop
(%
)
Comparison Table Ultratech Cement ACC Cement Ambuja Cement Shree Cement
Market Position
Absolute Capacity 4 3 2 1
Capacity Utilization (%) 2 3 1 4
Capacity Addition (FY14-16) 4 2 2 3
Regional Presence 4 4 3 1
Market Leadership 4 2 2 1
Page 26 of 73

Page 27 of 47
Ambuja‖s capacity addition in central
region, with lower capacity utilization,
may result in a suboptimal utilization
level for the company. However
capacity addition in the North bodes
well owing to high (~90%) utilization.
Clinker expansion in North & future
capacity addition will help it sustain
leadership in North (no grinding
expansion in FY14-16 should result in
Ultratech becoming market leader).
We expect our top 4 to stage a
comeback and account for 61% of total
capacity addition as against 23% over
FY09-13.
We expect Ambuja & Shree to lead the
pack in margin expansion in grey
cement. ACC & Ultratech may face
some challenges in RMC segment but
for Ultratech, white cement will more
than offset the impact.
going forward. Ambuja is the least sensitive to a price & utilization drop, which
bodes well in a falling price environment.
Shree: We see Shree‖s foray into the Eastern region as a well thought-out
strategy to diversify from a single market presence. Clinker expansion in the
North and future capacity additions should help it maintain a leadership
position in the North (although no grinding expansion in FY14-16 should result
in Ultratech becoming market leader). We expect Shree to replicate its record
execution and cost efficient operations in the Eastern region as well. Of the 4
cement companies under our coverage, Shree is the 3rd
most sensitive to price
& volume drops owing to higher fixed costs but its ambitious expansion plans
(to double its capacity) should help it attaining scale, which should result in
lower per-unit fixed costs in future.
Financial metrics
Top 4: Capacity addition - From dormant (FY09-13) to active (FY14-16E):
The combined capacity additions of Ultratech, ACC, Ambuja & Shree Cement
(our top 4) trailed industry growth rates over FY09-13 (Figure 104 & 105).
However, we expect our top 4 to stage a comeback and account for 61%
(figure 105) of total capacity additions over FY14-16E as opposed to 23% over
FY09-13. We believe this bodes well for our top 4 and will help them gain
market share in the near future. The majority of capacity additions by
Ultratech will be completed by FY14; however those of ACC & Ambuja
Cements will largely be back ended (by FY16E). Shree cement‖s 6.5mt
capacity addition is expected to be evenly distributed over FY15-16E.
Figure 104 Capacity addition of Ultratech + ACC + Ambuja + Shree
trailed that of industry in FY08-12
Figure 105 Majority of capacity addition over FY14-16 to be done by
our top 4
Source: Espirito Santo Investment Bank Research, Company Data, CMA Source: Espirito Santo Investment Bank Research, Company Data, CMA
Key assumptions: Volume growth to pick up in H2FY14
While we expect modest volume growth for CY13E/FY14E, the top-4
companies should register robust volume growth in CY14E/CY15E on the back
of expected demand improvement. We expect grey cement realizations to
improve and offset cost pressures resulting in margin expansion. Ambuja &
Shree should lead the pack in margin expansion in grey cement. ACC &
Ultratech may face some challenges in the RMC segment but for Ultratech,
white cement should more than offset the impact. The figure below highlights
our key assumptions.
Figure 106 Grey Cement - realization, ebitda & volume estimates
Source: Espirito Santo Investment Bank Research for estimates, Company Data
Balance sheet strength puts our top 4 on a strong footing:
Figure 107 & 108 shows a scatter plot of various cement players based on
EBITDA growth, RoIC and Net Debt/EBITDA over the past 5 years. An ideal
-
5.0
10.0
15.0
20.0
25.0
30.0
35.0
40.0
45.0
50.0
Capacity Addition (Mt)
Ultratech + ACC + Ambuja + Shree Cement (Mt)
0%
20%
40%
60%
80%
100%
120%
(Ultratech + ACC + Ambuja + Shree Cement) as % of Total (Mt)
CY12 CY13E CY14E CY12 CY13E CY14E FY13 FY14E FY15E FY13 FY14E FY15E
Volumes 24.1 24.3 26.1 22.0 21.8 22.7 12.5 13.9 14.8 40.8 41.8 44.8
Realization (Rs/T) 4,497 4,493 4,762 4,410 4,363 4,629 3,719 3,720 3,818 4,133 4,154 4,279
EBITDA (Rs/T) 930 742 939 1,088 920 1,226 1,032 978 1,027 949 920 1,055
Cost (Rs/T) 3,568 3,751 3,823 3,322 3,443 3,403 2,687 2,742 2,790 3,184 3,234 3,224
Estimates (Grey Cement)
Ultratech CementShree CementAmbuja CementACC Cement
Page 27 of 73

Page 28 of 47
Ultratech, Shree Cement & Ambuja
score well vs. other players on EBITDA
growth, RoIC and Net Debt/EBITDA
metrics, while ACC has lagged behind
only on growth terms.
player would have above-median EBITDA growth & RoIC and below median
Net Debt/EBITDA. Ultratech, Shree Cement & Ambuja score well on all three
fronts vs. other players, while ACC has lagged behind only on growth terms.
With new capacities expected from these players over FY14-FY16, and a
healthy balance sheet, we expect Ultratech, Shree Cement and ACC to
outperform (in terms of growth & returns) their peers in the medium term. In
addition, we think a combination of lower solvency ratios (FY13/CY12) Net
Debt/EBITDA of -0.4x for our top 4 vs. 5.3x for others, interest coverage at
22.1x vs. 3.3x for others) & above-industry-average growth rates will help the
our top 4 participate in the Indian cement growth story on a much stronger
footing.
Figure 107 Ultratech, Shree Cement & Ambuja score above median RoIC &
EBITDA growth (FY09-13)
Figure 108 Ultratech, Shree Cement, ACC & Ambuja all in best quadrant in
Net Debt/EBITDA and RoIC (FY09-13)
Source: Espirito Santo Investment Bank Research, factset Source: Espirito Santo Investment Bank Research, factset
Return ratios look set to improve
Return ratios for our top 4 have declined from peak levels of ~30-35% in FY07
to ~15-20% in FY13 as a result of demand moderation, capacity additions and
rising input costs. However, we expect the ratios to improve going forward
with a pick-up in demand and moderation in capacity addition. Our estimates
do not factor in potential gains on cost saving initiatives and hence we see
upside risk to our estimates. Our top 4 have strong balance sheets with
gearing below 0.2x. Most of these producers say they expect to fund their
growth capex through internal accruals, implying a moderate increase in
gearing.
Figure 109 ROE - expected to remain flat Figure 110 ROIC - to improve further Figure 111 Net gearing - low & stable
Source: Espirito Santo Investment Bank Research for estimates, Company
Data
Source: Espirito Santo Investment Bank Research for estimates, Company
Data
Source: Espirito Santo Investment Bank Research for estimates, Company
Data
Ultratech Cement
Ambuja Cement
ACC Cement
Jaiprakash
Associates
Shree Cement
Madras Cement
Century Textiles
India Cements
Rain Commodities
JK Lakshmi
Birla Corp
JK Cement
Kesoram Industries
Prism
Heidelberg
-20%
-10%
0%
10%
20%
30%
40%
-11% -6% -1% 4% 9% 14% 19% 24% 29% 34% 39%
5 Year EBITDA CAGR
5 Year Average ROCE
Median ROCE at 17.6%
Ultratech Cement
Ambuja Cement
ACC Cement
Jaiprakash
Associates
Shree Cement
Madras Cement
Century Textiles
India Cements
Rain Commodities
JK Lakshmi
Birla Corp
Kesoram Industries
Prism
Heidelberg
(3.0)
(1.0)
1.0
3.0
5.0
7.0
9.0
-11% -6% -1% 4% 9% 14% 19% 24% 29% 34% 39%
Average Net Debt/EBITDA
5 Year Average ROCE
0%
5%
10%
15%
20%
25%
30%
35%
40%
FY10 FY11 FY12 FY13 FY14E FY15E
ROE (%)
ACC Cement Ambuja Cement
Ultratech Cement Shree Cement
0%
5%
10%
15%
20%
25%
30%
35%
FY10 FY11 FY12 FY13 FY14E FY15E
ROIC (%)
ACC Cement Ambuja Cement
Ultratech Cement Shree Cement
(0.60)
(0.40)
(0.20)
-
0.20
0.40
0.60
0.80
1.00
1.20
FY10 FY11 FY12 FY13 FY14E FY15E
Net Gearing (x)
ACC Cement Ambuja Cement
Ultratech Cement Shree Cement
Page 28 of 73

Page 29 of 47
Figure 113 H2FY cement consumption better
than H1FY
Source: Espirito Santo Investment Bank Research, Company Data
44%
45%
46%
47%
48%
49%
50%
51%
52%
53%
54%
FY05 FY06 FY07 FY08 FY09 FY10 FY11 FY12 FY13
% H1FY % H2FY
Historical data indicate weak demand
in the June to September period, with
a pick up in the following months.
Figure 112 Financial metrics: Ultratech looks best positioned to maintain its market leadership position
Source: Espirito Santo Investment Bank Research, Company Data, Full green = 4 is best while Full white = 0 is worst, (Best & Worst is relative for these 4 companies)
Earnings momentum – downgrades already behind?
Whilst we have little doubt that long-term demand fundamentals for the
sector are positive, Indian cement makers have suffered over the last 6
months due to sluggish demand (1HCY13 growth at 5.3% yoy) primarily on the
back of an unfavourable demand/supply equation, early and extended
monsoons, and pushback on central government public expenditure. As a
result of the aforementioned factors, consensus has sharply cut earnings
estimates for all four companies, as can be seen in the figure below. In
addition, Ultratech, ACC, Ambuja and Shree Cement have all corrected by 15-
25% YTD vs. the Sensex gain of 1.94%.
What do consensus estimates reflect?
At this point we think the negatives are well factored in and the same events
should pave way for earnings upgrades going forward. Our back of the
envelope calculation indicates that the Street is now factoring in volume
growth of 9%, 2%, 3% for Ultratech, ACC, Ambuja Cement respectively for
CY13/FY14. Figure 114 also indicates the derived volume growth for FY14/15.
Figure 114 Implied volume growth from consensus estimates
Source: Espirito Santo Investment Bank Research for estimates, Bloomberg for consensus
Post monsoon, election spending to revive demand:
We estimate an increase in demand in the medium term on the back of: 1.
pick-up in construction activity post monsoons. Historical data indicate weak
cement demand in the June to September period, with a pick-up in the
following months. Besides prolonged and above average monsoons, higher
MSP‖s for farmers and central government handouts on social schemes imply
higher disposable income and pent-up demand. 2. Whilst the central
government has pushed back its expenditure schemes, we expect pent up
demand to materialize on this front as the country nears elections. Besides,
state elections in MP, Delhi, Rajasthan and Chhattisgarh should push up
demand further. The figure below highlights the seasonal production trends in
recent years.
Exhibit: (Figure 115-119) Post monsoon, demand to pick-up; Pre-election spend
to play out
Comparison Table Ultratech Cement ACC Cement Ambuja Cement Shree Cement
Return, Leverage & Growth
Last 5 year Avg. RoIC 3 2 1 4
Last 5 year Avg. Net Debt/EBITDA 1 3 4 2
Last 5 year Avg. EBITDA CAGR 4 1 2 4
EBITDA CAGR 2yr Forward 4 2 3 3
1yr. Fwd. EV/EBITDA 3 4 1 3
CY13E CY14E CY13E CY14E FY14E FY15E FY14E FY15E
Consensus Net Sales (Rs Mn) 117,401 133,306 100,220 113,442 62,697 71,622 220,704 253,091
Grey Cement (as % Net Sales) 94% 94% 100% 100% 82% 82% 83% 83%
Grey Cement Net Sales (Rs Mn) 110,357 125,308 100,220 113,442 51,412 58,730 183,184 210,066
FY13/CY12 Realization(Rs/T) 4,497 4,497 4,410 4,410 3,719 3,719 4,154 4,154
Implied Volumes (Mt) 24.5 27.9 22.7 25.7 13.8 15.8 44.1 50.6
Implied Growth - yoy (%) 2% 14% 3% 13% 11% 14% 5% 15%
ESIBe Growth - yoy (%) 1% 7% -1% 4% 12% 6% 0% 7%
Ambuja Cement Shree Cement Ultratech Cement
Standalone (Rs Mn)
ACC Cement
Page 29 of 73

Page 30 of 47
We initiate with BUY ratings on
Ultratech Cement (FV Rs 2221),
Ambuja Cement (FV Rs 206) and ACC
(FV Rs 1397) and with a NEUTRAL
rating on Shree Cement (FV Rs 4199)
Figure 115 East - demand picks up in H2FY Figure 116 East - demand picks up in H2FY
Source: Espirito Santo Investment Bank Research, Company Data Source: Espirito Santo Investment Bank Research, Company Data
Figure 117 North - demand picks up in H2FY Figure 118 South - demand picks up in H2FY Figure 119 Central - demand picks up in H2FY
Source: Espirito Santo Investment Bank Research, Company Data Source: Espirito Santo Investment Bank Research, Company Data Source: Espirito Santo Investment Bank Research, Company Data
Initiate with BUY on ULCT, Ambuja & ACC; Neutral on SRCM
Our view on Ultratech, Ambuja, ACC and Shree Cement is based on our
analysis of the companies‖: market share and growth potential, balance sheet
strength, operational characteristics and potential costs saving opportunities
going forward. We think the market leader, Ultratech Cement, should continue
to benefit from industry growth owing to its major capacity addition plan over
FY14-16. Ambuja is our second pick owing to its stable input costs and
expected growth ahead. ACC & Ambuja have a combined plan to add ~10mt of
capacity by CY15. ACC is our third pick on fundamental parameters and while
we currently do not read too much into ACEM‖s stake building plans, any
incremental stake purchase via a creeping acquisition could offer support to
ACC‖s share price. We like Shree cement for its strong growth profile and
operating metrics but see limited upside at current valuations. Overall, we
initiate with BUY ratings on Ultratech Cement (FV Rs 2221), Ambuja Cement
(FV Rs 206) and ACC (FV Rs 1397) and with a NEUTRAL rating on Shree
Cement (FV Rs 4199).
1,550
1,650
1,750
1,850
1,950
2,050
2,150
2,250
Apr May Jun Jul Aug Sep Oct Nov Dec Jan Feb Mar
East FY11 East FY12
1,350
1,550
1,750
1,950
2,150
2,350
Apr May Jun Jul Aug Sep Oct Nov Dec Jan Feb Mar
West FY11 West FY12
2,650
2,850
3,050
3,250
3,450
3,650
3,850
4,050
4,250
Apr May Jun Jul Aug Sep Oct Nov Dec Jan Feb Mar
North FY11 North FY12
3,700
4,200
4,700
5,200
5,700
6,200
Apr May Jun Jul Aug Sep Oct Nov Dec Jan Feb Mar
South FY11 South FY12
1,800
1,900
2,000
2,100
2,200
2,300
2,400
2,500
2,600
2,700
Apr May Jun Jul Aug Sep Oct Nov Dec Jan Feb Mar
Central FY11 Central FY12
Page 30 of 73

Page 31 of 47
We prefer to value cement companies
on earnings based multiples over EV/T,
wherein the former captures actual
growth rates and utilization levels, as
against the latter, which captures the
nameplate capacity.
We value Ultratech Cement at 10x 1-
year forward FY EV/EBITDA, whilst,
value ACC and Ambuja at 9x 1-year
forward CY 14 EV/EBITDA i.e. 10%
discount to Ultratech. We value Shree
(Cement business) at a target multiple
of 8x FY14 EV/EBITDA, with the
implied EV/EBITDA multiple for its
entire operations at a 15% premium to
its 5yr average.
Figure 120 Ultratech looks best positioned to maintain its market leadership position
Source: Espirito Santo Investment Bank Research, Company Data, Full green = 4 is best while Full white = 0 is worst, (Best & Worst is relative for these 4 companies)
Valuation metrics & methodology
Valuation methodology: We prefer EV/EBITDA over P/E and EV/T
We prefer to value cement companies on earnings-based multiples over EV/T
as the former captures actual growth rates and utilization levels while the
latter captures the name plate capacity. Further, we prefer EV/EBITDA (x)
over PE (x) for the sake of consistency as several cement players (like Shree
Cement) follow aggressive depreciation policies that suppress profits. We
value pure cement companies Ultratech, ACC and Ambuja on 1-year forward
EV/EBITDA (x), and use a SOTP valuation for Shree Cement, using DCF for its
power operations and 1-year fwd EV/EBITDA to its cement operations.
Ultratech, Ambuja and ACC Cement deserve premium
Whilst the bears might argue that one could find several mid-sized companies
offering higher growth rates and cheaper valuations, we think these three
companies offer significantly higher market share (based on current capacity),
growth visibility (based on expected additions), strong execution track record,
above median return ratios and importantly a lot of comfort on the balance
sheet front. We value Ultratech Cement at 10x 1-year forward FY EV/EBITDA
while we value ACC and Ambuja at 9x 1-year forward CY 14 EV/EBITDA i.e. at
a 10% discount to Ultratech. We value Shree (Cement business) at a target
multiple of 8x FY14 EV/EBITDA, with implied EV/EBITDA multiple for entire
operations at 15% premium to its 5yr average. We value Ambuja on a
standalone basis (excluding ACC), as the necessary approvals for proposed
HIPL & Ambuja merger are still pending.
Our top 4 stands out against global majors
Whilst the bears might argue that our top 4 Indian cement makers are trading
at a ~20% premium to the global ―Big 5‖ (Lafarge [LG FP, Not rated], Holcim
Comparison Table Ultratech Cement ACC Cement Ambuja Cement Shree Cement
Return, Leverage & Growth
Last 5 year Avg. RoIC 3 2 1 4
Last 5 year Avg. Net Debt/EBITDA 1 3 4 2
Last 5 year Avg. EBITDA CAGR 4 1 2 4
EBITDA CAGR 2yr Forward 4 2 3 3
1yr. Fwd. EV/EBITDA 3 4 1 3
Operational Characteristics
Clinker Substitution Potential 4 1 2 3
Wt. Avg. Power Cost 2 3 3 4
External Power Purchased (%) 3 2 1 4
Clinker Energy Consumption Norm 4 3 3 2
Cement Electricity Consumption Norm 3 2 3 4
WHR Initiatives 4 2 2 3
AFR Initiatives 3 4 3 1
Transport Mix 4 3 2 1
Average Lead Distance 3 3 3 4
Market Position
Absolute Capacity 4 3 2 1
Capacity Utilization (%) 2 3 1 4
Capacity Addition (FY14-16) 4 2 2 3
Regional Presence 4 4 3 1
Market Leadership 4 2 2 1
Overall 4 3 3 2
Page 31 of 73

Page 32 of 47
[HOLN VX, Not rated], Cemex [CX US, Not rated], Heidelberg [HEI DE, Not
rated], Vicat [VCT FP, Not rated]) on 1 year forward EV/EBITDA or 2x on P/B
(x) parameters, we think these companies deserve the premium given they
offer: 1) A structural growth play (please read: India yet to ride the curve
below) 2) Superior return ratios (i.e. average RoE at ~15% vs. Big 5 at ~5%
FY13/CY12) 3) Robust and relatively clean balance sheets (i.e. average net
debt/EBITDA at 1.5x vs. Big 5 at 4.1x (FY13/CY12) and 4) Decent pay-out
profiles (i.e. average at 1.2% vs. Big 5 at 2% (FY13/CY12). Further, although one
might debate the India growth story (a mirage?) over stuck infrastructure
projects, lack of political will, etc., we think the sector offers the best proxy
and is more a consumption theme driven by housing demand, which accounts
for 67% of total 2012 consumption. Considering the growth opportunities in
the country & expected capacity addition by these players, we think the
premium for top 4 is justified. Our order of preference is 1) Ultratech Cement;
2) Ambuja Cement; and 3) ACC Cement; and 4) Shree Cement.
Figure 121 Ultratech should grow above median level Figure 122 Ultratech has above median RoIC and EBITDA growth
--
Source: Espirito Santo Investment Bank Research for estimates, Company Data, Factset for non covered stocks Source: Espirito Santo Investment Bank Research for estimates, Company Data, Factset for non covered stocks
Cement vs. Infrastructure/Road/Housing – Better than the rest?
Cement is an essential part of the infrastructure, road and housing value chain.
Owing to better return ratios (Figure 123) & strong balance sheets, we think
Indian cement producers can be seen as a better proxy for the infrastructure,
road and housing sectors than sector constituents. We think India‖s
infrastructure/road/housing growth story can be played through exposure to
the cement sector.
Figure 123 Cement - best RoIC in value chain
Source: Espirito Santo Investment Bank Research, Company Data, Bloomberg, Year - TTM (Trailiing Twelve Months)
UltraTech
Ambuja
ACC
Jaiprakash
Shree
Madras
IndiaCem
Birla Corp
JK CemPrism
Heidelberg India
Mangalam
Holcim Indonesia
Indocement
Anhui Conch
CNBM
China Shanshui
Siam Cement
Taiwan Cement
Asia Cement
Lafarge SAHolcim Ltd.
Vicat SA
CEMEX SAB
Lafarge Malaysia
Cementos Argos
0
2
4
6
8
10
12
14
16
-40% -20% 0% 20% 40% 60% 80% 100%
1yr Fwd EV/EBITDA
EBITDA CAGR 2yr
UltraTech
Ambuja
ACC
Jaiprakash
Shree
Madras
IndiaCem
Birla Corp
JK Cem
Prism
Heidelberg India
MangalamHolcim Indonesia
Indocement
Anhui Conch
CNBM
China Shanshui Siam Cement
Taiwan Cement
Asia Cement
Lafarge SA Holcim Ltd.
Vicat SA
CEMEX SAB
Lafarge Malaysia
Cementos Argos
-10%
-5%
0%
5%
10%
15%
20%
25%
30%
35%
-40% -20% 0% 20% 40% 60% 80% 100%
RoIC
EBITDA CAGR 2yr
0%
2%
4%
6%
8%
10%
12%
14%
16%
18%
20%
AC
C
Am
bu
ja
Ult
rate
ch
Sh
ree
Ce
me
nt
Me
an
Sad
bh
av E
ng
ine
eri
ng
Ash
oka B
uil
dco
n
IRB
In
frastr
uctu
re
IL&
FS
Tra
nsp
ort
ati
on
Ne
two
rk
Me
an
DL
F L
imit
ed
Un
ite
ch
Ob
ero
i R
ealt
y
So
bh
a D
eve
lop
ers
Pre
sti
ge
Esta
tes
Ph
oe
nix
Mil
ls
Go
dre
j P
rop
ert
y
HD
IL
An
an
t R
aj
Pars
vn
ath
De
ve
lop
ers
Me
an
GM
R I
nfr
astr
uctu
re
GV
K P
ow
er
&
Infr
astr
uctu
re
Me
an
Cement Road Housing Infrastructure
TTM ROIC
Page 32 of 73

FOR IMPORTANT DISCLOSURE INFORMATION, INCLUDING DISCLOSURES RELATED TO THE U.S. DISTRIBUTOR OF THIS REPORT, PLEASE REFER TO THE FINAL PAGES OF THIS REPORT - Please refer to the final pages of this report for important disclosures, analyst certifications and additional information. Espirito Santo Investment Bank does and seeks to do business with companies covered in its research reports. As a result, investors should be aware that the firm may have a conflict of interest that could affect the objectivity of this report. Investors should consider this report as only a single factor in making their investment decision. This research report has been prepared in whole or in part by research analysts based outside the US who are not registered/qualified as research analysts with FINRA (v1.0.5.2)
COVERAGE INITIATION
India | Cement | Large Cap | 20-September-2013
Ultratech Cement
On a rapid growth trajectory
We initiate coverage of Ultratech - our top pick - with a BUY rating and
FV of Rs2,221/sh. In our view, Ultratech’s plan to expand its existing
capacity by 20% by FY16 should help it maintain a market leadership
position at both the regional and pan-India levels. We think its
presence across the cement value chain (grey cement & RMC) and in
high value segments (white cement & putty) will help sustain its long-
term growth. We expect cost saving initiatives through fuel mix
optimization, Waste Heat Recovery (WHRs), Alternative Fuels & Raw
Materials (AFRs) and a better cement/clinker ratio to help mitigate
rising input costs. We think Ultratech’s two-pronged approach of
volume growth with input cost optimization should help it maintain
margins and consolidate its market position.
Capacity expansion should ensure market leadership position
Ultratech is in the midst of a major expansion plan to increase its capacity by
c.20% over the next three years. FY13 saw the commissioning of 2.15mt of
cement capacity (Maharashtra & Gujarat) & 3.3mt of clinker in Chhattisgarh,
while projects at Raipur (4.8mt), Malkhed (4.4mt) and Shambhupura (2.9mt)
are under construction. Capacity expansion is spread across regions, which
should help fortify its regional & pan India market dominance. Ultratech has
been able to maintain higher utilization level at 84% in FY13 vs. c.70% for the
industry. The company announced the acquisition of 4.8mt JP Gujarat will help
consolidate its position in the Western region to 37% (29% in FY13).
Diversified product offerings & presence across value chain: LT +VE
Ultratech not only has market leadership in the grey cement market but is also
a leader in the RMC segment, as well as a key player in white cement. Its
presence in the RMC segment should help protect its turf in the long run as
the market shifts from SMCs to RMCs. Its recent expansion in white cement &
putty, 3.5x realizations vs. grey cement, will help it target high value segments.
White cement & RMC combined accounted for 17% of total revenues in FY13.
Cost savings measures on the anvil; clinker optimization also an option
Ultratech is rolling out initiatives to rein-in rising input costs. In FY13, its energy
cost fell by 2% YoY to Rs989/t owing to the increased usage of pet coke. In
FY13, it increased pet coke consumption to 34% of the total requirement,
resulting in an 8% drop in imported coal volumes and also helping to offset a
15% increase in grid power cost. Ultratech’s initiatives for 90MW WHR could in
our view help it reduce its power cost by Rs2bn annually. We think its
cement/clinker ratio of 1.3x is one of the lowest in the industry and a move
towards the permissible limit of 1.7x offers the potential for annual cost savings
of ~Rs14.5bn on our estimates. On the AFR front, Ultratech successfully reduced
its coal intake by 75kt by using 130kt of alternative fuels in FY13.
Initiate with BUY and FV of Rs.2,221/share
We value Ultratech Cement at 10x FY15E EV/EBITDA, i.e., at a 10% premium to its
3-year average 1yr forward EV/EBITDA. We think Ultratech offers an attractive
combination of: 1) highest volume growth amongst its peers (at 12% CAGR over
FY13-16E), 2) market leadership position, 3) diversification into high-margin
complementary business lines (wall putty/white cement), 4) robust and clean
balance sheet and importantly 5) credible management and no corporate
governance issues. Initiate with BUY and FV of Rs.2,221/share.
Accounting & corporate governance GREEN
Franchise Strength GREEN
Earnings Momentum AMBER
BUY 29% upside
Fair Value Rs2,221.00
Bloomberg ticker UTCEM IN
Share Price Rs1,720.00
Market Capitalisation Rs471,280.00m
Free Float 40%
INR m Y/E 31-Mar 2012A 2013A 2014E 2015E
Revenue 192,357 213,191 222,738 246,131
EBITDA 41,939 48,393 50,628 61,932
EBIT 32,310 38,160 39,217 48,532
Net Income 24,033 26,777 28,048 34,231
Y/E 31-Mar 2012A 2013A 2014E 2015E
P/E (x) 19.6 17.6 16.8 13.8
P/BV (x) 3.7 3.1 2.7 2.3
EV/EBITDA (x) 12.0 10.6 10.1 8.0
EBITDA margin 21.8% 22.7% 22.7% 25.2%
Net Debt / EBITDA 0.7 0.9 0.8 0.4
ROE 18.7% 17.6% 15.9% 16.5%
RoIC 12.9% 12.3% 11.6% 13.3%
Net Gearing (x) 0.2 0.3 0.2 0.1
Source: Espirito Santo Investment Bank Research, Company
Data, Bloomberg
80
85
90
95
100
105
110
115
Oct 2012
Nov 2012
Dec 2012
Jan 2013
Feb 2013
Mar 2013
Apr 2013
May 2013
Jun 2013
Jul 2013
Aug 2013
Sep 2013
UTCEM IN vs BSE500 Index
Share Price Performance
Analysts Ritesh Shah +91 22 4315 6831 [email protected] Espirito Santo Securities India Private Limited Anshuman Atri +91 22 4315 6825 [email protected] Espirito Santo Securities India Private Limited
Page 33 of 73

Page 2 of 9
Source: Espirito Santo Investment Bank Research estimates, Company data and Bloomberg, SHP – June 2013, Segment Revenue – FY13
Valuation Metrics FY12A FY13A FY14E FY15E
Recommendation: BUY P/E (x) 19.6 17.6 16.8 13.8
Fair Value: Rs 2,221 P/BV (x) 3.7 3.1 2.7 2.3
EV/EBITDA (x) 12.0 10.6 10.1 8.0
Share Price: Rs 1,720 EV/Sales (x) 2.6 2.4 2.3 2.0
Upside / Downside 29%
3 Month ADV ($m) 6.3 Key ratios FY12A FY13A FY14E FY15E
Free Float 40%
52 Week High / Low INR 1,508- 2,075 EBITDA margin 21.8% 22.7% 22.7% 25.2%
EBIT margin 16.8% 17.9% 17.6% 19.7%
Bloomberg: UTCEM IN Net Debt / EBITDA 0.5 0.5 0.5 0.2
EBIT / Net Interest 12.6 15.1 12.4 15.4
ROE 18.7% 17.6% 15.9% 16.5%
RoIC 12.9% 12.3% 11.6% 13.3%
Shares In Issue (mn) 274 Net Gearing (x) 0.2 0.3 0.2 0.1
Market Cap (Rs mn) 471,280
Net Debt (Rs mn) - FY14E 24,850
Enterprise Value (Rs mn) 496,130 P&L Summary FY12A FY13A FY14E FY15E
Revenue 192,357 213,191 222,738 246,131
Forthcoming Catalysts: % change 39.4% 10.8% 4.5% 10.5%
Compat verdict on CCI penalty levied on Ultratech EBITDA 41,939 48,393 50,628 61,932
Timely completion of ~10mt expansion plans % change 55.6% 15.4% 4.6% 22.3%
Implementation of 90MW of WHR plants % margin 21.8% 22.7% 22.7% 25.2%
Depreciation & Amortisation 9,629 10,234 11,411 13,400
EBIT 32,310 38,160 39,217 48,532
Espirito Santo Securities Analyst % change 71.6% 18.1% 2.8% 23.8%
Ritesh Shah % margin 16.8% 17.9% 17.6% 19.7%
022- 4315 6831 Operating Profit 32,310 38,160 39,217 48,532
[email protected] Net Financials 2,564 2,523 3,158 3,158
Other Pre-tax Income 3,708 3,036 3,601 3,621
Espirito Santo Securities Analyst Pre Tax Profit 33,454 38,672 39,660 48,995
Anshuman Atri Income Tax Expense 9,481 11,791 11,508 14,660
022- 4315 6825 Associates - - - -
[email protected] Minority Interests (60) 103 103 103
Exceptional Item - - - -
Shareholding Pattern Net Income 24,033 26,777 28,048 34,231
ESIB Net Income 24,033 26,777 28,048 34,231
Reported EPS 87.7 97.7 102.3 124.8
ESIB EPS 87.7 97.7 102.3 124.8
Shares in issue (Millions) 274 274 274 274
Cash Flow Summary FY12A FY13A FY14E FY15E
Operating EBIT 32,310 38,160 39,217 48,532
Add: Depreciation 9,629 10,234 11,411 13,400
Less: Cash Tax 9,444 10,109 11,508 14,660
Less: Increase in Working Capital (1,517) (398) (224) (1,443)
Less: Other Opex 234 108 464 341
Operating Cash Flow 33,778 38,574 38,880 48,374
Segment Revenue (%) - FY13 Less: Capex 26,822 44,201 35,780 30,780
Free Cash Flow 6,955 (5,627) 3,100 17,594
Less: Increase in Investments 17,663 2,531 - -
Add: Other Income 3,708 3,036 3,601 3,621
Add: Increase in Debt 3,411 14,674 - -
Add: Increase in Equity 21 102 (142) -
Less: Interest Paid 2,564 2,523 3,158 3,158
Less: Dividend 1,921 2,551 2,897 3,541
Change in Cash (8,053) 4,579 504 14,515
Balance Sheet Summary FY12A FY13A FY14E FY15E
Cash & Equivalents 28,538 33,117 33,621 48,136
Return ratios Tangible Fixed Assets 127,702 143,161 172,530 199,911
CWIP 19,397 36,011 31,011 21,011
Goodwill 5,444 7,337 7,337 7,337
Associates & Financial Investments 23,946 26,478 26,478 26,478
Other Assets 75 84 84 84
Non-Cash Working Capital 2,034 1,636 1,412 (31)
Total Assets 207,136 247,823 272,472 302,925
Interest Bearing Debt 59,613 74,287 74,287 74,287
Deferred Tax Liability 17,411 19,096 19,096 19,096
Other Liabilities 1,245 1,364 1,364 1,364
Shareholders' Equity 128,244 152,296 176,945 207,397
Minority Interests 623 781 781 781
Total Equity & Liability 207,136 247,823 272,472 302,925
Net Debt 22,009 25,354 24,850 10,335
Ultratech Cement
Promoter,
62.0%
FII, 20.7%
DII, 4.6%
Others,
12.7%
Grey
Cement, 83%
RMX, 10%
White
Cement & Putty, 7%
0.0%
5.0%
10.0%
15.0%
20.0%
25.0%
CY11A CY12A CY13E CY14E
ROE RoIC
Page 34 of 73

Page 3 of 9
Figure 124 Ultratech - ESIB vs. Consensus
Source: Espirito Santo Investment Bank Research estimates, Bloomberg for consensus
Ultratech
Consol (Rs Mn) FY14E FY15E FY14E FY15E FY14E FY15E
Sales 222,738 246,131 233,838 268,834 -5% -8%
EBITDA 50,628 61,932 51,596 61,261 -2% 1%
PAT 28,048 34,231 29,149 35,063 -4% -2%
ESIB Consensus Difference (%)
Company snapshot
Ultratech Cement is India's largest cement manufacturer with a global installed
capacity of 53.9mt in FY13, which it plans to expand further to 64.5mt by FY16. Its
grey cement capacity in India stands at 50.9mt (in FY13), while its Middle East based
subsidiary "Star Cement" has 3mtpa capacity. Ultratech is market leader in RMC with
100+ operational plants which are capable of producing more than 13 million m3
annually. It is also a leading player in the white cement (0.56mt) & wall care putty
(0.4mt) categories. Ultratech is India's leading cement exporter with total exports in
FY13 of 1.07mt. In FY13, grey cement accounted for 83% of total revenues, while RMC
accounted for 10% and white cement segment accounted for 7%.
Figure 125 Ultratech has market leadership in
most of the regions - Capacity share FY13
Figure 126 West accounts for 29% of
Ultratech's total capacity (FY13)
Figure 127 Ultratech valuation – FY15E FV of
Rs2,221
Source: Espirito Santo Investment Bank Research, Company Data Source: Espirito Santo Investment Bank Research, Company Data Source: Espirito Santo Investment Bank Research estimates
Figure 128 Scenario Analysis
Low case Base case High case
Fair value 1,768 2,221 2,633
Upside/downside: 3% Upside 29% Upside 53% Upside
FY15 EBITDA(Rs Bn) 48.5 61.9 70.6
Assumptions
Grey Cement volumes at 5% below our estimates
Realization at 5% below our estimates
White Cement & Wall Care Putty volumes & realization 5% below our estimates
RMC volumes & realization 5% below our estimates
Grey cement volumes at 41.8/44.8mt in FY14E/FY15E
RMC volumes at 5.7/6.23mn m3
White Cement & Wall Care Putty Volumes at 1.15mt & 1.2mt
Grey Cement Realization at Rs.4,154/T & Rs4,279
Grey Cement EBITDA at Rs.920/T & Rs1055 in FY14E & FY15E
Realization at 5% above our estimates
Source: Espirito Santo Investment Bank Research for estimates
Figure 129 SWOT analysis
Strengths Weaknesses
Ultratech commands market leadership in grey cement at the pan India level and it is also a top 3 player in all regions
Ultratech is India's largest RMC player with over 100 operational plants and total installed capacity of 13 million m3
Ultratech is India's leading white cement & wall care putty producer with c.1mt of installed capacity
19% of the total power requirement in FY13 was met through external sources at Rs6.33/kwh vs. own generation of Rs4.15/kwh. Increase in external power share can increase total power & fuel cost.
Of the total requirement of 6.42MT (power + kiln), Ultratech has FSAs of ~3mtpa, owing to which it has to depend on e-auction & imported coal, which leads to higher production cost at Rs4.1/kwh
Ultratech's Bhaskarpara coal block, with 47.37% share was de-allocated in FY13 by IMG for delays in achieving milestones. The matter is currently pending a ruling from the High Court of Chhattisgarh. a negative verdict can result to de-allocation.
Opportunities Threats
Capacity growth of 10.55mt, by FY15, to increase total capacity to 64.55mt which will help maintain market leadership
White cement & putty division, which has 3.5x realizations as that of grey cement, doesn’t suffer from excess supply and further expansion will help to boost profitability.
Ultratech is undertaking 90MW of WHR projects which will lower total power cost. WHR CoP is at Rs0.41/kwh vs. purchased power of Rs6.33/kwh in FY13
Ultratech was able to substitute 75kt of coal with alternative fuels in FY13. AFR is still in nascent stage and further initiatives can help reduce overall power & fuel cost
Cement to clinker ratio for Ultratech is at 1.3x vs. 1.7x permissible limit. Usage of more fly ash can help reduce overall cost.
Prolonged weakness in demand may force marginal players to resort to predatory pricing, which may hurt margins
Prolonged weakness in demand can lead to sub-optimal plant utilization levels from FY13 level of 84%
CCI imposed a penalty of Rs11.75bn in June 2012 for alleged contravention of the provisions of competition act. The case is now being heard by COMPAT (Competition Appellate Tribunal) and a negative verdict would lead to a cash outflow of Rs11.75bn.
Increasing diesel prices and freight cost (Rail & Road) will lead to increase in total cost. Rail and road together account for 96% of its freight mode.
Source: Espirito Santo Investment Bank Research for estimates
East,
13%
West,
29%North,
15%
South,
9%
Central,
14%
Market Share
East,
13%
West,
29%
North,
22%
South,
25%
Central,
11%
Capacity Breakup (%)
Valuations FY15E
EBITDA (Rs Mn) 61,932
Multiple 10.0x
EV (Rs Mn) 619,319
Debt (Rs Mn) 74,287
Cash + Investments (Rs Mn) 63,952
Equity Value (Rs Mn) 608,985
No of Shares (Mn) 274
FV Rs/Share 2,221
Page 35 of 73

Page 4 of 9
Ultratech - JP Gujarat acquisition
Ultratech Cement recently announced the acquisition of 4.8mt JP Gujarat for
an EV of Rs38bn implying EV/T of $124, which will help in consolidating the
west market share to 36% (29% in FY13). The deal will include equity issuance
of Rs1.5bn (0.32% equity dilution) and the rest is via debt of Rs36.5bn. JP’s
assets include recently commissioned plants with latest technology and split
grinding units. The land area of 5,479Ha and limestone reserves of ~500mt
provides scope to double the capacity going forward. Other assets are a CPP
of 57.5MW, DG of 30MW, Jetty of 2,500DWT, desalination plant and a cement
bag manufacturing unit (0.3mn bags/day). These plants will provide operating
leverage in Gujarat, wherein UTCEM’s plants are functioning at a high
utilization rate (~95%) and can help in targeting the coastal markets of
Mumbai, Kochi, Mangalore and Sri Lanka. Management expects the deal to be
EPS accretive from the third year onwards and synergy gains of Rs300-
400mn per annum through market realignment and higher utilization. We
think the deal will further help Ultratech maintain market leadership at the pan
India & regional levels and provide access to the high growth coastal market.
In addition, the integrated nature of plants with strong infrastructure should
help maintain low operating costs. The proposed Jaypee – Ultratech
transaction is subject to the approval of shareholders and creditors, sanction
of the Scheme of Arrangement by the High Courts, approval of the
Competition Commission of India and all other statutory approvals. The
timeline expected for the event is 7 to 9 months. Given pending regulatory
approvals, our base case currently does not factor in the transaction. However,
on the basis that it was approved and we incorporated the higher debt and
earnings contribution into our model, we currently calculate that our FV would
fall to Rs2,158/share (vs. our base case at Rs2,221/share).
Figure 130 JP Gujarat - Expected synergy gain of Rs300-400mn per
annum
Figure 131 Long-term benefit - EPS accretive from
year 3 onwards
Source: Espirito Santo Investment Bank Research, Company Data Source: Espirito Santo Investment Bank Research estimates
Valuations (+ JP Gujarat) FY15E
EBITDA (Rs Mn) 64,032
Multiple 10.0x
EV (Rs Mn) 640,319
Debt (Rs Mn) 110,787
Cash + Investments (Rs Mn) 63,952
Equity Value (Rs Mn) 593,485
No of Shares (Mn) 275
FV Rs/Share 2,158
Page 36 of 73

Page 5 of 9
Source: Espirito Santo Investment Research for estimates
Parameter Traffic signal Reasons
Accounting &
governance
GREEN
We don’t find anything untoward, using our proprietary model, in Ultratech’s corporate governance
practices. Increased disclosure on matters such as the recent Jaypee deal and details on several cost
heads would be appreciated by the Street
Franchise strength GREEN
Ultratech Cement is India's largest cement manufacturer. In our view, its plan to add 20% of existing
capacity by FY16E should help it maintain market leadership at both the regional & pan India levels. We
think its presence across the cement value chain (grey cement & RMC) and in high value segments
(white cement & wall care) will help sustain its long-term growth. Ultratech is also a market leader in
RMC with 100+ operational plants. ULTC enjoys considerable brand premium and enjoys robust
business model.
Earnings
momentum AMBER
Tepid cement demand growth in past 6 months (~3.3%) has resulted in downward revision in India
demand expectation for FY14E at ~6% vs. 9.3% in FY13. This has resulted in downward revision in
growth rates for some companies and consensus expects Ultratech to grow at 6% in FY14, which has
resulted in earnings downgrades.
Page 37 of 73

Page 6 of 9
Valuation Methodology
We value Ultratech Cement at 10x FY15E EV/EBITDA, i.e., at a 10% premium
to its 3-year average 1yr forward EV/EBITDA.
Risks to Fair Value
CCI Penalty: CCI imposed a penalty of Rs11.8bn on Ultratech in June
2012, for alleged contravention of the provisions of competition act.
The case is being heard at COMPAT (Competition Appellate Tribunal)
and a negative verdict would lead to a cash outflow to the tune of
imposed penalty.
Sand mining ban: Sand is an essential ingredient in concrete. Owing
to rampant sand mining without regulatory approvals, National Green
Tribunal (NGT) has called for a mining ban across all rivers in India. A
further stringent set of rules will negatively impact cement demand.
Captive block (de)/allocation: coal blocks allotted to Ultratech have
been de-allocated for lack of progress and the matter is pending in
the high courts of the respective jurisdictions. In the event of a
favorable outcome, the power cost for associated power plants can
reduce by 2/3rd
(to Rs1-1.2/kwh)
o Ultratech: Coal block of Bhaskarpara Coal Company Ltd.
(Ultratech’s 47.37% ownership) was de-allocated owing to
delays in achieving milestones. The company has filed a
written petition the in High Court of Chhattisgarh and is
under review.
External limestone purchase: Cost of external purchased limestone is
4x that from own quarry. 5% substitution of own limestone by
external sources could increase per tonne cost by Rs7.
Increase in Freight rates: Cement is largely transported by road & rail
modes. Taking a producer with 50% rail/road transport mode and
average lead distance of 520kms, a 5% increase in rail freight would
result in a Rs18/t cement cost while a 5% increase in road freight
would increase costs by Rs29/t.
Increase in external power purchase: Cost of external power is ~50%
higher than that of own power. Ultratech depends on external power
sources to the tune of 14%. A 5% substitution of own power by
external means would result in a per tonne cost increase by Rs9.
Increase in coal & pet coke rates: Owing to limited coal linkages,
most cement producers are dependent on e-auction and imported
coal. A 5% rise in kiln coal cost would increase per tonne cost by
Rs30.
Sharp drop in demand: Our estimates factor in 5.9% & 8.3% growth in
FY14E & FY15E respectively. A sharp drop in demand is a risk to our
volume estimates for Ultratech cement.
Prolonged price war: New entrants could resort to price wars to gain
market share. A prolonged price war could result in a sharp drop in
realization in affected regions.
Greenfield & brownfield expansion: Ultratech is undertaking various
greenfield & brownfield expansions. Delays in land acquisition &
environmental clearances, inadequate supply of raw materials (like
limestone, linkage coal & fly ash) may hamper expansion plans.
Increase in taxes or levies on Cement: As per CMA, taxes and levies
constitute 60% or more of the ex-factory price. Further increase in tax
rates or levies may impact cement demand.
Page 38 of 73

Page 7 of 9
Tax credits and incentives: Cement producers enjoy several tax
credits and incentives for capex under 80IA & subsidy in states like
HP. Withdrawal of these incentives may result in higher effective tax
rates in future.
Please visit our website at www.EspiritoSantoIB.co.uk for up to date recommendation charts.
Ultratech Cements UTCEM IN
Report date Recommendation Fair value Share price (INR)
Recommendation history is not available
Source: Bloomberg, Espirito Santo Investment Bank Research
500
700
900
1100
1300
1500
1700
1900
2100
2300
2500
Sep-10 Dec-10 Mar-11 Jun-11 Sep-11 Dec-11 Mar-12 Jun-12 Sep-12 Dec-12 Mar-13 Jun-13 Sep-13
Buy Trading Buy Neutral Trading Sell Sell Restricted Dropped Coverage
Ambuja Cements ACEM IN
Report date Recommendation Fair value Share price (INR)
Recommendation history is not available
Source: Bloomberg, Espirito Santo Investment Bank Research
100
120
140
160
180
200
220
240
Sep-10 Dec-10 Mar-11 Jun-11 Sep-11 Dec-11 Mar-12 Jun-12 Sep-12 Dec-12 Mar-13 Jun-13 Sep-13
Buy Trading Buy Neutral Trading Sell Sell Restricted Dropped Coverage
ACC ACC IN
Report date Recommendation Fair value Share price (INR)
Recommendation history is not available
Source: Bloomberg, Espirito Santo Investment Bank Research
900
1000
1100
1200
1300
1400
1500
Sep-10 Dec-10 Mar-11 Jun-11 Sep-11 Dec-11 Mar-12 Jun-12 Sep-12 Dec-12 Mar-13 Jun-13 Sep-13
Buy Trading Buy Neutral Trading Sell Sell Restricted Dropped Coverage
Shree Cement SRCM IN
Report date Recommendation Fair value Share price (INR)
Recommendation history is not available
Source: Bloomberg, Espirito Santo Investment Bank Research
1500
2000
2500
3000
3500
4000
4500
5000
Sep-10 Dec-10 Mar-11 Jun-11 Sep-11 Dec-11 Mar-12 Jun-12 Sep-12 Dec-12 Mar-13 Jun-13 Sep-13
Buy Trading Buy Neutral Trading Sell Sell Restricted Dropped Coverage
Page 39 of 73

FOR IMPORTANT DISCLOSURE INFORMATION, INCLUDING DISCLOSURES RELATED TO THE U.S. DISTRIBUTOR OF THIS REPORT, PLEASE REFER TO THE FINAL PAGES OF THIS REPORT - Please refer to the final pages of this report for important disclosures, analyst certifications and additional information. Espirito Santo Investment Bank does and seeks to do business with companies covered in its research reports. As a result, investors should be aware that the firm may have a conflict of interest that could affect the objectivity of this report. Investors should consider this report as only a single factor in making their investment decision. This research report has been prepared in whole or in part by research analysts based outside the US who are not registered/qualified as research analysts with FINRA (v1.0.5.2)
COVERAGE INITIATION
India | Cement | Large Cap | 20-September-2013
Ambuja Cements
Minority concerns overdone
ACEM offers best in class operating metrics thanks to its high exposure
to the trade segment, highest percentage of blended mix (of the
companies we cover) and efficient operational/logistics systems. We
see further scope for improvement as it focuses on cost-saving
initiatives. We see ACEM’s expansion into North/Central India as
encouraging and complementary to ACC’s existing facilities. While the
HIPL-ACEM transaction has raised some eyebrows (especially on the
Rs35bn cash payment to Holcim), from a long-term perspective we
think the deal is favourable for ACEM’s minority shareholders. The
transaction remains subject to regulatory/shareholder approvals, so we
currently do not incorporate it into our FV. We initiate coverage on
Ambuja Cements with a BUY rating and FV of Rs 206/share.
HIPL-ACEM transaction: minority concerns look overdone
We think the HIPL-ACEM merger transaction is neutral in terms of the price paid
for the stake in Holcim India Private Limited (HIPL) (figure 139-141). While the
transaction is earnings dilutive in the near term, we think consensus and media
concerns are overdone as both have overlooked the potential synergy gains, with
the merger set to give ACEM a pan-India foothold and a presence in two premium
brands. Importantly, the transaction implies an attractive EV/T at US$115, at a
sharp discount to 1) the Ultratech-Jaypee deal at US$124 (with sub optimal ratios)
or 2) greenfield cost of US$130-140. Besides, the issuance of new shares to Holcim
at an EV/T of US$153 implies a sharp premium to the implied valuation for the
50.01% stake in ACC (implied EV/T of US$115). With the Land Acquisition Bill now
an act, we think the cost of setting up a cement plant will only increase, thereby
raising entry barriers. Based on the SEBI’s recent circular (4 Feb 2013), both legs
of the transaction are subject to approval of the majority of the minority
shareholders (exhibit 1 and 2).
Gaining exposure in the right regions; complementary to ACC
Post its 0.6MT expansion at Bhatpara (Chhattisgarh), ACEM is set for further
expansion in the Eastern region at Sankrail (a 0.8MT grinding unit) by CY14, and
also plans to set up a 2.17MT clinker (1.5mt cement plant) in Rajasthan and
associated grinding plants of 1.5MT each in Dadri (UP) and Osara (MP) by CY15-
16E. We think the company’s incremental exposure to the North is the right
strategic move given Ambuja’s high capacity utilization in the North. Post
expansion, ACEM’s capacity will stand at 33.5MT. Further, ACEM’s current
capacity/expansion plans have limited overlap with ACC’s capacities, which bodes
well from a market positioning/pan India perspective for both companies.
Best in class operating metrics; further cost/synergy gains expected
ACEM has best in class operating metrics thanks to high exposure to the retail
segment and flexible & efficient logistics. We believe the proposed HIPL-
ACEM transaction is favourable for ACEM’s minority shareholders from a long-
term investment horizon perspective and therefore we would recommend
ACEM’s minority shareholders accept the merger terms.
Initiate with a BUY & FV of Rs206; Post HIPL-ACEM merger FV of Rs198
We value ACEM’s cement operations at 9x CY14 EV/EBITDA (10% discount to
UTCEM). Given pending approvals, we do not factor in the impact of the
transaction and initiate with a BUY and FV of Rs206/share. Even post the
HIPL-ACEM deal, we expect ACEM’s BS to be net cash thanks to its strong
cash flow profile.
Taking exposure in right regions; complementary to ACEM’s positioning
Post 0.6MT expansion at Bhatpara (Chattisgarh), ACEM eyes further
Accounting & corporate governance AMBER
Franchise Strength GREEN
Earnings Momentum AMBER
BUY 14% upside
Fair Value Rs206.00
Bloomberg ticker ACEM IN
Share Price Rs180.00
Market Capitalisation Rs276,840.00m
Free Float 50%
INR m Y/E 31-Dec 2011A 2012A 2013E 2014E
P/E (x) 22.5 21.3 19.4 15.1
P/BV (x) 3.4 3.1 2.9 2.6
EV/EBITDA (x) 12.5 9.6 11.2 7.7
EBITDA margin 23% 26% 22% 28%
Net Debt / EBITDA (1.5) (1.6) (2.0) (1.9)
ROE 15% 15% 15% 17%
Op. RoIC 19% 23% 19% 26%
Net Gearing (x) (0.4) (0.4) (0.4) (0.5)
Y/E 31-Dec 2011A 2012A 2013E 2014E
Revenue 84,568 96,415 95,105 104,844
EBITDA 19,770 24,730 21,049 28,999
EBIT 15,319 19,078 15,116 22,833
Net Income 12,289 12,971 14,236 18,331
All share price data as at close on 18-Sep-2013
Source: Espirito Santo Investment Bank Research, Company
Data, Bloomberg
80
85
90
95
100
105
110
115
Oct 2012
Nov 2012
Dec 2012
Jan 2013
Feb 2013
Mar 2013
Apr 2013
May 2013
Jun 2013
Jul 2013
Aug 2013
Sep 2013
ACEM IN vs BSE500 Index
Share Price Performance
Analysts Ritesh Shah +91 22 4315 6831 [email protected] Espirito Santo Securities India Private Limited Anshuman Atri +91 22 4315 6825 [email protected] Espirito Santo Securities India Private Limited
Page 40 of 73

Page 2 of 10
Source: Espirito Santo Investment Bank Research for estimates, Company Data, * December ending company
Valuation Metrics CY11A CY12A CY13E CY14E
Recommendation: BUY P/E (x) 22.5 21.3 19.4 15.1
Fair Value (*): Rs 206 P/BV (x) 3.4 3.1 2.9 2.6
EV/EBITDA (x) 12.5 9.6 11.2 7.7
Share Price: Rs 180 EV/Sales (x) 2.9 2.5 2.5 2.1
Upside / Downside 14%
3 Month ADV ($m) 9.5 Key ratios CY11A CY12A CY13E CY14E
Free Float 50%
52 Week High / Low INR 163 - 221 EBITDA margin 23.4% 25.6% 22.1% 27.7%
EBIT margin 18.1% 19.8% 15.9% 21.8%
Bloomberg: ACEM IN Net Debt / EBITDA -1.5 -1.6 -2.0 -1.9
EBIT / Net Interest 29.1 25.2 24.7 37.3
* FV - on pre HIPL - ACEM merger ROE 15.2% 14.7% 14.9% 17.0%
Op. RoIC 18.7% 23.3% 18.5% 26.4%
Shares In Issue (mn) 1,538 Net Gearing (x) -0.4 -0.4 -0.4 -0.5
Market Cap (Rs mn) 276,822
Net Debt (Rs mn) (41,201)
Enterprise Value (Rs mn) 235,621 P&L Summary CY11A CY12A CY13E CY14E
Revenue 84,568 96,415 95,105 104,844
Forthcoming Catalysts: % change 14.4% 14.0% -1.4% 10.2%
Compat verdict on CCI penalty levied on Ambuja EBITDA 19,770 24,730 21,049 28,999
Timely completion of ~5mt expansion plans % change 8.4% 25.1% -14.9% 37.8%
Implementation of AFR & WHR Cost reduction projects % margin 23.4% 25.6% 22.1% 27.7%
Depreciation & Amortisation 4,452 5,652 5,933 6,166
EBIT 15,319 19,078 15,116 22,833
Espirito Santo Securities Analyst % change 6.6% 24.5% -20.8% 51.0%
Ritesh Shah % margin 18.1% 19.8% 15.9% 21.8%
022- 4315 6831 Operating Profit 15,319 19,078 15,116 22,833
[email protected] Net Financials 526 757 612 612
Other Pre-tax Income 2,479 3,489 4,500 3,967
Espirito Santo Securities Analyst Pre Tax Profit 17,271 21,810 19,004 26,188
Anshuman Atri Income Tax Expense 4,740 6,048 4,768 7,856
022- 4315 6825 Associates - - - -
[email protected] Minority Interests - - - -
Exceptional Item (243) (2,791) - -
Shareholding Pattern Net Income 12,289 12,971 14,236 18,331
ESIB Net Income 12,289 12,971 14,236 18,331
Reported EPS 8.02 8.43 9.26 11.92
ESIB EPS 8.02 8.43 9.26 11.92
Shares in issue (Millions) 1,532 1,538 1,538 1,538
Cash Flow Summary CY11A CY12A CY13E CY14E
Operating EBIT 15,319 19,078 15,116 22,833
Add: Depreciation 4,452 5,652 5,933 6,166
Less: Cash Tax 4,147 7,001 4,768 7,856
Less: Increase in Working Capital (3,310) (1,956) 1,269 (1,696)
Operating Cash Flow 18,933 19,685 15,013 22,838
Less: Capex 5,600 2,744 10,000 7,000
Market Mix (%) - CY12 Free Cash Flow 13,333 16,941 5,013 15,838
Less: Increase in Investments 5,228 1,557 - -
Less: Other Net Assets (444) 25 - -
Add: Other Income 2,236 697 4,500 3,967
Add: Increase in Debt (222) (82) - -
Add: Increase in Equity 799 826 - -
Less: Interest Paid 526 757 612 612
Less: Dividend 5,703 6,448 6,448 6,448
Change in Cash 5,133 9,595 2,452 12,745
Balance Sheet Summary CY11A CY12A CY13E CY14E
Cash & Equivalents 28,380 37,976 40,427 53,172
Return ratios Tangible Fixed Assets 61,865 58,624 56,691 53,525
CWIP 4,868 5,201 11,201 15,201
LT Investments 954 1,120 1,120 1,120
LT Loans & Advances 4,769 6,159 6,159 6,159
Other Assets 321 394 394 394
Non-Cash Working Capital (13,380) (15,336) (14,068) (15,763)
Total Assets 87,776 94,137 101,925 113,809
Interest Bearing Debt 428 346 346 346
Deferred Tax Liability 6,436 5,483 5,483 5,483
Other Liabilities 217 258 258 258
Shareholders' Equity 80,694 88,051 95,839 107,722
Total Equity & Liability 87,776 94,137 101,925 113,809
Net Debt (28,906) (38,749) (41,201) (53,946)
Ambuja Cements
Promoter,
50.6%FII, 28.7%
DII, 10.2%
Others,
10.5%
North,
41%
East, 20%
South &
West, 39%
Exports,
1%
0.0%
5.0%
10.0%
15.0%
20.0%
25.0%
30.0%
CY11A CY12A CY13E CY14E
ROE Op. RoIC
Page 41 of 73
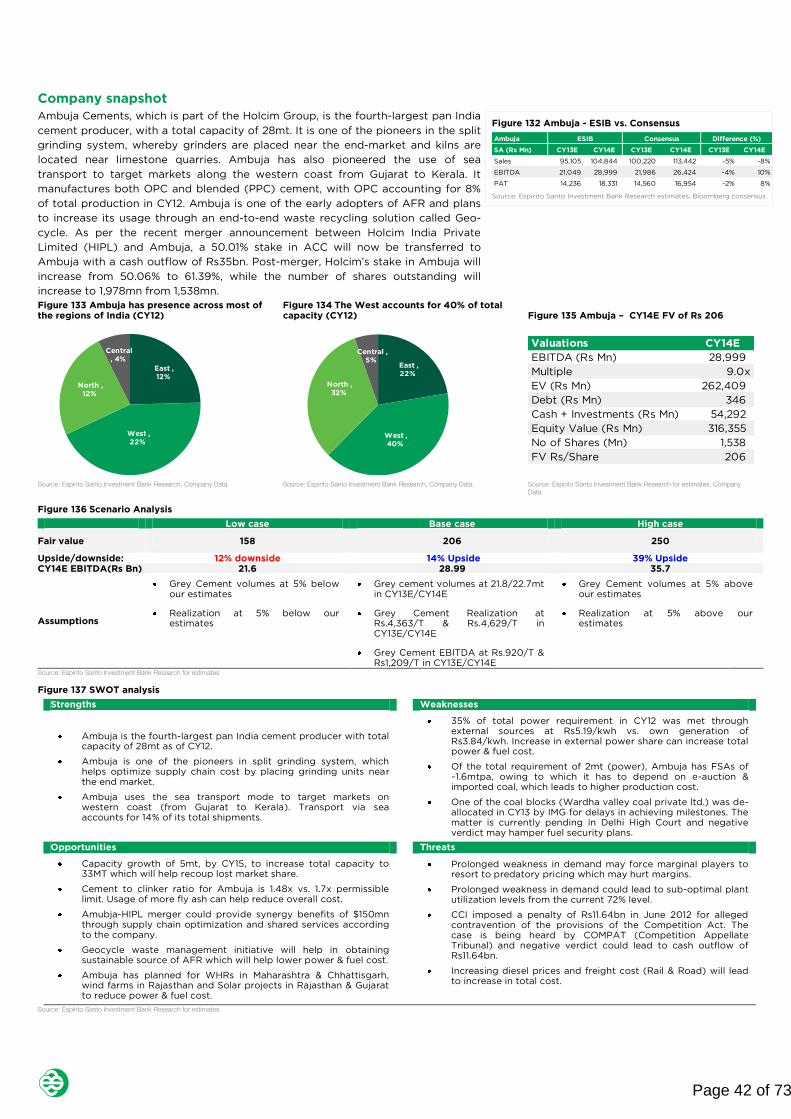
Page 3 of 10
Figure 132 Ambuja - ESIB vs. Consensus
Source: Espirito Santo Investment Bank Research estimates, Bloomberg consensus
Ambuja
SA (Rs Mn) CY13E CY14E CY13E CY14E CY13E CY14E
Sales 95,105 104,844 100,220 113,442 -5% -8%
EBITDA 21,049 28,999 21,986 26,424 -4% 10%
PAT 14,236 18,331 14,560 16,954 -2% 8%
ESIB Consensus Difference (%)
Company snapshot
Ambuja Cements, which is part of the Holcim Group, is the fourth-largest pan India
cement producer, with a total capacity of 28mt. It is one of the pioneers in the split
grinding system, whereby grinders are placed near the end-market and kilns are
located near limestone quarries. Ambuja has also pioneered the use of sea
transport to target markets along the western coast from Gujarat to Kerala. It
manufactures both OPC and blended (PPC) cement, with OPC accounting for 8%
of total production in CY12. Ambuja is one of the early adopters of AFR and plans
to increase its usage through an end-to-end waste recycling solution called Geo-
cycle. As per the recent merger announcement between Holcim India Private
Limited (HIPL) and Ambuja, a 50.01% stake in ACC will now be transferred to
Ambuja with a cash outflow of Rs35bn. Post-merger, Holcim’s stake in Ambuja will
increase from 50.06% to 61.39%, while the number of shares outstanding will
increase to 1,978mn from 1,538mn.
Figure 133 Ambuja has presence across most of
the regions of India (CY12)
Figure 134 The West accounts for 40% of total
capacity (CY12)
Figure 135 Ambuja – CY14E FV of Rs 206
Source: Espirito Santo Investment Bank Research, Company Data Source: Espirito Santo Investment Bank Research, Company Data Source: Espirito Santo Investment Bank Research for estimates, Company
Data
Figure 136 Scenario Analysis
Low case Base case High case
Fair value 158 206 250
Upside/downside: 12% downside 14% Upside 39% Upside
CY14E EBITDA(Rs Bn) 21.6 28.99 35.7
Assumptions
Grey Cement volumes at 5% below our estimates
Realization at 5% below our estimates
Grey cement volumes at 21.8/22.7mt in CY13E/CY14E
Grey Cement Realization at Rs.4,363/T & Rs.4,629/T in CY13E/CY14E
Grey Cement EBITDA at Rs.920/T & Rs1,209/T in CY13E/CY14E
Grey Cement volumes at 5% above our estimates
Realization at 5% above our estimates
Source: Espirito Santo Investment Bank Research for estimates
Figure 137 SWOT analysis
Strengths Weaknesses
Ambuja is the fourth-largest pan India cement producer with total capacity of 28mt as of CY12.
Ambuja is one of the pioneers in split grinding system, which helps optimize supply chain cost by placing grinding units near the end market.
Ambuja uses the sea transport mode to target markets on western coast (from Gujarat to Kerala). Transport via sea accounts for 14% of its total shipments.
35% of total power requirement in CY12 was met through external sources at Rs5.19/kwh vs. own generation of Rs3.84/kwh. Increase in external power share can increase total power & fuel cost.
Of the total requirement of 2mt (power), Ambuja has FSAs of ~1.6mtpa, owing to which it has to depend on e-auction & imported coal, which leads to higher production cost.
One of the coal blocks (Wardha valley coal private ltd.) was de-allocated in CY13 by IMG for delays in achieving milestones. The matter is currently pending in Delhi High Court and negative verdict may hamper fuel security plans.
Opportunities Threats
Capacity growth of 5mt, by CY15, to increase total capacity to 33MT which will help recoup lost market share.
Cement to clinker ratio for Ambuja is 1.48x vs. 1.7x permissible limit. Usage of more fly ash can help reduce overall cost.
Amubja-HIPL merger could provide synergy benefits of $150mn through supply chain optimization and shared services according to the company.
Geocycle waste management initiative will help in obtaining sustainable source of AFR which will help lower power & fuel cost.
Ambuja has planned for WHRs in Maharashtra & Chhattisgarh, wind farms in Rajasthan and Solar projects in Rajasthan & Gujarat to reduce power & fuel cost.
Prolonged weakness in demand may force marginal players to resort to predatory pricing which may hurt margins.
Prolonged weakness in demand could lead to sub-optimal plant utilization levels from the current 72% level.
CCI imposed a penalty of Rs11.64bn in June 2012 for alleged contravention of the provisions of the Competition Act. The case is being heard by COMPAT (Competition Appellate Tribunal) and negative verdict could lead to cash outflow of Rs11.64bn.
Increasing diesel prices and freight cost (Rail & Road) will lead to increase in total cost.
Source: Espirito Santo Investment Bank Research for estimates
East ,
12%
West ,
22%
North ,
12%
Central
, 4%
Market Share
East ,
22%
West ,
40%
North ,
32%
South ,
0%
Central ,
5%
Capacity Breakup (%)
Valuations CY14E
EBITDA (Rs Mn) 28,999
Multiple 9.0x
EV (Rs Mn) 262,409
Debt (Rs Mn) 346
Cash + Investments (Rs Mn) 54,292
Equity Value (Rs Mn) 316,355
No of Shares (Mn) 1,538
FV Rs/Share 206
CMP (Rs/Share) 180
% Upside/ (Downside) 14%
Page 42 of 73

Page 4 of 10
Figure 138 Ambuja (ACEM/ACL) merger
transaction details
Source: Espirito Santo Investment Bank Research, Company Data
HIPL – ACEM transaction details: Minority concerns look overdone
The board of Ambuja Cement (ACEM) has approved its merger with Holcim
India Private Limited (HIPL). As per the merger announcement, the transaction
will be carried out in two parts. First, Ambuja Cements will purchase a 24%
stake in HIPL for a consideration of Rs35bn. Second, Ambuja will issue 58.4m
shares to Holcim (foreign parent). HIPL currently holds a 9.76% stake in
Ambuja Cements & 50.01% stake in ACC Limited and therefore ACC will
become a subsidiary of ACEM. As per SEBI’s recent circulars, the draft
schemes of arrangement are interdependent transactions and hence approval
of both legs of the transaction is now connected. This should help allay
investor concerns over Holcim drawing out Rs35bn cash from ‘Ambuja’
without shareholder approvals. We think the merger transaction is neutral for
Ambuja in terms of the price paid for the stake in HIPL. While the proposed
transaction will be earnings dilutive in the near term, we think the transaction
offers additional benefits through potential synergy gains for long-term
investors.
On a per share basis, our calculation indicates ACEM minority shareholders will
face 1) a cash loss (Rs23/share); and 2) dilution impact (Rs43/share), which
should be partly offset by 3) a gain of Rs58/share on account of the merger.
This translates into a negative per share impact of ~Rs7/share. Our calculation
does not factor in the proposed Rs9bn of synergy gains over two years.
Whilst it’s a short-term negative for Ambuja’s shareholders, we think the
Street has overlooked the potential synergy gains (US$150m), pan India
foothold (access to complementary geographies) and presence in two
premium brands. Importantly, the transaction implies an attractive EV/T at
US$115, at a sharp discount to 1) the Ultratech-Jaypee deal at US$124 (with
sub-optimal ratios, operating margins at 5%) or 2) greenfield cost of US$130-
140 or 3) ACC’s average historical trading multiples at US$124-126 EV/T; or 4)
existing trading multiples of Indian larger peers at US$112-132. Besides, the
issuance of new ACEM shares to Holcim at EV/T of US$153 implies a sharp
premium to the implied US$115 EV/T valuation for the 50.01% stake in ACC.
With the Land Acquisition Bill now in force, we think the cost of setting up a
cement plant will only increase and consequently the barriers to entry will also
rise.
Figure 139 Price paid for stake in HIPL is in line
with SOTP of HIPL’s % stake in Ambuja & ACC
Figure 140 HIPL-ACEM: 2 step transaction
process
Figure 141 HIPL & ACEM merger dilutive in near
term
Source: Espirito Santo Investment Bank Research for estimates, Company
Data
Source: Espirito Santo Investment Bank Research, Company Data Source: Espirito Santo Investment Bank Research, Company Data
Synergy gains likely to be substantial; strong cash flow to see balance sheet
stay net cash
As per management, the proposed merger would unlock potential synergy
gains worth US$150m. Supply chain optimization through clinker / cement
swaps and corresponding lower lead distances could translate into cost
savings of US$60-70m. Further, management expects targeted fixed cost
reduction and shared services like common procurement, etc. to yield another
US$70-80m by CY15-16. Our estimates currently do not capture any of the
aforementioned benefits and consequently these benefits, if they materialize,
pose upside risk to our estimates.
Company ACC Ambuja
No of Shares (Mn) 188 1,538
Share Price (Rs/Share) - [24-Jul-2013] 1,231 191
Market Cap (Rs Mn) 231,108 293,893
Holcim's Stake (%) 50.01% 50.55%
Holcim India's Stake 50.01% 9.76%
Value of Holcim India's Stake (Rs Mn) 115,577 28,684
Total (Rs Mn) 144,261
Number of Shares (Mn) 5,690
Per Share Value (Rs) 25.35
Transaction
Step 1.
Ambuja Purchases 24% stake in Holcim India (Mn) 1,366
Price Paid (Rs/Share) 25.63
(a) Value (Rs Mn) 35,003
Step 2.
Merge Holcim India with Ambuja
Swap Ratio Ambuja: HIPL of 1:7.4
Number of Shares issued (Mn) 584
(b) Value (Rs Mn) 111,682
Total Transaction Value (Rs Mn) = (a) + (b) 146,685
No Ambuja Shares Post Merger (Mn) 1,978
Accrual to Minority Holders
Cash loss due to 24% buyout (Rs/Share) (22.8)
Gain from merger of ACC (Rs/Share) 58.4
Loss from dilution of Ambuja shares (Rs/Share) (42.5)
Net Gain/(Loss) per share (Rs) (6.8)
Page 43 of 73

Page 5 of 10
Figure 142 ACEM FV at Rs198/share, if the
transaction goes through
Source: Espirito Santo Investment Bank Research for estimates, Company Data
Valuations - CY14E Ambuja ACC
EBITDA (Rs Mn) 28,999 25,055
% Ownership 100% 50.01%
Attributable EBITDA 28,999 12,530
Multiple 9.0x 9.0x
EV (Rs Mn) 262,409 113,384
Debt (Rs Mn) 346 1,652
Cash + Investments (Rs Mn) 54,292 38,519
Net Debt (Rs Mn) (53,946) (36,867)
Attributable Net Debt (Rs Mn) (53,946) (18,437)
Less: Transaction outgo 35,000 -
Net Debt (Rs Mn) (18,946) (18,437)
Equity Value (Rs Mn) 281,355 131,821
Holding Discount (%) 17%
Equity Value (Rs Mn) 281,355 109,411
No Share (Mn) 1,978
FV (Rs/Share) 198
When it announced the proposed transaction, HOLCIM management re-
iterated its commitment to India, citing its investments in the 4.5MT Marwar
Mundwa project (Board approval still pending) and it intends to invest up to
Rs30bn to acquire incremental ownership in ACC. We note that the work at
the proposed Marwar Mundwa project has already started, with EC clearances
secured, associated limestone mine ready and land acquisition progressing in
full swing. Further, the ordering processing is expected to begin once the
company receives board approval. On the proposed incremental acquisition
into ACC, at present we don’t read much into it although based on this we see
a possibility that ACC could eventually be merged into ACEM. In fact,
Ambuja’s recent presentation clearly mentions this possibility, stating that the
company intends to “evaluate full merger of operating companies into a
culturally unified company”.
With current cash on books expected to fund the first phase of the
transaction, we expect ACEM to rely on its cash flow to fund its growth capex.
We expect ACEM to generate cumulative OCF of Rs37.8bn over the next two
years, which should be enough to cover its growth capex (Rs17bn) and enable
the company maintain its net cash position (Rs53.9bn, CY15e).
Shareholder approval a must; either case a win-win scenario in our view
Whilst, the proposed HIPL-ACEM merger requires several approvals (see
Exhibit 3 below), we think the most crucial would be the shareholders’
approval requiring a majority of the minority vote. As per SEBI’s recent
circulars, it’s clear that the draft schemes of arrangement are interdependent
transactions and hence both legs of the transaction are now connected.
Furthermore, SEBI’s recent circular dated 21 May 2013 (Exhibit 1) states that a
majority of minority votes is required for the transaction to go through. In
addition, as per a proviso under the Companies Act: 1) the approval of a
majority of persons representing “3/4th
in value” is also required for the
transaction to go through. ACEM‘s promoters’ shareholding stands at 50.55%,
FII’s 28.7% and DII’s at 10.11%. With the presence of several long-term high
quality investors on its holders list, we see little risk that the transaction will
not go through.
Exhibit 1: Extracts from SEBI circular pointing to majority of minority vote
“Such Schemes shall also provide that the Scheme shall be acted upon only if
the votes cast by the public shareholders in favour of the proposal are more
than the number of votes cast by the public shareholders against it. The term
'public' shall carry the same meaning as defined under Rule 2 of Securities
Contracts (Regulation) Rules, 1957.”
Exhibit 2: Extracts from Companies Act
“(6) Where, at a meeting held in pursuance of sub-section (1), majority of
persons representing three-fourths in value of the creditors, or class of creditors
or members or class of members, as the case may be, voting in person or by
proxy or by postal ballot, agree to any compromise or arrangement and if
such compromise or arrangement is sanctioned by the Tribunal by an order,
the same shall be binding on the company, all the creditors, or class of
creditors or members or class of members, as the case may be, or, in case of a
company being wound up, on the liquidator and the contributories of the
company.”
Exhibit 3: list of approvals required for the transaction to go through
Shareholders and creditors of Ambuja and Holcim India
BSE Limited and National Stock Exchange of India Limited
Securities and Exchange Board of India (SEBI)
Foreign Investment Promotion Board (FIPB), India
Jurisdictional High Courts at Delhi and Gujarat
Page 44 of 73

Page 6 of 10
What if the transaction goes through?
We believe the proposed HIPL-ACEM transaction is favourable for ACEM’s
minority shareholders with a long-term investment horizon and therefore we
would recommend ACEM’s minority shareholders accept the merger terms. If
the merger is successful and we incorporated the transaction into our model,
on current calculations our FV would be Rs198/share (see the previous figure).
Source: Espirito Santo Investment Bank Research for estimates
Parameter Traffic signal Reasons
Accounting &
governance
AMBER
In February 2013, ACEM passed a resolution to increase royalty rates to 1% till CY14 (vs. 0.67% earlier).
This was despite the majority of shareholders voting against an increase in royalty rates. Several of
ACEM’s existing board members holding the title of Independent Director have been in the position for
more than 10 years. We think this long association this could raise concerns about their independence.
Franchise strength GREEN
ACEM, which is part of Holcim Group, is the 4th largest pan India cement producer. ACEM offers best in
class operating metrics with its high exposure to trade segment, highest percentage of blended mix
and efficient operational/logistic systems. If the proposed HIPL- ACEM transaction goes through, ACEM
with 50% stake in ACC will have pan India presence and have scope to realize potential synergy gains.
ACEM enjoys a strong ex
Earnings
momentum AMBER
Tepid cement demand growth in the past 6 months (~3.3%) has resulted in downward revision in India
demand expectation for FY14E at ~6% vs. 9.3% in FY13. This has resulted in downward revision in
growth rates for companies and street expects ACEM to have muted growth in FY14, which has led to
earnings downgrades.
Page 45 of 73

Page 7 of 10
Valuation Methodology
We value ACEM’s cement operations at 9x CY14 EV/EBITDA (10% discount to
UTCEM).
Risks to Fair Value
CCI Penalty: CCI imposed a penalty of Rs11.6bn on Ambuja in June
2012, for alleged contravention of the provisions of competition act.
The case is being heard by COMPAT (Competition Appellate Tribunal)
and a negative verdict would lead to a cash outflow to the tune of
imposed penalty.
HIPL & ACEM proposed merger: If the merger is successful and we
incorporated the transaction into our model, our current CY14E FV
drops to Rs198/share (from Rs206). With synergy benefits expected
from CY15/16 onwards, the impact of any cash outflow would more
pronounced in the near term.
Sand mining ban: Sand is an essential ingredient in concrete. Owing
to rampant sand mining without regulatory approvals, National Green
Tribunal (NGT) has called for a mining ban across all rivers in India. A
further stringent set of rules will negatively impact cement demand.
Captive block (de)/allocation: coal blocks allotted to Ambuja have
been de-allocated for lack of progress and the matter is pending in
the high courts of the respective jurisdictions. In the event of a
favorable outcome, the power costs for associated power plants
could fall by 2/3rd
(to Rs1-1.2/kwh)
o Ambuja: The Ministry of Coal has de-allocated Wardha Valley
Coal Field Pvt. Ltd.’s (Ambuja’ stake at 27.27%) coal block in
the state of Maharashtra. The company has filed a writ in the
High Court of Delhi and it is under review.
External limestone purchase: Cost of external purchased limestone is
4x that from own quarry. 5% substitution of own limestone by
external sources could increase per tonne costs by Rs19. A 5%
substitution would result in a Rs19/t increase in costs.
Increase in Freight rates: Cement is largely transported by road & rail
modes. Taking a producer with 50% rail/road transport mode and
average lead distance of 520kms, a 5% increase in rail freight would
result in a Rs18/t cement cost while a 5% increase in road freight
would increase costs by Rs29/t.
Increase in external power purchase: The cost of external power is
~35% higher than that of own power. Ambuja depends on external
power sources to the tune of 35%. A 5% substitution of own power by
external means would result in per tonne cost increase by Rs6.
Increase in coal & pet coke rates: Owing to limited coal linkages,
most cement producers are dependent on e-auction and imported
coal. A 5% rise in kiln coal cost would increase per tonne costs by
Rs29.
Sharp drop in demand: Our estimates factor 5.9% & 8.3% growth in
FY14E & FY15E respectively. A sharp drop in demand is a risk to our
volume estimates for Ambuja.
Prolonged price war: New entrants could resort to price wars to gain
market share. A prolonged price war could result in a sharp drop in
realization in affected region.
Greenfield & brownfield expansion: Ambuja is undertaking various
greenfield & brownfield expansions. Delays in land acquisition &
Page 46 of 73

Page 8 of 10
environmental clearances, inadequate supply of raw materials (like
limestone, linkage coal & fly ash) may hamper expansion plans.
Increase in taxes or levies on Cement: As per CMA, taxes and levies
constitute 60% or more of the ex-factory price. A further increase in
tax rates or levies may impact cement demand.
Increase in technology know-how fee: Ambuja Cements is currently
entitled to pay 1% of net sales as technology know how fee to Holcim.
Royalty rates are subject to revision on a triennial basis and further
increases remain a risk to our FV.
Tax credits and incentives: Cement producers enjoy several tax
credits and incentives for capex under 80IA & subsidy in states like
HP. Withdrawal of these incentives may result in higher effective tax
rates in future.
Please visit our website at www.EspiritoSantoIB.co.uk for up to date recommendation charts.
Ambuja Cements ACEM IN
Report date Recommendation Fair value Share price (INR)
Recommendation history is not available
Source: Bloomberg, Espirito Santo Investment Bank Research
100
120
140
160
180
200
220
240
Sep-10 Dec-10 Mar-11 Jun-11 Sep-11 Dec-11 Mar-12 Jun-12 Sep-12 Dec-12 Mar-13 Jun-13 Sep-13
Buy Trading Buy Neutral Trading Sell Sell Restricted Dropped Coverage
Page 47 of 73
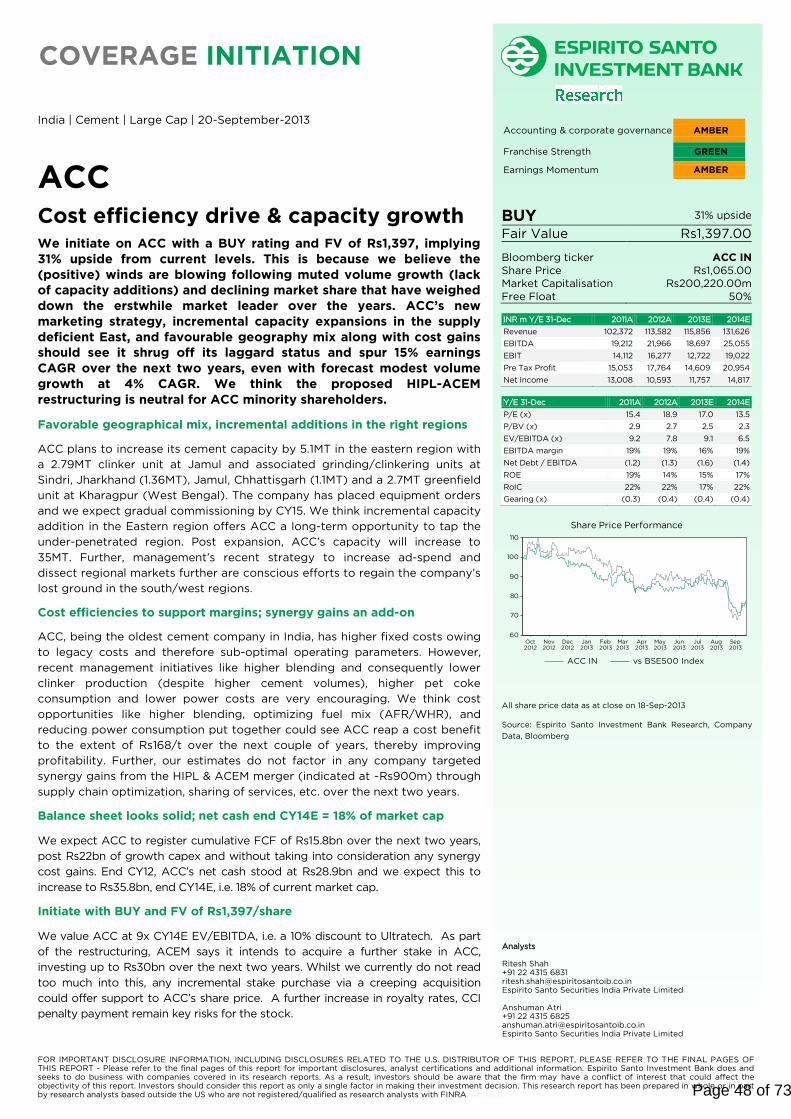
FOR IMPORTANT DISCLOSURE INFORMATION, INCLUDING DISCLOSURES RELATED TO THE U.S. DISTRIBUTOR OF THIS REPORT, PLEASE REFER TO THE FINAL PAGES OF THIS REPORT - Please refer to the final pages of this report for important disclosures, analyst certifications and additional information. Espirito Santo Investment Bank does and seeks to do business with companies covered in its research reports. As a result, investors should be aware that the firm may have a conflict of interest that could affect the objectivity of this report. Investors should consider this report as only a single factor in making their investment decision. This research report has been prepared in whole or in part by research analysts based outside the US who are not registered/qualified as research analysts with FINRA (v1.0.5.2)
COVERAGE INITIATION
India | Cement | Large Cap | 20-September-2013
ACC
Cost efficiency drive & capacity growth
We initiate on ACC with a BUY rating and FV of Rs1,397, implying
31% upside from current levels. This is because we believe the
(positive) winds are blowing following muted volume growth (lack
of capacity additions) and declining market share that have weighed
down the erstwhile market leader over the years. ACC’s new
marketing strategy, incremental capacity expansions in the supply
deficient East, and favourable geography mix along with cost gains
should see it shrug off its laggard status and spur 15% earnings
CAGR over the next two years, even with forecast modest volume
growth at 4% CAGR. We think the proposed HIPL-ACEM
restructuring is neutral for ACC minority shareholders.
Favorable geographical mix, incremental additions in the right regions
ACC plans to increase its cement capacity by 5.1MT in the eastern region with
a 2.79MT clinker unit at Jamul and associated grinding/clinkering units at
Sindri, Jharkhand (1.36MT), Jamul, Chhattisgarh (1.1MT) and a 2.7MT greenfield
unit at Kharagpur (West Bengal). The company has placed equipment orders
and we expect gradual commissioning by CY15. We think incremental capacity
addition in the Eastern region offers ACC a long-term opportunity to tap the
under-penetrated region. Post expansion, ACC’s capacity will increase to
35MT. Further, management’s recent strategy to increase ad-spend and
dissect regional markets further are conscious efforts to regain the company’s
lost ground in the south/west regions.
Cost efficiencies to support margins; synergy gains an add-on
ACC, being the oldest cement company in India, has higher fixed costs owing
to legacy costs and therefore sub-optimal operating parameters. However,
recent management initiatives like higher blending and consequently lower
clinker production (despite higher cement volumes), higher pet coke
consumption and lower power costs are very encouraging. We think cost
opportunities like higher blending, optimizing fuel mix (AFR/WHR), and
reducing power consumption put together could see ACC reap a cost benefit
to the extent of Rs168/t over the next couple of years, thereby improving
profitability. Further, our estimates do not factor in any company targeted
synergy gains from the HIPL & ACEM merger (indicated at ~Rs900m) through
supply chain optimization, sharing of services, etc. over the next two years.
Balance sheet looks solid; net cash end CY14E = 18% of market cap
We expect ACC to register cumulative FCF of Rs15.8bn over the next two years,
post Rs22bn of growth capex and without taking into consideration any synergy
cost gains. End CY12, ACC’s net cash stood at Rs28.9bn and we expect this to
increase to Rs35.8bn, end CY14E, i.e. 18% of current market cap.
Initiate with BUY and FV of Rs1,397/share
We value ACC at 9x CY14E EV/EBITDA, i.e. a 10% discount to Ultratech. As part
of the restructuring, ACEM says it intends to acquire a further stake in ACC,
investing up to Rs30bn over the next two years. Whilst we currently do not read
too much into this, any incremental stake purchase via a creeping acquisition
could offer support to ACC’s share price. A further increase in royalty rates, CCI
penalty payment remain key risks for the stock.
Accounting & corporate governance AMBER
Franchise Strength GREEN
Earnings Momentum AMBER
BUY 31% upside
Fair Value Rs1,397.00
Bloomberg ticker ACC IN
Share Price Rs1,065.00
Market Capitalisation Rs200,220.00m
Free Float 50%
INR m Y/E 31-Dec 2011A 2012A 2013E 2014E
Revenue 102,372 113,582 115,856 131,626
EBITDA 19,212 21,966 18,697 25,055
EBIT 14,112 16,277 12,722 19,022
Pre Tax Profit 15,053 17,764 14,609 20,954
Net Income 13,008 10,593 11,757 14,817
Y/E 31-Dec 2011A 2012A 2013E 2014E
P/E (x) 15.4 18.9 17.0 13.5
P/BV (x) 2.9 2.7 2.5 2.3
EV/EBITDA (x) 9.2 7.8 9.1 6.5
EBITDA margin 19% 19% 16% 19%
Net Debt / EBITDA (1.2) (1.3) (1.6) (1.4)
ROE 19% 14% 15% 17%
RoIC 22% 22% 17% 22%
Gearing (x) (0.3) (0.4) (0.4) (0.4)
All share price data as at close on 18-Sep-2013
Source: Espirito Santo Investment Bank Research, Company
Data, Bloomberg
60
70
80
90
100
110
Oct 2012
Nov 2012
Dec 2012
Jan 2013
Feb 2013
Mar 2013
Apr 2013
May 2013
Jun 2013
Jul 2013
Aug 2013
Sep 2013
ACC IN vs BSE500 Index
Share Price Performance
Analysts Ritesh Shah +91 22 4315 6831 [email protected] Espirito Santo Securities India Private Limited Anshuman Atri +91 22 4315 6825 [email protected] Espirito Santo Securities India Private Limited
Page 48 of 73

Page 2 of 8
Source: Espirito Santo Investment Bank Research estimates, Company Data and Bloomberg, SHP – June 2013, Segment Revenue – CY12
Valuation Metrics CY11A CY12A CY13E CY14E
Recommendation: BUY P/E (x) 15.4 18.9 17.0 13.5
Fair Value: Rs 1,397 P/BV (x) 2.9 2.7 2.5 2.3
EV/EBITDA (x) 9.2 7.8 9.1 6.5
Share Price: Rs 1065 EV/Sales (x) 1.7 1.5 1.5 1.3
Upside / Downside 31%
3 Month ADV ($m) 6.4 Key ratios CY11A CY12A CY13E CY14E
Free Float 50.0%
52 Week High / Low INR 952 - 1,515 EBITDA margin 18.8% 19.3% 16.1% 19.0%
EBIT margin 13.8% 14.3% 11.0% 14.5%
Bloomberg: ACC IN Net Debt / EBITDA -1.2 -1.3 -1.6 -1.4
EBIT / Net Interest 14.6 14.2 14.7 22.0
ROE 18.6% 14.4% 14.9% 17.0%
RoIC 21.6% 21.8% 17.1% 21.8%
Shares In Issue (mn) 188 Gearing (x) -0.3 -0.4 -0.4 -0.4
Market Cap (Rs mn) 200,220
Net Debt (Rs mn) (29,689)
Enterprise Value (Rs mn) 170,531 P&L Summary CY11A CY12A CY13E CY14E
Revenue 102,372 113,582 115,856 131,626
Forthcoming Catalysts: % change 20.1% 11.0% 2.0% 13.6%
Compat verdict on CCI penalty levied on ACC EBITDA 19,212 21,966 18,697 25,055
Completion of HIPL & Ambuja merger % change 6.5% 14.3% -14.9% 34.0%
Timeline for 10% buyback by Ambuja post HIPL merger % margin 18.8% 19.3% 16.1% 19.0%
Depreciation & Amortisation 5,100 5,689 5,976 6,033
EBIT 14,112 16,277 12,722 19,022
Espirito Santo Securities Analyst % change -0.3% 15.1% -21.6% 53.1%
Ritesh Shah % margin 13.8% 14.3% 11.0% 14.5%
022- 4315 6831 Operating Profit 14,112 16,277 12,722 19,022
[email protected] Net Financials 969 1,147 865 865
Other Pre-tax Income 1,910 2,633 2,752 2,796
Espirito Santo Securities Analyst Pre Tax Profit 15,053 17,764 14,609 20,954
Anshuman Atri Income Tax Expense 2,155 3,911 3,006 6,286
022- 4315 6825 Associates 110 95 156 151
[email protected] Minority Interests 0 1 1 1
Exceptional Item 0 -3,354 0 0
Shareholding Pattern Net Income 13,008 10,593 11,757 14,817
ESIB Net Income 13,008 10,593 11,757 14,817
Reported EPS 69.3 56.4 62.6 78.9
ESIB EPS 69.3 56.4 62.6 78.9
Shares in issue (Millions) 188 188 188 188
Cash Flow Summary CY11A CY12A CY13E CY14E
Operating EBIT 14,112 16,277 12,722 19,022
Add: Depreciation 5,100 5,689 5,976 6,033
Less: Tax 2,155 3,911 3,006 6,286
Less: Increase in Working Capital 3,027 2,602 (573) (2,858)
Operating Cash Flow 14,031 15,454 16,264 21,627
Less: Capex 4,157 387 11,000 11,000
Segment Revenue (%) Free Cash Flow 9,874 15,067 5,264 10,627
Less: Increase in Investments 276 1,076 - -
Add: Other Income 2,105 (739) 2,908 2,947
Add: Increase in Debt (132) (3,529) - -
Add: Increase in Equity - - - -
Less: Interest Paid 969 1,147 865 865
Less: Dividend 6,110 6,546 6,546 6,546
Change in Cash 4,492 2,031 762 6,164
Balance Sheet Summary CY11A CY12A CY13E CY14E
Cash & Equivalents 28,549 30,579 31,341 37,504
Tangible Fixed Assets 64,071 59,347 54,371 49,338
Return ratios CWIP 3,694 3,116 13,116 23,116
Associates & Financial Investments 5,596 6,671 6,671 6,671
Other Assets 561 1,658 1,658 1,658
Non-Cash Working Capital (18,481) (16,933) (17,506) (20,365)
Total Assets 83,989 84,439 89,651 97,924
Interest Bearing Debt 5,181 1,652 1,652 1,652
Deferred Tax Liability 5,238 5,226 5,226 5,226
Other Liabilities 3,755 3,811 3,811 3,811
Shareholders' Equity 69,791 73,724 78,936 87,207
Minority Interests 25 26 27 28
Total Equity & Liability 83,989 84,439 89,651 97,924
Net Debt (23,368) (28,927) (29,689) (35,852)
ACC
Promoter,
50.3%
FII, 19.5%
DII, 11.7%
Others,
18.6%
0.0%
5.0%
10.0%
15.0%
20.0%
25.0%
CY11A CY12A CY13E CY14E
ROE RoIC
Cement,
94%
RMX, 6%
Page 49 of 73

Page 3 of 8
Figure 143 ACC Cement - ESIB vs. Consensus
Source: Espirito Santo Investment Bank Research for estimates, Bloomberg
ACC
Consol (Rs Mn) CY13E CY14E CY13E CY14E CY13E CY14E
Sales 115,856 131,626 118,878 133,668 -3% -2%
EBITDA 18,697 25,055 20,447 24,290 -9% 3%
PAT 11,757 14,817 13,145 15,589 -11% -5%
ESIB Consensus Difference (%)
Company snapshot
ACC, which is part of Holcim Group, is the 3rd largest pan India cement producer with
total capacity of 30.5mt as of CY12 and has a presence across all regions. It is one of the
key RMC producers with total installed capacity of 3 million m3. It manufacturers both
OPC and blended (PPC & PSC) types of cement, with OPC accounting for 13% of total
CY12 production. ACC is one of the early adopters of AFR and plans to increase usage
through an end-to-end waste recycle solution named Geo-cycle. In CY12, RMC business
accounted for 6% of total revenues while grey cement accounted for 94%. As per the
recent merger announcement between Holcim India Pvt Ltd and Ambuja Cement, ACC
will become a subsidiary of Ambuja Cements.
Figure 144 ACC has presence across all regions
- capacity share in CY12
Figure 145 South accounted for 32% of total
capacity in CY12
Figure 146 ACC valuation - CY14 FV of
Rs1,397/Share
Source: Espirito Santo Investment Bank Research, Company Data Source: Espirito Santo Investment Bank Research, Company Data Source: Espirito Santo Investment Bank Research for estimates, Co data
Figure 147 Scenario Analysis
Low case Base case High case
Fair value 1,001 1,397 1,580
Upside/downside: 6% downside 31% Upside 48% Upside
CY14E EBITDA(Rs Bn) 17.6 25.1 28.5
Assumptions
Grey Cement volumes at 5% below our estimates
Realization at 5% below our estimates
Grey cement volumes at 24.3/26.1 mt in CY13E/CY14E
RMC volumes at 1.5 mn m3 in CY13E/CY14E
Grey Cement Realization at Rs.4,493/T & 4,762/T in CY13E/CY14E
Grey Cement EBITDA at Rs.742/T & Rs.939/T in CY13E/CY14E
Realization at 3% above our estimates
Source: Espirito Santo Investment Bank Research for estimates
Figure 148 SWOT analysis
Strengths Weaknesses
ACC is the third largest pan India cement producer with total capacity of 30.5mt as of CY12 and presence across all regions
ACC is one of the key RMC producers with total installed capacity of 3 million m3.
ACC produces all types of cement, with blended (PPC & PSC) accounting for 87% of total production
26% of total power requirement in CY12 was met through external sources at Rs5.36/kwh vs. own generation of Rs4.3/kwh. Increase in external power share can increase total power & fuel cost.
Of the total requirement of 5.5MT (power + kiln), ACC has FSAs of ~3mtpa, owing to which it has to depend on e-auction & imported coal, which leads to higher production cost
One of the coal blocks (Semaria-Piapria) was de-allocated in January 2013 for non-receipt of EC & FC clearance. The matter is currently pending in the High Court of Jabalpur and a negative verdict may hamper fuel security plans
Opportunities Threats
Capacity growth of 5mt, by CY15, to increase total capacity to 35.6mt which will help recoup market share
ACC plans alternative fuels to substitute coal intake by 5% by CY15, which will help lower power & fuel cost
Cement to clinker ratio for ACC is at 1.53x vs. 1.7x permissible limit. Usage of more fly ash can help in reducing overall cost.
Geocycle waste management initiative should help obtain a sustainable source of AFR, which in turn will help lower power & fuel cost
Prolonged weakness in demand may force marginal players to resort to predatory pricing, which may hurt margins
Prolonged weakness in demand could lead to sub-optimal plant utilization levels from the current 79% level
CCI imposed a penalty of Rs11.48bn in June 2012 for alleged contravention of the provisions of the competition act. The case is being heard at COMPAT (Competition Appellate Tribunal) and a negative verdict would lead to cash outflow of Rs11.48bn.
Increasing diesel prices and freight cost (Rail & Road) will lead to increase in total costs. Rail and road together account for 100% of its freight modes.
Source: Espirito Santo Investment Bank Research for estimates
East ,
12%
West ,
8%
North ,
8%
South ,
7%
Central
, 11%
Market Share
East ,
20%
West ,
13%
North ,
20%
South ,
32%
Central ,
15%
Capacity Breakup (%) Valuations CY14E
EBITDA (Rs Mn) 25,055
Multiple 9.0x
EV (Rs Mn) 225,495
Debt (Rs Mn) 1,652
Cash + Investments (Rs Mn) 38,519
Equity Value (Rs Mn) 262,362
No of Shares (Mn) 188
FV Rs/Share 1,397
Page 50 of 73

Page 4 of 8
Parameter Traffic signal Reasons
Accounting &
governance
AMBER
In February 2013, ACEM passed a resolution to increase royalty rates to 1% till CY14 (vs.
0.67% earlier). This was despite the majority of minority shareholders voting against an
increase in royalty rates. Several of ACEM’s existing board members holding the title of
Independent Director have been in the position for more than 10 years. We think this long
association this could raise concerns about their independence.
Franchise
strength GREEN
ACC, which is part of Holcim Group, is the 3rd largest pan India cement producer with
total capacity of 30.5mt as of CY12. It is also one of the key RMC producers. ACC has
been an innovator and early adopter of AFR. Muted volume growth and declining market
share have over the years weighed down the erstwhile market leader. However, we think
incremental expansion plans and cost saving measures will see the company back on an
even footing. As per the recent merger announcement between Holcim India Pvt Ltd and
Ambuja Cement, ACC will become a subsidiary of Ambuja Cements.
Earnings
momentum AMBER
Tepid cement demand growth in the past 6 months (~3.3%) has resulted in a downward
revision in India demand expectation for FY14E at ~6% vs. 9.3% in FY13. This has resulted
in some downward revisions in consensus growth rates for companies and street expects
ACC to have muted growth in CY13, which has resulted in earnings downgrades.
Page 51 of 73

Page 5 of 8
Valuation Methodology
We value ACC at 9x CY14E EV/EBITDA, i.e. a 10% discount to Ultratech.
Risks to Fair Value
CCI Penalty: CCI imposed a penalty of Rs11.5bn on ACC in June 2012,
for alleged contravention of the provisions of the competition act.
The case is being heard at COMPAT (Competition Appellate Tribunal)
and a negative verdict would lead to a cash outflow to the tune of
imposed penalty.
Sand mining ban: Sand is an essential ingredient in concrete. Owing
to rampant sand mining without regulatory approvals, National Green
Tribunal (NGT) has called for a mining ban across all rivers in India. A
further stringent set of rules would negatively impact cement
demand.
Captive block (de)/allocation: coal blocks allotted to ACC have been
de-allocated for lack of progress and the matter is pending in the high
courts of the respective jurisdictions. In the event of a favorable
outcome, power costs for associated power plants could fall by 2/3rd
(to Rs1-1.2/kwh)
o ACC: “Semaria-Piapria” coal block, which was allotted to
Madhya Pradesh State Mining Corporation (MPSMC) & ACC’s
100% subsidiary ACC Mineral Resources Limited (AMRL) in
2009, has been de-allocated owing to limited progress. The
block was expected to produce 0.5mt annually. AMRL’s 49%
stake in the block implies an annual share of 0.25mt or 20%
of the current thermal coal requirement. AMRL has filed a
written petition in the High Court of Jabalpur and this is
under review.
o ACC: AMRL’s other 3 blocks includes, a) Bichapur, b) Marki
Bakra and c) Morga in which it holds a 49% stake. Outputs
from these blocks have not been factored into our estimates
and present an upside risk.
External limestone purchase: Cost of external purchased limestone is
4x that from own quarry. 5% substitution of own limestone by
external sources could increase per tonne cost by Rs2-5.
Increase in Freight rates: Cement is largely transported by road & rail
modes. Taking a producer with 50% rail/road transport mode and
average lead distance of 520kms, a 5% increase in rail freight would
result in a Rs18/t cement cost while a 5% increase in road freight
would increase costs by Rs29/t.
Increase in external power purchase: The cost of external power is
~25% higher than that of own power. ACC depends on external power
sources to the tune of 26%. A 5% substitution of own power by
external means would result in a per tonne cost increase by Rs6.
Increase in coal & pet coke rates: Owing to limited coal linkages,
most cement producers are dependent on e-auction and imported
coal. A 5% rise in kiln coal cost would increase the per tonne cost by
Rs30.
Sharp drop in demand: Our estimates factor 5.9% & 8.3% growth in
FY14E & FY15E respectively. A sharp drop in demand is a risk to our
volume estimates for ACC.
Prolonged price war: New entrants could resort to price wars to gain
market share. A prolonged price war could result in a sharp drop in
realization in affected region.
Page 52 of 73

Page 6 of 8
Greenfield & brownfield expansion: ACC is undertaking various
greenfield & brownfield expansions. Delays in land acquisition &
environmental clearances, inadequate supply of raw materials (like
limestone, linkage coal & fly ash) may hamper expansion plans.
Increase in taxes or levies on Cement: As per CMA, taxes and levies
constitute 60% or more of the ex-factory price. A further increase in
tax rates or levies may impact cement demand.
Increase in technology know-how fee: ACC Cement is currently
entitled to pay 1% of net sales as technology know how fee to Holcim.
Royalty rates are subject to revision on a triennial basis and further
increases remain a risk to our FV.
Tax credits and incentives: Cement producers enjoy several tax
credits and incentives for capex under 80IA & subsidy in states like
HP. Withdrawal of these incentives may result in higher effective tax
rates in future.
Following the restructuring we would note the risk that cash at ACC
may not be optimally utilized – ACC’s current return ratios are
currently 15%+.
Please visit our website at www.EspiritoSantoIB.co.uk for up to date recommendation charts.
ACC ACC IN
Report date Recommendation Fair value Share price (INR)
Recommendation history is not available
Source: Bloomberg, Espirito Santo Investment Bank Research
900
1000
1100
1200
1300
1400
1500
Sep-10 Dec-10 Mar-11 Jun-11 Sep-11 Dec-11 Mar-12 Jun-12 Sep-12 Dec-12 Mar-13 Jun-13 Sep-13
Buy Trading Buy Neutral Trading Sell Sell Restricted Dropped Coverage
Page 53 of 73

FOR IMPORTANT DISCLOSURE INFORMATION, INCLUDING DISCLOSURES RELATED TO THE U.S. DISTRIBUTOR OF THIS REPORT, PLEASE REFER TO THE FINAL PAGES OF THIS REPORT - Please refer to the final pages of this report for important disclosures, analyst certifications and additional information. Espirito Santo Investment Bank does and seeks to do business with companies covered in its research reports. As a result, investors should be aware that the firm may have a conflict of interest that could affect the objectivity of this report. Investors should consider this report as only a single factor in making their investment decision. This research report has been prepared in whole or in part by research analysts based outside the US who are not registered/qualified as research analysts with FINRA (v1.0.5.2)
COVERAGE INITIATION
India | Cement | Small & Mid Cap | 20-September-2013
Shree Cement
Looking East to diversify
Around 5x capacity addition over FY04-12 in record commissioning
timelines along with new benchmarks for capital/operational costs
speaks volumes of management’s capabilities and potential. After
gaining market leadership in the North, it has now set itself a target to
diversify market presence. Shree’s distinct model of using pet coke as a
fuel input in power plants has not only helped to maintain its low
power cost for cement operations but also register healthy profits in
power operations. Cost reduction initiatives like WHR, synthetic
gypsum and zinc slag will continue to help in reducing input costs. We
think management’s proactive approach to cost-saving initiatives and
significant expansion plans will help it join the large capacity league
sooner than later. Though we like Shree’s operational prowess, we
would wait for a more favourable entry point in the stock. Initiate with
a NEUTRAL and FV of Rs4199/share.
Market leadership in North; East on management radar now
We expect Shree to add another 6.5MT in capacity by FY16E in the eastern region
(via the greenfield route). Shree has mastered swift project execution and has set
new industry benchmarks in the commissioning of cement and power plants. We
expect it to maintain a similar track record while adding new capacities in the
eastern region, though required time may be higher owing to the greenfield
nature of the projects. We see its foray into the supply deficient Eastern region as
good news as we believe it will reduce market concentration risk.
Power — not just another segment
Shree Cement’s unique model to use pet coke as a fuel for power plants has
helped it rein in costs and maintain healthy margins (EBITDA/kwh at Rs1.0+).
Availability of captive power at half the grid rates helps the company keep a
tab on fuel costs and is one of the key reasons why its cement EBITDA/t is in
line with large peers. We expect Shree to adopt a similar power strategy for
its new plants in the eastern region to maintain its cost leadership, as power &
fuel costs account for c.20-25% of total input cost for cement firms. With pet
coke expected to remain in surplus in India, we don’t foresee any spike in fuel
costs for the company.
Input cost optimization — a recurring theme
Shree Cement runs one of the largest WHR plants in India, with 46MW
capacity, COP at ~Rs0.5 vs. grid cost at Rs.5-6/kwh. It is also one of the few
companies that utilize low grade limestone as a SO2 filter to produce
synthetic gypsum to maintain stable gypsum costs. Other initiatives include
using zinc slag as a replacement for laterite. We think the management will
continue to seek new avenues (like WHRs), to maintain its competitive cost
structure.
Initiate with NEUTRAL and FV of Rs.4,199/share
We value Shree’s power business via a DCF at Rs369/share and the cement
business at 8.0x (a 20% discount to UTCEM) FY14E EV/EBITDA, i.e. implied 15%
premium to its historical 5-year trading average. We like Shree’s capacity
exposure to high utilization geographies (North/East), high ROE/RoIC ratios with
a robust balance sheet and best in class capital/operational costs. With the stock
having run up 142% in 2 years vs. 21% for BSE Sensex, we find the current valuation
expensive and difficult to justify. Initiate with NEUTRAL and FV of Rs4199/share.
Accounting & corporate governance GREEN
Franchise Strength GREEN
Earnings Momentum AMBER
NEUTRAL 6% upside
Fair Value Rs4,199.00
Bloomberg ticker SRCM IN
Share Price Rs3,964.00
Market Capitalisation Rs137,947.20m
Free Float 25%
INR m Y/E 30-Jun 2012A 2013A 2014E 2015E
Revenue 58,981 55,671 62,599 66,914
EBITDA 16,458 15,378 16,632 18,100
EBIT 7,727 11,022 11,569 12,272
Net Income 6,185 10,040 9,078 9,850
ESIB EPS 178 288 261 283
Y/E 30-Jun 2012A 2013A 2014E 2015E
P/E (x) 22.3 13.8 15.2 14.0
P/BV (x) 5.1 3.6 3.0 2.5
EV/EBITDA (x) 8.4 8.9 7.9 7.0
EBITDA margin 28% 28% 27% 27%
Net Debt / EBITDA 0.1 (0.1) (0.4) (0.7)
ROE 23% 26% 19% 18%
RoIC 15% 19% 18% 18%
Net Gearing (x) 0.0 (0.0) (0.1) (0.2)
All share price data as at close on 18-Sep-2013
Source: Espirito Santo Investment Bank Research, Company
Data, Bloomberg
90
100
110
120
130
140
150
Oct 2012
Nov 2012
Dec 2012
Jan 2013
Feb 2013
Mar 2013
Apr 2013
May 2013
Jun 2013
Jul 2013
Aug 2013
Sep 2013
SRCM IN vs BSE500 Index
Share Price Performance
Analysts Ritesh Shah +91 22 4315 6831 [email protected] Espirito Santo Securities India Private Limited Anshuman Atri +91 22 4315 6825 [email protected] Espirito Santo Securities India Private Limited
Page 54 of 73

Page 2 of 8
Source: Espirito Santo Investment Bank Research Estimates, Company Data and Bloomberg, SHP – June 2013, Segment Revenue – FY13
Valuation Metrics FY12A FY13A FY14E FY15E
Recommendation: NEUTRAL P/E (x) 22.3 13.8 15.2 14.0
Fair Value: Rs 4,199 P/BV (x) 5.1 3.6 3.0 2.5
EV/EBITDA (x) 8.4 8.9 7.9 7.0
Share Price: Rs 3,964 EV/Sales (x) 2.4 2.5 2.1 1.9
Upside / Downside 6%
3 Month ADV ($m) 1.0 Key ratios FY12A FY13A FY14E FY15E
Free Float 25%
52 Week High / Low INR 3,050- 5,210 EBITDA margin 27.9% 27.6% 26.6% 27.0%
EBIT margin 13.1% 19.8% 18.5% 18.3%
Bloomberg: SRCM IN Net Debt / EBITDA 0.1 -0.1 -0.4 -0.7
EBIT / Net Interest 3.3 5.7 13.2 14.0
ROE 22.6% 26.1% 19.4% 17.7%
RoIC 14.9% 19.3% 17.9% 17.5%
Shares In Issue (mn) 35 Net Gearing (x) 0.0 0.0 -0.1 -0.2
Market Cap (Rs mn) 138,095
Net Debt (Rs mn) (11,937)
Enterprise Value (Rs mn) 126,158 P&L Summary FY12A FY13A FY14E FY15E
Revenue 58,981 55,671 62,599 66,914
Forthcoming Catalysts: % change 70.8% -5.6% 12.4% 6.9%
Compat verdict on Rs3.98bn fine imposed by CCI EBITDA 16,458 15,378 16,632 18,100
Timely completion of ~5mt expansion plans % change 86.0% -6.6% 8.2% 8.8%
% margin 27.9% 27.6% 26.6% 27.0%
Depreciation & Amortisation 8,731 4,356 5,063 5,828
EBIT 7,727 11,022 11,569 12,272
Espirito Santo Securities Analyst % change 269.6% 42.6% 5.0% 6.1%
Ritesh Shah % margin 13.1% 19.8% 18.5% 18.3%
022- 4315 6831 Operating Profit 7,727 11,022 11,569 12,272
[email protected] Net Financials 2,354 1,931 880 880
Other Pre-tax Income 1,628 2,114 1,415 1,742
Espirito Santo Securities Analyst Pre Tax Profit 7,001 11,205 12,104 13,134
Anshuman Atri Income Tax Expense 693 1,155 3,026 3,283
022- 4315 6825 Associates - - - -
[email protected] Minority Interests - - - -
Exceptional Item 123 11 - -
Shareholding Pattern Net Income 6,185 10,040 9,078 9,850
ESIB Net Income 6,185 10,040 9,078 9,850
Reported EPS 177.5 288.2 260.6 282.8
ESIB EPS 177.5 288.2 260.6 282.8
Shares in issue (Millions) 34.8 34.8 34.8 34.8
Cash Flow Summary FY12A FY13A FY14E FY15E
Operating EBIT 7,727 11,022 11,569 12,272
Add: Depreciation 8,731 4,356 5,063 5,828
Less: Tax 693 1,155 3,026 3,283
Less: Increase in Working Capital (3,208) 2,829 (2,612) (186)
Operating Cash Flow 18,974 11,394 16,218 15,002
Less: Capex 5,948 7,331 10,000 10,000
Segment Revenue (%) - FY13 Free Cash Flow 13,026 4,063 6,218 5,002
Less: Increase in Investments 356 3,389 - -
Add: Other Income 1,504 2,104 1,415 1,742
Add: Increase in Debt (1,511) (7,782) - -
Add: Increase in Equity - - - -
Add: Other Financials 2,102 1,867 - -
Less: Interest Paid 2,354 1,931 880 880
Less: Dividend 810 810 810 810
Change in Cash 11,602 (5,878) 5,944 5,055
Balance Sheet Summary FY12A FY13A FY14E FY15E
Cash & Equivalents 16,590 10,712 16,656 21,710
Return ratios Tangible Fixed Assets 15,211 18,185 22,122 25,294
CWIP 967 967 1,967 2,967
Goodwill - - - -
Associates & Financial Investments 15,405 18,794 18,794 18,794
Other Assets 697 938 938 938
Non-Cash Working Capital (104) 3,178 566 380
Total Assets 48,766 52,774 61,042 70,083
Interest Bearing Debt 17,556 9,774 9,774 9,774
Deferred Tax Liability - - - -
Other Liabilities 3,871 4,564 4,564 4,564
Shareholders' Equity 27,339 38,437 46,705 55,745
Minority Interests - - - -
Total Equity & Liability 48,766 52,774 61,042 70,083
Net Debt 966 (938) (6,882) (11,937)
Shree Cement
Promoter,
64.8%FII, 8.1%
DII, 5.9%
Others,
21.2%
Cement,
82%
Power,
18%
0.0%
5.0%
10.0%
15.0%
20.0%
25.0%
30.0%
FY12A FY13A FY14E FY15E
ROE RoIC
Page 55 of 73

Page 3 of 8
Figure 149 ESIB vs. consensus
Source: Espirito Santo Investment Bank Research for estimates, Bloomberg
Shree Cement
SA (Rs Mn) FY14E FY15E FY14E FY15E FY14E FY15E
Sales 62,599 66,914 62,697 71,622 0% -7%
EBITDA 16,632 18,100 17,399 19,972 -4% -9%
PAT 9,078 9,850 9,685 11,553 -6% -15%
ESIB Consensus Difference (%)
Company snapshot
Shree Cement is North India's largest cement producer with an installed capacity of
13.5mtpa as of FY12. Its power segment has an installed capacity of 560MW, which
is not only used for cement production but also for external sales. Power sales have
increased 10-fold in the last 4 years to 1,322mu in FY12. Shree Cement has mastered
swift project execution, and has set a national record in setting up cement & power
plants. It is the first company in the world to utilize 100% pet-coke in all its
operations for both cement and power plants. This helps in keeping power costs at
sub Rs2.5/kwh, despite lacking FSAs and captive blocks.
Figure 150 Foray into East is expected to give
9% of capacity market share by FY16E
Figure 151 Grinding capacity expansion is
largely concentrated in Eastern region - FY16E
Figure 152 Shree valuation – FY14E at Rs4199
Source: Espirito Santo Investment Bank Research for estimates Source: Espirito Santo Investment Bank Research for estimates Source: Espirito Santo Investment Bank Research for estimates, Co data
Figure 153 Scenario Analysis
Low case Base case High case
Fair value 3,377 4,199 5,084
Upside/downside: 15% downside 6% Upside 28% Upside
FY14E EBITDA(Rs Bn) 13.2 16.6 20.3
Assumptions
Grey Cement volumes at 5% below our estimates
Power sales volumes at 5% below our estimates
Realization at 5% below our estimates
Grey cement & clinker volumes at 13.9/14.8mt in FY14E/FY15E
Power sales volumes at 2,678/2,602 mu in FY14E/FY15E
Grey Cement Realization at Rs.3,720/T & Rs3,818/T in FY14E/FY15E
Grey Cement EBITDA at Rs.978/T & Rs1,027/T in FY14E/FY15E
Grey Cement volumes at 5% above our estimates
Power sales volumes at 5% above our estimates
Realization at 5% above our estimates
Source: Espirito Santo Investment Bank Research for estimates
Figure 154 SWOT analysis
Strengths Weaknesses
Shree Cement is market leader in Northern region with 18% market share, as of FY13E
560MW of installed power capacity helps in maintaining per unit cost in sub Rs2.5/kwh range
Shree Cement has set national record in project execution. It set up kiln #8 in a record time of 330 days vs. the industry average of 630 days. It set up 150mw power plant in a record 21 months vs. the industry average of 30 months.
Market concentration in North region makes it vulnerable to dynamics of one region
Lack of captive coal block & linkages leaves it vulnerable to external fuel cost fluctuations
Opportunities Threats
Capacity growth of 6.5mt, by FY16E, in Eastern region, will increase total capacity to 20mt which will help diversify markets
Higher sales from power segment which accounted for 18% of total revenues in FY13 will help mitigate seasonality effect of cement business
Implementation of WHR can help reduce overall power cost
Complete reliance on synthetic gypsum can help in reducing raw material uncertainty and reduce cost
Cement to clinker ratio for Shree Cement is at 1.47x vs. 1.7x permissible limit. Usage of higher fly ash to reduce cost.
Prolonged weakness in demand may force marginal players to resort to predatory pricing which may hurt margins
Prolonged weakness in demand can lead to sub-optimal plant utilization levels, below management guidance of 90%
CCI imposed a penalty of Rs3.98bn in June 2012 for alleged contravention of the provisions of the competition act. The case in being heard at COMPAT (Competition Appellate Tribunal) and a negative verdict would lead to a cash outflow of Rs3.98bn.
Increasing diesel prices and freight cost (Rail & Road) will lead to increase in total cost. Rail and road together account for 100% of its freight modes.
Shree Cement's new expansions are greenfield plants which may face execution issues
Source: Espirito Santo Investment Bank Research for estimates
East ,
9%
North ,
16%
Market Share
East ,
33%
North ,
67%
Capacity Breakup (%)Valuations FY14E
NPV Power (Rs Mn) 12,872
EBITDA Cement (Rs Mn) 13,939
Multiple 8.0x
EV (Rs Mn) 111,508
Debt (Rs Mn) 9,774
Cash + Investments (Rs Mn) 31,670
Equity Value (Rs Mn) 146,277
No of Shares (Mn) 35
FV Rs/Share 4,199
Page 56 of 73

Page 4 of 8
Source: Espirito Santo Investment Bank Research for estimates
Figure 155 Power business NPV
Source: Espirito Santo Investment Bank Research for estimates (FY14-33), Company Data
Cashflows FY12 FY13 FY14 FY15 FY16 FY17 FY18 FY19 FY20 FY21 FY22 FY23 FY24 FY25 FY26 FY27 FY28 FY29 FY30 FY31 FY32 FY33 FY34
EBIT (4,131) 1,628 1,214 1,245 1,271 1,302 1,377 1,380 1,383 1,385 1,387 1,388 1,375 1,348 1,320 1,292 1,263 1,234 1,204 1,173 1,142
EBIT After tax (3,428) 1,351 1,008 1,034 1,055 1,081 1,143 1,145 1,148 1,150 1,151 1,152 1,142 1,119 1,096 1,072 1,048 827 806 786 765
EBIT after tax + Depreciation 3,386 2,273 1,956 2,010 2,059 2,112 2,215 2,273 2,330 2,387 2,444 2,500 2,558 2,618 2,677 2,736 2,795 2,655 2,718 2,780 2,841
Less: Capex - (500) (500) (500) (500) (500) (1,000) (1,000) (1,000) (1,000) (1,000) (1,000) (1,000) (1,000) (1,000) (1,000) (1,000) (1,000) (1,000) (1,000) (1,000)
Less: WC - 1,218 517 600 679 762 395 483 570 657 743 829 417 507 596 685 773 681 768 854 1,110
Funds inflow (16,500) - - - -
Free Cashflow (16,500) - 3,386 2,990 1,973 2,110 2,238 2,374 1,610 1,756 1,900 2,044 2,187 2,329 1,975 2,124 2,273 2,421 2,568 2,337 2,486 2,634 2,951
Less: Interest 668 668 650 614 578 542 506 470 434 398 362 326 290
Less: Debt Repayment (7,425) - - - 400 400 400 400 400 400 400 400 400 400 400 400 400 400 400 400 400 400 225
Add: Dividend Received - - - - - - - - - - - - - - - - - - - - -
Net Equity cashflow (9,075) - 2,717 2,322 923 1,096 1,260 1,431 704 885 1,066 1,246 1,425 1,603 1,285 1,724 1,873 2,021 2,168 1,937 2,086 2,234 2,726
Net Equity cashflow to Shree (9,075) - 2,717 2,322 923 1,096 1,260 1,431 704 885 1,066 1,246 1,425 1,603 1,285 1,724 1,873 2,021 2,168 1,937 2,086 2,234 2,726
Discount Rate 12%
FY14 NPV 12,872
Parameter Traffic signal Reasons
Accounting &
governance
GREEN
Using our proprietary model we don’t find anything untoward about the corporate governance practices followed by Shree. Timely disclosures pertaining to segmental volumes for cement & power, expansion plans would be appreciated by the street.
Franchise strength GREEN
Shree has strong project execution skills, which helps it to add capacity in record time. Its low cost of operations helps it achieve similar EBITDA/t as that of large players, despite lower realizations. Owing to strong cash flow generation and balance sheet strength, we expect it to manage its capacity addition largely through internal accruals
Earnings
momentum AMBER
Tepid cement demand growth in the past 6 months (~3.3%) has resulted in downward revision in India
demand expectation for FY14E at ~6% vs. 9.3% in FY13. This has resulted in consensus downward
revisions of growth rates for some companies and street expects Shree to grow at 4% in FY14, which
has resulted in earnings downgrades.
Page 57 of 73

Page 5 of 8
Valuation Methodology
We value Shree’s power business via a DCF at Rs369/share and the cement
business at 8.0x (a 20% discount to UTCEM) FY14E EV/EBITDA, i.e. implied 15%
premium to its historical 5-year trading average.
Risks to Fair Value
CCI Penalty: CCI imposed a penalty of Rs3.98bn on Shree cement in
June 2012, for alleged contravention of the provisions of competition
act. The case is being heard by the COMPAT (Competition Appellate
Tribunal) and a negative verdict would lead to cash outflow to the
tune of imposed penalty.
Market concentration risk: Shree Cement’s focus is only in the
Northern region, and lower demand in this region vs. the average in
India may have a bigger impact on it compared to pan-India players
like ACC, Ambuja and Ultratech.
Sand mining ban: Sand is an essential ingredient in concrete. Owing
to rampant sand mining without regulatory approvals, National Green
Tribunal (NGT) has called for a mining ban across all rivers in India. A
further stringent set of rules will negatively impact cement demand.
External limestone purchase: Cost of external purchased limestone is
4x that from own quarry. 5% substitution of own limestone by
external source can increase per tonne cost by Rs7.
Increase in freight rates: Cement is largely transported by road & rail
modes. Based on a producer with 50% rail/road transport mode and
average lead distance of 520kms, a 5% increase in rail freight would
result in a Rs18/t increase in cement costs while a 5% increase in road
freight would increase costs by Rs29/t.
Increase in coal & pet coke rates: Owing to limited coal linkages,
most cement producers are dependent on e-auction and imported
coal. A 5% rise in kiln coal cost would increase per tonne costs by
Rs27.
Sharp drop in demand: Our estimates factor in 5.9% & 8.3% demand
growth in FY14E & FY15E respectively. A sharp drop in demand is a
risk to our volume estimates for Shree cement.
Pro-longed price war: New entrants could resort to price wars to gain
market share. A prolonged price war could result in a sharp drop in
realization in affected regions.
Greenfield & brownfield expansion: Shree Cement is undertaking
various greenfield & brownfield expansions. Delays in land acquisition
& environmental clearances, inadequate supply of raw materials (like
limestone, linkage coal & fly ash) may hamper expansion plans.
Increase in taxes or levies on Cement: As per CMA, taxes and levies
constitute 60% or more of the ex-factory price. Further increases in
tax rates or levies may impact cement demand.
Tax credits and incentives: Cement producers enjoy several tax
credits and incentives for capex under 80IA & subsidy in states like
HP. Withdrawal of these incentives may result in higher effective tax
rates in the future.
Page 58 of 73

Page 6 of 8
Please visit our website at www.EspiritoSantoIB.co.uk for up to date recommendation charts.
Shree Cement SRCM IN
Report date Recommendation Fair value Share price (INR)
Recommendation history is not available
Source: Bloomberg, Espirito Santo Investment Bank Research
1500
2000
2500
3000
3500
4000
4500
5000
Sep-10 Dec-10 Mar-11 Jun-11 Sep-11 Dec-11 Mar-12 Jun-12 Sep-12 Dec-12 Mar-13 Jun-13 Sep-13
Buy Trading Buy Neutral Trading Sell Sell Restricted Dropped Coverage
Page 59 of 73

Page 33 of 47
Appendix – 01: Global Valuation Metrics
Figure 156 Global - valuation metrics
Source: Espirito Santo Investment Bank Research estimates for our Top 4, Company Data, Factset for not covered stocks.
Appendix – 02: EV/EBITDA & EV/T band charts
Figure 157 ACC - EV/EBITDA - trading below mean valuations Figure 158 ACC - EV/T ($) - price fall exagerated by rupee fall
Source: Espirito Santo Investment Bank Research, Bloomberg Source: Espirito Santo Investment Bank Research, Bloomberg
Comparison Table
Bloomberg
Ticker
2yr EBITDA
CAGR
Last
Reported
RoIC
Last
Reported
RoE RoE (+1)
1yr Fwd
EV/EBITDA
1yr Fwd
P/B
1yr Fwd
P/E
Net
Debt/EBITDA
YTD.
Performance
India - Large
UltraTech Cement Ltd. UTCEM IN 13% 12% 18% 17% 8.0 2.3 13.8 0.2 -14%
Ambuja Cements Ltd. ACEM IN 8% 23% 15% 17% 7.7 2.6 15.1 (1.9) -11%
ACC Ltd. ACC IN 7% 22% 14% 15% 6.5 2.3 13.5 (1.4) -26%
Jaiprakash Associates Ltd. JPA IN -25% 4% 3% 4% 14.9 0.6 20.8 9.5 -60%
Shree Cement Ltd. SRCM IN 8% 19% 26% 19% 7.9 3.0 15.2 (0.4) -15%
Madras Cements Ltd. MC IN 5% 18% 14% 16% 6.6 1.5 10.6 2.6 -33%
India Cements Ltd. ICEM IN 14% 5% 4% 6% 5.3 0.4 9.0 4.5 -46%
Median 8% 18% 14% 16% 7.7 2.3 13.8 0.2 -26%
Median - top 4 8% 21% 16% 17% 7.8 2.4 14.4 (0.9) -15%
India - Mid & Small
Birla Corp. Ltd. BCORP IN 15% 12% 10% 12% 0.6 6.3 3.4 -32%
J.K. Cement Ltd. JKCE IN 11% 15% 11% 13% 5.5 0.7 6.3 2.5 -50%
Prism Cement Ltd. PRSC IN 38% -5% 7% 13% 6.9 1.3 18.3 6.3 -41%
HeidelbergCement India Ltd. HEIM IN 76% 4% 5% 7% 10.0 1.0 20.1 12.5 -33%
Mangalam Cement Ltd. MGC IN 26% 17% 11% 15% 5.2 0.5 4.7 1.7 -45%
Median 26% 12% 10% 13% 6.2 0.7 6.3 3.4 -41%
Global - Comparables
Lafarge SA LG FP 7% 3% 5% 7% 7.2 0.9 18.4 4.1 9%
Holcim Ltd. HOLN VX 12% 4% 8% 9% 7.4 1.2 16.2 3.4 1%
Vicat SA VCT FP 14% 6% 7% 9% 7.1 1.0 15.1 3.4 7%
HeidelbergCement AG HEI DE 19% 2% 5% 6% 6.9 0.8 16.1 4.3 25%
CEMEX SAB de CV CX US 12% -7% -3% 1% 10.0 1.1 6.5 22%
Median 12% 3% 5% 7% 7.2 1.0 16.2 4.1 9%
Indoensia
PT Holcim Indonesia Tbk SMCB IJ 2% 17% 12% 13% 8.5 2.1 17.1 0.6 -14%
PT Indocement Tunggal Prakarsa Tbk INTP IJ 11% 27% 23% 22% 8.5 3.2 14.0 0.0 -11%
Median 7% 22% 18% 17% 8.5 2.7 15.5 0.3 -12%
China
Anhui Conch Cement Co., Ltd. 914 HK 25% 13% 15% 16% 6.9 2.0 13.1 2.1 -7%
China National Building Material Co. Ltd. 3323 HK 33% 19% 15% 15% 8.1 0.9 6.3 9.7 -32%
China Shanshui Cement Group Ltd. 691 HK 4% 18% 11% 12% 5.9 0.8 7.0 3.5 -43%
Median 25% 18% 15% 15% 6.9 0.9 7.0 3.5 -32%
Thailand
Siam Cement Public Co. Ltd. SCC TB 39% 17% 21% 21% 12.8 3.2 15.4 5.6 1%
Siam City Cement Public Co. Ltd. SCCC TB 23% 21% 25% 28% 13.8 5.2 20.5 0.9 2%
Median 31% 19% 23% 24% 13.3 4.2 18.0 3.3 2%
Taiwan
Taiwan Cement Corp. 1101 TT 9% 8% 9% 10% 8.4 1.5 16.3 4.6 5%
Asia Cement Corp. 1102 TT 21% 7% 8% 9% 15.1 1.4 16.2 8.4 4%
Median 15% 8% 9% 9% 11.8 1.4 16.3 6.5 4%
Malaysia
Lafarge Malaysia Bhd. LMC MK 5% 11% 11% 12% 13.5 2.7 24.6 0.0 4%
Cementos Argos Ante Caribe SA CEMARGOS CB 23% 4% 4% 6% 13.7 1.8 47.5 3.7 -2%
Median 14% 8% 7% 9% 13.6 2.3 36.1 1.8 1%
-
2.0
4.0
6.0
8.0
10.0
12.0
14.0
EV/EBITDA -2 Std. Dev Mean
+1 Std. Dev +2 Std. Dev -1 Std. Dev
-
50
100
150
200
250
300
EV/T ($) -2 Std. Dev Mean
+1 Std. Dev +2 Std. Dev -1 Std. Dev
Page 60 of 73

Page 34 of 47
Figure 159 Ambuja - EV/EBITDA - Trading below mean valuation Figure 3 Ambuja - EV/T ($) - price fall exagerrated by rupee fall
Source: Espirito Santo Investment Bank Research, Bloomberg Source: Espirito Santo Investment Bank Research, Bloomberg
Figure 161 Shree - EV/EBITDA trading above mean. Re-rating on capacity
addition Figure 162 Shree - EV/T ($) - at mean valuation
Source: Espirito Santo Investment Bank Research, Bloomberg Source: Espirito Santo Investment Bank Research, Bloomberg
Figure 163 Ultratech - EV/EBITDA - re-rating post L&T Cement and
Grasim merger (July 2010) Figure 164 Ultratech - EV/T ($) - fall exagerrated by rupee fall
Source: Espirito Santo Investment Bank Research, Bloomberg Source: Espirito Santo Investment Bank Research, Bloomberg
Appendix – 03: Earnings momentum charts
Figure 165 ACC - downgrades tapering off Figure 166 ACC - earnings forecast remains flat
Source: Espirito Santo Investment Bank Research, FactSet Source Espirito Santo Investment Bank Research, FactSet
-
2.0
4.0
6.0
8.0
10.0
12.0
14.0
EV/EBITDA -2 Std. Dev Mean
+1 Std. Dev +2 Std. Dev -1 Std. Dev
-
50
100
150
200
250
300
EV/T ($) -2 Std. Dev Mean
+1 Std. Dev +2 Std. Dev -1 Std. Dev
-
2.0
4.0
6.0
8.0
10.0
12.0
EV/EBITDA -2 Std. Dev Mean
+1 Std. Dev +2 Std. Dev -1 Std. Dev
-
50
100
150
200
250
300
EV/T ($) -2 Std. Dev Mean
+1 Std. Dev +2 Std. Dev -1 Std. Dev
-
2.0
4.0
6.0
8.0
10.0
12.0
14.0
EV/EBITDA -2 Std. Dev Mean
+1 Std. Dev +2 Std. Dev -1 Std. Dev
-
50
100
150
200
250
EV/T ($) -2 Std. Dev Mean
+1 Std. Dev +2 Std. Dev -1 Std. Dev
0
200
400
600
800
1000
1200
1400
1600
-100%
-80%
-60%
-40%
-20%
0%
20%
40%
60%
80%
100%
Ja
n-0
9
Mar-0
9
May
-0
9
Ju
l-0
9
Se
p-0
9
No
v-0
9
Ja
n-1
0
Mar-10
May
-10
Ju
l-10
Se
p-10
No
v-10
Ja
n-1
1
Mar-11
May
-11
Ju
l-11
Se
p-11
No
v-11
Ja
n-1
2
Mar-12
May
-12
Ju
l-12
Se
p-12
No
v-12
Ja
n-1
3
Mar-13
May
-13
Ju
l-13
Net upgrades/downgrades Price (RHS)
0
200
400
600
800
1000
1200
1400
1600
-15.0%
-10.0%
-5.0%
0.0%
5.0%
10.0%
15.0%
20.0%
25.0%
30.0%
% Change in NTM EPS growth forecasts Price (RHS)
Page 61 of 73

Page 35 of 47
Figure 167 Ambuja - downgrades tapering off Figure 168 Ambuja - earnings forecast in negative zone
Source: Espirito Santo Investment Bank Research, FactSet Source: Espirito Santo Investment Bank Research, FactSet
Figure 169 Ultratech - downgrades tapering off Figure 170 Ultratech - earnings forecast is flat
Source: Espirito Santo Investment Bank Research, FactSet Source: Espirito Santo Investment Bank Research, FactSet
Figure 171 Shree - spike in downgrades Figure 172 Shree - earnings forecast remains flat
Source: Espirito Santo Investment Bank Research, FactSet Source: Espirito Santo Investment Bank Research, FactSet
Appendix – 04: Demand by sector
India vs. US cement consumption - India yet to ride the curve
Despite the fact that it is already the world's second-largest cement producer,
we expect India to go through a prolonged growth period as it rides through
the cement curve (Figure 173), helped by rising housing & infrastructure
demand. As of 2011, per capita cement consumption in India was at 185kg vs.
the global average of 480kg. India & the US are at opposite ends of the global
cement curve (Figure 173), with the US having completed its journey. A closer
look at the US per capita cement consumption trend since 1900 (Figure 174)
provides an indication of how the Indian cement growth story might develop.
The US took 64 years to reach peak consumption of 432/kg per capita in
2005, from the current Indian per capita level. Taking Indian per capita GDP
growth at 3x that of US (2% CAGR over 64 years), we estimate it would
require another 15 years for India to reach the peak level achieved by US.
0
50
100
150
200
250
-80%
-60%
-40%
-20%
0%
20%
40%
60%
80%
Ja
n-0
9
Mar-0
9
May
-0
9
Ju
l-0
9
Se
p-0
9
No
v-0
9
Ja
n-1
0
Mar-10
May
-10
Ju
l-10
Se
p-10
No
v-10
Ja
n-1
1
Mar-11
May
-11
Ju
l-11
Se
p-11
No
v-11
Ja
n-1
2
Mar-12
May
-12
Ju
l-12
Se
p-12
No
v-12
Ja
n-1
3
Mar-13
May
-13
Ju
l-13
Net upgrades/downgrades Price (RHS)
0
50
100
150
200
250
-10.0%
-8.0%
-6.0%
-4.0%
-2.0%
0.0%
2.0%
4.0%
6.0%
8.0%
10.0%
12.0%
Ja
n-0
9
Mar-0
9
May
-0
9
Ju
l-0
9
Se
p-0
9
No
v-0
9
Ja
n-1
0
Mar-10
May
-10
Ju
l-10
Se
p-10
No
v-10
Ja
n-1
1
Mar-11
May
-11
Ju
l-11
Se
p-11
No
v-11
Ja
n-1
2
Mar-12
May
-12
Ju
l-12
Se
p-12
No
v-12
Ja
n-1
3
Mar-13
May
-13
Ju
l-13
% Change in NTM EPS growth forecasts Price (RHS)
0
500
1000
1500
2000
2500
-80%
-60%
-40%
-20%
0%
20%
40%
60%
80%
100%
Ja
n-0
9
Mar-0
9
May
-0
9
Ju
l-0
9
Se
p-0
9
No
v-0
9
Ja
n-1
0
Mar-10
May
-10
Ju
l-10
Se
p-10
No
v-10
Ja
n-1
1
Mar-11
May
-11
Ju
l-11
Se
p-11
No
v-11
Ja
n-1
2
Mar-12
May
-12
Ju
l-12
Se
p-12
No
v-12
Ja
n-1
3
Mar-13
May
-13
Ju
l-13
Net upgrades/downgrades Price (RHS)
0
500
1000
1500
2000
2500
-15.0%
-10.0%
-5.0%
0.0%
5.0%
10.0%
15.0%
20.0%
25.0%
Ja
n-0
9
Mar-0
9
May
-0
9
Ju
l-0
9
Se
p-0
9
No
v-0
9
Ja
n-1
0
Mar-10
May
-10
Ju
l-10
Se
p-10
No
v-10
Ja
n-1
1
Mar-11
May
-11
Ju
l-11
Se
p-11
No
v-11
Ja
n-1
2
Mar-12
May
-12
Ju
l-12
Se
p-12
No
v-12
Ja
n-1
3
Mar-13
May
-13
Ju
l-13
% Change in NTM EPS growth forecasts Price (RHS)
0
1000
2000
3000
4000
5000
6000
-100%
-80%
-60%
-40%
-20%
0%
20%
40%
60%
80%
100%
Ja
n-0
9
Mar-0
9
May
-0
9
Ju
l-0
9
Se
p-0
9
No
v-0
9
Ja
n-1
0
Mar-10
May
-10
Ju
l-10
Se
p-10
No
v-10
Ja
n-1
1
Mar-11
May
-11
Ju
l-11
Se
p-11
No
v-11
Ja
n-1
2
Mar-12
May
-12
Ju
l-12
Se
p-12
No
v-12
Ja
n-1
3
Mar-13
May
-13
Ju
l-13
Net upgrades/downgrades Price (RHS)
0
1000
2000
3000
4000
5000
6000
-20.0%
-10.0%
0.0%
10.0%
20.0%
30.0%
40.0%
50.0%
Ja
n-0
9
Mar-0
9
May
-0
9
Ju
l-0
9
Se
p-0
9
No
v-0
9
Ja
n-1
0
Mar-10
May
-10
Ju
l-10
Se
p-10
No
v-10
Ja
n-1
1
Mar-11
May
-11
Ju
l-11
Se
p-11
No
v-11
Ja
n-1
2
Mar-12
May
-12
Ju
l-12
Se
p-12
No
v-12
Ja
n-1
3
Mar-13
May
-13
Ju
l-13
% Change in NTM EPS growth forecasts Price (RHS)
Page 62 of 73

Page 36 of 47
Figure 173 India (2nd largest producer) is yet to ride the curve Figure 174 US Cement consumption pattern since 1900
Source: Espirito Santo Investment Bank Research, Company Data Source: Espirito Santo Investment Bank Research, Company Data
Cement demand – skewed towards housing
The Indian cement consumption story is primarily being driven by housing
demand, which accounts for 67% of total 2012 consumption, followed by
infrastructure at 13%, commercial construction at 11% and Industrial
construction at 9%.
Key trends like mass urbanization (expected ~250mn migration over the next
20 years, IHB), rising per capita income and a rising number of nuclear families
are driving housing demand. The urbanization trend is also fuelling demand for
the commercial segment in urban and semi-urban areas. The government's
impetus to shore up India's ailing infrastructure with $1 trillion in spending over
the 12th five year plan is also likely to boost cement demand.
Figure 175 Housing is key growth driver with
67% of total consumption (2012)
Figure 176 Rapid urbanization is leading to sustained
housing demand
Figure 177 Cement housing consumption growth
at 0.7x housing loan growth
Source: Espirito Santo Investment Bank Research, Company Data Source: Espirito Santo Investment Bank Research, Company Data Source: Espirito Santo Investment Bank Research, Company Data
Housing Demand – 67% of total cement consumption
India‖s housing sector is still in a nascent stage and should continue to fuel
cement demand for a sustained period. As per the 2011 census, India has
247mn households (excluding institutional households), out of which only 29%
have a concrete roof, while 62% have concrete-based walls. Assuming an
average house size of 300sq. ft. and 20kg/sq. ft. cement consumption,
existing households present a billion-tonne cement opportunity. Further, the
expected urbanization of ~250mn people over next 20 years will create
additional demand. India's mortgage to GDP ratio is currently (FY13) at a low
8% (Figure 148) and we expect it to increase with rising per capita income
growth, which should further fuel cement demand for housing.
USA
Brazil
China
Germany
IndiaIndonesia
Italy
Japan
South Korea
Mexico
Russia SpainThailand
Turkey
-
200
400
600
800
1,000
1,200
1,400
1,600
1,800
- 5,000 10,000 15,000 20,000 25,000 30,000 35,000 40,000 45,000
Cement Consumption (Kg/Person) Trend line (Cement Consumption (Kg/Person))
Cement Consuption (Kg/Person)
GDP Per Capital ($ 2005 PPP)
World Average
-
50
100
150
200
250
300
350
400
450
500
- 5,000 10,000 15,000 20,000 25,000 30,000 35,000 40,000 45,000
Cement Consumption (Kg/Person) Poly. (Cement Consumption (Kg/Person))
US Cement Consumption (Kg/Person)
US Per Capita GDP ($ 2005 Prices)
2.25%
2.30%
2.35%
2.40%
2.45%
2.50%
2.55%
2.60%
2.65%
2.70%
2.75%
2.80%
25.0%
26.0%
27.0%
28.0%
29.0%
30.0%
31.0%
32.0%
India Urban as % of Total PopulationIndia Urbanization Growth Rate (%) - RHS
-
0.2
0.4
0.6
0.8
1.0
1.2
1.4
1.6
FY09 FY10 FY11 FY12 FY13
% Cement Housing Growth/Housing Loan Disbursement Growth
Average
Page 63 of 73

Page 37 of 47
Figure 178 Housing demand across India remains strong
Figure 179 EWS & LIG shortage driving
government spend on housing
Figure 180 India lags behind most in Mortgage
to GDP ratio – FY13
Source: Espirito Santo Investment Bank Research, NHB Source: Espirito Santo Investment Bank Research, MoHUPA Source: Espirito Santo Investment Bank Research, HDFC
State & GOI led housing demand
GOI & State governments are working to tackle the housing shortage, ~19mn in
2012, through various welfare schemes. Affordable housing for ~19mn units at
400sq. ft. and 20kg/sq. ft. cement consumption presents a 152mt cement
opportunity. Ten states contribute to 76% of the urban housing shortage - UP,
Maharashtra, WB, AP, TN, Bihar, Rajasthan, MP, Karnataka and Gujarat. Central
schemes such as JnNURM, RAY and affordable housing programmes are
channelled towards the supply side, while Rajiv Rinn Yojana (RRY), 1% interest
subvention scheme, the credit mortgage risk guarantee fund and urban
housing fund are being used to fuel demand.
Figure 181 East accounts for 35% of total
shortage (FY12)
Figure 182 RRY plans to target 20% of shortage
in XIIth plan
Source: Espirito Santo Investment Bank Research, Company Data, MoHUPA Source: Espirito Santo Investment Bank Research, Company Data, MoHUPA
Demand drivers for EWS & LIG: Various state & central schemes are being
launched to provide funds to the urban poor who are currently unable to
obtain loans from HFCs and Banks.
RRY intends to provide housing loans up to Rs. 0.5mn for EWS and
Rs. 0.8mn for LIG with an interest subsidy of 5% restricted up to Rs.
0.5mn. RRY is expected to target 20% of shortage for the state during
the XIIth 5 year plan.
Credit Mortgage Risk Guarantee Fund totalling Rs.1,000Crs has been
established to mitigate high risk perception of the Banks/HFC for
informal sector housing loans
Urban Housing Fund is being created for increased credit flow to the
urban poor
Supply-side drivers: GOI & State governments are giving out various financial
and non-financial incentives to promote the supply of affordable housing.
Financial incentives include service tax exemption, direct tax rebates, direct
capital grant support. Non-financial incentives include reduced timeline for
approval, access to state/city land holdings inventory, increased land
availability, increased FSI/TDR facilities and policy support for promotion of
mass housing.
JnNURM, RAY – Urban housing & infrastructure
The Jawaharlal Nehru Urban Renewal Mission (JnNURM) was launched on 3rd
Dec 2006 as a 7-year program with an investment of Rs1 Trillion for urban
60
110
160
210
260
310
Ko
lkata
Patn
a
Bh
ub
nesh
war
Guw
aha
ti
Mum
bai
Ah
med
ab
ad
Pun
e
Su
rat
Delh
i
Fa
rid
ab
ad
Jaip
ur
Lu
dhia
na
Ch
en
nai
Hyd
era
bad
Ko
ch
i
Be
ng
alu
ru
Vijayaw
ad
a
Bh
op
al
Lu
ckn
ow
Ind
ore
East West North South Central
JFM 2012 AMJ 2012 JAS 2012 OND 2012 JFM 2013
Residex Index (Base 2007)
Category No (Mn) %
EWS 10.6 56
LIG 7.4 39
MIG & above 8.0 4
Total 18.8 100
Housing shortage among categories
0%
20%
40%
60%
80%
100%
120%
Mortgages as % of Nominal GDP
0%
5%
10%
15%
20%
25%
30%
35%
40%
-
1.0
2.0
3.0
4.0
5.0
6.0
7.0
East West North South Central
Shortage No (Mn) % Shortage of Total - RHS
-
0.05
0.10
0.15
0.20
0.25
0.30
0.35
0.40
0.45
No of Households (Mn)
Page 64 of 73

Page 38 of 47
Figure 186 90% of rural housing shortage
is in BPL category (as of 2012)
Source: Espirito Santo Investment Bank Research, Company Data
0
5
10
15
20
25
30
35
40
45
Below Poverty Line (BPL) Non-BPL
Shortage No Units (Mn)
infrastructure and housing development, with GOI‖s share at 66%. The plan
was subsequently extended for another 2 years until FY14. Two sub divisions
under JnNURM, namely Urban Infrastructure and Governance (UIG) deals with
infrastructure projects, while Basic Services for Urban Poor (BSUP) deals with
housing facilities for the urban poor. Although the current investment in
JnNURM of ~Rs400bn for a 7 year period implies annual cement consumption
of ~3-4mt (assuming ~30t/Rs mn of investment), we expect this to increase
further as the scope of project is increased to cover a larger part of India.
Figure 183 861K DUs are under progress or yet to
start (FY12)
Figure 184 GOI has made 66% of allocation (vs.
planned outlay)
Figure 185 ACA releases to allocation above
80% in most of the regions
Source: Espirito Santo Investment Bank Research, MoHUPA Source: Espirito Santo Investment Bank Research, MoHUPA Source: Espirito Santo Investment Bank Research, MoHUPA
Rural demand – through IAY
GOI‖s flagship rural housing programme, Indira Awaas Yojana (IAY), provides
assistance of Rs45,000 for new construction in plains areas and Rs48,500 for
construction in hilly/difficult areas. IAY was allotted Rs152bn in the FY13-14
budget, which – along with other rural programmes (MGNREGS, PMGSY) –
saw a 46% increase YoY in allocation on an aggregate basis. The GOI has also
decided to increase per unit assistance from Rs45,000 to Rs70,000 from 1st
April 2013. In FY12, the South reported the lowest target achievement of 83%,
while the North reported a maximum of 136%. We think the combination of a
high degree of target achievement on a pan-India level (90% in FY12 – Figure
187) and a 56% YoY increase in per unit assistance should provide a boost to
cement demand.
Figure 187 IAY: 90% target achieved in FY12
Figure 188 East accounted for 49% of total
achievement
Figure 189 IAY - per house spend to rise to
Rs70,000
Source: Espirito Santo Investment Bank Research, MoRD Source: Espirito Santo Investment Bank Research, MoRD Source: Espirito Santo Investment Bank Research, MoRD
Near term trend in private housing
Owing to the dearth of new housing start data by region, we have used the
National Housing Bank's (NHB) Residex Index (Figure 178) as a proxy for
housing demand. The Residex Index gives housing prices across multiple cities
based on current transactions, with a base year of 2007. The Residex index in
Q4FY13 remained strong across India, indicating strong housing demand,
except for a few regions like Hyderabad, Kochi, Bengaluru and Jaipur.
Housing starts, as per real estate advisory firm Cushman & Wakefield, have
moderated in few tier-1 cities owing to either soft demand or city specific
issues; however, mid/lower segment demand remains strong across cities.
Commercial construction demand – 11% of total cement demand
Office space across key regions has remained stable in terms of net
absorption and net asking rent rates. Owing to a dearth of volume data for
commercial construction space, we have used pricing as a proxy for demand.
Rental rates in the cities of Ahmedabad, Pune & Mumbai in the west, Kolkata in
-
200
400
600
800
1,000
1,200
1,400
1,600
East West North South Central Total
Th
ou
san
ds No of Dwelling Units
Sanctioned Completed
Occupied (out of completed) Under Progress
DUs Not Started
0%
50%
100%
150%
200%
UIG UIDSSMT BSUP IHSDP Total
East West North South Central
0%
20%
40%
60%
80%
100%
120%
140%
160%
FY06 FY07 FY08 FY09 FY10 FY11 FY12 Total
UIG UIDSSMT BSUP IHSDP Total
0%
20%
40%
60%
80%
100%
120%
140%
East West North South Central Total
FY09 FY10 FY11 FY12
Achievement/Target %
0
500
1,000
1,500
2,000
2,500
3,000
3,500
East West North South Central Total
No
of
Ho
use
s (
Th
ou
san
ds)
FY09 FY10 FY11 FY12
-
10,000
20,000
30,000
40,000
50,000
60,000
FY03 FY04 FY05 FY06 FY07 FY08 FY09 FY10 FY11 FY12
Spend (Rs)/House
Page 65 of 73
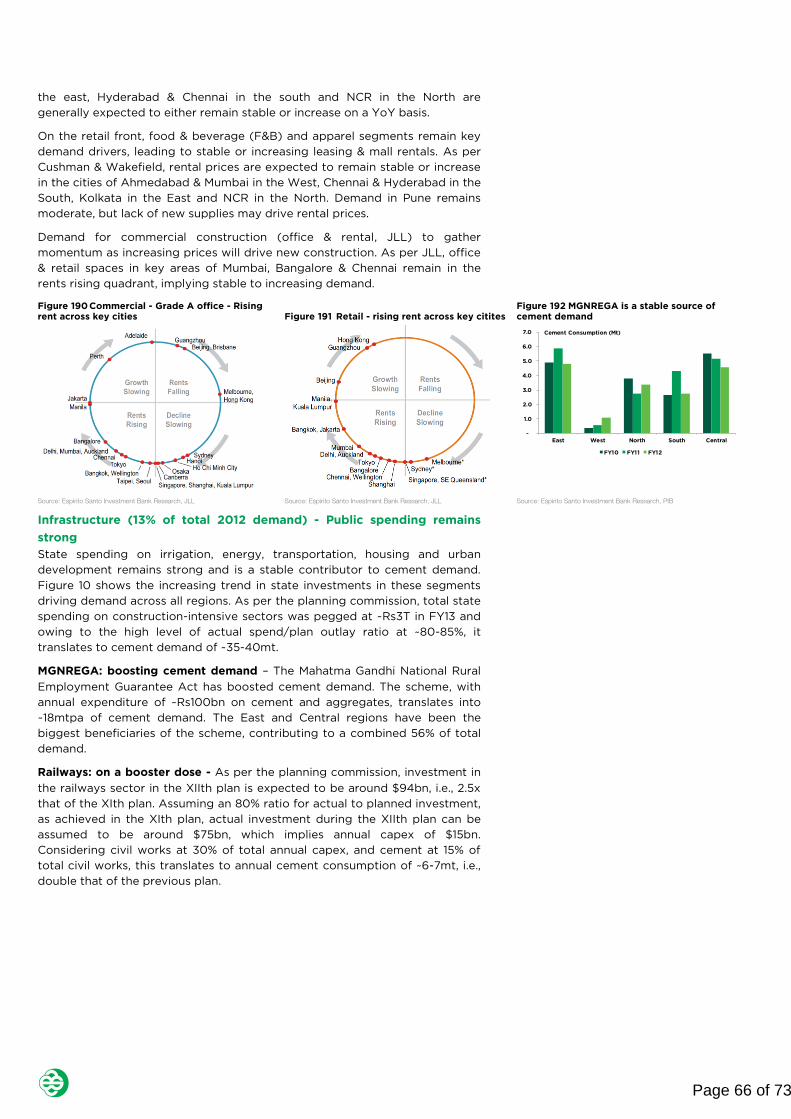
Page 39 of 47
the east, Hyderabad & Chennai in the south and NCR in the North are
generally expected to either remain stable or increase on a YoY basis.
On the retail front, food & beverage (F&B) and apparel segments remain key
demand drivers, leading to stable or increasing leasing & mall rentals. As per
Cushman & Wakefield, rental prices are expected to remain stable or increase
in the cities of Ahmedabad & Mumbai in the West, Chennai & Hyderabad in the
South, Kolkata in the East and NCR in the North. Demand in Pune remains
moderate, but lack of new supplies may drive rental prices.
Demand for commercial construction (office & rental, JLL) to gather
momentum as increasing prices will drive new construction. As per JLL, office
& retail spaces in key areas of Mumbai, Bangalore & Chennai remain in the
rents rising quadrant, implying stable to increasing demand.
Figure 190 Commercial - Grade A office - Rising
rent across key cities Figure 191 Retail - rising rent across key citites
Figure 192 MGNREGA is a stable source of
cement demand
Source: Espirito Santo Investment Bank Research, JLL Source: Espirito Santo Investment Bank Research, JLL Source: Espirito Santo Investment Bank Research, PIB
Infrastructure (13% of total 2012 demand) - Public spending remains
strong
State spending on irrigation, energy, transportation, housing and urban
development remains strong and is a stable contributor to cement demand.
Figure 10 shows the increasing trend in state investments in these segments
driving demand across all regions. As per the planning commission, total state
spending on construction-intensive sectors was pegged at ~Rs3T in FY13 and
owing to the high level of actual spend/plan outlay ratio at ~80-85%, it
translates to cement demand of ~35-40mt.
MGNREGA: boosting cement demand – The Mahatma Gandhi National Rural
Employment Guarantee Act has boosted cement demand. The scheme, with
annual expenditure of ~Rs100bn on cement and aggregates, translates into
~18mtpa of cement demand. The East and Central regions have been the
biggest beneficiaries of the scheme, contributing to a combined 56% of total
demand.
Railways: on a booster dose - As per the planning commission, investment in
the railways sector in the XIIth plan is expected to be around $94bn, i.e., 2.5x
that of the XIth plan. Assuming an 80% ratio for actual to planned investment,
as achieved in the XIth plan, actual investment during the XIIth plan can be
assumed to be around $75bn, which implies annual capex of $15bn.
Considering civil works at 30% of total annual capex, and cement at 15% of
total civil works, this translates to annual cement consumption of ~6-7mt, i.e.,
double that of the previous plan.
-
1.0
2.0
3.0
4.0
5.0
6.0
7.0
East West North South Central
FY10 FY11 FY12
Cement Consumption (Mt)
Page 66 of 73

Page 40 of 47
Figure 195 New products for reduced curing
time
Source: Espirito Santo Investment Bank Research, ACC
Figure 193 Railways - Capex breakdown in XIIth plan
Figure 194 Annual demand could be double that of
XIth plan
Source: Espirito Santo Investment Bank Research, Ministry of railways Source: Espirito Santo Investment Bank Research, Planning commission
Highways/roads – an untapped opportunity: India has a road network of 3.3
million kilometres, of which ~80% are rural roads and only 2% are national
highways. National highways are largely made of bitumen, which accounts for
88% of total length, while concrete makes up the remaining 12%. As per the
Indian Roads Congress (IRC), 40% of the roads in western countries including
the US, Germany and Austria are made of concrete, whereas only 2% of India‖s
roads (by length) are made of concrete. Approximately 1000 tonnes of
cement are required for the construction of one kilometre of a two-lane
concrete road. Roads remain a potential demand driver, assuming a 40% share
for concrete road and 1,000T/Km of cement, this translates into a 1,254mt
opportunity. Concrete roads outscore bitumen in terms of fuel efficiency and
durability, while a long curing time of 28 days remains a drawback. With new
products, like UTWT 24 & Speedcrete, developed by ACC, concrete roads can
be trafficked within 24 hours and 8 hours respectively, thereby solving the
long curing issue.
Appendix: 05 - India cement regions
Figure 196 India cement regions
Source: Espirito Santo Investment Bank Research, CMA
Appendix – 06: Definitions
Affordable Housing: Individual dwelling units with a carpet area of not more
than 60 Sq. meters.
Affordable Housing Projects: Housing projects where at least 60% of the
FAR/FSI is used for dwelling units of carpet area of not more than 60 Sq.
meters. The project shall also reserve 15% of the total FAR/FSI or 35% of the
total number of dwelling units for EWS category.
CCI‖s definition of Cartel: “Cartel” includes an association of producers,
sellers, distributors, traders or service providers who by agreement amongst
New lines
21%Gauge
Conversion3%
Doubling
6%
Rolling Stock
27%
Track
renewals8%
Electrification
4%
Others
31%
XIth plan XIIth plan
Planned capex (Rs bn) 2,333 5,192
Actual/likely capex (Rs bn) 1,908 4,154
Achievement rate (%) 82% 80%
Likely annual capex (Rs bn) 382 831
Civil works (%) 30% 30%
Civil works (Rs bn) 114.6 249.3
Cement as % of Civil 15% 15%
Cement demand (mt) 3.4 7.5
Northern Region Eastern Region Southern Region Western Region Central Region
Uttarakhand Assam Andhra Pradesh Gujarat Uttar Pradesh
Haryana Meghalaya Tamil Nadu Maharashtra Madhya Pradesh
Punjab Tripura Karnataka
Rajasthan Manipur Kerala
Himachal Pradesh Nagaland Pondicherry
Chandigarh Arunachal Pradesh Andaman & Nicobar
Delhi Mizoram Goa
Jammu & Kashmir Bihar
Jharkhand
Odisha
West Bengal
Chhattisgarh
Page 67 of 73

Page 41 of 47
themselves, limit, control or attempt to control the production, distribution,
sale or price of, or, trade in goods or provision of services.
Appendix – 07: Cement manufacturing process
Figure 197 Cement Manufacturing Process
Source: Espirito Santo Investment Bank Research, JSW
Appendix: 08 – Limestone deposits
India‖s limestone deposits are concentrated in a few states, wherein Karnataka
(30% of total), Andhra Pradesh (20%), Rajasthan (11%), Gujarat (11%),
Meghalaya (9%), Chhattisgarh (5%) together account for 86% of total FY13
reserves. Owing to the availability of limestone reserves, these states
combined accounted for 57% (Andhra Pradesh - 22%, Karnataka - 8%,
Rajasthan - 13%, Gujarat - 8%, Meghalaya - 1%, Chhattisgarh - 5%) of total
cement capacity in FY13. States like Maharashtra (6% capacity in FY13) and
Tamil Nadu (10%), despite having negligible reserves, have significant capacity
on account of being key cement consumers. Out of total reserves, 30% are
located in forests and other regulated areas which may not be available for
cement manufacture. Though current limestone reserves are sufficient for the
next 30-40 years, lack of access to captive mines can impact companies on an
individual basis. For instance, Ambuja is currently purchasing 5% of its
limestone from the external market, which costs ~4x that of a captive source.
Page 68 of 73

Page 42 of 47
Figure 198: South holds half of Indian limestone reserves (2011)
Source: Espirito Santo Investment Bank Research, Company Data, IBM
Appendix: 09 - Gypsum deposits
In India, gypsum reserves are concentrated in Rajasthan (82% of total - 2011)
where its supply and mining is monopolized by government organizations.
This has resulted in a competitive scenario in gypsum procurement from
external markets. Geographically concentrated reserves also imply that
cement players in far off states find it difficult to procure the mineral and have
to bear higher logistic costs. Further, only 12% of India‖s total gypsum reserves
(Figure 199) are suitable for cement production.
Lime Stone Reserves R&R (Mt) % of Region % of Total
East 31,354 100% 18%
Arunachal Pradesh 483 2% 0%
Assam 1,305 4% 1%
Bihar 859 3% 0%
Chhattisgarh 9,038 29% 5%
Jharkhand 746 2% 0%
Manipur 46 0% 0%
Meghalaya 16,054 51% 9%
Nagaland 1,038 3% 1%
Odisha 1,738 6% 1%
Sikkim 2 0% 0%
West Bengal 45 0% 0%
West 21,750 100% 12%
Gujarat 20,012 92% 11%
Maharashtra 1,737 8% 1%
North 27,216 100% 16%
Haryana 71 0% 0%
Himachal Pradesh 4,762 17% 3%
Jammu & Kashmir 1,356 5% 1%
Rajasthan 19,486 72% 11%
Uttarakhand 1,540 6% 1%
South 88,598 100% 51%
Andhra Pradesh 35,179 40% 20%
Daman & Diu 129 0% 0%
Karnataka 51,886 59% 30%
Kerala 207 0% 0%
Puducherry 16 0% 0%
Tamil Nadu 1,182 1% 1%
Central 6,427 100% 4%
Madhya Pradesh 5,921 92% 3%
Uttar Pradesh 506 8% 0%
Total 175,345 100% 100%
Page 69 of 73
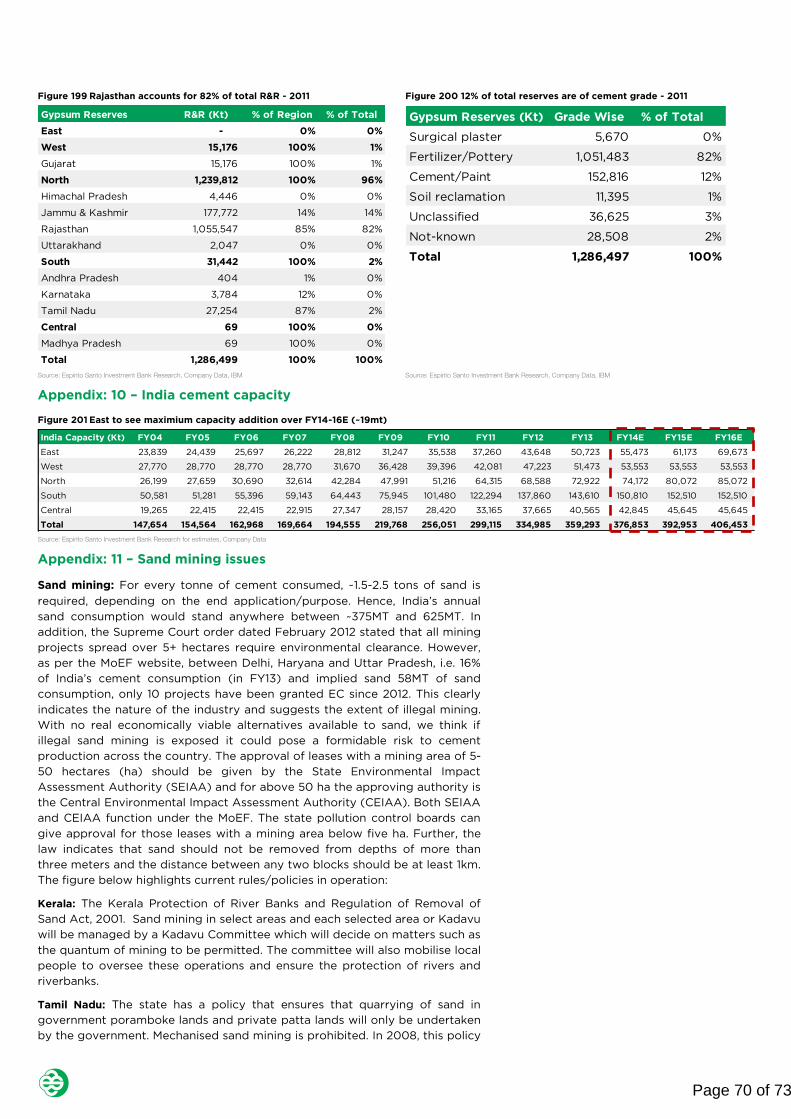
Page 43 of 47
Figure 199 Rajasthan accounts for 82% of total R&R - 2011 Figure 200 12% of total reserves are of cement grade - 2011
Source: Espirito Santo Investment Bank Research, Company Data, IBM Source: Espirito Santo Investment Bank Research, Company Data, IBM
Appendix: 10 – India cement capacity
Figure 201 East to see maximium capacity addition over FY14-16E (~19mt)
Source: Espirito Santo Investment Bank Research for estimates, Company Data
Appendix: 11 – Sand mining issues
Sand mining: For every tonne of cement consumed, ~1.5-2.5 tons of sand is
required, depending on the end application/purpose. Hence, India‖s annual
sand consumption would stand anywhere between ~375MT and 625MT. In
addition, the Supreme Court order dated February 2012 stated that all mining
projects spread over 5+ hectares require environmental clearance. However,
as per the MoEF website, between Delhi, Haryana and Uttar Pradesh, i.e. 16%
of India‖s cement consumption (in FY13) and implied sand 58MT of sand
consumption, only 10 projects have been granted EC since 2012. This clearly
indicates the nature of the industry and suggests the extent of illegal mining.
With no real economically viable alternatives available to sand, we think if
illegal sand mining is exposed it could pose a formidable risk to cement
production across the country. The approval of leases with a mining area of 5-
50 hectares (ha) should be given by the State Environmental Impact
Assessment Authority (SEIAA) and for above 50 ha the approving authority is
the Central Environmental Impact Assessment Authority (CEIAA). Both SEIAA
and CEIAA function under the MoEF. The state pollution control boards can
give approval for those leases with a mining area below five ha. Further, the
law indicates that sand should not be removed from depths of more than
three meters and the distance between any two blocks should be at least 1km.
The figure below highlights current rules/policies in operation:
Kerala: The Kerala Protection of River Banks and Regulation of Removal of
Sand Act, 2001. Sand mining in select areas and each selected area or Kadavu
will be managed by a Kadavu Committee which will decide on matters such as
the quantum of mining to be permitted. The committee will also mobilise local
people to oversee these operations and ensure the protection of rivers and
riverbanks.
Tamil Nadu: The state has a policy that ensures that quarrying of sand in
government poramboke lands and private patta lands will only be undertaken
by the government. Mechanised sand mining is prohibited. In 2008, this policy
Gypsum Reserves R&R (Kt) % of Region % of Total
East - 0% 0%
West 15,176 100% 1%
Gujarat 15,176 100% 1%
North 1,239,812 100% 96%
Himachal Pradesh 4,446 0% 0%
Jammu & Kashmir 177,772 14% 14%
Rajasthan 1,055,547 85% 82%
Uttarakhand 2,047 0% 0%
South 31,442 100% 2%
Andhra Pradesh 404 1% 0%
Karnataka 3,784 12% 0%
Tamil Nadu 27,254 87% 2%
Central 69 100% 0%
Madhya Pradesh 69 100% 0%
Total 1,286,499 100% 100%
Gypsum Reserves (Kt) Grade Wise % of Total
Surgical plaster 5,670 0%
Fertilizer/Pottery 1,051,483 82%
Cement/Paint 152,816 12%
Soil reclamation 11,395 1%
Unclassified 36,625 3%
Not-known 28,508 2%
Total 1,286,497 100%
India Capacity (Kt) FY04 FY05 FY06 FY07 FY08 FY09 FY10 FY11 FY12 FY13 FY14E FY15E FY16E
East 23,839 24,439 25,697 26,222 28,812 31,247 35,538 37,260 43,648 50,723 55,473 61,173 69,673
West 27,770 28,770 28,770 28,770 31,670 36,428 39,396 42,081 47,223 51,473 53,553 53,553 53,553
North 26,199 27,659 30,690 32,614 42,284 47,991 51,216 64,315 68,588 72,922 74,172 80,072 85,072
South 50,581 51,281 55,396 59,143 64,443 75,945 101,480 122,294 137,860 143,610 150,810 152,510 152,510
Central 19,265 22,415 22,415 22,915 27,347 28,157 28,420 33,165 37,665 40,565 42,845 45,645 45,645
Total 147,654 154,564 162,968 169,664 194,555 219,768 256,051 299,115 334,985 359,293 376,853 392,953 406,453
Page 70 of 73

Page 44 of 47
was countermanded by the government and private parties were given
permits for mining.
Karnataka: The Uniform Sand Mining Policy does not allow sand mining in
Coastal Regulation Zone (CRZ) areas and prohibits the use of machinery to
mine sand from rivers. The High Court of Karnataka banned mechanised boats
for sand mining in the state from April 2011. From September 2011, according
to Karnataka Minor Mineral Concession (Amendment) Rules 2011, the
responsibility of oversight of sand mining has been transferred to the Public
Works, Ports and Inland Water Transport Department.
Andhra Pradesh: In 2006, the government introduced a new policy that allows
only manual labour and bullocks to mine sand in riverbeds. Bullock carts,
mules and other animals are exempt from any mining tax. Contractors will be
allotted sand through open bidding by a committee headed by district joint
collectors. Sand can be sold only if it has a maximum retail price tag,
otherwise there will be a penalty. Use of poclaines has been banned entirely,
and mining will be prohibited below three metres.
Maharashtra: Under a new policy announced in October 2010, contractors are
required to obtain permission from the Gramsabha for sand mining. A ban on
the use of suction pumps in dredging and sand mining licences can be given
only through a bidding process. Sand mining projects also have to obtain
environmental clearances.
Appendix: 12 – Ambuja & ACC – waste recycling management
Figure 202 Geo 20 installation concept at Ambuja & ACC
Source: Espirito Santo Investment Bank Research, Company Data, Ambuja Cement
Page 71 of 73

Page 7 of 8
IMPORTANT DISCLOSURES
100913
This report was prepared by Espírito Santo Investment Bank Research, a global brand name for the equity research teams of Banco Espírito Santo de Investimento, S.A., with headquarters in Lisbon, Portugal, of its Branches in Spain and Poland and of its affiliates BES Securities do Brasil, S.A – Corretora de Câmbio e Valores Mobiliários, in Brazil, Execution Noble Limited, in the United Kingdom, and Espirito Santo Securities India Private Limited, in India, all authorized to engage in securities activities according to each domestic legislation. All of these entities are included within the perimeter of the Financial Group controlled by Espírito Santo Financial Group S.A. (“Banco Espírito Santo Group”).
Analyst Certification
Each research analyst primarily responsible for the content of this research report, in whole or in part, certifies that with respect to each security or issuer that the analyst covered in this report: (1) all of the views expressed accurately reflect his or her personal views about those securities or issuers; the issuers were not previously informed about the content of the recommendation included in this research report and the assumptions were not validated by the issuers; (2) no part of his or her compensation is directly or indirectly related to: (a) the specific recommendations or views expressed by that research analyst in the research report; and/or (b) any services provided or to be provided by Banco Espírito Santo de Investimento, S.A. and/or by any of its affiliates to the issuer of the securities under recommendation. Moreover, each of the analysts hereby certifies that he or she has no economic or financial interest whatsoever in the companies subject to his or her opinion and does not own or trade any securities issued by the latter.
Ratings Distribution
Espirito Santo Investment Bank Research hereby provides the distribution of the equity research ratings in relation to the total Issuers covered and to the investment banking clients as of end of June 2013.
Explanation of Rating System Ratings Distribution
12-MONTH RATING DEFINITION
BUY Analyst expects at least 10% upside potential to fair value, which should be realized in the next 12 months
NEUTRAL Analyst expects upside/downside potential of between +10% and -10% to fair value, which should be realized in the next 12 months
SELL Analyst expects at least 10% downside potential to fair value, which should be realized in the next 12 months
As at end June 2013 Total ESIB Research
Total Investment Banking Clients (IBC)
Recommendation Count % of Total Count % of IBC % of Total
12 Month Rating:
Buy 233 44.8% 36 73.5% 6.9%
Neutral 180 34.6% 9 18.4% 1.7%
Sell 100 19.2% 1 2.0% 0.2%
Restricted 2 0.4% 2 4.1% 0.4%
Under Review 4 0.8% 1 2.0% 0.2%
TRADING RATING DEFINITION
TRADING BUY Analyst expects a positive short-term movement in the share price (max duration 2 months from the time Trading Buy is announced) and may move out of line with the fair value estimate during that period
TRADING SELL Analyst expects a negative short-term movement in the share price (max duration 2 months from time Trading Sell is announced) and may move out of line with the fair value estimate during that period
Trading Rating:
Trading Buy 1 0.2% 0 0.0% 0.0%
Trading Sell 0 0.0% 0 0.0% 0.0%
Total recommendations 520 100% 49 100% 9.4%
For further information on Rating System please see “Definitions and distribution of ratings” on: http://www.espiritosantoib-research.com.
Share Prices
Share prices are as at the close of business on the day preceding publication, unless otherwise specified.
Coverage Policy
Espírito Santo Investment Bank Research reserves the right to choose the securities it expresses opinions on. The main criteria to choose such securities are: 1) markets in which they trade 2) market capitalisation 3) liquidity, 4) sector suitability. Espírito Santo Investment Bank Research has no specific policy regarding the frequency in which opinions and investment recommendations are released.
Representation to Investors
Espírito Santo Investment Bank Research has issued this report for information purposes only. This material constitutes "investment research" for the purposes of the Markets in Financial Instruments Directive and as such contains an objective or independent explanation of the matters contained in the material.
Any recommendations contained in this document must not be relied upon as investment advice based on the recipient's personal circumstances. This report is not, and should not be construed as an offer or a solicitation to buy or sell any securities or related financial instruments. The investment discussed or recommended in this report may be unsuitable for investors depending on their specific investment objectives and financial position. The material in this research report is general information intended for recipients who understand the risks associated with investment. It does not take account of whether an investment, course of action, or associated risks are suitable for the recipient. This research report does not purport to be comprehensive or to contain all the information on which a prospective investor may need in order to make an investment decision and the recipient of this report must make its own independent assessment and decisions regarding any securities or financial instruments mentioned herein. In the event that further clarification is required on the words or phrases used in this material, the recipient is strongly recommended to seek independent legal or financial advice. Where an investment is denominated in a currency other than the investor’s currency, changes in rates of exchange may have an adverse effect on the value, price of, or income derived from the investment. Past performance is not necessarily a guide to future performance. Income from investments may fluctuate. The price or value of the investments to which this report relates, either directly or indirectly, may fall or rise against the interest of investors. Any recommendation and opinion contained in this report may become outdated as a consequence of changes in the environment in which the issuer of the securities under analysis operates, in addition to changes in the estimates and forecasts, assumptions and valuation methodology used herein. The securities mentioned in this publication may not be eligible for sale in some states or countries.
All the information contained herein is based upon information available to the public and has been obtained from sources believed to be reliable. However, Espírito Santo Investment Bank Research does not guarantee the accuracy or completeness of the information contained in this report. The opinions expressed herein are Espírito Santo Investment Bank Research present opinions only, and are subject to change without prior notice. Espírito Santo Investment Bank Research is not under any obligation to update or keep current the information and the opinions expressed herein nor to provide the recipient with access to any additional information.
Espírito Santo Investment Bank Research has not entered into any agreement with the issuer relating to production of this report. Espírito Santo Investment Bank Research does not accept any form of liability for losses or damages which may arise from the use of this report or its contents.
Ownership and Material Conflicts of Interest
Banco Espírito Santo de Investimento, S.A. and/or its Affiliates (including all entities within Espírito Santo Investment Bank Research) and/or their directors, officers and employees, may have, or have had, interests or qualified holdings on issuers mentioned in this report. Banco Espírito Santo de Investimento, S.A. and/or its Affiliates may have, or have had, business relationships with the companies mentioned in this report. However, the research analysts may not purchase or sell securities or have any interest whatsoever in companies subject to their opinion.
Banco Espírito Santo Group has a qualified shareholding (1% or more) in EDP, Portugal Telecom and Providência. Portugal Telecom has either a direct or indirect qualified shareholding (2% or more) in Banco Espírito Santo, S.A.
Pursuant to Polish Ministry of Finance regulations, we inform that Banco Espírito Santo Group companies and/or Banco Espírito Santo de Investimento, S.A. Branch in Poland do not have a qualified shareholding in the Polish Securities Issuers mentioned in this report higher than 5% of its total share capital.
The Chief Executive Officer of Banco Espírito Santo de Investimento, S.A., Mr. José Maria Ricciardi, is a member of EDP’s General and Supervisory Board. Mr. Rafael Valverde, a member of the board of Banco Espírito Santo de Investimento, S.A., is a non-executive board member of EDP Renováveis. Mr. Ricardo Abecassis Espírito Santo Silva, a member of the board of Banco Espírito Santo de Investimento, S.A., is a board member of Brazil Hospitality Group.
Banco Espírito Santo de Investimento, S.A and/or its subsidiaries are liquidity providers or market makers for Altri, Usiminas and Vale.
Banco Espírito Santo de Investimento, S.A. and/or its subsidiaries participate or have participated as a syndicate member in share offerings of Aliansce, Brazil Hospitality Group, Iguatemi, IQE plc, Marfrig, Minerva, Santander, Vertu Motors and ZE PAK in the last 12 months.
Banco Espírito Santo de Investimento, S.A. and/or its subsidiaries participate or have participated as a syndicate member in the bond issues of the following companies: EDP, Galp Energia, Jerónimo Martins, Mota-Engil, Portugal Telecom, REN and Sonae in the last 12 months.
Banco Espírito Santo de Investimento, S.A. and/or its subsidiaries provided investment banking services to the following companies: 4imprint, Aliansce, AGA Rangemaster Group, Brazil Hospitality Group, Burford Capital, Casino Guichard, EDP, EDP Renovaveis, Ence, Galp Energia, Godrej Consumer Products, Iguatemi, ImmuPharma, Impax Asset Management Group, Inditex, IQE, Jerónimo Martins, Kcom Group, Kredyt Inkaso, Kruk, Laird, Marfrig, Minerva, Mota-Engil, Novae Group Plc, Portugal Telecom, REN, Rovi, Santander, Semapa, Sonae, Sports Direct, SVG Capital, Ted Baker, Tim, Vertu Motors, Xchanging, ZE PAK and ZON Multimédia in the last 12 months.
Page 72 of 73

Page 8 of 8
Banco Espírito Santo Group has been a partner to Mota-Engil in the infrastructure business in Portugal and other countries. Mota-Engil and Banco Espírito Santo Group, through ES Concessões, S.G.P.S., S.A., have created a joint holding company – Ascendi – for all stakes in transportation infrastructure concessions, in Portugal and abroad. Banco Espírito Santo de Investimento, S.A. provided, or continues to provide, investment banking services to Ascendi.
Banco Espírito Santo de Investimento, S.A. and/or its subsidiaries do and seek to provide investment banking or other services to the companies referred to in this research report. As a result, investors should be aware that a conflict of interest may exist.
Market Making UK
Execution Noble Limited is a Market Maker in companies covered and may sell to or buy from customers as principal in certain financial instruments listed or admitted to listing on the London Stock Exchange. For information on Companies to which Execution Noble Limited is a Market Maker please see “Execution Noble Limited UK Market Making” on http://www.espiritosantoib-research.com.
Confidentiality
This report cannot be reproduced, in whole or in part, in any form or by any means, without Espírito Santo Investment Bank Research’s specific written authorization. This report is confidential and is intended solely for the designated addressee. Therefore any disclosure, replication, distribution or any action taken in reliance on it, is prohibited and unlawful. Receipt and/or review of this research report constitutes your agreement not to redistribute, retransmit, or disclose to others the contents, opinions, conclusion, or information contained in this report (including any investment recommendations, estimates or price targets without first obtaining express permission from an authorized officer of Banco Espírito Santo de Investimento, S.A.
Regulatory Authorities
For information on the identity of the Regulatory Authorities that supervise the entities included within Espírito Santo Investment Bank Research please see http://www.espiritosantoib-research.com.
IMPORTANT DISCLOSURES FOR U.S. PERSONS
This report was prepared by Espírito Santo Investment Bank Research, a global brand name for the equity research teams of Banco Espírito Santo de Investimento, S.A., with headquarters in Lisbon, Portugal, of its Branches in Spain and Poland and of its affiliates BES Securities do Brasil, S.A – Corretora de Câmbio e Valores Mobiliários, in Brazil, Execution Noble Limited, in the United Kingdom, and Espirito Santo Securities India Private Limited, in India, all authorized to engage in securities activities according to each domestic legislation. Neither Banco Espírito Santo de Investimento, S.A. nor these affiliates are registered as a broker-dealer in the United States and therefore, is not subject to U.S. rules regarding the preparation of research reports and the independence of research analysts. This report is provided for distribution to U.S. institutional investors in reliance upon the exemption from registration provided by Rule 15a-6 of the U.S. Securities Exchange Act of 1934, as amended.
This report is confidential and not intended for distribution to, or use by, persons other than the addressee and its employees, agents and advisors.
E.S. Financial Services, Inc. is the U.S. distributor of this report. E.S. Financial Services, Inc. accepts responsibility for the contents of this report, subject to the terms set out below, to the extent that it is delivered to a U.S. person other than a major U.S. institutional investor. Any U.S. person receiving this report and wishing to effect securities transactions in any security discussed in the report should do so only through E.S. Financial Services, Inc.
Contact Information
Garreth Hodgson Senior Managing Director / Head of Sales (212) 351-6054 [email protected]
Eva Gendell Vice President (212) 351-6058 [email protected]
James Kaloudis Executive Director (212) 351-6065 [email protected]
Lisa Gottardo Executive Director (212) 351-6060 [email protected]
Mike Williams Vice President (212) 351-6052 [email protected]
Pedro Marques Vice President (212) 351-6051 [email protected]
Poorva Upadhyaya Assistant Vice President (212) 351-6056 [email protected]
Rodrigo Carvalho Senior Managing Director (212) 351-6070 [email protected]
E.S. Financial Services, Inc. New York Branch 340 Madison Avenue, 12th Floor New York, N.Y. 10173
Each analyst whose name appears in this report certifies the following, with respect to each security or issuer that the analyst covers in this report: (1) that all of the views expressed in this report accurately reflect the personal views of the analyst about those securities and issuers; and (2) that no part of the compensation of the analyst was, is, or will be, directly or indirectly, related to the specific recommendations or views expressed by the analyst in this report.
The analysts whose names appear in this report are not registered or qualified as research analysts with the Financial Industry Regulatory Authority ("FINRA") and may not be associated persons of E.S. Financial Services, Inc. and therefore may not be subject to the applicable restrictions under FINRA Rules on communications with a subject company, public appearances and trading securities held by a research analyst account.
Ownership and Material Conflicts of Interest
Banco Espírito Santo de Investimento, S.A. and/or its Affiliates and/or their directors, officers and employees, may have, or have had, interests or qualified holdings on issuers mentioned in this report. Banco Espírito Santo de Investimento, S.A. and/or its Affiliates may have, or have had, business relationships with the companies mentioned in this report.
For a complete list of the covered Issuers in which Banco Espírito Santo de Investimento, S.A. or its Affiliates hold stakes in excess of 1% and for information on possible material conflicts of interest arising from investment banking activities please see “Important disclosures for US persons” on http://www.espiritosantoib-research.com.
Receipt of Compensation
For information on Receipt of Compensation from subject Issuers please see “Important disclosures for US persons” on http://www.espiritosantoib-research.com.
Representation to Investors
Espírito Santo Investment Bank Research has issued this report for information purposes only. All the information contained therein is based upon information available to the public and has been obtained from sources believed to be reliable. However, Espírito Santo Investment Bank Research does not guarantee the accuracy or completeness of the information contained in this report. The opinions expressed herein are our present opinions only, and are subject to change without prior notice. Espírito Santo Investment Bank Research is not under any obligation to update or keep current the information and the opinions expressed herein. This report is not, and should not be construed as an offer or a solicitation to buy or sell any securities or related financial instruments. The investment discussed or recommended in this report may be unsuitable for investors depending on their specific investment objectives and financial position. Where an investment is denominated in a currency other than the investor’s currency, changes in rates of exchange may have an adverse effect on the value, price of, or income derived from the investment. Past performance is not necessarily a guide to future performance. Income from investments may fluctuate. The price or value of the investments to which this report relates, either directly or indirectly, may fall or rise against the interest of investors. Any recommendation and opinion contained in this report may become outdated as a consequence of changes in the environment in which the issuer of the securities under analysis operates, in addition to changes in the estimates and forecasts, assumptions and valuation methodology used herein. The securities mentioned in this publication may not be eligible for sale in some states or countries. Espírito Santo Investment Bank Research does not accept any form of liability for losses or damages which may arise from the use of this report. Please note that investing in any non-U.S. securities or related financial instruments discussed in this research report may present certain risks. The securities of non-U.S. issuers may not be registered with the U.S. Securities and Exchange Commission or subject to regulation in the United States. Information on such non-U.S. securities or related financial instruments may be limited. Foreign companies may not be subject to audit and reporting standards and regulatory requirements comparable to those in the United States.
Page 73 of 73