covering first quarter 2021 volume 21, number 2 ... - ncda.com
TRANSCRIPT

Covering First Quarter 2021 Volume 21, Number 2
San Diego Auto OutlookComprehensive information on the San Diego County new vehicle market
Market Summary
Data Source: AutoCount data from Experian.
Annual Trend in County Market
Historical Data Source: AutoCount data from Experian.
Domestics consist of vehicles sold by GM, Ford, FCA (excluding Alfa and FIAT), and Tesla.
The graph above shows annual new retail light vehicle registrations from 2015 thru 2020 and Auto Outlook’s projection for 2021.
156885 156572 152543143314 138349
119841128500
0
50,000
100,000
150,000
200,000
2015 2016 2017 2018 2019 2020 2021Forecast
New
ligh
t veh
icle
regi
stra
tions
YTD '20 YTD '21 % Chg. Mkt. Share
thru Mar. thru Mar. '20 to '21 YTD '21
TOTAL 33,370 34,510 3.4%
Car 12,418 10,033 -19.2% 29.1%
Light Truck 20,952 24,477 16.8% 70.9%
Domestic 8,891 10,356 16.5% 30.0%
European 5,001 5,420 8.4% 15.7%
Japanese 16,439 15,939 -3.0% 46.2%
Korean 3,039 2,795 -8.0% 8.1%
FORECAST
Market Gets off to Good Start in 2021; 7.2% increase Predicted for Entire Year
Below is a summary of five key trends in the San Diego County new vehicle market.
County new retail light vehicle registrations increased 3.4% in the First Quarter of 2021The county market improved during the first three months of this year versus a year earlier, and the increase would have been higher were it not for the typical lag in measuring registra-tions. The recording of registrations can occur 15 days, or more, after the date of sale. So the March 2020 total likely reflects vehicles that were sold from around the middle of February to the middle of March, when COVID was bare-ly a factor. The full of impact of the pandemic will be evident in the Second Quarter, when the market could improve by more than 50%.
San Diego county new vehicle market pre-dicted to increase by 7.2% for all of 2021Here is the scenario that was hoped for in 2021: the vaccine rollout would expand as the year progressed, COVID would abate, full re-opening would occur, economic recovery would gain steam, and new car sales would head higher. But this scenario is far from guar-
anteed and the microchip shortage, and other supply-related bottlenecks have added some uncertainty. If the outlook for 2021 was only a function of demand, vehicle sales would likely be off to the races in the second half of the year, but lean inventories will act as a speed bump that will slow the pace of the recovery.
Light truck market share moves above 70%Combined SUV, pickup, and van sales contin-ued to improve. Higher gas prices might give a temporary boost to passenger car sales, but demand for trucks and SUVs should continue to fuel increases in light truck share.
Alternative powertrain market improvesHybrid and electric vehicle registrations were up 33% during the first three months of ‘21 versus the 3.4% increase in the overall market.
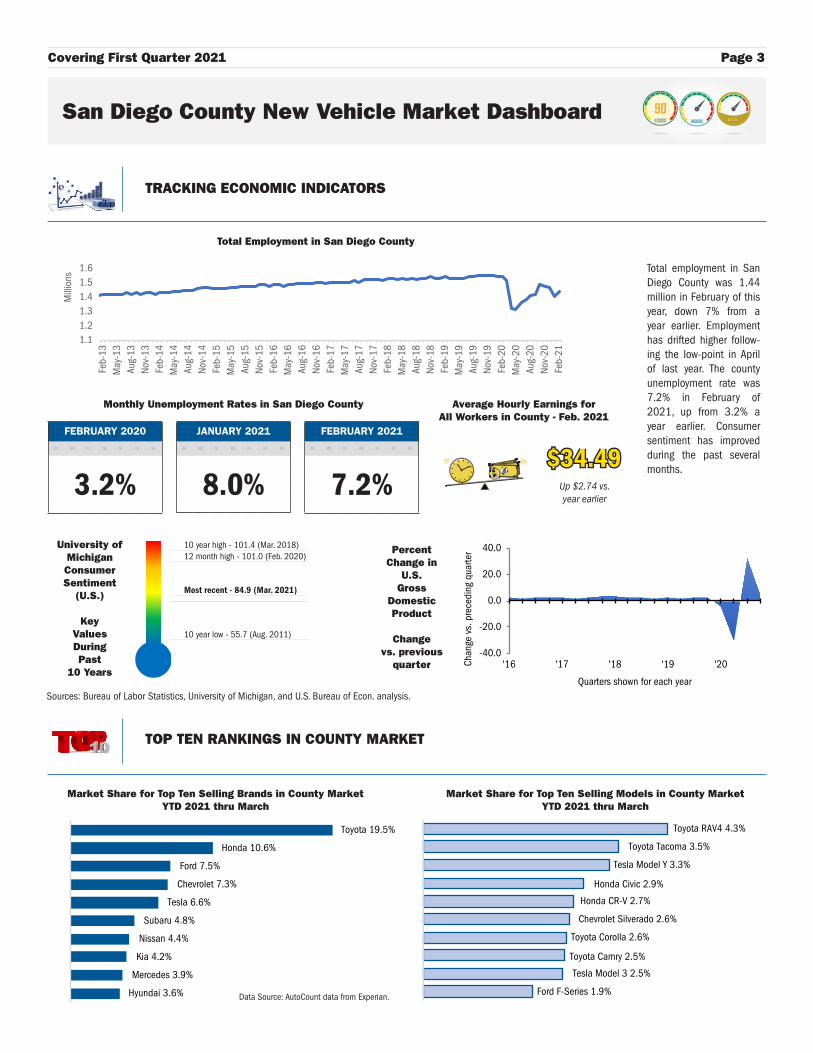
Toyota, Honda, Ford, Chevrolet, and Tesla are leaders in county marketToyota was the best selling brand in the First Quarter, with a 19.5% share. Honda’s county share was 10.6%, higher than its estimated 9.0% share in the U.S.
Low interest rates: Interest rates should re-main at historically low levels for the foresee-able future, supporting consumer affordability.
Pent up demand: Delayed purchases accrued due to the pandemic will give sales a boost for at least the next two years.
Employment: Hiring has accelerated and it’s possible that jobs lost during the pandemic could be recovered by the middle of 2022.
Economic stimulus: The Federal government has continued to support the economy, which will boost growth well into next year.
Tight inventories: Supply-induced production cutbacks will hold back the rate of growth in new vehicles sales during 2021.
Rising gas prices: Higher fuel prices reduce disposable income, but will spur interest in the bevy of electric vehicles hitting the market.
Key Factors Driving theCounty New Vehicle Market

Page 2 San Diego Auto Outlook
49.9% 53.9% 57.3% 60.9%67.1% 70.9%
2016 2017 2018 2019 2020 YTD '21
18.1% 18.3%21.1% 22.3% 22.5%
24.8%
2016 2017 2018 2019 2020 YTD '21
15.2 15.7 15.6 16.015.2
9.8
14.315.4 15.7
Q1 '19 Q2 '19 Q3 '19 Q4 '19 Q1 '20 Q2 '20 Q3 '20 Q4 '20 Q1 '21
Mill
ions
San Diego Auto OutlookPublished by:
Auto Outlook, Inc.PO Box 390, Exton, PA 19341
Phone: 610-640-1233 EMail: [email protected]: Jeffrey A. Foltz
Information quoted must be attributed to San Diego Auto Outlook, published by Auto Outlook, Inc. on behalf of the New Car Dealers Association San Diego County, and must also include the statement: “Data Source: AutoCount Data from Experian.” Copyright Auto Outlook, Inc., April 2021
At Auto Outlook, we strive to provide sound and accurate analyses and forecasts based upon the data available to us. However, our forecasts are derived from third-party data and contain a number of assumptions made by Auto Outlook and its management, including, without limitation, the accuracy of the data compiled. As a result, Auto Outlook can make no representation or warranty with respect to the accuracy or com-pleteness of the data we provide or the forecasts or projections that we make based upon such data. Auto Outlook expressly disclaims any such warranties, and undue reliance should not be placed on any such data, forecasts, projections, or predictions. Auto Outlook undertakes no obligation to update or revise any predictions or forecasts, whether as a result of any new data, the occurrence of future events, or otherwise.
San Diego County New Vehicle Market DashboardSan Diego County New Vehicle Market Dashboard
MARKET PERFORMANCE DURING PAST TWO YEARS
San Diego County Quarterly Registrations
Seasonally Adjusted Annual Rate, Converted to Equivalent U.S. New Vehicle Market SAAR
(millions of units)
The graph on the left provides an easily recognizable way to gauge the strength of the county market. It shows quarterly regis-trations based on a seasonally adjusted annual rate. These fig-ures are then indexed to SAAR sales figures for the U.S. new vehicle market. So just like in the national market, when the quarterly SAAR is above 17 mil-lion units, the county market is strong, 15 million is about av-erage, and below 13 million is weak. Quarterly registrations in the county recovered to a U.S. equivalent level of 15.7 mil-lion units in the First Quarter of 2021, up from the Fourth Quar-ter of last year.
Data Source: AutoCount data from Experian.
KEY TRENDS DURING PAST 5 YEARS
LightTruck
MarketShare
2016 thru 2020and
YTD ‘21 (March)
LuxuryBrand
MarketShare
2016 thru 2020and
YTD ‘21 (March)
Light truck share has increased by 21.0 share points since 2016.
Luxury brand share has increased by 6.7 share points since 2016.
Data Source: AutoCount data from Experian.
Covering First Quarter 2021 Page 3
Hyundai 3.6%
Mercedes 3.9%
Kia 4.2%
Nissan 4.4%
Subaru 4.8%
Tesla 6.6%
Chevrolet 7.3%
Ford 7.5%
Honda 10.6%
Toyota 19.5%
Ford F-Series 1.9%
Tesla Model 3 2.5%
Toyota Camry 2.5%
Toyota Corolla 2.6%
Chevrolet Silverado 2.6%
Honda CR-V 2.7%
Honda Civic 2.9%
Tesla Model Y 3.3%
Toyota Tacoma 3.5%
Toyota RAV4 4.3%
1.11.21.31.41.51.6
Feb-
13M
ay-1
3Au
g-13
Nov-
13Fe
b-14
May
-14
Aug-
14No
v-14
Feb-
15M
ay-1
5Au
g-15
Nov-
15Fe
b-16
May
-16
Aug-
16No
v-16
Feb-
17M
ay-1
7Au
g-17
Nov-
17Fe
b-18
May
-18
Aug-
18No
v-18
Feb-
19M
ay-1
9Au
g-19
Nov-
19Fe
b-20
May
-20
Aug-
20No
v-20
Feb-
21
Mill
ions
San Diego County New Vehicle Market Dashboard
TRACKING ECONOMIC INDICATORS
Total Employment in San Diego County
Up $2.74 vs. year earlier
FEBRUARY 2020SU MO TU WE TH FR SA
3.2%
Monthly Unemployment Rates in San Diego County
JANUARY 2021SU MO TU WE TH FR SA
8.0%
FEBRUARY 2021SU MO TU WE TH FR SA
7.2%
Average Hourly Earnings forAll Workers in County - Feb. 2021
$34.49$34.49
TOP TEN RANKINGS IN COUNTY MARKET
University ofMichiganConsumerSentiment
(U.S.)
KeyValuesDuringPast
10 Years
10 year low - 55.7 (Aug. 2011)
10 year high - 101.4 (Mar. 2018)12 month high - 101.0 (Feb. 2020)
-40.0
-20.0
0.0
20.0
40.0
'16 '17 '18 '19 '20Chan
ge v
s. p
rece
ding
qua
rter
Quarters shown for each year
PercentChange in
U.S.Gross
DomesticProduct
Changevs. previous
quarter
Sources: Bureau of Labor Statistics, University of Michigan, and U.S. Bureau of Econ. analysis.
Data Source: AutoCount data from Experian.
Total employment in San Diego County was 1.44 million in February of this year, down 7% from a year earlier. Employment has drifted higher follow-ing the low-point in April of last year. The county unemployment rate was 7.2% in February of 2021, up from 3.2% a year earlier. Consumer sentiment has improved during the past several months.
Market Share for Top Ten Selling Brands in County MarketYTD 2021 thru March
Market Share for Top Ten Selling Models in County MarketYTD 2021 thru March
Most recent - 84.9 (Mar. 2021)

Page 4 San Diego Auto Outlook
Non Luxury SUVs, 33%
Pickups and Vans, 14%Luxury SUVs, 10%
Small Cars, 23%
Luxury & Sports Cars, 9%
Non Luxury Mid Size & Large Cars,
11%
Non Luxury SUVs, 38%
Pickups and Vans, 17%
Luxury SUVs, 16%
Small Cars, 13%
Luxury & Sports Cars, 9%
Non Luxury Mid Size & Large Cars,
7%
YTD '20 YTD '21
Hybrid 6.1% 10.0%
Electric 7.9% 8.3%
Plug In Hybrid 2.1% 2.4%
Estimated Quarterly Alternative Powertrain Market Share(includes hybrid and electric vehicles)
The graph above shows estimated hybrid powertrain and electric vehicle market share. Registrations by powertrain for vehicles equipped with multiple engine types were estimated by Auto Outlook. The estimates are based on model registrations compiled by Experian, and engine installation rates collected from other sources.
YTD Share by Engine Type(2020 and 2021, thru March)
San Diego County New Vehicle Market Dashboard
TRACKING ELECTRIC AND HYBRID VEHICLE SALES
THREE YEAR CHANGE IN SEGMENT MARKET SHARES
Segment Market Shares in County YTD 2018 thru March
Segment Market Shares in County YTD 2021 thru March
Data Source: AutoCount data from Experian. Data Source: AutoCount data from Experian.
Non Luxury SUV Market Share, YTD ‘18:
33%Non Luxury SUV
Market Share, YTD ‘21:
38%
0.0%
2.0%
4.0%
6.0%
8.0%
10.0%
Q1'19
Q2'19
Q3'19
Q4'19
Q1'20
Q2'20
Q3'20
Q4'20
Q1'21
Electric Hybrid Plug In Hybrid
Electric vehicle market share was 8.3% in the First Quarter of 2021.

Covering First Quarter 2021 Page 5
Tesla Model 3
Honda Accord
Subaru Forester
Subaru Outback
Ford Explorer
Mazda CX5
Toyota Prius
Toyota Corolla
Toyota Camry
Honda HR-V
Honda Civic
Ford F-Series
Lexus RX
Ford Ranger
Toyota RAV4
Ram Pickup
Jeep Wrangler
Honda CR-V
Toyota Highlander
Toyota 4Runner
Toyota Tacoma
Chevrolet Silverado
Subaru Crosstrek
Nissan Rogue
Chevrolet Traverse
-50 -40 -30 -20 -10 0 10 20 30 40 50
Non Luxury SUVs, 38%
Pickups and Vans, 17%
Luxury SUVs, 16%
Small Cars, 13%
Luxury & Sports Cars, 9%
Non Luxury Mid Size & Large Cars,
7%
CHANGE IN MODEL RANKINGS
Chevrolet Traverse Moves Up in Rankings
The graph below shows the change in rankings during the first three months of 2020 to the same period this year for the top 25 selling models in the San Diego County market. Models are positioned on the graph from top to bottom based on the change in rankings. The biggest gainer was the Chevrolet Traverse. Other big winners were Nissan Rogue and Subaru Crosstrek.
Change in rankings from YTD ‘20 to YTD ‘21
Models on this side moved down in the rankings Models on this side of the graph moved up in the rankings
Chevrolet Traverse moved up 35 positions. It was the 59th best seller during the first three months of ‘20, and moved up to 24th this year.
Change in Rankings for Top 25 Selling Models - YTD ‘20 thru March to YTD ‘21
Source: AutoCount data from Experian.

Page 6 San Diego Auto Outlook
2.7
3.1
3.7
5.1
6.0
6.5
6.8
7.1
25.5
30.4
0.0 5.0 10.0 15.0 20.0 25.0 30.0 35.0
Subaru
Dodge
Ford
Volkswagen
Chevrolet
Kia
Hyundai
Nissan
Honda
Toyota
Share of non luxury car market (%)
3.7
4.1
5.3
5.5
5.8
7.8
9.7
11.1
12.1
24.4
0.0 5.0 10.0 15.0 20.0 25.0 30.0
Ram
Hyundai
Kia
Nissan
Jeep
Subaru
Honda
Chevrolet
Ford
Toyota
Share of non luxury light truck market (%)
1.3
1.5
1.9
3.0
5.6
6.3
9.4
14.6
14.8
36.5
0.0 10.0 20.0 30.0 40.0
Cadillac
Infiniti
Volvo
Acura
Porsche
Audi
Lexus
Mercedes
BMW
Tesla
Share of luxury car market (%)
2.4
3.1
3.4
4.7
8.2
9.8
10.4
13.6
16.4
21.6
0.0 5.0 10.0 15.0 20.0 25.0
Cadillac
Porsche
Acura
Volvo
Land Rover
Audi
BMW
Lexus
Mercedes
Tesla
Share of luxury light truck market (%)
BRAND SCOREBOARD - PART ONE
Brand Market Share Leaders in Primary Segments
Top 10 Non Luxury Car Brands in County MarketYTD 2021 thru March
Top 10 Luxury Car Brands in County MarketYTD 2021 thru March
Top 10 Non Luxury Truck Brands in County MarketYTD 2021 thru March
Top 10 Luxury Light Truck Brands in County MarketYTD 2021 thru March
Leading Car Brands
Non Luxury: Toyota, Honda, and NissanLuxury: Tesla, BMW, and Mercedes
Leading Light Truck Brands
Non Luxury: Toyota, Ford, and ChevroletLuxury: Tesla, Mercedes, and Lexus
Data Source: AutoCount data from Experian.
Data Source: AutoCount data from Experian.
Covering First Quarter 2021 Page 7
0.5%
3.8%
0.7%
3.9%
1.4%
1.9%
2.1%
2.1%
2.1%
5.5%
4.3%
2.4%
4.3%
5.0%
4.5%
2.0%
11.1%
10.9%
9.0%
13.9%
1.0%
1.3%
1.4%
2.0%
2.1%
2.5%
2.6%
3.0%
3.0%
3.1%
3.6%
3.9%
4.2%
4.4%
4.8%
6.6%
7.3%
7.5%
10.6%
19.5%
0.0% 5.0% 10.0% 15.0% 20.0% 25.0%
Porsche
GMC
Land Rover
Ram
Audi
Mazda
Volkswagen
BMW
Lexus
Jeep
Hyundai
Mercedes
Kia
Nissan
Subaru
Tesla
Chevrolet
Ford
Honda
Toyota
Market Share
County U.S.
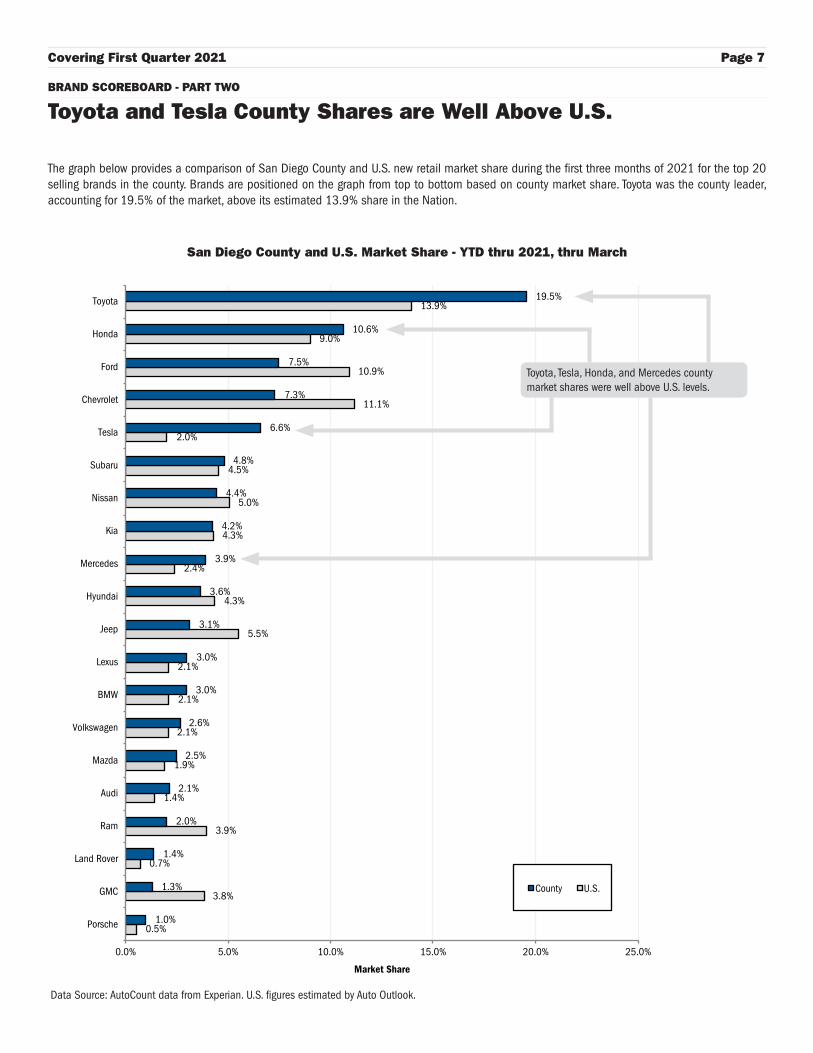
The graph below provides a comparison of San Diego County and U.S. new retail market share during the first three months of 2021 for the top 20 selling brands in the county. Brands are positioned on the graph from top to bottom based on county market share. Toyota was the county leader, accounting for 19.5% of the market, above its estimated 13.9% share in the Nation.
BRAND SCOREBOARD - PART TWO
Toyota and Tesla County Shares are Well Above U.S.
San Diego County and U.S. Market Share - YTD thru 2021, thru March
Data Source: AutoCount data from Experian. U.S. figures estimated by Auto Outlook.
Toyota, Tesla, Honda, and Mercedes county market shares were well above U.S. levels.

Page 8 San Diego Auto Outlook
Toyo
ta
Hon
da
Sub
aru
Nis
san
Jeep
Maz
da Kia
Ford
Hyu
ndai
Che
vrol
et
Volk
swag
en
Bui
ck
GM
C
MIN
I
Mits
ubis
hi
FIAT
0
500
1000
1500
YTD
2021 R
egis
trat
ions
Compact SUV
Subcompact SUV
18.3%
11.2%
6.5% 5.7% 5.6% 5.1% 4.8%
3.6% 3.4% 3.2% 2.9% 2.6% 2.3% 2.2% 2.2%
SMALL SUV CLOSE UP
Toyota is Top Selling Non-Luxury Small SUV Brand
New Retail Light Vehicle Registrations in Non-Luxury Small SUV Segments - YTD 2021 thru March
The graph below shows new retail light vehicle registrations for Small Non-Luxury SUV brands. Brands are positioned from left to right based on the combined total for Subcompact and Compact models. Each circle corresponds to brand registrations for Subcompact SUVs (orange circle) and Compact SUVs (blue circle).
Data Source: AutoCount data from Experian.
Top 15 Selling Small SUVs in San Diego CountyYTD 2021 thru March
(Includes Subcompact and Compact Models)
RAV4 was the best-seller among SubCompact and Compact SUV models.
Data Source: AutoCount data from Experian.
Subcompact SUVs ranked relatively high for Subaru.
Toyota was the best-selling Non-Luxury Small SUV brand

Covering First Quarter 2021 Page 9
0.0%
2.0%
4.0%
6.0%
8.0%
10.0%
12.0%
14.0%
16.0%
18.0%
3 yrs. old or newer
4 to 6 yrs. old
3.4%
-4.3%
-15.7%
6.9%8.5%
New vehicles All used vehicles 3 year old or newer used vehicles
4 to 6 year oldused vehicles
7 to 10 year oldused vehicles
SAN DIEGO COUNTY USED VEHICLE MARKET
County Used Vehicle Market Posts Small Decline in 1Q ‘21
Percent Change in New and Used Vehicle Registrations YTD 2021 thru March vs. YTD 2020
Used vehicle registrations in San Diego County declined 4.3% during the first three months of 2021 versus the same period a year earlier.
The nearly new used vehicle market (3 years old or newer) declined at a faster pace than older vehicles.
Used vehicle market has been given a boost by sparse new vehicle inventories and cost conscious consumers. Used vehicle market should remain relatively strong during 2021.
3 KEY TRENDS INUSED VEHICLE
MARKET
01.
02.
03.
Data Source: AutoCount data from Experian.
USED VEHICLE BRAND MARKET SHARE
Toyota is Top Seller in County Used Vehicle Market
Brand Market Share for Top 15 Selling Brands, by Vehicle Age (YTD ‘21 thru March)
Ford market share was higher for 4 to 6 year old vehicles.
Data Source: AutoCount data from Experian.
The graph below shows used light vehicle registrations by brand for two age categories: vehicles newer than three years old, and vehicles four to six years old. Brands are positioned from left to right based on market share for three year old or newer vehicles.
Toyota was the best-selling brand for 3 year old or newer vehicles.

Page 10 San Diego Auto Outlook
The table above shows new retail light vehicle (car and light truck) registrations in San Diego County. Figures are shown for the First Quarters of 2020 and 2021, and annual totals for 2019 and 2020. The top ten ranked brands in each category are shaded yellow.
Brand Registrations ReportSan Diego County New Retail Car and Light Truck Registrations
First Quarter Annual Totals
Registrations Market Share (%) Registrations Market Share (%)
1Q '20 1Q '21 % change 1Q '20 1Q '21 Change 2019 2020 % change 2019 2020 Change
TOTAL 33,370 34,510 3.4 138,349 119,841 -13.4
Cars 12,418 10,033 -19.2 37.2 29.1 -8.1 54,108 39,426 -27.1 39.1 32.9 -6.2
Light Trucks 20,952 24,477 16.8 62.8 70.9 8.1 84,241 80,415 -4.5 60.9 67.1 6.2
Domestic Brands 8,891 10,356 16.5 26.6 30.0 3.4 36,070 33,700 -6.6 26.1 28.1 2.0
European Brands 5,001 5,420 8.4 15.0 15.7 0.7 20,799 17,915 -13.9 15.0 14.9 -0.1
Japanese Brands 16,439 15,939 -3.0 49.3 46.2 -3.1 69,974 57,933 -17.2 50.6 48.3 -2.3
Korean Brands 3,039 2,795 -8.0 9.1 8.1 -1.0 11,506 10,293 -10.5 8.3 8.6 0.3
Acura 387 279 -27.9 1.2 0.8 -0.4 1,499 1,206 -19.5 1.1 1.0 -0.1
Alfa Romeo 76 49 -35.5 0.2 0.1 -0.1 359 203 -43.5 0.3 0.2 -0.1
Audi 665 730 9.8 2.0 2.1 0.1 2,477 2,202 -11.1 1.8 1.8 0.0
BMW 1,096 1,025 -6.5 3.3 3.0 -0.3 4,421 3,558 -19.5 3.2 3.0 -0.2
Buick 102 69 -32.4 0.3 0.2 -0.1 352 300 -14.8 0.3 0.3 0.0
Cadillac 105 171 62.9 0.3 0.5 0.2 584 439 -24.8 0.4 0.4 0.0
Chevrolet 1,738 2,516 44.8 5.2 7.3 2.1 7,231 7,517 4.0 5.2 6.3 1.1
Chrysler 99 114 15.2 0.3 0.3 0.0 498 326 -34.5 0.4 0.3 -0.1
Dodge 298 289 -3.0 0.9 0.8 -0.1 1,178 1,068 -9.3 0.9 0.9 0.0
FIAT 18 2 -88.9 0.1 0.0 -0.1 147 33 -77.6 0.1 0.0 -0.1
Ford 2,424 2,581 6.5 7.3 7.5 0.2 11,026 9,465 -14.2 8.0 7.9 -0.1
Genesis 59 77 30.5 0.2 0.2 0.0 187 157 -16.0 0.1 0.1 0.0
GMC 318 447 40.6 1.0 1.3 0.3 1,370 1,399 2.1 1.0 1.2 0.2
Honda 4,084 3,660 -10.4 12.2 10.6 -1.6 17,618 14,094 -20.0 12.7 11.8 -0.9
Hyundai 1,353 1,259 -6.9 4.1 3.6 -0.5 5,330 4,706 -11.7 3.9 3.9 0.0
Infiniti 239 152 -36.4 0.7 0.4 -0.3 1,198 732 -38.9 0.9 0.6 -0.3
Jaguar 91 62 -31.9 0.3 0.2 -0.1 345 261 -24.3 0.2 0.2 0.0
Jeep 1,037 1,079 4.1 3.1 3.1 0.0 5,020 4,262 -15.1 3.6 3.6 0.0
Kia 1,627 1,459 -10.3 4.9 4.2 -0.7 5,989 5,430 -9.3 4.3 4.5 0.2
Land Rover 359 474 32.0 1.1 1.4 0.3 1,413 1,266 -10.4 1.0 1.1 0.1
Lexus 1,059 1,036 -2.2 3.2 3.0 -0.2 4,640 3,715 -19.9 3.4 3.1 -0.3
Lincoln 141 128 -9.2 0.4 0.4 0.0 544 439 -19.3 0.4 0.4 0.0
Maserati 38 18 -52.6 0.1 0.1 0.0 144 95 -34.0 0.1 0.1 0.0
Mazda 1,051 848 -19.3 3.1 2.5 -0.6 4,203 3,585 -14.7 3.0 3.0 0.0
Mercedes 1,005 1,348 34.1 3.0 3.9 0.9 4,802 4,210 -12.3 3.5 3.5 0.0
MINI 112 72 -35.7 0.3 0.2 -0.1 406 462 13.8 0.3 0.4 0.1
Mitsubishi 79 39 -50.6 0.2 0.1 -0.1 372 197 -47.0 0.3 0.2 -0.1
Nissan 1,553 1,529 -1.5 4.7 4.4 -0.3 7,660 5,591 -27.0 5.5 4.7 -0.8
Other 68 73 7.4 0.2 0.2 0.0 323 213 -34.1 0.2 0.2 0.0
Porsche 227 340 49.8 0.7 1.0 0.3 1,013 932 -8.0 0.7 0.8 0.1
Ram 552 692 25.4 1.7 2.0 0.3 2,400 2,295 -4.4 1.7 1.9 0.2
Subaru 1,708 1,651 -3.3 5.1 4.8 -0.3 6,884 6,341 -7.9 5.0 5.3 0.3
Tesla 2,077 2,270 9.3 6.2 6.6 0.4 5,867 6,190 5.5 4.2 5.2 1.0
Toyota 6,279 6,745 7.4 18.8 19.5 0.7 25,900 22,472 -13.2 18.7 18.8 0.1
Volkswagen 948 909 -4.1 2.8 2.6 -0.2 3,891 3,354 -13.8 2.8 2.8 0.0
Volvo 298 318 6.7 0.9 0.9 0.0 1,058 1,126 6.4 0.8 0.9 0.1Source: AutoCount data from Experian.