cpb document · pdf filecpb document no 119 june, ... relate variation in local policing...
TRANSCRIPT

CPB Document
No 119
June, 2006
Evaluating the push for tougher, more targeted
policing in the Netherlands
Evidence from a citizen survey
Ben Vollaard

2
CPB Netherlands Bureau for Economic Policy Analysis
Van Stolkweg 14
P.O. Box 80510
2508 GM The Hague, the Netherlands
Telephone +31 70 338 33 80
Telefax +31 70 338 33 50
Internet www.cpb.nl
ISBN 90-5833-276-4

3
Abstract in English
In this study, we estimate the effects of a tougher, more targeted police response to criminal and
disorderly behaviour (‘proactive policing’). We use a citizen survey providing unique data on
hard-to-observe dimensions of police work for every single municipality in the Netherlands. We
relate variation in local policing strategies to individual data on victimisation of crime and
experience of disorder and fear of crime over the period 1993-2001. The sample includes some
370,000 residents randomly selected from the Dutch population. We control for individual
background characteristics and fixed municipality characteristics. We find evidence that stricter
law enforcement is effective in reducing disorder, fear of crime, violent crime and property
crime. Concentrating visible police presence at ‘hot spots’ is effective in combating disorder,
fear of crime, and property crime. As a result of proactive policing during the period 2003-
2005, crime and disorder went down substantially. Fear of crime has been reduced as well.
Key words: police, effectiveness, proactive policing, disorder policing, hot spots policing.
JEL code: K4 – Legal procedure, the Legal System, and Illegal Behaviour
Abstract in Dutch
In deze studie schatten we het effect op de veiligheid van een strenger handhavingsbeleid en
een politietoezicht dat gericht is op de meest onveilige plekken. Enquêtegegevens uit de
Politiemonitor Bevolking vormen de bron van gegevens over de stijl van optreden van de lokale
politie. We relateren variatie in het optreden van de lokale politie aan individuele gegevens over
slachtofferschap van criminaliteit en ervaring van overlast en onveiligheidsgevoelens over de
periode 1993-2001. De steekproef omvat circa 370.000 respondenten die willekeurig zijn
geselecteerd uit de Nederlandse bevolking. We controleren voor individuele
achtergrondkarakteristieken en over de tijd constante kenmerken van gemeenten. We vinden
empirisch bewijs voor een effect van strenger handhaven op overlast, gevoelens van
onveiligheid en vermogenscriminaliteit en geweldscriminaliteit. Meer gericht toezicht op de
meest onveilige plekken resulteert in een afname van overlast, gevoelens van onveiligheid en
vermogenscriminaliteit. Dankzij strenger en gerichter politieoptreden in de periode 2003-2005
is de veiligheid verhoogd. Ook voelen mensen zich veiliger.
Steekwoorden: politie, criminaliteit, overlast, effectiviteit, slachtofferenquête.

4

5
Contents
Preface 7
Samenvatting 9
Summary 13
1 Introduction 17
2 A tougher and more targeted police response 21
3 Dutch Victimisation Survey 23
4 Research design 27
5 Estimation results 33
6 Conclusions 39
References 41


7
Preface
Without empirical evidence on what works and what doesn’t, policymakers are in the dark
regarding the best way of enhancing police performance. This study contributes to the growing
research efforts aimed at identifying the effect of policing strategies. This research report fits in
a series of studies into policing within the CPB, with earlier work focusing on the value added
of performance contracts for police forces, the effect of the police funding formula on
performance of police forces, and the effect of an increase in police personnel on crime and
disorder.
We gratefully acknowledge the Department of the Interior and the Department of Justice for
providing survey data from the Dutch Victimisation Survey (Politiemonitor Bevolking, PMB).
Mervin van Veen from Intomart GfK provided helpful assistance in working with the data from
the PMB. We thank Jaap Bos from the Centraal Justitieel Incassobureau for providing data on
the number of police fines at the level of municipalities.
We thank Jeannette Verbruggen for providing excellent research assistance. Without her
diligent work, the empirical analysis would not have been possible.
Several people kindly took the time to review a draft of the report, and provided many useful
suggestions on how to structure the analysis and how to present the results. Special thanks go to
Robert Dur (Erasmus Universiteit Rotterdam), Karin Lasthuizen (Vrije Universiteit
Amsterdam), Peter Versteegh (Politie Haaglanden), Frits Vlek (Commissie Politie en
Wetenschap) and to CPB colleagues Pierre Koning, Dinand Webbink and Machiel Mulder. We
also thank participants of the CPB seminar on May 30, 2006 and participants of the second
annual workshop on the economics of crime from the University of Maryland, June 5-6, 2006
for their comments and suggestions. The author greatly benefited from an invited stay at the
Institute of Criminology of the Hebrew University Jerusalem in November and December 2005.
Comments from David Weisburd and other people at the Institute were of great use to the study.
Coen Teulings, Director.

8

9
Samenvatting
Zowel het veiligheidsbeleid van veel gemeenten als het beleid van dit kabinet is gericht op
strenger en gerichter politieoptreden. Verschillende gemeenten richten de aandacht van de
politie op ‘hot spots’, de meest onveilige plekken. Daartoe monitoren zij ontwikkelingen in de
lokale veiligheidssituatie nauwgezet. In het Veiligheidsprogramma geeft het kabinet aan dat de
politie de handhaving en criminaliteitsbestrijding ‘weer naar behoren’ moet uitvoeren. Strenger
politieoptreden staat daarbij voorop:
Er is momenteel sprake van een op onderdelen te lang volgehouden gedoogcultuur en
‘tolerantie’ ten opzichte van criminogeen en overlastgevend gedrag in de (semi)-publieke
ruimte. Hiermee is de burger rekening gaan houden. De eerste correctie op regelovertredend
gedrag betreft vaak een strafrechtelijke. Het strafrecht is hierdoor vaak niet de laatste maar de
eerste schakel in de handhaving. (‘Naar een veiliger samenleving’, Ministerie van BZK en
Ministerie van Justitie, oktober 2002, p. 5, 6).
Over het effect van strenger en gerichter politieoptreden is nog weinig bekend, zeker binnen de
Nederlandse context. Een dergelijk beleid zou juist provocerend kunnen werken of zou kunnen
leiden tot verplaatsing van overlast en criminaliteit naar veiliger buurten. Zonder inzicht in de
effecten van deze aanpak, dan wel een alternatieve aanpak, blijft het voor beleidsmakers
onduidelijk wat de beste manier is om de criminaliteit en overlast te bestrijden. Om deze reden
analyseert het Centraal Planbureau in deze studie het effect van strengere handhaving en
gerichter toezicht op de veiligheid. Onderzoeksvraag is of de veiligheid zich gunstiger
ontwikkelt in gemeenten waarbinnen de politie relatief streng optreedt en relatief vaak zichtbaar
is op de meest onveilige plekken. Bron van gegevens over het optreden van de politie vormt de
Politiemonitor Bevolking, een jaarlijkse telefonische enquête onder de Nederlandse bevolking.
Andere gegevensbronnen zijn minder betrouwbaar of minder volledig.
Na het presenteren van de resultaten van het onderzoek gaan we in op de manier waarop we het
effect van de verandering in het politieoptreden hebben bepaald.
Onderzoeksresultaten en lessen voor beleid
Op basis van de uitkomsten van de empirische analyse trekken we de volgende conclusies:
1. Een strenger en meer gericht politieoptreden draagt bij aan een verhoging van de veiligheid.
Strenger politieoptreden en politietoezicht dat is gericht op de meest onveilige plekken verhoogt
de effectiviteit van de politie. Dankzij een hardere en meer gerichte aanpak heeft de politie in de
periode 2003-2005 de overlast met circa 5 procent verlaagd en de criminaliteit met 2 tot 3
procent. Ook voelen mensen zich veiliger. De effectievere inzet van politiemiddelen van de

10
laatste jaren vormt grotendeels een inhaalslag na een lange periode van voortdurend dalende
politieprestaties. De Politiemonitor Bevolking laat zien dat in de ogen van de burger de politie
sinds 2004 voor het eerst sinds 10 jaar beter is gaan presteren. Ontevredenheid over het
ingrijpen van de politie bij problemen in de eigen buurt neemt voor het eerst weer af. In 2003
was 38 procent van de burgers het eens met de stelling dat de politie niet hard genoeg optreedt,
in 2005 was dit percentage gezakt tot 34 procent. Daarnaast zien burgers de politie vaker op
plaatsen waar zij dat het meest belangrijk vinden. In 2003 was 55 procent het eens met de
stelling dat je de politie te weinig in de buurt ziet, in 2005 was dit percentage gezakt tot 48
procent.
2. Voor een verdere verhoging van de veiligheid lijkt het prikkelen tot ‘beter blauw’ kosten-
effectiever dan middelen vrijmaken voor ‘meer blauw’. Het kabinet heeft als doelstelling de
criminaliteit en overlast over de periode 2002-2008/2010 met circa 20 procent te verlagen.
Hiervan is inmiddels de helft gerealiseerd: het percentage mensen dat ten minste één keer per
jaar slachtoffer wordt van criminaliteit is met 11 procent gedaald (van 50 procent in 2002 tot 44
procent in 2005); het percentage mensen dat vaak te maken heeft met overlast is met 8 procent
gedaald (van 41 procent in 2002 tot 38 procent in 2005). Ook met de huidige effectiviteit van de
politie blijft een verhoging van de veiligheid met ‘meer blauw’ een kostbare aangelegenheid.
Een verdere daling van de criminaliteit en overlast met 10 procent is te bereiken met circa 20
procent extra politiepersoneel, zo blijkt uit een eerdere studie van het CPB. Dit zou neerkomen
op minimaal 630 miljoen euro extra personeelskosten per jaar. De kosten die zijn gemoeid met
het bereiken van een betere inzet van bestaande middelen zijn naar alle waarschijnlijkheid lager.
Het gaat hierbij bijvoorbeeld om kosten van het monitoren van ontwikkelingen in de lokale
veiligheidssituatie, het gebruiken van systemen om de inzet van politiepersoneel hierop af te
stemmen en het systematisch evalueren van het effect van politieoptreden.
3. Tevredenheid van de burger over het politieoptreden is een goede indicator om de politie op af
te rekenen. Gemiddeld genomen hebben burgers een goed idee van het presteren van de lokale
politie. Als de overheid de politie ook in de toekomst wil prikkelen tot prestatieverbetering, dan
biedt deze indicator een goede mogelijkheid voor bijvoorbeeld een onderlinge vergelijking van
de prestaties van politiekorpsen (‘benchmarking’). Voordeel van deze indicator vergeleken met
‘output’-indicatoren zoals het aantal staandehoudingen is dat de politie minder mogelijkheden
heeft alleen volgens de statistieken beter te presteren. Een eerdere studie van het CPB geeft ook
aan dat het verhogen van de tevredenheid van de burger meer in lijn ligt met wat van de politie
verwacht wordt dan het simpelweg verhogen van de ‘output’.

11
Aanpak
Hoe onderscheiden we het effect van strenger en gerichter politieoptreden op criminaliteit van
de vele andere factoren die de criminaliteit beïnvloeden? Schrijven we de invloed op de
criminaliteit van bijvoorbeeld minder drugsverslaafden niet onbedoeld toe aan deze verandering
in het politieoptreden?
Het basisidee achter de analyse is het volgende: als strenger en gerichter politieoptreden effect
heeft, dan zal de criminaliteit en overlast relatief sterk dalen in gemeenten waarbinnen de
politie relatief streng en gericht optreedt. We kijken naar veranderingen over de tijd. Hierdoor
hebben verschillen tussen gemeenten die constant zijn over de tijd geen invloed op de
resultaten. Denk bijvoorbeeld aan het mogelijke verschil in houding van burgers ten opzichte
van de politie in een gemeente in Drenthe en in een gemeente in Zuid-Holland. Als we geen
rekening zouden houden met deze verschillen tussen gemeenten, dan zouden we al snel het
effect van politieoptreden onderschatten. Zo lijkt harder politieoptreden samen te gaan met
meer overlast, simpelweg omdat een grotere mate van overlast nu eenmaal om een harder
optreden vraagt.
Daarnaast moeten we rekening houden met de reactie van de politie op veranderingen in de
veiligheidssituatie in een gemeente. Niet alle gemeentelijke kenmerken die samenhangen met
het optreden van de politie zijn immers constant over de tijd. Zo kan een gemeente met een
relatief ongunstige economische ontwikkeling te maken krijgen met meer criminaliteit en bij de
politie aandringen op harder ingrijpen. Harder optreden hangt dan samen met een ongunstige
ontwikkeling in de lokale veiligheidssituatie. Als we hier geen rekening mee zouden houden,
dan zouden we het effect van politieoptreden opnieuw onderschatten. Om dit te voorkomen
richten we ons op de periode 1993-2001. Uit analyses van de werkwijze van de politie weten
we dat gedurende deze periode zowel de verdeling van politiemiddelen als de keuze van aanpak
nauwelijks op veranderingen in de veiligheidsituatie reageren. Dat dit inderdaad het geval is
blijkt uit het feit dat onze resultaten niet veranderen wanneer we expliciet rekening houden met
gemeentelijke ontwikkelingen in samenstelling van de bevolking, het type woningen en de
werkloosheid gedurende deze periode. Een analyse voor de jaren 2003-2005 laat zien dat de
politie de laatste jaren veel sterker is gaan reageren op veranderingen in de veiligheidssituatie.
Dit resultaat bevestigt onze keuze om de meest recente jaren niet mee te nemen bij de analyse
van de effecten van politieoptreden op de veiligheid.
Bron van gegevens over het optreden van de politie vormt de Politiemonitor Bevolking, een
jaarlijkse telefonische enquête onder de Nederlandse bevolking. Een nadere analyse laat zien
dat burgers gemiddeld genomen een goed idee hebben van het presteren van de politie. Zo blijkt
het beeld dat burgers hebben van het presteren van een politiekorps overeen te stemmen met het
beeld van direct betrokkenen. Dezelfde verschillen in het optreden van de politie tussen

12
politieregio’s zien we jaar op jaar in de antwoorden van respondenten terug. Ook merken
burgers het wanneer de politie vaker bekeurt. De perceptie van het lokale politieoptreden door
burgers is dus niet willekeurig maar toont duidelijke patronen. We gebruiken de Politiemonitor
Bevolking ook als bron van gegevens over criminaliteit, overlast en onveiligheidsgevoelens.
Kortom, in onze analyse relateren we de kans op slachtofferschap van criminaliteit en overlast
aan het optreden van de lokale politie zoals burgers dat waarnemen, waarbij we rekening
houden met alle verschillen tussen gemeenten die constant zijn over de tijd en met de meeste
verschillen tussen gemeenten die veranderen over de tijd.
.

13
Summary
Both municipalities and the current administration are pushing the police towards a more
proactive approach: a tougher, more targeted police response to criminal and disorderly
behaviour. Several municipalities target police presence on ‘hot spots’, places with an elevated
risk on victimisation of crime and disorder. To that end, they closely monitor developments in
the local safety situation. The administration has a strong focus on stricter law enforcement. The
police should change its ‘culture of tolerance’ towards criminal and disorderly behaviour in
public spaces. The first strategy has been coined ‘hot spots policing’, the second strategy
‘disorder policing’. We use the term ‘proactive policing’ when referring to the combination of
the two strategies.
The empirical evidence on the effectiveness of proactive policing is limited, with virtually no
evidence within the Dutch context. Concentrating police presence at hot spots could lead to
displacement of crime into adjacent neighbourhoods. Alternatively, strict law enforcement
could undermine people’s willingness to cooperate with the police. Without evidence on the
effectiveness of this policing strategy, or other approaches, policy makers remain in the dark
regarding the best way to fight crime and disorder. Given the lack of research in this area, the
CPB Netherlands Bureau of Economic Policy initiated a study into the effects of proactive
policing on crime and disorder. Research question is whether crime and disorder go down more
rapidly in municipalities that follow a proactive approach to policing. Source of data on the
style of policing is the Dutch Victimisation Survey (PMB), a yearly telephone survey among
the Dutch population. Other sources of data are either less reliable or less complete.
Below, we first present our research findings and then discuss the way in which we analysed the
effect of policing on safety.
Findings and lessons for policy
Based on the results of the empirical analysis, we conclude the following:
1. Proactive policing contributes to greater safety. Both hot spots policing and disorder policing
increase police effectiveness. As a result of a tougher, more targeted policing during the period
2003-2005, the police reduced disorder by some 5 percent and crime by 2 to 3 percent. Fear of
crime has been reduced as well. The improvement in police effectiveness of the last years is
mostly a ‘reversal operation’ after a long period of declining police performance. In 2004,
dissatisfaction with police responsiveness to problems in the neighbourhood declined for the
first time in 10 years. Additionally, since 2004, people see the police more often at places where
they appreciate it most.

14
2. For a further increase in safety, strengthening incentives to enhance police performance seems
to be more cost-effective than increasing the level of police resources. This administration’s
goal is to lower crime and disorder by some 20 percent over the period 2002-2008/2010. We are
now halfway: the percentage of people who are victim of crime at least once a year declined
from 50 percent in 2002 to 44 percent in 2005; the percentage of people that frequently
experiences disorder declined from 41 percent in 2002 to 38 percent in 2005. Even with the
current level of police effectiveness it is very costly to realise a further 10 percent decline in
crime and disorder through greater numbers of police personnel. Based on findings from earlier
studies, some 20 percent more police personnel per capita would be necessary to achieve this
goal. That would mean some €630 million additional costs of personnel per year at a minimum.
The costs of efforts related to strengthening incentives are likely to be lower than the costs of
additional police personnel. The more so, since the long period of growing police resources but
declining police performance suggests a great amount of slack within the police organisation.
3. The police can be held accountable to citizen satisfaction with police work. Not only do citizens
have an idea of what the police do in their neighbourhood, their perceptions turn out to be
important determinants of police effectiveness as well. Holding the police accountable to
indicators of citizen satisfaction with police work is likely to provide incentives that are better
in line with the objectives of police work than output measures such as the number of fines.
Approach
How do we single out the impact of proactive policing from the many other factors affecting
crime and disorder? The basic idea behind this study is as follows: if proactive policing has an
effect, then crime and disorder should go down more rapidly in municipalities that follow this
approach to policing. We focus on changes over time. As a result, differences between
municipalities that are constant over time do not affect our estimates. Think of a difference in
attitude to the police in a rural municipality versus an urban municipality. If we would not take
these differences into account, we would underestimate the effectiveness of proactive policing.
After all, proactive policing seems to be related to higher crime and disorder, simply because
rougher conditions demand a tougher, more targeted approach.
We also need to account for the police response to changes in the local safety situation. Not all
municipality characteristics that are related to the style of policing are constant over time after
all. For instance, a municipality with a relatively unfavourable trend in unemployment could
demand a tougher approach to criminal and disorderly behaviour. In that case, stricter law
enforcement is related to unfavourable trends in crime and disorder. If we would not take this
police response into account, we would underestimate the effectiveness of proactive policing.
To prevent this estimation bias, we focus on the period 1993-2001. Studies into police work
suggest that neither means nor strategies responded to changes in crime and disorder during this

15
period. Indeed, our estimates are not affected by including a host of time-varying municipality
characteristics that are known to be drivers of trends in crime and disorder. An analysis for the
period 2003-2005 shows that the police are becoming more responsive to changes in the local
safety situation. This finding confirms our choice to exclude the most recent years from the
empirical analysis.
Source of data on style of policing is the Dutch Victimisation Survey. A closer analysis of the
survey shows that dissatisfaction with policing strategies reflects actual local police work.
Moreover, survey respondents are able to make a distinction between different dimensions of
police work. Survey responses show clear patterns that correspond with other sources of
information about police performance. We also use the Dutch Victimisation Survey as source of
data on crime, disorder, and fear of crime.
To conclude, in our analysis, we relate the probability of victimisation to the strategy of the
local police department as perceived by citizens, while controlling for all differences between
municipalities that are constant over time and for most differences between municipalities that
vary over time.


17
1 Introduction
1.1 Rationale
The police were doing less with more resources over the period 1993-2002. While police
personnel per capita grew by 20 percent, the percentage of people who stated that the police
react on problems in their neighbourhood declined from 63 percent in 1993 to 55 percent in
2002 (see figure 1.1). Even police visibility took a hit: the percentage of people who saw the
police at least once a week in their neighbourhood declined from 39 to 30 percent. Not only did
satisfaction with visible police work decline, productivity in criminal investigation went down
as well (Wiebrens, 2002). Vollaard and Koning (2005) show that the growth in police resources
did not go to complete waste as claimed by Vroegop and Tak (2005), but the effect of more
police personnel was certainly lower than possible. The newly formed regional police forces
enjoyed great freedom in their operations with little effective oversight at the national and local
level (Vlek et al., 2004). This lack of oversight combined with continuous growth in resources
contributed to ever-declining police performance.
Figure 1.1 Police resources and performance over 1993-2005 (1993=100)
80
90
100
110
120
130
1992 1994 1996 1998 2000 2002 2004 2006
Police personnel per capita (FTEs)
'Police react on problems in our neighbourhood' (% agree)
Number of convicted crimes (weighted with severity) per capita
Note: All data for the 25 regional police forces only. Each conviction is weighted with the severity of the crime, which is equal
to the number of days someone is on average incarcerated for having committed that crime. Other sanctions such as
financial penalties are translated into ‘prison day equivalents’, following the guidelines of the prosecution council. Figure for
1993 is based on an estimate.
Source: Prosecution Council, Department of the Interior, Dutch Victimisation Survey (PMB).

18
Outside intervention
By 2002, the government decided to intervene. The national government and many local
authorities called for a more ‘proactive’ approach to policing. The police should no longer
accept disorderly and criminal behaviour; the time of tolerating deviant behaviour (‘gedogen’)
is over. Visible police presence at ‘hot spots’ should increase and the police should take
immediate action against disorder and crime, especially from frequent and young offenders.
Government policy, laid down in the National Policing Plan 2003-2006 (‘Landelijk Kader
Nederlandse Politie’), also included other elements, such as a greater number of follow-up
criminal investigations and closer cooperation between the police and partner agencies at the
local and national level. As part of the new Policing Plan, the government introduced
performance contracts for each of the police forces, which were signed in the summer of 2003.
The performance contracts include a number of targets that should lead to a more proactive
police response to crime and disorder. In many cases, the goals of the National Policing Plan are
embedded in local initiatives to improve safety. Well-known examples include ‘Rotterdam
Veilig’, ‘Naar een veilig Den Haag’, and ‘Utrecht veilig!’. Figure 1.1 on the previous page
shows that people notice the move towards proactive policing. Dissatisfaction with the police
response to problems in the neighbourhood is no longer increasing. Additionally, productivity
in criminal investigation is increasing for the first time since 1993.
A shift towards more effective strategies is most welcome for the Dutch police, given the high
ambitions to improve safety and the modest growth in police resources. The goal is to lower
crime and public disorder by some 20 percent over the period 2002-2008/2010. Only with
greater efficiency and effectiveness of their operations, the police will be able to contribute to a
further decline in crime and disorder.
A push in the right direction?
Thus far, little firm empirical evidence is available on the effect of proactive policing and other
policing strategies within the Dutch context. Looking through twenty years of (exclusively
Dutch) material, Wittebrood and Van Beem (2004) find only two empirical studies on the
effects of policing strategies on crime that meet minimum scientific standards (including a
treatment and a control group, for instance).
Although the (almost exclusively American) literature on ‘what works in policing’ provides
some guidance (see Weisburd and Eck, 2004), complementing Dutch empirical research is
necessary. Not only is firm evidence scarce in the international literature, the situation in the
Netherlands may also be somewhat unique. For example, whereas police aggressiveness is a
major concern in the United States (and subject of endless study), many people in the
Netherlands find the police too little aggressive (see chapter 3). Compared to their American
colleagues, the Dutch police seem to be much more ‘friendly’ and ‘understanding’. Empirical

19
research is necessary to evaluate whether the policing strategies advocated in the National
Policing Plan are effective, and if so, what the size of the effect is. Such research informs policy
makers on the best way of enhancing police performance. Without firm evidence on what works
and what doesn’t within the Dutch context, policy makers stay in the dark regarding the best
way to improve police performance.
1.2 Research question
In this study, we address the following question:
Do municipalities with a tougher, more targeted police response to criminal and disorderly
behaviour (‘proactive policing’) achieve lower rates of crime, disorder and fear of crime?
We focus on proactive policing, since it is an essential element in both local and national policy.
Below, we discuss the scope of this study. First, we discuss our method to address this question.
1.3 Method
We use survey data from the Dutch Victimisation Survey (PMB) to estimate the effect of
proactive policing on crime, disorder, and fear of crime. Besides questions about victimisation
of crime and experience of disorder and fear, the PMB includes a range of questions about local
police work. Due to the large sample size of the PMB, we are able to take municipalities as the
unit of analysis. At this level, initiatives to combat crime and public disorder – in line with the
framework of the National Policing Plan – are made.1 Police statistics are not an alternative to
the survey data. Historic police statistics about policing strategies are either not available,
incomplete or unreliable. Later in this study, we discuss the accuracy of people’s perception of
police work.
1.4 Contribution to the literature
Little substantive research has been conducted on many of the key elements of commonly used
policing strategies (Weisburd and Eck, 2004). This study aims to contribute to this literature by
using a new source of data: a citizen survey. Given the broad scope of the survey, we are able to
incorporate a broad set of outcomes ranging from crime to disorder to fear of crime and two
different policing strategies. A great advantage of using survey data is the sample size. When
using observations of police work by researchers (the usual way of collecting data on police
work that are not readily available) information is available for only a few localities. Due to the
1 Another reason to choose the municipality as unit of analysis rather than the police region is the necessary number of
observations to estimate an effect. In the Netherlands, there are only 25 police regions, compared to 467 municipalities.

20
large sample size of the PMB, we have information for every single municipality in the
Netherlands.
1.5 Scope
The use of a victimisation survey as our primary source of data implies a specific focus of this
study:
• We focus on a more effective use of resources targeted at police patrol. We do not look into the
effect of shifting resources away from visible police work to other police tasks such as criminal
investigation.
• We focus on victims rather than offenders of crime. Consequently, policing strategies
specifically aimed at offenders – including a focus on young and frequent offenders – are
outside the scope. Victim-less crime and crime against business is not within the scope either.
• The questions in the survey specifically focus on police work, rather than the co-operation
between the police and other local organisations. Thus, we do not discuss the effect of better co-
operation between the police and partner organisations.
Additionally, it is not our aim to evaluate how well the outside pressure on the police was
designed. We do not look into the costs of performance contracts in terms of distortion of effort.
For an economic analysis of the performance contracts for police forces, see Vollaard (2003).
1.6 Structure
The study is organised as follows. Chapter 2 describes the policy to improve police
effectiveness and the existing evidence on their effectiveness. Chapter 3 describes our data. In
Chapter 4 and 5, we discuss the empirical strategy and estimation results. Chapter 6 concludes.

21
2 A tougher and more targeted police response
As discussed in the introductory chapter, one of the main goals of the National Policing Plan
and accompanying local initiatives is a tougher, more targeted police response to criminal and
disorderly behaviour. Below, we discuss the key elements of ‘proactive policing’: hot spots
policing and disorder policing – and the existing evidence on their effectiveness.
2.1 Greater police presence at hot spots (‘hot spots policing’)
Greater visible presence of the police at public spaces is central to the Policing Plan. With
greater visible presence, the police are better able to control behaviour in public spaces, and
intervene in case of offensive behaviour. Greater patrol presence should be concentrated on
places and times where people have a higher than average risk of victimisation of crime and
nuisance from public disorder. These are places like railway stations, shopping centres, areas
around coffee shops, spots were youth hang out, and so on.
As we will discuss in chapter 3, the empirical evidence suggests that the police are more often
visible in those places where people appreciate it most. The Hague is an example of a city that
implemented hot spots policing (see text box, and the discussion in the next chapter).
‘Hot spots policing’ in The Hague
Since 2004, The Hague police identifies hot spots at the level of streets and places. The policing strategy involves three
elements: first, intensified police presence at the hot spot for at least 12 months, second, a combination of law
enforcement and purely preventative activities, and third, coordinated action of police, municipality and partner
organisations. Every ten months, the situation at the hot spots is reported. For each hot spot, a number of indicators are
chosen based on reports of crime and disorder (for example: reports of nuisance from prostitutes, reports of nuisance
from public intoxication, reports of hemp growing, etc.). These statistics are combined with regular interviews with the
local population to create a picture of the situation at the hot spot. If public order has been restored for eight months and
people in the neighbourhood have been satisfied for the same period, then the hot spots is removed from the list. In
total, The Hague had some 20 hot spots by the end of 2005.
Source: Municipality of The Hague, Periodieke rapportage hotspots – mei-december 2005, January 2006.
The effectiveness of the hot spots policing approach has strong empirical support. Based on a
review of a series of randomised field trials, Braga (2001) concludes that hot spots policing can
result in substantial reductions in crime and disorder. Moreover, the evidence also suggests that
hot spots policing does not simply lead to displacement of crime into adjacent neighbourhoods.
Actually, intensive police intervention in one place turns out to have positive rather than
negative effects on surrounding areas. This ‘diffusion of crime control benefits’ has been
reported in a number of studies (Weisburd and Eck, 2004).

22
2.2 Disorder policing
In addition to targeting police presence at ‘hot spots’, the police should follow a strategy of
stricter law enforcement. The police should change its ‘culture of tolerance’ towards criminal
and disorderly behaviour in public spaces. Stricter enforcement means active intervention rather
than ‘leaving things as they are’, and implies interventions invoking the criminal justice system.
This approach should primarily lead to 180,000 additional fines and transactions after police
stops per year, an increase of 15 percent. With stricter, more aggressive law enforcement, crime
and public disorder are expected to go down. By 2005, the regional police forces had far
surpassed the target: the number of fines and transactions after police stops increased from 1.3
million in 2002 to 1.9 million in 2005.
In the literature, disorder policing is also known by the term ‘broken windows policing’. The
hypothesis underlying this approach is that intensive enforcement applied broadly to incivilities
and other types of disorder lead to reductions in serious crime (see Dur, 2006). The literature is
mostly focused on investigating the effect of disorder policing on serious crime, whereas this is
not the sole focus of the National Policing Plan. Whether disorder policing is successful in
bringing down public disorder has not been subject of much study, which is to not surprising
since police statistics provide a rather incomplete picture of disorder.
New York City under mayor Giuliani and chief of police Bratton provides the most prominent
example of broken windows policing. The effectiveness of their ‘get tough’ approach is hotly
debated. Claims of large effects on the crime rate have been challenged because the benefits
attributed to disorder policing are possibly confounded with other factors, such organisational
changes within the police and the end of the crack epidemic. In a recent study of monthly time-
series data spanning 1974-1999, Corman and Mocan (2005) include these possible confounding
factors, including economic conditions, the ‘Giuliani-factor’ (affecting police morale and
productivity) and deterrence variables such as number of police as well as felony arrests. They
conclude that the broken-windows hypothesis has validity in the case of robbery, motor vehicle
theft, and grand larceny. Earlier studies that investigate the impact of aggressive policing on
serious crime do not shed substantial light on the issues because of their empirical shortcomings
(Weisburd and Eck, 2004). In addition to standard identification difficulties, earlier papers
suffer from omitted-variable bias (Corman and Mocan, 2005, note 12).
2.3 Conclusion
The ‘what works in policing’ literature provides evidence on the effectiveness of hot spots
policing. The evidence for the effectiveness of disorder policing is more limited, with little to
no evidence for public disorder and one study about the effect on serious crime.

23
3 Dutch Victimisation Survey
We use the Dutch Victimisation Survey (PMB) as source of data on crime, disorder, fear of
crime and policing strategies. The PMB is a repeated cross-section telephone survey that is
unique in its sampling size. Whereas the US National Crime Victimisation Survey covers 1 out
of 2,000 of the population above 12 years of age, the PMB covers some 1 out of 200 of the
population above 15 years of age. As a result of PMB’s sample size, variables can be
disaggregated to the level of municipalities.
Table 3.1 Dutch Victimisation Survey, sample statistics
Meana
1993-2001
2003
2005
Standard deviation
1993-2001
Perception of local police work (agree, %)
Dissatisfaction with police visibility (‘Too little visible’) 54.4 55.0 48.4 1.7
Dissatisfaction with police aggressiveness (‘Too little aggressive’) 35.9 38.3 33.8 0.6
Dissatisfaction with police fining (‘Fine too little’) 30.5 29.3 25.5 1.6
Police visibility (‘See police at least once a week’) 33.1 29.9 30.6 2.6
Public disorder (frequently occurring problem, %)
Youth nuisance 11.4 13.2 11.9 1.3
Drugs nuisanceb 4.3 6.2 5.3 3.2
Public intoxication 7.6 7.4 7.0 0.3
Vandalism 18.1 20.0 18.3 1.5
Graffiti 15.2 12.5 10.5 1.1
Aggressive driving (tail gaiting, passing on the right) 20.9 17.7 14.9 2.1
Fear of crime (frequently occurring problem, %)
Feels unsafe (every now and then) 29.4 27.7 24.0 0.8
Avoids unsafe placesc 11.1 9.9 8.0 0.4
Keeps child at homec 23.3 23.1 18.7 1.6
Fear of theftc 17.2 15.8 14.3 1.3
Property crime (victimised at least once last year, %)
Burglary 7.1 4.9 4.1 1.2
Car theft and theft out of car 7.0 6.6 5.7 0.7
Bicycle theft 6.4 5.2 4.5 0.4
Purse theft (both violent and non-violent) 4.3 3.6 2.7 0.3
Violent crime (victimised at least once last year, %)
Threat with violence 5.1 5.9 4.9 0.5
Assault 1.0 0.9 1.0 0.0
Notes: (a) All variables are weighted; sample weights are based on age and gender. (b) Drugs nuisance was included in the survey as of
1997. (c) These three measures of fear are based on the survey responses on the following statements: ‘Drive or walk around to avoid
unsafe places’; ‘Not allowing children to go out because of safety reasons’; ‘Leaving valuable properties at home to prevent theft’.

24
For every survey wave, respondents have been selected at random from the total population
over 15 years of age. Per police region (and sometimes smaller areas), the interviewers used
stratified sampling. A minimum of 1,000 respondents were interviewed in each of the 25 police
regions. In many cases, police regions opted for a greater number of respondents. In total,
460,844 people were surveyed over the period 1993-2005. In recent years, the survey had a
response rate of about 70 percent.
All victimisation and police practices are observed at the individual level, only some property
crimes are measured at the household level (bicycle theft, burglary, car theft, theft from cars).
We look at car theft and theft from cars together, since car theft is a rare offence. In a
victimisation survey, rare offences are measured with greater uncertainty that frequently
occurring offences. Respondents are interviewed in the first ten weeks in the year a survey is
held, with victimisation reflecting the twelve months preceding the interview date. Table 3.1
summarises the key variables we use for the empirical analysis. Background characteristics of
respondents include age, gender, education level, ethnicity, housing type, household size, and
income status (employed, student, housewife, or else).
3.1 From survey questions to policing strategies
Part of the Dutch Victimisation Survey is dedicated to people’s perceptions of policing
strategies and satisfaction with police work in their own neighbourhood. Below, we discuss
how we match survey questions with the policing strategies discussed in chapter 2. Table 3.2
provides an overview of the way in which we match survey questions with policing strategies.
Typical of all selected survey questions is that they ask how well the police address local needs.
Respondents are asked to take the local situation into account when judging police work.
Table 3.2 Matching survey questions with policing strategies
Policing strategy Related survey question (selected response)
Do you see the police too little in the neighbourhood?
(yes)
Hot spots policing: the more precisely patrol presence is
concentrated at the ‘hot spots’ and ‘hot times’ of criminal
activity, the less crime occurs in those places and times. How often do you see the police in the street where you
live? (at least once a week)
The police do not act sufficiently forcefully, do you agree?
(yes)
Disorder policing: the more aggressive the police
response to disorderly behaviour, the less crime and public
disorder occurs. The police fine too little here, do you agree? (yes)
Hot spots policing
Hot spots policing implies shifting resources to those places were people need them most. Even
when keeping overall resources constant, a shift of resources to the places with an elevated risk
on victimisation should lower dissatisfaction about lack of police presence in a municipality. In
25
that case, the decline in dissatisfaction resulting from of a shift of police resources into bad
neighbourhoods will be greater than the increase in dissatisfaction resulting from a shift of
resources out of safe neighbourhoods. After all, in safe neighbourhoods people are satisfied
with lower levels of police presence than in unsafe neighbourhoods. Thus, with the two survey
questions ‘Do you see the police too little in the neighbourhood?’ and ‘How often do you see
the police in your street?’, we can determine whether a police department is implementing a
strategy of hot spots policing. Our method leaves open at which level local police departments
define hot spots; these can be neighbourhoods, streets or places (see Eck et al., 2005). In line
with the National Policing Plan, the evidence suggests that hot spots policing became more
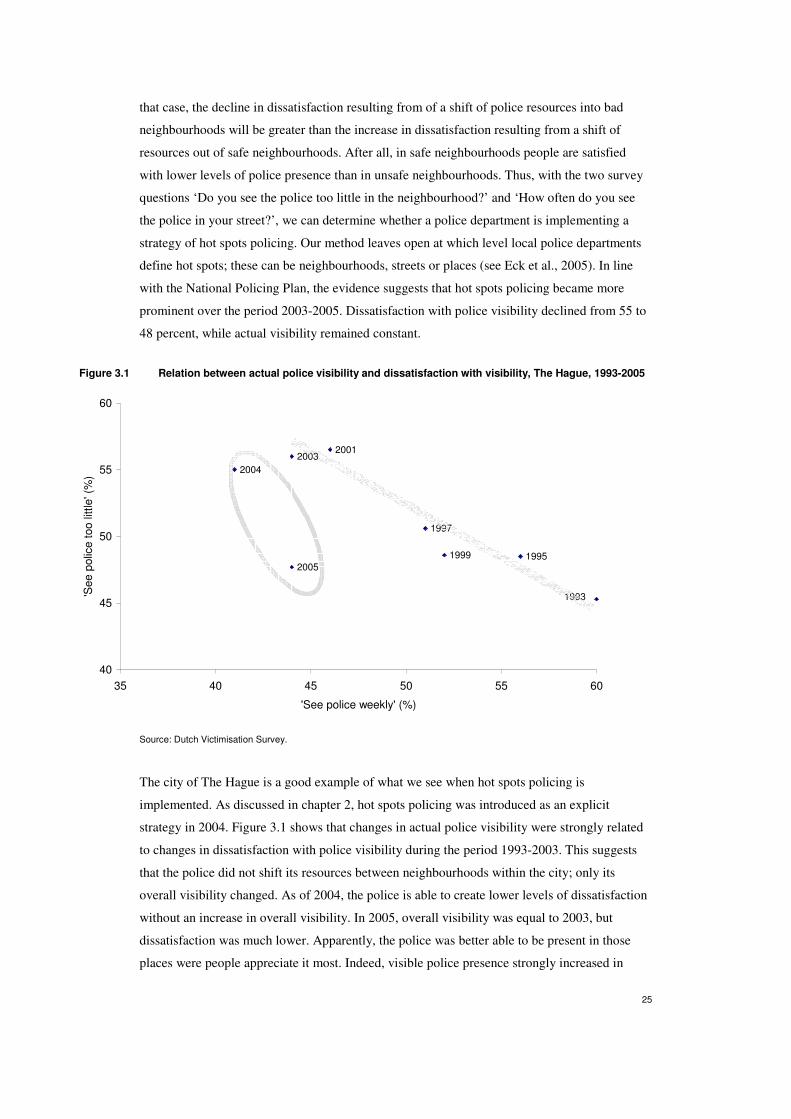
prominent over the period 2003-2005. Dissatisfaction with police visibility declined from 55 to
48 percent, while actual visibility remained constant.
Figure 3.1 Relation between actual police visibility and dissatisfaction with visibility, The Hague, 1993-2005
2005
20032001
1997
1999 1995
1993
2004
40
45
50
55
60
35 40 45 50 55 60
'See police weekly' (%)
'See p
olic
e t
oo little' (
%)
Source: Dutch Victimisation Survey.
The city of The Hague is a good example of what we see when hot spots policing is
implemented. As discussed in chapter 2, hot spots policing was introduced as an explicit
strategy in 2004. Figure 3.1 shows that changes in actual police visibility were strongly related
to changes in dissatisfaction with police visibility during the period 1993-2003. This suggests
that the police did not shift its resources between neighbourhoods within the city; only its
overall visibility changed. As of 2004, the police is able to create lower levels of dissatisfaction
without an increase in overall visibility. In 2005, overall visibility was equal to 2003, but
dissatisfaction was much lower. Apparently, the police was better able to be present in those
places were people appreciate it most. Indeed, visible police presence strongly increased in

26
relatively unsafe neighbourhoods like Schilderswijk and Laakkwartier, and remained more or
less constant in relatively safe neighbourhoods like Archipel and Ypenburg-Leidschenveen. The
anecdotal evidence for The Hague provides support for the two assumptions underlying our
method of measuring the implementation of hot spots policing. First, stronger hot spots policing
should not affect overall visibility over the municipality – barring other simultaneous changes
(the level of (visible) police resources did not change substantially over 2003-2005). Second,
dissatisfaction with police visibility should be strongly correlated with actual visibility. Such
was clearly the case during the period 1993-2001.
Figure 3.2 Dissatisfaction with police aggressiveness and police fining, the Netherlands, 1993-2005
22
26
30
34
38
42
1992 1994 1996 1998 2000 2002 2004 2006
Agre
e (
%)
'Too little aggressive' 'Fine too little'
Source: Dutch Victimisation Survey.
Disorder policing
The questions ‘The police do not act sufficiently forcefully, do you agree?’ and ‘The police fine
too little here, do you agree?’ are related to dissatisfaction with disorder policing. For crime
and disorder police fining is of limited information, however. Some 90 percent of all fines after
police stops are traffic related. For this reason, we use dissatisfaction with police fining in the
sensitivity analysis only. Figure 3.2 shows the development in dissatisfaction with police
aggressiveness and police fining over the period 1993-2005.

27
4 Research design
We use the variation in (satisfaction with) policing strategies between municipalities to identify
the impact on the probability of becoming victim of crime or experiencing disorder:
(1) Pr (yijt = 1 | η, X ) = α HOT SPOTSjt + β DISORDERjt + γ VISIBILITYjt + Xijt δ + ηj + µt + εijt
In this linear probability model, HOT SPOTSjt and DISORDERjt represent dissatisfaction with
these strategies in municipality j at time t; α and β are the parameters describing the effect of
these strategies. VISIBILITYjt reflects the actual visibility of the police in municipality j at time
t. Xijt is a matrix representing the characteristics of individual i, with δ as a vector describing
the effects of X. ηj indicates an effect on y specific for municipality j. To filter out any trends in
dissatisfaction with policing strategies across the nation, we include year fixed effects µt.
Finally, εijt is the error term of the model. We assume this error term to be identically and
independently distributed, with mean zero. Given the large sample size, we expect the linear
probability model to provide consistent estimates of the effect of policing strategies, provided
that estimation techniques are robust to heteroscedasticity (Wooldridge, 2002).
4.1 Modelling policing strategies
Local policing strategies enter the model as separate factors, which implies that they affect the
overall performance of the police. In other words: the policing strategies are not tied to one
specific production factor, but to the productivity of all production factors together.
As discussed in the previous chapter, when we control for overall police visibility,
dissatisfaction with visible police presence provides an indication of (the lack of) hot spots
policing. We measure the effect of a change in dissatisfaction with police visibility, keeping
overall visibility constant. When estimating the effect of hot spots policing, we control for
disorder policing, and vice versa. Otherwise, we are likely to overstate the effect of a single
strategy if it happens to be correlated with the other strategy. We are able to include both
strategies in the estimation equation since they are not fully complementary. Being present at
hot spots more often is most likely to lead to more fines and arrests; a policy of disorder
policing goes further than that.
Since we control for actual visibility of the police, we do not estimate the effect of allocating
resources to visible police presence at the cost of non-visible police activities such as back
office work or criminal investigations. The latter effect is captured by including the frequency
at which people see the police after all.

28
4.2 Heterogeneity
We include individual characteristics Xijt to prevent estimation bias through (observable) factors
that affect both dissatisfaction with policing strategies and victimisation levels. Individuals with
a higher probability of victimisation, such as adolescents, may also be living in municipalities
with very strict law enforcement, for example. Moreover, dissatisfaction with policing strategies
may also be affected by individual characteristics. For example, unemployed people may be
more likely to complain about the police – and their risk on victimisation may be higher as well
(see the text box). Ignoring the correlation between someone’s perception of policing strategies
and his or her probability on victimisation would bias the estimated effectiveness of policing
strategies towards zero. We control for a broad set of individual characteristics that are known
to be related to both the perception of police work and victimisation, including age, gender,
education, employment, household type, ethnicity and housing type.
The role of individual characteristics in the dissatisfaction with police performance
To see how much of a role individual characteristics play in dissatisfaction with police performance, we relate perception
to background characteristics of respondents living in a confined geographical area. They share the same police
services, but have different background characteristics. If they differ in their perception, then these differences are more
likely to be related to their individual background characteristics then to differences in police services. We choose a
high-crime urban neighbourhood, Rotterdam Maashaven, and a low-crime rural town, Werkendam. Regression analysis
shows that relatively young males, who are highly educated, employed and from Dutch descent, and have a family are
generally less dissatisfied about police work than females, who are lower educated, unemployed, from foreign descent,
and who live in an apartment with few or no children. A possible explanation of this difference in dissatisfaction is that
the first category of people are less dependent on police protection than the second group. Their probability of
victimisation is also lower.
Victimisation is not determined by individual characteristics alone – and policing strategies are
based on the characteristics of all people living in a municipality, not the characteristics of a
single individual. Heterogeneity across municipalities is actually limited since we measure
dissatisfaction with policing strategies rather than the absolute level of police performance. As a
result, police in a low-crime municipality can do just as well as police in a high-crime
municipality (as discussed later in this chapter). To control for any unobserved municipality-
characteristics factors that co-determine policing strategies and victimisation levels however,
we include municipality fixed effects ηj in the estimation equation. Consequently, we focus on
changes over time rather than differences between municipalities.
4.3 Simultaneity
To estimate the causal effect of policing strategies on crime and disorder, changes in
(dissatisfaction with) policing strategies should not be prompted by changes in the local safety

29
situation. Below, we discuss two ways in which a simultaneity bias may occur, and the way we
address simultaneity.
Simultaneity in policing strategies
With rampant crime and disorder, a police department may opt for a tougher response. When
this change in strategy affects citizen satisfaction, we will find that ‘being tough’ ‘results’ in
more crime, simply because the two variables are correlated through the police response. Thus
simultaneity in policy results in underestimation of the effect of policing strategies.
Of old, changes in local policing strategies show little relation with changes in the local safety
situation. A number of studies shows that neither resources, nor strategies are responsive to
trends in disorder and crime (see Vlek et al., 2004, for instance). This finding suggests that
simultaneity is limited, but it does not exclude the possibility of some bias. We control for fixed
municipality characteristics that could be related to trends policy makers respond to, like a large
immigrant population. Additionally, we control for a range of individual background
characteristics that could be related to such trends as well. Still, if the trends are not picked up
by the individual background characteristics and the municipality fixed effects, we
underestimate the effect of changes in policing strategies.
The outside pressure as of 2002/2003 provided a call on the police to address the most pressing
problems – and to address public disorder in particular. As a result of this pressure from the
authorities, hot spots policing and disorder policing could have been more ambitious in the
municipalities with relatively unfavourable trends in disorder. Since simultaneity could be more
of a problem during the period 2003-2005, we exclude these years from the analysis. Indeed, as
we will see in the sensitivity analysis, we find evidence for a greater simultaneity problem
during 2003-2005.
Simultaneity in survey responses
Dissatisfaction with police work could be based on the local safety situation rather than
information about police work. In that case, people in safe municipalities say that the police do
well and people in unsafe municipalities say that the police do poorly. The underlying reasoning
is: ‘it is safe, the police must be doing a good job’ and vice versa. Similarly, victimisation could
be a driver of people’s perception of police work. Simultaneity in survey responses leads to
overestimation of the effect of policing strategies: a positive evaluation of police work is
correlated with low rates of crime and disorder. A related argument pointing in the same
direction is that the need for police work goes down in safer communities. With higher safety,
people expect less from the police, and give a more positive judgment of police performance
(assuming that the distribution of resources follows the work load of the police). Again, this

30
would lead to overestimation of the effectiveness of policing strategies. The evidence
contradicts the presence of simultaneity bias in survey responses.
First, even when victimisation of crime and experience of disorder were going down during the
period 1993-2002, people became more negative about police work. Apparently, perception of
police work is not simply based on actual trends in victimisation of crime and disorder
(included in the same survey). Second, figure 4.1 shows that we do not find that police in rural
municipalities (with relatively little crime) do relatively well and police in highly urbanised
municipalities (with relatively much crime) do relatively poorly in the eyes of citizens. Thus the
police are just as likely to do poorly as they are to do well in relatively safe (or unsafe)
municipalities. To conclude, we do not find any evidence supporting the idea of simultaneity in
survey responses.
Figure 4.1 Dissatisfaction with local police work in rural and urban municipalities, 2005, 459 municipalities
0
20
40
60
80
100
0 2000 4000 6000 8000
Housing density
'Don't
react
on local pro
ble
ms' (
%
agre
e)
0
20
40
60
80
100
0 2000 4000 6000 8000
Housing density
'Too little v
isib
le' (
% a
gre
e)
0
20
40
60
80
100
0 2000 4000 6000 8000
Housing density
'Too little a
ggre
ssiv
e' (
% a
gre
e)
0
20
40
60
80
100
0 2000 4000 6000 8000
Housing density
'Too little a
ppro
achable
' (%
agre
e)
Source: Dutch Victimisation Survey, Netherlands Statistics.
Note: Housing density is defined as the number of addresses per squared kilometre (*1000) in a municipality.
4.4 Measurement error
When conducting the survey, the interviewers explicitly state that they are interested in
perceptions of local police work. By introducing the questions this way and by repeatedly
referring to the respondent’s neighbourhood in the questions, the responses should reflect
perceptions of local policing strategies rather than more general perceptions of how the police

31
perform. Citizens only observe some dimensions of police work and they do so imperfectly,
however. Perceptions of local police work are influenced by non-local factors (such as national
news reports) or by local factors that provide a distorted perspective of police services (for
example, local politicians wrongfully raving about poor police performance, biased news from
public relations department of the police). Consequently, using perceptions of local police work
may introduce measurement error in the analysis. A comparison between survey responses and
other sources of data shows that this noise is limited.
First, people notice it when the police fine more often. The relation between actual and
perceived police fining holds both across municipalities and over time. From systematic
observations of police work, we know that the single most noticeable change in police work
over the period 1993-2001 is more active police fining (Stol et al., 2004, p. 185). Indeed, police
fining is the only dimension of policing performance that improved over this period in the
perspective of citizens (see also figure 3.2).
Table 4.1 Dissatisfaction with police fining and the actual number of fines, data for 2003 and 2005, 472
municipalities
(1) (2)
Dependent variable ‘Police fine too little’ ‘Police fine too little’
Number of fines after police stops per capita – 0.11 (0.05)***
Number of non-traffic related fines after police stops per capita – 0.21 (0.30)***
Year fixed effect (2005) – 0.07 (0.00)*** – 0.07 (0.00)***
Number of observations 128,751 128,627
R2 0.01 0.01
Notes: Municipality fixed effects not shown. * Statistically significant at the 10-percent level. ** Statistically significant at the 5-percent
level. *** Statistically significant at the 1-percent level.
Dissatisfaction with police fining is also related to the actual number of police fines. Table 4.1
presents the results of a regression analysis of the relation between the change in the actual
number of fines (after police stops) and the changes in dissatisfaction with police fining. The
relation between the two variables is statistically significant at the 5 percent level. Based on this
estimate, the 15 percent increase in fines per capita over 2003-2005 resulted in a 1 percent
decrease in dissatisfaction about police fining. The second column of table 4.1 shows that
perceived police fining includes traffic fines: we do not find a statistically significant relation
between non-traffic related fines and dissatisfaction with police fining.
Second, differences in the perceived performance of police forces correspond with anecdotal
evidence about their performance. Figure 4.2 presents consistently underperforming and
overperforming police forces on four dimensions over the period 1993-2005. In two of the four
cases, Gooi- en Vechtstreek’s performance compares poorly to the national average. Of all
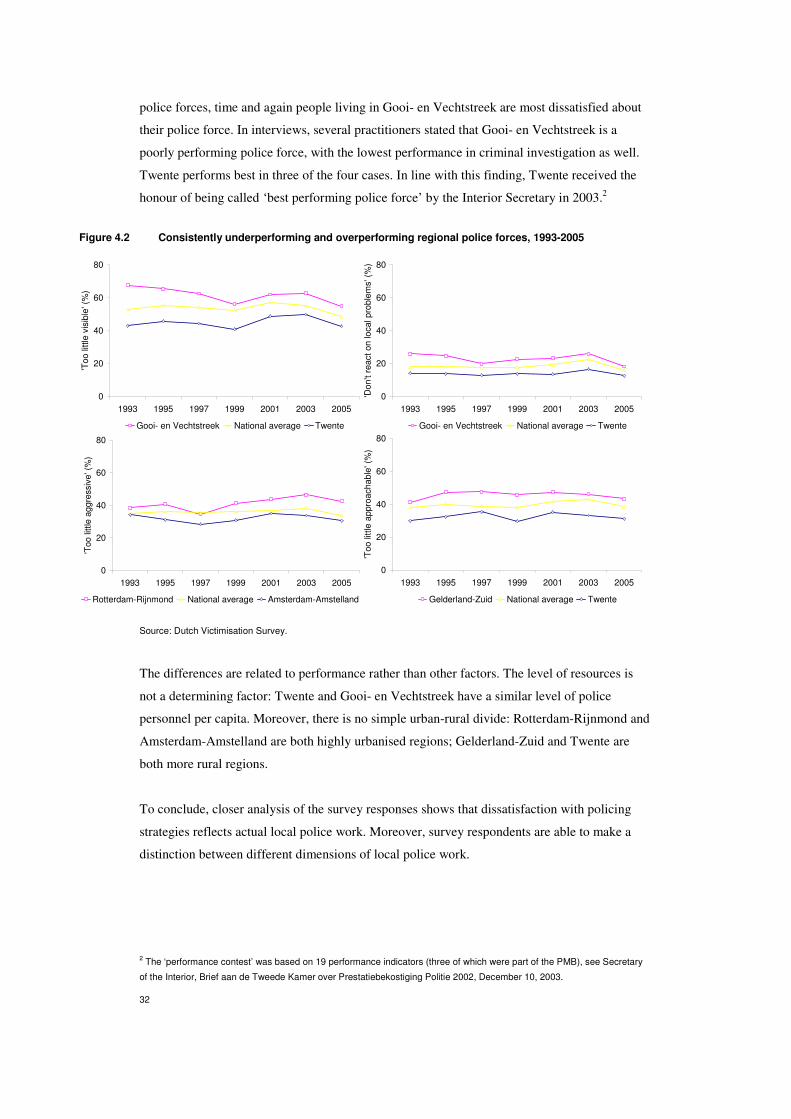
32
police forces, time and again people living in Gooi- en Vechtstreek are most dissatisfied about
their police force. In interviews, several practitioners stated that Gooi- en Vechtstreek is a
poorly performing police force, with the lowest performance in criminal investigation as well.
Twente performs best in three of the four cases. In line with this finding, Twente received the
honour of being called ‘best performing police force’ by the Interior Secretary in 2003.2
Figure 4.2 Consistently underperforming and overperforming regional police forces, 1993-2005
0
20
40
60
80
1993 1995 1997 1999 2001 2003 2005
'Too little v
isib
le' (
%)
Gooi- en Vechtstreek National average Twente
0
20
40
60
80
1993 1995 1997 1999 2001 2003 2005
'Don't
react
on local pro
ble
ms' (
%)
Gooi- en Vechtstreek National average Twente
0
20
40
60
80
1993 1995 1997 1999 2001 2003 2005
'Too little a
ggre
ssiv
e' (
%)
Rotterdam-Rijnmond National average Amsterdam-Amstelland
0
20
40
60
80
1993 1995 1997 1999 2001 2003 2005
'Too little a
ppro
achable
' (%
)
Gelderland-Zuid National average Twente
Source: Dutch Victimisation Survey.
The differences are related to performance rather than other factors. The level of resources is
not a determining factor: Twente and Gooi- en Vechtstreek have a similar level of police
personnel per capita. Moreover, there is no simple urban-rural divide: Rotterdam-Rijnmond and
Amsterdam-Amstelland are both highly urbanised regions; Gelderland-Zuid and Twente are
both more rural regions.
To conclude, closer analysis of the survey responses shows that dissatisfaction with policing
strategies reflects actual local police work. Moreover, survey respondents are able to make a
distinction between different dimensions of local police work.
2 The ‘performance contest’ was based on 19 performance indicators (three of which were part of the PMB), see Secretary
of the Interior, Brief aan de Tweede Kamer over Prestatiebekostiging Politie 2002, December 10, 2003.

33
5 Estimation results
In this chapter, we present the estimation results. We start by presenting the results of the fixed
effects model introduced in the previous chapter. To assess the robustness of our findings, we
re-estimate our model using various other specifications.
5.1 Effect of proactive policing
Table 5.1 provides an overview of the estimated effects. Since we measure dissatisfaction with
policing strategies, a positive coefficient implies a desirable effect on safety. The effects are
expressed in hundreds of percentage points. For example, a 10 percentage point decrease in
dissatisfaction with police visibility (keeping all else constant) brings down youth nuisance by
an estimated 0.5 percentage point (– 0.1*0.05*100). In the next section, we discuss the size of
the effects.
Table 5.1 Estimated effect of proactive policing on disorder, fear of crime and crime (municipality fixed
effects, 1993-2001, all variables in percentage points * 100)
Dependent variable (↓) Explanatory variablesa
Hot spots policing (‘Too little visible’) Disorder policing (‘Too little aggressive’)
Public disorder
Youth nuisance 0.05 (0.01)*** 0.14 (0.02)***
Drugs nuisanceb 0.00 (0.02)*** 0.09 (0.02)***
Public intoxication 0.03 (0.01)*** 0.06 (0.01)***
Vandalism 0.10 (0.02)*** 0.16 (0.02)***
Graffiti 0.07 (0.02)*** 0.07 (0.02)***
Aggressive driving 0.04 (0.02)*** 0.09 (0.02)***
Fear of crime
Feels unsafe 0.11 (0.02)*** 0.11 (0.02)***
Avoids unsafe places 0.03 (0.01)*** 0.02 (0.01)***
Fear of theft 0.06 (0.02)*** 0.02 (0.01)***
Keeps child at home 0.02 (0.03)*** 0.09 (0.03)***
Property crime
Burglary 0.02 (0.01)*** 0.03 (0.01)***
Car theft and theft out of car 0.01 (0.01)*** 0.02 (0.01)***
Bicycle theft 0.03 (0.01)*** 0.03 (0.01)***
Purse theft 0.00 (0.01)*** 0.01 (0.01)***
Violent crime
Threat with violence 0.01 (0.01)*** 0.03 (0.00)***
Assault 0.00 (0.00)*** 0.01 (0.00)***
Notes: (a) Other explanatory variables include: individual background characteristics, fixed municipality characteristics, actual visibility of
the police in the municipality, and other policing strategies in the municipality (disorder policing in the case of hot spots policing and vice
versa). We cluster individuals per municipality. Each estimate is based on a separate estimation equation. Full estimation results are
available upon request. (b) Drugs nuisance was included in the survey as of 1997. Standard errors are between parentheses. * Statistically
significant at the 10-percent level. ** Statistically significant at the 5-percent level. *** Statistically significant at the 1-percent level.

34
We find statistically significant effects for both policing strategies, which implies that citizens’
dissatisfaction with policing strategies are not just based on ‘noise’. If perceptions of local
police work are solely based on incorrect information such as sensational national news reports,
then we would not find an effect of policing strategies. Moreover, each policing strategy has a
separately identifiable effect, which differs from the other strategy. This finding provides
further evidence that people do not simply lump together all policing activities.
Disorder policing has an impact on all types of disorder, property crime and violent crime and
also fear of crime, save purse theft and fear of theft. The effect of disorder policing on property
crime and violent crime lends support to the hypothesis of broken windows. Clearly,
(dissatisfaction with) disorder policing is an important determinant of police effectiveness.
Hot spots policing – being visibly present where people appreciate it most – is effective in
bringing down disorder and property crime. Hot spots policing also makes people feel safer.
Apparently, concentrating visible police presence at ‘hot spots’ is an effective deterrence
against youth causing trouble in public spaces, drunks, vandals, graffiti sprayers, aggressive
drivers, burglars and bicycle thieves. We do not find an effect of better police visibility on
violent crime. This finding may be due to the fact that violent crime varies across individuals
rather than places, whereas experience of disorder is mostly a characteristic of the place in
which someone lives (Vollaard and Koning, 2005).
5.2 Size of the effect
To assess how large the estimated coefficients are, we relate them to changes in policing
strategies over the last twelve years. Figure 5.1 shows the development in disorder policing and
hot spots policing over the period 1993-2005. The graphs suggest two distinct periods in
policing strategies: increasingly lax law enforcement until 2003 and a reversal since then. The
year 2005 clearly stands out, both in terms of hot spots policing and disorder policing.
Figure 5.1 Disorder policing and hot spots policing, the Netherlands, 1993-2005
1993
19951997
1999
2005
2004
2003
2001
40
45
50
55
60
65
26 28 30 32 34 36 38
'See police at least once a week' (% agree)
'See p
olic
e t
oo little' (
% a
gre
e)
25
30
35
40
45
1993 1995 1997 1999 2001 2003 2005
'Too little a
ggre
ssiv
e' (
% a
gre
e)
Source: Dutch Victimisation Survey.

35
In table 5.2, we apply the estimated coefficients to the two distinct periods in style of policing:
1993-2003 and 2003-2005. The last two columns show the overall effect of proactive policing
for the periods 1993-2003 and 2003-2005, including the total effect on disorder, property crime
and violent crime.3 The positive effect on safety of the increase in proactive policing over the
last years stands in contrast with the negative effect of increasingly lax police performance until
2003.
Table 5.2 Estimated effect of proactive policing, 1993-2003 vs. 2003-2005 (point estimates)
1993-2003
Less proactive policing
2003-2005
More proactive policing
1993-2003 vs. 2003-2005
Overall effect policing strategy
(Lack of) hot
spots policing
(Lack of) disorder
policing
Hot spots
policing
Disorder
policing
1993-2003 2003-2005
Public disorder
Youth nuisance + 1 % + 4 % – 3 % – 5 % + 5 % – 8 %
Drugs nuisance . + 5 % . – 7 % + 5 % – 7 %
Public intoxication + 1 % + 3 % – 2 % – 4 % + 3 % – 6 %
Vandalism + 1 % + 3 % – 4 % – 4 % + 4 % – 7 %
Graffiti + 1 % + 2 % – 4 % – 3 % + 3 % – 6 %
Aggressive driving + 0 % + 2 % – 1 % – 2 % + 2 % – 4 %
Total disorder + 1 % + 2 % – 3 % – 2 % + 3 % – 5 %
Fear of crime
Feels unsafe + 1 % + 1 % – 2 % – 2 % + 2 % – 4 %
Avoids unsafe places + 1 % + 1 % – 2 % – 1 % + 2 % – 3 %
Fear of theft + 1 % . – 3 % . + 1 % – 3 %
Keeps child at home . + 1 % . – 2 % + 1 % – 2 %
Property crime
Burglary + 1 % + 2 % – 3 % – 3 % + 3 % – 6 %
Car crime . + 1 % . – 1 % + 1 % – 1 %
Bicycle theft + 1 % + 2 % – 4 % – 3 % + 3 % – 7 %
Purse theft . . . . . .
Total property crime + 1 % + 1 % – 2 % – 2 % + 2 % – 3 %
Violent crime
Threat with violence . + 2 % . – 3 % + 2 % – 3 %
Assault . + 3 % . – 4 % + 3 % – 4 %
Total violent crime . + 2 % . – 2 % + 2 % – 2 %
Notes: Table only includes estimated effects which are statistically significant at the 10 percent level or higher.
3 Estimated coefficients of hot spots policing and disorder policing for total disorder are 0.18 (0.04)*** and 0.21 (0.04)***,
respectively. For total property crime: 0.05 (0.02)***; 0.06 (0.02)***. For total violent crime: 0.01 (0.01); 0.03 (0.01)***.

36
Overall, public disorder first increased by 3 percent as a result of lax policing over the period
1993-2003 and then decreased by 5 percent as a result of the recovery in proactive policing
during 2003-2005. Fear of crime first increased by 2 percent, then decreased by 4 percent; total
property crime first increased by 2 percent, then decreased by 3 percent; total violent crime first
increased by 2 percent, then decreased by 2 percent.
5.3 Robustness
To test the robustness of our findings, we re-estimate our model using data from another period
(2003-2005) and other indicators of disorder policing.
Table 5.3 Estimated effect of dissatisfaction with policing strategies, 1993-2005 vs. 2003-2005
Hot spots policing Disorder policing
1993-2001*** 2003-2005*** 1993-2001*** 2003-2005***
Public disorder
Youth nuisance 0.05 (0.01)*** 0.05 (0.02)*** 0.14 (0.02)*** 0.10 (0.02)***
Drugs nuisance 0.00 (0.02)*** 0.03 (0.02)*** 0.09 (0.02)*** 0.01 (0.01)***
Public intoxication 0.03 (0.01)*** 0.02 (0.02)*** 0.06 (0.01)*** 0.05 (0.01)***
Vandalism 0.10 (0.02)*** 0.04 (0.05)*** 0.16 (0.02)*** 0.12 (0.03)***
Graffiti 0.07 (0.02)*** 0.05 (0.03)*** 0.07 (0.02)*** 0.03 (0.02)***
Aggressive driving 0.04 (0.02)*** 0.05 (0.02)*** 0.09 (0.02)*** 0.08 (0.02)***
Fear of crime
Feels unsafe 0.11 (0.02)*** 0.11 (0.03)*** 0.11 (0.02)*** 0.12 (0.03)***
Avoids places 0.03 (0.01)*** 0.04 (0.02)*** 0.02 (0.01)*** 0.04 (0.01)***
Fear of theft 0.06 (0.02)*** 0.04 (0.03)*** 0.02 (0.01)*** 0.04 (0.02)***
Keeps child home 0.02 (0.03)*** 0.05 (0.07)*** 0.09 (0.03)*** 0.12 (0.05)***
Property crime
Burglary 0.02 (0.01)*** 0.03 (0.01)*** 0.03 (0.01)*** 0.01 (0.01)***
Car theft, theft out of car 0.01 (0.01)*** 0.06 (0.02)*** 0.02 (0.01)*** 0.01 (0.01)***
Bicycle theft 0.03 (0.01)*** – 0.02 (0.02)*** 0.03 (0.01)*** 0.04 (0.02)***
Purse theft 0.00 (0.01)*** 0.04 (0.01)*** 0.01 (0.01)*** 0.01 (0.01)***
Violent crime
Threat wt. violence 0.01 (0.01)*** 0.01 (0.01)*** 0.03 (0.00)*** 0.03 (0.01)***
Assault 0.00 (0.00)*** 0.00 (0.01)*** 0.01 (0.00)*** 0.01 (0.00)***
Notes: Each estimate is based on a separate estimation equation including municipality fixed effects. Full estimation results are available
upon request. Standard errors are between parentheses. * Statistically significant at the 10-percent level. ** Statistically significant at the
5-percent level. *** Statistically significant at the 1-percent level.
Simultaneity
We aim to lower the bias from possible simultaneity in policing strategies by excluding the
years 2003-2005. As argued in the previous chapter, policing strategies had a larger ‘random
element’ before this period. Indeed, table 5.3 shows that the estimates for 1993-2001 are
generally higher than the estimates for 2003-2005. Thus, local policing strategies have become
more responsive to local trends in crime and disorder. The only (statistically significant)

37
exceptions to this rule are car crime and purse theft. It could be that the police no longer focus
their efforts on these offences since 2003. We find the largest differences in estimates for the
effect of disorder policing on drugs nuisance and graffiti and the effect of hot spots policing on
vandalism, suggesting that the police has been particularly responsive to trends in these types of
disorder.
When we include municipality averages of all individual characteristics in the estimation
equation for the period 1993-2001, we find exactly the same estimation results (not shown).
Thus, policing strategies are not responsive to trends in employment, demography, education
level, ethnicity, housing type, and household size. This finding suggests that simultaneity was
not a major issue during these years. The estimates for the period 2003-2005 tend to be
somewhat higher when we include the time-varying municipality characteristics – again
implying a greater responsiveness of the police to (observable) trends during these years.
Alternative indicators for disorder policing
We re-estimate the model using an alternative indicator of disorder policing from the survey,
dissatisfaction with police fining, and an alternative source of data: police statistics on fines.
Table 5.4 Size of the effect of changes in policing strategies over the period 2003-2005, alternative
indicators for disorder policing (point estimates)
(1)
‘Too little aggressive’
(2)
‘Fine too little’
(3)
Actual number of police finesa
Public disorder
Youth nuisance – 5 % – 2 % .
Drugs nuisance – 7 % . – 10 %
Public intoxication – 4 % – 1 % .
Vandalism – 4 % – 1 % – 2 %
Graffiti – 3 % . .
Aggressive driving – 2 % – 2 % – 3 %
Fear of crime
Feels unsafe – 2 % – 1 % .
Avoids unsafe places – 1 % . – 7 %
Fear of theft . . .
Keeps child at home – 2 % . – 6 %
Property crime
Burglary – 3 % . .
Car theft and theft out of car – 1 % . – 5 %
Bicycle theft – 3 % . – 8 %
Purse theft . . .
Violent crime
Threat with violence – 3 % – 1 % .
Assault – 4 % . .
Notes: (a) Because of data availability, estimates for the actual number of police fines are based on data for 2003-2005.

38
Table 5.4 provides an overview of the estimated effects on safety. The estimates in the second
column show that dissatisfaction with police fining is limited to disorder, fear of crime and
threat with violence. Not surprisingly, police fining has a less wide-ranging impact than more
generally defined aggressive policing (which also includes all other types of intervention,
including warnings and arrests). Since most police fines are traffic-related, the effect on
aggressive driving provides the most relevant comparison. Columns 2 and three show that we
find similar results for perceived and actual police fining, which lends credibility to using the
Dutch Victimisation Survey as data source for police performance. Apparently, using
administrative data rather than survey data does not substantially change the size of the
estimated effect. If anything, our indicators from the survey result in underestimation of the
effect (the more so, since the estimates in the third column are based on the period 2003-2005).
We find actual police fining to have an effect on property crime as well. Discussions with
police officers suggest that these findings many reflect an active, tougher approach in these
municipalities rather than greater police fining only. The approach may include such methods as
‘adopting’ drug addicts, making sure that they are institutionalised.
To conclude, the analysis suggests that the simultaneity bias is limited since our estimates are
not affected by including a host of time-varying municipality characteristics that are known to
be drivers of trends in crime and disorder. We limited the simultaneity bias further by excluding
the years 2003-2005. The estimates for this latter period show that the police has become more
responsive to changes in the local safety situation, and to trends in disorder in particular. Our
results are robust to the choice of source of data. Police fining has a similar impact on
aggressive driving – whether the variable is based on survey data or administrative data from
the police.
5.4 Conclusion
Based on the empirical analysis, we conclude that proactive policing is effective in lowering
crime, disorder and fear of crime. More specifically, disorder policing is effective in bringing
down all types of disorder, crime and fear of crime, save fear of theft and purse theft. The
effects on violent and property crime support the broken windows hypothesis. In line with
literature, we find hot spots policing to be effective in combating disorder, fear of crime and
property crime. We find evidence that the simultaneity bias over the period 1993-2001 is
limited and that the responsiveness of the police to local trends in crime and disorder increased
over the period 2003-2005. As a result of proactive policing since 2003, disorder declined by 5
percent and crime by 2 tot 3 percent. People felt safer as well. The increase in police
effectiveness stands in contrast to a long decline in police performance over the period 1993-
2003.

39
6 Conclusions
Proactive policing is an effective policing strategy
Based on the empirical analysis, we conclude that proactive policing (a tougher, more targeted
police response to criminal and disorderly behaviour) is effective in lowering crime, disorder
and fear of crime. Over the period 2003-2005, proactive policing reduced disorder by an
estimated 5 percent, property crime by 3 percent, violent crime by 2 percent and fear of crime
by 4 percent. The increase in police effectiveness of the last years is a clear break in a long
trend of ever-declining performance. During the period 1993-2003, increasingly lax law
enforcement actually resulted in an increase in crime and disorder. Since 2003, the police are
recovering lost ground.
Style of policing, not level of resources determines effect of police on safety
The increase in police effectiveness of the last years coincides with a more active involvement
in police work by municipalities and the national government. Both local and national
authorities are pushing the police towards a more proactive approach. As of 2003/2004, several
municipalities closely monitor local trends in crime and disorder and target police presence on
‘hot spots’. As of 2003, the national government holds the police forces accountable to a
number of performance targets laid down in ‘performance contracts’. It is not clear to what
extent the change in police effectiveness can be attributed to local or national policy. We can
only conclude that proactive policing is an effective policing strategy, not whether the
performance contracts are a good way of providing incentives to the police.
It is clear, however, that the contribution of the police to safety is primarily related to police
effectiveness, not the level of resources. During the period 1993-2003 the number of police
personnel increased, but satisfaction with police work decreased. Since 2003, we see the
reverse: police resources are slightly decreasing, and satisfaction of citizens is increasing.
Strengthening incentives seems to be a more cost-effective way of improving safety in the
coming years than providing means to increase the number of police personnel. This
administration’s goal is to lower crime and disorder by some 20 percent over the period 2002-
2008/2010. We are now halfway: the percentage of people who are victim of crime at least once
a year declined from 50 percent in 2002 to 44 percent in 2005; the percentage of people that
frequently experiences disorder declined from 41 percent in 2002 to 38 percent in 2005. Even
with the current level of police effectiveness it is very costly to realise a further 10 percent
decline in crime and disorder through greater numbers of police personnel. Based on the effect
of more police personnel estimated in Vollaard and Koning (2005), some 20 percent more
police personnel per capita would be necessary to achieve this goal. That would mean some
€630 million additional costs of personnel per year at a minimum (9,200 additional FTEs, each

40
at the annual cost of €68,542). The costs of efforts related to strengthening incentives are likely
to be lower than the costs of additional police personnel. The more so, since the long period of
growing police resources but declining police performance suggests a great amount of slack
within the police organisation.
Incentives could be based on citizen satisfaction with police work
Our findings suggest that incentives for the police could be based on citizen satisfaction with
police work. Not only do citizens have an idea of what the police do in their neighbourhood,
their perceptions turn out to be important determinants of police effectiveness as well. Holding
the police accountable to indicators of citizen satisfaction with police work is likely to provide
incentives that are better in line with the objectives of police work than output indicators such
as the number of fines (Vollaard, 2003).
As a final methodological note: our estimates of the effect of policing strategies could be biased
towards zero due to simultaneity in policing strategies. Additionally, we may overestimate the
effect of policing strategies as a result of simultaneous changes in other policing strategies that
we do not observe and as a result of simultaneity in survey responses on questions about police
work. We find evidence suggesting that these types of simultaneity bias are likely to be small,
but we cannot exclude the possibility that they affect our estimates. Therefore, further empirical
research into the determinants police effectiveness is necessary to put our findings to the test.

41
References
Bovens, Anneke, Terry Lamboo and Gerth Molenaar, 2006, Veiliger wijken door
uitvoeringsgericht beleid [Safer communities with practical policy], Openbaar Bestuur, 16 (5),
pp. 12-15.
Braga, Anthony A., 2001, The effects of hot spots policing on crime, The Annals of the
American Academy of Political and Social Science, 578, pp. 104-125.
Cameron, A. Colin and Pravin K. Trivedi, 2005, Microeconometrics. Methods and
Applications, Cambridge University Press, New York.
Corman, Hope and Naci Mocan, 2005, Carrots, sticks, and broken windows, Journal of Law
and Economics, 48 (1), pp. 235-266.
Dur, Robert, 2006, Status-seeking in violent subcultures and the double dividend of zero-
tolerance, TI Discussion Paper 005-1, Erasmus University, Rotterdam.
Eck, John E., Spencer Chainey, James G. Cameron, Michael Leitner and Ronald E. Wilson,
2005, Mapping Crime: Understanding Hot Spots, Special report, National Institute of Justice,
Washington D.C.
Stol, Wouter, A. Ph. van Wijk, G. Vogel, B. Foederer and L. van Heel, 2004, Politiestraatwerk
in Nederland. Noodhulp and gebiedswerk: inhoud, samenhang, verandering en sturing [Policing
the community, developments in the Netherlands], Nr. 14, Politie en Wetenschap, Apeldoorn.
Versteegh, Peter, 2005, Informatiegestuurde Veiligheidszorg [Intelligent policing], SMVP
Producties, Dordrecht.
Vlek, Frits, Kees Bangma, Kees Loef and Erwin Muller, 2004, Uit balans: politie en bestel in de
knel. State-of-the-art van kennis en inzichten [What do we know about the way the Dutch
police work?], Politiewetenschap No. 20, Politie en Wetenschap, Apeldoorn.
Vollaard, Ben A., 2003, Performance contracts for police forces, CPB Document 31, CPB
Netherlands Bureau for Economic Policy Analysis, The Hague.
Vollaard, Ben A. and Pierre Koning, 2005, Estimating police effectiveness with individual
victimisation data, CPB Discussion Paper 47, CPB Netherlands Bureau for Economic Policy
Analysis, The Hague.

42
Vroegop, Jacob and Peter Tak, 2005, Opgelost. Een onderzoek naar capaciteitsverdeling en
opsporingsprestaties binnen politieregio’s in Nederland (1996-2003) [(Dis)Solved. An
investigation into resource allocation and performance in criminal investigation], Wolf Legal
Publishers, Nijmegen.
Weisburd, David and John E. Eck, 2004, What can police do to reduce crime, disorder and
fear?, The Annals of the American Academy of Political and Social Science, 59 (3), 42-65.
Wiebrens, Cas, 2002, Celdagen zeggen meer over doelmatigheid politie [Prison days say more
about police efficiency], Economisch Statistische Berichten, 87 (4389), pp. 900-902.
Wittebrood, Karin and Matthijs van Beem, 2004, Sociale veiligheid vergroten door
gelegenheidsbeperking: wat werkt en wat niet? [Improving safety: what works and what
doesn’t?], Werkdocument No. 2, Social and Cultural Planning Office, The Hague.
Wooldridge, Jeffrey M., 2002, Econometric Analysis of Cross Section and Panel Data, MIT
Press, Cambridge (MA).