creating a landscape schematic using microsoft powerpoint · creating a landscape schematic using...
TRANSCRIPT
Creating a landscape schematic using Microsoft PowerPoint
By Ilissa Ocko
You don’t need fancy software like Adobe Illustrator to create a nice science visual. You can create a
graphic in basic, accessible software, such as Microsoft PowerPoint.
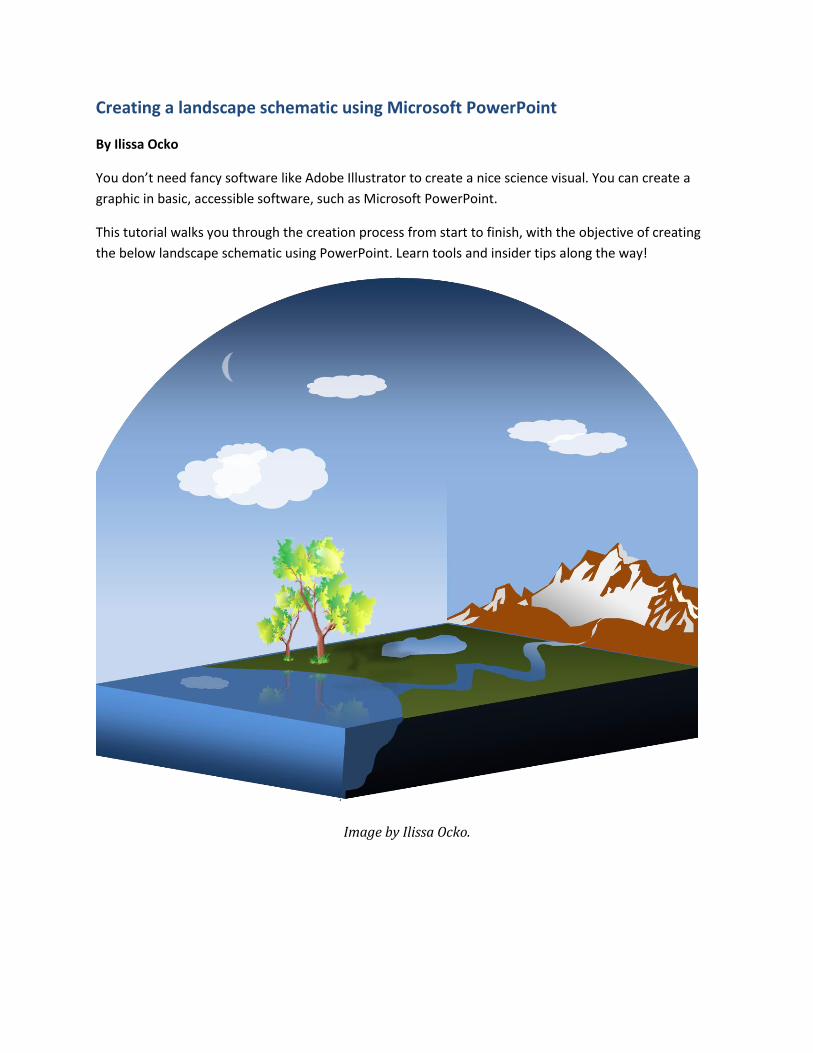
This tutorial walks you through the creation process from start to finish, with the objective of creating
the below landscape schematic using PowerPoint. Learn tools and insider tips along the way!
Image by Ilissa Ocko.
2
A. Start with an empty canvas
1. Open Microsoft PowerPoint
2. Create a new slide and delete any text boxes so that it is perfectly clean and white
B. Create the base of the landscape
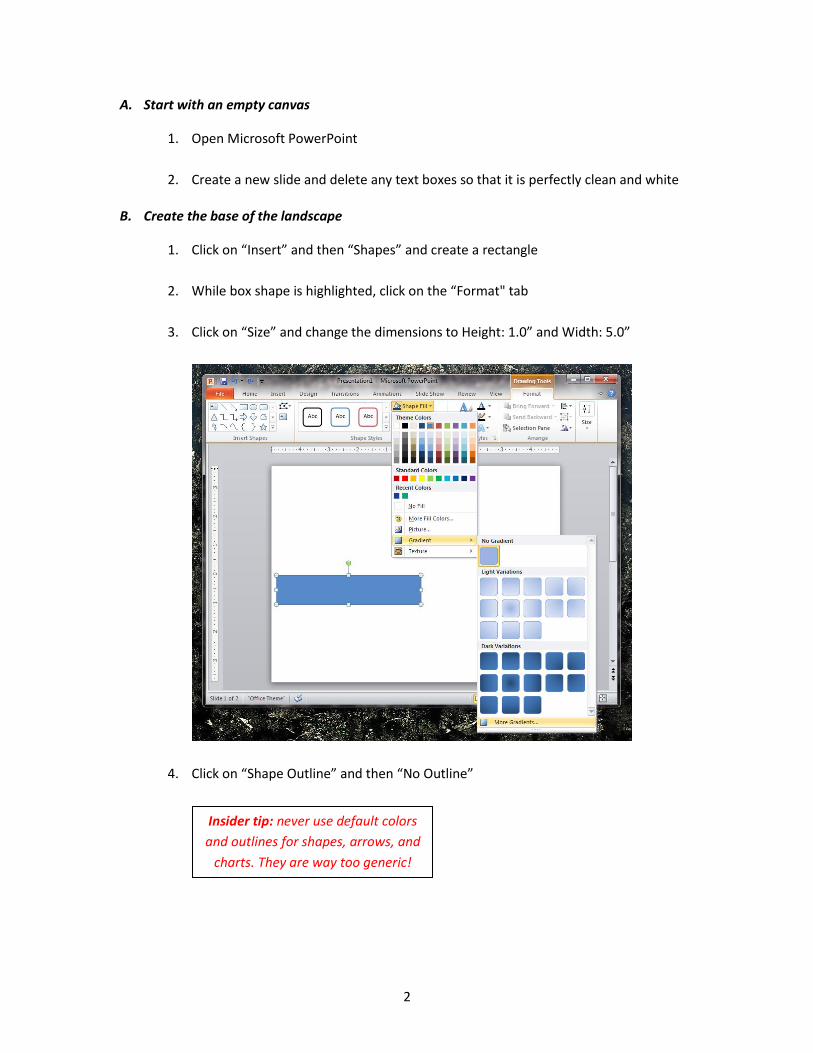
1. Click on “Insert” and then “Shapes” and create a rectangle
2. While box shape is highlighted, click on the “Format" tab
3. Click on “Size” and change the dimensions to Height: 1.0” and Width: 5.0”
4. Click on “Shape Outline” and then “No Outline”
Insider tip: never use default colors
and outlines for shapes, arrows, and
charts. They are way too generic!

3
5. Click on “Shape Fill,” then on “Gradient,” then on “More Gradients”
6. Under “Fill,” click on “Gradient fill” and then click on “Gradient stops” tabs to select,
add, or remove colors of your choice
7. Click “Close”
8. In the “Format” menu, click on “Shape Effects,” then on “3-D Rotation,” then on “3-D
Rotation Options”

4
9. On the “3-D Rotation” tab, rotate X by 45 degrees and Y by 10 degrees
10. On the “3-D Format” tab, change the depth to 500
11. Click “Close”
12. Move the box to the bottom of the slide.

5
C. Create the sky
1. Create two new rectangles: 1) Height: 4.0” and Width: 5.0” and 2) Height: 3.5” and
Width: 3.5”
2. Right-click on each rectangle, click on “Arrange” and “Send to back.”
3. Remove each rectangle’s outline.
4. Position the rectangles side-by-side and in line with base (see the example below for
guidance), and change the colors to a light shade of blue
5. Create a half circle as top of the atmosphere, by inserting the “Chord” basic shape.
6. Click on one of the yellow diamond shapes to create a perfect semi-circle, and rotate by
clicking on the green circle. Line up the diameter of the semi-circle with the top of the
rectangles.
Insider tip: take advantage of
“yellow diamonds” on braces,
shapes, and arrows—they let you
customize default curves and widths!
Insider tip: when inserting a shape, if
you want it to be symmetrical (such
as square or circle), press down
“Shift” when sizing the shape. This
also works for rotating shapes and
lines to perfect 45º and 90º angles.

6
7. Add a gradient to the chord. Make the bottom color match the other sky shapes, but the
top color a darker blue
8. Add a gradient to the left box to create some dimension to the atmosphere. Make the
top color match the other sky shapes, but the bottom color a lighter blue

7
D. Add the terrain
1. In the “Shapes” tab, go to “Lines and Connectors” and add a “Freeform” shape
2. Draw the shape of the land on top of the dark rectangle. Click once where you want the
line to begin, and then click for each bend/curve in the line to create an outline of the
land shape on top of the rectangle. (Don’t click and drag mouse, it will turn out all
squiggly.) Double-click where you want the line to end. You should have an outline of
the shape of the land on top of the dark rectangle.
3. Remove the outline and make the shape’s fill green. Add a gradient if you prefer, to add
definition
Insider tip: to add smooth curves,
make shorter lines and curve their
combined path.
8
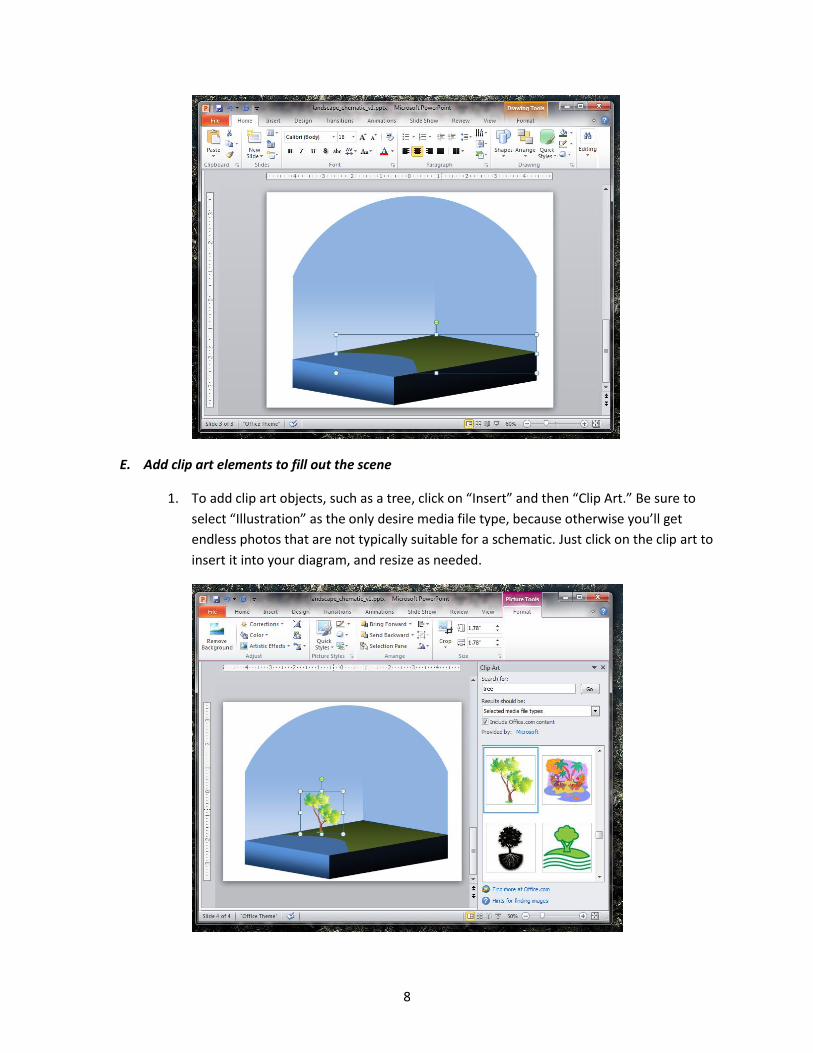
E. Add clip art elements to fill out the scene
1. To add clip art objects, such as a tree, click on “Insert” and then “Clip Art.” Be sure to
select “Illustration” as the only desire media file type, because otherwise you’ll get
endless photos that are not typically suitable for a schematic. Just click on the clip art to
insert it into your diagram, and resize as needed.

9
2. Alternatively, go to Microsoft Clip Art online to search through hundreds of illustrations
more easily. Type a keyword into “Search” at the top of the page, and then click the box
for “Illustration” on the left side under “MEDIA TYPES.” Download illustrations to your
computer and insert them into you PowerPoint slide by clicking on “Insert” and
“Picture”
3. Some symbols can be found in the “Shapes” tools in PowerPoint, such as a cloud. Just be
sure to change the outline and fill from the default. Play with sizes, colors, gradients,
and even transparency (you can access transparency by clicking “More Fill Colors” from
the “Shape Fill” tab)
4. Whereas the tree and cloud shapes were easy to include because they were standalone
objects (with no background), it’s not always that simple. In PowerPoint you are actually
able to take apart clip art objects so that you can remove the background. Say we want
mountains but can’t find any clipart without a sky, hills, etc., and those elements do not
fit in with our schematic. To remove unwanted elements:
i. Open up a new blank slide
Insider tip: if you have multiple
shapes that you want the styles to
match (such as fill, size, outline),
highlight all of them first while
holding down the “Shift” key and
then make your edits.
.
10
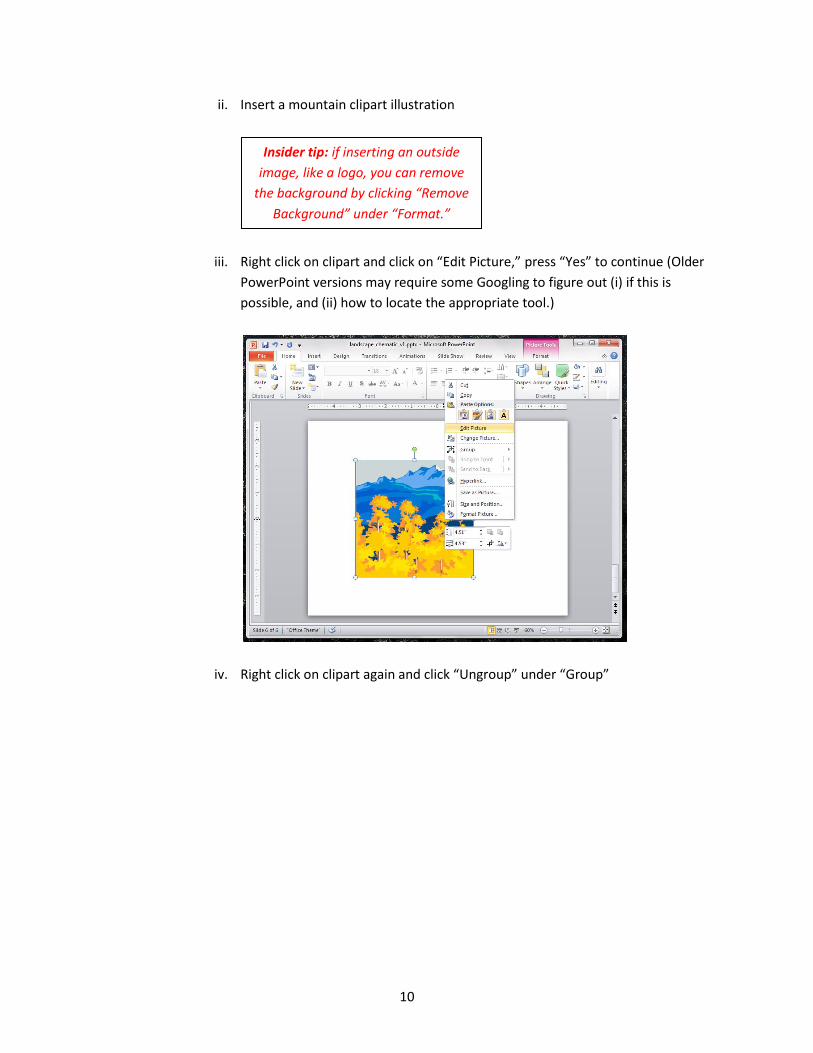
ii. Insert a mountain clipart illustration
iii. Right click on clipart and click on “Edit Picture,” press “Yes” to continue (Older
PowerPoint versions may require some Googling to figure out (i) if this is
possible, and (ii) how to locate the appropriate tool.)
iv. Right click on clipart again and click “Ungroup” under “Group”
Insider tip: if inserting an outside
image, like a logo, you can remove
the background by clicking “Remove
Background” under “Format.”

11
v. Delete pieces that you do not want
vi. Change colors of remaining pieces, if desired
vii. Highlight all remaining pieces, right click, and press “Group”
12
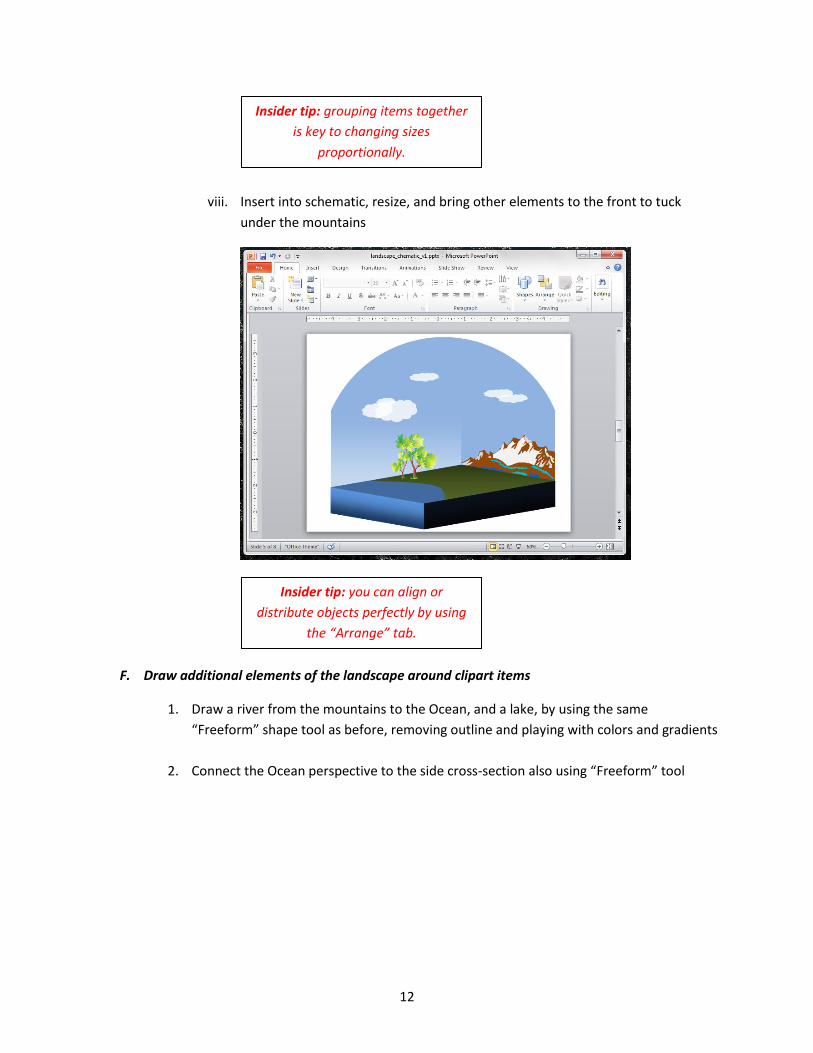
viii. Insert into schematic, resize, and bring other elements to the front to tuck
under the mountains
F. Draw additional elements of the landscape around clipart items
1. Draw a river from the mountains to the Ocean, and a lake, by using the same
“Freeform” shape tool as before, removing outline and playing with colors and gradients
2. Connect the Ocean perspective to the side cross-section also using “Freeform” tool
Insider tip: you can align or
distribute objects perfectly by using
the “Arrange” tab.
Insider tip: grouping items together
is key to changing sizes
proportionally.

13
G. Finalize with extra touches
1. Add reflections of the trees in the water by using the reflection tool. Right click on the
objects, click on “Format Picture,” and click on “Reflection.” Play around with the
different options to get the desired look
2. You can also add reflections by increasing the transparency of an object and flipping the
image in the water, as demonstrated for a cloud
14
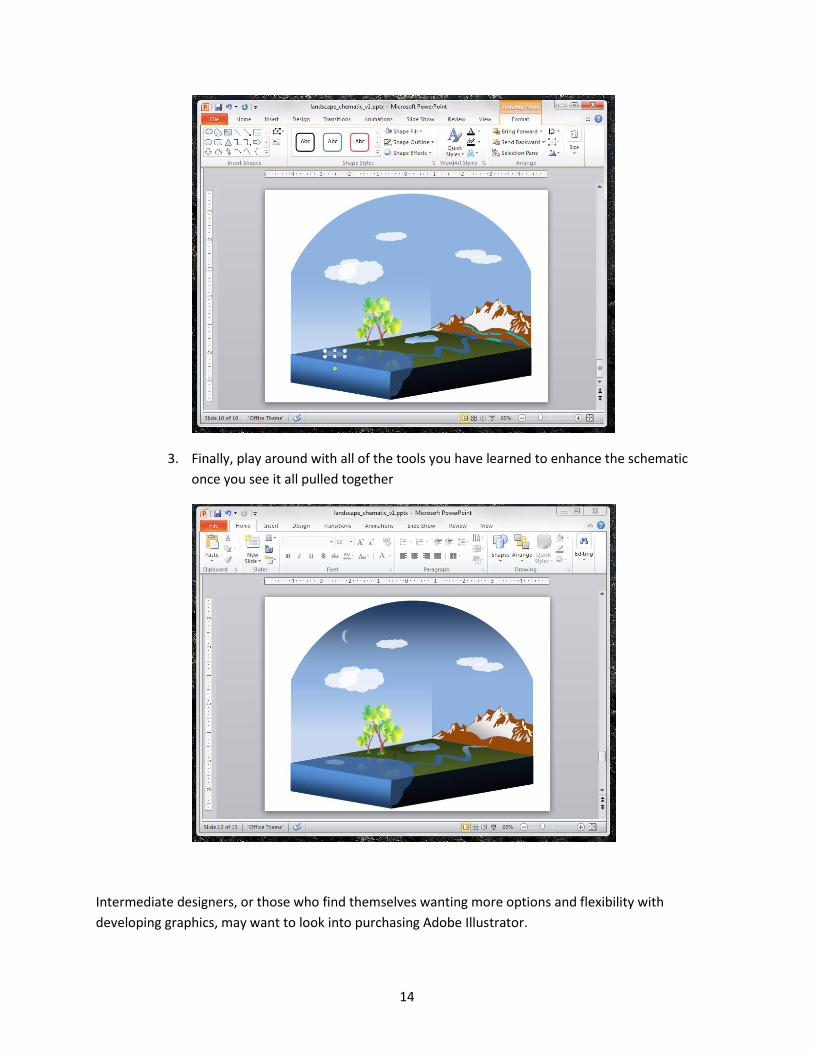
3. Finally, play around with all of the tools you have learned to enhance the schematic
once you see it all pulled together
Intermediate designers, or those who find themselves wanting more options and flexibility with
developing graphics, may want to look into purchasing Adobe Illustrator.

15
Illustrator lends itself well to illustrating science. The software can be used to plot data in a more
exciting way, and is compatible with postscript files, MATLAB figures, Microsoft Excel charts, PDFs, and
other files scientists commonly create as part of their research. For example, you can open these files
and take apart and modify their components to make them look better (e.g. thicken lines, shade curves,
change fonts, smooth data).
Illustrator is also compatible with the free resizable clipart illustrations offered by Microsoft Office
online, and you can take apart the individual pieces as in PowerPoint, described above in Section E4.
Further, you can insert photos into Illustrator and turn them into illustrations (of which you can then
take apart the individual pieces, recolor, etc.).
However, it is important to remember not to take advantage of every tool you come across no matter
what image-creating platform you use. Keep in mind that simpler really is better and will be more
effective in communicating your message. It took me a long time to admit this.
— Ilissa Ocko is a climate scientist at the Environmental Defense Fund in New York City.