creating a premier global packaging...
TRANSCRIPT
WestRock Creating A Premier Global
Packaging Company
Steve Voorhees
Chief Executive Officer
August 13, 2015
2
Forward-looking Statements
This presentation contains forward-looking statements within the meaning of the Private Securities Litigation Reform Act of 1995, including but not limited
to the statements on the slides entitled “WestRock Investment Thesis”, “WestRock Key Takeaways from June Quarter Results”, “Well Positioned
Corrugated Packaging Platform”, “WestRock Land and Development Update”, “Combined Merger-Related Synergy and Performance Improvement Goal
of $1.0 billion”, “Balanced Capital Allocation Strategy”, and “Multiple Levers to Increase Shareholder Value” that give guidance or estimates for future
periods as well as statements regarding, among other things, that, WestRock is creating a premier global packaging company in attractive growing
packaging markets; we have identified $1 billion of performance improvements and merger related synergies, before inflation; we expect a run-rate of
$150 million of business performance improvements and synergy benefits, before inflation, by the end of September 2015; we expect $550 million in cash
savings through FY24 by successfully merging U.S. qualified defined benefit pension plans; our expectation of paying an annualized dividend of $1.50 per
share; an annual cash dividend payout of approximately $390 million based on current shares outstanding and dividend payment rate per share; we will
maximize timing and value for WestRock stockholders with respect to the Land and Development business; we expect development sales to accelerate
over the coming quarters; Charleston, South Carolina market dynamics are strengthening; the Nexton and East Edisto developments are well positioned;
we will support and improve our business with acquisitions that improve our business which is a core competency; spinning off the attractive Specialty
Chemicals business; and the “What We Are Doing” column and the “Balanced Capital Allocation Strategy” section on the slide entitled “Multiple Levers to
Increase Shareholder Value.” Forward-looking statements are based on our current expectations, beliefs, plans or forecasts and are typically identified by
words or phrases such as "may," "will," "could," "should," "would," "anticipate," "estimate," "expect," "project," "intend," "plan," "believe," "target,"
"prospects," "potential" and "forecast," and other words, terms and phrases of similar meaning. Forward-looking statements involve estimates,
expectations, projections, goals, forecasts, assumptions, risks and uncertainties. WestRock cautions readers that a forward-looking statement is not a
guarantee of future performance and that actual results could differ materially from those contained in the forward-looking statement. With respect to
these statements, WestRock has made assumptions regarding, among other things, the results and impacts of the merger of MeadWestvaco and
RockTenn; whether and when the spin-off of WestRock's Specialty Chemicals business will occur; economic, competitive and market conditions
generally; volumes and price levels of purchases by customers; competitive conditions in WestRock's businesses and possible adverse actions of their
customers, competitors and suppliers. Further, WestRock's businesses are subject to a number of general risks that would affect any such forward-
looking statements including, among others, decreases in demand for their products; increases in energy, raw materials, shipping and capital equipment
costs; reduced supply of raw materials; fluctuations in selling prices and volumes; intense competition; the potential loss of certain customers; the scope,
costs, timing and impact of any restructuring of our operations and corporate and tax structure; the occurrence of a natural disaster, such as a hurricane,
winter or tropical storm, earthquake, tornado, flood, fire, or other unanticipated problems such as labor difficulties, equipment failure or unscheduled
maintenance and repair, which could result in operational disruptions of varied duration; our desire or ability to continue to repurchase company stock;
and adverse changes in general market and industry conditions. Such risks and other factors that may impact management's assumptions are more
particularly described in RockTenn 's and MeadWestvaco's past filings with the Securities and Exchange Commission, including under the caption
"Business – Forward-Looking Information" and "Risk Factors" in RockTenn's Annual Report on Form 10-K for the fiscal year ended September 30, 2014
and "Management's discussion and analysis of financial condition and results of operations – Forward-looking Statements" and "Risk factors" in
MeadWestvaco's Annual Report on Form 10-K for the fiscal year ended December 31, 2014. These risks, as well as other risks associated with
RockTenn, MeadWestvaco and WestRock are also more fully discussed under the caption "Cautionary Statement Regarding Forward-Looking
Statements" and "Risk Factors" in the Registration Statement on Form S-4 filed by WestRock on March 10, 2015 (which registration statement was
amended on April 20, 2015, May 6, 2015, and May 18, 2015, and was declared effective on May 19, 2015). The information contained herein speaks as
of the date hereof and WestRock does not have or undertake any obligation to update or revise its forward-looking statements, whether as a result of new
information, future events or otherwise.
3
Disclaimer and Use of Non-GAAP
Financial Measures and Reconciliations;
Clarification of MWV Referenced Time Periods
We may from time to time be in possession of certain information regarding WestRock that applicable law would not require
us to disclose to the public in the ordinary course of business, but would require us to disclose if we were engaged in the
purchase or sale of our securities. This presentation shall not be considered to be part of any solicitation of an offer to buy or
sell WestRock securities. This presentation also may not include all of the information regarding WestRock that you may need
to make an investment decision regarding WestRock securities. Any such investment decision should be made on the basis
of the total mix of information regarding WestRock that is publicly available as of the date of such decision.
We have included financial measures that are not prepared in accordance with accounting principles generally accepted in
the United States ("GAAP"). The non-GAAP financial measures presented are not intended to be a substitute for GAAP
financial measures, and any analysis of non-GAAP financial measures should be used only in conjunction with results
presented in accordance with GAAP and the reconciliations of non-GAAP financial measures to the most directly comparable
GAAP financial measures included in the Appendix to this presentation.
References herein to MWV’s Q3 FY15 and Q3 FY14 results reflect MWV’s results for the quarter ended June 2015 and June
2014, respectively.
4
WestRock Investment Thesis
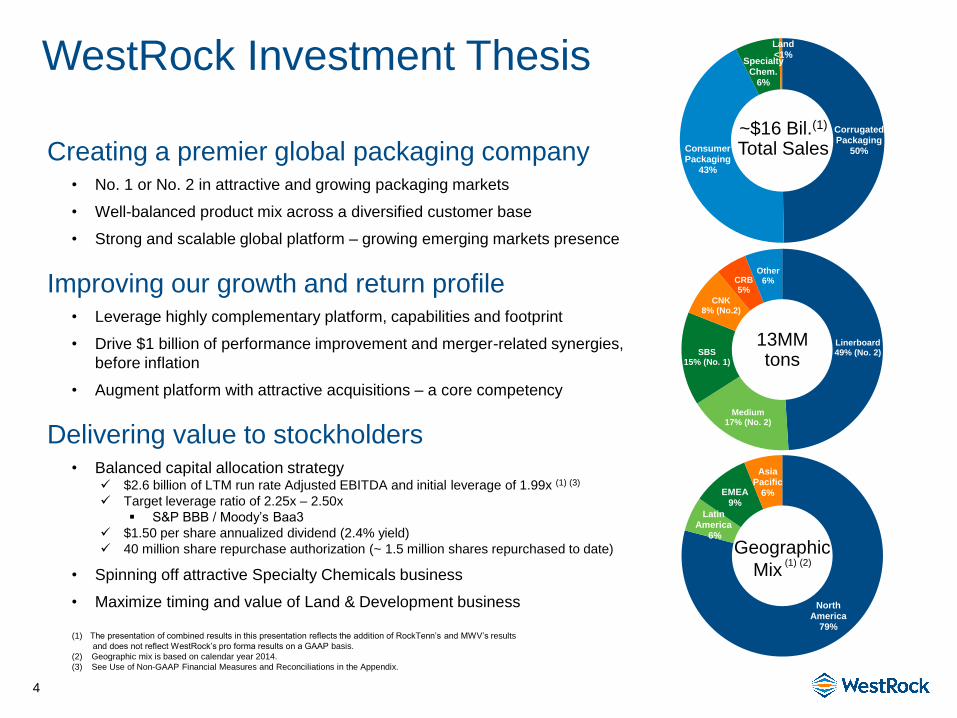
Creating a premier global packaging company • No. 1 or No. 2 in attractive and growing packaging markets
• Well-balanced product mix across a diversified customer base
• Strong and scalable global platform – growing emerging markets presence
Improving our growth and return profile • Leverage highly complementary platform, capabilities and footprint
• Drive $1 billion of performance improvement and merger-related synergies,
before inflation
• Augment platform with attractive acquisitions – a core competency
Delivering value to stockholders • Balanced capital allocation strategy
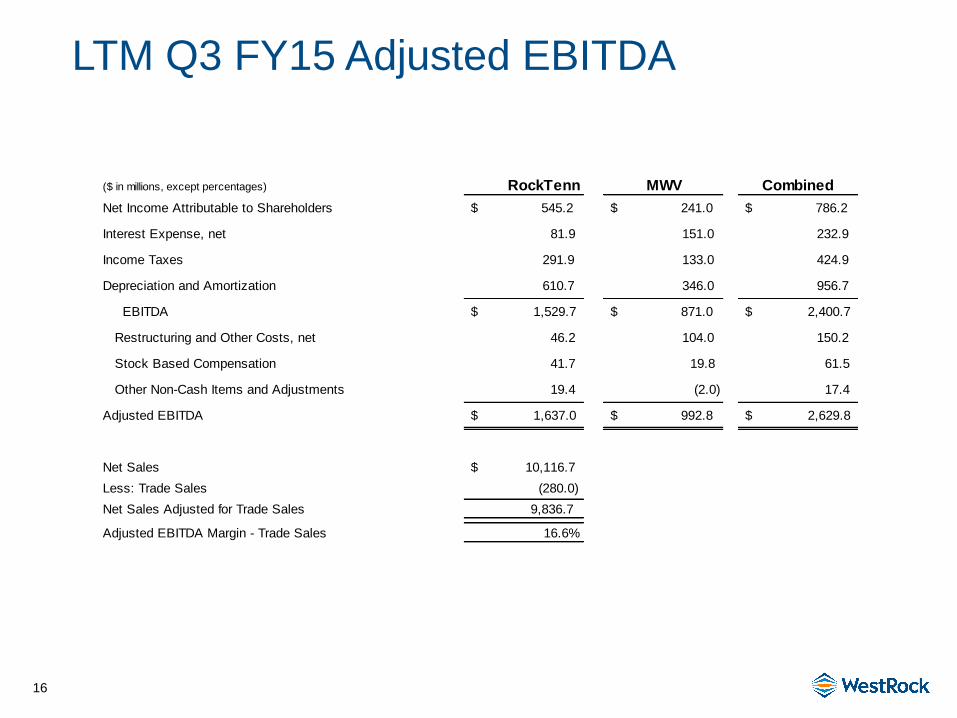
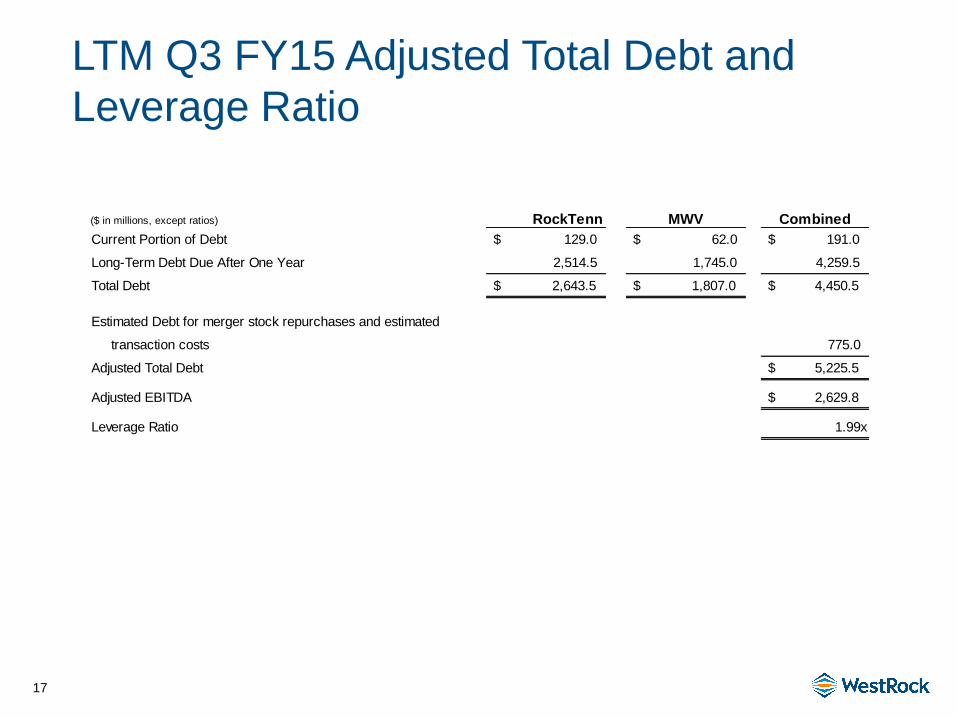
$2.6 billion of LTM run rate Adjusted EBITDA and initial leverage of 1.99x (1) (3)
Target leverage ratio of 2.25x – 2.50x
S&P BBB / Moody’s Baa3
$1.50 per share annualized dividend (2.4% yield)
40 million share repurchase authorization (~ 1.5 million shares repurchased to date)
• Spinning off attractive Specialty Chemicals business
• Maximize timing and value of Land & Development business
Linerboard 49% (No. 2)
Medium 17% (No. 2)
SBS 15% (No. 1)
CNK 8% (No.2)
CRB 5%
Other 6%
13MM tons
Corrugated Packaging
50% Consumer Packaging
43%
Specialty Chem.
6%
Land <1%
~$16 Bil.(1) Total Sales
(1) The presentation of combined results in this presentation reflects the addition of RockTenn’s and MWV’s results
and does not reflect WestRock’s pro forma results on a GAAP basis.
(2) Geographic mix is based on calendar year 2014.
(3) See Use of Non-GAAP Financial Measures and Reconciliations in the Appendix.
North America
79%
Latin America
6%
EMEA 9%
Asia Pacific
6%
Geographic
Mix (1) (2)
5
WestRock Key Takeaways from June
Quarter Results
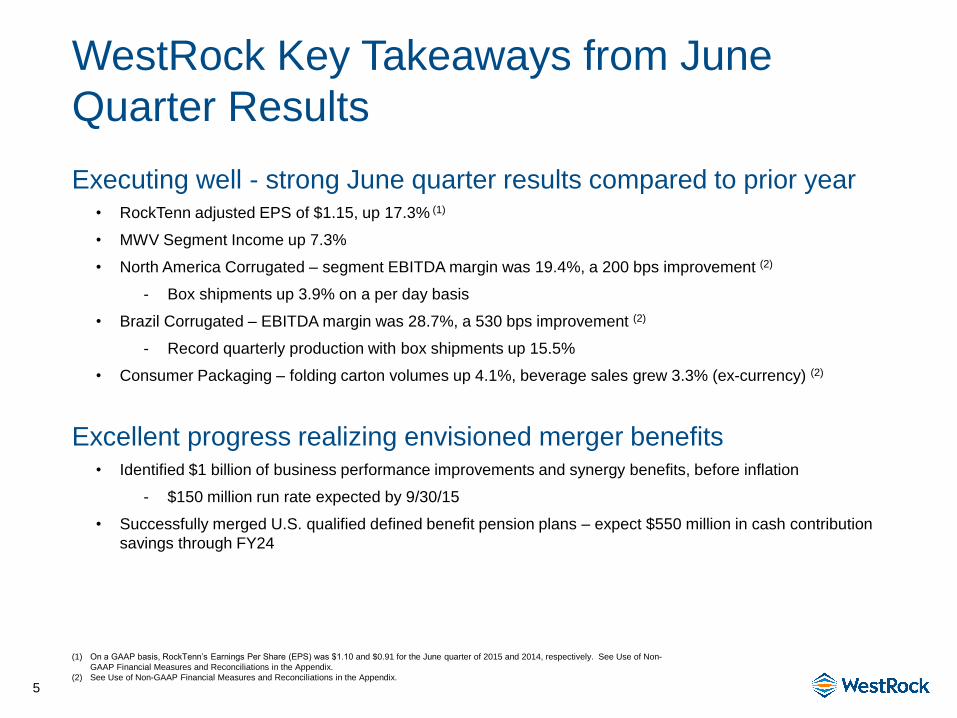
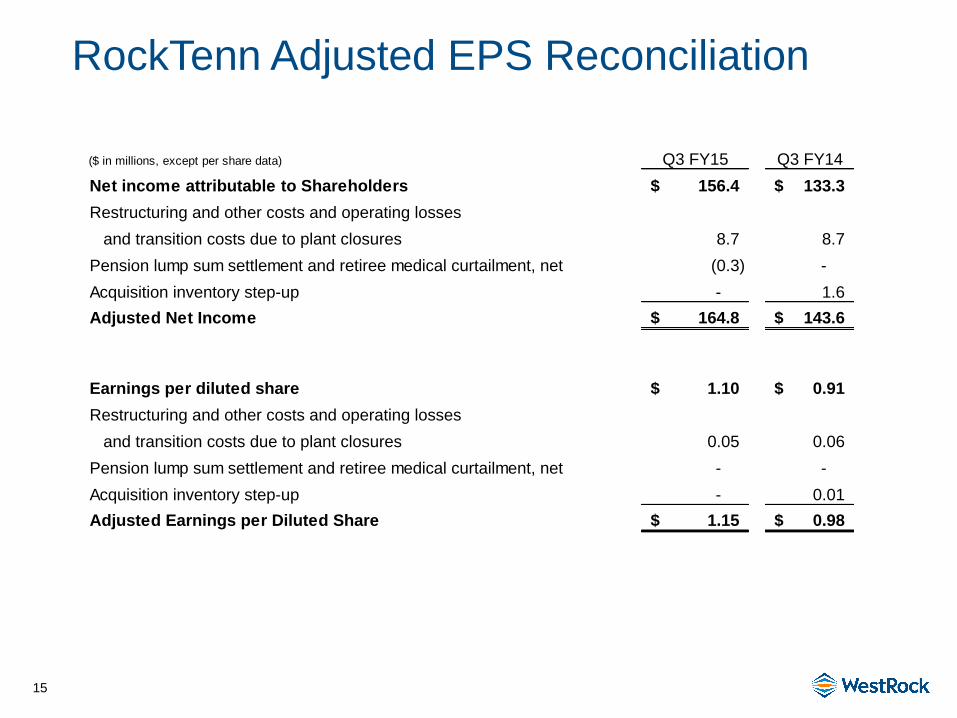
Executing well - strong June quarter results compared to prior year • RockTenn adjusted EPS of $1.15, up 17.3% (1)
• MWV Segment Income up 7.3%
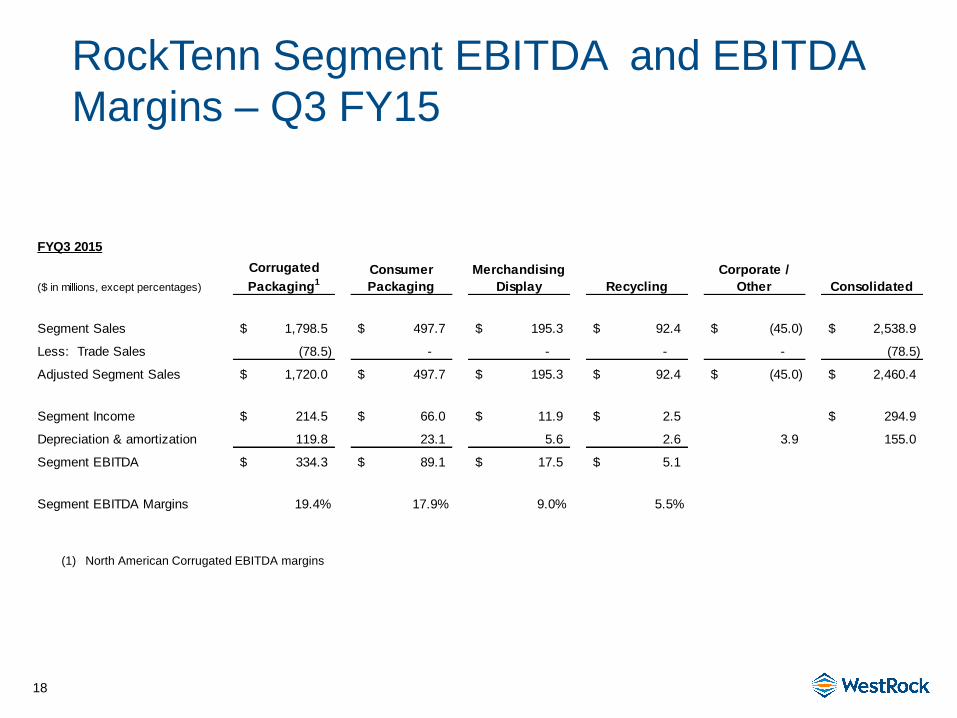
• North America Corrugated – segment EBITDA margin was 19.4%, a 200 bps improvement (2)
- Box shipments up 3.9% on a per day basis
• Brazil Corrugated – EBITDA margin was 28.7%, a 530 bps improvement (2)
- Record quarterly production with box shipments up 15.5%
• Consumer Packaging – folding carton volumes up 4.1%, beverage sales grew 3.3% (ex-currency) (2)
Excellent progress realizing envisioned merger benefits • Identified $1 billion of business performance improvements and synergy benefits, before inflation
- $150 million run rate expected by 9/30/15
• Successfully merged U.S. qualified defined benefit pension plans – expect $550 million in cash contribution
savings through FY24
(1) On a GAAP basis, RockTenn’s Earnings Per Share (EPS) was $1.10 and $0.91 for the June quarter of 2015 and 2014, respectively. See Use of Non-
GAAP Financial Measures and Reconciliations in the Appendix.
(2) See Use of Non-GAAP Financial Measures and Reconciliations in the Appendix.

6
Well-Positioned Corrugated Packaging Platform
(~$8 Billion in Annual Revenue)
North America
• North America's #2
largest vertically
integrated corrugated
manufacturer
• Broad range of converting
capabilities and high
quality corrugated
materials
• Customized and turn-key
solutions for all packaging
needs with approximately
100 North American
operations
Brazil
• Brazil’s #2 producer of
virgin kraft liner and
corrugated packaging
• High-quality virgin kraft
liner and recycled
material medium
paperboards
• Operates four box plants
across Brazil
India
• Corrugated packaging for
Indian fresh produce
• Developing market for
high-quality recycled
linerboard
A leader serving growing markets in North America, Brazil and India
7
SP Fiber Acquisition
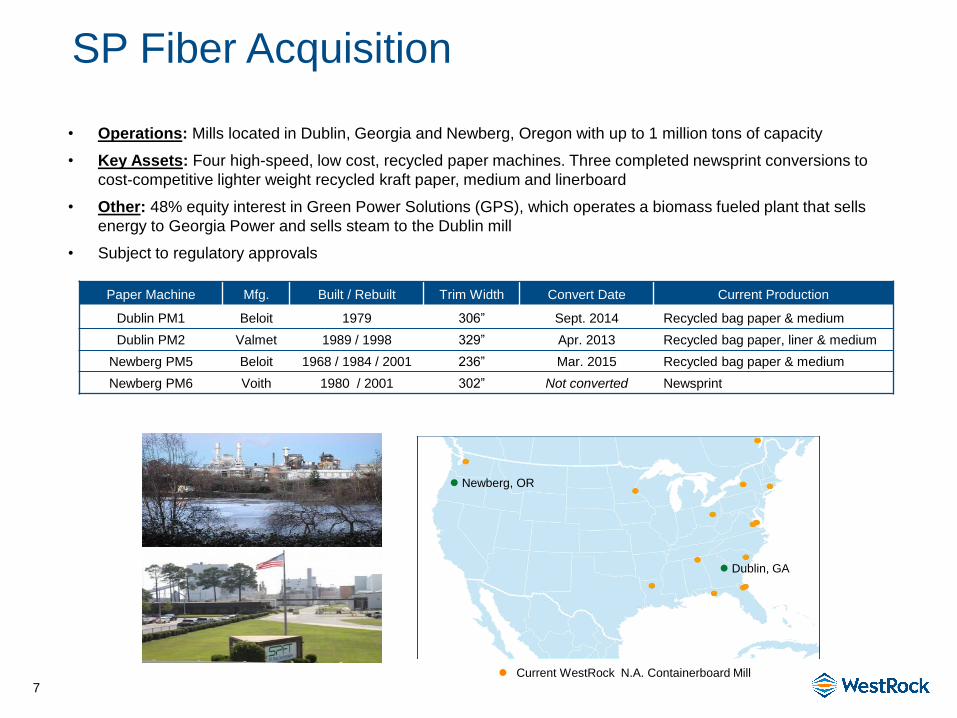
• Operations: Mills located in Dublin, Georgia and Newberg, Oregon with up to 1 million tons of capacity
• Key Assets: Four high-speed, low cost, recycled paper machines. Three completed newsprint conversions to
cost-competitive lighter weight recycled kraft paper, medium and linerboard
• Other: 48% equity interest in Green Power Solutions (GPS), which operates a biomass fueled plant that sells
energy to Georgia Power and sells steam to the Dublin mill
• Subject to regulatory approvals
Paper Machine Mfg. Built / Rebuilt Trim Width Convert Date Current Production
Dublin PM1 Beloit 1979 306” Sept. 2014 Recycled bag paper & medium
Dublin PM2 Valmet 1989 / 1998 329” Apr. 2013 Recycled bag paper, liner & medium
Newberg PM5 Beloit 1968 / 1984 / 2001 236” Mar. 2015 Recycled bag paper & medium
Newberg PM6 Voith 1980 / 2001 302” Not converted Newsprint
Current WestRock N.A. Containerboard Mill
Newberg, OR
Dublin, GA

8
Leading Consumer Packaging Platform with Scale
(~$7 Billion in Annual Revenue)
• Comprehensive
substrate mix
(SBS, CUK, CRB,
URB)
• Strong converting
assets and
capabilities
• Leading design
and innovation
capabilities
Leading Platform
& Capabilities
Diversified
End Markets
• Food
• Beverage
• Premium paperboard markets
(Tobacco, Commercial Print)
• Home, Health & Beauty
• Merchandising Displays
Global
Customer Mix
• Attractive global customer
base
• Comprehensive set of
product offerings to deliver
on customers’ evolving
needs
• Strongly positioned to
capture growth
9
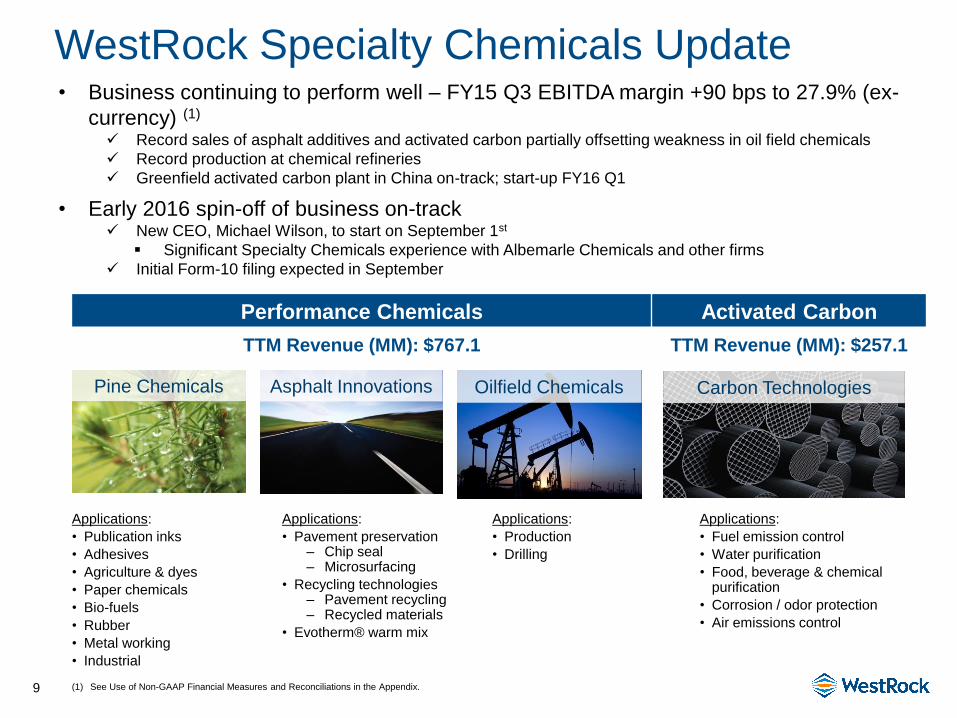
WestRock Specialty Chemicals Update • Business continuing to perform well – FY15 Q3 EBITDA margin +90 bps to 27.9% (ex-
currency) (1)
Record sales of asphalt additives and activated carbon partially offsetting weakness in oil field chemicals
Record production at chemical refineries
Greenfield activated carbon plant in China on-track; start-up FY16 Q1
• Early 2016 spin-off of business on-track New CEO, Michael Wilson, to start on September 1st
Significant Specialty Chemicals experience with Albemarle Chemicals and other firms
Initial Form-10 filing expected in September
Performance Chemicals Activated Carbon
TTM Revenue (MM): $767.1 TTM Revenue (MM): $257.1
Applications:
• Publication inks
• Adhesives
• Agriculture & dyes
• Paper chemicals
• Bio-fuels
• Rubber
• Metal working
• Industrial
Applications:
• Pavement preservation ‒ Chip seal ‒ Microsurfacing
• Recycling technologies ‒ Pavement recycling ‒ Recycled materials
• Evotherm® warm mix
Applications:
• Production
• Drilling
Applications:
• Fuel emission control
• Water purification
• Food, beverage & chemical purification
• Corrosion / odor protection
• Air emissions control
Asphalt Innovations Oilfield Chemicals Carbon Technologies Pine Chemicals
(1) See Use of Non-GAAP Financial Measures and Reconciliations in the Appendix.
10
WestRock Land & Development Update
10
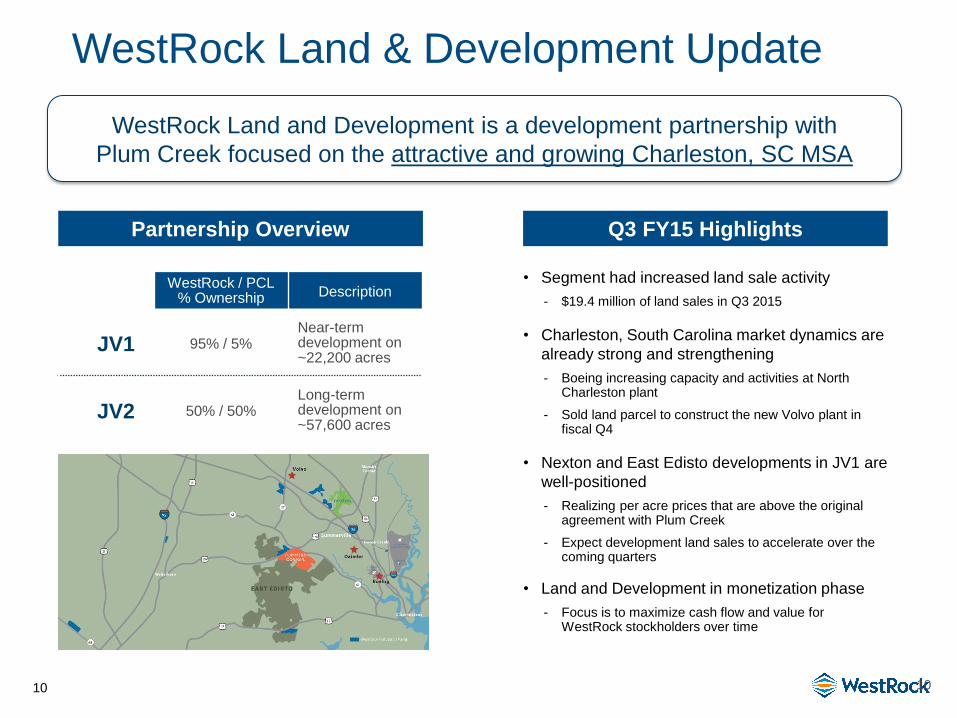
WestRock / PCL % Ownership Description
JV1 95% / 5% Near-term development on ~22,200 acres
JV2 50% / 50% Long-term development on ~57,600 acres
WestRock Land and Development is a development partnership with
Plum Creek focused on the attractive and growing Charleston, SC MSA
Partnership Overview Q3 FY15 Highlights
• Segment had increased land sale activity
- $19.4 million of land sales in Q3 2015
• Charleston, South Carolina market dynamics are
already strong and strengthening
- Boeing increasing capacity and activities at North Charleston plant
- Sold land parcel to construct the new Volvo plant in fiscal Q4
• Nexton and East Edisto developments in JV1 are
well-positioned
- Realizing per acre prices that are above the original agreement with Plum Creek
- Expect development land sales to accelerate over the coming quarters
• Land and Development in monetization phase
- Focus is to maximize cash flow and value for WestRock stockholders over time
11
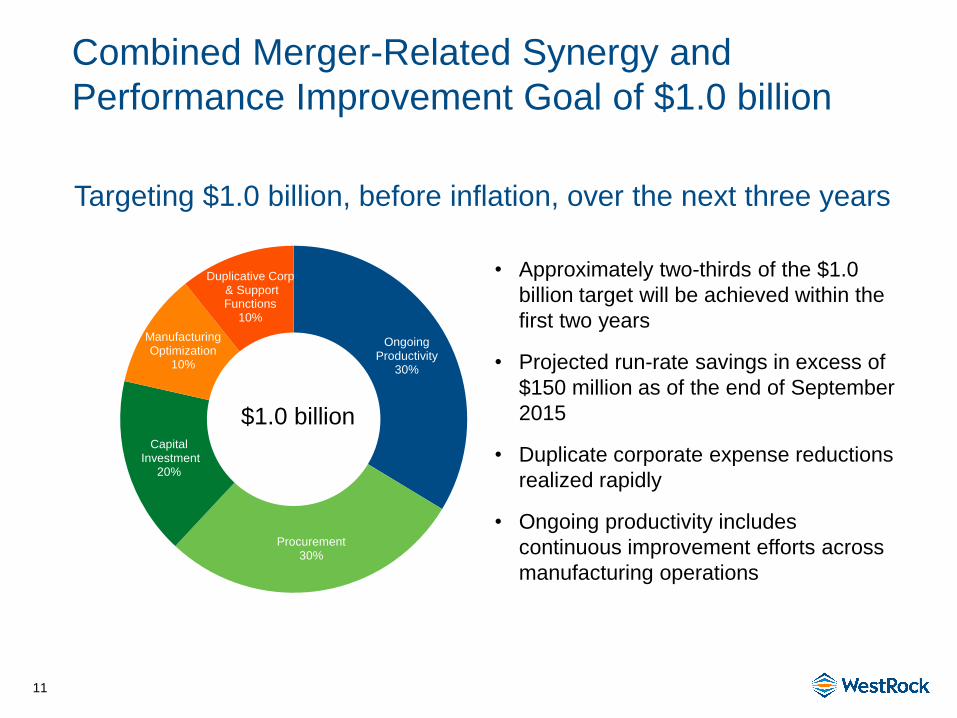
Ongoing Productivity
30%
Procurement 30%
Capital Investment
20%
Manufacturing Optimization
10%
Duplicative Corp & Support Functions
10%
Combined Merger-Related Synergy and
Performance Improvement Goal of $1.0 billion
$1.0 billion
• Approximately two-thirds of the $1.0
billion target will be achieved within the
first two years
• Projected run-rate savings in excess of
$150 million as of the end of September
2015
• Duplicate corporate expense reductions
realized rapidly
• Ongoing productivity includes
continuous improvement efforts across
manufacturing operations
Targeting $1.0 billion, before inflation, over the next three years
12
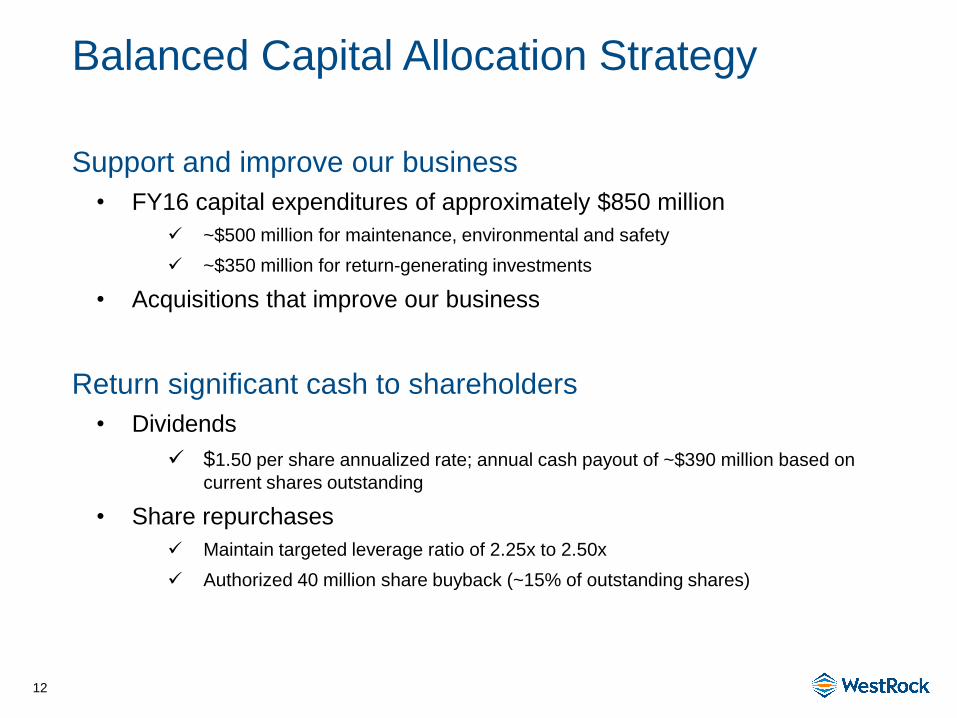
Balanced Capital Allocation Strategy
Support and improve our business
• FY16 capital expenditures of approximately $850 million
~$500 million for maintenance, environmental and safety
~$350 million for return-generating investments
• Acquisitions that improve our business
Return significant cash to shareholders
• Dividends
$1.50 per share annualized rate; annual cash payout of ~$390 million based on
current shares outstanding
• Share repurchases
Maintain targeted leverage ratio of 2.25x to 2.50x
Authorized 40 million share buyback (~15% of outstanding shares)
13
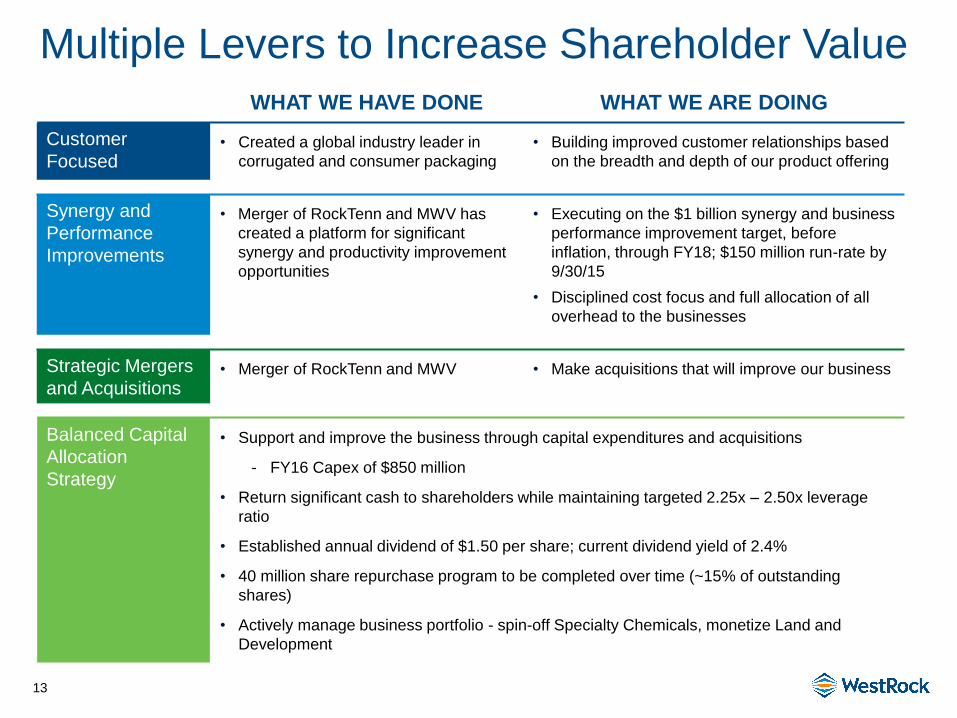
WHAT WE HAVE DONE WHAT WE ARE DOING
Customer
Focused • Created a global industry leader in
corrugated and consumer packaging
• Building improved customer relationships based
on the breadth and depth of our product offering
Synergy and
Performance
Improvements
• Merger of RockTenn and MWV has
created a platform for significant
synergy and productivity improvement
opportunities
• Executing on the $1 billion synergy and business
performance improvement target, before
inflation, through FY18; $150 million run-rate by
9/30/15
• Disciplined cost focus and full allocation of all
overhead to the businesses
Strategic Mergers
and Acquisitions • Merger of RockTenn and MWV • Make acquisitions that will improve our business
Balanced Capital
Allocation
Strategy
• Support and improve the business through capital expenditures and acquisitions
- FY16 Capex of $850 million
• Return significant cash to shareholders while maintaining targeted 2.25x – 2.50x leverage
ratio
• Established annual dividend of $1.50 per share; current dividend yield of 2.4%
• 40 million share repurchase program to be completed over time (~15% of outstanding
shares)
• Actively manage business portfolio - spin-off Specialty Chemicals, monetize Land and
Development
Multiple Levers to Increase Shareholder Value
15
RockTenn Adjusted EPS Reconciliation
($ in millions, except per share data) Q3 FY15 Q3 FY14
Net income attributable to Shareholders 156.4$ 133.3$
Restructuring and other costs and operating losses
and transition costs due to plant closures
Pension lump sum settlement and retiree medical curtailment, net (0.3) -
Acquisition inventory step-up - 1.6
Adjusted Net Income 164.8$ 143.6$
Earnings per diluted share 1.10$ 0.91$
Restructuring and other costs and operating losses
and transition costs due to plant closures
Pension lump sum settlement and retiree medical curtailment, net - -
Acquisition inventory step-up - 0.01
Adjusted Earnings per Diluted Share 1.15$ 0.98$
8.7 8.7
0.05 0.06
16
LTM Q3 FY15 Adjusted EBITDA
($ in millions, except percentages) RockTenn MWV Combined
Net Income Attributable to Shareholders $ 545.2 $ 241.0 $ 786.2
Interest Expense, net 81.9 151.0 232.9
Income Taxes 291.9 133.0 424.9
Depreciation and Amortization 610.7 346.0 956.7
EBITDA $ 1,529.7 $ 871.0 $ 2,400.7
Restructuring and Other Costs, net 46.2 104.0 150.2
Stock Based Compensation 41.7 19.8 61.5
Other Non-Cash Items and Adjustments 19.4 (2.0) 17.4
Adjusted EBITDA $ 1,637.0 $ 992.8 $ 2,629.8
Net Sales $ 10,116.7
Less: Trade Sales (280.0)
Net Sales Adjusted for Trade Sales 9,836.7
Adjusted EBITDA Margin - Trade Sales 16.6%
17
LTM Q3 FY15 Adjusted Total Debt and
Leverage Ratio
($ in millions, except ratios) RockTenn MWV Combined
Current Portion of Debt $ 129.0 $ 62.0 $ 191.0
Long-Term Debt Due After One Year 2,514.5 1,745.0 4,259.5
Total Debt $ 2,643.5 $ 1,807.0 $ 4,450.5
Estimated Debt for merger stock repurchases and estimated
transaction costs 775.0
Adjusted Total Debt $ 5,225.5
Adjusted EBITDA $ 2,629.8
Leverage Ratio 1.99x
18
RockTenn Segment EBITDA and EBITDA
Margins – Q3 FY15
FYQ3 2015
($ in millions, except percentages)
Corrugated
Packaging1
Consumer
Packaging
Merchandising
Display Recycling
Corporate /
Other Consolidated
Segment Sales 1,798.5$ 497.7$ 195.3$ 92.4$ (45.0)$ 2,538.9$
Less: Trade Sales (78.5) - - - - (78.5)
Adjusted Segment Sales 1,720.0$ 497.7$ 195.3$ 92.4$ (45.0)$ 2,460.4$
Segment Income 214.5$ 66.0$ 11.9$ 2.5$ 294.9$
Depreciation & amortization 119.8 23.1 5.6 2.6 3.9 155.0
Segment EBITDA 334.3$ 89.1$ 17.5$ 5.1$
Segment EBITDA Margins 19.4% 17.9% 9.0% 5.5%
(1) North American Corrugated EBITDA margins
19
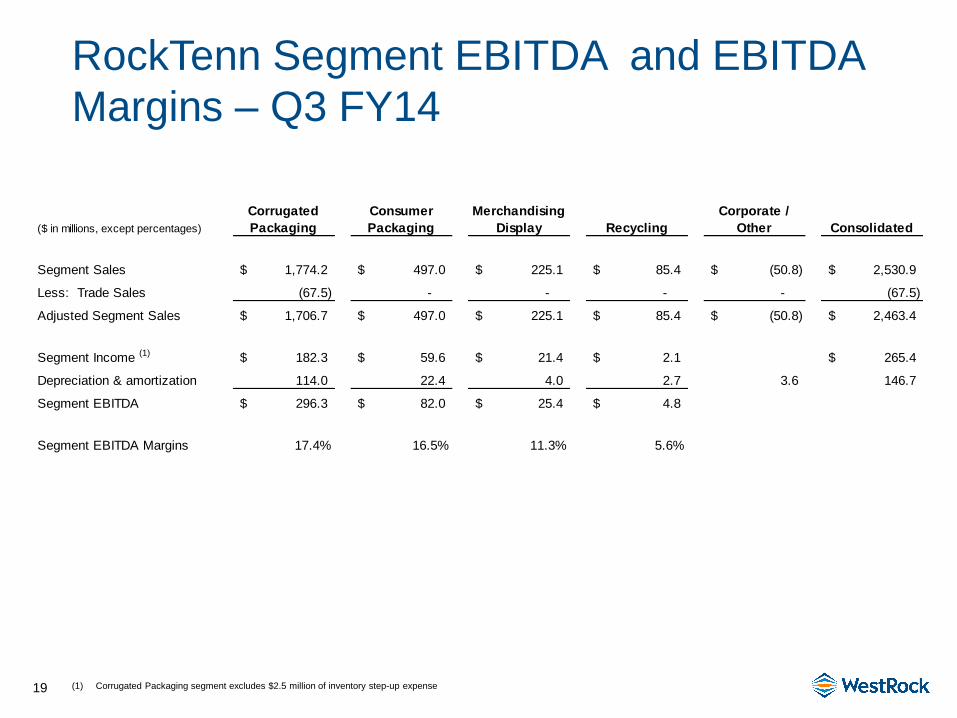
RockTenn Segment EBITDA and EBITDA
Margins – Q3 FY14
(1) Corrugated Packaging segment excludes $2.5 million of inventory step-up expense
($ in millions, except percentages)
Corrugated
Packaging
Consumer
Packaging
Merchandising
Display Recycling
Corporate /
Other Consolidated
Segment Sales 1,774.2$ 497.0$ 225.1$ 85.4$ (50.8)$ 2,530.9$
Less: Trade Sales (67.5) - - - - (67.5)
Adjusted Segment Sales 1,706.7$ 497.0$ 225.1$ 85.4$ (50.8)$ 2,463.4$
Segment Income (1) 182.3$ 59.6$ 21.4$ 2.1$ 265.4$
Depreciation & amortization 114.0 22.4 4.0 2.7 3.6 146.7
Segment EBITDA 296.3$ 82.0$ 25.4$ 4.8$
Segment EBITDA Margins 17.4% 16.5% 11.3% 5.6%
20
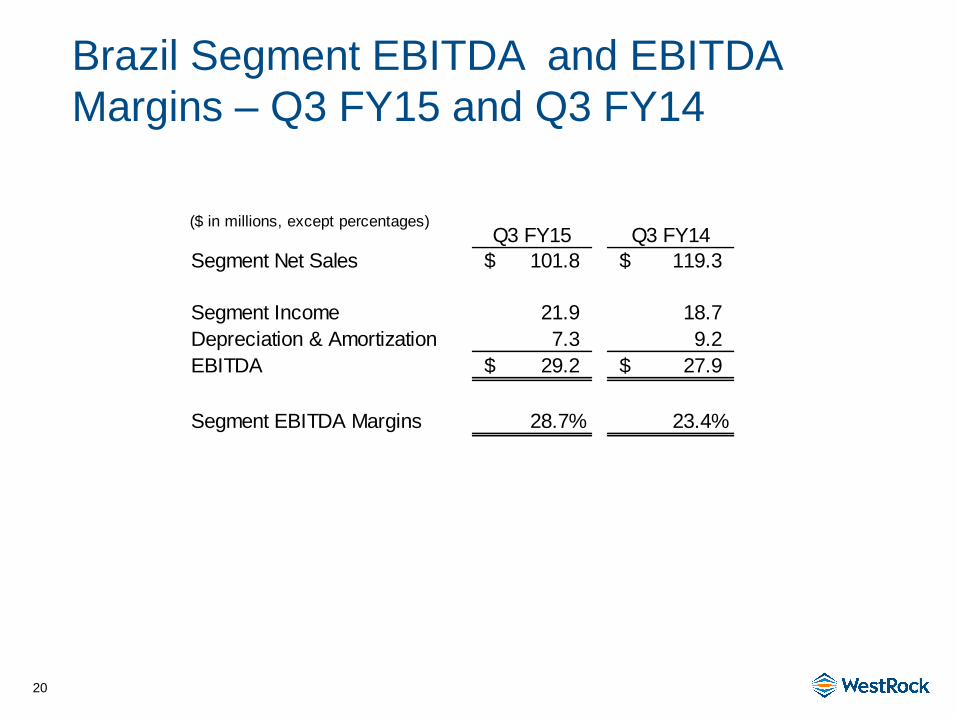
Brazil Segment EBITDA and EBITDA
Margins – Q3 FY15 and Q3 FY14
($ in millions, except percentages)Q3 FY15 Q3 FY14
Segment Net Sales 101.8$ 119.3$
Segment Income 21.9 18.7
Depreciation & Amortization 7.3 9.2
EBITDA 29.2$ 27.9$
Segment EBITDA Margins 28.7% 23.4%
21
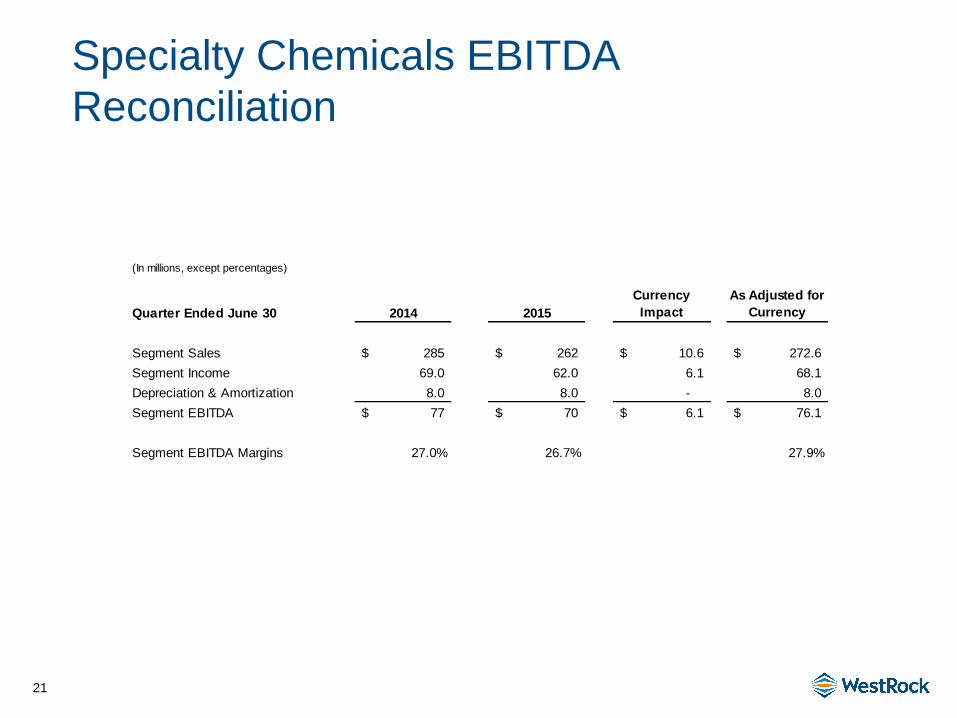
Specialty Chemicals EBITDA
Reconciliation
(In millions, except percentages)
Quarter Ended June 30 2014 2015
Currency
Impact
As Adjusted for
Currency
Segment Sales 285$ 262$ 10.6$ 272.6$
Segment Income 69.0 62.0 6.1 68.1
Depreciation & Amortization 8.0 8.0 - 8.0
Segment EBITDA 77$ 70$ 6.1$ 76.1$
Segment EBITDA Margins 27.0% 26.7% 27.9%
22
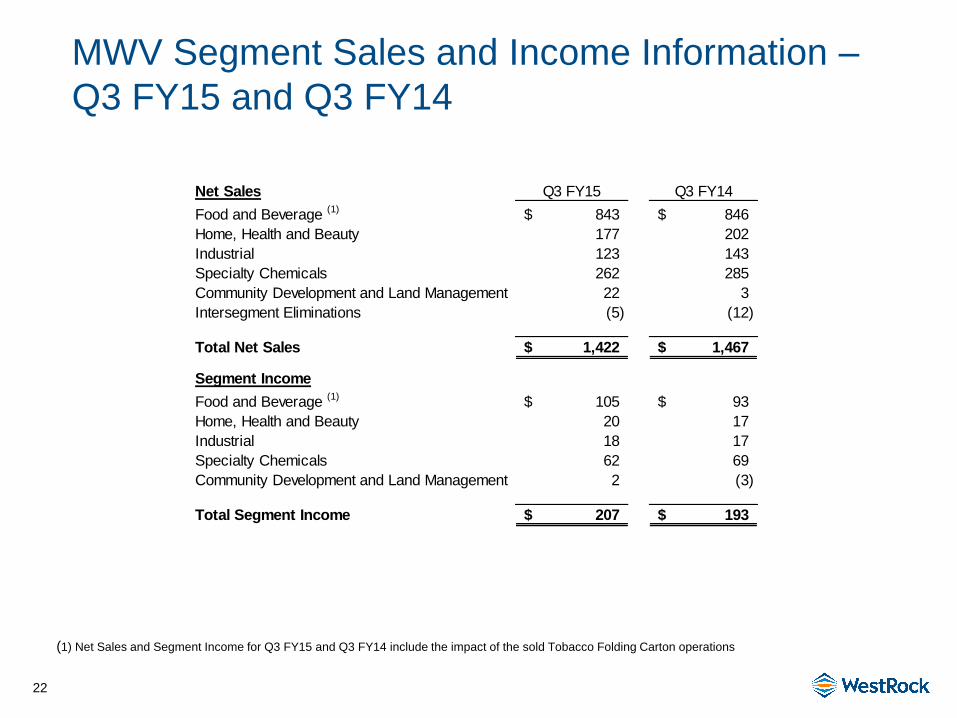
MWV Segment Sales and Income Information –
Q3 FY15 and Q3 FY14
(1) Net Sales and Segment Income for Q3 FY15 and Q3 FY14 include the impact of the sold Tobacco Folding Carton operations
Net Sales Q3 FY15 Q3 FY14
Food and Beverage (1)
843$ 846$
Home, Health and Beauty 177 202
Industrial 123 143
Specialty Chemicals 262 285
Community Development and Land Management 22 3
Intersegment Eliminations (5) (12)
Total Net Sales 1,422$ 1,467$
Segment Income
Food and Beverage (1)
105$ 93$
Home, Health and Beauty 20 17
Industrial 18 17
Specialty Chemicals 62 69
Community Development and Land Management 2 (3)
Total Segment Income 207$ 193$
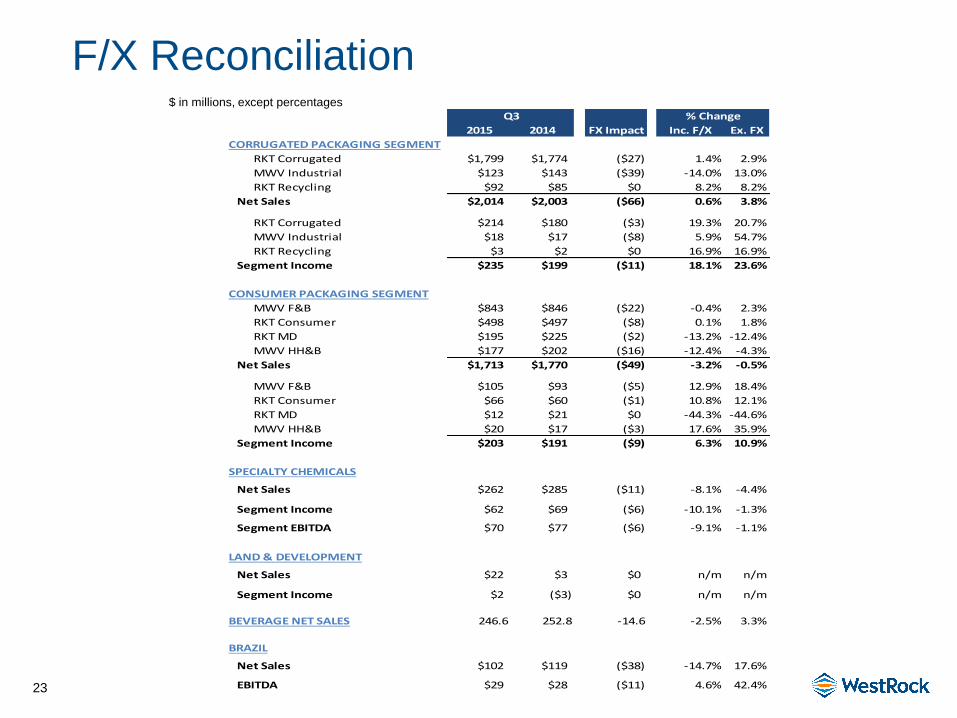
23
F/X Reconciliation $ in millions, except percentages
2015 2014 Inc. F/X Ex. FX
CORRUGATED PACKAGING SEGMENT
RKT Corrugated $1,799 $1,774 ($27) 1.4% 2.9%
MWV Industrial $123 $143 ($39) -14.0% 13.0%
RKT Recycling $92 $85 $0 8.2% 8.2%
Net Sales $2,014 $2,003 ($66) 0.6% 3.8%
RKT Corrugated $214 $180 ($3) 19.3% 20.7%
MWV Industrial $18 $17 ($8) 5.9% 54.7%
RKT Recycling $3 $2 $0 16.9% 16.9%
Segment Income $235 $199 ($11) 18.1% 23.6%
CONSUMER PACKAGING SEGMENT
MWV F&B $843 $846 ($22) -0.4% 2.3%
RKT Consumer $498 $497 ($8) 0.1% 1.8%
RKT MD $195 $225 ($2) -13.2% -12.4%
MWV HH&B $177 $202 ($16) -12.4% -4.3%
Net Sales $1,713 $1,770 ($49) -3.2% -0.5%
MWV F&B $105 $93 ($5) 12.9% 18.4%
RKT Consumer $66 $60 ($1) 10.8% 12.1%
RKT MD $12 $21 $0 -44.3% -44.6%
MWV HH&B $20 $17 ($3) 17.6% 35.9%
Segment Income $203 $191 ($9) 6.3% 10.9%
SPECIALTY CHEMICALS
Net Sales $262 $285 ($11) -8.1% -4.4%
Segment Income $62 $69 ($6) -10.1% -1.3%
Segment EBITDA $70 $77 ($6) -9.1% -1.1%
LAND & DEVELOPMENT
Net Sales $22 $3 $0 n/m n/m
Segment Income $2 ($3) $0 n/m n/m
BEVERAGE NET SALES 246.6 252.8 -14.6 -2.5% 3.3%
BRAZIL
Net Sales $102 $119 ($38) -14.7% 17.6%
EBITDA $29 $28 ($11) 4.6% 42.4%
Q3
FX Impact
% Change
