creating change for all children: disproportionality and school-wide pbs russ skiba the equity...
TRANSCRIPT

QuickTime™ and aTIFF (LZW) decompressor
are needed to see this picture.
Creating Change for All Children: Disproportionality and School-wide PBS
Russ SkibaThe Equity Project at Indiana University
Presented at the
Responding, Not Reacting ConferenceCentral Region II, MD July 16, 2008

QuickTime™ and aTIFF (LZW) decompressor
are needed to see this picture.
Protecting Equal Educational Opportunity Title VI of Civil Rights Act Individuals with Disabilities Education Act No Child Left Behind Yet disparities in:
Achievement gap Special Education Dropout/graduation Gifted/talented School discipline
QuickTime™ and aTIFF (LZW) decompressor
are needed to see this picture.
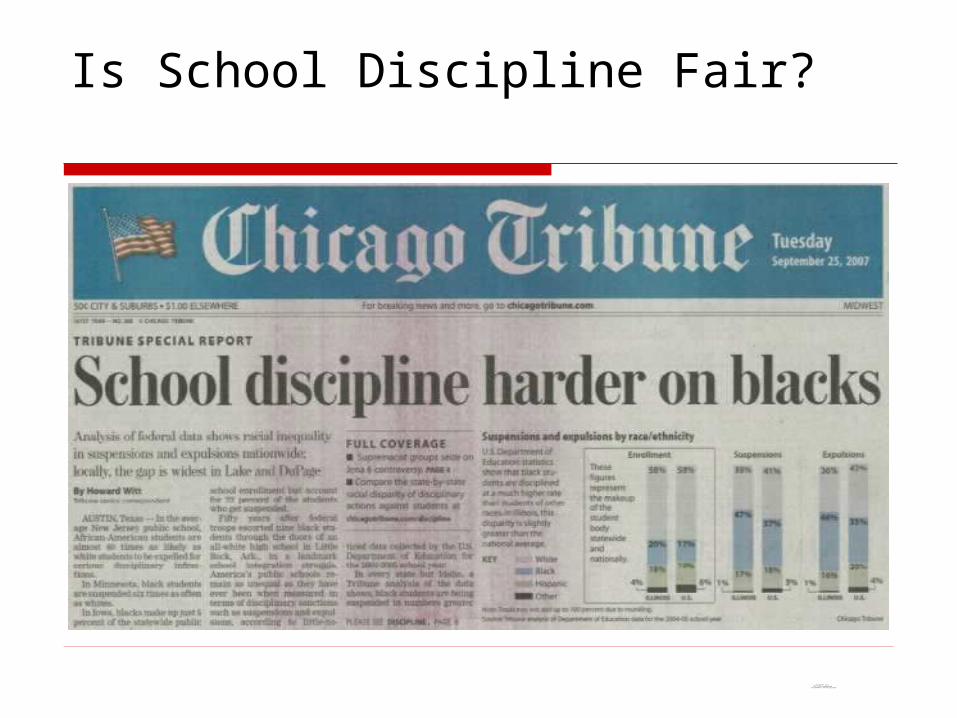
Is School Discipline Fair?

QuickTime™ and aTIFF (LZW) decompressor
are needed to see this picture.
CDF (1975): Black students suspended 2-3x as frequently
Disproportionality found by: Advancement Project, 2000 Costenbader & Markson, 1994 Costenbader & Markson, 1998 Eitle & Eitle, 2004 Felice, 1981 Glackman et al., 1978 Gordon, Della Piana, & Keleher, 2000 Gregory, 1997
Is School Discipline Fair?: 30 Years of Study

QuickTime™ and aTIFF (LZW) decompressor
are needed to see this picture.
Kaeser, 1979 Larkin, 1979 Lietz & Gregory, 1978 Massachusetts Advocacy Center, 1986 McCarthy & Hoge, 1987 McFadden & Marsh, 1992 McFadden, Marsh, Price, & Hwang, 1992 Raffaele Mendez & Knoff, 2003 Raffaele Mendez, Knoff, & Ferron, 2002 Rausch & Skiba, 2004a Richart et al., 2003 Shaw & Braden, 1990
Is School Discipline Fair?: 30 Years of Study (Cont’d)

QuickTime™ and aTIFF (LZW) decompressor
are needed to see this picture.
Skiba et al., 1997 Skiba et al., 2002 Streitmatter, 1986 Taylor & Foster, 1986 Thornton & Trent, 1988 U.S. Department of Education, 2000 Vavrus and Cole (2002) Wu et al., 1982
Is School Discipline Fair?: 30 Years of Study (Cont’d)

QuickTime™ and aTIFF (LZW) decompressor
are needed to see this picture.
Background: This Didn’t Start Yesterday (or even in 1975)
Thos. Jefferson: “...advance it as a suspicion” 1853: Margaret Douglas jailed 1897: Plessy v. Ferguson
Jim Crowe included burning of schools 1900-1930: Development of mental testing
and eugenics
QuickTime™ and aTIFF (LZW) decompressor
are needed to see this picture.
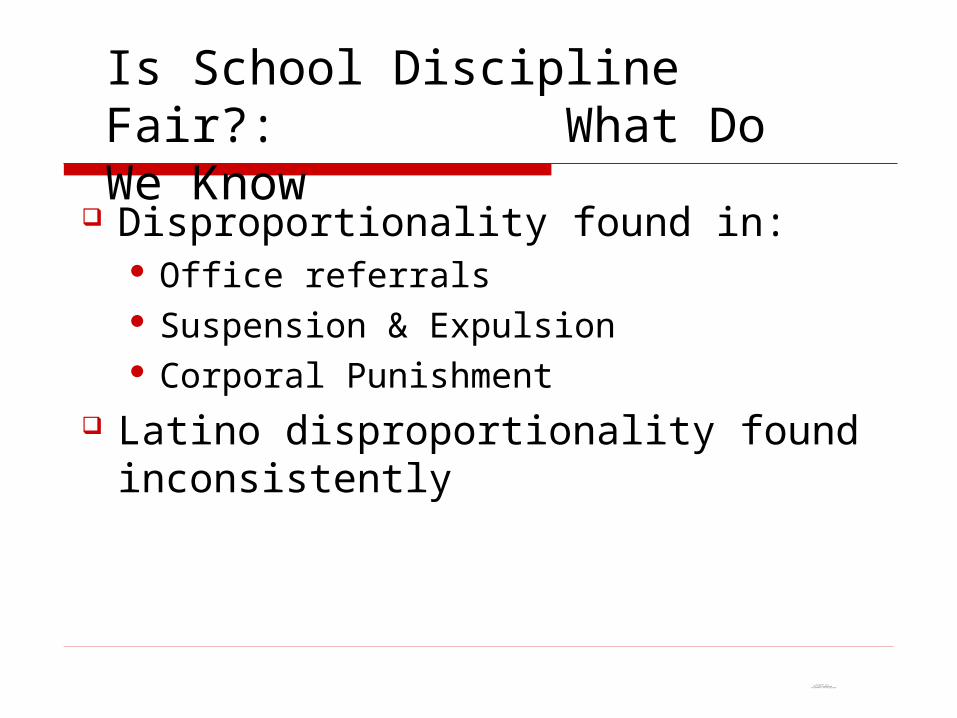
Disproportionality found in: Office referrals Suspension & Expulsion Corporal Punishment
Latino disproportionality found inconsistently
Is School Discipline Fair?: What Do We Know

QuickTime™ and aTIFF (LZW) decompressor
are needed to see this picture.
Note: Derived from U.S. Department of Education, 2004
Disproportionality in School Discipline at the National Level: 1972, 2000, 2003
6
3.1
13.2
5.09
13.9
4.88
0
2
4
6
8
10
12
14
16
Pe
rce
nt
of
Stu
de
nts
Su
sp
en
de
d
1972 2000 2003
AfricanAmerican
White
Relative Risk Ratios:1972: 1.942000: 2.592003: 2.84

QuickTime™ and aTIFF (LZW) decompressor
are needed to see this picture.
Discipline Rates by School Level
5.06
0.02
23.95
0.83
21.40
1.29
0
5
10
15
20
25
Incid
en
ts P
er
100 S
tud
en
ts
Elementary Middle High
OSS
EXP

QuickTime™ and aTIFF (LZW) decompressor
are needed to see this picture.
Out-of-School Suspension Incident Rate Comparison by Race and School Level
6.19
1.76
3.65
2.12
3.97
2.33
0
1
2
3
4
5
6
7
Incid
en
t R
ate
Com
pare
d t
o W
hit
e S
tud
en
ts
Elementary Middle High
AfricanAmerican
Hispanic

QuickTime™ and aTIFF (LZW) decompressor
are needed to see this picture.
Urban OSS Significantly higher; No statistical differences for EXP
Discipline Rates by Locale
24.28
0.75
13.31
0.61
11.56
0.63
7.00
0.41
0
5
10
15
20
25
30
Incid
en
ts P
er
100 S
tud
en
ts
Urban Suburban Town Rural
OSS
EXP

QuickTime™ and aTIFF (LZW) decompressor
are needed to see this picture.
Out-of-School Suspension Incident Rates by Race and Locale
6.6
39.21
28.15
38.89
52.39
19.19 19.03
13.909.97
10.38
10.0116.9
0
10
20
30
40
50
60
Urban Suburban Town Rural
Incid
en
t R
ate
per
100 S
tud
en
ts
AfricanAmericanHispanic
White

QuickTime™ and aTIFF (LZW) decompressor
are needed to see this picture.
Is Disciplinary Removal Effective? 30-50% of students suspended are repeat
offenders “Suspension functions as a reinforcer...rather than as a
punisher” (Tobin, Sugai & Colvin,1996)
Use of suspension correlates with School dropout (school level) (Raffaele-Mendez; Ekstrom,
1986)
Juvenile incarceration (state level) (Skiba et al)

QuickTime™ and aTIFF (LZW) decompressor
are needed to see this picture.
Percent Passing ISTEP by School Disciplinary Use (Adjusted for Demographic and Economic Indicators)
58.3557.51
49.9148.59
0
10
20
30
40
50
60
Perc
en
tag
e o
f S
tud
en
ts P
assin
g B
oth
M
ath
an
d E
ng
lish
Assessm
en
t
Low Usage High Usage
School Rate of Out-of-School Suspension and Expulsion
OSSEXP

QuickTime™ and aTIFF (LZW) decompressor
are needed to see this picture.
Risks of Suspension
Educational opportunity as the strongest predictor of instruction
Student perceptions of disparity School to prison pipeline?
No empirical data but School alienation creates risk for delinquency

QuickTime™ and aTIFF (LZW) decompressor
are needed to see this picture.
Alternative Explanations of Disciplinary Alternative Explanations of Disciplinary DisproportionalityDisproportionality
Disproportionality is related to SES SES and disproportionality correlate, but… Effects of race remain after control
Do black students misbehave more? No supporting evidence May in fact be treated more severely for same
offenses

QuickTime™ and aTIFF (LZW) decompressor
are needed to see this picture.
What Behaviors are Students What Behaviors are Students Referred For? By RaceReferred For? By RaceWhat Behaviors are Students What Behaviors are Students Referred For? By RaceReferred For? By Race
White students referred more for:
Smoking
Vandalism
Leaving w/o permission
Obscene Language
Black students referred more for:
Disrespect
Excessive Noise
Threat
Loitering
Of 32 infractions, only 8 significant differences:Of 32 infractions, only 8 significant differences:

QuickTime™ and aTIFF (LZW) decompressor
are needed to see this picture.
What Might Be Causing Disciplinary Disproportionality? Doesn’t appear to be related to AA enrollment Perhaps correlated with overuse of suspension
and expulsion May originate at classroom level
No differences at office level (Skiba et al., 2002) “Violations of implicit interactional codes” (Vavrus &
Coles, 2002)

QuickTime™ and aTIFF (LZW) decompressor
are needed to see this picture.
Ferguson, 2001
What Else Might Be Causing Disciplinary Disparities? Classroom Management
“Violations of implicit interactional codes” (Vavrus & Coles, 2002)
Interactions of some teachers/some students? Cultural Disparities
Cultural misinterpretations Lower or different expectations
Influence of stereotypes How are African American boys perceived? Different standards of “boys will be boys” Differential standards for “respect”, “loitering”, “threat”

...so what do we do?
QuickTime™ and aTIFF (LZW) decompressor
are needed to see this picture.
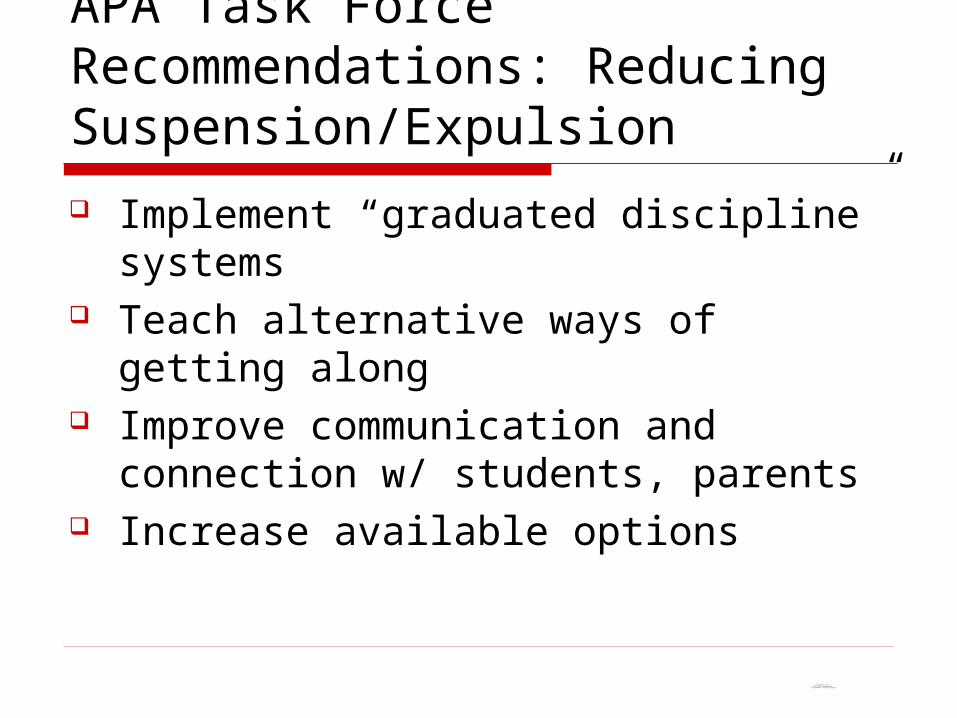
APA Task Force Recommendations: Reducing Suspension/Expulsion
Implement “graduated discipline” systems Teach alternative ways of getting along Improve communication and connection w/
students, parents Increase available options
QuickTime™ and aTIFF (LZW) decompressor
are needed to see this picture.
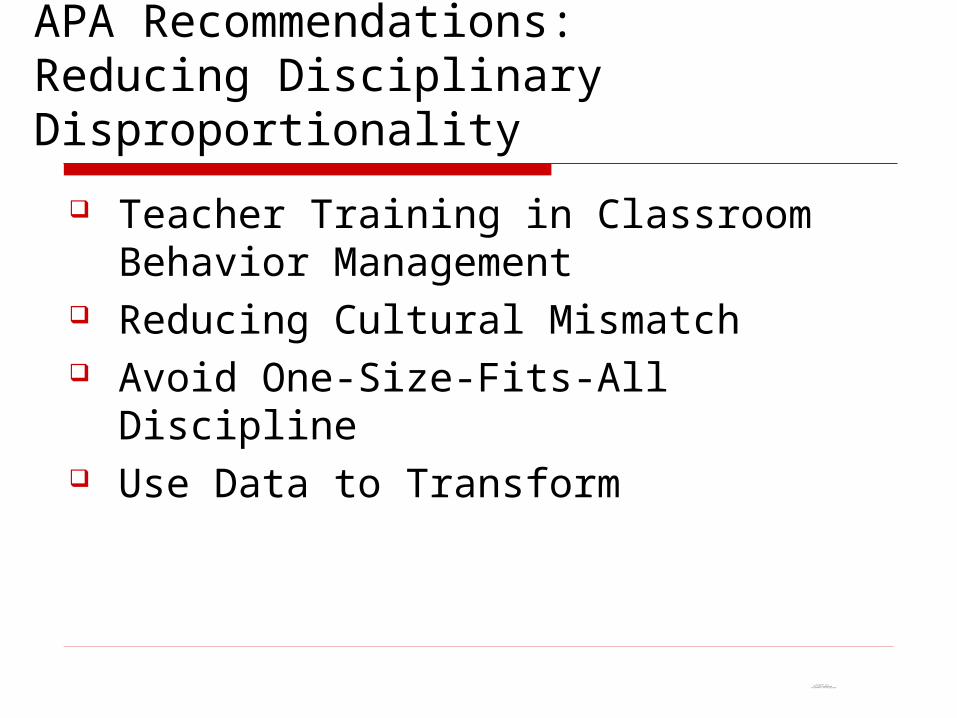
APA Recommendations:Reducing Disciplinary Disproportionality
Teacher Training in Classroom Behavior Management
Reducing Cultural Mismatch Avoid One-Size-Fits-All Discipline Use Data to Transform

QuickTime™ and aTIFF (LZW) decompressor
are needed to see this picture.
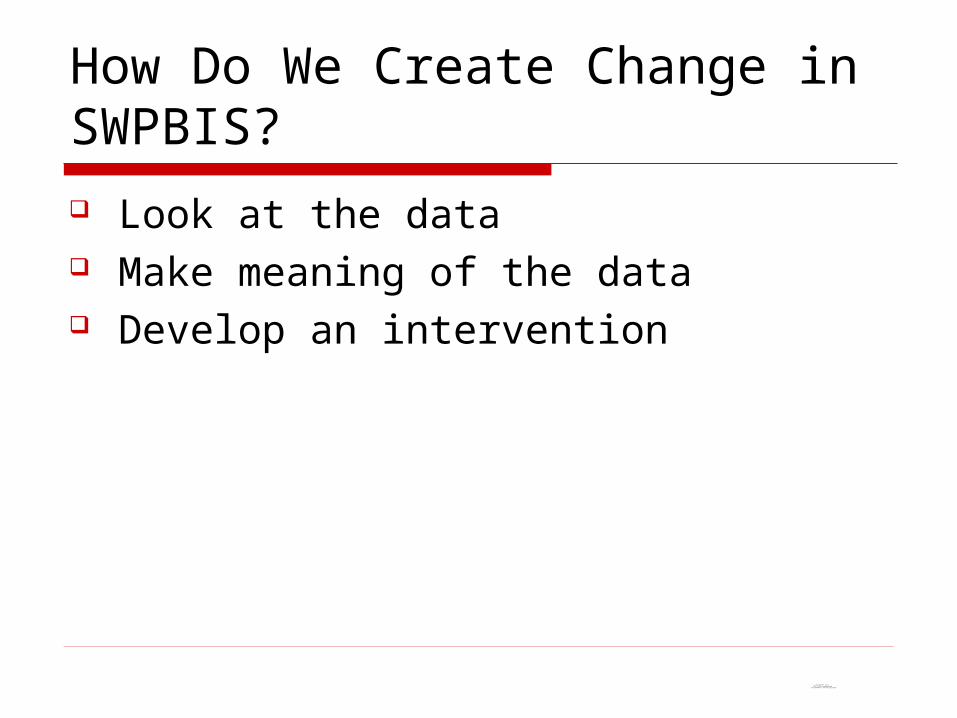
How Do We Create Change in SWPBIS?
Look at the data Make meaning of the data Develop an intervention Evaluate

QuickTime™ and aTIFF (LZW) decompressor
are needed to see this picture.
How Do We Create Change in SWPBIS?
Look at the data

QuickTime™ and aTIFF (LZW) decompressor
are needed to see this picture.
A National Database for Exploring Disproportionality 2005-06 Academic Year 436 Elementary and Middle Schools in 17 States
Implementing PBS at least 1 year 180,670 students 372,642 Office Discipline Referrals

QuickTime™ and aTIFF (LZW) decompressor
are needed to see this picture.
Effective Disciplinary Systems: What We Assume
Effective disciplinary systems should Scale disciplinary consequences in proportion
to seriousness of offenses, AND Be proportional across racial categories, since
there is no data to support any other distribution
QuickTime™ and aTIFF (LZW) decompressor
are needed to see this picture.
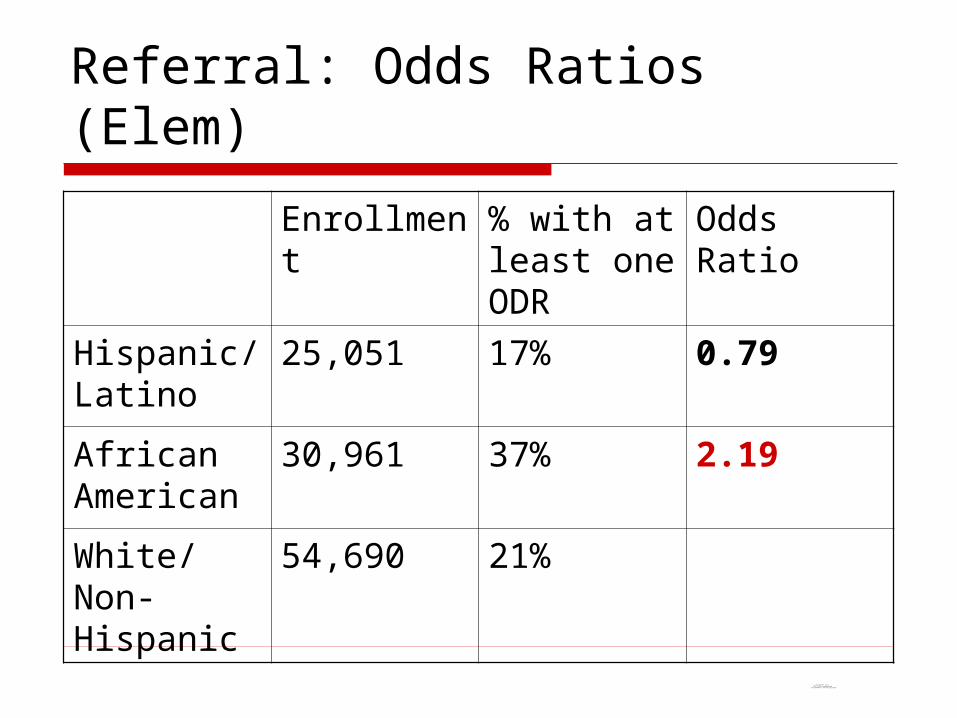
Referral: Odds Ratios (Elem)
Enrollment % with at least one ODR
Odds Ratio
Hispanic/ Latino
25,051 17% 0.79
African American
30,961 37% 2.19
White/ Non-Hispanic
54,690 21%

QuickTime™ and aTIFF (LZW) decompressor
are needed to see this picture.
Referral: Odds Ratios (Elem and Middle)
Enrollment % with at least one ODR
Odds Ratio
Hispanic/ Latino
25,051
10,332
17%
41%
0.79
1.71
African American
30,961
13,228
37%
61%
2.19
3.78
White/ Non-Hispanic
54,690
32,975
21%
29%

QuickTime™ and aTIFF (LZW) decompressor
are needed to see this picture.
Graduated Discipline
Detention Moderate/
(Call home, Privilege)
In school suspension
Out of school suspension
Minor
Defiance
Disruption
Moderate
Major
Use/ Possession

ODR & Administrative Consequences: Aggregated Data
OR Sig. OR Sig. OR Sig. OR Sig. OR Sig.
ODR (K-6) Minor Misbehavior 0.96 0.64 0.17 *** 0.02 *** 0.03 *** Defiance 0.88 1.51 0.88 0.78 * 0.01 *** Disruption 0.76 ** 1.40 0.79 * 0.59 *** 0.01 *** Moderate Infractions 1.04 1.42 1.28 * 1.55 *** 0.01 *** Major Violations 1.19 2.53 *** 1.44 ** 1.14 0.01 *** Use/Possession 0.94 1.84 4.34 *** 16.60 *** 0.02 *** Other/Unknown 1.33 ** 2.25 ** 1.19 1.32 * 0.02 ***
ODR (6-9) Minor Misbehavior 0.48 *** 0.67 *** 1.20 *** 0.27 *** 0.33 *** Defiance 0.29 *** 0.41 *** 0.74 *** 1.40 *** 0.24 *** Disruption 0.30 *** 0.38 *** 0.58 ** 1.40 *** 0.20 *** Moderate Infractions 0.30 *** 0.67 *** 1.20 *** 6.40 *** 0.33 *** Major Violations 0.38 *** 2.04 *** 1.44 *** 6.59 *** 0.50 *** Use/Possession 0.27 *** 1.97 ** 2.05 *** 53.01 *** 0.61 ** Other/Unknown 0.49 *** 1.20 ** 1.04 2.95 *** 0.49 ***
Other/UnknownDetentionModerate
PunishmentIn-School-Suspension
OSS/Expulsion
QuickTime™ and aTIFF (LZW) decompressor
are needed to see this picture.
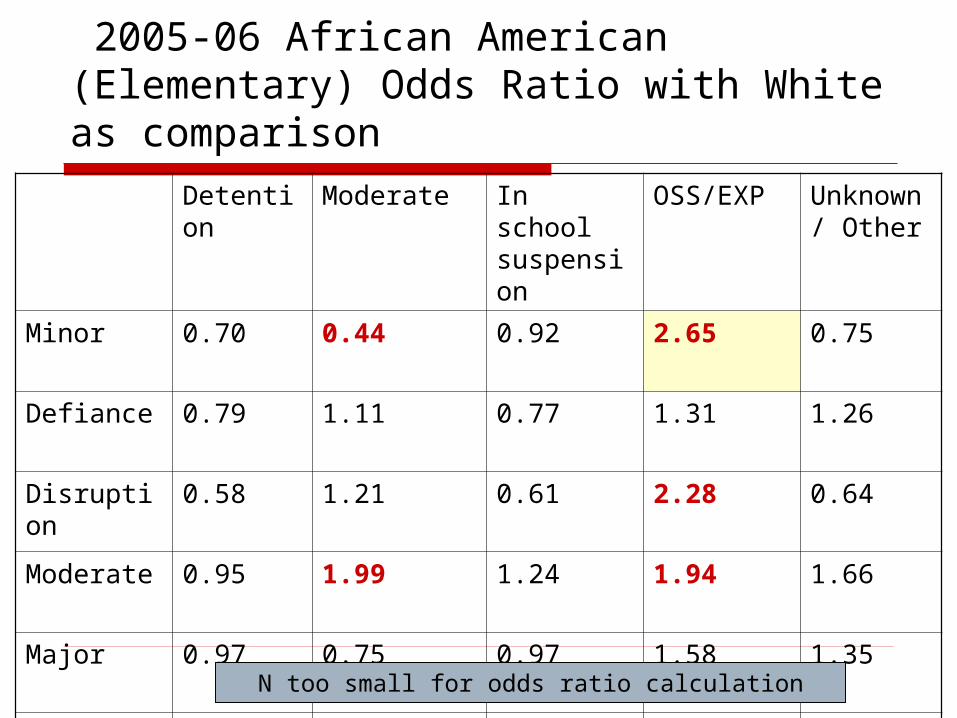
2005-06 African American (Elementary) Odds Ratio with White as comparison
Detention Moderate In school suspension
OSS/EXP Unknown/ Other
Minor 0.70 0.44 0.92 2.65 0.75
Defiance 0.79 1.11 0.77 1.31 1.26
Disruption 0.58 1.21 0.61 2.28 0.64
Moderate 0.95 1.99 1.24 1.94 1.66
Major 0.97 0.75 0.97 1.58 1.35
Use/ Possession
N too small for odds ratio calculation
QuickTime™ and aTIFF (LZW) decompressor
are needed to see this picture.
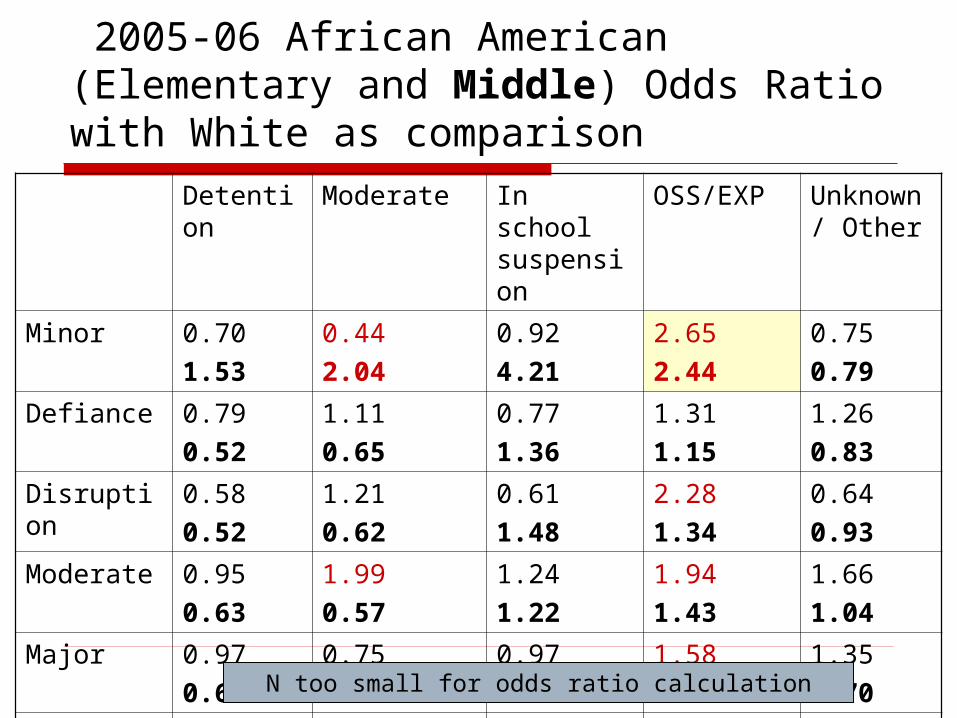
2005-06 African American (Elementary and Middle) Odds Ratio with White as comparison
Detention Moderate In school suspension
OSS/EXP Unknown/ Other
Minor 0.70
1.53
0.44
2.04
0.92
4.21
2.65
2.44
0.75
0.79
Defiance 0.79
0.52
1.11
0.65
0.77
1.36
1.31
1.15
1.26
0.83
Disruption 0.58
0.52
1.21
0.62
0.61
1.48
2.28
1.34
0.64
0.93
Moderate 0.95
0.63
1.99
0.57
1.24
1.22
1.94
1.43
1.66
1.04
Major 0.97
0.63
0.75
0.68
0.97
0.99
1.58
1.22
1.35
0.70
Use/ Possession
N too small for odds ratio calculation
QuickTime™ and aTIFF (LZW) decompressor
are needed to see this picture.
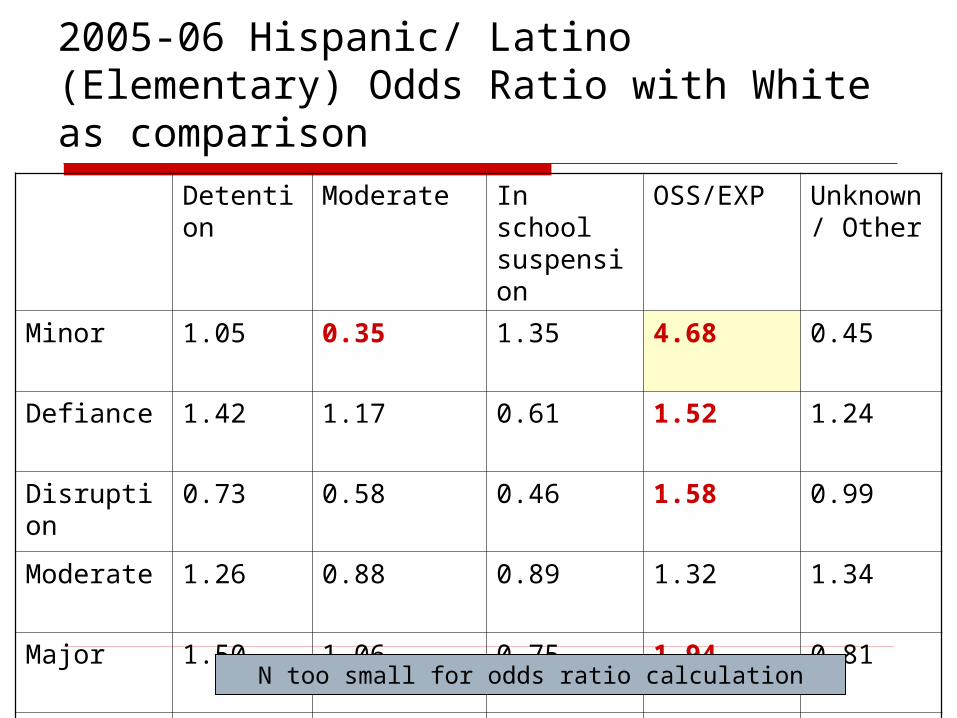
2005-06 Hispanic/ Latino (Elementary) Odds Ratio with White as comparison
Detention Moderate In school suspension
OSS/EXP Unknown/ Other
Minor 1.05 0.35 1.35 4.68 0.45
Defiance 1.42 1.17 0.61 1.52 1.24
Disruption 0.73 0.58 0.46 1.58 0.99
Moderate 1.26 0.88 0.89 1.32 1.34
Major 1.50 1.06 0.75 1.94 0.81
Use/ Possession
N too small for odds ratio calculation

QuickTime™ and aTIFF (LZW) decompressor
are needed to see this picture.
2005-06 Hispanic/ Latino (Elementary and Middle) Odds Ratio with White as comparison
Detention Moderate In school suspension
OSS/EXP Unknown/ Other
Minor 1.05
2.25
0.35
2.78
1.35
3.31
4.68
5.10
0.45
1.20
Defiance 1.42
1.03
1.17
1.11
0.61
1.53
1.52
1.46
1.24
1.09
Disruption 0.73
1.18
0.58
1.17
0.46
1.85
1.58
2.59
0.99
1.34
Moderate 1.26
1.07
0.88
1.05
0.89
1.42
1.32
2.17
1.34
0.94
Major 1.50
0.84
1.06
0.93
0.75
1.26
1.94
2.07
0.81
0.78
Use/ Possession
N too small for odds ratio calculation
QuickTime™ and aTIFF (LZW) decompressor
are needed to see this picture.
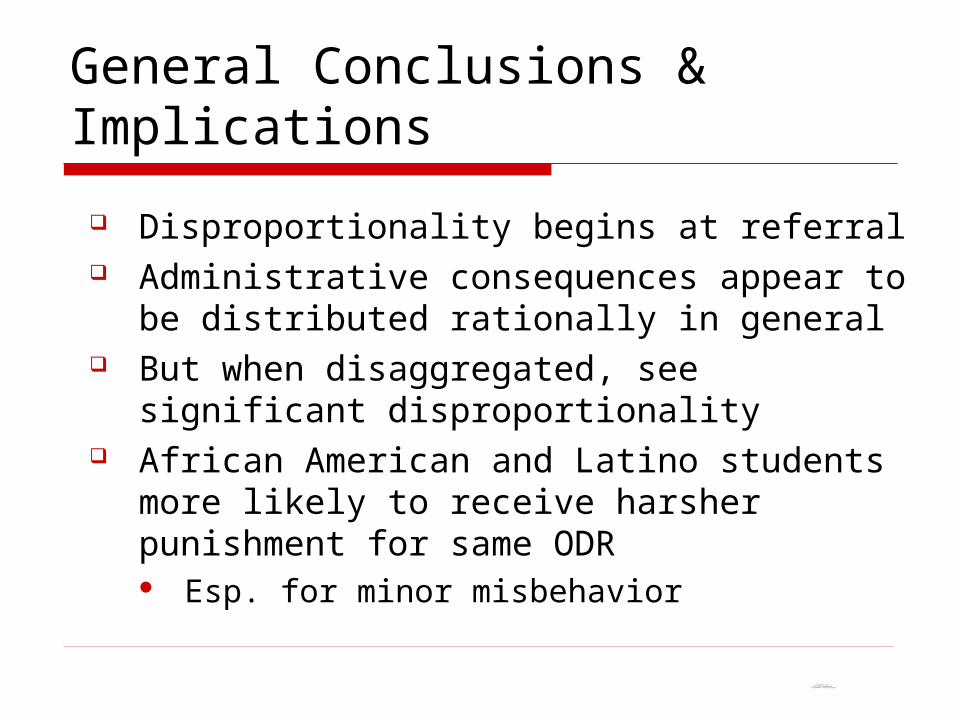
General Conclusions & Implications
Disproportionality begins at referral Administrative consequences appear to be
distributed rationally in general But when disaggregated, see significant
disproportionality African American and Latino students more likely
to receive harsher punishment for same ODR Esp. for minor misbehavior

QuickTime™ and aTIFF (LZW) decompressor
are needed to see this picture.
How Do We Create Change in SWPBIS?
Look at the data Make meaning of the data

QuickTime™ and aTIFF (LZW) decompressor
are needed to see this picture.
Studying Equity at Home: Local Equity Action Development (LEAD) School/District Reflection
Data Mining Discussions on Diversity
Identify Actions of Greatest Potential Impact Develop a Plan Implement, Assess, Adapt


QuickTime™ and aTIFF (LZW) decompressor
are needed to see this picture.
The Difficulty of Talking About Race
“When you say minorities, are you, what are you speaking of?...[INTERVIEWER: Ethnic and racial minorities]...Oh....OK...Alright...We have like...I guess we have about half and half. I don’t know that I’ve ever really paid attention to it .”
--Classroom Teacher

asdsdjkl;asdlkjj;lasd;fkj

Perspectives on Katrina: Washington Post/ABC News
Poll, 9/13/05
Perspectives on Katrina: Washington Post/ABC News
Poll, 9/13/05

What is Our Theory?
• Poverty?
• Deficits in classroom management?
• Negative community influences?
• Lack of cultural competence?
• Negative peer culture?
• Historical discrimination?
QuickTime™ and aTIFF (LZW) decompressor
are needed to see this picture.
How Do We Create Change in SWPBIS?
Look at the data Make meaning of the data Develop an intervention


QuickTime™ and aTIFF (LZW) decompressor
are needed to see this picture.

QuickTime™ and aTIFF (LZW) decompressor
are needed to see this picture.
What Does a Culturally Responsive PBIS Intervention Look Like?(Jones, Caravaca, Cizek, Horner, & Vincent, 2006)
“An awareness and appreciation of the multiple factors that may influence the values and perspectives of individual families and children.”
“Our message is that cultural responsiveness should not be viewed as an ‘added element’ but as an initial design feature that is to be implemented on a large scale.”

QuickTime™ and aTIFF (LZW) decompressor
are needed to see this picture.
PBIS at Chee-Dodge Elementary Yahtahey, NM; 99% Dine Elements of program
Made Dine language a central part of PBS PAWS: Developed culturally competent lessons
Results 80% of surveyed students knew expectations High score on Self-Assessment Form 0.12 ODR’s per day per 100 students (3rd lowest in
NM)--less than half national mean rate

QuickTime™ and aTIFF (LZW) decompressor
are needed to see this picture.
How Do We Create Change in SWPBIS?
Look at the data Make meaning of the data Develop an intervention Evaluate

QuickTime™ and aTIFF (LZW) decompressor
are needed to see this picture.
Discipline Rates
28.35
40.47
20.25
0
5
10
15
20
25
30
35
40
45
Incid
en
t R
ate
Per
100 S
tud
en
ts
Overall Rate Disaggregated Rate
BLACKWHITEOVERALL

QuickTime™ and aTIFF (LZW) decompressor
are needed to see this picture.
Discipline Rates
18.35
40.47
20.25
0
5
10
15
20
25
30
35
40
45
Incid
en
t R
ate
Per
100 S
tud
en
ts
Overall Rate Disaggregated Rate
BLACKWHITEOVERALL

QuickTime™ and aTIFF (LZW) decompressor
are needed to see this picture.
Discipline Rates Disaggregated
18.35
40.47
10.13
0
5
10
15
20
25
30
35
40
45
Incid
en
t R
ate
Per
100 S
tud
en
ts
Overall Rate Disaggregated Rate
BLACKWHITEOVERALL

QuickTime™ and aTIFF (LZW) decompressor
are needed to see this picture.
Discipline Rates
28.35
40.47
20.25
0
5
10
15
20
25
30
35
40
45
Incid
en
t R
ate
Per
100 S
tud
en
ts
Overall Rate Disaggregated Rate
BLACKWHITEOVERALL
QuickTime™ and aTIFF (LZW) decompressor
are needed to see this picture.
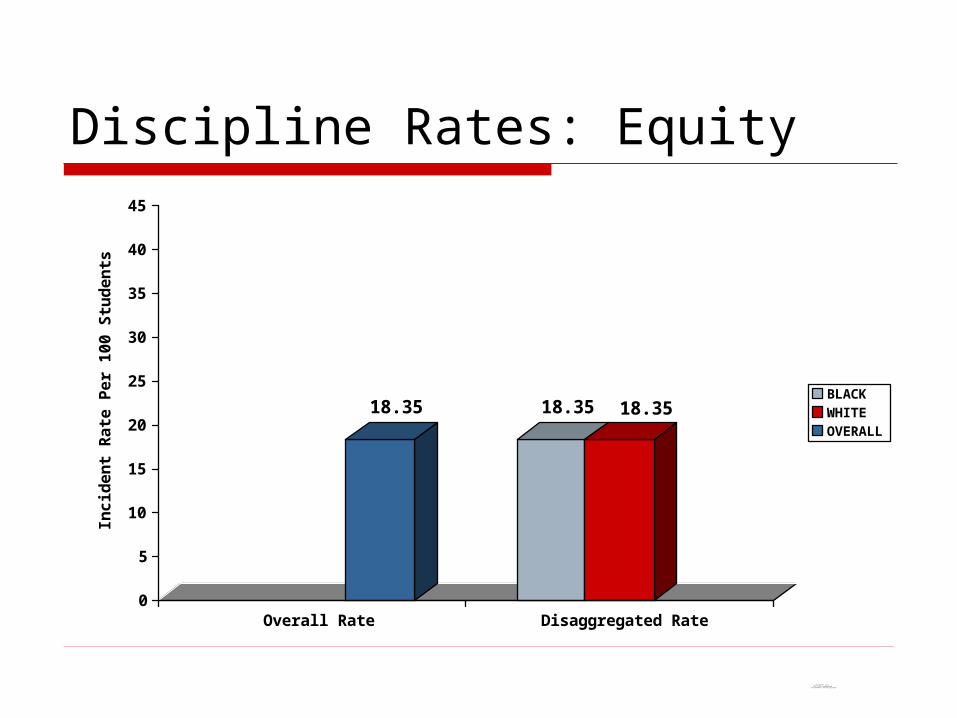
Discipline Rates: Equity
18.35 18.35 18.35
0
5
10
15
20
25
30
35
40
45
Incid
en
t R
ate
Per
100 S
tud
en
ts
Overall Rate Disaggregated Rate
BLACKWHITEOVERALL

QuickTime™ and aTIFF (LZW) decompressor
are needed to see this picture.
Possible Steps in Culturally Responsive PBS Look at the data on disparities
How great are the disparities? In what infractions? In what consequences?
Interpretation and hypothesis development Must represent all groups and perspectives What are the cultural differences?
Implement culturally responsive intervention
Evaluate impact on racial/ethnic disparities

QuickTime™ and aTIFF (LZW) decompressor
are needed to see this picture.
When Did Segregation End?
Brown v. Board of Education “with all deliberate speed...”
Alexander v. Holmes County Bd. of Ed. “There is no reason why such a wholesale
deprivation of constitutional rights should be tolerated another minute.”

QuickTime™ and aTIFF (LZW) decompressor
are needed to see this picture.
Some Relative Lengths...
State sponsored discrimination: 351 years Since its end: 37 years

QuickTime™ and aTIFF (LZW) decompressor
are needed to see this picture.
The Meaning of Equity... Ownership interest in a corporation in the form of
common stock or preferred stock. It also refers to total assets minus total liabilities, in which case it is also referred to as shareholder's equity or net worth or book value. In real estate, it is the difference between what a property is worth and what the owner owes against that property (i.e. the difference between the house value and the remaining mortgage or loan payments on a house). In the context of a futures trading account, it is the value of the securities in the account, assuming that the account is liquidated at the going price. In the context of a brokerage account, it is the net value of the account, i.e. the value of securities in the account less any margin requirements.

QuickTime™ and aTIFF (LZW) decompressor
are needed to see this picture.
The Meaning of Equity
“No man is an Island, entire of itself; every man is a piece of the Continent, a part of the main; if a Clod be washed away by the Sea, Europe is the less, as well as if a Promontorie were, as well as if a Manner of thy friends or of thine own were; any mans death diminishes me, because I am involved in Mankind; And therefore never send to know for
whom the bell tolls; It tolls for thee.”--John Donne, Meditation XVII from
“Devotions Upon Emergent Occasions” (1623)

QuickTime™ and aTIFF (LZW) decompressor
are needed to see this picture.
Websites: Equity Project at Indiana University
ceep.indiana.edu/equity Children Left Behind
ceep.indiana.edu/ChildrenLeftBehind
APA Zero Tolerance Report http://www.apa.org/ed/cpse/zttfreport.pdf

Russ SkibaRuss Skiba
Director, The Equity ProjectCenter for Evaluation and Education Policy509 E. Third St.Bloomington, IN [email protected]