discipline and disproportionality in the new ideia russ skiba center for evaluation and education...
TRANSCRIPT

QuickTime™ and a
TIFF (LZW) decompressorare needed to see this picture.
Discipline and Disproportionality in the New IDEIA
Russ SkibaCenter for Evaluation and Education PolicyIndiana University
Presented at the Annual Meeting of the Council for Exceptional Children
Salt Lake City, Utah April 6, 2006
QuickTime™ and a
TIFF (LZW) decompressorare needed to see this picture.
Prologue: How Do You Spell IDEA?
``PART A--GENERAL PROVISIONS``SEC. 601. <<NOTE: 20 USC 1400.>> SHORT TITLE; TABLE OF CONTENTS;
FINDINGS; PURPOSES.
``(a) Short Title.--This title may be cited as the `Individuals with Disabilities Education Act'.

QuickTime™ and a
TIFF (LZW) decompressorare needed to see this picture.
New Reporting Requirements Under IDEA 2004 Under Section 618, States must provide
data on: Incidence and duration of disciplinary actions
by race, ethnicity, limited English proficiency status, gender, and disability category, of children with disabilities, including suspensions of 1 day or more
Number & percentage removed to IAES compared to children w/o disabilities removed to alt. ed.
QuickTime™ and a
TIFF (LZW) decompressorare needed to see this picture.
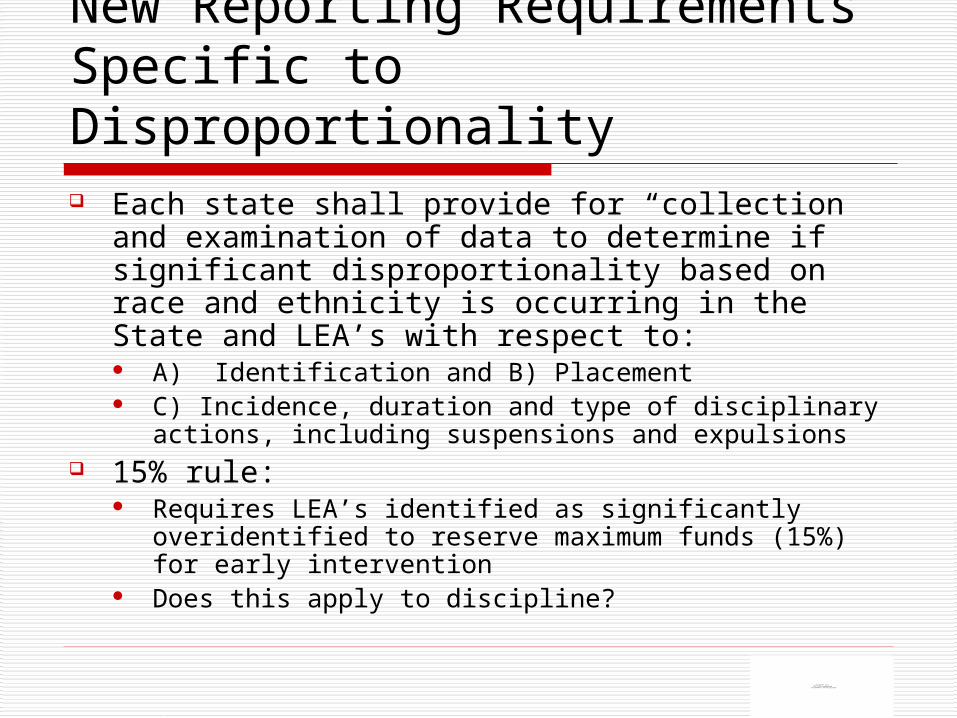
New Reporting Requirements Specific to Disproportionality Each state shall provide for “collection and
examination of data to determine if significant disproportionality based on race and ethnicity is occurring in the State and LEA’s with respect to: A) Identification and B) Placement C) Incidence, duration and type of disciplinary actions,
including suspensions and expulsions 15% rule:
Requires LEA’s identified as significantly overidentified to reserve maximum funds (15%) for early intervention
Does this apply to discipline?

Minority Disproportionality in School Discipline

QuickTime™ and a
TIFF (LZW) decompressorare needed to see this picture.
Non-Discriminatory Application: 30 Years of Study
CDF (1975): Black students suspended 2-3x as frequently
Studies since find disproportionality in: Office referrals Suspension & Expulsion Corporal Punishment
Evidence of disproportionality by economic status, gender, and disability designation
QuickTime™ and a
TIFF (LZW) decompressorare needed to see this picture.
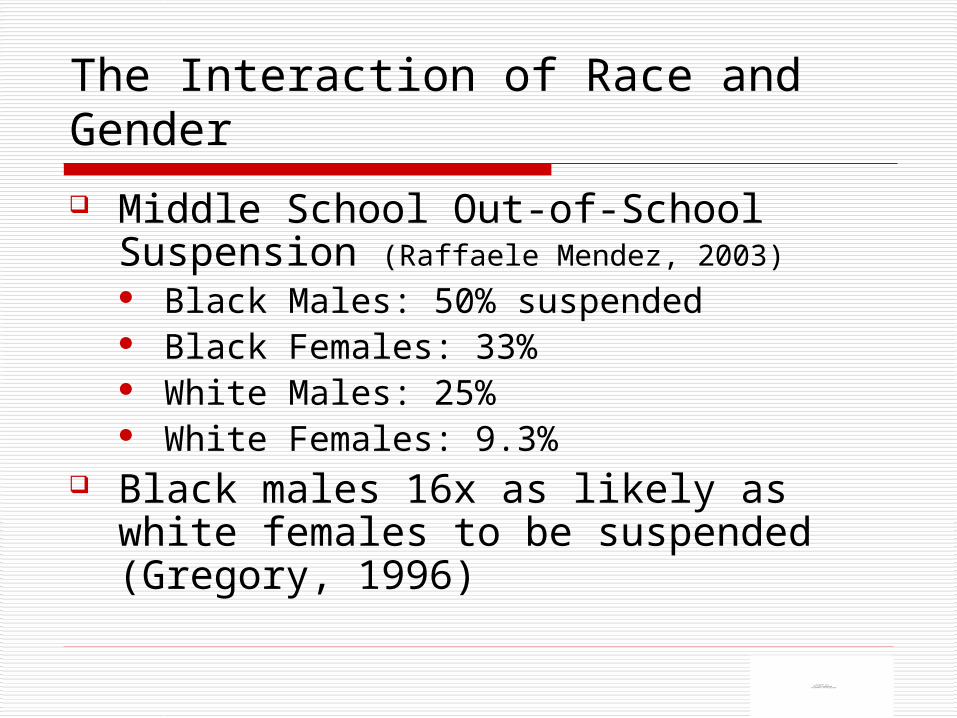
The Interaction of Race and Gender
Middle School Out-of-School Suspension (Raffaele Mendez, 2003) Black Males: 50% suspended Black Females: 33% White Males: 25% White Females: 9.3%
Black males 16x as likely as white females to be suspended (Gregory, 1996)
Raffaele Mendez (2003)QuickTime™ and a
TIFF (LZW) decompressorare needed to see this picture.
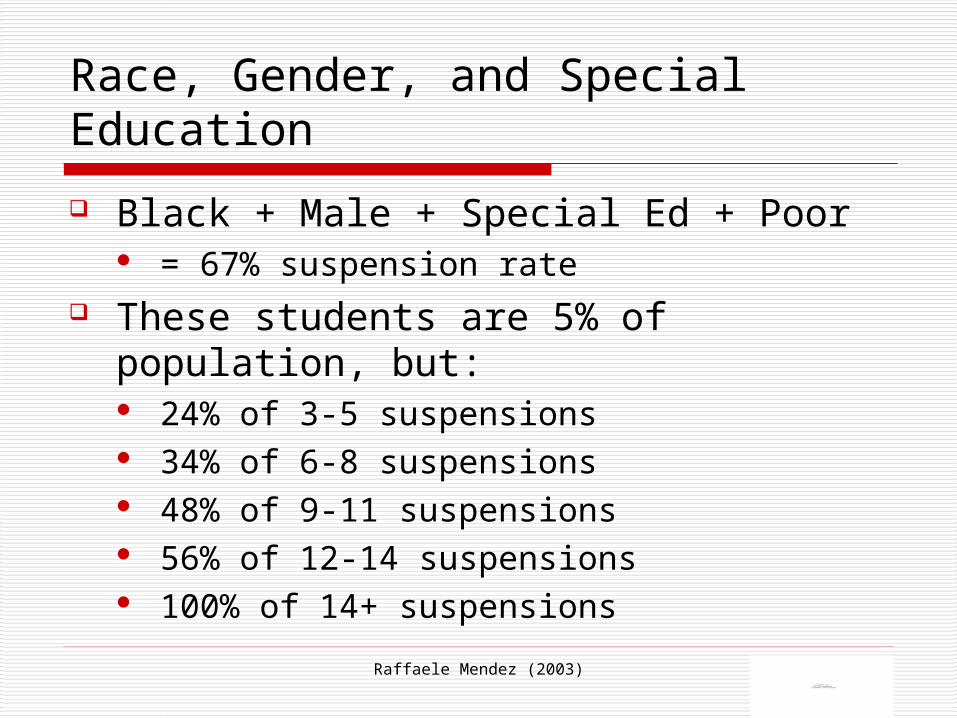
Race, Gender, and Special Education
Black + Male + Special Ed + Poor = 67% suspension rate
These students are 5% of population, but: 24% of 3-5 suspensions 34% of 6-8 suspensions 48% of 9-11 suspensions 56% of 12-14 suspensions 100% of 14+ suspensions

Skiba (2000)QuickTime™ and a
TIFF (LZW) decompressorare needed to see this picture.
Disproportionality Starts in the Classroom
52
45
66.1
30
68.5
31
0
10
20
30
40
50
60
70
Perc
en
t
Enrolled Referred Suspended
AfricanAmerican
White
Rausch & Skiba, 2004QuickTime™ and a
TIFF (LZW) decompressorare needed to see this picture.
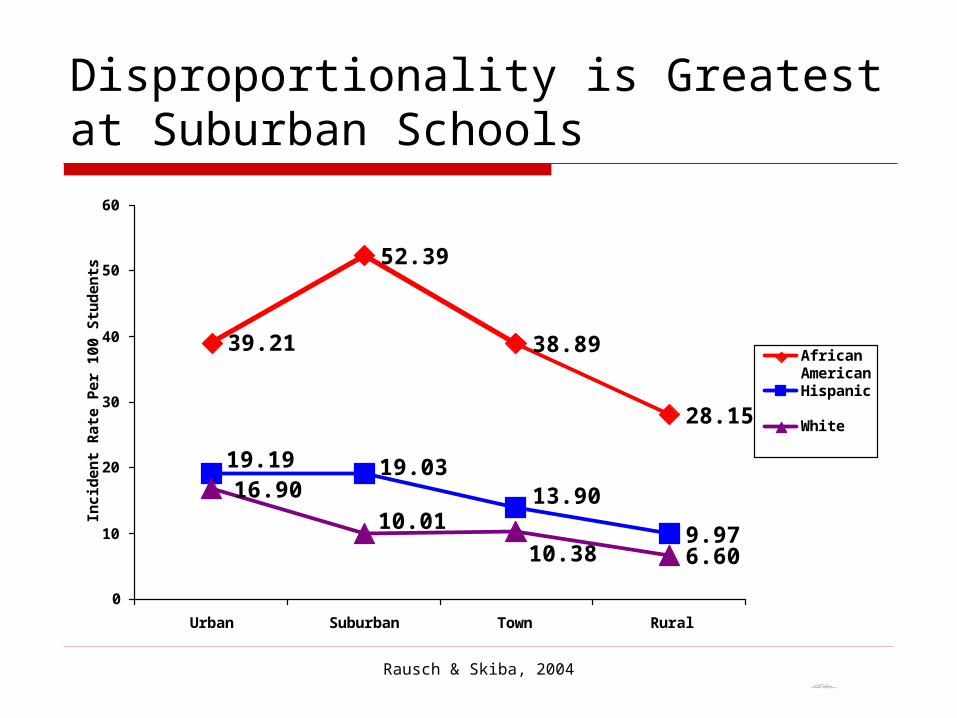
Disproportionality is Greatest at Suburban Schools
39.21
52.39
38.89
28.15
9.976.60
13.9019.0319.19
16.90
10.3810.01
0
10
20
30
40
50
60
Urban Suburban Town Rural
Incid
en
t R
ate
Per
100 S
tud
en
ts
AfricanAmericanHispanic
White

Rausch & Skiba, 2004QuickTime™ and a
TIFF (LZW) decompressorare needed to see this picture.
Disproportionality Begins Early and Persists
6.19
1.76
3.65
2.12
3.97
2.33
0
1
2
3
4
5
6
7
Lik
elih
ood
Rati
o C
om
pare
d t
o W
hit
e S
tud
en
ts
Elementary Middle High
AfricanAmerican
Hispanic
QuickTime™ and a
TIFF (LZW) decompressorare needed to see this picture.
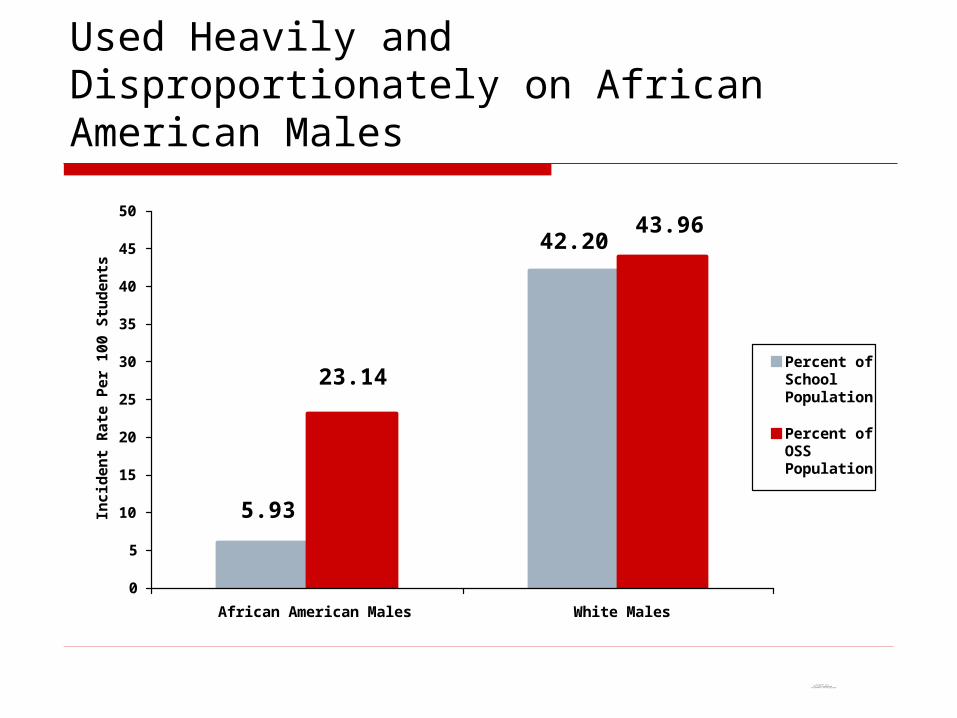
Used Heavily and Disproportionately on African American Males
42.20
5.93
23.14
43.96
0
5
10
15
20
25
30
35
40
45
50
African American Males White Males
Incid
en
t R
ate
Per
100 S
tud
en
ts
Percent ofSchoolPopulation
Percent ofOSSPopulation
QuickTime™ and a
TIFF (LZW) decompressorare needed to see this picture.
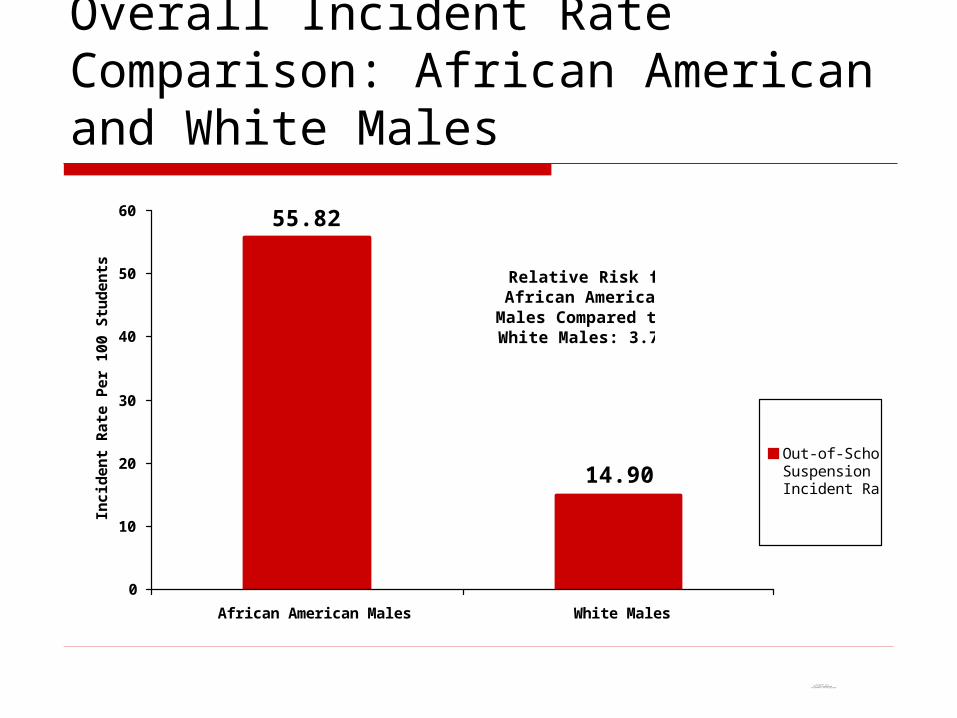
Overall Incident Rate Comparison: African American and White Males
55.82
14.90
0
10
20
30
40
50
60
African American Males White Males
Inci
den
t R
ate
Per
100 S
tud
en
ts
Out-of-SchoolSuspensionIncident Rate
Relative Risk for African American
Males Compared to White Males: 3.75x

QuickTime™ and a
TIFF (LZW) decompressorare needed to see this picture.
Alternative Explanations of Disciplinary Alternative Explanations of Disciplinary DisproportionalityDisproportionality
Disproportionality is related to SES SES and disproportionality correlate, but… Effects of race remain after control
Do black students misbehave more? No supporting evidence May in fact be treated more severely for same
offenses
QuickTime™ and a
TIFF (LZW) decompressorare needed to see this picture.
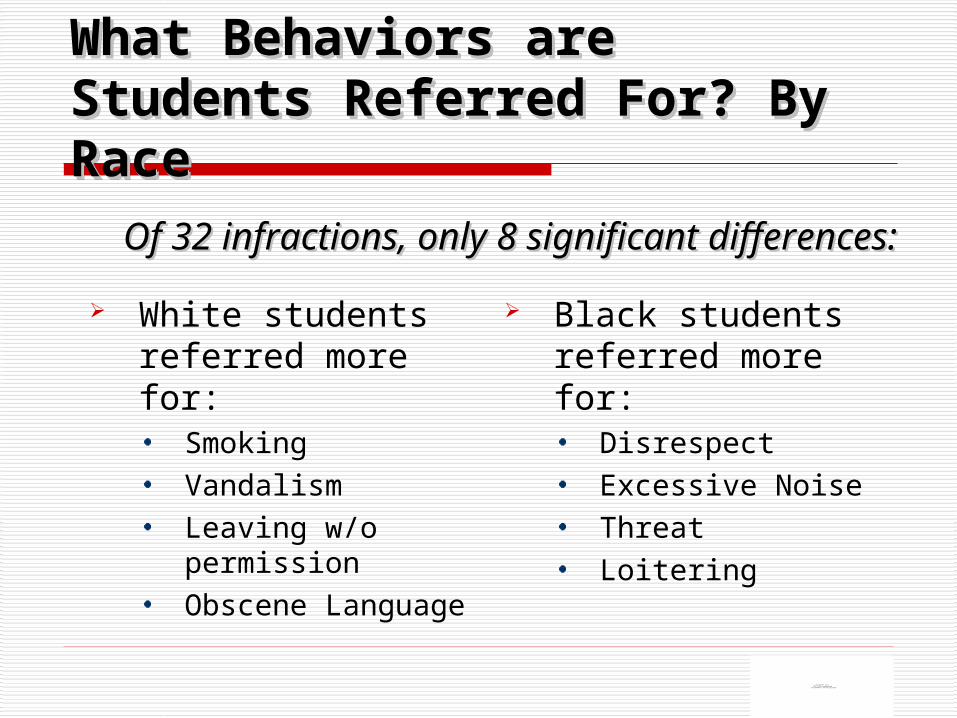
What Behaviors are Students What Behaviors are Students Referred For? By RaceReferred For? By RaceWhat Behaviors are Students What Behaviors are Students Referred For? By RaceReferred For? By Race
White students referred more for:
Smoking
Vandalism
Leaving w/o permission
Obscene Language
Black students referred more for:
Disrespect
Excessive Noise
Threat
Loitering
Of 32 infractions, only 8 significant differences:Of 32 infractions, only 8 significant differences:
QuickTime™ and a
TIFF (LZW) decompressorare needed to see this picture.
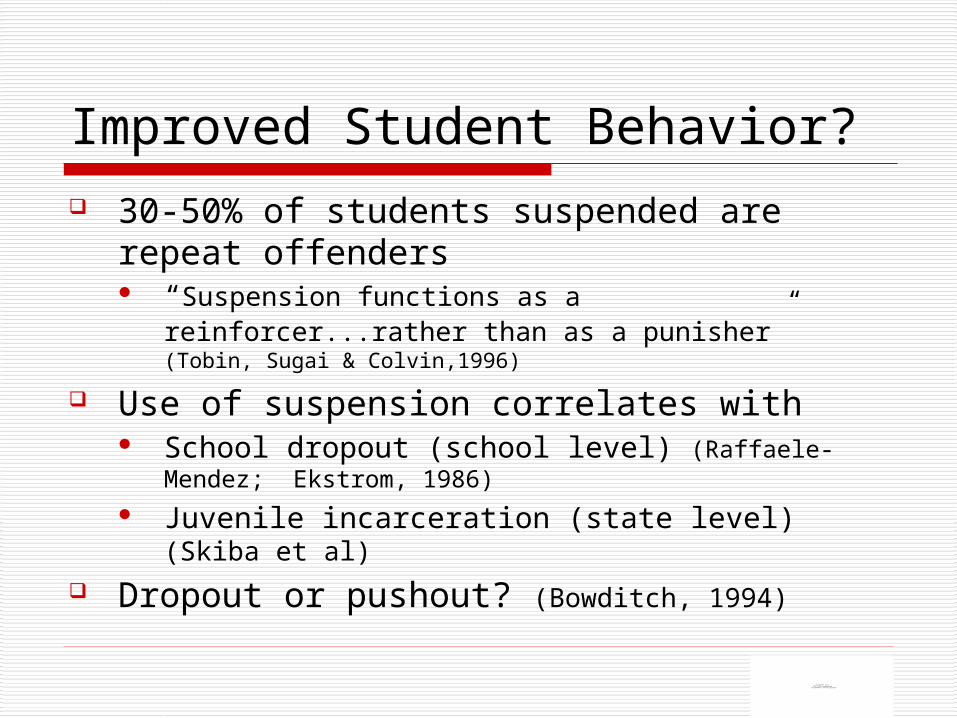
Improved Student Behavior? 30-50% of students suspended are repeat
offenders “Suspension functions as a reinforcer...rather than as a
punisher” (Tobin, Sugai & Colvin,1996)
Use of suspension correlates with School dropout (school level) (Raffaele-Mendez; Ekstrom,
1986) Juvenile incarceration (state level) (Skiba et al)
Dropout or pushout? (Bowditch, 1994)
QuickTime™ and a
TIFF (LZW) decompressorare needed to see this picture.
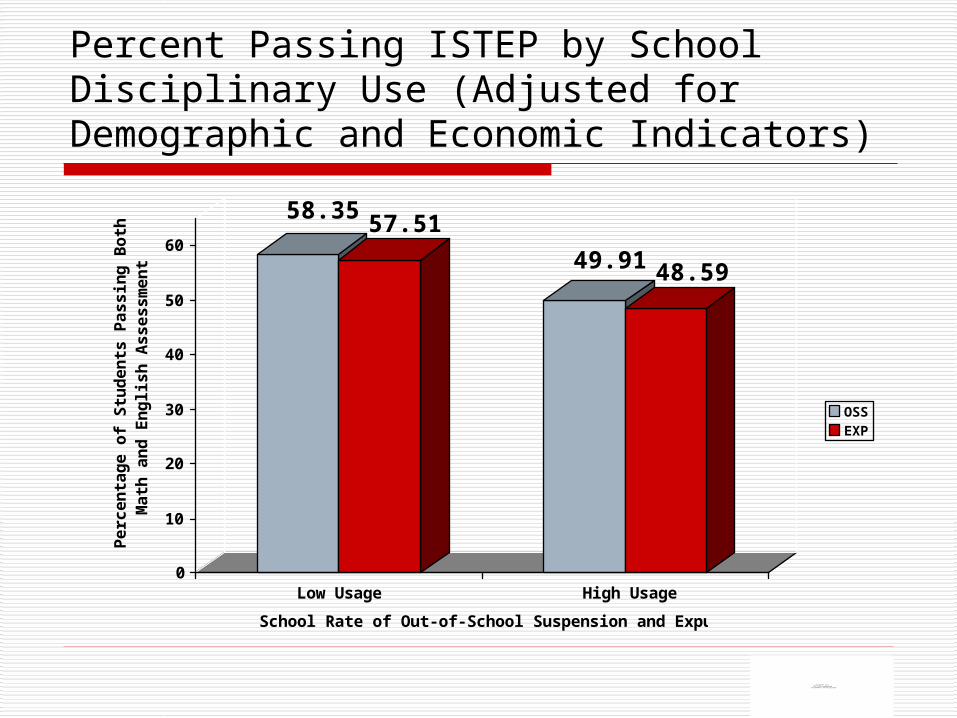
Percent Passing ISTEP by School Disciplinary Use (Adjusted for Demographic and Economic Indicators)
58.3557.51
49.9148.59
0
10
20
30
40
50
60
Perc
en
tag
e o
f S
tud
en
ts P
assin
g B
oth
M
ath
an
d E
ng
lish
Assessm
en
t
Low Usage High Usage
School Rate of Out-of-School Suspension and Expulsion
OSSEXP
Disproportionality of Students with Disabilities
in School Discipline

QuickTime™ and a
TIFF (LZW) decompressorare needed to see this picture.
Students with Disabilities are Suspended Disproportionately
Leone et al (2000) Kentucky: 14% of enrolled, 20% of susps. Maryland: 13.1% of enrolled, 24% of susps. Similar in Minn., Del. Kansas (2.7 x as likely)
But 21st Annual Report to Congress (2000) finds no evidence of disciplinary disproportionality, based on 1994 OCR Report

QuickTime™ and a
TIFF (LZW) decompressorare needed to see this picture.
Students with ED are Really Over-Represented
% of Students Reporting Susp/Exp (Wagner et al., 2005) Elem/Mid: 47.7% of ED HS: 72.9% ED El/Mid: 11.7% of other HS: 27.6% Other
Kansas: ED 7.5X to be suspended as likely as others with disability; 12x as likely as all students (Cooley, 1995)

QuickTime™ and a
TIFF (LZW) decompressorare needed to see this picture.
Are There Disparities in Behavior? More severe:
GAO (2001): Serious misbehavior for SpEd at 50 incidents/1000 students vs. 15/1000 for gen.ed.
Fiore & Reynolds (1996): Discrepancies in Weapons, Other Dangerous Behaviors, Violence Against Staff
Less severe: McFadden et al. (1992): Students with disabs less likely
to be truant; more likely for bothering others, defiance Cooley (1995): No differences in reasons for referral
Leone et al. (2000): Do students with disabilities just get caught more often?

QuickTime™ and a
TIFF (LZW) decompressorare needed to see this picture.
Disparities in Treatment McFadden et al. (1992): Students w/
disabs. more likely to receive harsh, less likely to receive mild punishment
GAO (2001) survey: Principals report equal treatment for special/general ed.
Do students with disabilities account for disproportionate disciplinary effort? GAO: 31% agree Skiba et al.: 33% agree

QuickTime™ and aTIFF (LZW) decompressor
are needed to see this picture.
Figure 1. Out-of-School Suspension and Expulsion Comparison for Indiana General and
11.58
0.64
25.55
0.48
0
5
10
15
20
25
30
Out-of-School Suspension Expulsion
Ris
k R
ate
(In
cid
ent
Rat
e P
er 1
00 S
tud
ents
)
General Education
Special Education
Relative Disciplinary Risk for Special Education:Out-of-School Suspension: 2.21Expulsion: 0.75

QuickTime™ and aTIFF (LZW) decompressor
are needed to see this picture.
Table 1. Indiana IDEA Discipline Totals and Categories: 2000-2001 and 2004-2005 School Year 2000-2001 School Year 2004-2005 School Year
Disability Enrollment
Number Receiving Discipline
Percent Receiving Discipline
Disability Enrollment
Number Receiving Discipline
Percent Receiving Discipline
Percentage Change
Total
140,153
1,554
1.11%
155,132
2,081
1.34%
20.72
Removed for Drug or
Weapon
140,153
412
0.29%
155,132
496
0.32%
10.34
Removed based on
Hearing Officer Determination
140,153
46
0.03%
155,132
13
0.008%
-73.33
Other
Suspension/Expulsion > 10 Days
140,153
1,096
0.78%
155,132
1,572
1.01%
29.49

QuickTime™ and aTIFF (LZW) decompressor
are needed to see this picture.
Table 2. Indiana IDEA Discipline by Disability Category: 2004-2005 school year
IDEA Disability Category Disability
Enrollment Number of Students Receiving Discipline
Percent of Students Receiving Discipline
Relative Disciplinary Risk a
Multiple Disabilities 1,569 4 0.25 0.18 Orthopedic Impairment 1,479 2 0.14 0.10 Visual Impairment 739 8 1.08 0.77 Hearing Impairment 1,697 8 0.47 0.33 Emotional Disability Full Time 6,994 740 10.58 11.13 Learning Disability 62,686 909 1.45 1.06 Communication Disorder 37,200 11 0.03 0.02 Mild Mental Disability 17,151 252 1.47 1.05 Moderate Mental Disability 3,705 14 0.38 0.26 Severe Mental Disability 799 0 0.00 0.00 Deaf-Blind 13 0 0.00 0.00 Autism Spectrum Disorder 5,558 19 0.34 0.24 Traumatic Brain Injury 553 9 1.63 1.16 Other Health Impaired 7,925 105 1.32 0.94
Note: Some disability categories (e.g. Developmental Delay) were omitted due to zero enrollments and zero number of students receiving discipline under IDEA a The relative disciplinary risk is the relative likelihood of one disability category being disciplined under IDEA relative to all other students with disabilities (i.e., all other disability categories). A ratio of one is equal likelihood, greater than one is more likely, and less than one is less likely for removal. For example, students identified as having an emotional disability full time, are 11.13 times as likely as their disabled peers to be disciplined under IDEA. Students identified with a communication disorder are 0.02 times as likely to be disciplined under IDEA compared to their disabled peers.

QuickTime™ and aTIFF (LZW) decompressor
are needed to see this picture.
Table 3. Indiana IDEA Discipline by Race: 2000-2001 and 2004-2005 School Yea r 2000-2001 School Year 2004-2005 School Year
Number Receiving Discipline
Percent Receiving Discipline
Relative
Risk
Number Receiving Discipline
Percent Receiving Discipline
Relative
Risk
Percent Change
Native American
9
3.57% 3.23
4
1.41%
1.05
-60.5%
Asian/Pacific Islander
5
1.27% 1.15
3
0.48%
0.36
-62.2%
Hispanic
29
0.98% 0.88
67
1.35%
1.01
37.76%
Black
342
1.93% 1.95
622
3.03%
2.80
57.00%
Multiracial
29
2.18% 1.98
50
1.62%
1.22
-25.67%
White
1,140
0.97% 0.53
1,335
1.06%
1.06
9.23%
Total
1,554
1.11%
---
2,081
1.34%
---
20.72%
QuickTime™ and a
TIFF (LZW) decompressorare needed to see this picture.
Do We Have the Capability to Collect This Data?
Fiore & Reynolds (1996): Only 6 states and 16 districts provided
breakdown of discipline of students with disabilities by race
Indiana Data General education: By incident Special education: By individual
QuickTime™ and a
TIFF (LZW) decompressorare needed to see this picture.
What Do We Do with Disproportionality? (2) Review and revision of policies, practices, and
procedures.--In the case of a determination of significant disproportionality with respect to the identification of children as children with disabilities, or the placement in particular educational settings of such children, in accordance with paragraph (1), the State or the Secretary of the Interior, as the case may be, shall-- ``(A) provide for the review and, if appropriate,
revision of the policies, procedures, and practices used in such identification or placement to ensure that such policies,[[Page 118 STAT. 2740]] procedures, and practices comply with the requirements of this title;

QuickTime™ and aTIFF (LZW) decompressor
are needed to see this picture.
Local Equity Action Development (LEAD) Projects
ONGOING QUESTIONS What do we know about disproportionality in our district? What changes in school-based processes will have the greatest impact on disproportionality in our
schools? How do we involve others in the process of creating ownership for and bringing about change? How will we know if our efforts are working? What impact will this have on other issues of equity?
PROCESS STEPS
Form a Planning Te am Form a preliminary planning team Review existing data Name the issue Expand the planning team to include other key stakeholders Gather and analyze new information
Identify the Action of Greatest
Potential Impact Hold focus groups to explore the issue & approaches from diverse perspectives Examine and discuss input from the focus groups Gather research and information on best practices and models Engage in honest conversations on equity, opportunities and expectations for ALL students and staff
Develop a Plan
Design a LEAD pilot Provide professional development, time, and other supports Develop an Action Plan for Implementation Pilot in a few places Gather feedback Adapt the pilot Plan for expanded implementation
Implement, Assess, Adapt
Expand the team to include representatives from all sites to assure two-way communication Provide professional development as needed for best practice & cultural competency Clarify links and communicate with other district initiatives and ELL, Title, School Improvement etc. Use data consistently to inform decisions Deepen conversations about equity and culturally responsive pedagogy Include parents and community in the process Ongoing assessments continue to inform implementation

QuickTime™ and a
TIFF (LZW) decompressorare needed to see this picture.
Studying Equity at Home: The LEAD Process What is the Nature of the Problem?
What does the data tell us? Courageous Conversations
Identify Actions of Greatest Potential Impact Develop a Plan Implement, Assess, Adapt
QuickTime™ and a
TIFF (LZW) decompressorare needed to see this picture.
LEAD Projects Implementation Ten districts currently participating in Equity
Action Projects Pre-Referral Process Peer Coaching K-2 Instructional Project Family Involvement

QuickTime™ and a
TIFF (LZW) decompressorare needed to see this picture.
Deficit Thinking: Disproportionality due primarily to characteristics of minority populations (e.g. Herrnstein & Murray)
Critical Race Theory: Disproportionality as a decision to maintain the structure of white privilege (e.g. Bell, Delgado)
Cultural Reproduction: Racial/economic inequity maintained by roles and actions of individuals within institutions, perhaps unconciously (e.g., Bowles & Gintis, Oakes)
...Maybe We Shouldn’t Talk About It...
Responses to InequityResponses to Inequity

QuickTime™ and a
TIFF (LZW) decompressorare needed to see this picture.
The Difficulty of Talking About Race
“When you say minorities, are you, what are you speaking of?...[INTERVIEWER: Ethnic and racial minorities]...Oh....OK...Alright...We have like...I guess we have about half and half. I don’t know that I’ve ever really paid attention to it .”
--Classroom Teacher

Race and the Relief EffortRace and the Relief Effort
"The storm didn't discriminate, and neither did the recovery effort.” --George W. Bush
"There is a historical indifference to the pain of poor people, and black people ... we seem to adjust more easily to black pain.”
--Rev. Jesse Jackson
"The storm didn't discriminate, and neither did the recovery effort.” --George W. Bush
"There is a historical indifference to the pain of poor people, and black people ... we seem to adjust more easily to black pain.”
--Rev. Jesse Jackson

QuickTime™ and a
TIFF (LZW) decompressorare needed to see this picture.
Perspectives on Katrina: Washington Post/ABC News Poll, 9/13/05

QuickTime™ and a
TIFF (LZW) decompressorare needed to see this picture.
What’s Your Theory?
Poverty? Systemic inadequacies? Community contributions? Cultural incompetence? Negative peer culture? Historical discrimination?

QuickTime™ and a
TIFF (LZW) decompressorare needed to see this picture.
What We Need:
Need formats that enable collection of the needed data WESTAT/OSEP calculation package
Need more research on intersection of race, disability, and discipline
Need models of change Leadership on the topic of race

Russ SkibaRuss Skiba
Center for Evaluation and Education Policy
509 E. Third St.
Bloomington, IN 47401
812-855-1240
fax: 812-856-8440