creating nitrous oxide (n o) emissions offsets in
TRANSCRIPT

Creating Nitrous Oxide (N2O) Emissions Offsets in Agricultural Crop Production in the United States
(aka “Nutrient Management”)1
Background Paper2 for the EPRI Greenhouse Gas Emissions Offset Policy Dialogue Workshop #11
November 2011
I. Background This paper has been prepared for a workshop to be held by the Electric Power Research Institute (EPRI) on November 4, 2011 in Washington, D.C. It is the 11th in a series of workshops sponsored by EPRI between 2008 and 2011 related to greenhouse gas (GHG) emissions offsets.
The purpose of this paper is to provide background for workshop discussions on the potential to achieve GHG emissions reductions by changing nitrogen fertilizer management practices (aka “nutrient management”) in U.S. agricultural crop production. This background paper covers the following topics:
Nitrous oxide (N2O) emissions in U.S. agricultural crop production;
Potential to achieve GHG emissions reductions by reducing N2O emissions in crop production;
Approach developed by Michigan State University (MSU) and EPRI to quantify agriculture-based N2O emissions reductions by using an empirically-derived, regionally specific “Tier 2” emissions factor;
Approach developed by the American Carbon Registry (ACR) and Applied Geosolutions to quantify agriculture-based N2O emissions reductions by using a “Tier 3” process-based modeling approach using the DNDC model;
Update on the ongoing development of a Nutrient Management Project Protocol by the Climate Action Reserve (CAR); and,
Potential action by the CA Air Resources Board (ARB) to develop a Nitrogen Fertilizer Nutrient Management Offsets Protocol
II. N2O is a Significant Source of Agricultural GHG Emissions Nitrogen (N) is ubiquitous in the environment and central to living systems. It is a primary constituent of nucleotides and proteins in plants, animals, and microorganisms, regulating numerous essential ecological and biogeochemical processes. Due in large part to the growing demand for N in agriculture, there has been a dramatic increase in biologically available or reactive N, in the biosphere. This demand and the pervasive inefficiencies in agricultural N use 1 Prepared by Adam Diamant, M.P.P., Electric Power Research Institute (EPRI), G. Philip Robertson Ph.D., and Neville Millar Ph.D., Michigan State University (MSU), and Ronald J. Gehl, Ph.D., North Carolina State University. Copyright © 2011 Electric Power Research Institute, Inc. All rights reserved. 2 This background paper is for informational purposes only. Please do not cite this paper or the materials in it without prior approval from the authors.

2
(Robertson, 1997; Galloway et al., 2008) come at a significant societal cost (Mosier et al., 2001), contributing to well‐documented environmental degradation, including increased coastal hypoxia, acidification of aquatic and soil systems, eutrophication and increased greenhouse gas (GHG) emissions. On the other hand, the synthetic production of fertilizer N and its addition to agricultural cropping systems is an essential facet of modern crop management and one of the major reasons food production has kept pace with human population growth (Robertson and Vitousek, 2009).
Since the late 1950s, global synthetic N fertilizer consumption has increased ten fold from around 10 to 100 Tg N in 20083. In 2007, US consumption of N fertilizer was 13.2 Tg N, of which 5.7 Tg N (43%) was estimated to be used for corn production (USDA ERS, 2010). Fertilizer N recovery in global crop production is estimated at around 50% (Smil, 1999), with the remaining N accumulating in soils, or being “lost” to the air, groundwater and surface water via a number of pathways (Eickhout et al., 2006). Major pathways include losses due to nitrification and denitrification to produce the gases dinitrogen (N2), nitrous oxide (N2O), and nitric oxide (NO); ammonia (NH3) volatilization especially following fertilizer application; nitrate (NO3‐) leaching; and erosion losses of organic N.4
One of the major environmental concerns related to N fertilizer use in cropping systems is the atmospheric emission of N2O which is a potent GHG. Nitrous oxide has important effects both on the climate system and on stratospheric ozone (Wuebbles, 2009), with human induced emissions increasing by around 150 Tg N annually (Mosier, 2001). Pre–industrial global N2O concentration in the atmosphere of ~270 ppbv have increased to current concentrations of ~320 ppbv (Forster et al., 2007).
Nitrous oxide is produced in the soil predominantly by the microbial processes of nitrification and denitrification.5,6 Factors that control these two processes – available carbon, inorganic nitrogen, and oxygen as affected by soil moisture, porosity, and aggregate structure – regulate production of N2O (Robertson and Groffman, 2007). Practices other than N fertilizer management that most influence emissions of N2O from cropped soils include crop type, tillage, residue management, and irrigation (Parkin and Kaspar, 2006).
Reducing N fertilizer rate is the key to reducing N2O emissions7 Numerous management technologies and approaches have been proposed to mitigate N losses from agricultural systems.8 Four main approaches for improving N–use efficiency in annual cropping systems have been suggested. Roberts (2007) argues that the basis of good N fertilizer
3 One teragram (1Tg) equals 1012 grams. One teragram (1Tg) N equals 1 million metric tons N. 4 See Mosier, 2001; Follett and Delgado, 2002; and Robertson and Groffman, 2007. 5 Nitrification refers to the microbial oxidation of NH4
+ to NO3-, and denitrification refers to the microbial
reduction of NO3- to N2O and then N2.
6 Nitrifiers are especially active in well aerated soil with available NH4+, and denitrifiers are active in poorly
drained soils with available C and NO3-. Denitrifiers also are active in well-aerated soils, particularly
following rain events, and in anaerobic or partially anaerobic microsites such as the interior of soil aggregates (Robertson 2000). 7 This discussion taken with permission from Millar (2010). 8 Non‐exhaustive lists are available in, for example, Oenema et al. (2001), Follett et al. (2005), and Cherry et al. (2008).

3
management in cropland agriculture is using the right source, at the right rate, at the right time, and with the right placement (the so-called “4Rs”) Millar (2010) provides a comprehensive review of individual fertilizer N management practices that can influence emissions of N2O in row-crop agriculture in the Midwest. Based on this review, the authors determined whether there is sufficient evidence to support its inclusion in a proposed N2O emissions reduction offset methodology. Below is a summary of the findings reported by Millar et al. (2010) for each of these N management practices.
Source - Overall, current evidence suggests that for the purposes of N2O offset protocol development, synthetic fertilizer N type is unreliable as a single factor for abating N2O emissions. Recent work by Venterea et al. (2010) in Minnesotan corm systems has shown that fertilizer type can be an important factor for reducing N2O emissions, although further studies are needed in different soils and cropping systems.
Timing - Although circumstantial evidence suggests that Midwest N2O fluxes should be lower in spring—than in fall—fertilized crops, predictive quantitative evidence for the Midwest is lacking to assess timing of fertilizer application as an eligible activity to generate N2O offsets. Until evidence suggests otherwise, it may be difficult to justify including fertilizer timing in an offsets protocol. However, with additional research this limitation could be overcome. Based upon synthetic fertilizer sales in the Midwest, available evidence suggests that about 50% of N fertilizer may be applied in the fall rather than the spring in annual summer cropping systems. With the expected increased in N2O emissions associated with this practice, a change from fall to spring fertilizer application should be encouraged.
Placement - In the absence of more consistent findings, and in particular for Midwest soils, it is difficult to justify including a fertilizer N placement strategy in an N2O reduction protocol.
Rate - Numerous field studies conducted on N input gradients in row-crop agriculture have found that emissions of N2O correlate well with fertilizer N rate.9 In all of these studies, increasing the amount of N added to soil resulted in increasing emissions of N2O. This is the foundation for current IPCC (2006) greenhouse gas inventory calculations.
With regards to predicting emissions of N2O from row-crop agriculture in the Midwest, evidence suggests that fertilizer rate is the most important factor. This finding is consistent with Tier 1 methodologies endorsed by the IPCC (2006). The IPCC approach is based upon extensive reviews and meta-analyses.10
III. Potential to Reduce GHG Emissions by Reducing N2O Emissions in Crop Production11 Carbon dioxide (CO2) currently accounts for about 63% of the global mean radiative forcing of the atmosphere attributable to long–lived GHGs (1.7 Wm-2; Solomon, 2007). Tropospheric
9 See MacKenzie et al. 1998; Bouwman et al. 2002a; McSwiney and Robertson 2005; Mosier et al. 2006; Drury et al. 2008; Dusenbury et al. 2008; Halvorson et al. 2008; Hoben et al. 2011; Millar et al. 2010. 10 Bouwman et al. 2002a; Akiyama et al. 2005; Novoa and Tejeda 2006; Stehfest and Bouwman 2006). 11 For more information, please refer to Developing Greenhouse Gas Emissions Offsets by Reducing Nitrous Oxide (N2O) Emissions in Agricultural Crop Production. Final Project Report. EPRI, Palo Alto, CA: 2009. Product ID# 1020546.

4
ozone, black carbon, and the well-mixed GHGs – principally methane (CH4), N2O, and various halocarbons – are responsible for the remainder. Changes in the non-CO2 GHGs, whether engineered or unintentional, could have a substantial impact on the radiative forcing of future atmospheres.
Nitrous oxide (N2O) in row-crop agriculture
Globally, agriculture is responsible for more than 10% of anthropogenic GHG emissions. The United Nations’ Intergovernmental Panel on Climate Change (IPCC) estimates that agricultural activities emit 21–25% of all anthropogenic CO2 fluxes, 50% of total CH4 emissions, and 60% of total N2O fluxes (IPCC; Smith, 2007). CO2 emissions derive from deforestation and fossil fuel use. Methane emanates from enteric fermentation, rice cultivation, biomass burning, and animal wastes. Nitrous oxide emissions come from cultivated soils, animal wastes, and biomass burning. The magnitude of these fluxes and their sensitivity to management make agriculture an attractive target for many GHG emission stabilization schemes. Also, because most of these fluxes are interdependent, there are numerous opportunities to exploit synergies among them.
N2O emissions from agricultural soils accounts for more than 50% of the global anthropogenic N2O flux, as shown in Figure 1. Direct efforts to abate N2O emissions in agricultural soils have met with limited success. There are no specific inhibitors of denitrifiers, and nitrifier inhibitors such as nitrapyrin, nitrogen dicyandiamide, and CaC2 are expensive and work inconsistently. Soil nitrogen availability appears to be the best general predictor of soil N2O flux, and total N inputs currently are used to estimate soil-related N2O contributions to national GHG emission inventories (IPCC 2006).
Figure 1. Anthropic sources of N2O globally; the total anthropic flux is 1.2 Pg Ceq per year. Source: IPCC 2001, Robertson 2004. Prinn 2004.
Nitrous oxide (N2O) is a powerful GHG All of the well-mixed non-CO2 GHGs are more potent than CO2 from a global warming perspective. For the so-called “biogenic gases” the 100-year Global Warming Potentials (GWPs) range from 25 for CH4 to 298 for N2O (Solomon, 2007). For all of these non-CO2 gases, the
Industrial Sources
16%
Agricultural Soils52%
Biomass Burning
6%
Cattle & Feedlots
26%

5
comparative index is the carbon dioxide equivalent (CO2e or CO2eq). This means that 1 ton of N2O emitted into the atmosphere is equivalent 298 tons of CO2 in terms of global warming potential. Consequently, small changes in the net emissions (i.e., “fluxes”) of these non-CO2 gases can have a proportionately larger effect on radiative forcing than similar changes in CO2 flux. This sensitivity to small changes provides a strong impetus for including the non-CO2 GHGs in the development of effective climate change mitigation strategies.
Total anthropic flux of N2O is equivalent to 1.2 Pg C per year, or 4.4 billion tons (Gt) CO2. Total anthropic flux of CH4 is equivalent to 2.2 Pg C per year, or 8.1 GtCO2 (Prinn 2004; Robertson 2004). Together, these fluxes are similar to the net annual loading of CO2 to today’s atmosphere (4.1 Pg C; Raupach et al. 2007).
Significance of N2O emissions in the United States Soil management activities, primarily N fertilizer application, account for about 69% of total N2O emissions in the US. Annual emissions of N2O from US cropland soils equaled 150 Tg CO2e in 2009 (EPA, 2011). N2O emissions represent the single largest contributor to the global warming impact of annual cropping systems12, due primarily to its atmospheric longevity and its associated radiative forcing.
As N2O in soil is produced predominantly through microbial transformations of inorganic N, the potential to produce and emit N2O increases with increasing N availability across a wide variety of ecosystems (e.g., Matson et al., 1987) including agricultural systems (e.g., Bouwman et al., 1993).
Although some N2O emissions are an unavoidable consequence of maintaining highly productive cropland (Mosier, 2001), activities that lower the input of N into cropland agriculture, or reduce N availability, will significantly reduce emissions of N2O.
The next section discusses the relationship between fertilizer N rate and N2O emissions, the relationship between fertilizer and yield, the socioeconomic factors that affect the adoption of reduced N rate practices, and the use of quantitative models to estimate N2O emissions.
Relationship between fertilizer N rate and N2O emissions In successive meta–analyses of available field data, primarily from temperate studies, simple ratios have been developed to relate the amount of N fertilizer applied to croplands to subsequent emissions of N2O.13 The current global mean value for fertilizer‐induced N2O emissions (synthetic and manure) – derived from over 1,000 agricultural field studies – is ~0.9% or 0.009.14 In short, for every 100 kg of N fertilizer applied, 0.9 kg of N in the form of N2O–N is assumed to be emitted directly into the atmosphere.
IPCC Tier 1 and Tier 2 Emissions Factors This emissions factor (EF) (amended to 1% or 0.01 due to uncertainty and other inventory considerations) has been adopted by the IPCC as their “Tier 1” default EF for use by countries
12 See Robertson et al., 2000; Robertson and Grace, 2004; and, Mosier et al. 2005. 13 These global fertilizer–induced emissions factors (EF) have been determined by Bouwman (1990), Eichner (1990), Bouwman (1996), Bouwman et al. (2002a,b), and Stehfest and Bouwman (2006). 14 Bouwman et al., 2002b; Stehfest and Bouwman, 2006.

6
when estimating their direct emissions of N2O from managed soils (IPCC, 2007a,b). About 75% of reporting countries use this default factor (Lokupitiya and Paustian, 2006), and over 90% of the national communications to the UNFCCC (which account for an estimated 75% of global cropland N2O emissions) are based on default global emission factors (Berdanier and Conant, 2011).
Under IPCC (2003) guidelines, there are two additional methodologies for calculating emissions from agricultural soils: “Tier 2”.uses EFs tailored to reflect the specific conditions of a country and the agricultural practices involved, and “Tier 3” uses more complex models and inventory systems (IPCC, 2000).
The use of a single EF value irrespective of N rate intrinsically establishes a linear relationship between N fertilizer rate and N2O emissions. This link is indifferent to biological thresholds, which might occur, for example, when the availability of inorganic N exceeds the requirements of competing biota such as plants and soil heterotrophs (Erickson et al., 2001).
Developing state or regional EFs (Tier 2) in representative agricultural management systems will better account for local climate, soil, management, and other conditions, and more accurately estimate country–wide emissions of N2O. Continuous corn and the corn–soybean rotation are representative agricultural ecosystems that dominate farm land in the US Midwest, and in eastern and central North America.
For example, in 2011 corn and soybean combined comprised 78% and 94% of the land area of the principal crops planted in Ohio and Illinois, respectively (USDA NASS, 2011). Corn is an N intensive crop, typically receiving large N additions to the soil, whereas soybean is an N fixing crop which requires little or no additional N input. Alterations to the N management of these crops therefore can have a major impact on US agricultural N2O emissions.
A number of studies in US grain corn cropping systems have investigated the response of N2O to N fertilizer management.15 These studies have been important for documenting EFs for fertilized US grain systems, however, because most have examined a single fertilizer rate (and some without a zero fertilizer rate comparison), these studies do not have the ability to detect N rate thresholds – for example, changes in EF as the availability of N exceeds crop N demand.
Response curves for N2O flux as a function of N rate are not common, but could help to better predict region– and site‐specific N2O emissions in response to N additions. For the few N2O response experiments in which more than two levels of N were applied, N2O flux in response to increasing N rates has been described by both linear and non–linear functions. For example, Halvorson et al. (2008) found N2O emissions increased linearly in response to three N fertilizer rates used on irrigated corn in Colorado (from 0.6 to 5.9 g N2O‐N ha‐1 day‐1).
Along a more finely resolved N gradient for non–irrigated corn in Michigan, however, McSwiney and Robertson (2005) reported a non–linear, exponentially increasing N2O response to fertilizer N along a 9–point N gradient. In their study, N2O fluxes more than doubled (20 vs. >50g N2O–N ha‐1 day‐1) at N rates greater than 100 kg N ha‐1, the N level at which yield was maximized at 6.8 Mg ha‐1.
15 See for example Bremner et al., 1981; McSwiney and Robertson, 2005; Venterea et al., 2005, 2010; Liu et al., 2006; Mosier et al., 2006; Parkin and Kaspar, 2006; Halvorson et al., 2008, 2010; Parkin, 2008; Tan et al., 2009; Hoben et al., 2010; Parkin and Hatfield, 2010.

7
More recently, Ma et al. (2009) found similar results for a 4–level N gradient under corn in eastern Canada: on average, they found that 150 compared with 90 kg N ha‐1 doubled N2O emissions (16.3 vs. 37.1 g N2O‐N ha‐1 day‐1, respectively), but only slightly increased corn grain yields (10.3 vs. 9.5 Mg ha‐1). And Hoben et al. (2010) documented a non–linear response for five commercial (on–farm) sites in Michigan under corn–soybean rotation with six fertilizer N rates (0–225 kg N ha‐1 yr‐1) as shown in Figure 2.
Figure 2. Best-fit line between annual N2O emissions (kg N2O-N ha-1 yr-1) and N fertilizer rate (kg N ha-1 yr-1) for five commercial corn fields in Michigan (solid line). Standard errors (± 0.06 * exp [0.010 * N rate]) are also shown (dashed lines). Annual emissions of N2O for each field replicate were calculated from daily N2O emissions measured in four blocks at six N rates (including zero) at each site during the year for eight site years. Redrawn from Hoben et al (2010).
The Michigan field studies described by Hoben 2010 presently represent one of the best resolved available U.S. studies to date for documenting N2O emission responses to a large number of fertilizer N rate treatments in corn cropping systems.
Elsewhere others also have reported evidence for non–linear N2O emission responses.16 In all cases where a non–linear curve best describes the N2O flux response to increasing amounts of N, small increases in applied N fertilizer result in proportionately higher N2O fluxes at higher N application rates.
If the N2O response curve is often non–linear, then use of the IPCC (2006) methodology for national GHG inventories will underestimate N2O emissions, as top–down atmospheric models suggest is the case (Crutzen et al., 2007). In using an exponential equation to calculate emissions of N2O, Bouwman et al. (2002b) implied that “the calculated emission increases more than proportional with the N application rate.”
If, as IPCC methodology suggests, N fertilizer rate is the most robust, single–factor proxy for estimating N2O emissions from US corn cropping systems, then the form of the relationship
16 See Bouwman et al., 2002b; Grant et al., 2006; Zebarth et al., 2008.
8
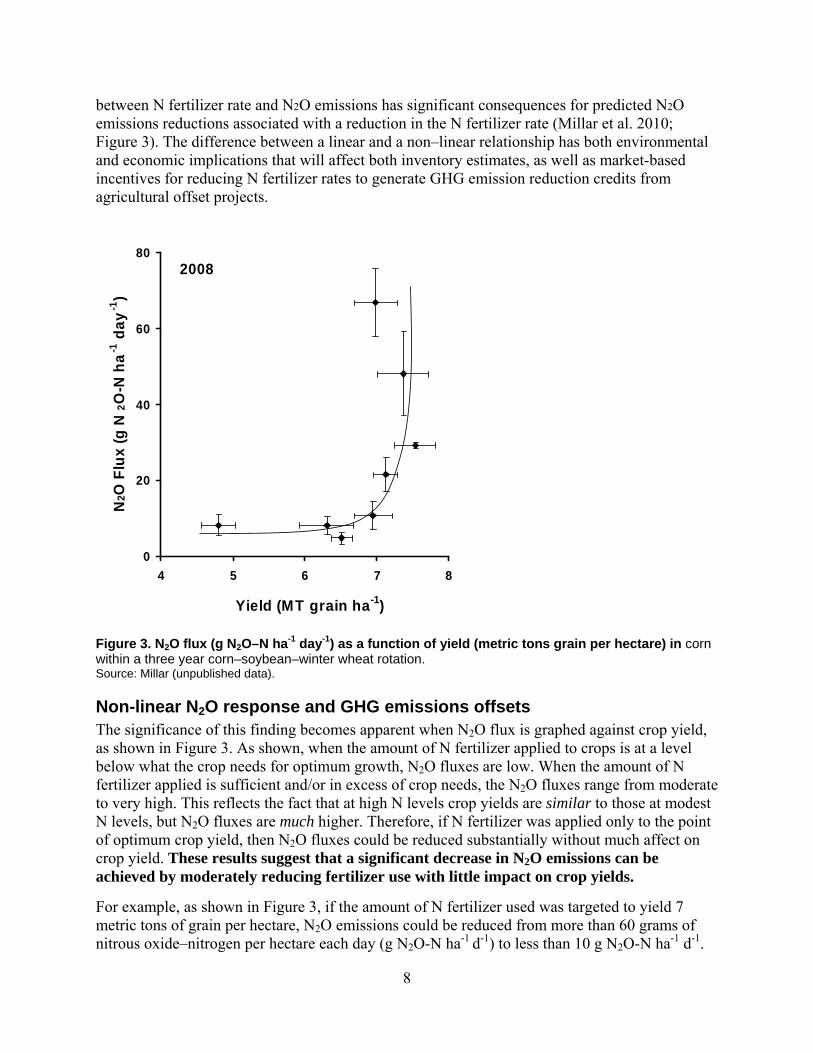
between N fertilizer rate and N2O emissions has significant consequences for predicted N2O emissions reductions associated with a reduction in the N fertilizer rate (Millar et al. 2010; Figure 3). The difference between a linear and a non–linear relationship has both environmental and economic implications that will affect both inventory estimates, as well as market-based incentives for reducing N fertilizer rates to generate GHG emission reduction credits from agricultural offset projects.
Figure 3. N2O flux (g N2O–N ha-1 day-1) as a function of yield (metric tons grain per hectare) in corn within a three year corn–soybean–winter wheat rotation. Source: Millar (unpublished data).
Non-linear N2O response and GHG emissions offsets The significance of this finding becomes apparent when N2O flux is graphed against crop yield, as shown in Figure 3. As shown, when the amount of N fertilizer applied to crops is at a level below what the crop needs for optimum growth, N2O fluxes are low. When the amount of N fertilizer applied is sufficient and/or in excess of crop needs, the N2O fluxes range from moderate to very high. This reflects the fact that at high N levels crop yields are similar to those at modest N levels, but N2O fluxes are much higher. Therefore, if N fertilizer was applied only to the point of optimum crop yield, then N2O fluxes could be reduced substantially without much affect on crop yield. These results suggest that a significant decrease in N2O emissions can be achieved by moderately reducing fertilizer use with little impact on crop yields.
For example, as shown in Figure 3, if the amount of N fertilizer used was targeted to yield 7 metric tons of grain per hectare, N2O emissions could be reduced from more than 60 grams of nitrous oxide–nitrogen per hectare each day (g N2O-N ha-1 d-1) to less than 10 g N2O-N ha-1 d-1.
0
20
40
60
80
4 5 6 7 8
Yield (MT grain ha-1)
N2O
Flu
x (
g N
2O
-N h
a-1
da
y-1
)
0
20
40
60
80
4 5 6 7 8
Yield (MT grain ha-1)
N2O
Flu
x (
g N
2O
-N h
a-1
da
y-1
)
2008

9
From 2008-2010, EPRI and MSU conducted on-farm field trials on commercial farms designed to demonstrate that reducing the amount of nitrogen fertilizer applied to row crops like corn can significantly reduce N2O emissions with little or no impact on crop yields. The quantitative results derived from these on-farm field tests confirm that N2O emissions can be substantially reduced in commercial corn production in the NCR by reducing the amount of N fertilizer applied to croplands without any significant yield penalty.
The non-linearity of N2O emissions has profound implications for the national accounting of U.S. N2O emissions and the amount of N2O-related emissions reductions that can be created by reducing N fertilizer usage. Figure 4 illustrates the relationship between annual direct emissions of N2O and fertilizer N application rate using a linear default (Tier 1, long dash line) and non–linear regional (Tier 2, solid line) approach. As shown, a reduction in N rate (A) brings about an approximately four times greater N2O emission reduction using the Tier 2 approach (B; dash–dot line), when compared to the Tier 1 approach (C; small dash line).
Figure 4. Relationship between annual direct emissions of N2O and fertilizer N application rate using a linear default (Tier 1, long dash line) and non–linear regional (Tier 2, solid line) approach. In this example, a reduction in N rate (A) brings about an approximately four times greater N2O emission reduction using the Tier 2 approach (B; dash–dot line), when compared to the Tier 1 approach (C; small dash line) . Adapted from Millar et al. (2010).
Fertilizer N rate and corn yield Nitrogen is often the limiting factor for crop growth. Crop yield is related to crop N requirement, with higher yields typically requiring increased N inputs that, as noted above, can lead to higher N2O emissions. Since N fertilizer typically has been relatively inexpensive in comparison to other farm costs and remains low relative to corn prices (Robertson and Vitousek, 2009), application at rates in excess of plant needs is common as farmers hedge against a perceived risk of insufficient N (Babcock, 1992).
CAST (2004) estimated that promoting the efficient use of fertilizer N inputs could reduce agricultural N2O emissions in the US by 30–40%.
10
Yield-goal recommendation for N-fertilizer use Prior to the 1970s, most crop N rate recommendations were based on soil–specific criteria and crop management variables such as rotation and manure application. Since the 1970s, yield-based N rate recommendations have been the rule in most Midwest states, primarily as a result of the landmark paper by Stanford (1973). 17
With Stanford’s approach, a yield goal of 10 metric tons per hectare (10 MT ha‐1; or 160 bushels (bu) per acre) for a moderately high–yield soil in the US Midwest is multiplied by an N yield factor, commonly 21 kg N MT‐1 (1.2 lb N bu‐1), to obtain a fertilizer N rate recommendation of 210 kg N ha‐1 (192 lb N acre‐1). The recommendation can then be adjusted downward for N contributions from other sources, such as prior legume crops or manure.
Economically-optimal rates of N-fertilizer use More recently, this yield–based approach to N rate recommendations has been questioned, primarily due to the poor relationship between these recommendations and the economic optimum N rate (EONR) as observed in numerous N rate response trials (e.g., Vanotti and Bundy, 1994).
This has led to development of an alternative approach that is now being adopted by some producers in the US Corn Belt, based on the N rate at which the value from increased grain yield just matches the cost of added N. In this approach (Figure 5), current N rate research data from field trials in corn– soybean rotations and continuous corn cropping are used to determine economically profitable N inputs, expressed as a range of N rates around the maximum return to N (MRTN) at different fertilizer nitrogen and corn prices (Nafziger et al., 2004; Sawyer et al., 2006).
In the MRTN approach, a number of steps are used to calculate the MRTN rate and the economically profitable N rate range (PNRR) for corn in each rotation for each participating Midwest state.18 In brief, the steps are: 1) yield data are collected at replicated N rates from numerous fertilizer N rate trials; 2) curves are fitted and equations calculated for each yield response to N rate data set for each crop rotation at each site; 3) from the response curve equation at each site, the yield increase (amount above yield at zero fertilizer N rate), gross dollar return at that yield increase (corn grain price times yield), fertilizer cost (fertilizer N price times fertilizer N rate), and net return to N (gross dollar return minus fertilizer N cost) are calculated at each 1 lb (0.45 kg) fertilizer N rate increment from zero to 240 lb N acre‐1 (214 kg N ha‐1); and 4) for each incremental N rate, the net return is averaged across all sites in the dataset for each rotation in each state.
The N rate with the largest average net dollar return to N is the MRTN for corn in each crop rotation in each state. The net return will vary depending upon fertilizer N and corn prices, and it is their ratio that directly influences the net return and point of maximum net return. From the MRTN analysis, the net economic return to N in each state is found to be similar at fertilizer N rates just below and just above the point of maximum net return (i.e., the MRTN). A range of N rates around the MRTN rate can therefore be considered to provide comparable economic return, 17 Although soil N tests prior to fertilization have been found to improve yield–goal N recommendations in some areas (e.g., Andraski and Bundy, 2002), such tests have not been effective predictors of future N needs in many areas. 18 These steps are detailed in Sawyer et al. (2006).

11
and as such, a fertilizer N rate can be defined to be within the PNRR when it results in a net return to N within ± US$ 1.00 acre‐1 (US$ 2.45 ha‐1) of the MRTN (Sawyer et al., 2006). The specific N rates that result in a net return to N of US$ 1.00 acre‐1 (US$ 2.45 ha‐1) higher and lower than the MRTN rate can be defined as the high and low profitable N rate, respectively for corn in each crop rotation in each state.
Figure 5. Maximum nitrogen (N) return for an Iowa corn crop following soybean. Results based on 165 sites for an N price of US$880/MT ($0.40/lb) and a corn price of US$157/MT ($4.00/bu). The mean return to N (MRTN) rate of 143 kg N/ha (128 lb N/acre) provides 98% of maximum yield, which occurs at 196 kg N/ha (175 lb N/acre). From Robertson and Vitousek (2009) after Sawyer et al. (2006). The N rate with the largest average net dollar return to N is the MRTN for corn in each crop rotation in each state. The net return will vary depending upon fertilizer N and corn prices, and it is their ratio that directly influences the net return and point of maximum net return. From the MRTN analysis, the net economic return to N in each state is found to be similar at fertilizer N rates just below and just above the point of maximum net return (i.e., the MRTN). A range of N rates around the MRTN rate can therefore be considered to provide comparable economic return, and as such, a fertilizer N rate can be defined to be within the PNRR when it results in a net return to N within ± US$ 1.00 acre‐1 (US$ 2.45 ha‐1) of the MRTN (Sawyer et al., 2006). The specific N rates that result in a net return to N of US$ 1.00 acre‐1 (US$ 2.45 ha‐1) higher and lower than the MRTN rate can be defined as the high and low profitable N rate, respectively for corn in each crop rotation in each state.
The MRTN method is attractive for a number of reasons, including: 1) data can be utilized from a large number and variety of N response trials and new trials can easily be added to the analysis; 2) specific responses of each site are considered in the determination of optimum N and net return, rather than average response; 3) risk assessment can be included, and 4) calculations are straightforward and likely economic outcomes at different N rates can be easily determined with

12
different N fertilizer and corn prices. These and other advantages help bridge the gap between research and practical N rate guidelines.
Regional distribution of N2O emissions in U.S. agriculture
Figure 6 shows the geographic extent of agricultural crop production in the U.S. that are primary crops associated with emissions of N2O. As shown, N2O emissions are primarily associated with corn, corn-soybean, and wheat production in the U.S.
Figure 6. Regions for N2O assessment modeling based on the percentage of corn, soybean, and wheat acreage with respect to total cropland 2000-2006. A composite map showing the spatial extent for all three crops is shown on the bottom right.
Figure 7 illustrates data recently developed by the U.S. Geological Survey (USGS) to help address the hypoxia problem in the Gulf of Mexico – together with an earlier compilation (Alexander and Smith, 1990). This figure shows annual N fertilizer data on a county-level basis for the period 1945-2001 for the conterminous United States.
MSU has estimated the total technical GHG mitigation potential that could be generated using the N2O mitigation approach developed by MSU and EPRI over the first five-year period following completion of the VCS Double Approval could be as high as 76 million metric tons (MMT) CO2e (Table 2).
The approach used does not cover the full range of eligible crops in each state for which the protocol could be applied, but rather focuses on California and the major grain crops grown throughout the contiguous US.
These estimates are based on the application of the MSU-EPRI N2O offsets methodology submitted to the VCS for methodology validation. These estimates do not include any assumptions about the potential rate of “uptake” of this offsets protocol in the agricultural community, but rather are based on the assumption that the protocol is used to account for all N2O emissions reductions that could be generated on “eligible” crop lands in the regions

13
analyzed. A geographic breakdown and brief details on methods and assumptions used in calculating the emissions reductions are given below.
Figure 7. Nitrogen fertilizer use (kg N) by county in the conterminous US. Data shown are for 1997; data available in this database are from 1982-2001. Source: Ruddy et al. 2006.
Table 2. Technical GHG mitigation potential that could be generated over the first five-year period following approval of the MSU-EPRI protocol.
US Geographic area
5 – Year Technical Mitigation Potential
N2O‐N (Gg) CO2e (MMT)
California 12.4 5.81
North Central Region 142 66.7
Contiguous US 6.1 3.10
Total 161 76 Gg = Gigagram (109 g) = thousand metric tons; MMT = million metric tons; N2O‐N = mass of nitrogen associated with N2O emissions reductions; CO2e = carbon dioxide equivalent (Global Warming Potential (GWP) of N2O = 298 CO2e). Contiguous US excludes California and North Central Region.

14
California19
The estimated technical potential for reducing emissions of nitrous oxide (N2O) by reducing nitrogen (N) fertilizer rate in Californian cropping systems eligible for offset projects utilizing the MSU-EPRI protocol is ~5.81 MMT CO2e over a five-year period following protocol acceptance with the VCS.
There is a mean average surplus of 43 lb N per acre (~48 kg N ha-1) for Californian crops for which N rate recommendations are available (i.e., field crops, perennials, vegetables and annual fruits)1. These crops utilize ~97% of the N fertilizer applied in the state (2005 data). The technical potential for reducing the N rate from this excess to the ‘upper’ average N rate for these crops as recommended by University of California Division of Agriculture and Natural Resources (UC-DANR) publications, is ~440,000 metric tons CO2e per year or ~2.20 Mt CO2e over a five-year period.
Reductions of N fertilizer rate from this ‘upper’ recommendation to the ‘lower’ recommendation (which can be viewed as a ‘baseline’ and ‘project’ N rate) as published by UC-DANR, would generate a further ~733,000 metric tons CO2e per year or ~3.61 Mt CO2e over a five-year period. The total mitigation potential for reducing N rate is therefore 2.20 + 3.61 Mt CO2e for a total of 5.81 Mt CO2e.
North Central Region (NCR)20
This area of the US encompasses the twelve Midwestern states of Illinois, Indiana, Iowa, Kansas, Michigan, Minnesota, Missouri, Nebraska, North Dakota, Ohio, South Dakota and Wisconsin. The region is the major producer of the nation’s corn (and half the nations wheat) - in 2010, of the 88.1 million acres of corn (for grain) planted in all the US; 73.1 million acres (~83%) were planted in the NCR.2
The estimated technical potential for reducing N2O emissions by reducing N fertilizer rate in NCR corn crops eligible for use in offset projects utilizing the MSU-EPRI protocol is ~66.7 Mt CO2e
# over a five-year period.
Of the 12 states listed above, seven (Iowa, Illinois, Indiana, Michigan, Minnesota, Ohio and Wisconsin) are represented in the Iowa State University Nitrogen Rate Calculator (ISU-NRC).3 For each of these states there is an economically profitable range of N fertilizer rate. Reductions in N2O emissions were calculated from a reduction in N fertilizer rate from the high to the low end of this profitable range, representing baseline and project N rates, respectively. For the remaining five states, the average of the high and low profitable N rates from the seven ISU-NRC states was used to determine their N2O emissions reductions. The area planted to corn for each state in 20103 was used to estimate total regional mitigation potential.
19 This analysis assumes: (i) An emission factor for N2O of 1.0% (IPCC Tier 1) was used - consistent across all N fertilizer rates for all crops investigated; (ii) Only direct emissions of N2O are included; (iii) A GWP of 298 CO2e for N2O was used; (iv) Data for 2005 (e.g., crop areas, N fertilizer rate recommendations, etc.) are assumed applicable for the five “future” years following protocol acceptance. 20 This analysis assumes: (i) A regional (NCR) emission factor (IPCC Tier 2) for N2O emissions; (ii) The emissions factor value increases with increasing N fertilizer rate; (iii) Both direct and indirect emissions included; (iv) A GWP of 298 CO2e for N2O; (v) The ratio of fertilizer to corn grain price ratio used was 0.10; (vi) Data for 2010 (e.g., crop areas, N fertilizer rate recommendations, etc.) are assumed applicable for the five “future” years following protocol acceptance.

15
The N rate reductions from which N2O emissions reductions were calculated (i.e., ‘high’ to ‘low’ profitable N rate) are somewhat conservative (they represent a ~15% reduction in N rate averaged across the 12 states). In many cases, project proponents (producers) may have a baseline N rate substantially higher than the ‘maximum’ profitable N rate such that greater reductions in N rate than envisaged above will likely be common - generating larger reductions in N2O emissions and carbon-offset volumes. Contiguous United States21 This area encompasses the “remaining” conterminous US states (i.e., excluding California and states within the NCR). For these states, we estimate the potential N2O emissions reductions in two major grain crops that require large external anthropogenic inputs of N fertilizer, namely wheat and corn (for grain).
The estimated technical potential for reducing emissions of N2O by reducing N fertilizer rate in corn and wheat crops of the contiguous U.S. eligible for use in offset projects utilizing the MSU-EPRI protocol is ~3.10 Mt CO2e over a five-year period.
The estimated technical potential for corn is ~1.37 Mt CO2e. For corn, the averages of the high and low profitable N rates from the seven states included on the ISU-NRC (above) were used to represent baseline and project N rates, respectively – these rates can be considered representative for corn grown throughout the United States. The reduction in N rate from the baseline to the project N rate was used to determine N2O emissions reductions. The area planted to corn for each state in 20103 was used to estimate total mitigation potential.
The estimated technical potential for wheat is ~ 1.73 Mt CO2e. Currently there is no comparable multi-state N rate calculator for wheat as there is for corn. Generally, wheat crops receive less N fertilizer than corn. Although variable, for the purposes of this calculation, we assume that the high (baseline) and the low (project) profitable N rates for all wheat crops are two thirds that of corn – a realistic range. The reduction in N rate from the baseline to the project N rate was used to determine N2O emissions reductions. The area planted to wheat for each state in 20103 was used to estimate total mitigation potential.
The total mitigation potential for reducing N rate is therefore 1.37 + 1.73 for a total of 3.10 Mt CO2e.
The same calculations done using the variable (Tier 2) emissions factor used in NCR states for corn (above) generates a technical potential for emissions reductions for corn and wheat of ~3.38 and 2.93 Mt CO2e, respectively, totaling ~ 6.31 Mt CO2e in the contiguous states. This is approximately 2.0 and 1.2 Mt more than the respective Tier 1 calculations.
The MSU GHG emissions calculator and N2O emissions
As part of the EPRI-MSU research collaboration, MSU further refined and expanded an existing online “carbon calculator” to include estimated changes in N2O emissions based on different rates of N fertilizer application in crop production. The geographic region covered by the calculator also was expanded to include the entire continental U.S. with county-level resolution.
21 This analysis assumes: (i) An emission factor for N2O of 1.0% (IPCC Tier 1) - consistent across all N fertilizer rates for both crops; (ii) Both direct and indirect emissions were included; (iii) A GWP of 298 CO2e for N2O; (iv) Data for 2010 (e.g., crop areas, N fertilizer rate recommendations, etc…) are assumed applicable for the five “future” years following protocol acceptance.

16
The U.S. Cropland Greenhouse Gas Calculator is located online at http://www.kbs.msu.edu/ghgcalculator .22 This web-based tool that provides farmer, offsets developers, electric utilities and others parties with a simple and straightforward means to understand and compare GHG emissions associated with different approaches to crop management on farm fields located throughout the entire continental U.S.
The MSU GHG calculator is designed to provide users with insights about how different crop and land management practices affect GHG emissions, and to help farmers and others to evaluate opportunities to participate in emerging GHG markets. The calculator includes major grain crops (corn, soybean, wheat) and a perennial cellulosic biofuel crop (switchgrass), in addition to alfalfa and corn silage. Default weather, soil, and crop parameters are determined on the basis of geographic location, and input parameters can be adjusted to make results appropriate for temperate region soils worldwide. The MSU GHG calculator is based on the SOCRATES soil carbon model, which is used worldwide to predict soil carbon change in cropping systems (Grace et al. 2005). The calculator uses a county-level database of climate and soil information specific to the user’s location to parameterize the model, then calculates expected changes in carbon emissions based on crop, yield, tillage, residue management, and other parameters specified by the user. Users choose a county of interest on an introductory screen and are taken to an input/output window where they choose crops, yields, tillage practices, and nitrogen fertilizer rates. Outputs from the calculator include the four major contributors of GHG emissions associated with production of field crops: soil carbon change, nitrous oxide (N2O) emission, GHG emissions from fuel use, and CO2 emissions associated with fertilizer production and transportation (McSwiney et al., 2009 forthcoming).
The “base scenario” shown in the GHG calculator is populated with default land management and crop inputs based on U.S. county averages. Users can alter these default values if desired to better represent their own farming conditions. Once a user has defined a suitable “base scenario,” they can alter the proposed land and crop management parameters in the calculator to create an alternative cropping system. The calculator then estimates the changes in carbon dioxide equivalent (CO2eq) emissions associated with the change in soil C, N2O flux, GHG emissions associated with fuel use, and CO2 associated with fertilizer production and transportation. Users can choose to estimate N2O emissions based on either a Tier 1 “linear” or Tier 2 “non-linear” methodology.
Quantifying N2O emission using “Tier 3” biogeochemical models Modeling N2O emissions from soil is challenging because multiple biological processes are involved that each respond differently to various environmental and soil factors (Farquharson and Baldock, 2008). Computer simulation models, which can integrate all of these variables, can be used to provide quantitative determinations of N2O emissions.
22 For more information, see C.P. McSwiney, Bohm S., Grace P., Robertson G., Greenhouse Gas Emissions Calculator for Grain and Biofuel Farming Systems, Journal of Natural Resources Life Science Education 39:125–131 (2010).

17
Numerous simulation models have been developed to predict N2O production, ranging from those that attempt to simulate comprehensively all soil processes to more empirical approaches requiring minimal input data. Since Focht (1974) published an N2O simulation model, models of varying complexity have been constructed to predict N2O production from nitrification and denitrification. These N2O simulation models can be classified into three categories: (i) laboratory; (ii) field; and (iii) regional/global levels.
Process–based field‐scale N2O simulation models, which simulate whole agro-ecosystems and can be used to develop N2O mitigation measures, are the most widely used (Chen et al., 2008). Current process–based, field-scale models for N2O include DNDC23, NLOSS24, ecosys25, Expert‐N26, WNMM27, FASSET28, CERES‐NOE29, and DAYCENT30.
The “nutrient management” offset protocol recently developed and approved in 2010 by the ACR is based on a farm-scale application of the DNDC process model. This ACR offsets protocol is discussed in detail in Section 5 of this paper.
It is important to understand both the potential advantages and potential limitations of these models. A recent T-AGG 31 report provides a comprehensive overview of how biogeochemical process models may be used to quantify GHG in agricultural systems for use in developing GHG mitigation programs.32
Advantages of process-based models Biogeochemical process models offer some important advantages from the perspective of calculating N2O fluxes and changes in fluxes across a wide range of N-management practice changes. They make it possible to model expected N2O emissions fluxes associated with many different kinds of N-management activities. They can simulate GHG dynamics under a range of changing environmental (soil physical properties, climate, topography, previous land management) and management (cropping, livestock, manure, grazing practices) variables, and can be scaled up and averaged for use at larger scales. Process-based models can produce estimates of GHG emission changes in response to changes in land use or management reasonably well when provided with significant environmental and agricultural data inputs and detailed site knowledge.
23 Li et al., 1992a, b; Li, 2000. 24 Li et al., 1992a, b; Li, 2000. 25 Grant, 2001. 26 Engel and Priesack, 1993. 27 Li et al., 2005, 2007. 28 Chatskikh et al., 2005. 29 Henault et al., 2005; Gabrielle et al., 2006. 30 Mosier et al., 1983; Mosier and Parton, 1985; Parton et al., 1988a, b, 1996, 1998, 2001; Del Grosso et al., 2000. 31 Technical Working Group on Agricultural Greeenhouse Gases (T-AGG). 32 “Using Biogeochemical Process Models to Quantify Greenhouse Gas Mitigation from Agricultural Management Projects,” Nicholas Institute for Environmental Policy Solutions Report NI R 11-03, March 2011.

18
Limitations of process-based models Unfortunately, there are still real limits to the ability of these models to represent the ecological processes, which drive the GHG emissions results. In some cases, sufficient measured long-term data are not available to test the models to ensure they are reasonably representing or predicting the impacts of the N management practices for all locales. Even in the US and Canada, where there are extensive high-quality national and regional databases and numerous long-term agricultural research sites, the availability of experimental data across all types of cropping, soils and livestock systems can be a limiting factor in validating these models and quantifying the uncertainty of the outcomes for various N management practices and crops. It is important for policy makers, offsets standards organizations and others to be clear about where the uncertainties lie in the use of these models if they are to be used to quantify GHG emissions outcomes for developing programs and markets.33
The process-based models are consistently being updated and calibrated as new information becomes available. While they are robust tools for quantifying GHG for many practices and cropping systems now, there are a number of opportunities to improve the function of these models, but they will require additional resources and research. Modelers need resources for further calibration of models to field studies, particularly those with research gaps, which is a continuing effort as the science evolves and refines remaining questions. Calibrating models for new crops and practices can cost from US$10,000 to US$50,000 when data are available, but there can be economies of scale if there are ways to combine crops.34
Given the complexity of most process-based models and the amount of data they require, running them accurately and consistently requires a certain level of sophistication and expertise. Setting up the full process models and running them for individual offset projects is complex, requires substantial expertise, may be prone to error or bias, and may be cost prohibitive. One of the primary challenges in using these process models for determining baseline and quantifying GHG impacts at farm- or regional-scales is to standardize how the technology can be made available to non-expert users such as project developers, consultants, and verifiers, in quantification protocols or program guidelines.35
Process models have the ability to account for specific crop characteristics, climate/weather conditions, and soil traits when calculating GHG emissions. However, biogeochemical process models are far from perfect and only include a simplification of all processes involved in soil organic matter dynamics. In particular, accurately characterizing the soil moisture of the vadose zone (the unsaturated root zone in the soil profile) remains an unsolved problem in the earth sciences. So, while it is mechanistically understood that the aerobic state of the soil is the main driver of N2O gas fluxes, it is challenging to model N2O gas fluxes since biogeochemical process models are not great in modeling the soil moisture state in terms of both spatial and temporal scales. Therefore, it is not surprising that process models do not model daily N2O fluxes very well. While both the DNDC and DAYCENT models have been shown to simulate the timing of
33 Ibid., p.18. 34 Ibid., p. 21. 35 Ibid., p. 23.

19
peak and low N2O flux values fairly well, the models are not able to reliably capture the magnitude of peak events.36 For example, Del Grosso et al. (2002) reports a weak relation (r2 values rarely exceeding 25%) between simulated and measured daily N2O fluxes within one site. A similar weak relation between simulated and measured daily N2O fluxes was reported in Li et al. (2005) when using the DNDC model (r2 value ranging from 0.14 and 0.35). Del Grosso et al. (2002) posed that effects of (micro-)topography, aspect, wind, humidity, microsite heterogeneity, gas diffusion, and other factors on soil water and temperature are not included in general-purpose biogeochemical process models, such as DNDC or DAYCENT, but are likely important on a daily basis and may explain the reported deviation between observed and simulated values at a daily time scale. However, when aggregated at an annual time scale, total modeled N2O fluxes do show a much better correspondence with measured fluxes. For example, Del Grosso et al. (2005) reports an r2 of 0.74 based on simulations at 12 different sites across North America. The inherent uncertainty in the biogeochemical process model is referred to as the structural uncertainty, as opposed to the uncertainty introduced by imperfect input values.
An additional challenge is that process-based models are notoriously difficult to calibrate. Results can be biased if one variable is not parameterized well. Due to the large number of input variables, it is not straightforward to verify an existing model run. A recent comparison of N2 and N2O fluxes simulated by various widely applied biogeochemical models demonstrated broad disagreement across the models tested (David et al. 2009), raising questions about how to correctly parameterize process models.
Socioeconomic factors that affect the adoption of reduced N rate practices37 Although increased fertilizer application has been clearly linked to environmental harm, it remains a relatively common practice for producers to apply more N fertilizer than is needed to produce economically optimum crop yields. A range of factors may discourage farmers from adopting reduced N input strategies even if the cost to do so is low or negligible. These include: lack of knowledge, lack of faith in farm advisors and models, cultural inertia, social acceptability, management complexity, economic risk, adding more N–containing fertilizer to address other nutrient limitations, and uncertainty regarding factors such as weather and soil conditions (Sheriff, 2005). Overall, excess fertilizer application aims to increase yields and is viewed as a risk reducing activity (SriRamaratnam, 1987).
Traditional approaches to reduce fertilizer use focus on education, but education alone remains insufficient to overcome perceptions regarding associated risks. To mitigate perceived risks, payments may be needed from government “green payment program” or via a market–based offset programs such as the American Carbon Registry (ACR), Climate Action Reserve, and the Verified Carbon Standard (VCS) (Schneider and McCarl, 2006).
36 De Gryze, S., J. Kimble, J. Six, B. Salas, “Nutrient Management Project Protocol: A Background Paper on Quantification of Emission Reductions,“ prepared for the Climate Action Reserve, Terra Global Capital, July 2011, p. 42. 37 Much of this discussion was prepared by Diana Stuart Ph.D., Michigan State University (MSU).

20
While much research has focused on the adoption of practices that directly benefit farmers, reducing fertilizer application represents an activity that most farmers view as risky and unbeneficial. In these cases, relying solely on education becomes largely ineffective (Napier et al., 2000). Financial incentives become necessary to encourage participation in risk‐associated environmental program. Even with an incentive, some farmers may participate while others remain uninterested. Farm structure variables such as farm size, farm income, operation type, farmer age, and farmer education level may describe differences in participation. These factors can influence whether or not farmers view specific management changes as too risky, even with financial incentives. In addition external factors such as government policies and programs, relationships with input providers, and relationships with companies that purchase farm products can influence participation.
IV. The MSU-EPRI N2O Offsets Protocol38 The Electric Power Research Institute (EPRI) provided funding to Michigan State University (MSU) to conduct a three-year field study to evaluate different approaches that could be used to quantify and reduce N2O emissions resulting from use of nitrogen-based fertilizer in commercial field crop production. After this work was completed and the results of the fields studies published in the peer-reviewed scientific literature, EPRI provided additional funding to MSU to develop the results into an N2O emission reduction offset methodology. Millar et al. (2010) proposed development of an GHG emissions offsets protocol designed to provide offset credits to farmers who reduce the amount of N fertilizer they apply to croplands and thereby reduce expected N2O emissions. This protocol is referred to as the MSU-EPRI methodology for “Quantifying N2O Emissions Reductions in US Agricultural Crops through N Fertilizer Rate Reduction.” As far as we are aware, the MSU-EPRI methodology is the only offset methodology proposed or in use in offset programs today that has been published in the peer-reviewed scientific literature.39
This protocol focuses on reducing N fertilizer application, which would also generated important co–benefits including improved water quality. The protocol is based on farmers reducing N application rates to a level that will continue to maintain yields within a profitable range. In exchange for reducing N application rates, farmers would be receive GHG emissions offsets that could be sold and traded to organizations that are trying to reduce their GHG emissions on a voluntary basis or to comply with regulatory programs such as the GHG emissions cap-and-trade program expected to be implemented in California starting in 2012. The MSU-EPRI methodology was submitted to the Verified Carbon Standard (VCS)40 and posted for public comment in September 2010. Its first validation under the VCS Double
38 Much of the discussion in this section is taken from Climate Action Reserve, “Methodology Synthesis to Supplement Nutrient Management Protocol Development,” May 6, 2011. 39 Millar, N, G.P. Robertson, P. R. Grace, R.J. Gehl, & J.P. Hoben. 2010. Nitrogen fertilizer management for nitrous oxide (N2O) mitigation in intensive corn (Maize) production: an emissions reduction protocol for US Midwest agriculture. Mitigation and Adaptation Strategies for Global Change 15:185–204. 40 Development of the VCS (previously called the Voluntary Carbon Standard) began in late 2005, led by The Climate Group, the International Emissions Trading Association and the World Economic Forum. The

21
Approval Process was completed successfully in spring 2011.41 The methodology currently is undergoing the 2nd required VCS validation. 42 The MSU-EPRI methodology also has been submitted for validation to the American Carbon Registry (ACR). It was posted for public comments by ACR earlier this year, and now is undergoing ACR;s formal peer review process for all new methodologies. The MSU-EPRI methodology quantifies emissions reductions of N2O from U.S. agriculture, as brought about by reductions in the rate of N fertilizer applied to cropping systems. The methodology requires the adoption or continuance of verifiable best practices for N management other than N fertilizer rate reduction, which are specific to the crop, soil, and environmental conditions encountered at a project site. It also encourages the application of economically optimum N rates so that productivity is not lowered. The methodology utilizes either the generally accepted IPCC Tier 1 default emission factor or an empirically derived (Tier 2), regional emission factor (applicable in the 12 state North Central Region) to aid in calculating N2O emissions reductions.
The approach is underpinned by robust science (Hoben et al. 2010), is straightforward and conservative, and also flexible and transparent to stakeholders. Methodology flexibility allows a farmer to achieve N rate reduction in a number of ways, including economic optimization of N rate, split N application, slow release N fertilizers, and inclusion of cover crops.
The methodology is simple and straightforward to implement which will help to encourage more widespread adoption by farmers. Low farmer cost and effort in relation to data and documentation requirement and invasiveness is an essential asset of any methodology if it is to be widely used and have broad uptake and fast adoption. Project adoption will be limited if methodologies by their design require large amounts of data not typically collected by farmers – this is a limitation of the more complex process based models.
The MSU-EPRI methodology may be considered as a practical solution to help reduce N2O emissions and other reactive N pollutants from U.S. agriculture, particularly N intensive corn rotations in the U.S. Midwest. When more N2O data from other U.S. regions and crops become available, the methodology can be amended to include additional Tier 2 approaches and Tier 2 approaches for regions other than the NCR. Below is a summary of a few specific elements of the MSU-EPRI N2O offsets protocol.
Start Date - Under the MSU-EPRI protocol and consistent with the VCS Standard, the project start date is the date on which activities that lead to the generation of GHG emission reductions or removals are implemented. Such activities may include preparing land for seeding, planting, changing agricultural or forestry practices, or implementing management or protection plans.
first program standard (VCS Version 1) was released in March 2006 and has since undergone further revisions, public comment periods, etc. 41 The MSU-EPRI methodology has moved from its First Assessment phase to its Second Assessment phase and, subsequently, a new version of the methodology, version 1.4, has been uploaded to the VCS website. This background paper reviewed version 1 of the MSU-EPRI methodology, and the final draft background paper will incorporate any changes made between versions 1.0 and 1.4. 42 The VCS has a number of programmatic documents relevant to consideration of this methodology, including tThe VCS Standard, version 3, and AFOLU Requirements, Version 3.0.

22
Offset projects covered by this protocol must have a start date on or after January 1, 2002 consistent with the VCS standard.
Eligible Practices - Under the conservative approach proposed in the MSU-EPRI offsets methodology, offsets credits can only be awarded for emission reductions associated with N rate reductions. Implementation of other N management practices are not directly creditable. The primary reason for this exclusion of other N management practices from direct crediting is the lack of consistent quantifiable evidence that implementation of these practices consistently will reduce N2O emissions. However, to the extent that adoption of these N management practices lead farmers to reduce the rate of N application on croplands, than these activities can be indirectly credited through crediting of offsets directly associated with the reduce rate of N application.
Additionality - The protocol requires projects to exceed their business-as-usual N rate, which is assessed one of two ways. When historical, verifiable farmer records are available, a project-specific baseline is established. When records are not available, the methodology uses a standardized approach to derive a baseline using county-level yield data and state-recommended fertilizer rates to achieve average yields. Project reductions are calculated as a direct function of fertilizer application rates below the baseline. More details on how baseline and project emission are calculated are provided in Section 4.
In addition, the MSU-EPRI protocol requires that no mandatory law, statute or other regulatory framework in place at the local, state, or federal level, requiring producers to reduce fertilizer N input rate below that of a business–as–usual or common–practice scenario.
Geographic Eligibility – The version of the MSU-EPRI offsets methodology at the VCS is designed specifically to address N2O emissions from corn-based cropping systems in the NCR, but also is applicable a wide range of crops across the entire United States.
In the 12-state North Central Region where most of the nation’s N2O emissions occur, the methodology requires use of a region-specific Tier 2 N2O quantification approach for use with corn row–crop systems, including continuous corn and rotations that include a corn component such as corn–soybean or corn-soybean-wheat. The proposed Tier 2 approach is based on peer-reviewed scientific studies completed by MSU in the NCR that are described above.
Crediting Period - Under the VCS, the crediting period is 10 years and is renewable two times (at most) for agricultural projects reducing N2O emissions.
Outside of the NCR, the methodology is based on application of the simple, non-linear IPPC Tier 1 emissions factors for accounting for N2O emissions for all agricultural crops in the US where the product is harvested for food, livestock fodder, or for another economic purpose. Aggregation - The protocol does not explicitly address aggregation or project grouping. However, the VCS allows a form of aggregation called ―project grouping, under which multiple activities may be brought together under a single project with a common monitoring and information system. More information about the MSU-EPRI N2O offsets protocol is shown in Table 3 below which provides a side-by-side comparison to the ACR offsets methodology described below.

23
V. ACR43 offsets Methodology for N2O Emission Reductions through Changes in Fertilizer Management44 The ACR Standard45 details programmatic requirements of ACR and includes “specifications for the quantification, monitoring, and reporting of project-based GHG emissions reductions and removals, verification, project registration, and issuance of offsets.” Projects must fully adhere to the ACR Standard, as well as the relevant project protocol. “The ACR Methodology for N2O Emission Reductions through Changes in Fertilizer Management” was adopted by ACR in November 2010.46
This ACR methodology is applicable to Agricultural Land Management (ALM) ACR project activities that involve a change in fertilizer management. This may include changes in fertilizer rate (quantity), type (specific synthetic or organic fertilizers), placement, timing, use of timed-release fertilizers, use of nitrification inhibitors and other factors.
The methodology relies on the DNDC model as the primary tool to be used to develop offset project “baseline” and “project” scenarios, and to quantify direct N2O emissions from fertilizer use and indirect emissions from leaching and ammonia volatilization.
Offset projects using this methodology must comply with all requirements of the ACR Standard, submit a GHG Project Plan for certification by ACR, and secure independent validation and verification by an ACR approved third-party verifier of the GHG Project Plan and GHG assertions.
Start Date - As noted within the protocol, the ACR Standard defines the Start Date for agriculture, forestry, and other land use (AFOLU) projects as the date on which the Project Proponent began the activity on project lands. Both the ACR Standard and protocol state that projects with a Start Date on or after November 1, 1997 are eligible.
Eligible Activities – Defined as Agricultural Land Management (ALM) ACR project activities that involve a change in fertilizer management, which may include changes in fertilizer rate (quantity), type, placement, timing, use of timed-release fertilizers, use of nitrification inhibitors and other factors. Under this protocol, project proponents must show that project activities may not lead to a significant decrease in yields. (If yields are significantly affected, the project is determined to be ineligible.)
Additionality – Proposed projects must pass the three-pronged ACR additionality test, as described in the ACR Standard. This is very similar to the approach used in the CDM to assess
43 The American Carbon Registry (ACR) is a non-profit carbon market registry founded in 1996 originally as the GHG Registry and becoming part of Winrock International in 2007. ACR was the first private voluntary GHG registry in the U.S. 44 Much of this discussion is taken from Climate Action Reserve, 2011, Op. Cit. 45 American Carbon Registry (2010), The American Carbon Registry (ACR) Standard, Version 2.1, October 2011, Winrock International, Little Rock, Arkansas, Available at: http://www.americancarbonregistry.org/carbon-accounting/american-carbon-registry-standard-v2.0 46 American Carbon Registry (2010), American Carbon Registry Methodology for N2O Emission Reductions through Changes in Fertilizer Management. Winrock International, Little Rock, Arkansas, Available at: http://www.americancarbonregistry.org/carbon-accounting/emissions-reductions-through-changes-in-fertilizer-management

24
additionality. This “project-based” additionality test includes ACR’s Regulatory Surplus test, the “Common Practice” test, and an “Implementation Barriers” test.
The project developer also must identify all plausible alternative fertilizer management scenarios which may have occurred in the absence of the project. Plausibility is determined by applying the three tests above to each baseline scenario. All alternative scenarios must be considered and a list of plausible alternative scenarios provided. The project activity is not considered additional if it could be included in the list of plausible alternative scenarios, in the absence of the carbon incentive.
Geographic Eligibility - The protocol does not restrict geographic eligibility. The protocol is inferred to have wide geographic applicability because the ACR program overall, accepts projects from within and outside the US.
Though the DNDC model is theoretically applicable to a wide geography as well, the model requires significant input data for calibration and validation. As such, there may be geographic locations for which sufficient data will not be available to calibrate the model.
Crediting Period - Changes in fertilizer management project activities may be implemented for one year or longer. The crediting period under the ACR protocol is variable, as chosen by the project developer. The crediting period may be as short as 1 year or as long as 7 years.
Aggregation - Projects are required to incorporate a minimum of 10 individual fields. Fields may be adjacent to each other, but must be justifiable as distinct fields during verification. The fields in a project may or may not be owned by the same landowner, as long as the combined areas are treated as a single project area. The methodology does not otherwise specify a minimum project size (e.g. in acres).
Table 3 shows a simple comparison of the ACR DNDC-based nitrogen fertilizer management methodology and the MSU-EPRI N2O offsets methodology.
Table 3. Nutrient Management Offset Protocol Synopsis47
Protocol Element ACR EPRI-MSU
Applicability/ Additionality
Can apply to a wide range of practice changes in Fertilizer Management including the 4Rs (right source, right rate, right time, right place)
Credit is provided for Fertilizer Rate Reduction which can be achieved by a wide range of practice changes in Fertilizer Management including but not limited to the 4Rs (right source, right rate, right time, right place)
Quantification Approach and Science basis (note – all follow IPCC guidance and include both direct and indirect sources of N20; all exclude soil carbon based on de minimus impact)
Tier 3; DNDC Process Model at Project Level; deposition of N is derived from National Atmospheric Deposition Program (NADP) data.
Tier 1 – based on IPCC defaults for all US states and crops that receive N fertilizer. Tier 2 – based on empirical equation similar to IPCC but with nonlinear response of N2O to N rate based on empirical results for corn rotations in the North Central Region.
47 This methodology synopsis originally was prepared by the Coalition for Agricultural Greenhouse Gas management (C-AGG) for a meeting held March 29-30, 2011 in Sacramento, CA. We have excerpted the columns for ACR and MSU. We have not included an additional column that refers to the Alberta Nitrogen Emissions Reduction Protocol (NERP), as this protocol is not discussed in this background paper.

25
N Input Sources (note - IPCC guidance considers N inputs from fertilizer N, manure N, crop residue N, residual soil N, irrigation N)
Includes IPCC sources of N inputs - fertilizer N and organic N additions such as manures – user must input; DNDC calculates crop residue N and biofixed N inputs, as well as mineralizable N.
Includes IPCC sources of N inputs – fertilizer N and organic N additions such as manures. Baseline N inputs based on either a) 5-6 years of verifiable farm records or b) USDA recommended fertilizer rates back-calculated from county yields (synthetic fertilizer only).
Practice Coverage Fertilizer rate, type, placement, timing and timed release and nitrification inhibitor technology
Based on proof of N rate reduction by whatever means practical, including 4R approaches, advanced fertilizer formulations, precision fertilizer placement, etc.
Baseline Establishment Project-level; based on management records of previous 5 years
Project-level; based on N fertilizer records of previous 5-6 years or (in absence of farm records) on conservative back-calculation of fertilizer rate based on USDA recommendations and county yields.
Data Input Requirements
Relatively more intensive; many project level inputs specified; some look-up tables
Site specific farm management records. Least level of data inputs
Assessment Scale Project or multi-project Project or multi-project
Geographic Coverage Potentially global depending on data availability to parameterize DNDC for specific cropping systems (methodology has no applicability conditions limiting use geographically)
USA only for now (Tier 2 approach available only for NCR). International project can be done under the version of the protocol submitted to the ACR for validation.
Metrics – Functional Equivalence
Output based metrics (tonnes of N20-N or CO2e per kg of crop yield) – functional unit for baseline and project comparisons
Output based metrics (tonnes of N2O-N or CO2e per hectare). Credit based on N2O-N avoided vs. baseline practice.
Leakage
Applicability condition of methodology is no significant decrease in yields as a result of project implementation (total yield shall not differ between the baseline and with-project scenarios by more than 5% in any given year). No leakage deduction.
Conditions – land in production prior to project; no yield reductions, no yield compensation; no additional N use
Complexity
Most complex to implement; project developer will need modeling expertise for calibration and execution; many data points to verify; verifier competency will need to have familiarity with the model
Least complex to implement. Flexibility offered for lack of site specific data, but based on same underpinning; level of expertise needed by farmer/project developer and verifier is minimal.
Cost-Effectiveness Likely achieved through aggregation
Efforts and costs minimal.
VI. Climate Action Reserve \ Nutrient Management Project Protocol The Climate Action Reserve (CAR) is developing an agriculture sector Nutrient Management Project Protocol (NMPP) to provide guidance on how to quantify, monitor, and verify greenhouse gas (GHG) emission reductions from changes in nitrogen fertilizer management on agricultural lands.

26
In early 2011, CAR created a multi-stakeholder to assist the organization in its efforts to develop the NMPP. The workgroup includes industry representatives, federal agency personnel, environmental organizations, verifiers and expert consultants.
In addition, CAR together with the Nicholas Institute of Duke University assembled a group of leading scientific experts to form a Science Advisory Committee (“SAC”).48 The purpose of the SAC is to help CAR interpret and apply the best available science into their Nutrient Management Project Protocol (NMPP).
CAR began development of the NMPP is early 2011 and expects to complete a final version of the NMPP to be brought to its board of directors for consideration in during Q1 2012.
VII. CA Air Resources Board (ARB) Action to Develop a Nitrogen Fertilizer Nutrient Management Offsets Protocol At its August 24, 2011 meeting of the California Air Resources Board (ARB), the ARB staff updated the Board on implementation of Assembly Bill 32 (AB 32) climate change program activities and the AB 32 Scoping Plan. As part of the ARB staff presentation on offset demand and offset protocols, ARB staff highlighted three GHG offset protocols that ARB staff are poised to begin developing as compliance offset protocols in 2012. The three protocols reported to be the focus of ARB development starting in 2012 include:
(i) Conversion of pneumatic controllers in natural gas transmission and distribution systems to reduce fugitive CH4 emissions;
(ii) Changes in fertilizer N-management to reduce N2O emissions; and,
(iii) Changes to innovative rice cropping systems to reduce CH4 emission. ARB staff are reported to have been working for many months on an in-depth technical review of over 20 offset protocols with the objective of narrowing the list to a few high quality protocols that could be adopted for the compliance program. In order for a new offsets protocol to be used to generate compliance grade offsets for use in California’s new GHG cap and trade program, it must be approved by the Board through a complete Board rulemaking process, which is expected to begin in Q1 2012. As part of developing a proposed regulation, ARB will go through a public process, and will look at all information that is available including protocols and scientific information that have been developed. Development of new ARB regulations and adoption of new offsets protocols could take up to one year from the time that ARB staff begins the formal regulatory process.
48 Committee membership was by invitation only. Involvement in the Technical Working Group on Agricultural Greenhouse Gases (T-AGG) was a priority qualification. Scientists must have met the following criteria to be eligible to participate: (i) a PhD in soil science or related field, (ii) 10+ years of experience in research, with a research emphasis directly relevant to agricultural nutrient management, and (iii) multiple publications in soil science, ecosystem science, agronomy, or related fields.

27
GLOSSARY OF TERMS Ceq or CO2eq Carbon or carbon dioxide equivalent. Units of measure that allow all
greenhouse gases to be compared relative to C or CO2 based on Global Warming Potentials. Also referred to as CO2e.
CO2 Carbon Dioxide. A GHG with a 100-year Global Warming Potential of 1.
CH4 Methane. A powerful GHG with a 100-year Global Warming Potential of 25.
GHG Greenhouse gas. This term usually is used to refer to the collection of all six types of GHGs regulated by the Kyoto Protocol (CO2, CH4, N2O, SF6, PFCs and HFCs).
Global Warming Potential (GWP)
The radiative warming caused by a molecule of gas relative to that of CO2 for a defined period, usually 100 years. By definition CO2 has a GWP of 1; N2O has a GWP of 298.
Gt Gigatonnes. Equal to one billion tonnes, or alternatively one petagram (1015). For example, one 1 GtCO2 is one billion tonnes of CO2.
Hectare (ha) A unit of surface area equal to 10,000 square meters or 2.471 acres.
IPCC The United Nations Intergovernmental Panel on Climate Change. The U.N. organization responsible for evaluating the scientific basis of global climate change pursuant to the UNFCCC.
N Nitrogen.
N2O Nitrous oxide. A powerful GHG with a 100-year GWP of 298.
N2O Flux The rate of movement of N2O from soil to the atmosphere.
N2O-N The atomic mass of the nitrogen contained in the N2O molecule.
Nitrification / Denitrification
Nitrification is the microbial oxidation of NH4+ to NO3
-. Denitrification is the microbial reduction of NO3
- to N2O and then to N2.
Mg Megagram. Equal to 1,000,000 grams, 1,000 kilograms, and 1 metric ton or 1 tonne.
MSU Michigan State University.
mt Metric ton. Also referred to as a tonne.
Mt One million metric tons.
Pg Petagram. Equal to 1015 grams or 109 metric tons. Equal to gigatonne (Gt) and 1,000 million metric tons (MMt). Approximately equal to 1,000 million U.S. “short” tons.
Tg Teragram. Equal to 1012 grams or 106 metric tons. Equal to 1 million metric tons (MMt). Approximately equal to 1 million U.S. “short” tons.

28
Bibliography & References Cited Andraski, T.W., and L.G. Bundy. 2002. Using the pre–sidedress soil nitrate test and organic nitrogen crediting to improve corn nitrogen recommendations. Agronomy Journal 94:1411‐ 1418. Association of Official Analytical Chemists (AOAC). 1990. AOAC official method 972.43: microchemical determination of carbon, hydrogen, and nitrogen. In: Official methods of analysis. Volume 1. 15th ed. Arlington (VA): AOAC International. p 341. Babcock, B.A. 1992. The Effects of Uncertainty on Optimal Nitrogen Applications. Review of Agricultural Economics 14:271‐280. Berdanier, A.B. and Conant, R.T. 2011. Regionally‐differentiated estimates of cropland N2O emissions reduce uncertainty in global calculations. Global Biogeochemical Cycles “Accepted Article”; doi: 10.1111/j.1365‐2486.2011.02554.x Bouwman, A.F. (1990). Exchange of greenhouse gases between terrestrial ecosystems and the atmosphere. Soils and the greenhouse effect. A. F. Bouwman. Chichester, UK, John Wiley and Sons: 61‐127. Bouwman, A.F., I. Fung, E. Matthews, and J. John. 1993. Global analysis of the potential for N2O production in natural soils. Global Biogeochemical Cycles 7:557‐597. Bouwman, A.F. 1996. Direct emission of nitrous oxide from agricultural soils. Nutrient Cycling in Agroecosystems 46:53‐70. Bouwman, A.F., L.J.M. Boumans, and N.H. Batjes. 2002a. Emissions of N2O and NO from fertilized fields: Summary of available measurement data. Global Biogeochemical Cycles 16:1058‐1071. Bouwman, A.F., L.J.M. Boumans, and N.H. Batjes. 2002b. Modeling global annual N2O and NO emissions from fertilized fields. Global Biogeochemical Cycles 16:1080‐1088. Bremner, J.M., G.A. Breitenbeck, and A.M. Blackmer. 1981. Effect of Anhydrous Ammonia Fertilization on Emission of Nitrous Oxide from Soils. Journal of Environmental Quality 10:77‐80. Buttel, F.H., and H. Newby. 1980. The Rural Sociology of Advanced Societies. Montclair, NJ: Allenheld. CAST. 2004. Climate change and greenhouse gas mitigation: challenges and opportunities for agriculture. Council for Agricultural Science and Technology. Task Force Rep. No. 140. 120 p.CAST, Ames, IA. Campbell, C.R. 1992. Determination of total nitrogen in plant tissue by combustion. In: Plank, C.O., (ed). Plant analysis reference procedures for the southern region of the United States. Athens (GA): Georgia Cooperative Extension Service. Southern Cooperative Series Bulletin 368. p 20–2. Available at www.ncagr.gov/agronomi/pdffiles/sera368.pdf (verified 17 June 2010). Chatskikh D., J. OlesenJ, J. Berntsen, K. Regina, and S. Yamulki. 2005. Simulation of effects of soils, climate and management on N2O emission from grasslands. Biogeochemistry 76:395‐ 419. Chen, D., Y. Li, P. Grace, and A. Mosier. 2008. N2O emissions from agricultural lands: a synthesis of simulation approaches. Plant and Soil 309:169‐189. Cherry, K.A., M. Shepherd, P.J.A. Withers, and S.J. Mooney. 2008. Assessing the effectiveness of actions to mitigate nutrient loss from agriculture: a review of methods. Science of the Total Environment 406:1‐23. Crutzen, P.J., A.R. Mosier, K.A. Smith, and W. Winiwarter. 2007. N2O release from agro‐biofuel production negates global warming reduction by replacing fossil fuels. Atmospheric Chemistry and Physics 8:389‐395. Del Grosso, S.J., W.J. Parton, A.R. Mosier, D.S. Ojima, A.E. Kulmala, and S. Phongpan. 2000. General model for N2O and N2 gas emissions from soils due to denitrification. Global Biogeochemical Cycles 14:1045‐1060. Del Grosso, S.J., A.R. Mosier, W.J. Parton, and D.S. Ojima. 2005. DAYCENT model analysis of past and contemporary soil N2O and net greenhouse gas flux for major crops in the USA. Soil and Tillage Research 83:9‐24. Del Grosso, S.J., W.J. Parton, A.R. Mosier, M.K. Walsh, D.S. Ojima, and P.E. Thornton. 2006. DAYCENT National‐scale simulations of nitrous oxide emissions from cropped soils in the United States. Journal of Environmental Quality 35:1451‐1460. Del Grosso, S.J., A.D. Halvorson, and W.J. Parton. 2008. Testing DAYCENT model simulations of corn yields and nitrous oxide emissions in irrigated tillage systems in Colorado. Journal of Environmental Quality 37:1383‐1389.

29
Del Grosso, S. J., S. M. Ogle, W. J. Parton, and F. J. Breidt. 2010 Estimating uncertainty in N2O emissions from U.S. cropland soils. Global Biogeochemical Cycles 24:GB1009. Dillman, D. 2007. Mail and Internet Surveys: the Tailored Design Method. Hoboken, NJ: Wiley. EPA. 2010. Inventory of US Greenhouse Gas Emissions and Sinks: 1990‐2008. Washington DC, United States Environmental Protection Agency. Eickhout, B., A.F. Bouwman, H. van Zeijts. 2006. The role of nitrogen in world food production and environmental sustainability. Agriculture Ecosystems and Environment 116:4‐14. Eichner, M.J. 1990. Nitrous oxide emissions from fertilized soils ‐ summary of available data, Journal of Environmental Quality 19:272‐280. Engel T., and E. Priesack. 1993. Expert‐N, a building block system of nitrogen models as resource for advice, research, water management and policy. In: Eijsackers, H.J.P., Hamers, T. (eds) Integrated soil and sediment research: a basis for proper protection. pp. 503‐507. Kluwer Academic Publishers, Dordrecht, Niederlande. Erickson, H., M. Keller, and E.A. Davidson. 2001. Nitrogen Oxide Fluxes and Nitrogen Cycling during Post Agricultural Succession and Forest Fertilization in the Humid Tropics. Ecosystems 4:67‐84. Farquharson, R. and J. Baldock. 2008. Concepts in modeling N2O emissions from land use. Plant and Soil 309:147‐167. Focht D.D. 1974. The effect of temperature, pH, and aeration on the production of nitrous oxide and gaseous nitrogen: a zero order kinetic model. Soil Science 118:173‐179. Follett, R.F., and J.A. Delgado. 2002. Nitrogen fate and transport in agricultural systems. Journal of Soil and Water Conservation 57:402‐408. Follett, R.F., S.R. Shafer, M.D. Jawson, and A.J. Franzluebbers. 2005. Research and implementation needs to mitigate greenhouse gas emissions from agriculture in the USA. Soil and Tillage Research 83:159‐166. Forster, P., V. Ramaswamy, P. Artaxo, T. Berntsen, R. Betts, D.W. Fahey, J. Haywood, J. Lean, D.C. Lowe, G. Myhre, J. Nganga, R. Prinn, G. Raga, M. Schulz, and R.V. Dorland. 2007. Changes in Atmospheric Constituents and in Radiative Forcing. Climate Change 2007: The Physical Science Basis. Contribution of Working Group I to the Fourth Assessment Report of the Intergovernmental Panel on Climate Change, Cambridge University Press, Cambridge, United Kingdom and New York, NY, USA, IPCC (Intergovernmental Panel on Climate Change). Gabrielle, B., P. Laville, C. Henault, B. Nicoullaud, and J.C. Germon. 2006. Simulation of nitrous oxide emissions from wheat. Plant and Soil 309:169‐189. Galloway, J.N., J.D. Aber, J.W. Erisman, S.P. Seitzinger, R.W. Howarth, E.B. Cowling, and B.J. Cosby. 2003. The nitrogen cascade. Bioscience 53:341‐356. Galloway, J. N., A. R. Townsend, J.W. Erisman, M. Bekunda, Z.C. Cai, J.R. Freney, L.A. Martinelli, S.P. Seitzinger, and M.A. Sutton. 2008. Transformation of the nitrogen cycle: Recent trends, questions, and potential solutions. Science 320(5878):889‐892. Gardner, W.H. 1986. Water content. p. 493‐544. In Klute et al. (ed.). Methods of soil analysis. Part 1. Physical and mineralogical methods. SSSA Book Ser. 5. SSSA and ASA, Madison, WI. Grace, P., G. P. Robertson, N. Millar, M. Colunga‐Garcia, B. Basso, S. H. Gage, and J. Hoben. 2011. The contribution of maize cropping in the Midwest USA to global warming: A regional estimate. Agricultural Systems 104:292‐296. Grant, R.F. (2001) A review of the Canadian ecosystem model ecosys. In: Shaffer, M. (ed) Modeling carbon and nitrogen dynamics for soil management. CRC, Boca Raton, Florida, pp 175‐264. Grant, R.F., E. Pattey, T.W. Goddard, L.M. Kryzanowski, and H. Puurveen. 2006. Modeling the effects of fertilizer application rate on nitrous oxide emissions. Soil Science Society of America Journal 70:235‐248. Halvorson, A.D., S.J. Del Grosso, and C.A. Reule. 2008. Nitrogen, tillage, and crop rotation effects on nitrous oxide emissions from irrigated cropping systems. Journal of Environmental Quality 37:1337‐1344. Halvorson, A. D., S. J. Del Grosso, F. Alluvione. 2010. Tillage and Inorganic Nitrogen Source Effects on Nitrous Oxide Emissions from Irrigated Cropping Systems. Soil Science Society of America Journal 74:436‐445. Henault, C., X. Devis, J.L. Lucas, and J.C. Germon. 1998. Influence of different agricultural practices (type of crop, form of N‐fertilizer) on soil nitrous oxide emissions. Biology and Fertility of Soils 27:299‐306.

30
Henault C, F. Bizouard, P. Laville, B. Gabrielle, B. Nicoullaud, J.C. Germon , and P. Cellier. 2005. Predicting in situ soil N2O emissions using NOE algorithm and soil database. Global Change Biology 11:115‐127. Hoben, J.P., R.J. Gehl, N. Millar, P.R. Grace, and G.P. Robertson. 2011. Non‐linear nitrous oxide (N2O) response to nitrogen fertilizer in on‐farm corn crops of the US Midwest. Global Change Biology 17:1140–1152. Holland, E.A., G.P. Robertson, J. Greenberg, P.M. Groffman, R.D. Boone, and J.R. Gosz. 1999. Soil CO2, N2O, and CH4 exchange. p. 185‐201 In: G. P. Robertson, et al. [eds.], Standard soil methods for long‐term ecological research. Oxford University Press, New York. IPCC. 2000. Good practice guidance and uncertainty management in national greenhouse gas inventories. Hayama, Japan. IPCC/IGES IPCC. 2003. Good practice guidance for land use, land‐use change and forestry. Hayama, Japan. IPCC/IGES. IPCC. 2006. IPCC guidelines for national greenhouse gas inventories, prepared by the National Greenhouse Gas Inventories Programme, Eggleston HS, Buendia L, Miwa K, Ngara T, Tanabe K (eds). Published: IGES, Japan. IPCC 2007a. Volume 4, Agriculture, Forestry and Other Land Use, Chapter 11. N2O emissions from managed soils, and CO2 emissions from lime and urea application. IPCC Guidelines for National Greenhouse Gas Inventories, Intergovernmental Panel on Climate Change ‐ National Greenhouse Gas Inventories Programme. IPCC 2007b. Climate Change 2007: The Physical Science Basis. Contribution of Working Group I to the Fourth Assessment Report of the Intergovernmental Panel on Climate Change. S. Solomon, D. Qin, M. Manning, Z. Chen, M. Marquis, K.B. Averyt, M. Tignor and H.L. Miller (eds.). Cambridge University Press, Cambridge, United Kingdom and New York, NY, Intergovernmental Panel on Climate Change. Li, C. 2000. Modeling trace gas emissions from agricultural ecosystems. Nutrient Cycling in Agroecosystems 58:259‐276. Li, C., S. Frolking, and T.A. Frolking. 1992a. A model of nitrous oxide evolution from soil driven by rainfall events: I. Model structure and sensitivity. Journal of Geophysical Research 97:9759‐9776. Li, C., S. Frolking, and T.A. Frolking. 1992b. A model of nitrous oxide evolution from soil driven by rainfall events: II. Model applications. Journal of Geophysical Research 97:9777‐9783. Li, Y., D.L. Chen, Y.M. Zhang, and H. Ding. 2005. Comparison of three modeling approaches for simulating denitrification and nitrous oxide emissions from loam‐textured arable soils. Global Biogeochemical Cycles 19:1–15. Li, Y., D.L. Chen, R.E. White, J.B. Zhang, B.G. Li, Y.M. Zhang, Y.F. Huang, and R. Edis. 2007. A spatially referenced Water and Nitrogen Management Model (WNMM) for (irrigated) intensive cropping systems in the North China Plain. Ecological Modeling 203:395‐423. Liu, X., A. Mosier, A. Halvorson, and F. Zhang. 2006. The Impact of Nitrogen Placement and Tillage on NO, N2O, CH4 and CO2 Fluxes from a Clay Loam Soil. Plant and Soil 280:177‐188. Livingston, G.P. and G.L. Hutchinson. 1995. Enclosure‐based measurement of trace gas exchange: applications and sources of error. Biogenic Trace Gases: Measuring Emissions from Soil and Water. P.A. Matson and R.C. Harriss. Oxford, U.K., Blackwell Science: 14‐51. Lokupitiya, E., and K. Paustian. 2006. Agricultural soil greenhouse gas emissions: A review of National Inventory Methods. J. Environ. Qual. 35:1413‐1427. Lubbell, M., and A. Fulton. 2008. Local policy networks and agricultural watershed management. Journal of Public Administration Research 18:673‐696. Ma, B.L., T.Y. Wu, N. Tremblay, W. Deen, M.J. Morrison, N.B. Mclaughlin, E.G Gregorich, and G. Stewart. 2009. Nitrous oxide fluxes from corn fields: on‐farm assessment of the amount and timing of nitrogen fertilizer. Global Change Biology 16:156‐170. Magee, L. 1990. R2 measures based on wald and likelihood ratio joint significance tests. American Statistician 44:250‐253. Matson, P. A. and P. M. Vitousek. 1987. Cross‐system comparisons of soil nitrogen transformations and nitrous oxide flux in tropical forest ecosystems. Global Biogeochemical Cycles 1:163‐170. Matson, P.A., W. J. Parton, A.G. Power, and M.J. Swift. 1997. Agricultural Intensification and Ecosystem Properties. Science 277(5325):504‐509. McSwiney, C.P., and G.P. Robertson. 2005. Nonlinear response of N2O flux to incremental fertilizer addition in a continuous maize (Zea mays L.) cropping system. Global Change Biology 11:1712‐1719.

31
C.P. McSwiney, Bohm S., Grace P., Robertson G., 010. Greenhouse Gas Emissions Calculator for Grain and Biofuel Farming Systems, Journal of Natural Resources Life Science Education 39:125–131. Millar, N., G.P. Robertson, P.R. Grace, R.J. Gehl, and J.P. Hoben. 2010. Nitrogen fertilizer management for nitrous oxide (N2O) mitigation in intensive corn production: an emissions reduction protocol for US Midwest agriculture. Mitigation and Adaptation Strategies for Global Change 15:185‐204. Mosier, A.R., and W.J. Parton. 1985. Denitrification in a shortgrass prairie: a modeling approach. In: Caldwell, D.E., Brierley, J.A., Brierley, C.L. (eds.) Planetary ecology. van Nostrand Reinhold, Princeton, NJ, pp 441‐460. Mosier, A.R., W.J. Parton, and G.L. Hutchinson. 1983. Modeling nitrous oxide evolution from cropped and native soils. Ecological Bulletin 35:229‐241. Mosier, A. R. 2001. Exchange of gaseous nitrogen compounds between agricultural systems and the atmosphere. Plant and Soil 228:17‐27. Mosier, A.R., M.A. Bleken, P. Chaiwanakupt, E.C. Ellis, J.R. Freney, R.B. Howarth, P.A. Matson, K. Minami, R. Naylor, K.N. Weeks, and Z.L. Zhu. 2001. Policy implications of human‐accelerated nitrogen cycling. Biogeochemistry 52:281‐320. Mosier, A. R., A. D. Halvorson, G. A. Peterson, G. P. Robertson, and L. Sherrod. 2005. Measurement of net global warming potential in three agroecosystems. Nutrient Cycling in Agroecosystems 7:67‐76. Mosier, A.R., A.D. Halvorson, C.A. Reule, and X.J.J. Liu. 2006. Net global warming potential and greenhouse gas intensity in irrigated cropping systems in northeastern Colorado. Journal of Environmental Quality 35:1584‐1598. Nafziger, E.D., J.E. Sawyer, and R.G. Hoeft. 2004. Formulating N recommendations for corn in the Corn Belt using recent data. N.C. Ext.‐Ind. Soil Fertility Conf., Des Moines, IA., Potash and Phosphate Inst, Brookings, SD. Nagelkerke, N.J.D. 1991. A note on a general definition of the coefficient of determination. Biometrika 78:691‐692. Napier, T.L., C.S. Thraen, and S.M. Napier. 1988. Willingness of land operators to participate in government‐sponsored soil erosion programs. Journal of Rural Studies 4:339‐347. Napier, T.L., M. Tucker, and S. McCarter. 2000. Adoption of conservation production systems in three Midwest watersheds. Journal of Soil and Water Conservation 55:123‐134. Nizeyimana, E.L., G.W. Petersen, M. L. Imhoff, H.R. Sinclair, S.W. Waltman, D.S. Reed‐Margetan, E.R. Levine, and J.M. Russo. 2001. Assessing the impact of land conversion to urban use on soils with different productivity levels in the USA. Soil Science Society of America Journal 65: 391‐402. Olander, L., K. Haugen‐Kozyra, 2011. Using Biogeochemical Process Models to Quantify Greenhouse Gas Mitigation from Agricultural Management Projects, Nicholas Institute for Environmental Policy Solutions, Report NI R 11‐03, March 2011. Oenema, O., G. Velthof, P. Kuikman. 2001. Technical and policy aspects of strategies to decrease greenhouse gas emissions from agriculture. Nutrient Cycling in agroecosystems 60:301‐315. Parkin, T.B., A. Mosier, J.L. Smith, R. Venterea, J. Johnson, D.C. Reicosky, G. Doyle, G. McCarty, and J. Baker. 2003. USDA‐ARS GRACEnet Chamber‐based Trace Gas Flux Measurement Protocol. Parkin, T.B. 2008. Effect of Sampling Frequency on Estimates of Cumulative Nitrous Oxide Emissions. Journal of Environmental Quality 37:1390‐1395. Parkin, T.B., and J.L. Hatfield. 2010. Influence of nitrapyrin on N2O losses from soil receiving fall applied anhydrous ammonia. Agriculture, Ecosystems and Environment 136:81‐86. Parkin, T.B., and T.C. Kaspar. 2006. Nitrous Oxide Emissions from Corn‐Soybean Systems in the Midwest. Journal of Environmental Quality 35:1496‐1506. Parton, W.J., J.W.B. Stewart, and C.V. Cole. 1988a. Dynamics of C, N, P, and S in grassland soils: a model. Biogeochemistry 5:109‐131. Parton, W.J., A.R. Mosier, and D.S. Schimel. 1988b. Rates and pathways of nitrous oxide production in a shortgrass steppe. Biogeochemistry 6:45‐58. Parton, W.J., D.S. Ojima, C.V. Cole, and D.S. Schimel. 1994. A general model for soil organic matter dynamics: sensitivity of litter chemistry, texture and management. In Quantitative modeling of soil forming processes. Soil Science Society of America Spec. Pub., Madison, WI, Vol. 39, 147‐167.

32
Parton, W.J., A.R. Mosier, D.S. Ojima, D.W. Valentine, D.S. Schimel, K. Weier, and A.E. Kulmala. 1996. Generalized model for N2 and N2O production from nitrification and denitrification. Global Biogeochemical Cycles 10:401‐412. Parton, W.J., M. Hartman, D.S. Ojima, and D.W. Schimel. 1998. DAYCENT and its land surface submodel: description and testing. Global and Planetary Change 19:35‐48. Parton, W.J., E.A. Holland, S.J. Del Grosso, M.D. Hartman, R.E. Martin, A.R. Mosier, D.S. Ojima, and D.S. Schimel. 2001. Generalized model for NOx and N2O emissions from soils. Journal of Geophysical Research 106:17403‐17419. Roberts, T.L. 2006. Improving nutrient use efficiency. IFA Agriculture Conference Optimizing Resource Use Efficiency for Sustainable Intensification of Agriculture. Kunming, China, International Fertilizer Industry Association (IFA), Paris, France. Robertson, G.P. (1997). Nitrogen use efficiency in row crop agriculture: crop nitrogen use and soil nitrogen loss. Ecology in Agriculture. L. Jackson. New York, Academic Press: 347‐365. Robertson, G.P., and P. Grace. 2004. Greenhouse Gas Fluxes in Tropical and Temperate Agriculture: The need for a Full‐Cost accounting of Global Warming Potentials. Environment, Development and Sustainability 6:51‐63. Robertson, G.P., and P. Groffman. 2007. Nitrogen transformations. Soil Microbiology, Biochemistry, and Ecology. E.A. Paul (ed.). New York, Springer, New York: 341‐364. Robertson, G.P. and P.M. Vitousek. 2009. Nitrogen in Agriculture: Balancing the Cost of an Essential Resource. Annual Review of Environment and Resources 34:97‐125. Robertson, G.P., E.A. Paul, and R.R. Harwood. 2000. Greenhouse Gases in Intensive Agriculture: Contributions of Individual Gases to the Radiative Forcing of the Atmosphere. Science 289(5486):1922‐1925. Rochette, P., and N.S. Eriksen‐Hamel. 2008. Chamber measurements of soil nitrous oxide flux: Are absolute values reliable? Soil Science Society of America Journal 72:331‐342. Rogers, E. 2005. Diffusion of Innovations. New York, NY: Free Press. Sawyer, J.E., E.D. Nafziger, G.W. Randall, L.G. Bundy, G.W. Rehm, and B.C. Joern. 2006. Concepts and rationale for regional nitrogen rate guidelines for corn. Iowa State University Extension, Ames, Iowa. Schneider, U.A. and B.A. McCarl. 2006. Appraising agricultural greenhouse gas mitigation potentials: effects of alternative assumptions. Agricultural Economics 25:277‐287. Sheriff, G. 2005. Efficient waste? Why farmers over‐apply nutrients and the implications for policy design. Review of Agricultural Economics 27:542‐557. Smil, V. 1999. Nitrogen in crop production: An account of global flows. Global Biogeochemical Cycles 13:647‐662. Smith, P., D. Martino, Z. Cai, D. Gwary, H. Janzen, P. Kumar, B. McCarl, S. Ogle, F. O’Mara, C. Rice, B. Scholes and O. Sirotenko. 2007a. Agriculture. In B. Metz et al. (ed.) Climate Change 2007: Mitigation. contribution of working group III to the fourth assessment report of the Intergovernmental Panel on Climate Change. Cambridge University Press, Cambridge, UK, and New York, NY, USA. Smith, R. G., F. D. Menalled, G.P. Robertson. 2007. Temporal Yield Variability under Conventional and Alternative Management Systems. Agronomy Journal 99:1629‐1634. Sparks, D.L., A.L. Page, P.A. Helmke, R.H. Loeppert, P.N. Soltanpour, M.A. Tabatabai, C.T. Johnston, and M.E. Sumner (ed.). Methods of soil analysis. Part 3. Chemical Methods. SSSA Book Ser. 5. SSSA and ASA, Madison, WI. SriRamaratnam, S., D.A. Bessler, M.E. Rister, J.E. Matocha, and J. Novak. 1987. Fertilizer under uncertainty: an analysis based on producer yield expectations. Am. J Agric Econ 69:349‐357. Stanford, G. 1973. Rationale for optimum nitrogen fertilization in corn production. Journal of Environmental Quality 2:159‐166. Stehfest, E., and L. Bouwman. 2006. N2O and NO emission from agricultural fields and soils under natural vegetation: summarizing available measurement data and modeling of global annual emissions. Nutrient Cycling in Agroecosystems 74:207‐228. Stonehouse, D.P. 1996. A targeted policy approach to inducing improved rates of conservation compliance in agriculture. Canadian Journal of Agricultural Economics 22:105‐119. Tan, I.Y.S., H.M. van Es, J.M. Duxbury, J.J. Melkonian, R.R. Schindelbeck, L.D. Geohring, W.D. Hively, and B.N. Moebius. 2009. Single‐event nitrous oxide losses under maize production as affected by soil type, tillage, rotation, and fertilization. Soil and Tillage Research 102:19‐26.

33
USDA ERS. 2010. United States Department of Agriculture Economic Research Service. http://www.ers.usda.gov. verified 21 June, 2010. USDA NASS. 2011. United States Department of Agriculture ‐ National Agricultural Statistic Service. 2010. Acreage. Available at: http://usda.mannlib.cornell.edu/usda/current/Acre/Acre‐06‐30‐2009.pdf. Verified October 2011. Vanotti, M.B. and L.G. Bundy. 1994. An alternative rationale for corn nitrogen‐fertilizer recommendations. Journal of Production Agriculture 7:243‐249. Venterea, R.T., M. Burger, and K.A. Spokas. 2005. Nitrogen Oxide and Methane Emissions under Varying Tillage and Fertilizer Management. Journal of Environmental Quality 34:1467‐1477. Venterea, R.T., M.S. Dolan, and T.E. Ochsner. 2010. Urea Decreases Nitrous Oxide Emissions Compared with Anhydrous Ammonia in a Minnesota Corn Cropping System. Soil Science Society of America Journal 74:407‐418. Wallach, D., and P. Loisel. 1994. Effect of parameter estimation on fertilizer optimization. Applied Statistics Journal of the Royal Statistical Society Series C 43:641‐651. Wejnert, B. 2002. Integrating models of diffusion of innovations: a conceptual framework. Annual Review of Sociology 28:297‐326. Wuebbles, D. J. 2009. Nitrous Oxide: No Laughing Matter. Science 326(5949):56‐57. Zebarth, B.J., P. Rochette, and D.L. Burton. 2008. N2O emissions from spring barley production as influenced by fertilizer nitrogen rate. Canadian Journal of Soil Science 88:197‐205.