‘creative destruction’: chinese gdp per capita from the ... · pdf...
TRANSCRIPT
European Historical Economics Society
!EHES!WORKING!PAPERS!IN!ECONOMIC!HISTORY!!|!!!NO.!63!
‘Creative Destruction’: Chinese GDP per capita from the Han Dynasty to Modern Times
Kent Deng London School of Economics
Patrick Karl O’Brien London School of Economics
SEPTEMBER!2014!
!EHES!Working!Paper!|!No.!63!|!September!2014!
‘Creative Destruction’: Chinese GDP per capita from the Han
Dynasty to Modern Times
Kent Deng* London School of Economics
Patrick Karl O’Brien**
London School of Economics
“So far the decisive data on prices, wages, etc., are absent [In China]”
Max Weber, The Religion of China (1920-1), translated by Hans Gerth (New York 1964, p. 80)
Abstract Our article is a critical survey of the concepts, methods and date constructed and utilized by scholars (particularly the late Angus Maddison) in order to provide estimates for the measurement of relative levels and long term trends in the GDP per capita for China from the Han Dynasty to modern times. We applaud the endeavour but have reluctantly concluded that, even as conjectures, they are not fit for purpose. Furthermore, our article suggests that the Kuznetsian paradigm in empirical economics may not turn out to be viable for qualitative analysis of the long term development of imperial economies of pre-modern East and South Asia.
Notice The material presented in the EHES Working Paper Series is property of the author(s) and should be quoted as such.
The views expressed in this Paper are those of the author(s) and do not necessarily represent the views of the EHES or its members
Acknowledgements: We wish to recognize that Dr. Sarah Merette of LSE provided exemplary research assistance and several heuristic suggestions that are embodied in this paper. We also thank Professors Robert Allen, Leandro Prados De La Escosura and Patricia Hudson for their heuristic comments. * Kent Deng, Reader in the Economic History of China, London School of Economics ** Patrick Karl O’Brien, Professor of Global Economic History, London School of Economics

2
Abstract
Our article is a critical survey of the concepts, methods and date constructed and
utilized by scholars (particularly the late Angus Maddison) in order to provide
estimates for the measurement of relative levels and long term trends in the GDP per
capita for China from the Han Dynasty to modern times. We applaud the endeavour
but have reluctantly concluded that, even as conjectures, they are not fit for purpose.
Furthermore, our article suggests that the Kuznetsian paradigm in empirical
economics may not turn out to be viable for qualitative analysis of the long term
development of imperial economies of pre-modern East and South Asia.
1. Theoretical Ambiguities and Empirical Incongruities
In a sequence of widely cited books and articles the late Angus Maddison has
laudably endeavoured to relocate the history of economic growth for the Chinese
Empire from year one of the common era to our times upon a statistical basis. For
that purpose he utilized: (a) a contested series of official and revised estimates for
the empire’s population; (b) an unofficial estimate for gross domestic product in 1933
as a basis for backward and forward projections across the century 1890-1990; and
(c) several assumptions that has allowed him and his uncritical followers to
extrapolate insecure estimates of per capita income conceptualized and calibrated
for contemporary purposes and times all the way back to the Han dynasty (Maddison
2007 a). For historians dealing in “facts” the results are unconvincing. Nevertheless,
these numbers are instructive to confront particularly for economists and economic
historians whose agendas for research continue to be based upon the programme for
a quantified analysis of “modern” economic growth inaugurated by Simon Kuznets
(Kuznets 1966 and Fogel 2013). That programme, extended geographically to
include Asian economies by Colin Clark, Paul Bairoch, Leonard Zimmerman and
others, enjoys success for industrial, agricultural, regional and country studies of long
term growth where and when statistical information for both inputs (land, labour,
technologies, capital) and outputs (for national, agricultural, industrial and service
production) are available at a macro level and are reliable within the margins of error
tested and recognized as adequate for economic analyses of long run economic
change (Clark 1940; Bairoch 1981 and 1997; Zimmerman 1965). As Kuznets
anticipated these preconditions apply to just a small sample of countries that
3
collected statistics for the compilation of national accounts and/or compiled data that
could serve as proxies for such accounts for limited spans of time (Kuznets 1971).
In this paper we intend to argue that on both factual and conceptual grounds these
preconditions do not apply arguably for even modern times and certainly not any to
long run economic history for China (Deng 1999). Maddison’s attempts to construct
a statistical framework for a macro-economic analysis of the economic development
of that huge empire which was, and remains, a large component of the modern and
pre-modern global economy is (as a previous generation of Sinologists anticipated)
doomed to frustration (Eckstein 1968; Feuerwerker 1992). This has led to the
“manufacture” of proxies for data that is simply not there and which might well
represent nothing other than abstract and personal numerical derivations from
professional histories written on a basis (of traditional evidence) and for which
Jacques Derrida’s famous quote (“il n’y a plus hors du texte”) seems apposite
(Putnam 1988).
The Kuznets programme for careful quantification was designed to replace historical
narratives, dense description, unreliable and untypical numbers with national
accounts and not to transform the explicandum for an economic history of imperial
China into abstractions purporting to measure per capita income under the Han and
other dynasties in International Dollars of 1990 (Fogel 2013). Thus our view
elaborated below is that Maddison’s widely cited data purporting to cover nearly two
millennia of history, are not fit for the purpose of providing conceptually sound or
statistically secure estimates to facilitate first the measurement and then the
comprehension of long term trends for rates of growth let alone for a statistically
based representation of comparative levels of incomes per capita afforded to its
citizens by the Chinese economy as it and other economies evolved between the
Han dynasty and the end of China’s imperial regime in 1911. We open the argument
with Table 1, which problematizes his data (Columns 2 and 3) by converting it into
kilocalories and grams of fine silver (Columns 4-7).
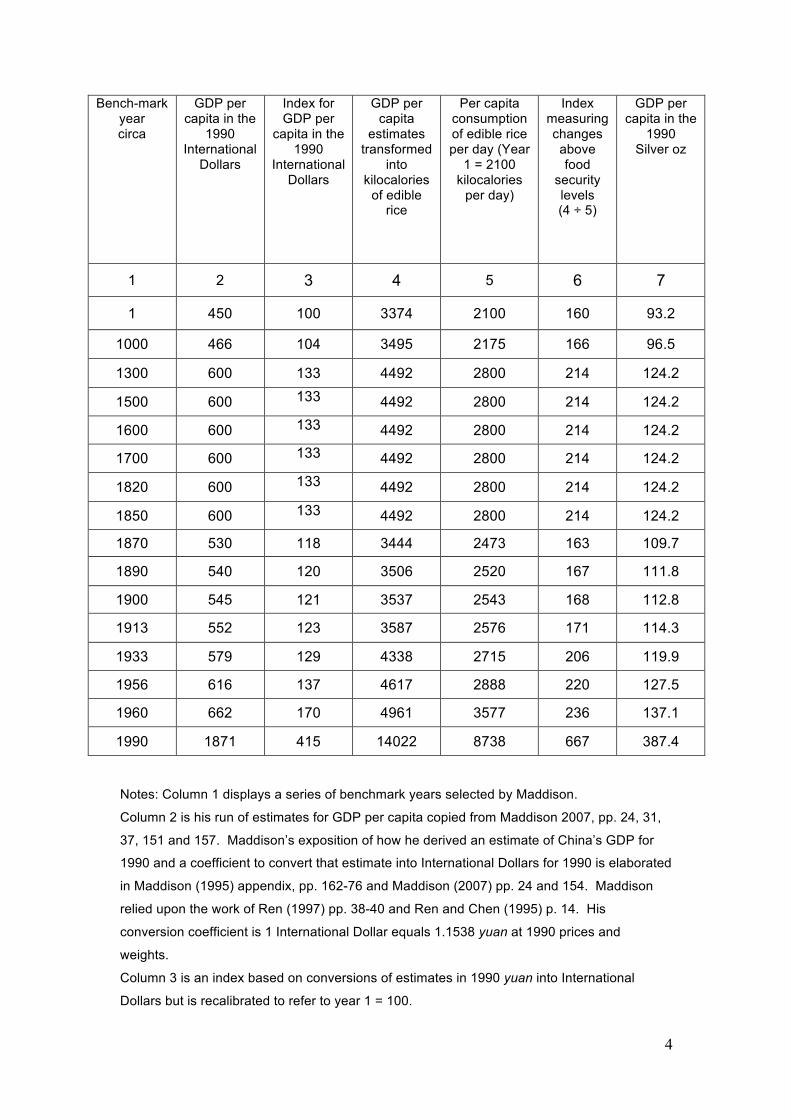
Table 1. Maddison’s Estimates for Long Run Trends and Relative Levels for GDP per
capita for the Chinese Empire for Bench Mark Years from Year 1 to 1990 Measured
in International Dollars and Recalibrated into Kilocalories of Nutrients per Capita and
Grams of Silver per Capita
4
Bench-mark year circa
GDP per capita in the
1990 International
Dollars
Index for GDP per
capita in the 1990
International Dollars
GDP per capita
estimates transformed
into kilocalories
of edible rice
Per capita consumption of edible rice per day (Year
1 = 2100 kilocalories
per day)
Index measuring changes above food
security levels (4 ÷ 5)
GDP per capita in the
1990 Silver oz
1 2 3 4 5 6 7
1 450 100 3374 2100 160 93.2
1000 466 104 3495 2175 166 96.5
1300 600 133 4492 2800 214 124.2
1500 600 133 4492 2800 214 124.2
1600 600 133 4492 2800 214 124.2
1700 600 133 4492 2800 214 124.2
1820 600 133 4492 2800 214 124.2
1850 600 133 4492 2800 214 124.2
1870 530 118 3444 2473 163 109.7
1890 540 120 3506 2520 167 111.8
1900 545 121 3537 2543 168 112.8
1913 552 123 3587 2576 171 114.3
1933 579 129 4338 2715 206 119.9
1956 616 137 4617 2888 220 127.5
1960 662 170 4961 3577 236 137.1
1990 1871 415 14022 8738 667 387.4
Notes: Column 1 displays a series of benchmark years selected by Maddison.
Column 2 is his run of estimates for GDP per capita copied from Maddison 2007, pp. 24, 31,
37, 151 and 157. Maddison’s exposition of how he derived an estimate of China’s GDP for
1990 and a coefficient to convert that estimate into International Dollars for 1990 is elaborated
in Maddison (1995) appendix, pp. 162-76 and Maddison (2007) pp. 24 and 154. Maddison
relied upon the work of Ren (1997) pp. 38-40 and Ren and Chen (1995) p. 14. His
conversion coefficient is 1 International Dollar equals 1.1538 yuan at 1990 prices and
weights.
Column 3 is an index based on conversions of estimates in 1990 yuan into International
Dollars but is recalibrated to refer to year 1 = 100.
5
Column 4 is Columns 2 divided by the official price per kilogramme of edible rice for 1990
(0.0648 yuan per kilo) and converted into kilocalories using methods and coefficients
prescribed by FAO (2002) as elaborated in NIIR Project Consultancy Services, 2012.
Column 5 selects the modern FAO level for “food security” (2100 kilocalories per day) as
conjecture for the average level enjoyed by the population of China under the Han Dynasty in
year 1 and extrapolates that level forward to 1990 utilizing the rates of growth postulated by
Maddison in Column 3.
Column 6 quantifies changes in the levels above food security as implied by Maddison’s
estimates for per capita incomes in 1990 International Dollars.
Column 7 is ounces of silver at 1990 prices in yuan. [Silver implied for the value of Chinese
GDP per capita in Column 2].
In Table 1, Maddison’s estimates expressed in International Dollars for the base year
of 1990 have been converted into their implied equivalents in kilocalories and grams
of fine silver in order to expose how problematic they might be. For example,
Column 4 converts Chinese per capita income as measured in yuan for 1990 into
kilograms of edible rice at its official current price of 0.648 yuan per kilogram and
transforms that number into kilocalories per capita per day using FAO conversion
coefficients (FAO 2002; NIIR Project Consultancy Services 2012). The conversion
for 1990, namely 14022 kilocalories per capita per day, has been extrapolated
backwards at rates of growth constructed by Maddison for his series expressed in
International Dollars for 1990 to represent changes in per capita income over nearly
2 millennia of Chinese history (Column 2). Our calibration (vide Column 4) which
displays the same trend (Column 3) through time could be plausibly interpreted to
show possible variations in levels of kilocalories available to the Chinese population
through better (1300-1850) and worse (1850-1963) times for the welfare of the
Chinese population. Furthermore, our estimates denominated in kilocalories can be
used to support an impression (Columns 4, 5 and 6) that for nearly two millennia of
imperial history the economy possessed the capacity to sustain the expanding
population of the Chinese empire at levels of nutrition discernibly higher than
standards of 2100 kilocalories a day (Column 5) proscribed by modern physiological
sciences and the FAO as necessary (compare with Column 4) for food security.
Furthermore, these levels in kilocalories derived from Maddison’s figures suggest
that for centuries before 1850 the population of imperial China enjoyed standards of
nutrition that were clearly and discernibly superior to anything afforded by most
national economies of Europe for its populations living below the upper percentiles of
income distributions (Column 6, as compared with data for England in Deng and
O’Brien forthcoming 2015; Muldrew 2011; Meredith and Oxley 2013).

6
Another sensitivity test that we applied to Maddison’s numbers that displays trends in
Chinese per capita incomes transforms his numeraire (1990 International Dollars)
into ounces of fine silver at a conversion rate of $4.83 per ounce (conversion rates
for silver into US dollars and RMB yuan are recorded in DUHP:
www.silver.institute.org/site/silver-visa.com/news/usa/332/). This number was then
extrapolated backwards (deploying the index in Column 3) through the years
benchmarked in Column 1 to produce the series reported in Column 7. The possible
meaning and plausibility for this series of numbers expressed in grams of fine silver
converted into yuan at the 1990 exchange rate could be exposed in several ways.
One, in kilogrammes of edible rice at 1990 prices produces absurd results. Another,
which converts grams of silver into silver taels – China’s official currency under the
Qing dynasty and compares the results with nominal daily wage rates for which
independent historical evidence for the years 1728-92 has been recently published in
a special issue of the Economic History Review (Broadberry and Hindle 2011).
According to this widely cited paper by Allen et al, nominal daily wage rates for
unskilled labour employed in the cities of Beijing, Suzhou and Canton over the period
1728-92 amounted to an average of 0.01 silver taels per capita per day for a labourer
supporting a wife and three children (Allen et al 2011). For that period Maddison’s
implied estimate of 124.4 ounces of silver per capita per annum (Column 7, Table 1)
converts into a far higher average per capita value of 1.26 taels per capita per day.
Either the figure published by Allen et al for wage dependant workers is far too low or
Maddison’s estimates, when translated into silver taels, seem far too high. Of
course, the purchasing power of fine silver changed over two centuries of time and
Maddison’s estimates for 1728-92 refer to its value in 1990 prices. Furthermore,
there is no reason to suppose that the income from wages available to an unskilled
labourer and his family for 1728-92 would be highly correlated with per capita
incomes for that same period. Nevertheless, these estimates seem prima to be too
far apart to be reconciled with each other or with other published figures for real GDP
per capita in taels per head (Liu 2009, p. 155).
Thus in different ways and for varying degrees crude sensitivity tests expressed in
kilocalories and silver reveal the potential ambiguities and inconsistencies embodied
in Maddison’s laudable endeavours to construct a series of estimates for GDP per
capita for the Chinese empire covering two millennia of time expressed in a
numeraire (International Dollars at 1990 prices and weights). Yet Maddison’s data is
both transparent and enticing. It promises nothing less than the statistics required to
7
both quantify trends and relative levels of well-being provided by the imperial
economy for the population of China. Unfortunately the numbers, for reasons we will
now proceed to elaborate, are insecure and will be represented as a thought
provoking but unconvincing exercise in quantification.
2. Bench Mark Estimates and Indices in 1990 International Dollars
Economic historians are certainly interested in measuring in the long run economic
growth achieved by the Chinese Empire between the times of the Western Han
Dynasty (206 BCE – 25 CE) to the end of dynastic rule under the Qing (1644-1911).
Currently they are particularly concerned to locate a chronology for divergence when
the empires rates and levels of economic development fell behind those of Western
Europe (Pomeranz 2000).
Maddison’s series of numbers for China’s GDP per capita have been constructed by
way of a backward extrapolation for 1990-1870 and a forward extrapolation for the
years 1-1870. The two series are linked together by conversion into a common and
ostensibly comparable numeraire namely, International Dollars that have been
designed and calibrated to represent the international purchasing power parity of the
yuan for the year 1990 (Maddison 1995a, pp. 162-78, and 2007b, p. 154).
For the first series Maddison apparently applied a single conversion coefficient to
official and revised estimates for China’s GDP for the years 1990, 1960 and 1956
and to an estimate for 1933 expressed in prices and yuan for that year published by
two Chinese economists Liu and Yeh in 1965 (Liu and Yeh 1965). He did not use the
estimate published in 2007 for 1934-36 based upon a recalibrated purchasing power
parity exchange rate for the mid 1930s which raised his estimate for China compared
to the United States by 10% (Fukao et al 2007). With his estimate in 1990
International Dollars for 1933 in place Maddison then deployed a series of sectoral
growth rates computed and published by three economists (Perkins, Rawski and
Wang) to produce an overall rate of growth for GDP per capita from 1913-33
(Maddison 1995, pp. 145 and 195). He then asserted that this estimated growth rate
could be applied to the “years of recovery” from internal disorder and international
warfare 1870-1912 (Maddison and Wu 2008).
Maddison claimed that the procedures he deployed to manipulate this limited range
of imperfect data could generate acceptable proxies for trends in the rates of change
8
in GDP per capita at constant (1990) prices between 1870 and 1990. Furthermore,
and because estimates originally compiled in yuan at current prices had been
converted into dollars at international prices for 1990 these numbers could also in
Maddison’s view be compared with all other economies whose currencies could be
converted directly or indirectly into the same numeraire (Fukao et al 2007). As
historians endeavouring to locate a chronology for economic divergence between
China and Europe the period 1870 to 1990 is not our primary concern. We simply
note that the benchmark figures cited for that century or so in Table 1 are the product
of backward extrapolations, depend upon revisions to official estimates for GDP for
1990, 1960, 1956; on an estimate constructed as best they could by two economists
for 1933 and rely upon an averaged annual growth rate for 1870-1912 that is
assumed to be the same as the constructed rate for 1913-33 (Maddison 2007b, pp.
156, 157; Maddison 1995, pp. 194, 195; and Maddison and Wu 2008, pp. 13-44)
Although Maddison was undoubtedly aware that when numbers representing base or
end years are compounded they cumulate (over long periods of time) into large
magnitudes, when presenting data for China that departed from established
standards for statistical veracity he rarely included sensitivity tests. He anticipated
that the publication of negotiable numbers would stimulate other academics to revise
and correct them. He cannot be faulted for an outcome that has now become a
sustained and uncritical use of data that he made accessible as evidence for
econometric tests, historical analyses, statistical mapping of the history of the world
economy and academic controversy? His work will, and should, continue to be
recognized as a pioneering stimulus for programmes of research designed to
construct national accounts for historical periods when states did not support
institutions to measure national incomes (Henderson 2010).
Nevertheless, Maddison was certainly very well informed and had been cogently
reminded by Leandro Prados De La Escosura about the properties of index numbers
and how sensitive all calibrations of purchasing power parities are to a specific period
of time. We add they are also sensitive to the range and quality of the data required
to convert Chinese yuan and other national currencies into some kind of universal
numeraire for purposes of conducting comparisons across countries and over spans
of years (Prados De La Escosura 2000). Recently, critics of the methods, statistics
and inferences derived from several rounds of data collection designed, managed
and funded by the world bank and other international organisations to provide
purchasing power parities for the worlds currencies have exposed both their heuristic

9
and tightly contextualized validity as well as the fragility of the extant range of
published purchasing power parity rates of exchange currently available for the
conversion of currencies (particularly the yuan) into either American or International
Dollars (World Bank 2008).
That literature has certainly exposed basic and unavoidable critiques of the
inferences and conclusions that continue to be drawn from Maddison’s data.
Criticism falls into two categories: (a) those that pertain to the meaning specification
and measurement of Gross Domestic Products (GDP); and (b) standard index
number problems embodied in projections from singular and more or less accurate
estimates for GDP expressed in this case in 1990 International Dollars that purport to
refer by way of backward and forward extrapolation to more than a century before
1990 and audaciously (as we will argue in section 3) to nearly two millennia of
Chinese economic history moving forward from Han times.
There will be no need to survey widely accepted critiques even to standardized and
carefully measured accounts of GDP as the internationally accepted indicator for any
national economy’s potential for the production of commodities and services and
often extended to its relative success in providing security, social welfare and
desirable levels of private consumption for its citizens (Abramovitz 1959; Prados
2013; Korzeniewicz et al 2004). That has been very well done by a recent article in
the Journal of Global History (Jerven 2012). If, when and wherever it can be
measured GDP retains its place as the basis and starting point for macro-economic
analysis of long run economic growth. Nevertheless, we should add a familiar point,
namely, that the accounts and data published by the Peoples’ Republic of China for
GDP for, household expenditures and average nationwide quotations for the
domestic prices of goods and services is of low quality, the subject of persistent
controversy and revisions that are frequently updated and presumably improved
(Holz 2006; Feenstra 2009)? For example Maddison and his co-author Wu have
claimed that China’s rate of growth for 1978-2003 should be revised downwards from
9.3% accepted by the World Bank to 7.9% (Maddison and Wu 2008, pp. 13-44).
While Ren’s reconstituted estimates for 1986, utilized by Maddison to reformulate his
GDP estimate for 1990, have been described as “badly out of date” (Dekhanov and
Swansen 2010, p. 200). Latterly the Chinese state is, however, engaged in
improving and standardizing the low quality of current official statistics which signals
the need to revise previous estimates utilized for historical analysis (Heston 2010, pp.
3-31).
10
What has recently been clarified as a deeply flawed procedure is Maddison’s own
methodology utilized for the statistical mapping of long term trends and which has
generated estimates for China’s GDP and GDP per capita by way of two
extrapolations that are both consistently and ambiguously denominated in
International Dollars connected to purchasing parities that serve to align a series of
numbers to constant relative prices for 1990 and to Year 1 as a reference year for the
representation of trends over two millennia of time.
Conceptually, purchasing power parities are not difficult to comprehend because they
embody the potentially quantifiable notion of precisely what a given amount of goods
and services valued in one national currency could cost to purchase in the currency
of another country (Sarno and Taylor 2002; World Bank 2008). Clearly, the answer
depends upon the specification and exact measurement of the quantities of goods
and services under consideration and their averaged prices at particular places and
times in the countries or cities being compared as well as a range of other factors
explored in depth and theoretical sophistication by economists interested in
explaining their connexions to trading rates of exchange (Rogoff 1996, pp. 647-68;
Prados de la Escosura 2000, pp. 1-41). For example, if a typical family resident in
Shanghai spent 50,000 yuan on goods and services in 1990 and an identical basket
of goods and services would have cost them US$5000 in New York, the command
over goods and services exercised by a modal Shanghai family in 1990 can be
expressed as a purchasing power parity equivalent to ten yuan equals one US$.
Binary parities are easy enough to calculate for micro units (families) living, working
and consuming in geographically confined spaces and comparable cultures such as
Shanghai and New York who purchase a similar range of goods and services over a
given year. When it comes to the calculation of parities that aim to refer to the entire
range of goods and services produced by the economies and consumed by the
citizens of China and the United States the volume and complexity of the calibrations
required to construct purchasing power parities for macro economic comparisons of
private consumption, investment, governmental services and other additive
components of GDP multiplies exponentially (Deaton and Heston 2010; and World
Bank 2013).
Nevertheless, several exercises have been conducted under the auspices of
international organizations to cover an increasing number of national economies at
levels of conceptual sophistication and statistical accuracy that have improved
11
significantly since their emergence in the 1950s (World Bank 2008). By 1970 the
construction of parities had moved on from binary comparisons of purchasing power
to embrace the more abstract concept of an international (Geary-Khamis) dollar
designed and redesigned to construct a conversion coefficient to transform any one
national currency into all other national currencies (Asian Development Bank 2007).
Simply put and for purposes of cross country comparisons, that parity would ideally
embody a nationally weighted set of prices expressed in a transnational numeraire
(dollars) that refers to a particular benchmark year and would somehow cover the
largest possible range of diverse goods and services produced and/or consumed by
each and every economy in the world – or more realistically for the sample of
countries who opted to participate in these international statistical exercises, which
are designed to measure the global value of all national currencies. Thus a world
average price in dollars for any specified commodity or service (or aggregations of
commodities and services produced and consumed in this “composite” or “proto-
world economy”) would be the sum of the calculated weighted average national
prices expressed in American dollars for a large and ostensibly representative
sample of commodities and services produced by particular national economies
divided by the number of countries included in samples that have increased to over
the years to become almost global in their reach and scope (Deaton and Heston
2010).
Clearly demands upon the statistical offices of governments and on international
organisations calibrating national data into purchasing power parities to collect,
match-up and find proxies for missing and low quality official statistics are enormous.
China did not participate in any of these exercises before 1993. Meanwhile the
extraordinary variance in prices across the peoples republic and between its cities
and rural areas persisted (Ward 2004). These factors remain along with the
contested estimates for that huge and complex economy’s national accounts lend
strong support to the stance of scepticism towards Maddison’s and similar estimates
that depend on purchasing power parities constructed before 2005 which have been
used to convert revised official estimates, surveys of household expenditures, and
averaged “nationwide” prices into International Dollars for 1990 (de Jong and van Ark
2012, pp. 1-20). Those and older estimates expressed in that same numeraire are
now being confronted with the reformed methods and an altogether larger and more
reliable data base (for 146 countries) utilized to construct the purchasing power
parities for cross country comparisons in International Dollars for years after and by
implication before the construction of parities for 2005 (World Bank 2013; de Jong

12
and van Ark 2012). The magnitudes of the revisions contemplated and discussed for
the currencies for several economies are really significant. This became obvious for
India and China because the estimates for both absolute and relative levels of their
gross domestic products per capita expressed in International Dollars declined
abruptly by more than 40% on the revised parities published for 2005.
In general the statistical reasons behind these recent and by implication historical
revisions in levels of GDP denominated in International Dollars are well understood.
The quality of Chinese and Indian statistics has improved. Not only has the urban
bias in averaged prices been recognized but prices have been more carefully aligned
with the qualities of the goods and especially the services produced and purchased
in China, India and other developing countries (Heston 2010; World Bank 2013).
Finally, it is of paramount importance to observe that augmenting the number, range
and structures of economies included in a matrix and process for calibration
designed to generate weighted average prices for a greater diversity of commodities
and services produced across an enlarged sample will effect parities not only for
referenced years but fluctuations in relative prices will alter parities for years between
benchmarked years (World Bank 2013). For example, China’s GDP “bounced back”
when it was converted into International Dollars on the latest PPP for 199 countries in
2011 (vide Economist, 03 May 2013). These changes in the parity of the yuan will
depend not only upon variations in production, prices and wages within China but
variations in all countries included in the sample (Ravallion 2010). More generally the
major and known point exposed by the 2005 exercise is an acceptance of a bias
embodied in the process of constructing otherwise heuristic and transitive purchasing
power parity rates of exchange (Diewert 2010, pp. 11-13). Those involved with these
exercises for the construction of “international” prices for commodities and especially
for services recognise that their procedures maximize the weights accorded for both
the prices and volumes of commodities and services consumed by the populations of
larger and richer countries. They warn of a systematic tendency to inflate the
significance of non- traded commodities, particularly local services produced and
consumed by the world’s poorest nations. Thus the dramatic downward revisions in
per capita incomes expressed in International Dollars for China, India and other
developing countries can be plausibly represented as: a “big” step in a more realistic
direction for estimates that purport to measure both relative levels and rates of
growth for Asian and African economies over restricted time spans for the twentieth
century (World Bank 2013). Conversely, for several developed economies,
especially Germany and the United States, growth measured in both domestic and
13
international prices seems to have been understated (Brümmerhoff and Grömling
2012).
Historians fastidious about facts have grappled with discussions among economists
and statisticians concerned with the complexities of measuring levels and rates of
growth in International Dollars over the last four decades, particularly for China and
other developing economies. They could only conclude that a secure base or
reference year for purposes of backward extrapolation extended through time has yet
to be constructed. One may emerge from the data sets collected and recalibrated on
a new basis for 2005 and 2011 (Deaton and Heston 2010; Diewert 2010).
Meanwhile only limited confidence could be reposed in historical estimates for China
in 1990 International Dollars and (as we will argue) even less credence could be
placed in the sequence of numbers purporting to represent both levels and rates
economic growth of China for centuries before that year (Crowshore 2011). Our
scepticism must, moreover, be reinforced by the following quotation from two
economists Angus Deaton and Alan Heston who have been closely engaged with the
design of a conceptual framework and the manipulations of data required to construct
purchasing power parities for our times. “One general rule is that comparisons
become less reliable the further apart are the structures of GDP (or its components)
of the countries being compared.” And they add, “this is essentially the same as the
increasing unreliability of long run historical comparisons, the further back we go.”
(Deaton and Heston 2010, p. 4). Our sensitivity tests in Table 1, together with
critiques of the methods and sources used by Maddison to produce a statistical map
for the economic history of China, supports their perception “that many of these
numbers” (which continue to find their way into global economic history) “have
substantial uncertainty and that extrapolations over long periods can easily lead to
results that make no sense” (Deaton and Heston 2010, p. 33).
Uncertainty already surrounds Maddison’s figures for 1913, 1900, 1890 and 1870 as
tabulated in Table 1. This is so because the price indices used for the measurement
of growth rates in constant prices are domestic prices embodied in a GDP deflator,
cost of living index or consumer price index (CPI). Deflation has not been conducted
with an index based upon international prices. Since International Dollars were
designed to allow for cross sectional comparisons at different points in time
consistency would seem to require that changes in China’s GDP from 1810 or 1890
to 1990 could only be constructed in prices that move in tandem with annual
fluctuations and trends in the international purchasing power parity of the yuan. For
14
the years 1870 to 1990 Maddison’s estimates for levels of GDP are derived from
growth rates. Those rates embody questionable estimates for GDP deflated by
imperfect indices for changes to the levels of Chinese prices. They do not reflect
changes in the parity of the yuan. They can be read as an undefined and ambiguous
hybrid of changing domestic and constant set of 1990 international prices (Johnson
et al 2009, pp. 3 and 20; Crowshore 2011).
3. Poverty Lines, Base Years and Extrapolators for the Measurement of
China’s Economic Growth from the Western Han to the Qing Dynasties
Equally problematical for the measurement of very long run growth and the location
of a chronology for divergence is the reference year estimate that Maddison selected
to represent the per capita income for an average Chinese living under the Western
Han Dynasty around Year 1. Maddison postulated that this typical individual
disposed of an annual amount of purchasing power that was equivalent to that
commanded by her/his modern day counterpart, living on an income definable as
poverty, namely 450 International Dollars at 1990 prices. This basic number has
been derived from controversial and ongoing attempts by economists employed by
the World Bank to construct a metric for a notional and universal poverty line or
subsistence income for samples of third world societies (Ravallion et al 1998, 2004
and 2008). Famously the Bank’s figure for 1985 was set at US$1 per day and
revised upwards to US$1.25 a day or US$456 for 2005. That concept and its
conjoined metric have come under sustained and convincing theoretical and
empirical attacks (Ravallion 2009; Stiglitz 2010; and Allen 2013).
Maddison has not, it appears, clarified or justified his selection of 450 International
Dollars for Year 1 as a plausible representation of a poverty line or subsistence
income measured in International Dollars for 1990 (Federicko 2002, p. 6).
Furthermore, the figure selected by Maddison as a proxy for per capita income in
Han times will not convert or extrapolate into anything comparable to the annual
amounts in yuan designated by the modern Chinese state to represent poverty lines
or subsistence incomes for its rural or urban poor (Ravallion et al 2001; Allen, 2013).
Prima facie a level of 60% above the level postulated as sufficient for food security
looks implausibly high (vide Table 1). It is, moreover, unlikely to be rendered more
plausible by unquantifiable surpluses appropriated from GDP by high, unrealistic and
historically implausible impressions of income inequality under the Han dynasty
(Wang 2007, pp. 162-74, 278-99).
15
In short, serious doubts surround attempts to transform and transpose a metric
designed for the measurement of global poverty and / or subsistence in our own
times into proxies for GDP per capita in the very remote past (Alam 2006; Allen
2013). Maddison did not confront the complexities involved in constructing and
pricing a basket of goods consumed by the poor across the world for modern times
(Deaton 2010). Instead he assumed that the populations of the Chinese empire,
before the era of the Sung (or Song) Dynasty, lived at a standard of living that could
be captured and proxied by a highly controversial modern metric of 450 International
Dollars (Stiglitz 2010; Allen 2013).
Apart from serious theoretical rejections to a numeraire based on 1990 International
Dollars and the whole notion of international poverty, long cycles in the growth of
population and output are ignored by Maddison’s data for GDP which suggests (vide
Table 1) that almost no change occurred for over a millennium before the advent of
the Sung. According to some contested statistics for population totals, the production
of iron and urbanization ratios as well as the consensual views of historians of
medieval China under the Sung dynasty, the imperial economy experienced an
“efflorescence” that carried per capita incomes up to a significantly higher level (Deng
2013). Maddison asserted that this uplift amounted to an order of magnitude of
approximately 33% over more than three centuries of time. So much for an eminent
Sinologist’s considered view that “One of the most dramatic cycles of economic
development and decline in all Asian history occurred in North China between the
eighth and thirteenth centuries” (Skinner 1985). Thereafter, Maddison posited that
the Chinese economy “suffered setbacks under the Yuan” (Mongol Dynasty) from
which (so his numbers suggest) it recovered and thereafter experienced some 350
years of stasis followed by a century of fluctuations in incomes per capita around a
level that remained discernibly below the static level sustained from circa 1300 to
circa 1850. That level diverged sharply from levels attained by the economies of
Western Europe, North America and Australasia (vide Maddison 2007b, p. 43; 1998
and 2001, p. 264 for comparisons with Europe).
Maddison’s inferences drawn from a restricted range of reading from secondary
sources in Chinese history published in English and transposed into numerical
abstractions deserve to be quoted in his own words. “I assume growth per capita
income under the Song was substantial” ([i.e.] “it grew by about a third”) but [was]
“slower in pace than Europe achieved in the proto-capitalist period 1400-1820”. I

16
assume that per capita income peaked in the Song … [when] “there is good reason
to believe Europe had fallen substantially below Chinese levels”, [A] “temporary
setback” [occurred] under the Yuan but over the long run in the Ming-Ch’ing
dynasties per capita performance was roughly stable.” This bold summary, covering
centuries of Chinese economic history, could hardly become consensual among
experts for a field that is distinguished by the most impressive historiographical
tradition for research and debate for any Asian country.
On the contrary, a considerable number of Chinese historians have suggested that
the Ming-Qing Period was one of steady performance in economic growth despite the
onset of a ‘Little Ice Age’ (Zhang 1996; Man 2009). Supplies of arable land remained
elastic until the late Qing (Deng 2011, pp. 19-20). During this period, the double-
cropping of rice was introduced to the south of the Yangzi River on a noticeable scale
for the first time in China’s history (Chao 1986, p. 199; Cheng 1992, pp. 98–101;
Liang 2006, p. 117). A real push for the new cropping practices came directly from
the Kangxi Emperor in the form of a well-publicised five-year experiment (1715–20)
conducted on a model rice farm of 100 mu in south Jiangsu. The experiment
achieved an average 47% increase in output per unit of land (Zhang 1996, p. 412).
This led to the yield plateau that prevailed for the rest of the Qing period (Shi 2012, p.
56). Even so, according to Liu, yield levels in the Lower Yangzi Region had increased
by a factor of 2–2.5 by 1850 from their Song levels. In some places, they had risen
by a factor of 5 (Liu 2013, pp. 104, 106). Farming tools improved (Yin and Hui 2012).
These yields were simply unobtainable before 1700 and the traditional view that
double-cropping of rice began with Champa Rice introduced in the early Song is no
longer tenable (Deng 2013; Liu 2013, p. 104). Finally, Chinese economic historians
agree that commercialized household cotton textile production took off during the
Ming Period (Xu 1989; Fan 2008; Wu 2009).
Maddison recognised that complementary historical statistics to bolster his numbers
for GPD that could also serve to represent the economic performance of the Chinese
Empire under the Ming and Qing dynasties (1368-1911) would as one of stasis might
carry conviction. He found support for his perceptions in the quantified conclusions
based upon the historical research and analysis conducted by two distinguished
American sinologists and social scientists, Dwight Perkins of Harvard and Gilbert
Rozman of Princeton. Rozman concluded that there had been little change in the
proportion of the population living in towns from the Tang to Qing dynasties
(Maddison 1995 and 2007b, pp. 10, 24, 31, 37, 151; Rozman 1973). Perkins wrote a
17
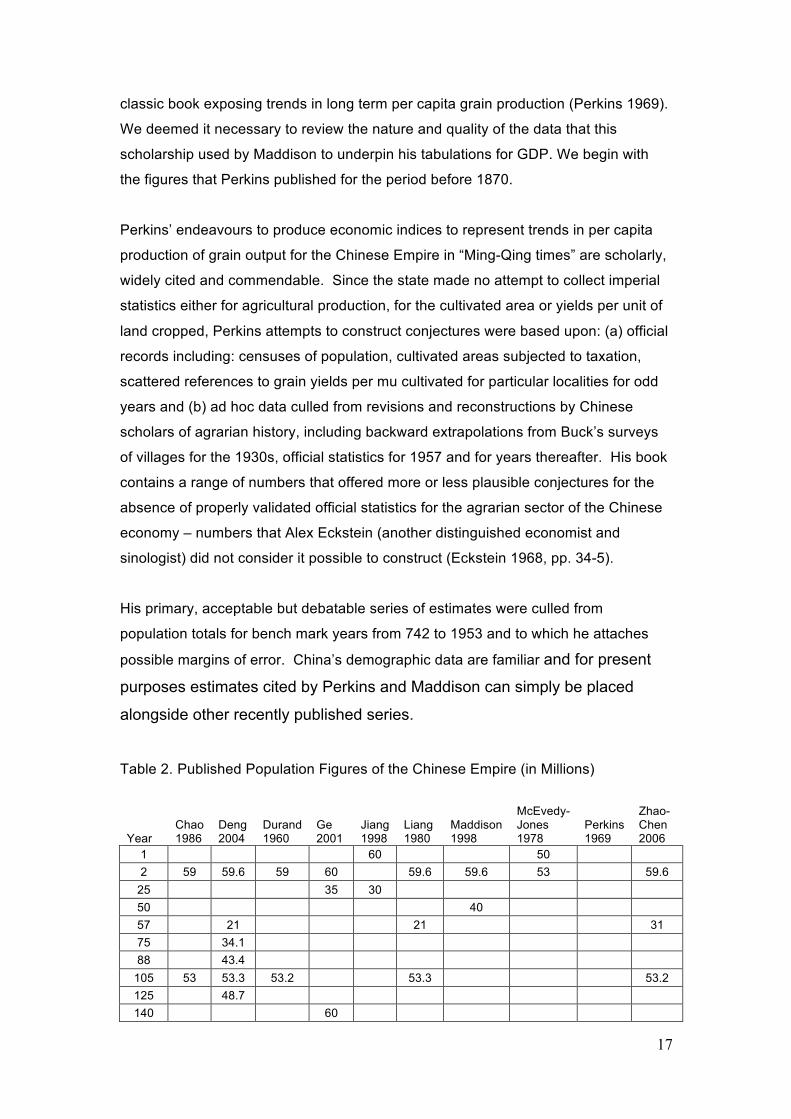
classic book exposing trends in long term per capita grain production (Perkins 1969).
We deemed it necessary to review the nature and quality of the data that this
scholarship used by Maddison to underpin his tabulations for GDP. We begin with
the figures that Perkins published for the period before 1870.
Perkins’ endeavours to produce economic indices to represent trends in per capita
production of grain output for the Chinese Empire in “Ming-Qing times” are scholarly,
widely cited and commendable. Since the state made no attempt to collect imperial
statistics either for agricultural production, for the cultivated area or yields per unit of
land cropped, Perkins attempts to construct conjectures were based upon: (a) official
records including: censuses of population, cultivated areas subjected to taxation,
scattered references to grain yields per mu cultivated for particular localities for odd
years and (b) ad hoc data culled from revisions and reconstructions by Chinese
scholars of agrarian history, including backward extrapolations from Buck’s surveys
of villages for the 1930s, official statistics for 1957 and for years thereafter. His book
contains a range of numbers that offered more or less plausible conjectures for the
absence of properly validated official statistics for the agrarian sector of the Chinese
economy – numbers that Alex Eckstein (another distinguished economist and
sinologist) did not consider it possible to construct (Eckstein 1968, pp. 34-5).
His primary, acceptable but debatable series of estimates were culled from
population totals for bench mark years from 742 to 1953 and to which he attaches
possible margins of error. China’s demographic data are familiar and for present
purposes estimates cited by Perkins and Maddison can simply be placed
alongside other recently published series.
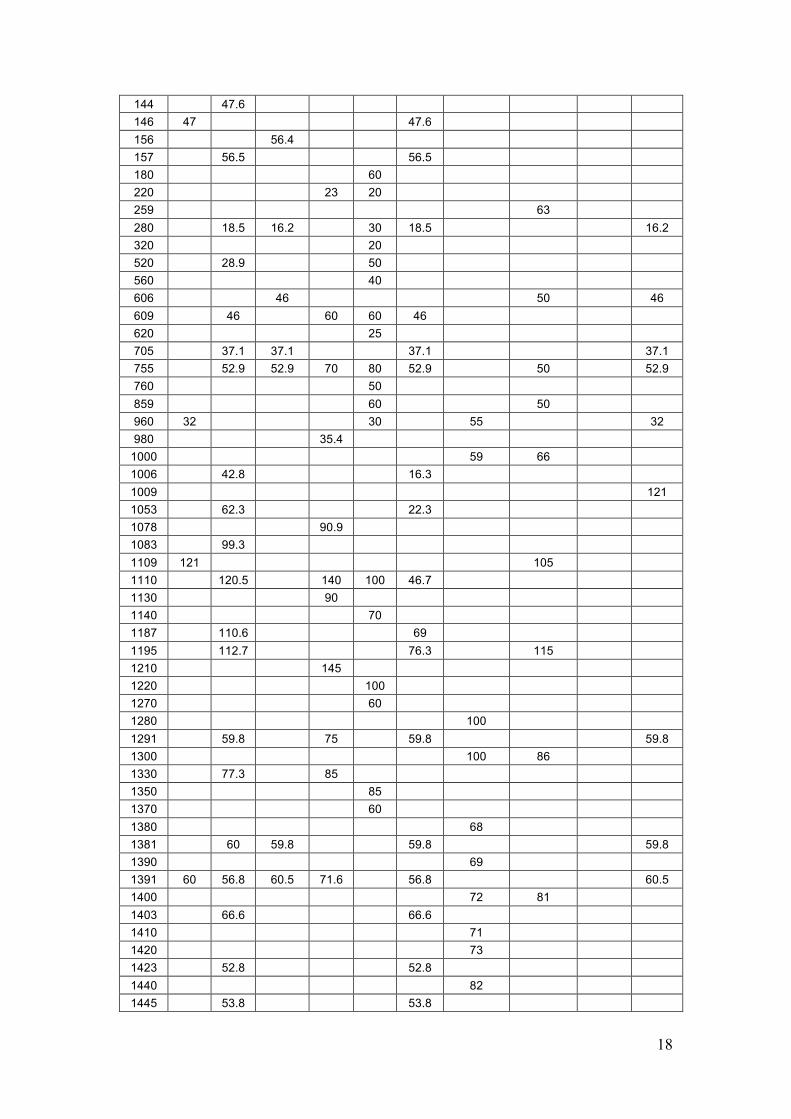
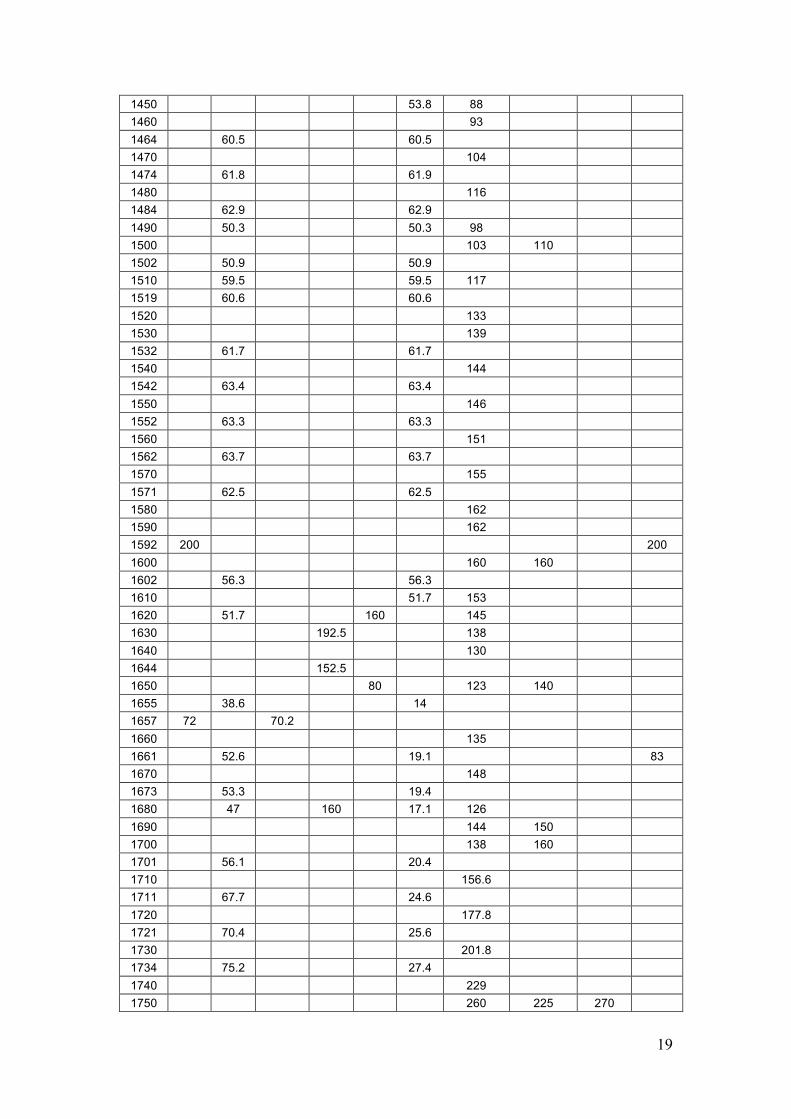
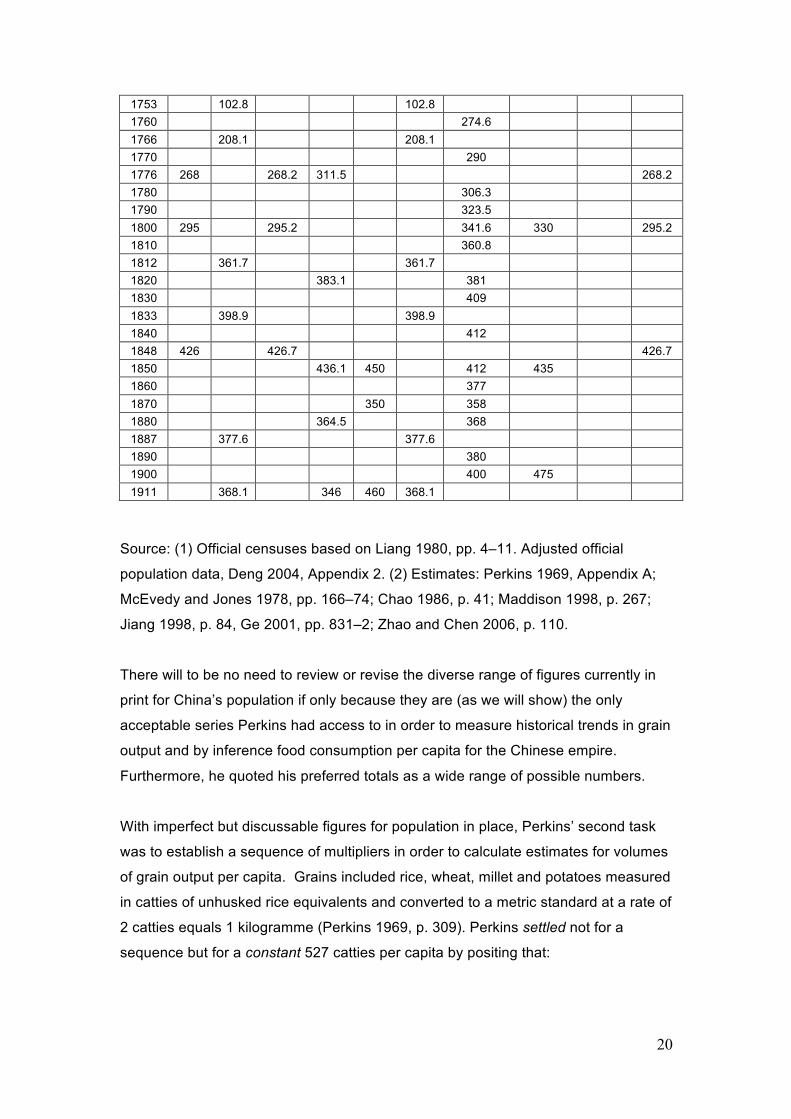
Table 2. Published Population Figures of the Chinese Empire (in Millions)
Year Chao 1986
Deng 2004
Durand 1960
Ge 2001
Jiang 1998
Liang 1980
Maddison 1998
McEvedy-Jones 1978
Perkins 1969
Zhao-Chen 2006
1 60 50 2 59 59.6 59 60 59.6 59.6 53 59.6
25 35 30 50 40 57 21 21 31 75 34.1 88 43.4
105 53 53.3 53.2 53.3 53.2 125 48.7 140 60
18
144 47.6 146 47 47.6 156 56.4 157 56.5 56.5 180 60 220 23 20 259 63 280 18.5 16.2 30 18.5 16.2 320 20 520 28.9 50 560 40 606 46 50 46 609 46 60 60 46 620 25 705 37.1 37.1 37.1 37.1 755 52.9 52.9 70 80 52.9 50 52.9 760 50 859 60 50 960 32 30 55 32 980 35.4
1000 59 66 1006 42.8 16.3 1009 121 1053 62.3 22.3 1078 90.9 1083 99.3 1109 121 105 1110 120.5 140 100 46.7 1130 90 1140 70 1187 110.6 69 1195 112.7 76.3 115 1210 145 1220 100 1270 60 1280 100 1291 59.8 75 59.8 59.8 1300 100 86 1330 77.3 85 1350 85 1370 60 1380 68 1381 60 59.8 59.8 59.8 1390 69 1391 60 56.8 60.5 71.6 56.8 60.5 1400 72 81 1403 66.6 66.6 1410 71 1420 73 1423 52.8 52.8 1440 82 1445 53.8 53.8
19
1450 53.8 88 1460 93 1464 60.5 60.5 1470 104 1474 61.8 61.9 1480 116 1484 62.9 62.9 1490 50.3 50.3 98 1500 103 110 1502 50.9 50.9 1510 59.5 59.5 117 1519 60.6 60.6 1520 133 1530 139 1532 61.7 61.7 1540 144 1542 63.4 63.4 1550 146 1552 63.3 63.3 1560 151 1562 63.7 63.7 1570 155 1571 62.5 62.5 1580 162 1590 162 1592 200 200 1600 160 160 1602 56.3 56.3 1610 51.7 153 1620 51.7 160 145 1630 192.5 138 1640 130 1644 152.5 1650 80 123 140 1655 38.6 14 1657 72 70.2 1660 135 1661 52.6 19.1 83 1670 148 1673 53.3 19.4 1680 47 160 17.1 126 1690 144 150 1700 138 160 1701 56.1 20.4 1710 156.6 1711 67.7 24.6 1720 177.8 1721 70.4 25.6 1730 201.8 1734 75.2 27.4 1740 229 1750 260 225 270
20
1753 102.8 102.8 1760 274.6 1766 208.1 208.1 1770 290 1776 268 268.2 311.5 268.2 1780 306.3 1790 323.5 1800 295 295.2 341.6 330 295.2 1810 360.8 1812 361.7 361.7 1820 383.1 381 1830 409 1833 398.9 398.9 1840 412 1848 426 426.7 426.7 1850 436.1 450 412 435 1860 377 1870 350 358 1880 364.5 368 1887 377.6 377.6 1890 380 1900 400 475 1911 368.1 346 460 368.1
Source: (1) Official censuses based on Liang 1980, pp. 4–11. Adjusted official
population data, Deng 2004, Appendix 2. (2) Estimates: Perkins 1969, Appendix A;
McEvedy and Jones 1978, pp. 166–74; Chao 1986, p. 41; Maddison 1998, p. 267;
Jiang 1998, p. 84, Ge 2001, pp. 831–2; Zhao and Chen 2006, p. 110.
There will to be no need to review or revise the diverse range of figures currently in
print for China’s population if only because they are (as we will show) the only
acceptable series Perkins had access to in order to measure historical trends in grain
output and by inference food consumption per capita for the Chinese empire.
Furthermore, he quoted his preferred totals as a wide range of possible numbers.
With imperfect but discussable figures for population in place, Perkins’ second task
was to establish a sequence of multipliers in order to calculate estimates for volumes
of grain output per capita. Grains included rice, wheat, millet and potatoes measured
in catties of unhusked rice equivalents and converted to a metric standard at a rate of
2 catties equals 1 kilogramme (Perkins 1969, p. 309). Perkins settled not for a
sequence but for a constant 527 catties per capita by positing that:

21
a) Per capita grain output fluctuated if at all only within narrow limits:-
fluctuations in grain prices, an assertion that was not checked against price
data
b) Those limits were bounded by a subsistence level of 400 catties and an upper
limit of 700 catties per capita (Perkins 1969, pp. 14-15 and 297);
c) In Ming-Qing times (1368-1911) “less than 500 seems more likely than 600”;
d) The “130 villages or so surveyed by John Lossing Buck in the late 1930s the
estimates for fewer than 10 villages fall below 400 catties” (Perkins, pp. 15-
16).
In Chart F1, Perkins also cited 5 historical sources from Sung times to 1844 to claim
“it does seem clear that 3 shi (piculs, 600 catties) of husked rice represented typical
annual grain consumption”. 600 catties is equivalent to 300 kilogrammes of edible
rice but on p. 301 he confusingly states “both the Buck and provincial data indicate
that per capita grain availability seldom fell below 180-240 kilogrammes (unhusked)
during the twentieth century” (Perkins 1969, Appendix F).
Agrarian history for China is frustratingly resistant to quantification, not least because
the figures recorded for rice are expressed in volumes (shi) and weights (catties).
They are often not distinguished between husked and unhusked rice. One shi of
husked rice weighs 200 catties. In unhusked, inedible and coarse form a shi weighs
130 catties (Li 1998, p. xvii). Perkins’ consistently used a fixed multiplier of 572
catties (286 kilogrammes) of unhusked rice which he reduces by 50% to 286 catties
(143 kilogrammes) of husked rice (Perkins 1969, p. 309). Modern food science
utilized by the FAO and United States Department of Agriculture obtain their
coefficients for the conversion of unhusked to husked and edible rice by positing a
lower wastage rate than Perkins (32% instead of 50%) and transform a kilogramme
of husked rice into nutrients with an energy value of 3660 kilocalories a day (F.A.O.
2002; and U.S.D.A. 2010).
If Perkins is to be corrected by modern science his 572 catties of unhusked rice
translates into
0.68 (286 kg) (3660 kilocalories)
365
which transforms into 1950 kilocalories per capita per day, which comes close to
Buck’s estimate of 1823 kilocalories for the 1930’s (Buck 1937).
22
The multiplier selected by Perkins for purposes of providing an index of historical
trends in grain output per capita is above the level of 200 kilogrammes of unhusked
rice that Perkins (and Buck) defined for “subsistence” but is clearly below the level of
2100 kilocalories a day prescribed today by the FAO as necessary for “food security”
(F.A.O. 2002).
Interpreted in terms of standards recommended by modern nutritional science
Perkins’ estimates for per capita grain consumption imply that a majority (and
possibly a substantial majority) of the population of the Chinese Empire lived in
conditions at the edge of “food security” for more than half a millennium after 1400.
By implication for masses of Chinese, standards of living not only fell below that
precarious level in times of disorder and crisis (the years of takeover by Manchu
armies and the Taiping rebellion) but if Perkins’ speculations are plausible they
subsisted at that level for most years during Ming-Qing times.
Maddison’s numerical representation and interpretation of stasis is certainly
supported by Perkins but, as Table 1 exposes, his estimates for GDP per capita
founded upon a base-line figure of 450 International Dollars and extrapolated forward
from 1300 to 1870 using average annual rates of growth derived from Perkins’
estimates for grain production per capita are not consistent with our calculations that
generate far higher levels of kilocalories per day provided by estimates of around
US$600 1990 International Dollars for these years benchmarked in Column 4 of
Table 1 for the period 1300 to 1870.
But the question remains: could data from Perkins (accepted by Maddison and those
who cite his rates of growth in per capita income in 1990 dollars) which are derived
from statistics for population growth and a conjectured constant of 572 catties of
unhusked rice, be used as trends that correlate with trends in GDP per capita?
Perkins suggested they could and attempted to corroborate his conjectures with
reference to evidence derived from an official survey of agricultural output for 1957
and more seriously with statistics derived from an elaborate alternative calculation
based upon reconstructed estimates for the area of arable land cultivated with grains
multiplied by a guess for weighted average yields (again measured in catties of
husked rice equivalents per mu). We suggest that for reasons that he almost
recognizes these estimates are unconvincing if not unacceptable (Perkins 1969, p.
298).
23
Two runs of statistics are required for such an exercise. First, estimates for the area
of arable land available for cultivation with one or more crops of grain for a series of
“representative / modal” years. Secondly (and accepting Perkins’ “assumption” that
80% of the cultivated arable land of the Chinese Empire produced grain year after
year) viable estimates for average annual yields per mu cropped once, twice or even
three times with rice and other grains (Perkins 1969, p. 17).
Despite their vital importance for government finance, cadastral surveys in
Imperial China were sporadic and subject to wide margins of error. The first
attempt to carry out an empire-wide cadastral survey was made in late
Northern Song when private land ownership became the dominant form of
landholding. In 1072 AD, Emperor Shenzong (r. 1068–85) issued a decree to
survey all farmland in Song territory utilizing the fangbu as the standard
survey unit for cultivated land (Zhang 1986, vol. 10, p. 7981, and Wu 1985,
pp. 17–18). Each fangbu was made of 6 paces2; 5 chi was counted as 1 pace;
hence 1 fangbu was 30 chi2. Only five provinces were properly surveyed
under this scheme (Tuotuo 1986, vol. 7, p. 5716). A second systematic
attempt was made in 1387. By1393, a total of 850,762,300 mu, officially, 1
mu = 240 x 6 paces2 (often translated into 0.38 hectares) had been officially
registered (Zhang 1986, vol. 10, p. 7981; Liang, 2004). In 1578, the Ming
government carried out another cadastral survey. Cadastral Registration was
resumed under the Qing Dynasty in 1654. That cadastral record was used as
the basis for taxation until 1690 (Zhao 1986, vol. 11, p. 9260). Ad hoc
amendments occurred but after 1690 no empire-wide cadastral surveys were
ever carried out (Zhao and Chen 2006, ch. 2). According to the 1765 regulations,
‘villagers measure their own lands, officials check at random’ (Zhao 1927, ‘Shihou 2’,
in Twenty-Five Official Histories, 1986, vol. 11, p. 9259). And Zhao has estimated
under-reporting in cadastral surveys of 20-30 per cent (Zhao 2007).
In reality, the mu as a unit of cultivated land was never fixed. Its area and fecundity
varied significantly from province to province, locality to locality and from time to time.
Usually, the average output from one mu (i.e. 240 x 6 paces2) of medium fertility in a

24
region became fixed as a fiscal benchmark. That benchmark was then used as the
common denominator to convert outputs (bags of grain) from plots of different
fertilities to a number of taxable units in order to simplify assessment for taxation.
This was a deliberate and persistent government procedure, known as “mu
conversion” (zhemu). For example, in 1109, Emperor Shenzong decreed that 1 mu of
the highest quality was equal to 10 mu of the lowest quality (Xu 1976, vol. 7, p.
6416). A government registered mu became nothing more than a virtual unit for
century after century. The practice continued during the Qing (Liang 1980, p. 528,
and Zhao 2007). According to Shi Zhihong, “Gross mu (damu) were larger than the
official size of 240 x 6 paces2. Mu varied from 260 x 6 paces2, 360 x 6 paces2, 430 x
6 paces2, 480 x 6 paces2, 540 x 6 paces2, 600 x 6 paces2, 720 x 6 paces2, 960 x 6
paces2, to 1200 x 6 paces2. Even if we know such variations, we cannot convert mu
recorded in historical materials into the official standard mu unless we can clarify the
type of ‘mu’ referred to in a particular record.” (Shi 2012, p. 55)
In short, the surveys conducted under Ming and Qing governments do not provide
historians with records of the empires area of cultivated land expressed in
standardized units. Official statistics for cultivable land are distorted by textual errors,
the inclusion of untaxed land and significant degrees of variance in the area called a
mu. Above all, they are inflated by grading land for fiscal reasons to reflect
differences in the underlying fertility of the soil. To reduce Ming surveys of fiscal mu
to estimates that approximate to the area cultivated with grains required arduous and
complex manipulations of data that ceased to be collected after 1690. Perkins (with
help from a prior exercise published by Fujii) produced a series of “most likely”
estimates of 370 million mu plus or minus 70 million shimu (‘modern mu’) for circa
1400 and 500 million shimu plus or minus 100 million mu for circa 1600 and 666
million (presumably plus or minus 20%) for 1661 and 950 shimu for the 1770’s
(Perkins 1969 Appendix B, pp. 221-35).
Perkins also made the not implausible assumption that the cultivated area (shimu)
grew between 1685 and 1700, 1725, 1766, 1777, 1812 and 1851 in line with the area
measured as non-standardized fiscal mu for these surveyed years (Perkins 1969, pp.
231-4). For 1873 and years thereafter he utilized estimates of the area cultivated
compiled by the Department of Agricultural Economics of Nanjing University and the
officially measured area for 1957 (Perkins 1969, pp. 232-6).

25
With very rough estimates for areas of cultivated land expressed in his reconstructed
and standardized mu in place, Perkins then confronted his database of 900
observations for yields “per mu” for disparate years and for scattered locations
across the empire. For circa 1500 to circa 1800 he noted their high degree of
variance and observed the lack of uniformity in weights and measures and the resort
to figures for rents (normally, levied as a share of the first rice crop) as a substitute
for crop yields (Perkins 1969, Appendix 1; Li 1998; Huang 1988).
For reasons that are not elaborated he tabulated a drastically reduced sample of
estimates for unhusked rice yields (catties per shimu) for just 4 locations that he
referred to centuries of time: 1500-99, 1600-99 and 1700-99. Even for that reduced
sample the variations for just 12 observations ranged from 250 catties per annum to
520 (Perkins 1969, Table G.2, p. 315). He almost admits that this data could not be
used for purposes of constructing an alternative conjecture for total grain output in
unhusked rice that might otherwise support his basic conjecture and which is in fact
based solely on contested statistics for the empire’s population (Lavely and Wang
1998; Deng 2004).
To sum up, Perkins’ serious attempts to come to grips with inadequate and unreliable
data for grain production / consumption has been translated into upper and lower
bound estimates that remain wide apart but are deployed to refer to his (and to
Maddison’s) perceptions of stasis over the Ming-Qing era. Perkins preferred
estimates are based on nothing more than population totals and a conjectured
constant of 286 kilogrammes of unhusked rice per capita which transforms into a
contestable level of 195-kilocalories per person per day (vide Table 1). His
altogether more tentative manipulations of insecure data for cultivated land and its
gross average yields per unstandardized mu expressed in catties of unhusked rice
(which are quoted by Maddison) generate numbers that translate into lower and
upper bound numbers of 2635 and 5124 kilocalories a day. They do not corroborate
estimates for kilocalories per day based upon the size of the empire’s population
multiplied by a constant (Perkins 1969, Appendix G).
Perhaps the most balanced judgement to make about a scholarly exercise conducted
by a distinguished economist to relocate the agrarian history of imperial China on a
statistical basis for purposes of measuring rates and levels of agricultural growth is
that it remains as a heuristic example of an endeavour to produce data for the
Kuznetsian paradigm for the “empirical tradition economics” (Fogel 2013). Sadly, he
26
has not supplied historians or Maddison with the macro-economic data required to
forge a statistical explicandum for a modern economic history of the Ming-Qing
empire. These data (referred to by Perkins as “most likely conjectures”) are, we
regret to say, simply not fit for that purpose (vide Perkins 1969, pp. 8-17).
Maddison certainly depended on Perkins for the rates of change he utilized to
extrapolate his own numerical constructions for China’s GDP in International Dollars
backwards and forwards through some 1900 years of history. He also, moreover,
cited Rozman’s 1973 figures for the empire’s urbanization ratio (Rozman 1973).
Except for some archaeologists who cling resolutely to that ratio as the only statistical
evidence available to them for metanarratives of economic development for
prehistoric, and classical centuries, the correlations between that particular numerical
index and changes in levels of GDP per capita are recognised as conceptually
ambiguous and depend upon an uncritical view of statistical evidence that is
conceptually dubious, namely, multipliers that convert areas of settlement into
populations of towns (Bloom 2007; Pascarti and Dunn 2002).
Agreed, the economic mechanisms through which the concentration or
agglomeration of populations within the boundaries of geographical units designated
as “urban” by states for administrative purposes, and by historians in terms of
population and households that vary from 1000 to 50,000 could theoretically operate
to promote nationwide economic growth are well understood (Fujita et al 2000;
Krugman and Venables 1995; Ge 2000-1). Relevant correlations have been tested
for recent times (Polere 2009; De Long and Shleifer 1993; Taylor 2013).
Nevertheless, unless and until it has been established precisely how other features
and factors (particularly variations in the administrative boundaries established by
political authorities for purposes of governance, taxation and defence) behind the
correlation also operated across space and time, the set of disparate urbanization
ratios for China will continue to retain their status as an ambiguous indicator for the
measurement of trends or levels of economic development (Ge 2000-1; and Duan
1999). China’s relatively low and stable urbanization ratios may simply reflect a
greater degree of dispersal of more productive activities associated with
manufacturing and professional services across space? They can be plausibly
related to: the overall area of an enormous and expanding polity, internal peace and
security, the size of the empire’s population and the densities of its transportation of
communication networks (Cao 2001; McKeown 2011, pp. 309-19; Rosenthal and
Wong 2011).
27
While Kuznets established clear connexions between macro-economic growth and
the shares of workforces engaged in agriculture, neither he, Rozman, nor most
historical geographers are prepared to posit any close and invariant correlation
between urbanization ratios, the sectoral allocation of the workforce and levels of per
capita income (Taylor 2013). Even for Europe that ratio fluctuated across space and
over time in line with changes in the comparative advantages of villages and towns
(Crouzet 2001). There seems to be no evidence covering the share of the workforce
(or ideally the share of its labour time) allocated to non-agricultural pursuits in China.
Before the late eighteenth century the absolute numbers of Chinese workers
employed in “urban” locations variously defined, probably exceeded the total for
Western Europe. The most recent data for 1776 offers urbanization ratios of 7.4% for
China, 10% for Europe, 16% for Britain. The ratio for Jiangnan, the most
commercialized pocket of Qing China is cited as 14% (Li and van Zanden 2012). But
the problem is that the term ‘Jiangnan’ refers only to 27% of all prefectures (8 out of a
total of 29) across Jiangsu and Zhejiang provinces (Tan 1991, pp. 51–2, 59–66; Feng
2002, pp. 22, 24–7; Guo 2007, p. 152), or 4% of all prefectures (190) across the
empire (Cao 2001, pp. 828-9; Ge 2000-1, vol. 4, pp. 282, and vol. 5 pp. 808, 811). In
short, correlations between underspecified and unmeasured ratios for urbanization
and GDP per capita vary across space and time.
4. Conclusions: Can the Kuznetsian Paradigm Be Extended to Include the
Long Run Development of the Chinese and Other Oriental Empires?
Our view of prospects for the construction of macro-economic history of the Chinese
Empire from the Western Han or even from Ming-Qing dynasties is one of pessimistic
regret. We have reached this unwelcome conclusion by way of a critique of the
innovatory endeavours of the late Angus Maddison to discover and calibrate data
that might serve as plausible conjectures for trends in China’s GDP per capita from
Han to modern times. Aware that his indices continue to be widely cited by
economists and that other economic historians are engaged in revising comparable
categories and ranges of Chinese data this essay has been written to remind them
that the Kuznetsian paradigm for economic history depends upon access to statistical
evidence that is secure enough to provide an explicandum for competing analytical
narratives (Bairoch 1981; Liu 2010; Bolt and van Zanden 2013; Broadberry et al
2013).
28
For reasons that we will now summarize the work of the most committed and prolific
Kuznetsian scholar of his generation shows this is patently not the case for Chinese
economic history. First, the foundations upon which Maddison projected intervals of
growth from (circa Year 1) to the end of the Sung Dynasty (circa Year 1300) are
based on no statistical evidence other than the disputable figures he cited for total
population (see Table 2). This also applies for the interlude of decline and recovery
from circa 1850 to circa 1890 associated with the highly destructive Taipei rebellion
and two foreign invasions. While the presentation of index numbers that suggest six
centuries of stasis in per capita production and consumption from Sung to late Qing
times are based almost entirely upon an enlightening but ultimately unsuccessful
attempt by Perkins to measure trends in the volume of grain output supported by
Rozman’s conceptually ambiguous and statistically insecure ratios for urbanization.
Despite the understandable urge of our colleagues in archaeology and classical
history to quantify their evidence, most historians do not read data for changes over
long spans of time in the shares of an economy’s population resident on sites
designated as “towns” (let alone a numerator that purports to measure the size of its
largest city) as an adequate proxy for rates of growth in GDP per capita (Morris 2010
and 2013; Taylor 2013).
For the period after 1890 Maddison’s numbers that appear in several publications
rely on official and revised estimates from the Communist state, and outdated
revision of these estimates by Ren Ruoen for 1986; an unofficial construction of one
national account for 1933 by an academic economist, Ou Pao-san (1947), and then
by Liu and Yeh (1965), for 1933 and some more or less plausible conjectures for
average annual rates of growth for the years 1914/18-33 published by Perkins,
Rawski and Chang, which Maddison asserted could be applied to the periods from
1890-1913 and 1870-90.
Economic historians might be persuaded that inadequate but perhaps acceptable
statistical evidence might emerge to construct an imperfect but potentially useable
series for GDP and GDP per capita in current and constant prices for bench mark
years after 1890? Nevertheless, and in the light of recent and ongoing discussions
among economists in the wake of 2005 statistical exercise conducted under the
auspices of the World Bank designed to convert estimates for the gross domestic
products of 146 countries for purposes of international comparisons they will become
more aware and sceptical about the provenance, confined context and meaning of
29
numbers expressed in International Dollars and projected backwards or forwards in
time for purposes of historical analysis (World Bank 2006, 2008 and 2013).
For example, they will note that Maddison’s own forward projections of growth from
Western Han to Sung times also rests upon a base line guess for per capita
consumption which he defined as equivalent to a modern universal poverty line of
450 International Dollars which is convertible into the same amount of American
dollars and 518 Chinese yuan for 1990 (Table 1). Apart from the difficulty of
imagining survival in contemporary America on an income of US$1.25 dollars a day
that particular poverty line figure was constructed by the Bank’s economists in order
to provide a headlined numerical impression for conditions afflicting the lives of the
very poor in the poorest countries of the modern third world. It is neither transparent
conceptually nor uncontroversial. The acceptable general question for historians is
could this or even some revised figure for a global poverty line be transposed to
serve as a plausible proxy for the standard of living for a modal Chinese family
unfortunate enough to have lived under the Han dynasty? Some classical historians
may embrace that number as a possibility for quantification but serious theoretical
and empirical objections surround the conflation of a metric designed to facilitate
comparisons of average standards of living across populations in ancient times with
any contemporary and supposedly global metric for a poverty line (Morris 2013, and
Pritchett 1997). That line will fluctuate with the purchasing power parity exchange
rates for currencies in ways, directions and degrees that are not related to either the
range of prices or quantities of commodities actually consumed by the poor
purchasing and/or producing enough for subsistence (Reddy and Pogge 2010).
World Bank figures have, moreover, been exposed as out of line with standards and
measurements for poverty established by national governments expressed in local
prices and incomes. For China, recent official estimates distinguish rural from urban
poverty and suggest levels in yuan that are not even close to the reference year
figure of 450 International Dollars for year 1 selected by Maddison as a basis for
forward extrapolation from Han times (World Bank 2006).
Furthermore, our tests for sensitivity and consistency (vide Table 1) based upon
alternative data for normal daily wages in grams of fine silver and a metric
established by the Food and Agricultural Organization of the United Nations of 2100
kilocalories per capita a day as the nutrients required for “food security” suggest that
for almost two millennia Chinese families enjoyed levels of nutrition that were
paradoxically far more optimistic than anything suggested by participants in the
30
Divergence Debate, either for the Chinese Empire or the labouring poor of Western
Europe (Vries 2013). Taken at face value Maddison’s reference figure for year 1 (i.e.
450 International Dollars) converts into yuan and then into edible rice equivalents (at
the official average price of 0.648 yuan per kilogramme for 1990). The implausible
numbers that are generated by this calculation suggest that under the Han dynasty
an average Chinese family allocated only 30% of a subsistence-cum-modern poverty
income to the purchase of food (Piazza et al 2001; Ravallion and Chen 2004).
Sensitivity tests reveal that there is something amiss not simply with the evidence
and conjectures for the rates of growth utilized for forward projections from the Han
era to 1850 but more seriously with the conceptual foundations of any index
expressed in constant 1990 International Dollars utilized as a base line level for the
projection of long term trends in GDP per capita. There is no statistically based
evidence for accepting inferences that could prima facie be drawn from Maddison’s
estimates in International Dollars. They suggest that after an “efflorescence”
(revealed as a mere “blip”?) experienced under the Sung dynasty the macro
economy of the empire stagnated and China’s population experienced no
improvement in their standard of living before 1960. Maddison’s innovatory and
persistent attempts to manufacture statistics in order to work within the paradigm
established by Simon Kuznets for empirical economics has led to nothing better than
abstract numerical impressions which are no more nor less secure than historical
narratives that they seek to replace. Historians of art work with abstract and realistic
paintings. Both are interesting but for very different reasons. Economic historians
remain committed to facts embedded in theory from which they derive consistency
(Clark 2008).
For example, Maddison’s imaginative guess expressed in numerical form that GDP
per capita income at the time of the Han Dynasty might plausibly or arguable have
been equivalent to a World Bank estimate of third world poverty. For our own times
of 450 dollars in 1990 prices does not match with his text when transposed into
kilocalories – vide Column 6 of the table. Nevertheless, that number might, prima
facie, be rescued by the argument that while a majority of the population subsisted
on 2100 kilocalories per day a minority owning land, capital or enforcing rights to
appropriate taxes or to expropriate tribute taxes, extracted a surplus of somewhere
close to 60% of the Han empire’s GDP. In short the distribution of income in Han
China might have been close to an “inequality possibility frontier” (Milanovic et al
31
2007). That possibility cannot be ruled out ab mitio. Nevertheless, the political and
logistical conditions required for surplus extraction on the scale and regularity
required to support Maddison’s bold guess for GDP per capita under the Han were
not present in ancient empires (Bernholz and Vaubel 2004; Yun-Casalilla and
O’Brien 2012). Furthermore, almost no support can be found in historical literature to
suggest that Han China was a society characterized by high degrees of inequality
(Wang 2007, pp. 162-74, 278-99). Maddison’s imaginative numerical speculation for
the empire’s base line level of per capita income is not consistent with the analytical
narrative based upon numbers that he constructed to analyse more than two million
years of Chinese history (Maddison 2007).
Perhaps our overtly sceptical stance towards an index designed to expose trends in
levels and rates of growth in China’s GDP per capita which are ostensibly measured
and expressed in 1990 International Dollars for such a long span of time might be
further clarified with reference to the figures reported in Table 1 for 1990 and 1490.
For this “thought experiment” let us set aside as potentially reparable the real
problems Maddison encountered in converting imperfect quasi-official estimates for
GDP available for 1990 and the biases and ambiguities now clearly exposed by the
2005 and 2011 exercises for the construction of a viable exchange rate to measure
the purchasing power parity of the yuan (and multiple other currencies) in
International Dollars for those same years (World Bank 2008). Even with more
acceptable purchasing power parities major ontological questions will remain. For
example, what exactly could a number of around 600 International Dollars or
thereabouts for modern times reveal about the global status of the imperial economy
and the standard of living it afforded for its population back in 1490? Have our own
contemporaries – i.e. families residing in modern day China - enjoyed standards of
living that could be represented by a multiplier that prima facie suggests that their
current standards of living amount to little more than three times the average level of
material welfare afflicting their ancestors ruled by the Ming Dynasty?
Did the “Confusions of Pleasure” experienced by wealthy urban Chinese in late Ming
times rest on levels of agrarian productivity that provided surpluses way above the
levels prescribed for food security for that empire’s population? (Brook 1998) Did
those levels exceed the levels of production and consumption provided by other
Eurasian economies when Columbus set off on his voyage of discovery? According
to Maddison’s metric and calculations the gap in per capita income at that
conjuncture in Eurasian history was around 170 International Dollars (Maddison
32
2001). To measure divergence at that momentous point in history he had
manufactured an estimate for Europe of 771 dollars and another for Ming China of
600 dollars utilizing 1990 purchasing power parities between the yuan and a
weighted average of European currencies. But his estimates lack not only statistical
reliability but conceptual meaning because the relative standing of the Chinese
economy and the material welfare of its population measured and ranked according
to the international power parity of the yuan for 1990 might bear little or no
resemblance to its position in the world 500 years earlier. That position could only be
established by an exercise designed to convert the currencies of the world by rates of
exchange based upon the relative prices and volumes of output for goods and
services generated by the technological and production possibilities and preferences
that pertained in Ming times (Prados De La Escosura 2000).
Furthermore, libraries of theoretical and empirical literature on the properties of index
numbers agree that highly significant variations can and indeed have occurred in the
measurement of GDP and GDP per capita between calculations that endeavour to
quantify and compare either standards of living (or values of national outputs) in the
prices and volumes for periods separated by anything longer than rather short spans
of time (World Bank 2013). As Simon Kuznets and Moses Abramovitz told us years
ago these conceptual problems are evaded, not solved, by arithmetical or geometric
averaging of deflators based on different sets of prices (Abramovitz 1959; Kuznets
1981; and Usher 1968). Of course, their modern economy provides much more by
way of goods and services for Chinese citizens in 1990 than in 1490. Just how much
more depends not only upon how appropriately and accurately GDP is defined and
measured in current prices for both years but also upon changes to the structures of
production and the composition of consumption over such a long span of time and
statistically on the capacities of price deflators to capture profound discontinuities in
technologies for production and the emergence of both new and superior goods and
services.
Even if familiar conceptual and statistical problems involved in the definition and
measurement of GDP could be taken as unavoidable the meaning and heuristic
purpose of a number representing per capita GDP for 1490 denominated in
International Dollars – based upon the international purchasing power parity of the
yuan for 1990 remains difficult to comprehend. Has Maddison’s appealing run of
ostensibly comparable index numbers circumvented familiar problems of deflating
estimates for GDP in current prices into constant prices for the measurement of
33
growth, stasis or regression in national production or welfare (Abramovitz 1959)? Or,
is not the case that Maddison’s procedures for the deflation of China’s GDP have
generated conceptually ambiguous numbers (Usher 1968)? By 1990 Chinese
families were purchasing a volume, range and quality of commodities and services
that could be represented as either uniquely modern or obtainable at prices that
placed them, or conceivable substitutes for them, way beyond the reach of their
ancestors alive in 1490.
This point embodies nothing more than a thought experiment that refers to the
familiar Geschenkron effect of measuring changes in the volume of goods and
services that over time have improved significantly in quality and performance while
declining in price (Gerschenkron 1966). That effect has been explored by classic
articles on the long run costs of health, travel and artificial light music and other
hedonistic attributes of goods and services purchased by modern populations. The
problem has been a constant preoccupation for statisticians engaged with the
construction of deflators to measure changes in the costs of living and rates of
growth for GDP. Recent discussions among economists show these problems are
compounded and not solved by the deployment of numbers expressed in
International Dollars for modern times to measure anything other than depressingly
short term changes in average levels of welfare and volumes of production (World
Bank 2013). Ontologically it remains difficult for philosophers and historians to
conceive of models or fictions whereby a modern Chinese might be persuaded to
take a time train back to the era of the Ming for an annual income that was anywhere
near as low as her annual income of 1871 International Dollars for 1990 (vide Table
1).
Valid statistics collected and calibrated with improved precision into International
Dollars do help a Chinese, Indian or American to formulate a reasonably clear and
accurate perception of where their economy and income stands in relation to other
economies and populations elsewhere in the world at the present time. Extrapolated
backwards to include pre-modern classical centuries (let alone pre-historic eras) such
numbers or indices expressed in modern International Dollars provide them with
virtually no conceptions of the relative scale and efficiency of China’s imperial
economy in times long past or with any convincing way of informing a modern
Chinese just how much better off in material terms she could be compared to her
ancestors. Mutatis mutandis these widely cited macro economic indicators have not
and cannot provide economists or economic historians with access to the body of
34
statistical date that they so ardently desire in order to publish in ways and journals
that cling to Kuznetsian and derivative paradigms for the study of long run economic
growth. For pre-modern statistical “dark ages” that paradigm may be degenerate and
should be reformulated in ways and along lines that could include more illuminating,
transparent and available economic facts such as kilocalories or measures of the
exceptional standards of living enjoyed by tiny populations residing in favourably
endowed micro-spaces such as the Huating-Lou area of the Yangzi Delta. Such
facts might travel to link the past with the present in impressionistic and confined but
more realistic ways (Li 1998; Li and van Zanden 2012). Maddison’s endeavours are
heroic but heuristic failures that leave us with the question of how far the paradigm
for research he recommended can be realistically pursued? Meanwhile there is no
warrant for facts to travel in the direction of convenient, consoling and publishable
abstractions. And it might well be regarded as “Eurocentred” to ignore debates
among Chinese economic historians about the evidence available for an empirical
tradition in economics.
References
Abramovitz, M., “The Welfare Interpretation of Secular Trends in National Income
and Product,” in M. Abramovitz, ed., The Allocation of Economic Resources
(Stanford 1959), pp. 1-22.
Alam, M., “Global Disparities Since 1800: Trends and Regional Patterns,” Journal of
World Systems Research 12/2 (2006), pp. 36-59.
Allen, R., Poverty Lines in History, Theory and Current International Practice
(Unpublished paper, Nuffield College, Oxford, 2013).
Asian Development Bank, Purchasing Power Parity Preliminary Report International
Comparison Program in Asia (Manila, 2007).
Bairoch, P., Cities and Economic Development from the Dawn of History to the
Present (Chicago, 1988).
Bairoch, P., Victories et deboires II Histoire économique et sociale du monde au XVI
siècle à nos jours (Paris, 1997).
35
Bairoch, P. and Maurice Levy-Leboyer (eds.), Disparities in Economic Development
since the Industrial Revolution (London, 1981).
Bernholz, P and Vaubel, R. (eds.), Political Competition, Innovation and Growth in
the History of Asian Civilizations (Cheltenham, 2004).
Bolt J. and J. Van Zanden, “The First Update of the Maddison Project Re-Estimating
Growth Before 1820,” Maddison Project Working Paper 4 (Groningen, 2013).
Brook, T., The Confusions of Pleasure, Commerce and Culture in Ming China
(Berkeley, 1998).
Brümmerhoff, D. and M. Gromling, “Are National Accounts Revisions Harmful for
Historical Comparisons,” World Economics 13/4 (2012), pp. 79-97.
Buck, J.L., Land Utilization in China (New York 1937, republished by Paragon Books,
1964).
Cao Shuji, Zhongguo Renkou Shi (A Demographic History of China) (Shanghai,
2001).
Chandler, T. and G. Fox, Four Thousand Years of Urban Growth. An Historical
Census (New York, 1987).
Cheng Minsheng, Songdai Diyu Jingji (Regional Economies of the Song Period)
(Zhengzhou, 1992).
Clark, C., Conditions of Economic Progress (London, 1940).
Clark, G., ‘In Defense of Malthusian Interpretations of History’, European Review of
Economic History 12 (2008) pp. 177-79.
Crouzet, F., A History of the European Economy 1000-2000 (Charlottesville, 2001).
Crowshore, D., “Frontiers of Real Time Data,” Journal of Economic Literature 49/1
(2011), pp. 72-100.
36
De Jong, H. and B. van Ark, The Comparison of GDP Levels and the Use of PPPs in
the Maddison Data Base (Groningen, 2012).
De Long, J.B. and A. Shleifer, “European City Growth before the Industrial
Revolution,” Journal of Law and Economics 36/2 (1993), pp. 671-702.
Deaton, A., ‘Prices Indexes, Inequalities and the Measurement of World Poverty’,
American Economic Review, 100 (2010) pp. 5-34.
Deaton, A. and A. Heston, “Understanding PPPs and PPP-based National Accounts,”
American Journal: Macroeconomics 2/4 (2010), pp.1-35.
Deng, G., The Premodern Chinese Economy - Structural Equilibrium and Capitalist
Sterility (London, 1999).
Deng, K., “Demystifying Growth and Development in Northern Song China, 960–
1127,” Working Papers of Department of Economic History, LSE, No.178, June 2013.
Deng, K., “Unveiling China’s True Population Statistics for the Pre-Modern Era with
Official Census Data,” Population Review 43/2 (2004), pp. 1–38.
Deng, K., China’s Political Economy in Modern Times: Changes and Economic
Consequences, 1800–2000 (London, 2011).
Diewert, E., “New Methodological Developments for the International Comparison
Program,” Review of Income and Wealth 56 Special Issue 1 (2010).
Dirhanov, Y. and E. Swanson, “Maddison and Wu: Measuring China’s Economic
Performance,” World Economics 11 (2010), pp. 199-203.
Duan Jixian, Zhongguo Renkou Zaoshi Xinlun (A New Insight into Demographic
Dynamics in China) (Beijing, 1999).
Eckstein, A., “The Economic Heritage,” in A. Eckstein et al, eds., Economic Trends in
Communist China (Chicago, 1968).
37
F.A.O., Food Energy – Methods of Analysis and Conversion Factors F.A.O. (Rome)
Food and Nutrition Paper 77 (2002).
Fan Jinmin, Guoji Minsheng – Mingqing Shehui Jingji Yanjiu (The National Economy
and People’s Life – Selected Essays on Socio-Economic Issues of the Ming-Qing
Period) (Fuzhou, 2008).
Federicko, G., “The World Economy 0-2000 AD. A Review Article,” European Review
of Economic History 6 (2002), pp. 111-20.
Feenstra, R. C. et al, “Estimating Real Production and Expenditures across Nations:
A Proposal for Improving the Penn World Tables,” The Review of Economics and
Statistics 91/1 (2009), pp. 201-12.
Feenstra, R. et al, “Who Shrunk China? Puzzles in the Measurement of Real GDP,”
Economic Journal 123/12 (2013), pp. 1100-29.
Feng Xianliang, Mingqing Jiangnan Diqude Huanjing Biandong Yu Shehui Kongzhi
(Environmental Changes and Social Control in the Jiangnan Region during the Ming-
Qing Period) (Shanghai, 2002).
Feuerwerker, A., “Presidential Address: Questions about China’s Early Modern
Economic History That I Wish I Could Answer,” The Journal of Asian Studies 51/4
(1992), pp. 757-69.
Fogel, W. et al, Political Arithmetic and the Empirical Tradition in Economics
(Chicago, 2013).
Fujita, M. P. et al, The Spatial Economy (Cambridge, 2000).
Fukao, K., D. Ma and T. Yuan, ‘Real GDP in Pre-War East Asia’, Review of Income
and Wealth 53/3 (2007), pp. 503-37.
Ge Jianxiong (ed.), Zhongguo Renkou Shi (A Comprehensive History of Population
in China) (Shanghai, 2000-1).
38
Gerscherkron, A., Economic Backwardness in Historical Perspective (Cambridge
[MA], 1966).
Guo Hong and Jin Runcheng, Zhongguo Xingzheng Quhua Tongshi, Ming (A
General History of Administrative Division in China, the Ming Period) (Shanghai,
2007).
Heston, A., “What Can be Learned About the Economies of China and India from the
Results of Purchasing Power Comparisons,” in B. Eichengreen et al, eds., Emerging
Giants, China and India in the World Economy (Oxford, 2010), ch. 1.
Holz, C., “China’s Reform Period Economic Growth: How Reliable Are Angus
Maddison’s Estimates?” Review of Income and Wealth 52/1 (2006), pp. 85-119.
Howlett, P. and M.S. Morgan (eds.), How Well Do Facts Travel? The Dissemination
of Reliable Knowledge (Cambridge, 2010).
Huang, P. C. C., The Peasant Family and Rural Development in the Yangzi Delta,
1350-1988 (Stanford, 1988).
Jerven, M., ‘An Unlevel Playing Field: National Income Estimates and Reciprocal
Comparisons’, Global Economic History 7 (2012), pp. 107-28.
Jiang Tao, Lishi Yu Renkou – Zhongguo Chuantong Renkou Jieguo Yanjiu (History
and Demography – China’s Traditional Demographic Pattern) (Beijing, 1998).
Jin Ji-yun, Ronggui Wu and Rongle Liu, “Rice Production and Fertilization in China,”
Better Crops International 16 Special Supplement.
Johnson, S. et al, “Is Newer Better? Penn World Table Revisions and Their Impact
on Growth Estimates,” National Bureau of Economic Research Working Paper 15455
(Cambridge, 2009).
Korzeniewicz, R. P. et al, “Measuring National Income: A Critical Assessment in
Comparative Studies,” Society and History 46 (2004), pp. 535-86.

39
Krugman, P. and A. Venables, “Globalization and the Inequality of Nations,”
Quarterly Journal of Economics (1995), pp. 857-80.
Kuznets, S., Economic Growth of Nations; Total Output and Production Structure
(Cambridge [MA], 1971), pp. 1-10.
Kuznets, S., Modern Economic Growth Rate, Structure and Spread (New Haven,
1996).
Lavely, W., and R. Bin Wong, “Revising the Malthusian Narrative: The Comparative
Study of Population Dynamics in Late Imperial China,” Journal of Asian Studies 57
(1998), pp. 714-48.
Lee, James and Wang Feng, One Quarter of Humanity (Cambridge [MA], 1999).
Li Bozhong, Agricultural Development in Jiangnan 1620-1850 (Basingstoke, 1998).
Li Bozhong, “An Early Modern Economy in China, A study of GDP of the Huating-Lou
Area 1823-29,” in Billy K.L. So, ed., The Economy of Lower Yangzi Delta in Late
Imperial China (London, 2013).
Li Bozhong and J. L. Van Zanden, “Before the Great Divergence? Comparing the
Yangzi Delta and the Netherlands at the Beginning of the Nineteenth Century,”
Journal of Economic History 72 (2012), pp. 956-89.
Liang Fangzhong, Zhongguo Lidai Huko Tiandi Tianfu Tongji (Dynastic Data for
China’s Households, Cultivated Land and Land Taxation) (Shanghai, 1980).
Liang Gengyao, Nansongde Nongcun Jingji (The Rural Economy under the Sothern
Song) (Beijing, 2006).
Liang Jingmin, “Yulin Tuce Yanjiu Zongshu” (A Survey of Studies of the Fish-Scale
Cadastral Registration), Zhongguo Jingjishi Yanjiu (Study of Chinese Economic
History) 1 (2004), pp. 135–41.
Liu Di, Qianjindai Zhongguo Zonliang Jingji Yanjiu, 1600-1840 (China’s Macro
Economic Quantities in the Early Modern Period, 1600-1840 (Shanghai, 2010).
40
Liu, Guanglin, “Agricultural Productivity in Early Modern Jiangnan,” in Billy So, ed.,
The Economy of Lower Yangzi Delta in the Late Imperial China (London, 2013), pp.
99–117.
Liu, J.T.C. and K. Yeh, The Economy of the Chinese Mainland, 1933-1959
(Princeton, 1965).
Maddison, A. and H. Wu, “Measuring China’s Economic Performance,” World
Economics 9 (2008), pp. 13-44.
Maddison, A., Chinese Economic Performance in the Long Run (Paris, 1998), First
Edition.
Maddison, A., Chinese Economic Performance in the Long Run 960-2030 (Paris,
2007b), Revised and Updated Edition.
Maddison, A., Contours of the World Economy 1-2030 (Oxford, 2007a).
Maddison, A., Explaining the Economic Performance of Nations; Essays in Time and
Space (Aldershot, 1995b).
Maddison, A., Maintaining the World Economy 1820-1992 (Paris, 1995a).
Maddison, A., The World Economy. A Millennial Perspective (Paris, 2001). This data
base is updated on:
http://www.worldeconomics.com/data/MaddisonHistoricalGDP%20Historical%20GDP
%20Data.efp
Man Zhimin, Zhongguo Lishi Shiqi Qihou Bianhua Yanjiu (Climate Changes in
China’s Long-term History) (Jinan, 2009).
McEvedy, Colin and Richard Jones (eds.), Atlas of World Population History
(Harmondsworth, 1978).
McKeown, A., “Different transitions comparing China and Europe, 1600-1900,”
Journal of Global History 6 (2011), pp. 309-20.
41
Milanovic, B, et al., ‘Measuring Ancient Inequality’, Working Paper 13550, National
Bureau of Economic Research, 2007.
Morris, I., The Measure of Civilization (London, 2013).
Morris, I., Why the West Rules – For Now (London, 2010).
NIIR Project Consultancy Services, Wheat, Rice, Corn, Oats, Barley, Sorghum
Processing Handbook (New York, 2012).
Ou Pao-san, National income of China, 1933, 1936 and 1946 (Nanking, 1947).
Pascuiti, D. and Chase Dunn, Estimating the Population Size of Cities
(http://irows.ucr.edu/research/citemp/estciti/estcit.com).
Perkins, D., Agricultural Development in China 1368-1968 (Edinburgh, 1969).
Piazza, A. et al, China Overcoming Rural Poverty: A World Bank Country Study
(Washington, 2001).
Polere, M., The Wealth and Poverty of Regions, Why Cities Matter (London, 2009).
Pomeranz, K., The Great Divergence: China, Europe and the Making of the Modern
World Economy (Princeton, 2000).
Prados, de la Escosura, Leandro, “International Comparisons of Real Product 1820-
1990: An Alternative Data Set,” Explorations in Economic History 37 (2000), pp. 1-41.
Prados, de la Escosura, Leandro, “World Human Development: 1870-2007,” Review
of Income and Wealth 2014.
Pritchett, L., “Divergence Big Time,” Journal of Economic Perspectives 11/3 (1997),
pp. 3-17.
Putnam, H., Reality and Representation (Cambridge, 1988).
42
Ravallion, M., “Price Levels and Economic Growth. Making Sense of PPP Changes
between IPC Rounds,” Policy Research Working Paper 5229 (World Bank,
Washington, 2010).
Ravallion, M. et al, “Dollar a Day Revisited,” World Bank Economic Review 23/2
(2009), pp. 163-84.
Ravallion, M. et al, World Bank Working Papers 133, 3408, 4620 (Washington, 1998,
2004 and 2008).
Ravallion, M. and S. Chen, “China’s (Uneven) Progress against Poverty,” World Bank
Working Paper 3408 (Washington, 2004).
Reddy, S. and T. Pogge, “How Not to Count the Poor,” in J. Stiglitz et al, eds.,
Debates on the Measurement of Global Poverty (Oxford, 2010), ch. 3.
Ren Ruoen, China’s Economic Performance,” International Perspective (Paris,
1997).
Ren Ruoen and Chen Kai, “China’s GDP in US Dollars Based on Purchasing Power
Parity,” Policy Research Working Paper 1415 (World Bank, Washington, 1995).
Rogoff, K., “The Purchasing Power Parity Puzzle,” Journal of Economic Literature
34/2 (1996), pp. 647-68.
Rozman, G., Urban Networks in Ch’ing China and Tokugawa Japan (Princeton,
1973).
Sarno, L. and M.P.L. Taylor, The Economics of Exchange Rates (Cambridge, 2002).
Shi Zhihong, “Shijiu Shiji Shangbanqide Zhongguo Liangshi Muchanliang Jiqi
Zongchanliang Zai Guji” (Re-Estimation of Yields per Mu and the Aggregate Food
Output in Early Nineteenth Century China), Zhongguo Jingjishi Yanjiu (Research into
Chinese Economic History) 3 (2012), pp. 52-66.
Skinner, G.W., “The Structure of Chinese History,” Journal of Asian Studies 44
(1985), pp. 271-92.
43
Stiglitz, J. et al (ed.), Debates on the Measurement of Global Poverty (Oxford, 2010).
Tan Qixiang, Jianming Zhongguo Lishi Ditu Ji (A Collection of Historical Maps of
China) (Beijing, 1991).
Taylor, A. and M. Taylor, “The Purchasing Power Parity Debate,” Journal of
Economic Perspectives 18/4 (2004), pp. 135-58.
Tuotuo, Song Shi (History of the Song Dynasty),” Er-shi-wu Shi (Twenty-Five Official
Histories) (Shanghai, 1986), vol. 7.
United States Department of Agriculture, Food Security Assessment 2010-2020
(Washington, 2010).
Usher, D., The Price Mechanism and the Meaning of National Income (Oxford,
1968).
Vries, P., Escaping Poverty. The Origins of Modern Economic Growth (Gottingen,
2013).
Wang Lihua, Zhongguo Jiating Shi (A History of Families in China) (Guangzhou,
2007).
Ward, M., Quantifying the World. UN Ideas and Statics (Bloomington, 2004).
Weber, Max, The Religion of China (1920-1), translated by Hans Gerth (New York,
1964).
Wong, R.B. and J.L. Rosenthal, Beyond Divergence: The Politics of Economic
Change in China and Europe (Cambridge [MA], 2011).
World Bank, China - Research Report on Gender Gaps and Poverty Reduction
(Washington, 2006).
World Bank, Global Purchasing Power Parities and Real Expenditures (Washington,
2008).
44
World Bank, Measuring the Real Size of the World’s Economy the Framework
Methodology and Results of the International Comparisons Program (Washington,
2013).
Wu Hui, Zhongguo Jingjishi Ruogan Wentide Jiliang Yanjiu (Quantitative Issues of
Chinese Economic History) (Fuzhou, 2009).
Wu Hui, Zhongguo Lidai Liangshi Muchan Yanjiu (Grain Yields in Chinese Long-term
History) (Beijing, 1985).
Xu Song, Song Huiyao Jigao (Edited Administrative Statutes of the Song Dynasty)
(1809, Reprint, Taipei, 1976).
Xu Xinwu, Jiangnan Tubu Shi (A History of Homemade Cotton Cloth in the Lower
Yangzi Delta) (Shanghai, 1989).
Yin Zhihua and Hui Fuping, “Zailun Mingqing Shiqi Taihu Diqude Tieda Yu Gengniu”
(On the Use Iron Rakes and Water Buffalos in the Lake Tai Region during the Ming-
Qing Period), Zhongguo Nongshi (Agricultural History of China) 4 (2012), pp. 37-44.
Yun-Casallila, B. and O’Brien, P. (eds.), The Rise of Fiscal States; a Global History
1500-1914 (Cambridge, 2012).
Zhang Piyuan, Zhongguo Lishi Qihou Bianhua (Climate Changes in Chinese History)
(Jinan, 1996).
Zhang Tingyu, Ming Shi (History of the Ming Dynasty),” Er-shi-wu Shi (Twenty-Five
Official Histories) (Shanghai, 1986), vol. 10.
Zhao Erxun, Qingshi Gao (Draft of the History of the Qing Dynasty), Er-shi-wu Shi
(Twenty-Five Official Histories) (Shanghai, 1986), vol. 11.
Zhao Gang and Chen Zhongyi, Zhongguo Tudi Zhidu Shi (A History of Land
Ownershi in China) (Beijing, 2006).
Zhao Yun, “Jishu Wucha, Zhemu Jiqi Juli Shuaijian Guilü Yanjiu” (Technical Errors:
Land Unit Conversion and the Law of Diminishing Distance), Zhongguo Shehui
45
Jingjishi Yanjiu (Research into Chinese Social and Economic History), 3 (2007), pp.
1–13.
Zimmerman, J.L., Poor Lands, Rich Land and the Widening Gap (New York, 1965).
European Historical Economics Society
!EHES!Working!Paper!Series Recent EHES Working Papers 2014 EHES.62 EHES.61 EHES.60 EHES.59 EHES.58
The Drivers of Long-run CO2 Emissions: A Global Perspective since 1800 Sofia Teives Henriques and Karol J. Borowiecki State dissolution, sovereign debt and default: Lessons from the UK and Ireland, 1920-1938 Nathan Foley-Fisher and Eoin McLaughlin Mismeasuring Long Run Growth. The Bias from Spliced National Accounts Leandro Prados de la Escosura Paving the way to modernity: Prussia roads and grain market integration in Westphalia, 1821-1855 Martin Uebele and Daniel Gallardo-Albarrán Fertility and early-life mortality: Evidence from smallpox vaccination in Sweden Philipp Ager, Casper Worm Hansen and Peter Sandholt Jensen
EHES.57 EHES.56 EHES.55
Breaking the Unbreakable Union: Nationalism, Trade Disintegration and the Soviet Economic Collapse Marvin Suesse The Danish Agricultural Revolution in an Energy Perspective: A Case of Development with Few Domestic Energy Sources Sofia Teives Henriques and Paul Sharp Just Add Milk: A Productivity Analysis of the Revolutionary Changes in Nineteenth Century Danish Dairying. Markus Lampe and Paul Sharp
All papers may be downloaded free of charge from: www.ehes.org The European Historical Economics Society is concerned with advancing education in European economic history through study of European economies and economic history. The society is registered with the Charity Commissioners of England and Wales number: 1052680