credit-suisse presentation slides
TRANSCRIPT
Slide 0
QUARTERLY RESULTS 2003 Q3
Slide 1
PRESENTATION
� RESULTS OVERVIEW
� CONSOLIDATED RESULTS Slide 4
� CREDIT SUISSE FINANCIAL SERVICES Slide 13
� CREDIT SUISSE FIRST BOSTON Slide 22
� ADDITIONAL INFORMATION Slide 29
� DISCLAIMER Slide 42
Slide 2
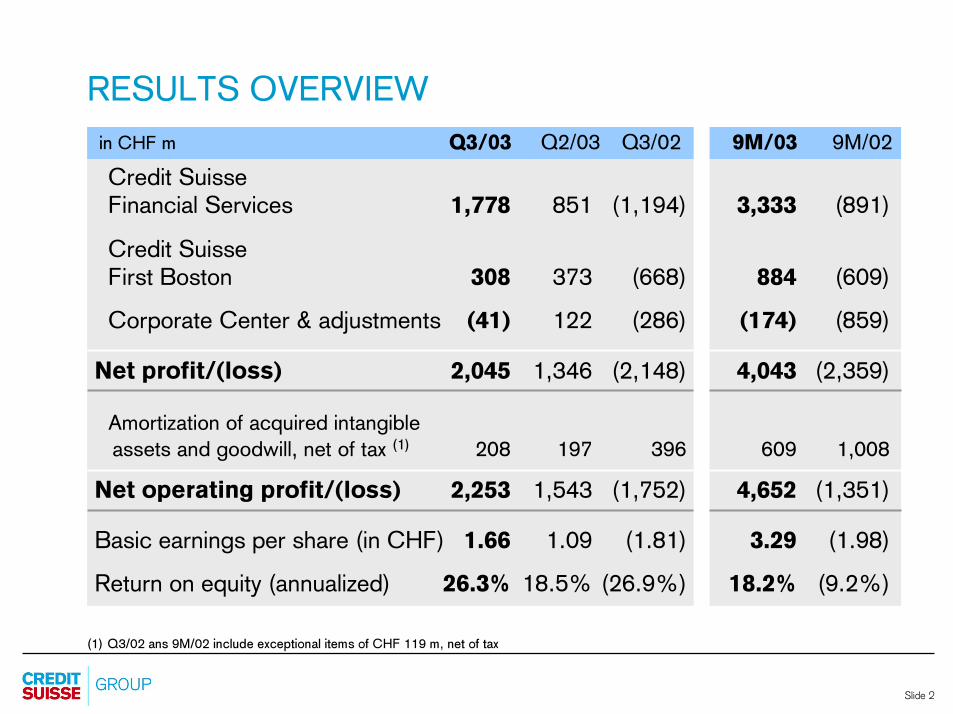
9M/03 9M/02
RESULTS OVERVIEW
Credit SuisseFinancial Services 1,778 851 (1,194) 3,333 (891)
Credit SuisseFirst Boston 308 373 (668) 884 (609)
Corporate Center & adjustments (41) 122 (286) (174) (859)
Net profit/(loss) 2,045 1,346 (2,148) 4,043 (2,359)
Amortization of acquired intangible
assets and goodwill, net of tax (1) 208 197 396 609 1,008
Net operating profit/(loss) 2,253 1,543 (1,752) 4,652 (1,351)
Basic earnings per share (in CHF) 1.66 1.09 (1.81) 3.29 (1.98)
Return on equity (annualized) 26.3% 18.5% (26.9%) 18.2% (9.2%)
Q3/03 Q2/03 Q3/02in CHF m
(1) Q3/02 ans 9M/02 include exceptional items of CHF 119 m, net of tax
Slide 3
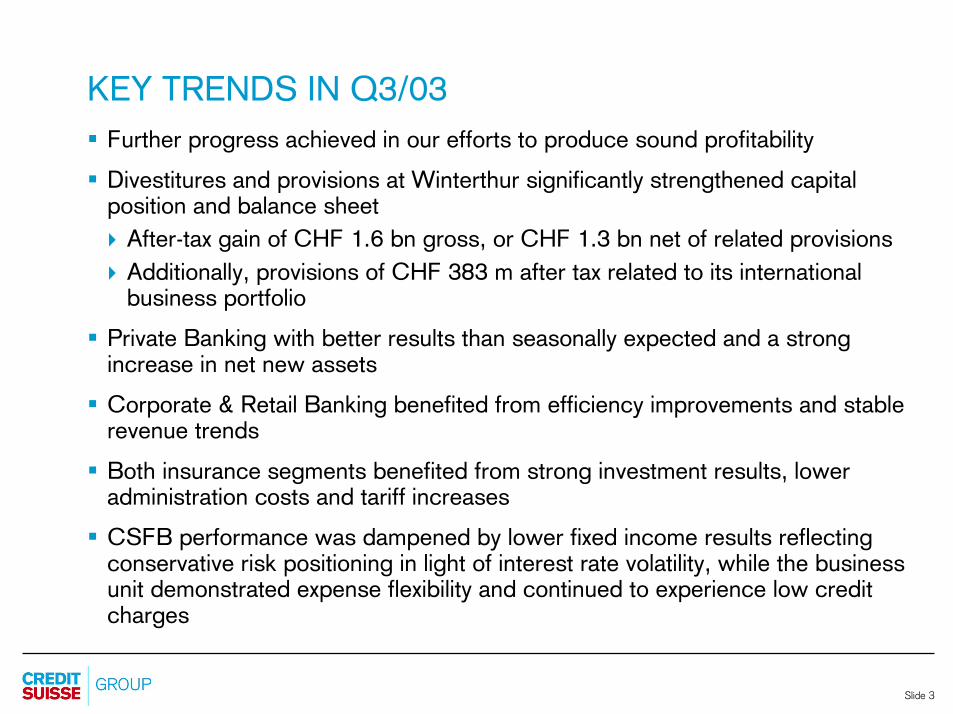
KEY TRENDS IN Q3/03
� Further progress achieved in our efforts to produce sound profitability
� Divestitures and provisions at Winterthur significantly strengthened capital position and balance sheet
� After-tax gain of CHF 1.6 bn gross, or CHF 1.3 bn net of related provisions
� Additionally, provisions of CHF 383 m after tax related to its international business portfolio
� Private Banking with better results than seasonally expected and a strong increase in net new assets
� Corporate & Retail Banking benefited from efficiency improvements and stable revenue trends
� Both insurance segments benefited from strong investment results, lower administration costs and tariff increases
� CSFB performance was dampened by lower fixed income results reflecting conservative risk positioning in light of interest rate volatility, while the business unit demonstrated expense flexibility and continued to experience low credit charges
Slide 4
PRESENTATION
� RESULTS OVERVIEW Slide 1
� CONSOLIDATED RESULTS
� CREDIT SUISSE FINANCIAL SERVICES Slide 13
� CREDIT SUISSE FIRST BOSTON Slide 22
� ADDITIONAL INFORMATION Slide 29
� DISCLAIMER Slide 42

Slide 5
OPERATING INCOME
in CHF m9 months
20022003
∆in %Q2/03Q3/03
∆in %
Net interest income 2,012 1,862 8 5,525 6,110 (10)
Net commission & fee income 3,223 2,960 9 8,997 12,034 (25)
Net trading income 72 1,327 (95) 2,672 2,145 25
Net income from theinsurance business 1,467 1,341 9 4,343 1,924 126
Total operating income (1) 6,531 7,549 (13) 21,104 21,643 (2)
(1) including "Other ordinary income/(expenses), net"
Slide 6
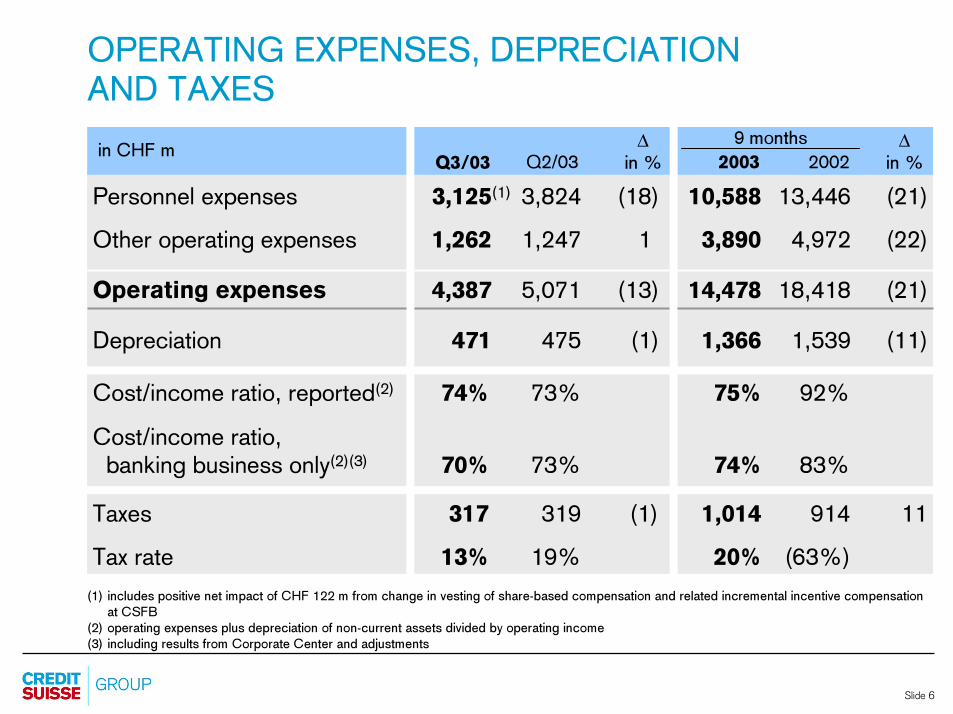
OPERATING EXPENSES, DEPRECIATION
AND TAXES
in CHF m9 months
20022003
∆in %Q2/03Q3/03
∆in %
Personnel expenses 3,125(1) 3,824 (18) 10,588 13,446 (21)
Other operating expenses 1,262 1,247 1 3,890 4,972 (22)
Operating expenses 4,387 5,071 (13) 14,478 18,418 (21)
Depreciation 471 475 (1) 1,366 1,539 (11)
Cost/income ratio, reported(2) 74% 73% 75% 92%
Cost/income ratio,banking business only(2)(3) 70% 73% 74% 83%
(1) includes positive net impact of CHF 122 m from change in vesting of share-based compensation and related incremental incentive compensation at CSFB
(2) operating expenses plus depreciation of non-current assets divided by operating income(3) including results from Corporate Center and adjustments
Taxes 317 319 (1) 1,014 914 11
Tax rate 13% 19% 20% (63%)

Slide 7
PROVISIONS
Valuation adjustments, provisions and lossesin CHF m
973
106
734
Non credit-related
Credit-related at CSFB
Credit-related at CSFS
Adjustment in the
method of estimating
inherent loss allowance
471
778
164
1,440
Note: Totals include Corporate Center and adjustments but exclude exceptional provisions of CHF 984 m in Q4/02
24
126
61
233
45
155
20032002
Q1Q4 Q2 Q3Q3
53
31131
44
215
119
86 10

Slide 8
IMPAIRED LOANS
59.5 60.0 62.3 63.8 67.1 68.0 Valuation allowance as % of
impaired loans
6.0 4.6 4.9 4.1 3.3 3.0 Impaired loans as % of due
from banks and customers (1)
Total impaired loansin CHF bn
CSFB
CSFS
12/01 09/02 12/02 06/0303/03
(1) due from banks and customers and mortgages (excluding securities lending and reverse repurchase agreements)
09/03
6.0
9.5
5.0
7.3 6.5
4.3
15.6
12.310.8
6.9
5.5
12.4
6.0
3.5
9.5
5.3
3.2
8.5
Slide 9
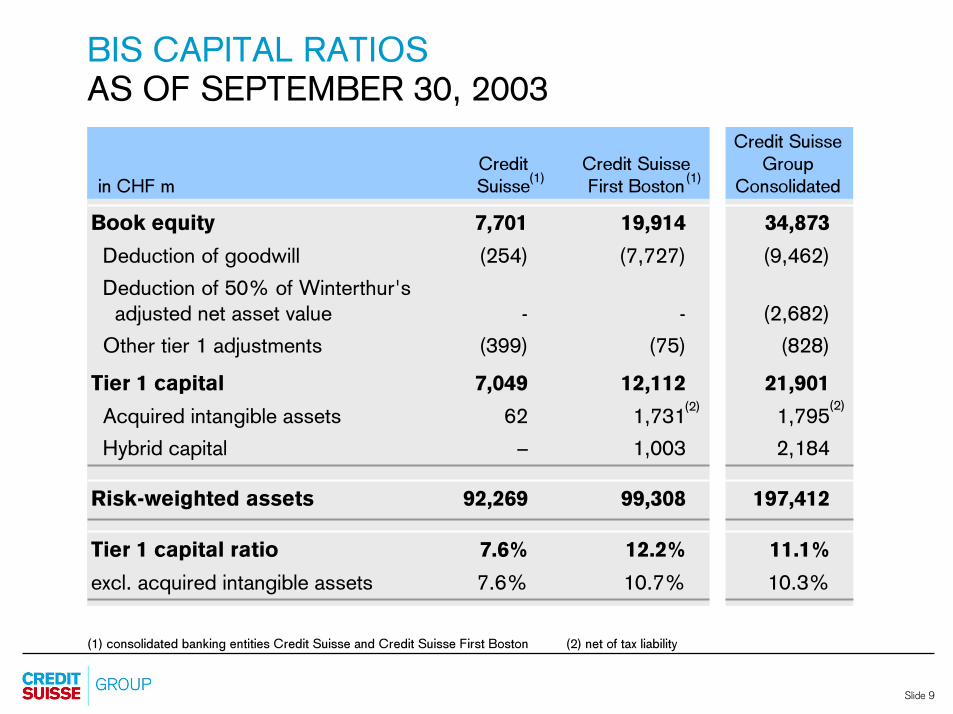
BIS CAPITAL RATIOS
AS OF SEPTEMBER 30, 2003
(1) consolidated banking entities Credit Suisse and Credit Suisse First Boston (2) net of tax liability
Book equity 7,701 19,914 34,873
Deduction of goodwill (254) (7,727) (9,462)
Deduction of 50% of Winterthur's
adjusted net asset value - - (2,682)
Other tier 1 adjustments (399) (75) (828)
Tier 1 capital 7,049 12,112 21,901
Acquired intangible assets 62 1,731 1,795
Hybrid capital – 1,003 2,184
Risk-weighted assets 92,269 99,308 197,412
Tier 1 capital ratio 7.6% 12.2% 11.1%
excl. acquired intangible assets 7.6% 10.7% 10.3%
Credit Suisse
First Bostonin CHF m
Credit
Suisse
(2)
(1) (1)
(2)
Credit Suisse
Group
Consolidated
Slide 10
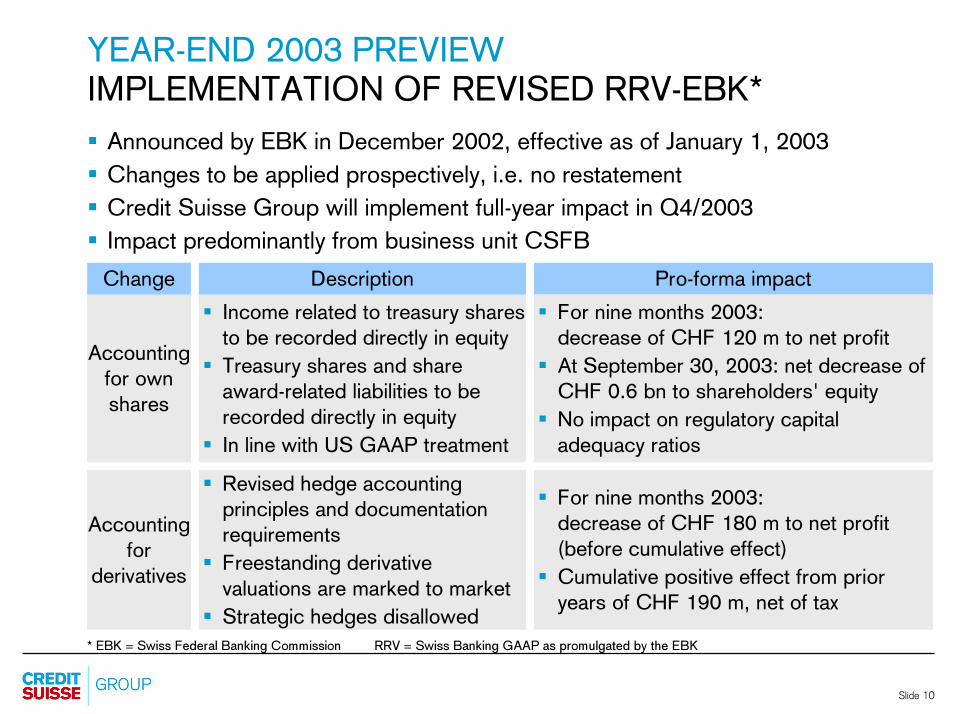
� Revised hedge accounting
principles and documentation
requirements
� Freestanding derivative
valuations are marked to market
� Strategic hedges disallowed
� For nine months 2003:
decrease of CHF 180 m to net profit
(before cumulative effect)
� Cumulative positive effect from prior
years of CHF 190 m, net of tax
Accounting
for own
shares
YEAR-END 2003 PREVIEW
IMPLEMENTATION OF REVISED RRV-EBK*
� Announced by EBK in December 2002, effective as of January 1, 2003
� Changes to be applied prospectively, i.e. no restatement
� Credit Suisse Group will implement full-year impact in Q4/2003
� Impact predominantly from business unit CSFB
Change Pro-forma impact
� Income related to treasury shares
to be recorded directly in equity
� Treasury shares and share
award-related liabilities to be
recorded directly in equity
� In line with US GAAP treatment
Description
* EBK = Swiss Federal Banking Commission RRV = Swiss Banking GAAP as promulgated by the EBK
Accounting
for
derivatives
� For nine months 2003:
decrease of CHF 120 m to net profit
� At September 30, 2003: net decrease of
CHF 0.6 bn to shareholders' equity
� No impact on regulatory capital
adequacy ratios

Slide 11
US GAAP PREVIEWDIVESTITURES TRIGGER ASSESSMENT OF US GAAP GOODWILL
Swiss GAAP
� Merger accounted for applying
the pooling of interests method
� Historical carrying values maintained for Winterthur's
assets and liabilities
� No goodwill from merger but
also no increase in equity
account
� Recent divestitures resulted in
an after-tax gain of CHF 1.6 bn
gross, or CHF 1.3 bn net of
related provisions
US GAAP
� Merger accounted for under the
purchase method
� assets and liabilities valued at fair market
value at transaction date
� Difference between the net fair value of
assets / liabilities acquired and the market
capitalization of Winterthur recorded as
� goodwill, with corresponding
� increase in shareholders' equity
� At January 1, 2003, the remaining
additional US GAAP goodwill amounted
to CHF 3.5 bn
� Net result of recent divestitures under
US GAAP significantly lower due to the
higher book values and allocated goodwill

Slide 12
US GAAP PREVIEWDIVESTITURES TRIGGER ASSESSMENT OF US GAAP GOODWILL
Swiss GAAP US GAAP
Winterthur-related goodwill recorded in CSG
consolidated accounts at December 31, 2002 1.0 4.5
Q2/03 – Q3/03 goodwill allocation and write-off
related to divestitures (0.1) (1.7)
Q2/2003 goodwill impairment charge (Life & Pensions) – (1.5)
YTD 2003 goodwill amortization charge (0.1) –
Winterthur-related goodwill recorded in CSG
consolidated accounts at September 30, 2003 0.8 1.3
in CHF billion
At December 31, 2002:
Winterthur shareholders' equity(1) 5.6 10.8
Winterthur shareholders' equity(1), net of goodwill 4.6 6.3
(1) including minority interests
Relevant 2003
reporting
standard

Slide 13
PRESENTATION
� RESULTS OVERVIEW Slide 1
� CONSOLIDATED RESULTS Slide 4
� CREDIT SUISSE FINANCIAL SERVICES
� CREDIT SUISSE FIRST BOSTON Slide 22
� ADDITIONAL INFORMATION Slide 29
� DISCLAIMER Slide 42
Slide 14
CREDIT SUISSE FINANCIAL SERVICES
OVERVIEW (1/2)
Highlights
banking
segments
Results
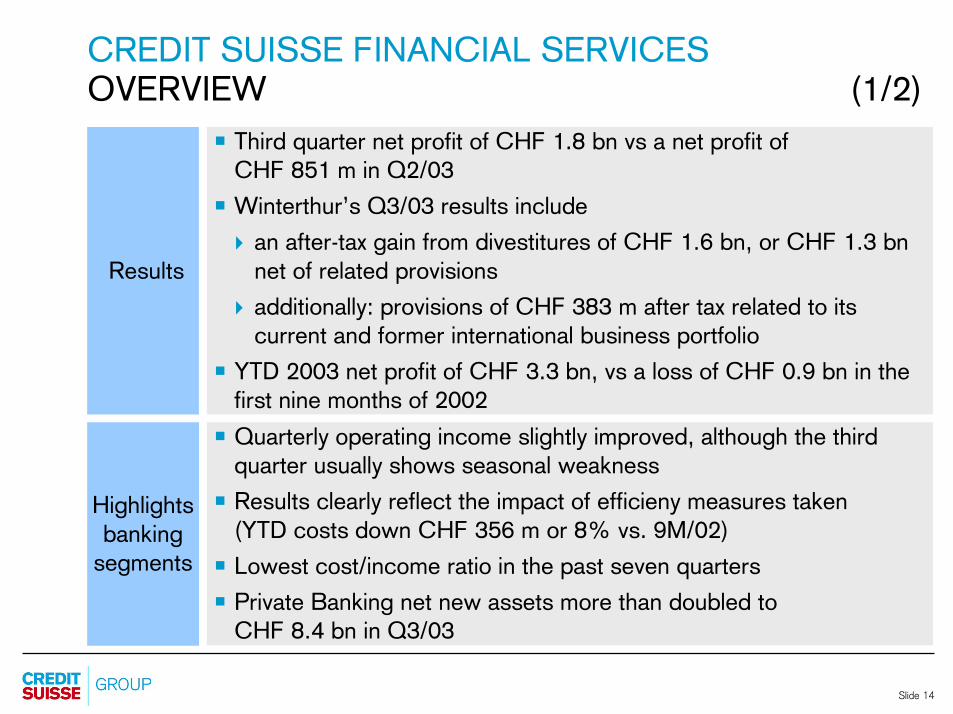
�Third quarter net profit of CHF 1.8 bn vs a net profit ofCHF 851 m in Q2/03
�Winterthur’s Q3/03 results include
� an after-tax gain from divestitures of CHF 1.6 bn, or CHF 1.3 bn
net of related provisions
� additionally: provisions of CHF 383 m after tax related to its
current and former international business portfolio
�YTD 2003 net profit of CHF 3.3 bn, vs a loss of CHF 0.9 bn in the
first nine months of 2002
�Quarterly operating income slightly improved, although the third
quarter usually shows seasonal weakness
�Results clearly reflect the impact of efficieny measures taken
(YTD costs down CHF 356 m or 8% vs. 9M/02)
�Lowest cost/income ratio in the past seven quarters
�Private Banking net new assets more than doubled to
CHF 8.4 bn in Q3/03

Slide 15
CREDIT SUISSE FINANCIAL SERVICES
OVERVIEW (2/2)
Highlights
insurance
segments
�Significantly improved investment results 9M/03
(Life & Pensions up CHF 2.7 bn; Insurance up CHF 1.0 bn)
�Steady progress in the underlying performance vs 9M/02 due to
� tariff increases, selective business renewals
� lower administration costs (in total down by CHF 315 m or 12%)
�Finalized sales of Churchill (UK), Winterthur Italy and
Republic (US)
� In isolation, these divestitures increased Winterthur Group’s
EU solvency surplus capital by approximately CHF 3.5 bn

Slide 16
Non-Life
WINTERTHUR SEGMENT PROFITS
(1) Churchill (UK), Winterthur Italy, Republic (US)(2) certain provisions related to Winterthur’s current and former international business portfolio
in CHF m Life Total
Segment profit Q3, including 991 126 1,117
after-tax gains from divestitures,net of related provisions (1) 1,268 57 1,325
additional provisions after tax (2) (383) – (383)
of which recognized in claims (117) – (117)

Slide 17
PRIVATE BANKING
Operating income 1,571 3% 4,489 (5%)
Segment result Key profit & loss items
Operating expenses 819 (4%) 2,501 (8%)
� Operating income up 3% vs Q2/03, gross margin
down 3 bp (to 125 bp) vs Q2/03
� Operating expenses 4% below Q2/03, in line with
headcount development
� Improved cost/income ratio of 55.1%, lowest ratio
in the past six quarters
� Net new assets more than doubled to CHF 8.4 bn
in Q3/03, higher AuM base
in CHF m
Net new assets
(CHF bn)
Gross
margin(bp)
C/I
ratio (%)
in C
HF
m
59.1 55.1 61.5 59.1
3.8 8.4 18.2 13.7
128 125 124 125
519492
1,4061,382
9 months
2003
2003
Q3Q2 2002
∆ vs Q2/03 9M/03Q3/03
∆ vs9M/02
+5%
+2%

Slide 18
CORPORATE & RETAIL BANKING
Operating income 789 (2%) 2,346 (3%)
Segment result Key profit & loss items
in C
HF
m
Operating expenses 483 (4%) 1,481 (9%)
Provisions (1) 65 (8%) 213 (9%)
65.8 64.4 70.7 66.3
Cost/incomeratio (%)
(1) valuation adjustments, provisions and losses (provisions based on expected credit losses derived from statistical model)
in CHF m
12.9 13.6 9.5 12.2ROE (%)
212 215 214 213
Net interestmargin (bp)
9 months
2003
2003
Q3Q2 2002
169156
445
364
+8%
+22%
∆ vs Q2/03 9M/03Q3/03
∆ vs9M/02
� Stable underlying operating income, net interest
margin up 3 bp vs Q2/03
� Operating expenses 4% below Q2/03, in line with
headcount development
� Improved cost/income ratio of 64.4%, lowest ratio
in the past seven quarters
� Further reduced impaired loans
Slide 19
LIFE & PENSIONS
Segment result Key profit & loss items
in C
HF
m
Return on
invested
assets (%)
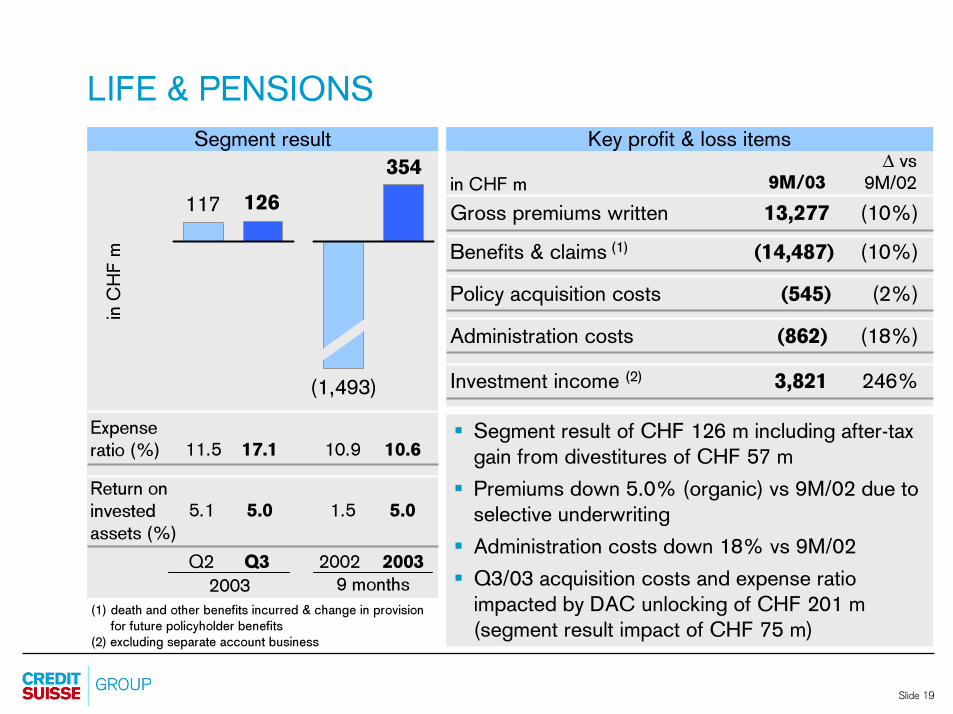
11.5 17.1 10.9 10.6
5.1 5.0 1.5 5.0
Expense
ratio (%)
(1) death and other benefits incurred & change in provision for future policyholder benefits
(2) excluding separate account business
in CHF m
Gross premiums written 13,277 (10%)
Benefits & claims (1) (14,487) (10%)
Policy acquisition costs (545) (2%)
Investment income (2) 3,821 246%
Administration costs (862) (18%)
9 months
2003
2003
Q3Q2 2002
9M/03
∆ vs 9M/02
� Segment result of CHF 126 m including after-tax
gain from divestitures of CHF 57 m
� Premiums down 5.0% (organic) vs 9M/02 due to
selective underwriting
� Administration costs down 18% vs 9M/02
� Q3/03 acquisition costs and expense ratio
impacted by DAC unlocking of CHF 201 m
(segment result impact of CHF 75 m)
126117
354
(1,493)

Slide 20
INSURANCE
Segment result Key profit & loss items
in C
HF
m
Return on invested
assets (%)
100.5 103.6 103.5 101.6
4.0 3.9 (0.3) 3.8
Combined ratio (%)
Net premiums earned 11,876 2%
in CHF m
Claims & annuities (8,689) 0%
Policy acquisition costs (2,018) 7%
Investment income 952 –
Administration costs (1,355) (8%)
991
102
1,185
(998)
9M/03
∆ vs9M/02
� Segment result of CHF 991 m including
� an after-tax gain from divestitures of CHF 1.6 bn,
or CHF 1.3 bn net of related provisions
� additional provisions of CHF 383 m after tax
� Premiums up 8.1% (organic) vs 9M/02, largely
driven by tariff increases
� Administration costs down 8% vs 9M/02
� Q3/03 reported combined ratio of 103.6%
includes CHF 117 m additional provisions
(corresponding to 3.1 ppt combined ratio) 9 months
2003
2003
Q3Q2 2002

Slide 21
CREDIT SUISSE FINANCIAL SERVICES
OUTLOOK
� CSFS expects a good overall result in 2003:
Overall: - Efficiency improvements
Banking: - Higher AuM base- Stable credit trend
- Seasonally higher costs in fourth quarter
Winterthur: - Improved technical results
- No contribution from divested businesses
going forward
� Life & Pensions remains exposed to volatility of the capital markets
Outlook
for 2003
Slide 22
PRESENTATION
� RESULTS OVERVIEW Slide 1
� CONSOLIDATED RESULTS Slide 4
� CREDIT SUISSE FINANCIAL SERVICES Slide 13
� CREDIT SUISSE FIRST BOSTON
� ADDITIONAL INFORMATION Slide 29
� DISCLAIMER Slide 42

Slide 23
CREDIT SUISSE FIRST BOSTON
OVERVIEW
� Cost containment continues to be a key goal
� Credit provisions continue to be at historically low levels
� Amortization of retention payments substantially completed
Results Q3/03
vs
Q2/03
Highlights
� Net operating profit(1) of USD 358 m, down 13% from USD 412 m
� Net profit down 21% to USD 224 m
� Operating income of USD 2.4 bn, down 22% primarily as
conservative risk positioning dampened fixed income trading results
� Operating expenses reduced by 21% to USD 1.8 bn due to lower
compensation accruals
� Compensation/revenue ratio(2) reduced to 48.5% from 52.2% due
to positive net impact of USD 90 m from change in vesting of stock
awards and related incremental incentive compensation accruals
� Pre-tax operating margin(2) comparable at 17.4%
� Return on average allocated capital(2) of 16.9% vs 18.0%
(1) excluding amortization of acquired intangible assets and goodwill, net of tax(2) excluding certain acquisition-related costs not allocated to the segments and reflecting certain other reclassifications
Slide 24
CREDIT SUISSE FIRST BOSTON
KEY FINANCIAL RESULTS
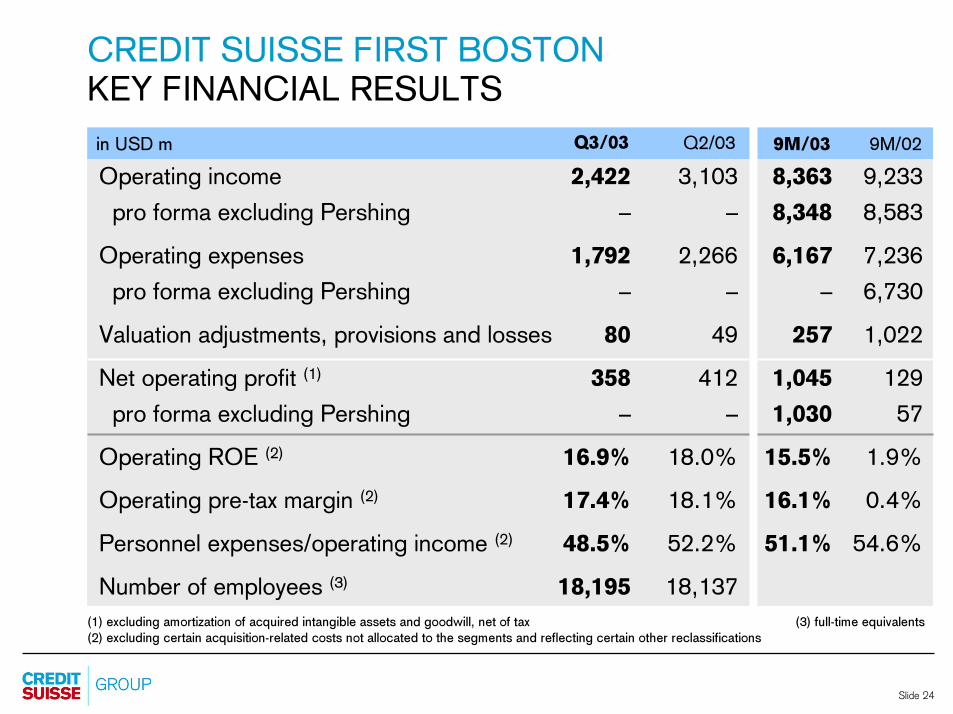
Operating income 2,422 3,103 8,363 9,233
pro forma excluding Pershing – – 8,348 8,583
Operating expenses 1,792 2,266 6,167 7,236
pro forma excluding Pershing – – – 6,730
Valuation adjustments, provisions and losses 80 49 257 1,022
Net operating profit (1) 358 412 1,045 129
pro forma excluding Pershing – – 1,030 57
Operating ROE (2) 16.9% 18.0% 15.5% 1.9%
Operating pre-tax margin (2) 17.4% 18.1% 16.1% 0.4%
Personnel expenses/operating income (2) 48.5% 52.2% 51.1% 54.6%
Number of employees (3) 18,195 18,137
(1) excluding amortization of acquired intangible assets and goodwill, net of tax (3) full-time equivalents(2) excluding certain acquisition-related costs not allocated to the segments and reflecting certain other reclassifications
in USD m Q2/03Q3/03 9M/03 9M/02
Slide 25
INSTITUTIONAL SECURITIES
OVERVIEW
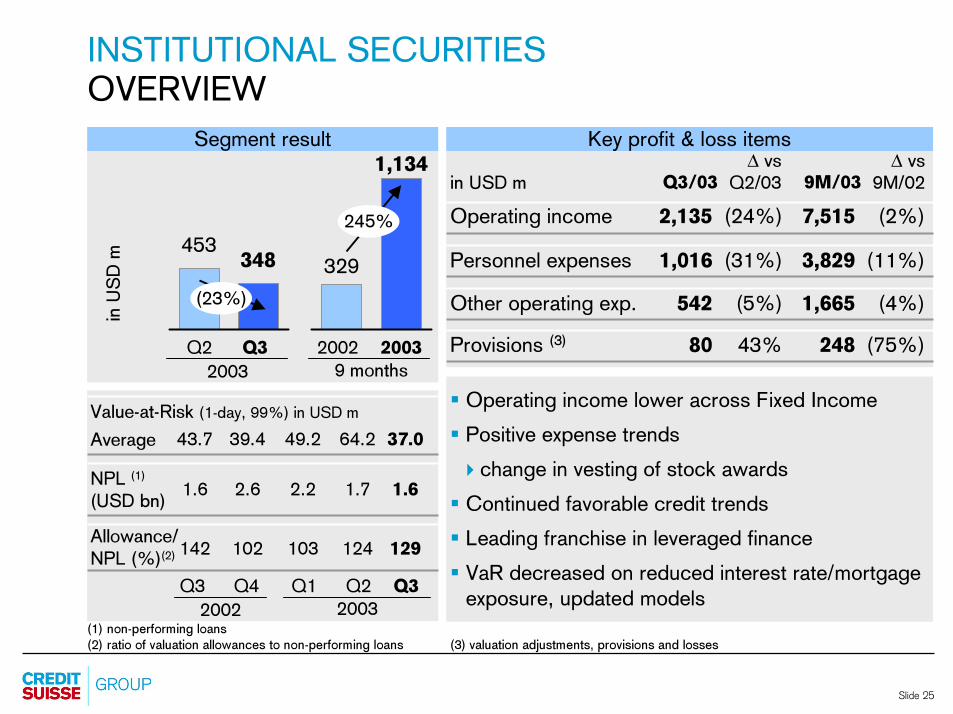
Operating income 2,135 (24%) 7,515 (2%)
Segment result Key profit & loss items
Personnel expenses 1,016 (31%) 3,829 (11%)
Other operating exp. 542 (5%) 1,665 (4%)
� Operating income lower across Fixed Income
� Positive expense trends
� change in vesting of stock awards
� Continued favorable credit trends
� Leading franchise in leveraged finance
� VaR decreased on reduced interest rate/mortgage
exposure, updated models
(1) non-performing loans(2) ratio of valuation allowances to non-performing loans (3) valuation adjustments, provisions and losses
∆ vsQ2/03 9M/03in USD m Q3/03
∆ vs9M/02
Provisions (3) 80 43% 248 (75%)
in U
SD
m 348453
1,134
329
(23%)
245%
Value-at-Risk (1-day, 99%) in USD m
Average
Allowance/
NPL (%)(2)
43.7 39.4 49.2 64.2 37.0
142 102 103 124 129
NPL (1)
(USD bn)1.6 2.6 2.2 1.7 1.6
2003
Q2
2002
Q3 Q4 Q1 Q3
9 months
2003
2003
Q3Q2 2002
Slide 26
INSTITUTIONAL SECURITIES
OPERATING INCOME
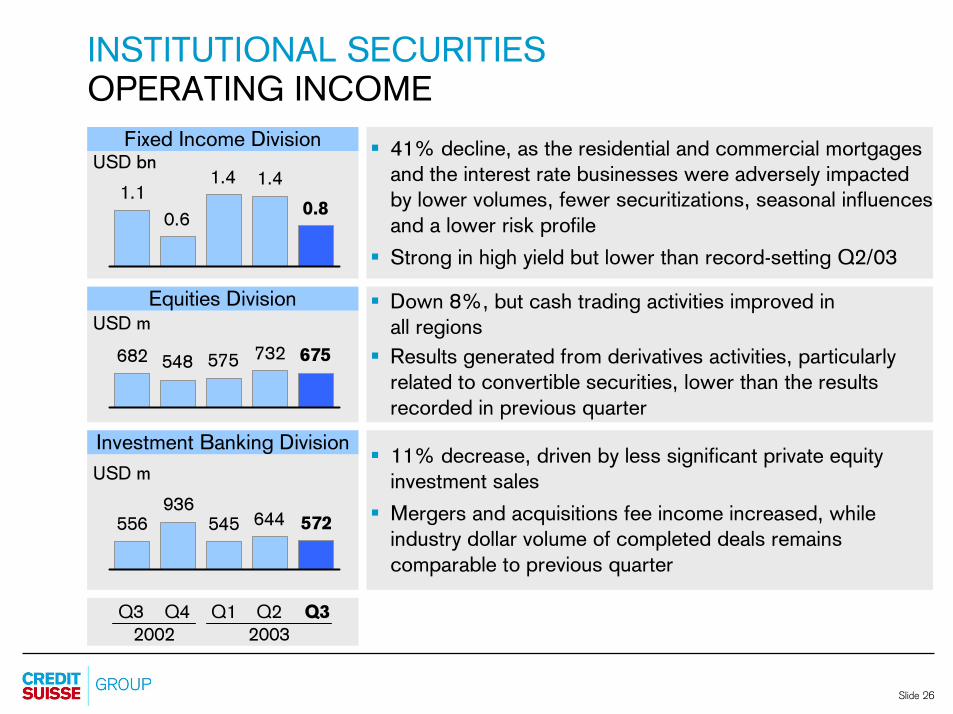
Fixed Income Division
Equities Division
Investment Banking Division
1.1
0.6
1.4
USD m
682 548 575
� 41% decline, as the residential and commercial mortgages
and the interest rate businesses were adversely impacted
by lower volumes, fewer securitizations, seasonal influences
and a lower risk profile
� Strong in high yield but lower than record-setting Q2/03
� Down 8%, but cash trading activities improved in
all regions
� Results generated from derivatives activities, particularly
related to convertible securities, lower than the results
recorded in previous quarter
� 11% decrease, driven by less significant private equity
investment sales
� Mergers and acquisitions fee income increased, while
industry dollar volume of completed deals remains
comparable to previous quarter
USD bn
USD m
556936
545
1.4
732
644
20032002
Q1Q4 Q2 Q3Q3
0.8
675
572
Slide 27
CSFB FINANCIAL SERVICES
OVERVIEW
Segment result Key profit & loss items
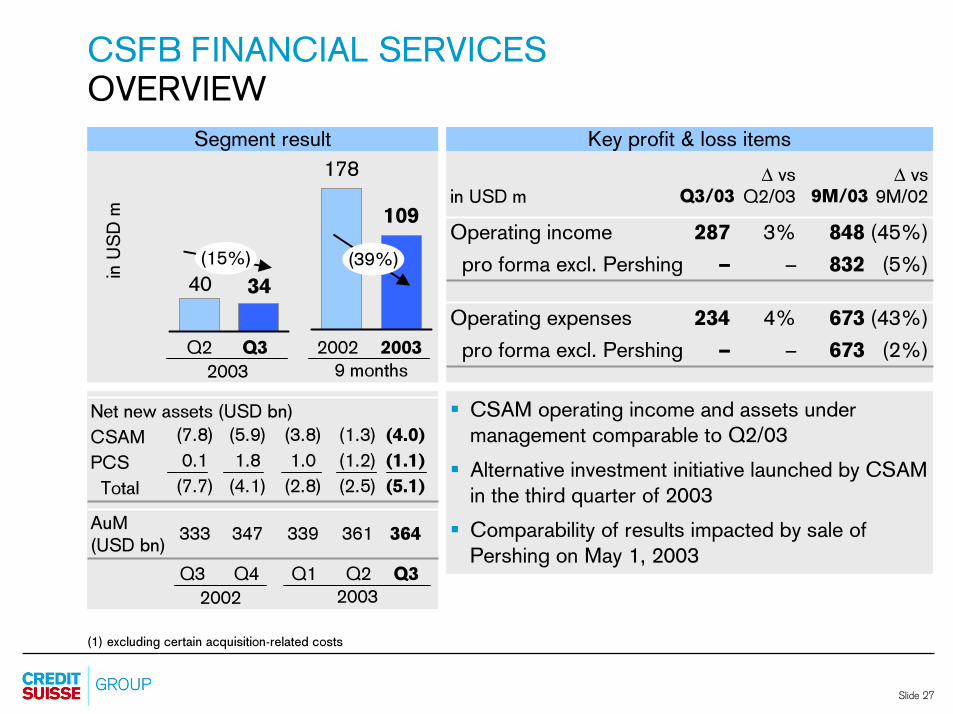
� CSAM operating income and assets under
management comparable to Q2/03
� Alternative investment initiative launched by CSAM
in the third quarter of 2003
� Comparability of results impacted by sale of
Pershing on May 1, 2003
(1) excluding certain acquisition-related costs
∆ vsQ2/03 9M/03in USD m Q3/03
∆ vs9M/02
Operating income 287 3% 848 (45%)
pro forma excl. Pershing – – 832 (5%)
in U
SD
m
3440
178
(39%)
Operating expenses 234 4% 673 (43%)
pro forma excl. Pershing – – 673 (2%)
109
(15%)
333 347 339 361 364AuM
(USD bn)
(7.8) (5.9) (3.8) (1.3) (4.0)
0.1 1.8 1.0 (1.2) (1.1)
(7.7) (4.1) (2.8) (2.5) (5.1)
Net new assets (USD bn)
CSAM
PCS
Total
2003
Q2
2002
Q3 Q4 Q1 Q3
9 months
2003
2003
Q3Q2 2002
Slide 28
CREDIT SUISSE FIRST BOSTON
OUTLOOK
Outlook
for 2003
� Outlook remains optimistic, despite seasonally lower revenues
expected for the fourth quarter
� Progress towards sustained profitability
� Continued focus on client needs
� Core businesses remain challenging, with many of our markets
operating at historically low levels
� While making continued progress, profitability still not satisfactory
Slide 29
PRESENTATION
� RESULTS OVERVIEW Slide 1
� CONSOLIDATED RESULTS Slide 4
� CREDIT SUISSE FINANCIAL SERVICES Slide 13
� CREDIT SUISSE FIRST BOSTON Slide 22
� ADDITIONAL INFORMATION
� DISCLAIMER Slide 42

Slide 30
ADDITIONAL INFORMATION
INDEX
Winterthur
- Additional information on divestitures at Winterthur (Slides 31 to 32)
- Investment result general account (Slide 33)
- Investment portfolio - asset allocation (Slide 34)
- Equity base development (Slide 35)
Credit Suisse Private Banking
- Development of gross margin (Slide 36)
- AuM by product and currency (Slide 37)
Credit Suisse First Boston
- Operating income detail Investment Banking (Slide 38)
- "Legacy" assets (Slides 39 to 40)
- Counterparty exposure by industry (Slide 41)
Slide 31
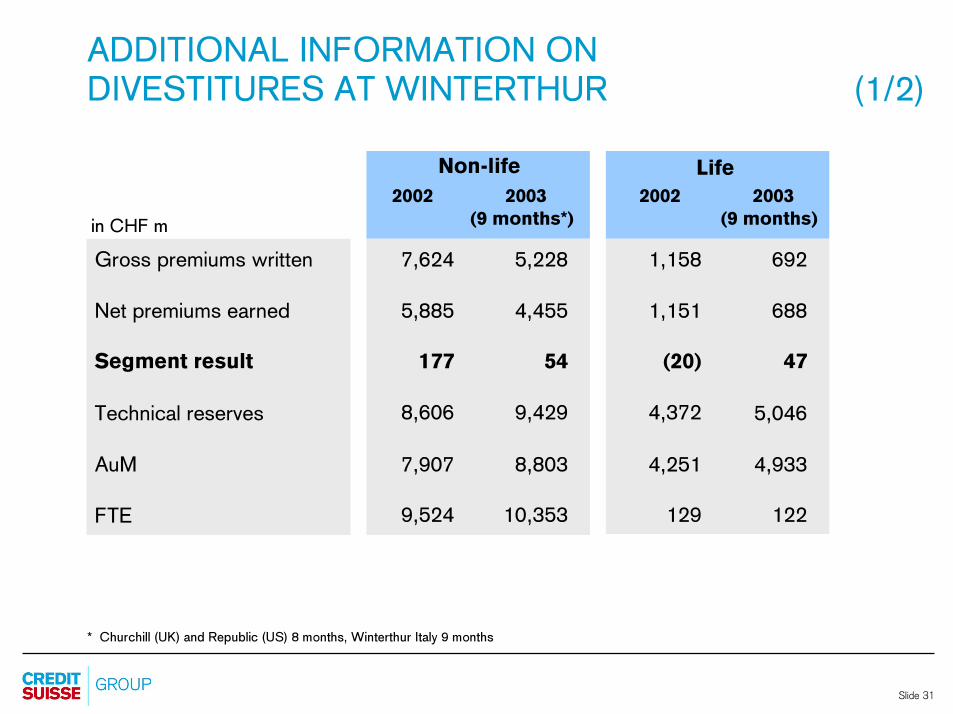
ADDITIONAL INFORMATION ON
DIVESTITURES AT WINTERTHUR (1/2)
in CHF m
LifeNon-life
2002 2003
(9 months*)
2002 2003
(9 months)
* Churchill (UK) and Republic (US) 8 months, Winterthur Italy 9 months
7,624
5,885
177
8,606
7,907
9,524
5,228
4,455
54
9,429
8,803
10,353
1,158
1,151
(20)
4,372
4,251
129
692
688
47
5,046
4,933
122
Gross premiums written
Net premiums earned
Segment result
Technical reserves
AuM
FTE

Slide 32
Non-Life
ADDITIONAL INFORMATION ON
DIVESTITURES AT WINTERTHUR (2/2)
in CHF m Life Total
Sales proceeds (1) 4,376 434 4,810
./. Book value (2,575) (369) (2,944)
./. Goodwill (90) (90)
./. Tax impact (135) (8) (143)
Gross gains on sales, after tax 1,576 57 1,633
./. Sales related provisions
booked as other expenses (275) (275)
./. Sales related provisions
booked as claims (technical) (97) (97)
Tax impact 64 64
After-tax gains on sales,
net of related provisions 1,268 57 1,325
(1) Churchill (UK), Winterthur Italy, Republic (US)

Slide 33
WINTERTHUR GROUP
INVESTMENT RESULT GENERAL ACCOUNT
Note: Q1 to Q3 2002 reclassified to the current presentation format, including real estate for own use, interest paid from current income and realized gains/losses
Current income 1,236 1,435 1,203 1,222 1,255 1,394 1,359
Realized gains 1,346 1,389 2,353 333 1,327 821 688
Realized losses (647) (2,129) (1,589) (373) (633) (411) (193)
Impairments (942) (857) (1,413) (675) (328) (52) (75)
Other (114) (100) (135) (115) (111) (141) (127)
Investment income (P&L) 879 (262) 419 392 1,510 1,611 1,652
2002(1)
Q2 Q3 Q4Q1 Q1
2003(1)
Q2 Q3
in CHF m
Slide 34
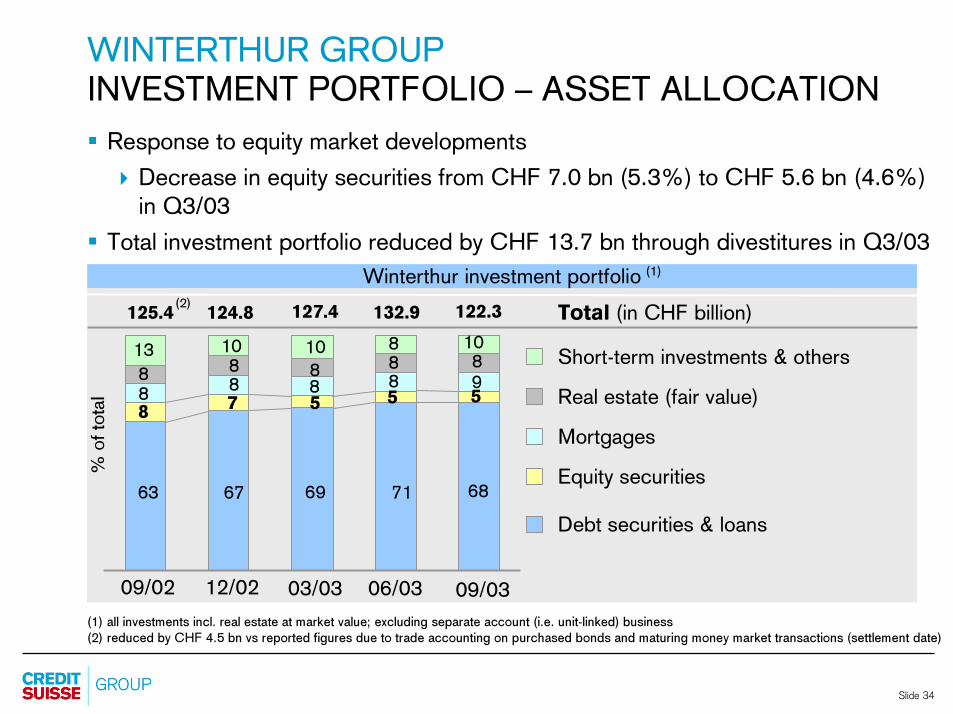
WINTERTHUR GROUP
INVESTMENT PORTFOLIO – ASSET ALLOCATION
� Response to equity market developments
� Decrease in equity securities from CHF 7.0 bn (5.3%) to CHF 5.6 bn (4.6%)in Q3/03
� Total investment portfolio reduced by CHF 13.7 bn through divestitures in Q3/03
Winterthur investment portfolio
Real estate (fair value)
Mortgages
Equity securities
Debt securities & loans
(1) all investments incl. real estate at market value; excluding separate account (i.e. unit-linked) business(2) reduced by CHF 4.5 bn vs reported figures due to trade accounting on purchased bonds and maturing money market transactions (settlement date)
Short-term investments & others
12/02
(1)
(2)
13
88
63
8
Total (in CHF billion)
% o
f to
tal
125.4
09/02
124.8
10
8
67
7
127.4
03/03
10
69
5
88
06/03
132.9
888
71
85
108
68
5
09/03
122.3
9

Slide 35
WINTERTHUR GROUP
EQUITY BASE DEVELOPMENT IN 2003
� Significant increase of CHF 1.4 billion in shareholders' equity in 9M/03
Winterthur shareholders' equity
(1) net of tax and policyholder participation
12/02 Dividends
paid
Net unrealized
gains/losses (netto)(1)
FX changes;
otherNet profit Minority
interests
09/03
5 5876 960
-318+148
+1,493 +50
0
in CHF m
Slide 36
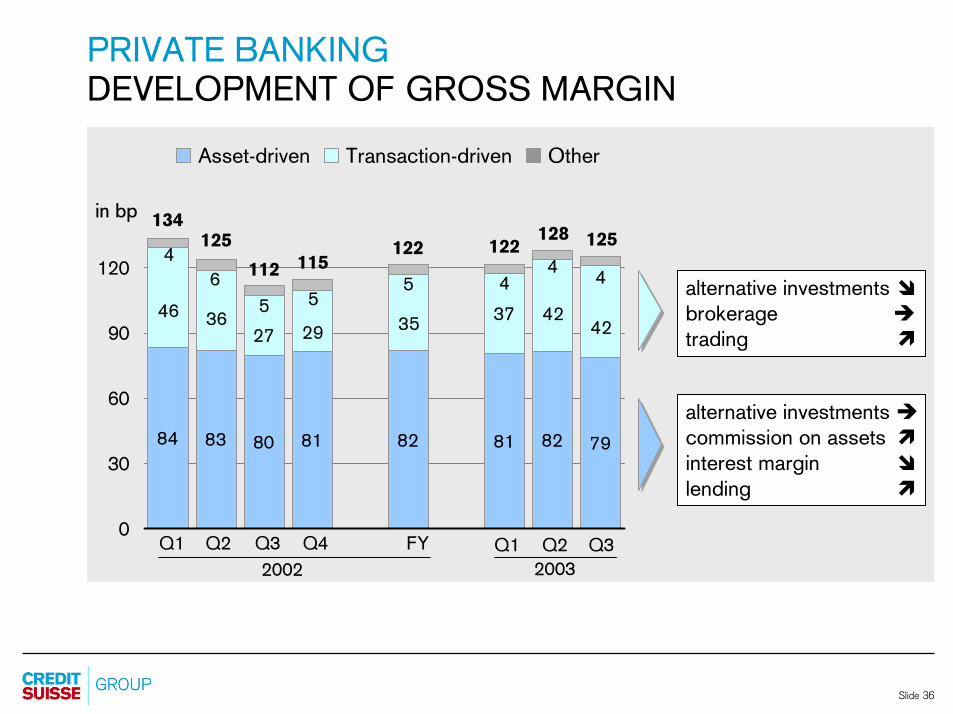
PRIVATE BANKING
DEVELOPMENT OF GROSS MARGIN
80 81 82 81 82 79
37
84 83
4242
352927
3646
4 44
55
5
6
4
0
30
60
90
120
134125 122
112
OtherTransaction-drivenAsset-driven
in bp
alternative investments �
brokerage �
trading �
alternative investments �
commission on assets �
interest margin �
lending �
122128
Q1 Q2 Q3
2002
Q4 FY
2003
Q1 Q2 Q3
125
115

Slide 37
PRIVATE BANKING
AUM BY PRODUCT AND CURRENCY
AuM categories by product(incl. investments in funds)
27% 29% 27% 26%
33%34%
33% 32%
23% 21% 23%
17% 16% 17% 17%
25%
Liquidity &money markets
Fixedincome
Equities
Balanced
12/02 03/03
AuM categories by currency
30% 32% 32% 32%
36% 35% 35% 34%
27% 26% 26% 26%
8%7%7%7%Other
EUR
USD
CHF
09/0312/02 03/0306/03 06/0309/03
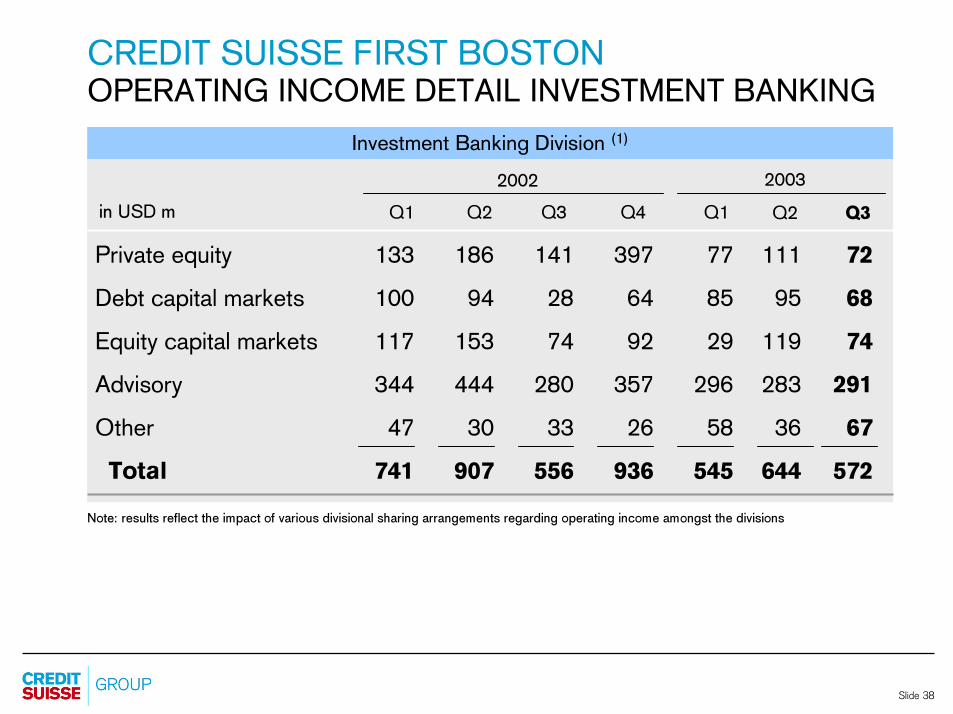
Slide 38
CREDIT SUISSE FIRST BOSTONOPERATING INCOME DETAIL INVESTMENT BANKING
Investment Banking Division (1)
Note: results reflect the impact of various divisional sharing arrangements regarding operating income amongst the divisions
Private equity 133 186 141 397 77 111 72
Debt capital markets 100 94 28 64 85 95 68
Equity capital markets 117 153 74 92 29 119 74
Advisory 344 444 280 357 296 283 291
Other 47 30 33 26 58 36 67
Total 741 907 556 936 545 644 572
in USD m
20032002
Q3Q2 Q4 Q1Q1 Q2 Q3

Slide 39
CREDIT SUISSE FIRST BOSTON
"LEGACY" ASSETS (1/2)"Legacy" assets net exposure
8,964 Real estate
11,925 1,975 Distressed
986 Private equity (1,228 unfunded commitment)
in USD m
12/1999
2,925 Real estate
5,357 1,107 Distressed
1,325 Private equity (857 unfunded commitment)
12/2001
1,535 Real estate
3,031 512 Distressed
984 Private equity (785 unfunded commitment)
12/2002
12/2000
4,805 Real estate
8,026 1,498 Distressed
1,724 Private equity (984 unfunded commitment)
Note:- Unfunded commitments
excluded for private equity- Unfunded commitments
included for real estate- Private equity unfunded
commitments include employee commitments
1,052 Real estate
2,498 539 Distressed
907 Private equity (863 unfunded commitment)
06/2003
09/2003
978 Real estate
2,438 532 Distressed
928 Private equity (778 unfunded commitment)
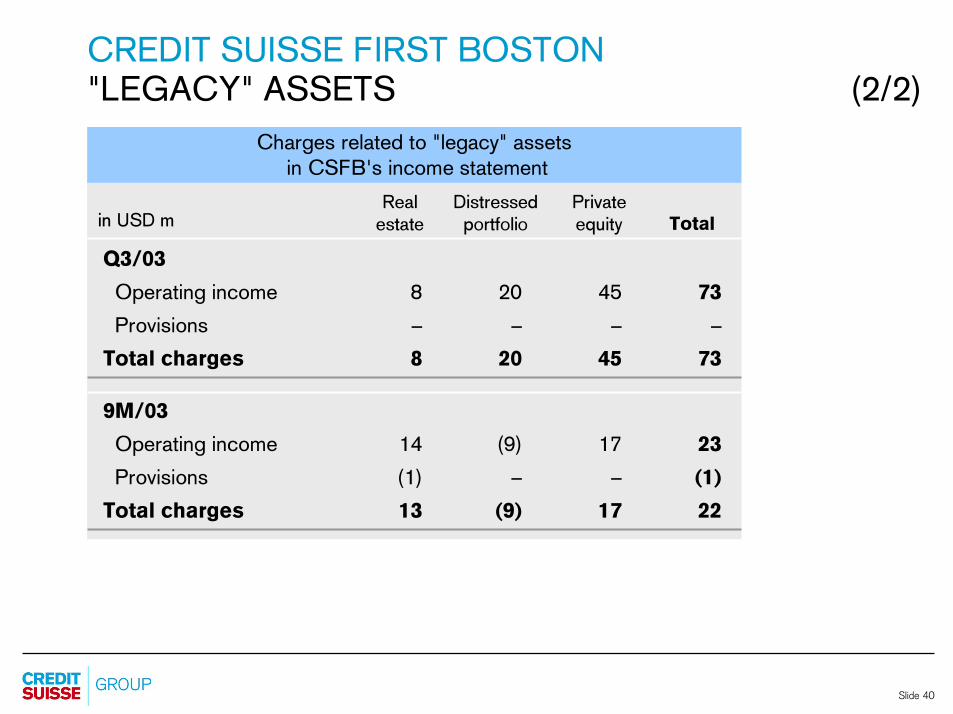
Slide 40
CREDIT SUISSE FIRST BOSTON
"LEGACY" ASSETS (2/2)
Charges related to "legacy" assets
in CSFB's income statement
Q3/03
Operating income 8 20 45 73
Provisions – – – –
Total charges 8 20 45 73
Real estate
Distressed portfolio
Private equity Totalin USD m
9M/03
Operating income 14 (9) 17 23
Provisions (1) – – (1)
Total charges 13 (9) 17 22

Slide 41
CREDIT SUISSE FIRST BOSTON
COUNTERPARTY EXPOSURE BY INDUSTRY
Note:
(1) Current exposure equals committed amount (includes only drawn commitments) for lending plus mark-to-market for counterparty trading less credit protection.
Selected CSFB exposure as of September 30, 2003 (1)
Current Undrawn Net
exposure commitments Reserves exposure
Telecommunications 1,347 1,717 (321) 2,743
Telecommunications
manufacturers 39 201 (14) 226
Merchant energy 789 130 (151) 768
Airlines 625 39 (202) 462
in USD m

Slide 42
DISCLAIMER
Cautionary Statement regarding forward-looking information
This presentation contains forward-looking statements within the meaning of the Private
Securities Litigation Reform Act of 1995.
Forward-looking statements involve inherent risks and uncertainties, and we might not be
able to achieve the predictions, forecasts, projections and other outcomes we describe or
imply in forward-looking statements. A number of important factors could cause results to
differ materially from the plans, objectives, expectations, estimates and intentions we
express in these forward-looking statements, including those we identify in "Risk Factors" in
our Annual Report on Form 20-F for the fiscal year ended December 31, 2002 filed with the
US Securities and Exchange Commission, and in other public filings and press releases.
We do not intend to update these forward-looking statements except as may be required by
applicable laws.
Quarterly Report 2003/Q3 — Non-GAAP Financial Information
For additional information with respect to our results for the third quarter, we refer you to
our “Quarterly Report 2003/Q3”, posted on our website at www.credit-suisse.com. This
presentation may contain non-GAAP financial information. A reconciliation of such non-
GAAP financial information to the most directly comparable measures under Swiss
generally accepted accounting principles (as well other related information), is also included
in our Quarterly Report 2003/Q3.