credit-suisse presentation slides
TRANSCRIPT
QUARTERLY RESULTS 2004 Q4

Slide 1
DISCLAIMER
Cautionary statement regarding forward-looking information
This presentation contains forward-looking statements within the meaning of the Private Securities Litigation Reform Act of 1995.
Forward-looking statements involve inherent risks and uncertainties, andwe might not be able to achieve the predictions, forecasts, projections and other outcomes we describe or imply in forward-looking statements.
A number of important factors could cause results to differ materially from the plans, objectives, expectations, estimates and intentions we express in these forward-looking statements, including those we identify in"Risk Factors" in our Annual Report on Form 20-F for the fiscal yearended December 31, 2003 filed with the US Securities and Exchange Commission, and in other public filings and press releases.
We do not intend to update these forward-looking statements except as may be required by applicable laws.

Slide 2
GOOD FULL-YEAR RESULTS
Net income 5,628 959
Basic earnings per share (in CHF) 4.80 0.82
Return on equity 15.9% 10.6%
BIS Tier 1 ratio (31.12.04) 12.3%
in CHF m 4Q042004
� Fourth quarter results include increase in provision of CHF 242 m related to the 2001 sale of Winterthur International, loss on disposal of a minority holding of CHF 148 m and severance payments at CSFB of CHF 112 m (all after tax)
� Strong momentum in capital generation
� Dividend proposed of CHF 1.50 per share
� Ask Annual General Meeting for permission to repurchase shares for up to CHF 6 bn over two years
Slide 3
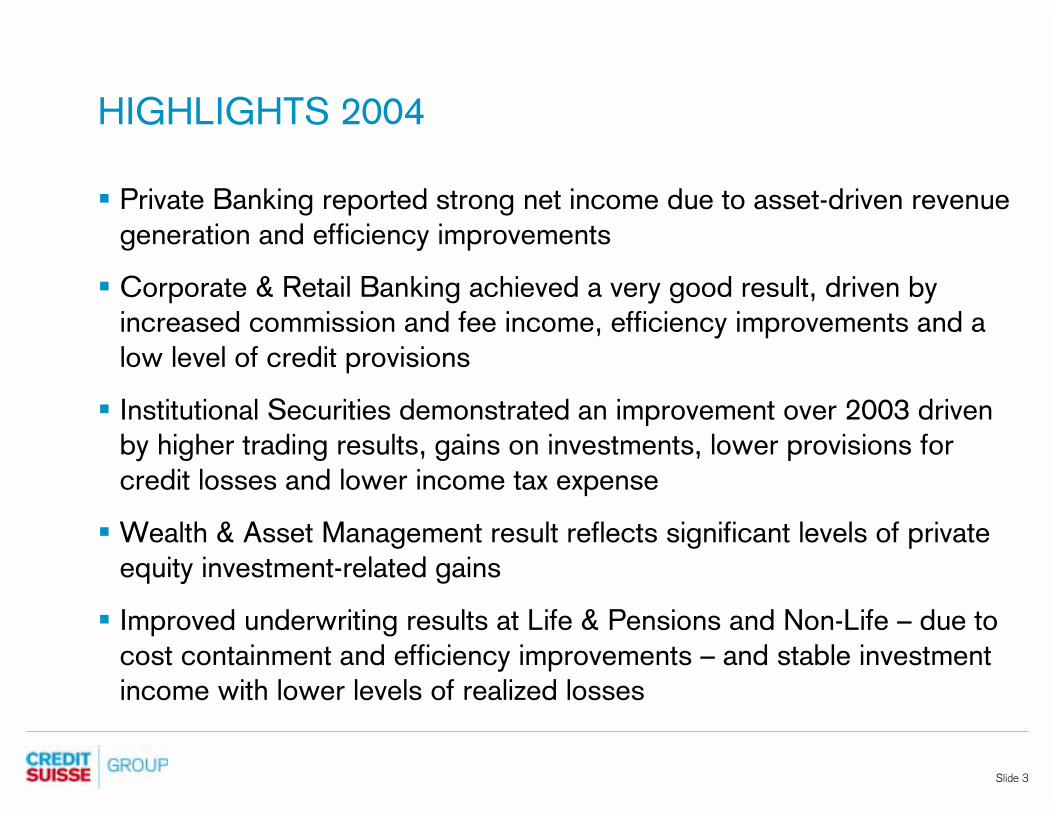
HIGHLIGHTS 2004
� Private Banking reported strong net income due to asset-driven revenue generation and efficiency improvements
� Corporate & Retail Banking achieved a very good result, driven by increased commission and fee income, efficiency improvements and a low level of credit provisions
� Institutional Securities demonstrated an improvement over 2003 driven by higher trading results, gains on investments, lower provisions for credit losses and lower income tax expense
� Wealth & Asset Management result reflects significant levels of private equity investment-related gains
� Improved underwriting results at Life & Pensions and Non-Life – due to cost containment and efficiency improvements – and stable investment income with lower levels of realized losses
Slide 4
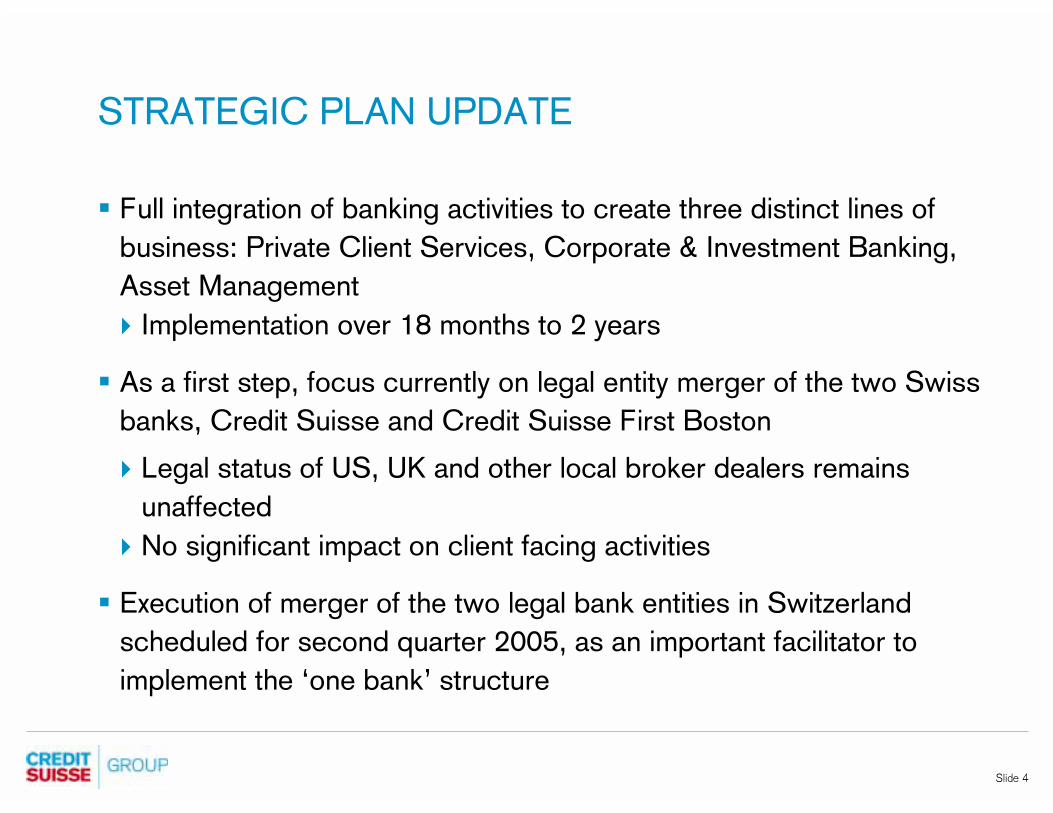
STRATEGIC PLAN UPDATE
� Full integration of banking activities to create three distinct lines of
business: Private Client Services, Corporate & Investment Banking,
Asset Management
� Implementation over 18 months to 2 years
� As a first step, focus currently on legal entity merger of the two Swiss
banks, Credit Suisse and Credit Suisse First Boston
� Legal status of US, UK and other local broker dealers remains
unaffected
� No significant impact on client facing activities
� Execution of merger of the two legal bank entities in Switzerland
scheduled for second quarter 2005, as an important facilitator to
implement the ‘one bank’ structure

Slide 5
FINANCIAL REVIEW 2004 Q4
Slide 6
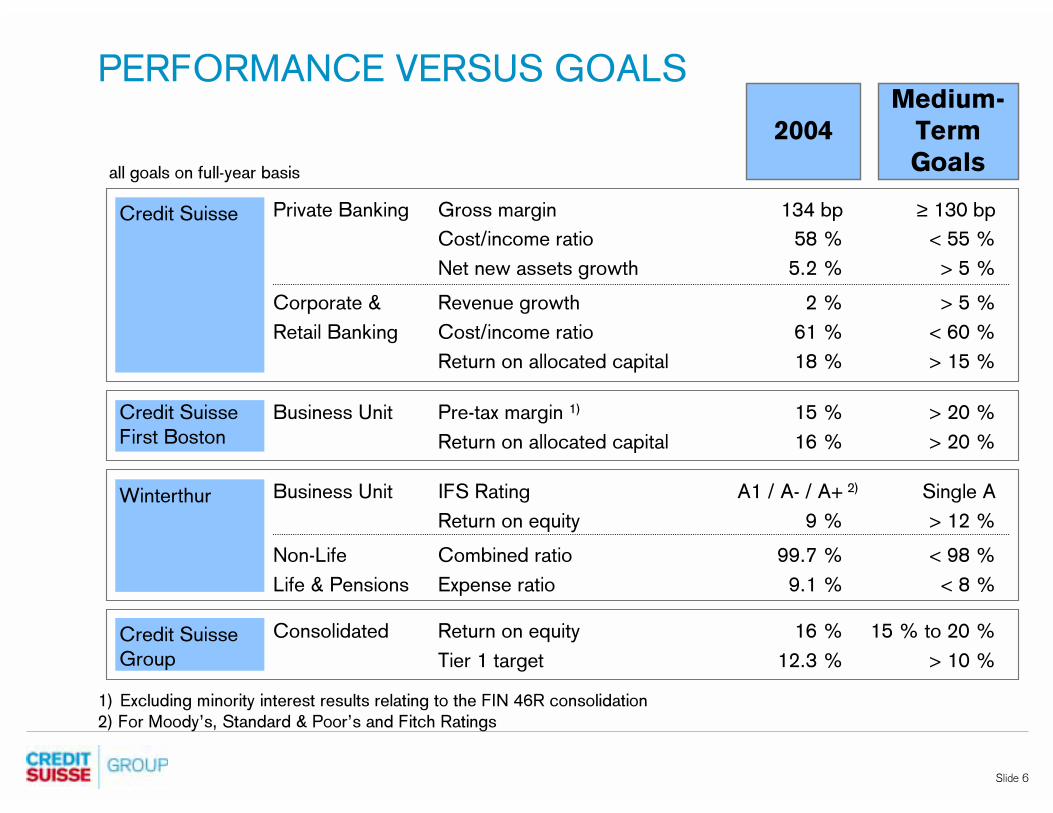
PERFORMANCE VERSUS GOALSMedium-
Term
Goals
Consolidated Return on equity 16 % 15 % to 20 %
Tier 1 target 12.3 % > 10 %
Private Banking Gross margin 134 bp ≥ 130 bp
Cost/income ratio 58 % < 55 %
Net new assets growth 5.2 % > 5 %
Corporate & Revenue growth 2 % > 5 %
Retail Banking Cost/income ratio 61 % < 60 %
Return on allocated capital 18 % > 15 %
2004
Business Unit Pre-tax margin 1) 15 % > 20 %
Return on allocated capital 16 % > 20 %
Business Unit IFS Rating A1 / A- / A+ Single A
Return on equity 9 % > 12 %
Non-Life Combined ratio 99.7 % < 98 %
Life & Pensions Expense ratio 9.1 % < 8 %
all goals on full-year basis
1) Excluding minority interest results relating to the FIN 46R consolidation
2) For Moody’s, Standard & Poor’s and Fitch Ratings
Credit Suisse
First Boston
Credit Suisse
Winterthur
Credit Suisse Group
2)
Slide 7
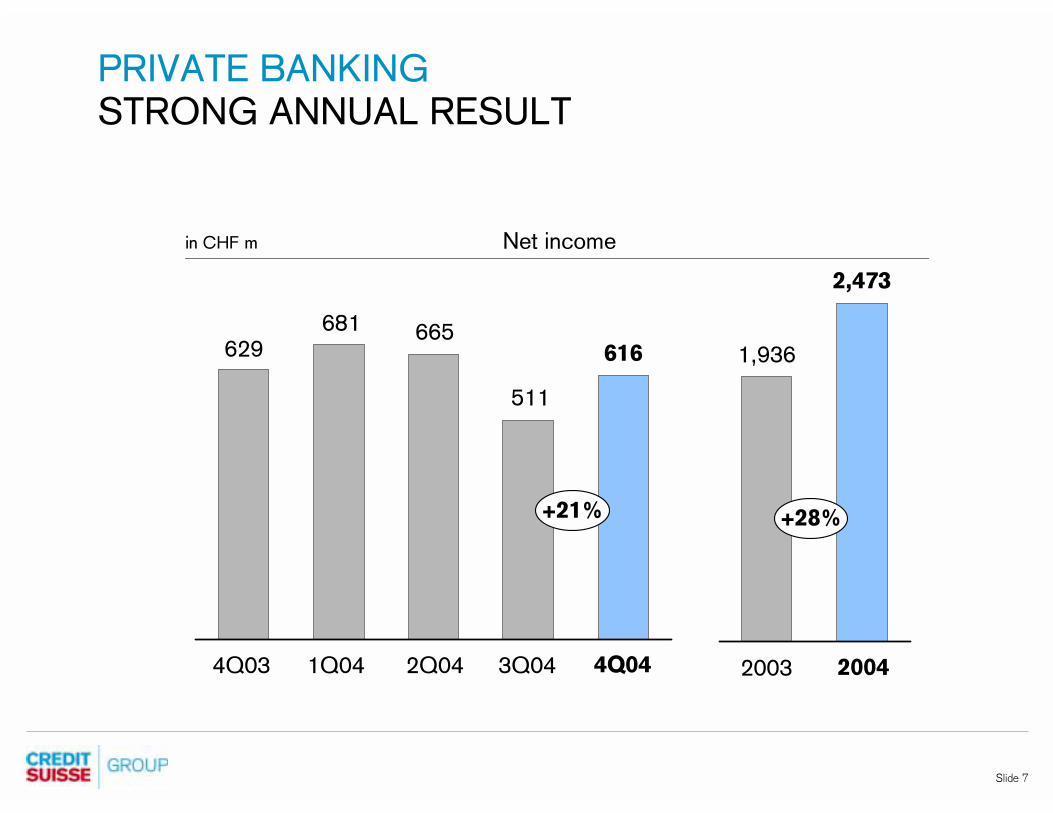
PRIVATE BANKING
STRONG ANNUAL RESULT
Net incomein CHF m
2003 20042Q04 3Q04 4Q044Q03 1Q04
665616629
681
511
1,936
2,473
+28%+21%
Slide 8
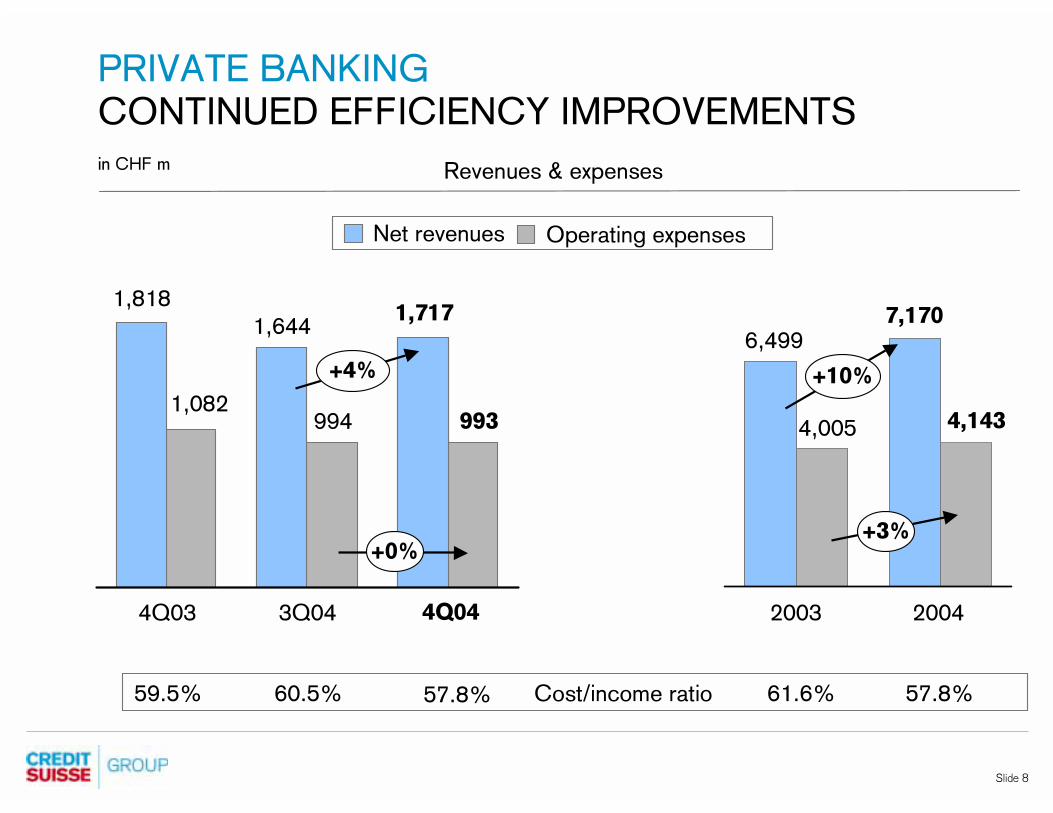
PRIVATE BANKING
CONTINUED EFFICIENCY IMPROVEMENTS
Net revenues Operating expenses
Revenues & expensesin CHF m
7,1706,499
2003 2004
4,1434,005
+10%
+3%
1,6441,818
9941,082
+0%
4Q03 3Q04 4Q04
1,717
993
Cost/income ratio 61.6% 57.8%57.8%
+4%
60.5%59.5%
Slide 9
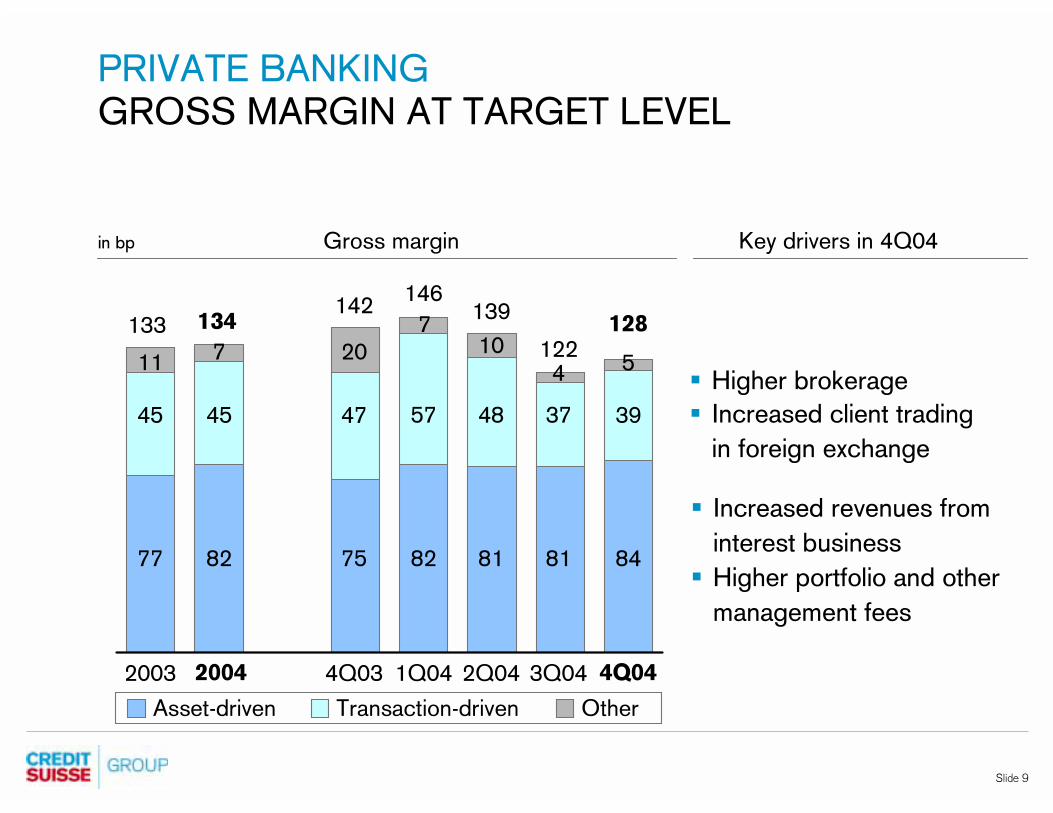
PRIVATE BANKING
GROSS MARGIN AT TARGET LEVEL
Key drivers in 4Q04Gross marginin bp
Asset-driven Transaction-driven Other
142146
139
� Higher brokerage
� Increased client trading
in foreign exchange
1Q044Q03 2Q04 3Q04 4Q04
107
20
818275
485747
122
81
37
4
128
84
5
39
� Increased revenues from
interest business
� Higher portfolio and other
management fees
2003 2004
133
11
77
45
134
7
82
45
Slide 10
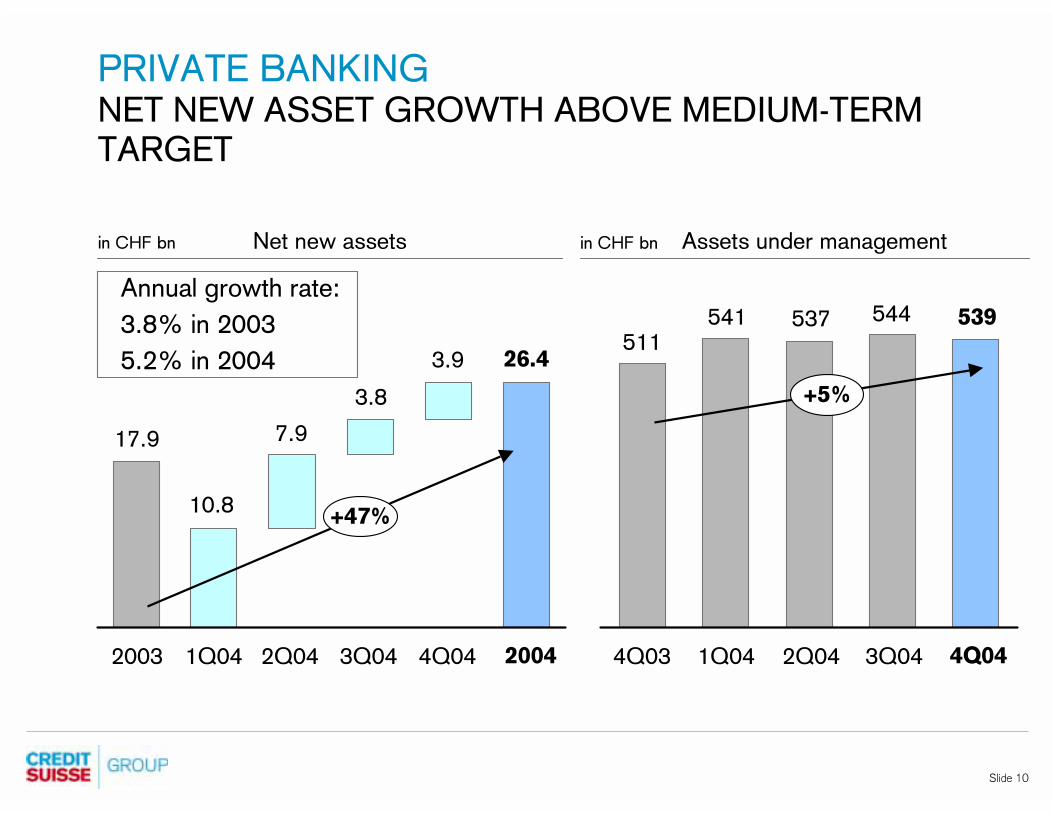
Assets under managementNet new assetsin CHF bn
17.9
10.8
7.9
537541511
539
1Q04 2Q04 3Q04 4Q04 1Q044Q03 2Q04 3Q04 4Q04
in CHF bn
26.4
544
3.9
PRIVATE BANKINGNET NEW ASSET GROWTH ABOVE MEDIUM-TERM
TARGET
Annual growth rate:
3.8% in 2003
5.2% in 2004
3.8
2003 2004
+47%
+5%

Slide 11
CORPORATE & RETAIL BANKING
VERY GOOD ANNUAL RESULT
Net incomein CHF m
2003 20042Q04 3Q04 4Q044Q03 1Q04
256 257
50
189 199
586
901
+54%
+29%
Slide 12
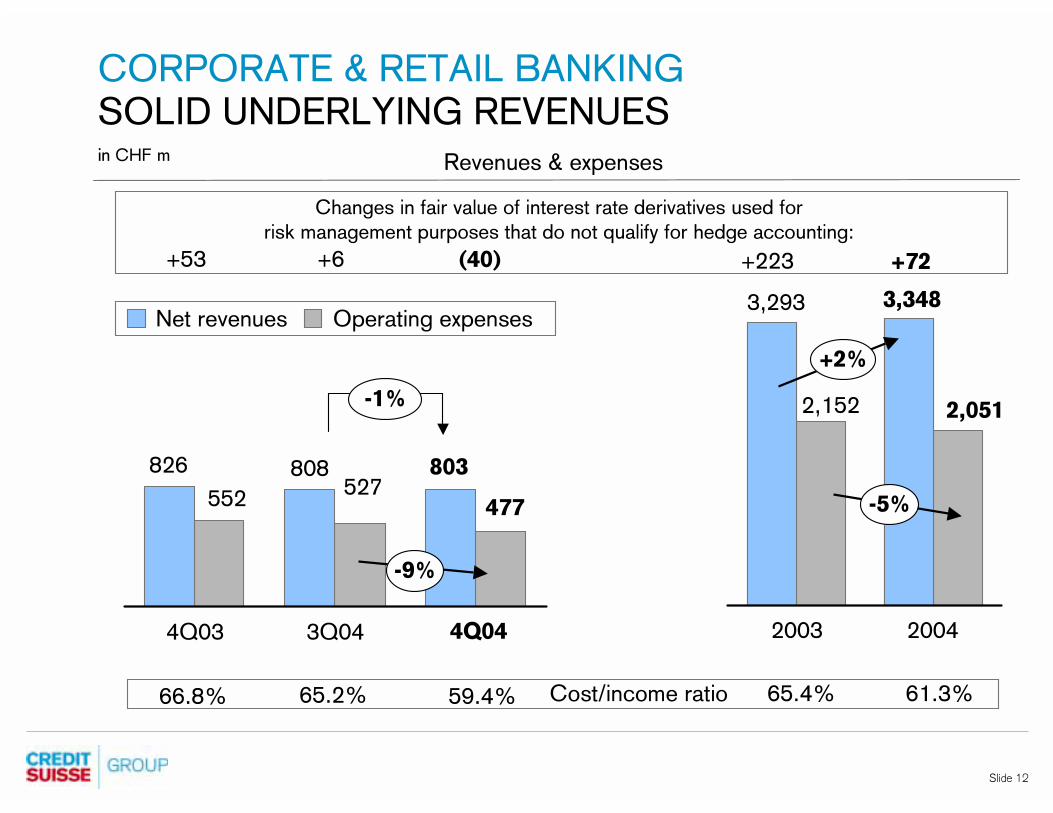
CORPORATE & RETAIL BANKING
SOLID UNDERLYING REVENUES
Net revenues Operating expenses
Revenues & expensesin CHF m
3,348
2003 2004
2,051
+2%
-5%
808826527
552
-9%
4Q03 3Q04 4Q04
803
477
-1%
Cost/income ratio 65.4% 61.3%59.4%
Changes in fair value of interest rate derivatives used for
risk management purposes that do not qualify for hedge accounting:
+223 +72+53 +6 (40)
3,293
2,152
65.2%66.8%
Slide 13
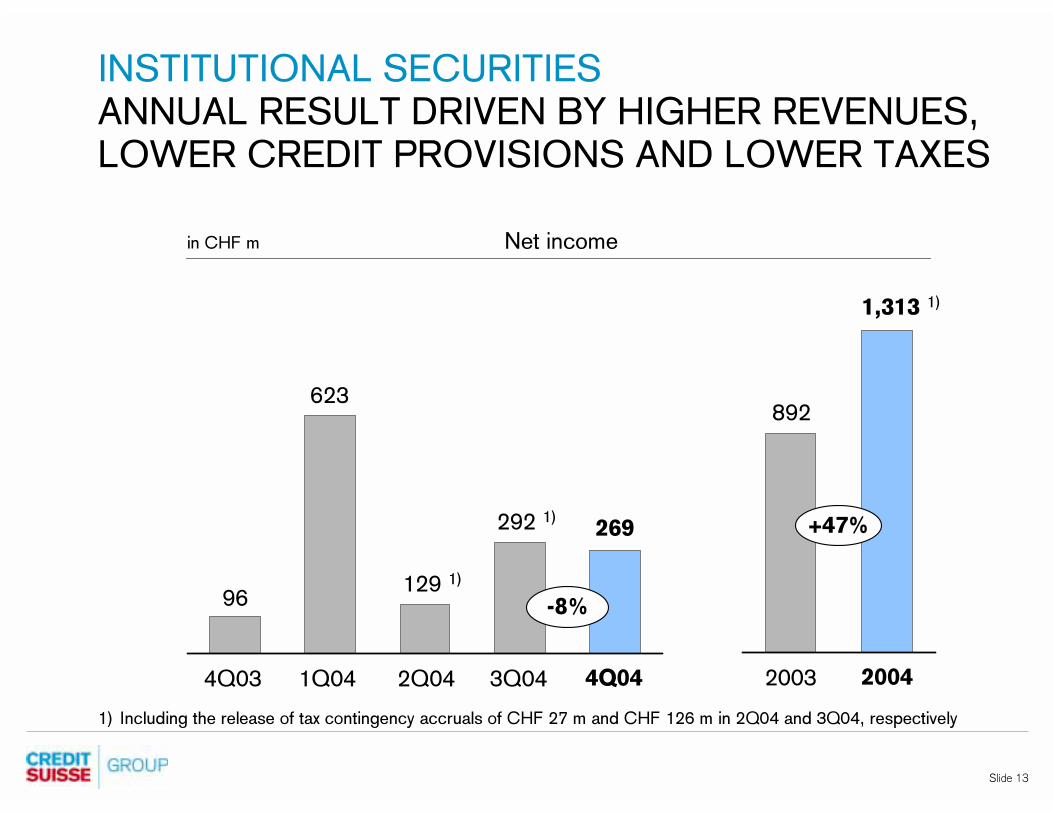
INSTITUTIONAL SECURITIES
ANNUAL RESULT DRIVEN BY HIGHER REVENUES,
LOWER CREDIT PROVISIONS AND LOWER TAXES
Net incomein CHF m
2003 20042Q04 3Q04 4Q044Q03 1Q04
129 1)
269
96
623
292 1)
892
1,313 1)
+47%
-8%
1) Including the release of tax contingency accruals of CHF 27 m and CHF 126 m in 2Q04 and 3Q04, respectively
Slide 14
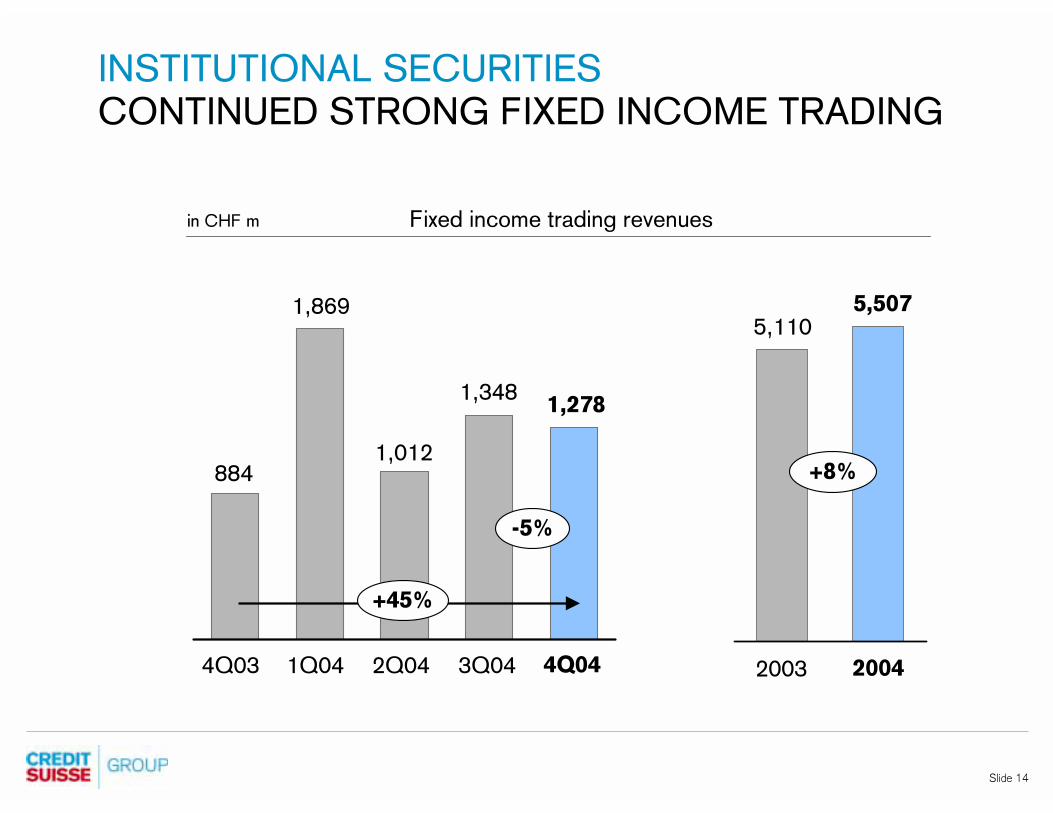
INSTITUTIONAL SECURITIES
CONTINUED STRONG FIXED INCOME TRADING
1Q044Q03 2Q04 3Q04 4Q04
884
1,869
1,012
1,3481,278
-5%
+45%
Fixed income trading revenuesin CHF m
2003 2004
5,1105,507
+8%
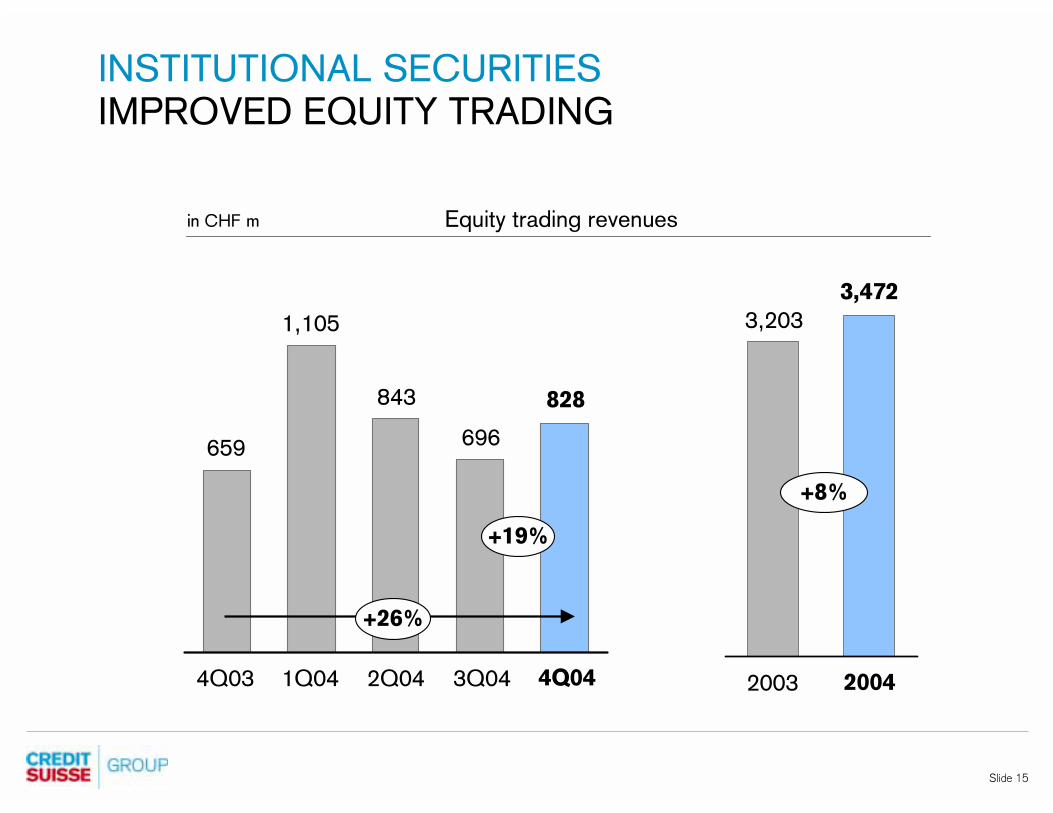
Slide 15
INSTITUTIONAL SECURITIES
IMPROVED EQUITY TRADING
1Q044Q03 2Q04 3Q04 4Q04
659
1,105
843
696
828
+26%
+19%
Equity trading revenuesin CHF m
2003 2004
3,203
3,472
+8%

Slide 16
1Q044Q03 2Q04 3Q04 4Q04
839 840902 868
INSTITUTIONAL SECURITIES
MIXED INVESTMENT BANKING RESULTS
Debt underwriting
Equity underwriting
Advisory
in CHF m Investment Banking revenues
718
-29%
-32%
+75%
-17%
3,4653,328
20042003
-18%
+7%
-5%

Slide 17
INSTITUTIONAL SECURITIESCONTROLLED EXPENSES AND PRE-TAX MARGIN
IMPROVEMENT
Total operating expensesin CHF bn
1Q044Q03 2Q04 3Q04 4Q04
1) Excluding minority interest results relating to the FIN 46R consolidation
2.6
Pre-tax margin 1)in %
10.9
4.6
7.7
1Q044Q03 2Q04 3Q04 4Q04
22.2
13.7
Compensation and benefits
Other operating expenses
2.82.93.1
2.5
-7%
-4%
Slide 18
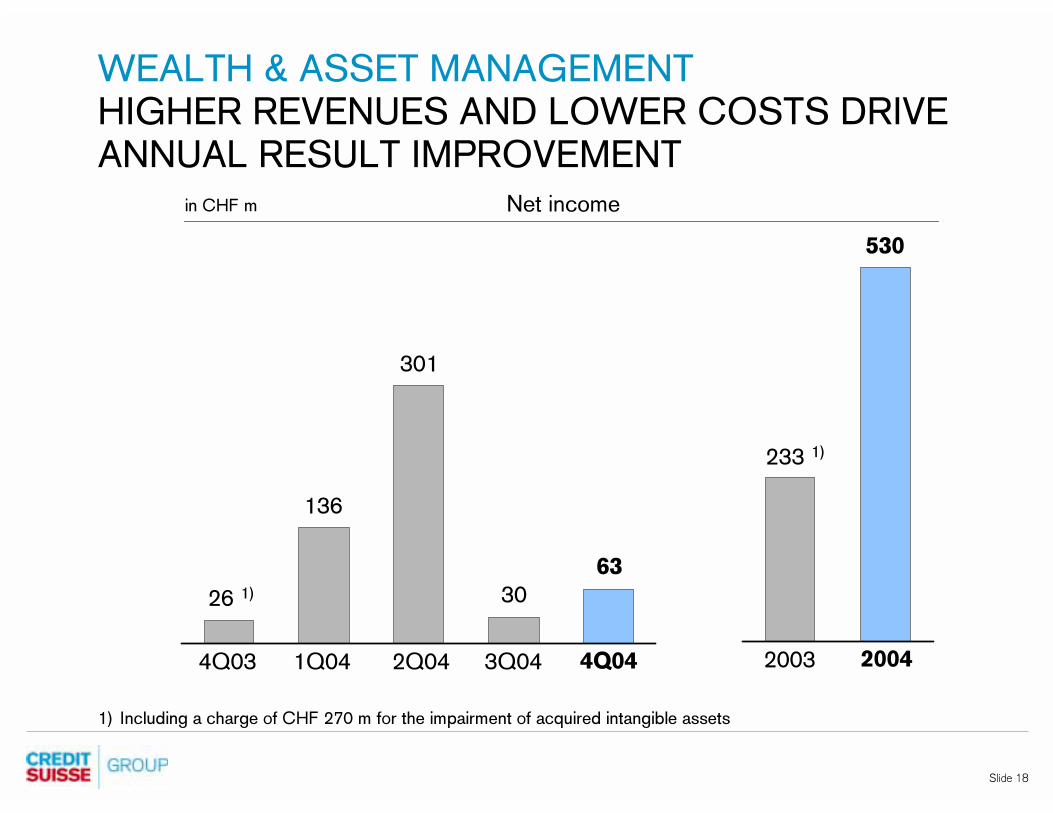
WEALTH & ASSET MANAGEMENT
HIGHER REVENUES AND LOWER COSTS DRIVE
ANNUAL RESULT IMPROVEMENT
Net incomein CHF m
2003 20042Q04 3Q04 4Q044Q03 1Q04
301
63
26 1)
136
30
233 1)
530
1) Including a charge of CHF 270 m for the impairment of acquired intangible assets
Slide 19
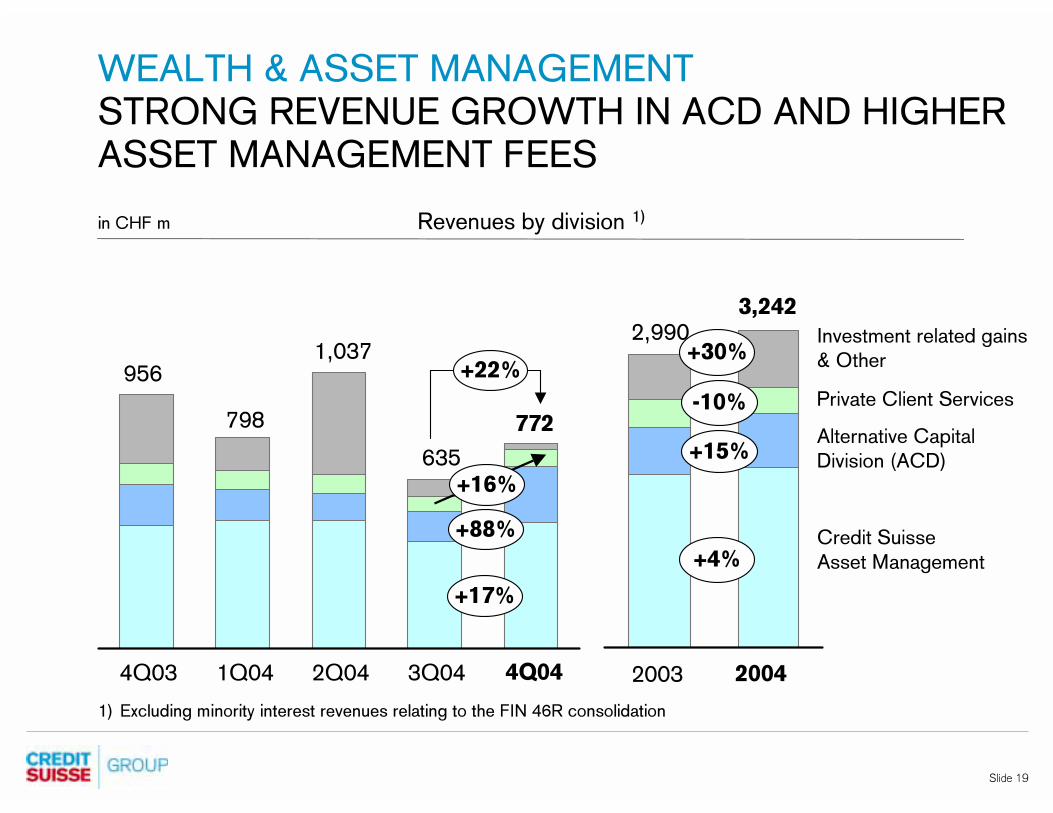
WEALTH & ASSET MANAGEMENT
STRONG REVENUE GROWTH IN ACD AND HIGHER
ASSET MANAGEMENT FEES
956
in CHF m Revenues by division 1)
1Q044Q03 2Q04 3Q04 4Q04
772
+17%
+22%
798
1,037
635
+88%
+16%
1) Excluding minority interest revenues relating to the FIN 46R consolidation
Alternative Capital
Division (ACD)
Private Client Services
Credit Suisse
Asset Management
Investment related gains & Other
20042003
2,9903,242
+4%
+15%
-10%
+30%
Slide 20
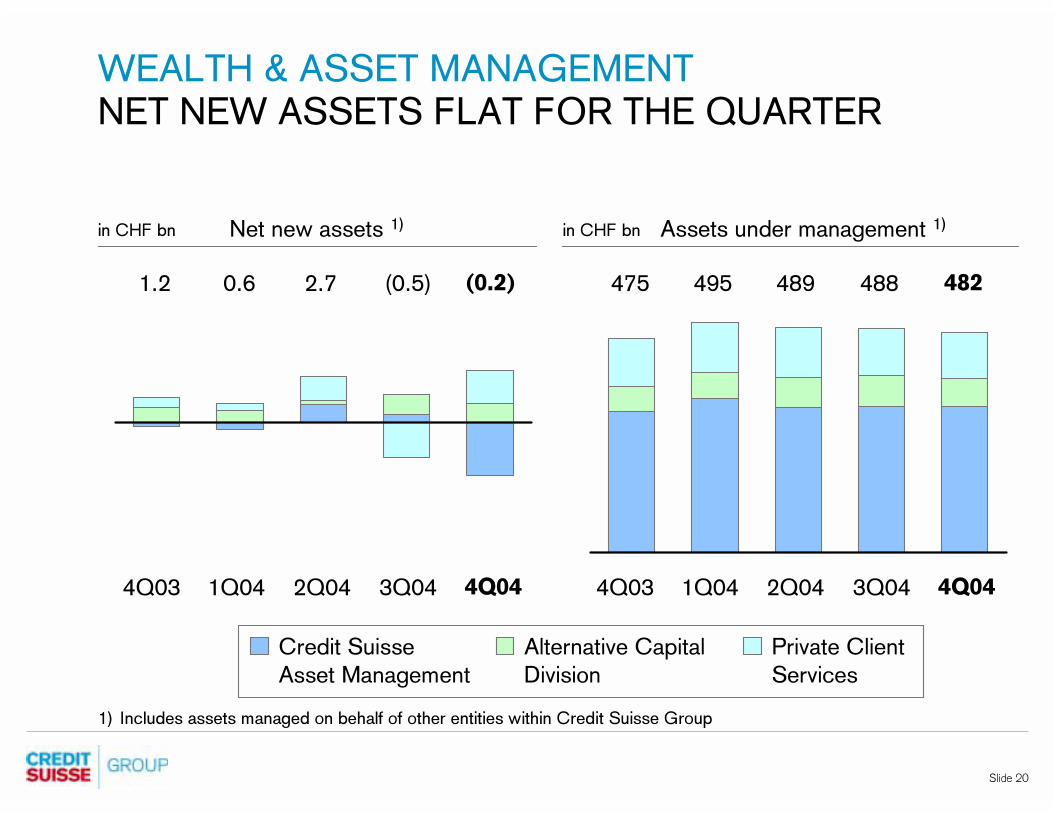
WEALTH & ASSET MANAGEMENT
NET NEW ASSETS FLAT FOR THE QUARTER
Assets under management 1)Net new assets 1)in CHF bn
1Q044Q03 2Q04 3Q04 4Q04 1Q044Q03 2Q04 3Q04 4Q04
in CHF bn
Private Client
Services
Credit Suisse
Asset Management
Alternative Capital
Division
(0.5) 4894954751.2 0.6 2.7 488 482(0.2)
1) Includes assets managed on behalf of other entities within Credit Suisse Group
Slide 21
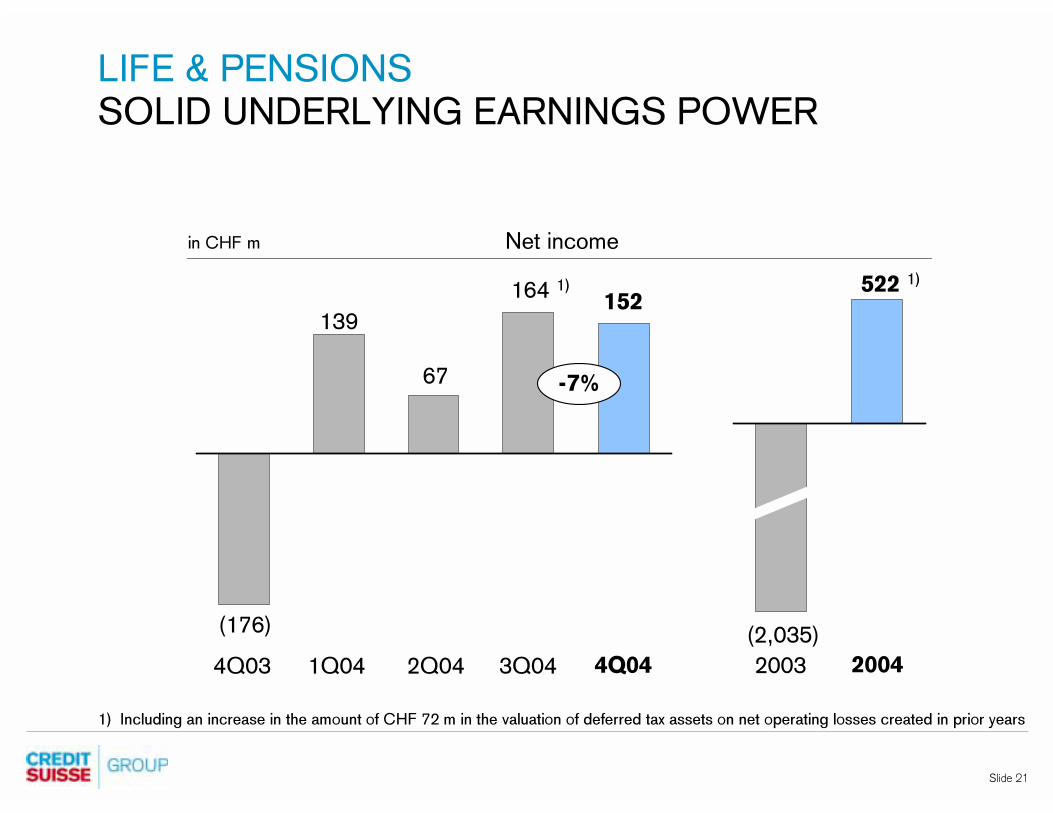
LIFE & PENSIONS
SOLID UNDERLYING EARNINGS POWER
Net incomein CHF m
2003 20042Q04 3Q04 4Q044Q03 1Q04
67
152
(176)
139
164 1)
(2,035)
522 1)
-7%
1) Including an increase in the amount of CHF 72 m in the valuation of deferred tax assets on net operating losses created in prior years
Slide 22
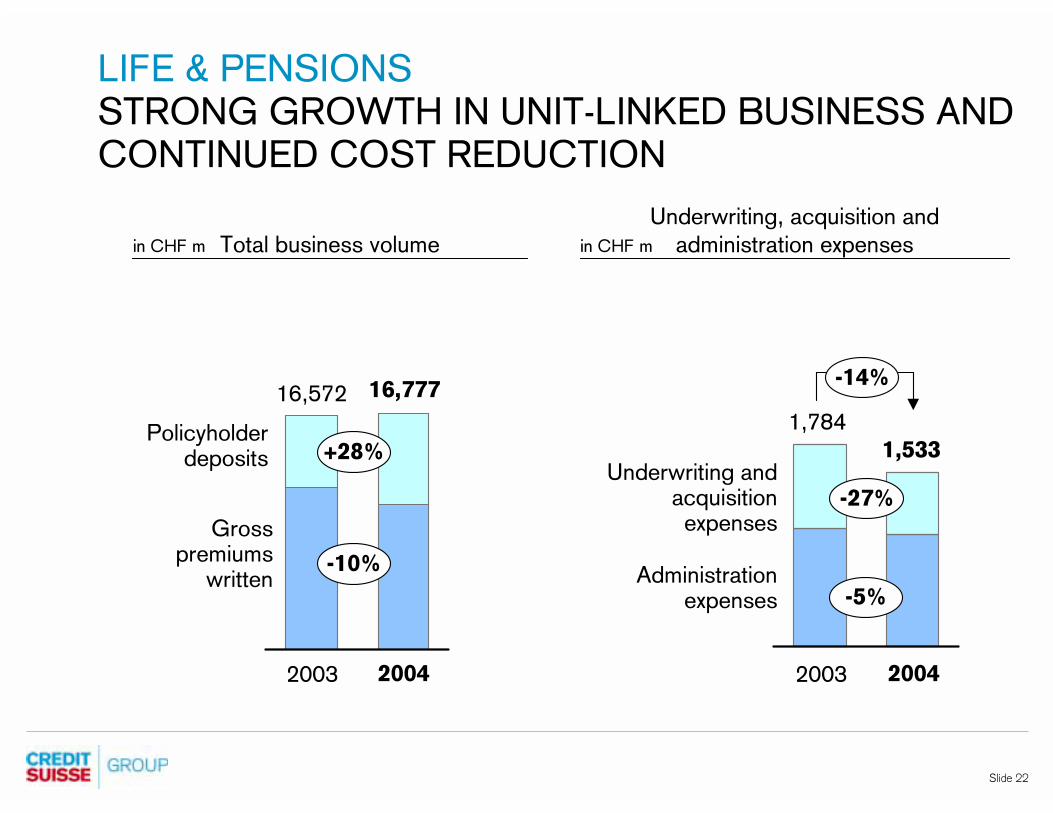
LIFE & PENSIONS
STRONG GROWTH IN UNIT-LINKED BUSINESS AND
CONTINUED COST REDUCTION
in CHF m Total business volume
Underwriting, acquisition and
administration expenses
16,777
1,533
1,784
Underwriting and acquisition expenses
Administration expenses
Policyholder deposits
Grosspremiums
written
2003 2004 2003 2004
in CHF m
-14%
-5%
-27%
16,572
+28%
-10%
Slide 23
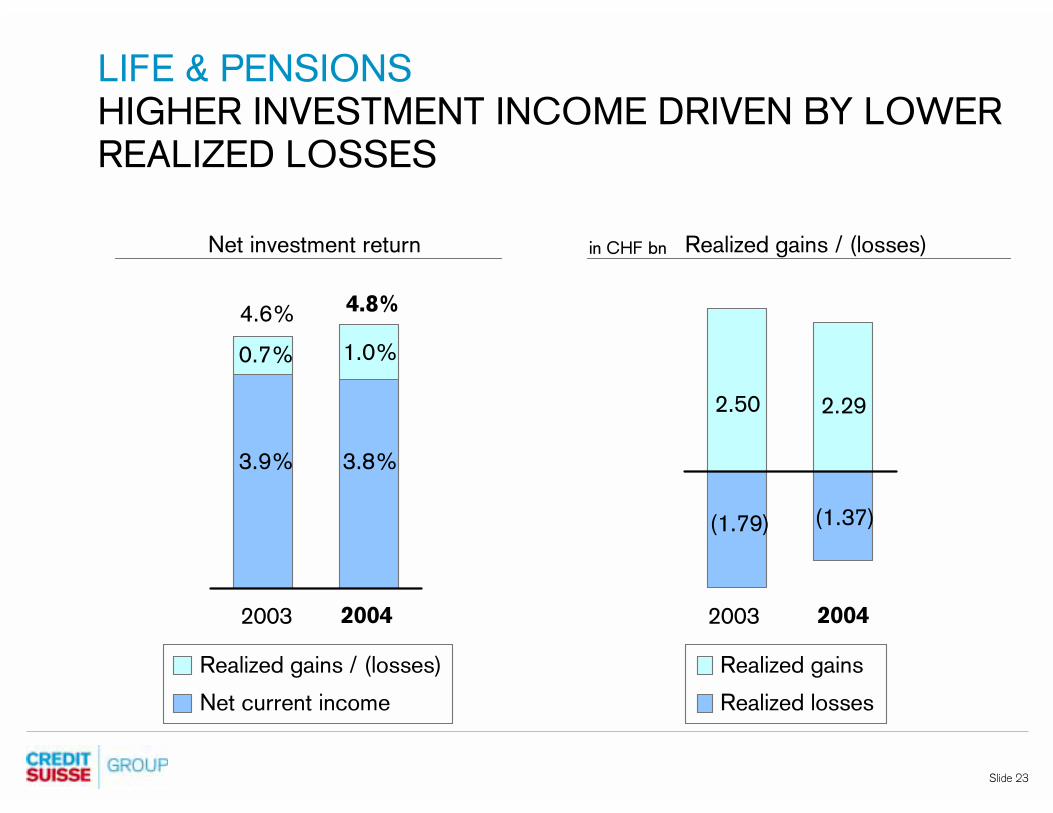
LIFE & PENSIONS
HIGHER INVESTMENT INCOME DRIVEN BY LOWER
REALIZED LOSSES
0.7%
4.8%
3.9% 3.8%
1.0%
4.6%
Realized gains / (losses)
Net current income
Net investment return
2003 20042003 2004
Realized gains / (losses)in CHF bn
(1.37)
2.29
(1.79)
2.50
Realized losses
Realized gains

Slide 24
NON-LIFE
STRONG IMPROVEMENT IN UNDERLYING
PERFORMANCE
Net incomein CHF m
2003 20042Q04 3Q04 4Q044Q03 1Q04
82
(177) 2)
55103
198 1)
(374)
206 1) 2)
1) Including an increase in the amount of CHF 59 m in the valuation of deferred tax assets on net operating losses created in prior years2) Including a charge of CHF 242 m after tax related to the increase of the provision for contingencies relating to the sale of Winterthur
International
Slide 25
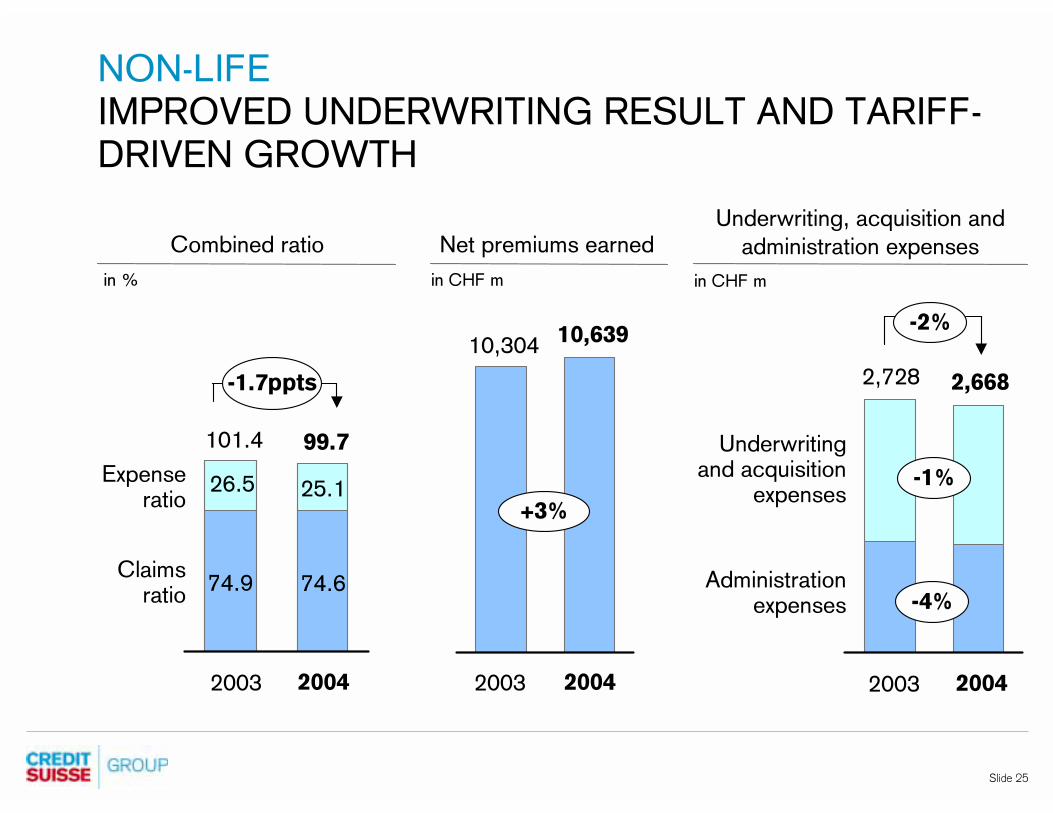
NON-LIFE
IMPROVED UNDERWRITING RESULT AND TARIFF-
DRIVEN GROWTH
2,6682,728
Underwriting and acquisition
expenses
Administrationexpenses
Underwriting, acquisition and
administration expenses
in CHF m
Combined ratio
Expense ratio
Claims ratio
in %
101.4 99.7
26.5 25.1
74.9 74.6
2003 2004 2003 2004
in CHF m
Net premiums earned
10,304 10,639
2003 2004
-1.7ppts
-1%
-4%
+3%
-2%
Slide 26
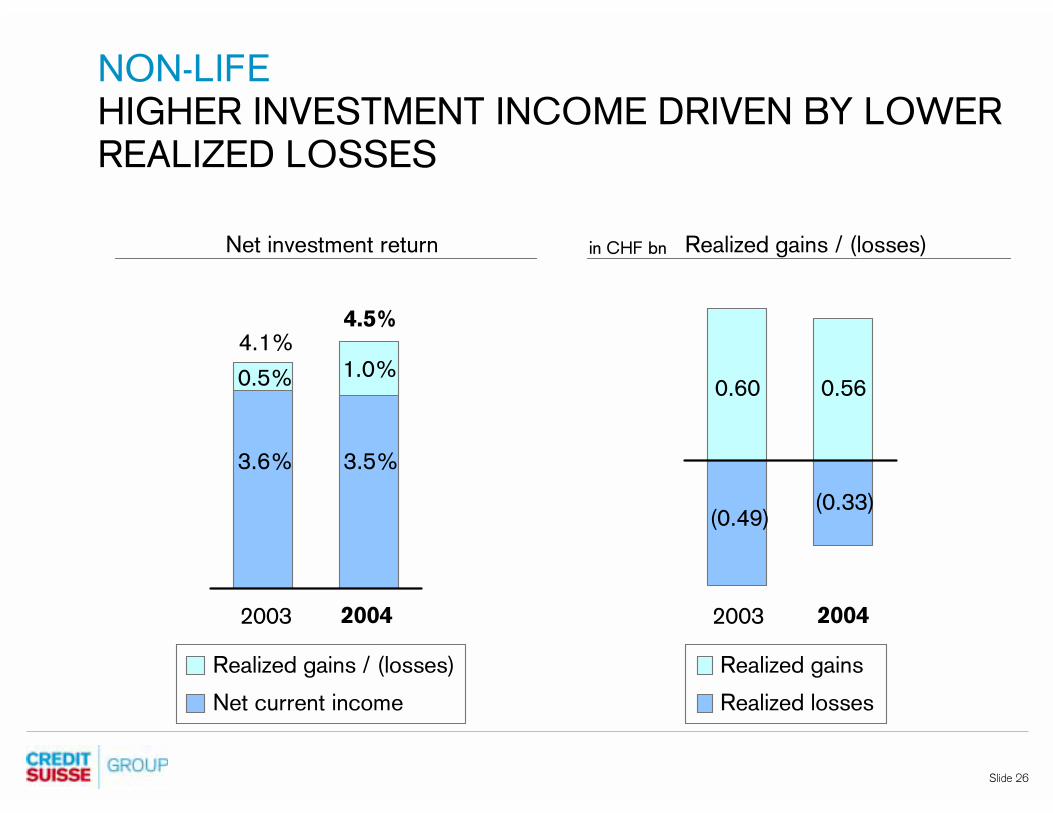
NON-LIFE
HIGHER INVESTMENT INCOME DRIVEN BY LOWER
REALIZED LOSSES
2003 2004
(0.33)
0.56
(0.49)
0.60
Realized losses
Realized gains
Realized gains / (losses)in CHF bnNet investment return
0.5%
4.5%
3.6% 3.5%
1.0%4.1%
2003 2004
Realized gains / (losses)
Net current income
Slide 27
6
8
10
12
14
16
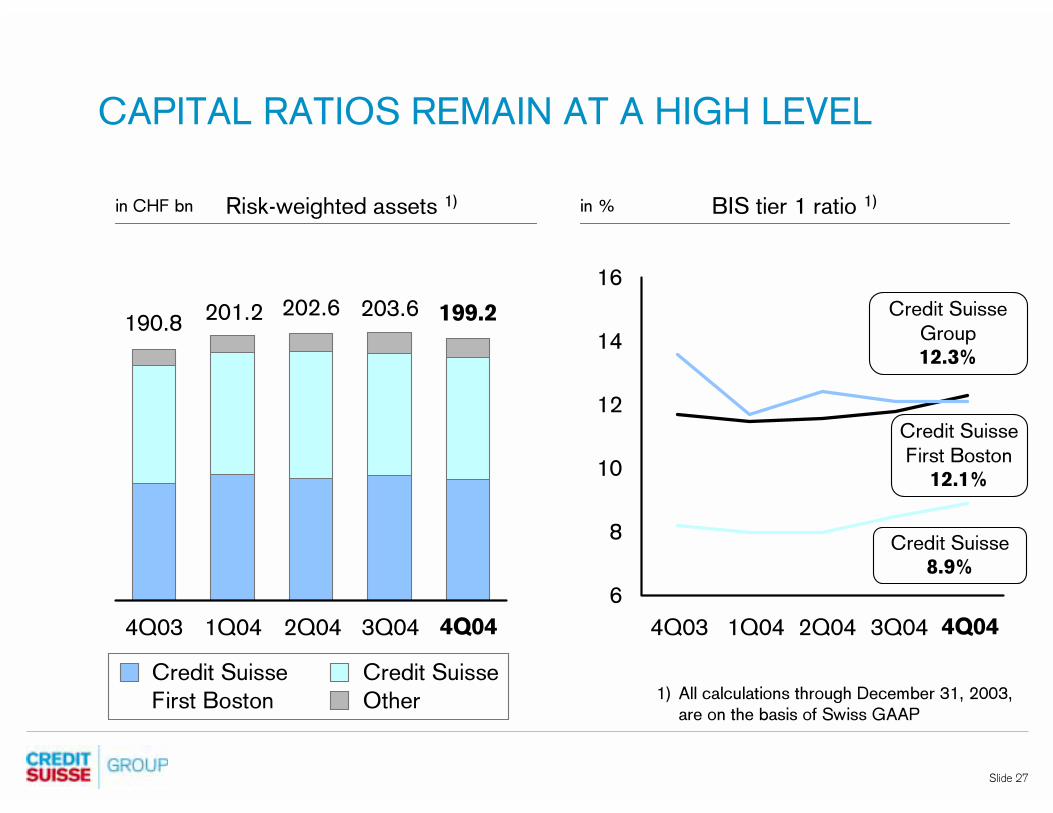
CAPITAL RATIOS REMAIN AT A HIGH LEVEL
202.6
in % BIS tier 1 ratio 1)
1Q044Q03 2Q04 3Q04 4Q04
Risk-weighted assets 1)in CHF bn
Credit Suisse Group12.3%
1Q044Q03 2Q04 3Q04 4Q04
Credit Suisse
First Boston12.1%
Credit Suisse8.9%
201.2190.8
1) All calculations through December 31, 2003,
are on the basis of Swiss GAAP
203.6 199.2
Credit SuisseCredit Suisse
First Boston Other
Slide 28
SHARE REPURCHASE PROGRAM AND
DIVIDEND PROPOSAL
� Ask Annual General Meeting for permission to repurchase shares up to CHF 6 bn over two years
� Tier 1 target > 10% (including Basel II) in line with our performance goals communicated in December 2004
� Program to commence after the Annual General Meeting 2005 and torun for a maximum of two years
� Registered shares bought back via second trading line will be cancelled
� Return to competitive dividend policy with dividend of CHF 1.50 proposed for 2004

Slide 29
OUTLOOK
� Strategic plan announced in December 2004 to enable us to remaincompetitive in the face of a mixed market environment that is expected to continue in 2005
� Intention to become a fully integrated bank will allow the Group to continue to compete effectively by seizing growth opportunities and capturing revenue and cost synergies
� First step to integration is the merger of the of the two legal bank entities in Switzerland, scheduled for the second quarter 2005
� Integration will enable us to better serve clients across multiple business lines and will facilitate the more efficient allocation of the Group’s capital

Slide 30