credit suisse securities (europe) limited annual …...credit suisse securities (europe) limited,...
TRANSCRIPT

Credit Suisse Securities (Europe) Limited
Annual Report 2014
Credit Suisse Securities (Europe) LimitedAnnual Report 2016


1Credit Suisse Securities (Europe) Limited, Annual Report 2016
Credit Suisse Securities (Europe) Limited
Credit Suisse Securities (Europe) LimitedAnnual Report 2016
Copyright © 2016 Credit Suisse Group. All rights reserved.
Board of Directors as at 30 March 2017
Noreen Doyle (Chair and Independent Non-Executive)
David Mathers (CEO)
Alison Halsey (Independent Non-Executive)
Robert Endersby (Independent Non-Executive)
Robert Arbuthnott (CFO)
Christopher Horne
Paul Ingram (CRO)
Eraj Shirvani
Company Secretary
Paul E Hare
Company Registration Number 891554
2
Noreen DoyleBorn 1949Irish and US Citizen
Non-Executive
Board member since 2011
Chair of the Board
Professional history
2011–present Credit Suisse International Credit Suisse Securities (Europe) Limited
Chair of the Board of Directors (2012-present)
Non-Executive Director (2011-present)
Chair of the Remuneration Committee (2014-present)
Chair of the Nomination Committee (2013-present)
Member of the Risk Committee (2013-present)
Member of the Audit Committee (2011-present)
2004–present Credit Suisse AG & Credit Suisse Group AG
Member of the Board of Directors (2004-present)
Vice-Chair and Lead Independent Director of the Board of Directors (2014-present)
Member of the Chairman’s and Governance Committee (2014-present)
Member of the Risk Committee (2004-2007; 2009-2014; 2016-present)
Member of the Audit Committee (2007-2009; 2014-2016)
1992-2005 European Bank for Reconstruction (EBRD)
First vice president and head of banking (2001-2005)
Deputyvicepresidentfinanceanddirectorofriskmanagement(1997-2001)
Chiefcreditofficeranddirectorofsyndications(1994-1997)
Head of syndications (1992-1994)
Prior to 1992 Bankers Trust Company, Houston, New York and London
Managing director, European Structured Sales (1990-1992)
Various positions at management level
Education
1974 MBA in Finance, Tuck at Dartmouth College, New Hampshire
1971 BA in Mathematics, The College of Mount Saint Vincent, New York
Other activities and functions
Newmont Mining Corporation, chair of the board of directors, member of the audit committee
British Bankers’ Association (BBA), chair
UK Panel on Takeovers and Mergers, member
Tuck European Advisory Board, member
Marymount International School, London, chair of the board of governors
Sarita Kenedy East Foundation, trustee
NewTa Limited, director
David R. MathersBorn 1965British Citizen
Board member since 2016
Chief Executive Officer
Professional history
2005–present Credit Suisse International Credit Suisse Securities (Europe) Limited
Executive Director (2016-present; 2005-2006)
CEO (2016-present)
Alternate Director of the Board of Directors (2005)
1998–present Credit Suisse AG & Credit Suisse Group AG
Chairman of Strategic Resolution Oversight Board (2015-present)
Member of the Executive Board (2010-present)
ChiefFinancialOfficer(2010-present)
Head of IT and Operations AG (2012-2015)
Head of Finance and COO of Investment Banking (2007-2010)
Senior positions in Credit Suisse’s Equity business, including Director of European Research and Co-Head of European Equities (1998-2007)
Prior to 1998 HSBC
Global head of equity research (1997 – 1998)
Research analyst, HSBC James Capel (1987 – 1997)
Education
1991 MA in Natural Sciences, University of Cambridge, England
1987 BA in Natural Sciences, University of Cambridge, England
Other activities and functions
European CFO Network, member
Women in Science & Engineering (WISE) program and academic awards and grants at Robinson College, Cambridge, sponsor

3Credit Suisse Securities (Europe) Limited, Annual Report 2016
Credit Suisse Securities (Europe) Limited
Alison HalseyBorn 1956British Citizen
Non-Executive
Board member since 2015
Professional history
2015–present Credit Suisse International Credit Suisse Securities (Europe) Limited
Non-Executive Director (2015-present)
Chair of the Audit Committee (2015-present)
Member of the Risk Committee (2015-present)
Member of the Nomination Committee (2015-present)
Member of the Remuneration Committee (2015-present)
Co-chairoftheConflictsCommittee(2016-present)
2011–present Super Duper Family LLP
Managing Partner
1977 – 2011 KPMG
Global Lead Partner (2002-2011)
UK Head of Financial Services (2001-2004)
Audit Partner, Financial Services (1991-2001)
Secondment, Assistant Commissioner, Building Societies Commission (1989-1991)
Senior Manager, Specialist Banking Department (1986-1989)
Education
1980 UK FCA, Institute of Chartered Accountants in England and Wales
1977 BA in French, King’s College, London
Other activities and functions
Cambian Group plc, Non-executive Director, Chair of the Audit & Risk Committee and Member of the Nomination and Remuneration Committees
Provident Financial Group plc, Non-executive Director, Chair of the Audit Committee, and Member of the Nomination, Remuneration and Risk Advisory Committees
Aon UK Limited, Non-executive Director, Member of the Risk & Compliance and Nominations Committees and Chair of the Audit Committee
Robert EndersbyBorn 1959British Citizen
Non-Executive
Board member since 2016
Professional history
2016–present Credit Suisse International Credit Suisse Securities (Europe) Limited
Non-Executive Director (2016-present)
Chair of the Risk Committee (2016-present)
Member of the Audit Committee (2016-present)
Member of the Nomination Committee (2016-present)
Member of the Remuneration Committee (2016-present)
Co-ChairoftheConflictsCommittee(2016-present)
2012 – 2014 Danske Bank Group
ChiefRiskOfficer&MemberofExecutiveBoard
Chair of Executive Risk Committee
Chair of Group Liquidity Risk Committee
2011 – 2012 Royal Bank of Scotland plc
ChiefOperatingOfficer,GroupCreditRisk
2006 – 2010 Barclays Bank plc
Commercial Credit Risk Director, Global Retail & Commercial Banking and
Group Wholesale Credit Risk Director
Education
1982 BA in Social Science (Economics), University of the West of England
Other activities and functions
Tesco Personal Finance Group Limited and
Tesco Personal Finance Plc, Non-executive Director, Chair of Risk Committee, Member of Audit Committee, Remuneration Committee and Disclosure Committee
4
Robert K. ArbuthnottBorn 1968British Citizen
Board member since 2016
Chief Financial Officer
Professional history
2015–present Credit Suisse International Credit Suisse Securities (Europe) Limited
Executive Director (2016-present)
Managing Director, Regional CFO for UK Regulated Entities, Chairman of the UK Pension Committee (2015-2016)
Member of the Board of Directors of Credit Suisse Investments (UK) and Credit Suisse Investment Holdings (UK) (2016-present)
2007 – 2015 Barclays, Singapore
Head of India Finance Shared Services (2014-2015)
CFOAsiaPacific,Singapore(2008-2014)
Regional Head of Product Control, Singapore (2007-2008)
2000 – 2007 Merrill Lynch, Japan and UK
CFO EMEA Credit, Mortgages, Real Estate, Private Equity, London (2006-2007)
CFO FICC Asia, Tokyo (2005-2006)
Head of Rates ISS, Tokyo (2002-2004)
Finance Risk Management FICC, Tokyo (2000-2002)
1997 – 2000 Salomon Brothers, London
Head of Product Control for Structured Credit EMEA
1995 – 1997 BZW, London
Fixed Income Salesman
1994 – 1995 Goethe Institute, Germany
1993 – 1994 LIFFE, London
Market Supervision Division
1990 – 1993 KPMG, London
Accountant
Education
1993 UK ACA, Institute of Chartered Accountants in England and Wales
1989 Master of Arts, Cambridge University
1986 Lancing College
Other activities and functions
Parrish Solutions Ltd BVI, Director and advisory board member
Tanglin Trust School, Director and advisory board member
Christopher G.B. HorneBorn 1964British Citizen
Board member since 2015
Professional history
1997–present Credit Suisse International Credit Suisse Securities (Europe) Limited
Executive Director (2015-present; 2010-2011)
Chair of the Disclosure Committee (2015-present)
Alternate Director of the Board of Directors (2008)
Deputy CEO (2015-present)
Branch Manager, Credit Suisse AG, London Branch (2015-present)
Member of the Board of Directors of Credit Suisse Investments (UK) and Credit Suisse Investment Holdings (UK) (2014-present)
Deputy Head of the European Investment Banking Department (2014-2015)
Global COO of the Investment Banking Department (2009-2014)
Europe COO of the Investment Banking Department (2005-2008)
Managing Director, Global Mergers and Acquisitions Group (2004-2005)
Co-head of Corporate Advisory & Finance within the Global Industrial & Services team in Europe (2001-2004)
Credit Suisse First Boston‘s European Mergers & Acquisitions Department and European Corporate Advisory & Finance team (1997-2000)
1990 – 1997 BZW, London
Investment Banker
1986 – 1990 Deloitte Haskins & Sells , London
Accountant
Education
1989 UK ACA, Institute of Chartered Accountants in England and Wales
1986 BSc Honours, Chemistry, Durham University
Other activities and functions
British Bankers Association Board, member
5Credit Suisse Securities (Europe) Limited, Annual Report 2016
Credit Suisse Securities (Europe) Limited
Paul R. IngramBorn 1963British Citizen
Board member since 2015
Chief Risk Officer
Professional history
2013–present Credit Suisse International Credit Suisse Securities (Europe) Limited
Executive Director (2015-present)
ChiefRiskOfficer(2013-present)
2009 – 2013 RBS Group
Investment Banker
Global Head of Market Risk and Insurance Risk
1994 – 2008 HSBC Group
Global Head of Market Risk and Traded Credit Risk (2001-2008)
HeadofFinance,Operations&Risk,AsiaPacific(exHongKong), Hong Kong (1998-2001)
Country CFO & Branch Manager Midland Bank Japan, Tokyo (1995-1998)
Head of Markets Product Control & Risk Projects, New York (1994-1995)
1987 – 1994 Samuel Montagu & Co
Various Markets roles
1985 – 1987 LittleJohn Fraser
Audit & Consultancy
Education
1985 BA Honours Economics, University of Essex
Eraj ShirvaniBorn 1966British, American and Iranian Citizen
Board member since 2016
Professional history
1988–present Credit Suisse International Credit Suisse Securities (Europe) Limited
Executive Director (2016-present; 2010-2011)
Alternate Director (2008)
Global Head of Solutions & Head of Fixed Income EMEA (2016-present)
Member of the Management Committee of Credit Suisse AG, London Branch (2010-2011)
Global Head of Emerging Markets Group & Head of Fixed Income EMEA (2015-2016)
Co-Head of Global Credit Products & Head of Fixed Income EMEA (2011-2015)
Head, European Credit Products (2006-2009)
Head,European&PacificCreditSales&Trading(2000-2006)
Head of European Credit Trading (1998-2000)
Various Positions in US Credit Trading (1990-1998)
Investment Banking Analyst Program Participant (1988-1990)
Education
1994 MBA, Columbia University
1988 BA in International Relations & French, University of Pennsylvania
Other activities and functions
GFMA, Board Member
AFME, Board Member
Royal National Children’s Foundation, Trustee
GuardTime Holdings Pte Ltd, Director/Advisory Board Member

6
Strategic Report for the year ended 31 December 2016The Directors present their Annual Report and the Consolidated Financial Statements for the year ended 31 December 2016.
BUSINESS REVIEWProfileThe Credit Suisse Securities (Europe) Limited Group (the ‘CSS(E)L Group’) consists of the Company, its consolidated subsidiaries and structured entities. The Financial Statements are presented in United States Dollars (‘USD’), which is the functional currency of the Company (‘CSS(E)L’) and in accordance with International Financial Reporting Standards (‘IFRS’).
Credit Suisse Securities (Europe) Limited (the ‘Company’) is a wholly owned subsidiary of Credit Suisse Investment Holdings (UK) (the ‘Parent’) and indirectly wholly owned subsidiary of Credit Suisse Group AG (‘CSG’). It is authorised by the Prudential Regu-lation Authority (‘PRA’) and regulated by the Financial Conduct Authority (‘FCA’) and the PRA. Its principal activities are the arrangingoffinanceforclientsintheinternationalcapitalmarkets,theprovisionoffinancialadvisoryservicesandactingasdealerinsecurities, derivatives and foreign exchange on a principal and agency basis.
The Company has branch operations in Frankfurt, Paris, Amsterdam, Seoul, Warsaw and Stockholm. The Frankfurt, Paris, Warsaw and Stockholm branches provide equity broking and investment banking services. The Amsterdam branch is closing. In addition to providing these activities, the Seoul branch has approval from South Korea’s Financial Supervisory Commission to engage in over-the-counter (‘OTC’) derivatives business and is a member of the Korean Securities Dealers Association. The Company also maintainsrepresentativeofficesinSwitzerland.
CSG, a company domiciled in Switzerland, is the ultimate par-ent of a worldwide group of companies (collectively referred to as
the ‘CSgroup’).CSGprepares financial statementsunderUSGenerally Accepted Accounting Principles (‘US GAAP’). These accounts are publicly available and can be found at www.credit-su-isse.com.
Asaleadingfinancialservicesprovider,CSgroupiscommittedtodelivering its combinedfinancial experienceandexpertise tocorporate, institutional and government clients and high-net-worth individuals worldwide, as well as to retail clients in Switzerland. CS group serves its diverse clients through three regionally focused divisions: Swiss Universal Bank, International Wealth Management andAsiaPacific.Theseregionalbusinessesaresupportedbytwodivisions specialising in investment banking capabilities: Global Markets and Investment Banking & Capital Markets. The Strategic Resolution Unit consolidates the remaining portfolios from the for-mer non-strategic units plus additional businesses and positions thatdonotfitwithourstrategicdirection.Thesebusinessdivisionsco-operatecloselytoprovideholisticfinancialsolutions,includinginnovative products and specially tailored advice. Founded in 1856, CS group has a truly global reach today, with operations in over50countriesandateamofmorethan47,170 employeesfromapproximately 150 different nations.
Management and GovernanceThe Board of Directors (‘Board’) is responsible for governance arrangements that ensure effective and prudent management of CSS(E)L, including the segregation of duties and the prevention of conflictsofinterest.TheBoardapprovesandoverseestheimple-mentation of strategic objectives, risk strategy and internal gover-nance;ensurestheintegrityoftheaccountingandfinancialreport-ing systems; oversees disclosure and communications processes; provides effective oversight of senior management; and assesses the effectiveness of governance arrangements.
Members of the Board and Board Committees
Board member Audit Risk Nomination Remuneration Conflicts since Independence Committee Committee Committee Committee Committee
Noreen Doyle, Chair 2011 Independent Member Member Chair Chair -
Robert Endersby 2016 Independent Member Chair Member Member Co-chair
Alison Halsey 2015 Independent Chair Member Member Member Co-chair
Christopher Horne, Deputy CEO 2015 - - - - - -
Robert Arbuthnott 2016 - - - - - -
Paul Ingram, CRO 2015 - - - - - -
David Mathers, CEO 2016 - - - - - -
Eraj Shirvani 2016 - - - - - -
Stephen Dainton* 2016 - - - - - -
* Resigned as a member of the Board with effect from 26 January 2017.

7Credit Suisse Securities (Europe) Limited, Annual Report 2016
Strategic Report for the year ended 31 December 2016
Board and MangementA number of management and governance changes have been effected during the year. Robert Endersby has been appointed as an Independent Non-Executive Director and Chair of the Risk Committee. David Mathers, Robert Arbuthnott, Stephen Dainton and Eraj Shirvani have been appointed as Executive Directors. Richard Thornburgh resigned as a Non-Executive Director and Stephen Dainton, Jason Forrester and David Livingstone have resigned as Executive Directors as a result of resignations from the Company or changes in responsibilities.
The requirements of the PRA & FCA Senior Managers & Cer-tificationRegime (‘SMCR’)were implemented inCSS(E)Lwitheffect from 07 March 2016. The SMCR framework seeks to increase individual accountability and enhance culture in Financial Services through: mandating the clear allocation of all activities, business areas and management functions of the in-scope legal entities to a small number of Senior Managers who are approved by the UK Regulators; identifying a set of functions that expose the in-scope legal entities to risk through their day-to-day activities and requiring that the staff performing these functions are cap-turedasCertifiedStaffandconfirmedannuallyas‘Fit&Proper’;andimplementingandenforcingasetofConductRulesthatreflectthe core standards expected of staff. The implementation of SMCR inCSS(E)L isalignedwith,andbuildson, thesignificantprogress that has been made over the past three years in develop-ing CSS(E)L Group’s governance and culture.
Principal Product areasLast year, Credit Suisse announced the restructuring of the CS group, with the creation of new regionally focused divisions, and the realignment of existing businesses/divisions. Global Markets announced a further restructuring in March 2016. As a result of the restructure, the CSS(E)L Group has four principal business lines:p Global Markets brings together equity sales and trading,
credit products and trading as well as structured lending and selected derivative capabilities to create a fully integrated fran-chise for clients. Global Markets provides a broad range of financialproductsandservicesofclientdrivenbusinessesandalso supports the CS group’s private banking businesses and their clients. The suite of products and services include global securities sales, trading and execution, prime brokerage and comprehensiveinvestmentresearch.Clientsincludefinancialinstitutions, corporations, governments and institutional inves-tors, such as pension and hedge funds. The division consists of four sub-divisions: Equities, Credit, Solutions and Management.
p Within the Asia Pacificdivisionarangeoffinancialproductsand services is offered, focusing on corporates, and institu-tional clients. CSS(E)L delivers integrated client coverage to provideconnectivityandaccesstobroaderfinancialmarkets,differentiated product offerings, and tailored financing
solutions. The investment banking business supports corpo-rate clients by advising on all aspects of M&A, corporate sales and restructurings, divestitures and takeover defence strate-gies and provides equity and debt underwriting capabilities for entrepreneur, corporate and institutional clients. In addition, the business includes equities and fixed income sales andtrading services, and provides access to a range of debt and equitysecurities,derivativeproducts,andfinancingopportuni-ties across the capital spectrum for corporate, sovereign and institutional clients.
p The Investment Banking & Capital Markets division offers a broad range of investment banking products and services which includes advisory services related to M&A, divestitures, takeover defence, restructurings and spin-offs, as well as debt and equity underwriting of public offerings and private place-ments. Derivative transactions related to these activities are alsooffered.Clientsincludeleadingcorporations,andfinancialinstitutions. Investment banking capabilities are delivered through regional and local teams based in both major devel-oped and emerging market centres. An integrated business model enables the delivery of high value, customised solutions that leverage the expertise offered across CSS(E)L and that help clients unlock capital and value in order to achieve their strategic goal. This business was sold to Credit Suisse Interna-tional (‘CSi’) in 2015.
p The Strategic Resolution Unit was created to facilitate the right-sizing of business divisions from a capital perspective and includes remaining portfolios from the former non-strategic units plus transfers of additional exposures from the business divisions. The Strategic Resolution Unit in the Company con-sistsprimarilyofthelegacylifefinancebusiness.Theportfolioincludes a tail of long-dated trades. The primary focus of the Strategic Resolution Unit is to facilitate the rapid wind-down of capital usage and costs in order to reduce the negative impact on the overall CSS(E)L Group performance.
Economic environmentDuring2016thefinancialmarketswerevolatileandexperiencedfurther heightened uncertainty caused by a number of political developments. The UK’s decision to leave the European Union post the referendum in June 2016 and US presidential election resultinNovember2016,werekeydrivingfactorsbehindfinancialmarket moves globally.
The annual rate of Consumer Price Index (‘CPI’) inflation increased to 1.6% at the end of December 2016 from 0.2% at the end of December 2015. In August 2016, the Bank of England (‘BOE’) announced additional measures to ease monetary policy by increasing the size of its asset purchase program and reducing the base interest rate to 0.25%. The unemployment rate dropped mar-ginally to 4.8% at the end of December 2016 from 5.1% at the end of December 2015. Looking at 2016 as a whole, UK Gross

8
DomesticProduct (‘GDP’)growthslowedmodestly to2 percentfrom 2.2 percent in 2015. The European Central Bank (‘ECB’) announced further monetary easing measures at its March 2016 meeting, including cuts in all main interest rates, an increase in the asset purchase program and additional bank funding measures. Later in the year, the ECB announced its intention to scale back monthly asset purchases to EUR 60 billion beginning in April 2017. At its December 2016 meeting, the US Federal Reserve (‘Fed’) decided to raise the target range for thepolicy rateby25 basispoints. The weakest major currency in 2016 compared with the US dollar was the British pound, which significantly depreciated after the outcome of the UK referendum on EU membership in June.
At the beginning of 2016, major equity markets declined sharply due to the weaker than expected macroeconomic data in developed economies, economic growth concerns in China and low oil prices. Since the middle of February 2016, equity markets recovered supported by improved commodity markets and accom-modative monetary policies of major central banks. Towards the end of year, equity markets continued to move higher, driven by bettereconomicdataandtheexpectationsforfiscalstimulusintheUS under a new presidential administration. Among developed markets,CanadaandUKequitiesoutperformed,benefittingfromhigher commodity prices and a weaker currency, respectively, while Swiss and Japanese equities lagged behind.
Throughoutthefirsthalfoftheyear,financialmarketsbecameincreasingly sensitive to expectations of the outcome of the UK referendum and following a perceived increase in the likelihood of a leave vote in early June, the sterling exchange rate and short-term interest rates fell. The expectations for a broadly more accommodative stance of monetary policy from major central banks helped to reverse some of these moves. After the decline in thefirsthalfoftheyear,governmentbondyieldsincreasedinthesecond half of 2016. UK government bond yields rose more than international equivalents following an increased perception among market participants that the UK’s future trade arrangements with the European Union may be less open than previously anticipated.
In September, the BOE commenced purchases of corporate bonds under the Corporate Bond Purchase Scheme (‘CBPS’). TheBankpurchased£4billionover thefirst twomonthsof thescheme. Although sterling investment grade corporate bond spreads fell on the announcement of the scheme in August, they have since risen gradually over the remainder of the year. After a strong pickup over the summer, issuance of sterling investment grade corporate bonds slowed in the later part of the year due to market volatility, as well as strong sterling issuance immediately following the announcement of the CBPS in August.
Key performance indicators (‘KPIs’)TheCompanyusesarangeofKPI’s(incorporatingfinancialper-formance,capitalandliquidity)tomanageitsfinancialposition.Ina changing regulatory environment and with the increasing cost of capital these KPIs are critical to the successful management of thebusinesstoachievetheCompany’sobjectives.ProfitabilityandRisk Weighted Assets (‘RWA’) are reviewed at the business line level to promote the drive towards the development and mainte-nanceofprofitableandcapitalefficientbusiness;capitalintensivebusinesses are closely monitored and reviewed.
2016 2015
Earnings Net profit/(loss) after tax (USD million):
Continued (101) (563)
Discontinued 73 5
Total (28) (558)
2016 2015
Capital
Risk Weighted Assets (USD million) 30,391 33,277
Tier 1 capital (USD million) 7,227 7,124
Return on Tier 1 capital (0.39%) (7.83%)
2016 2015
Liquidity
Liquidity Buffer (USD million) 20,636 19,216
2016 2015
Consolidated Statement of Financial Position
Total Assets (USD million) 118,953 143,542
Total Asset growth/(reduction) (17.13%) (25.79%)
Return on Total Assets (0.02%) (0.39%)
PerformanceConsolidated Statement of IncomeFor the year ended 31 December 2016, CSS(E)L Group reported a net loss attributable to shareholders of USD 28 million (2015: USD 558 million). Net revenues from continuing operations amounted to USD 913 million (2015: USD 824 million). After operating expenses, the CSS(E)L Group reported a loss before tax from continuing operations of USD 96 million (2015: USD 605 million loss). Income tax expense across continuing and discontin-uing operations for the year ended 31 December 2016 was USD 48 million (2015: USD 39 million tax credit). In addition, the CSS(E)L Group reported a gain before tax from discontinued operations of USD 116 million (2015: USD 8 million). The main reason for the large reduction in the reported loss is due to the execution of business migration plan and cost reduction strategy in the UK.
In 2016, Global Markets revenues decreased 18% year on year to USD 1,326 million, as challenging trading conditions resulted in low levels of client activity. Within Global Markets, Cash Equities revenues decreased by 25% to USD 310 million due to diminished client risk appetite and a negative market outlook caused by market uncertainty following the UK Referendum vote and a general risk-off trend in the latter half of the year due to the political uncertainty surrounding the US Presidential elections. Prime Services revenues decreased by 14% to USD 425 million, impactedfromthesignificantdropinGBP/USDratesposttheUKReferendumvoteandlowerclientdemanddrivenbydifficultmar-ket conditions. In addition to the economic environment the Prime Derivative Services business and Prime Services Finance and Brokeragesawasignificantdropinrevenuesasthebusinesswasmigrated to CSi and Credit Suisse AG Dublin Branch over the course of 2016. Systematic Market Making reported revenues of USD 140 million for 2016, a decrease of 50% compared with 2015. The reduction in revenues was primarily driven by a

9Credit Suisse Securities (Europe) Limited, Annual Report 2016
Strategic Report for the year ended 31 December 2016
reduction in trading activity in the later part of year following the exit of most business lines. This was partially offset by an increase in Global Credit Product revenues of 7% to USD 304 million mainly driven by the Auto, Utilities and Finance sectors from both primary and secondary markets.
AsiaPacificrevenuesremainedrelativelyflatyearonyear.The SRU division’s net revenues moved to a loss of USD 9
million compared with gains of USD 36 million in 2015. The loss in 2016 was mainly due to the cost to wind down and exit certain positions in line with the CS group strategy.
Business migrations, moving business to CSi and cost reduc-tionprogramintheUKhashadasignificantimpactontheexpensebase of CSS(E)L Group and combined expenses across continu-ing and discontinuing operations, most notably Compensation and Benefits reducedbyUSD621million toUSD636millionandGeneral, Administrative and Trading expenses has reduced by USD 263 million to USD 875 million.
The effective tax rate for the period to December 2016 is higher than the UK statutory tax rate primarily as a result of per-manent differences, non-recoverable foreign taxes and the effect of prior year adjustments. Similarly, the effective tax rate for the period to December 2015 was higher than the UK statutory tax rate primarily as a result of permanent differences, non-recover-able foreign taxes and the effect of deferred tax not recognised.
Discontinued operations and Assets held for saleIn January 2016, the CSS(E)L Group entered into a business transfer agreement to sell the Prime Services Platform to Credit Suisse AG (acting through its Dublin branch). The plan has subse-quently been revised and intends to amend the business transfer agreement to remove certain assets and liabilities from the scope of the agreement. Instead, CSS(E)L Group plans to move those assets and liabilities to CSi. CSS(E)L Group is transferring the Prime Services Platform to Credit Suisse AG (acting through its Dublin branch) on a phased basis and will record the sale as com-pleted when the majority of client balances have migrated to Credit Suisse AG (acting through its Dublin branch). This milestone is expected to be reached in 2017. The transfer of assets and liabili-ties to CSi is expected to commence in and be subsequently com-plete by 2018.
During 2016 Systematic Market Making business was sub-stantiallyexitedwithfinalclosureexpectedinearly2017.
CSS(E)L sold a number of assets in 2015 – the IBCM division transferred its staff, and majority of its clients to CSi; CSS(E)L branches located in Amsterdam and Milan transferred their respective businesses to CSi; the Listed Derivatives agency busi-ness and OTC Derivatives (centrally cleared) business was sold to CSi. Although the sale was substantially complete in 2015 for accountingpurposes,finalclientsandtheirbalancesweretrans-ferred at the beginning of 2016.
The above transactions collectively qualify for discontinued operations treatmentunder IFRS,andpost-taxprofitor lossofthese individualbusinesseshasbeenclassifiedasdiscontinuedoperations in CSS(E)L Group’s Consolidated Statement of Income. CSS(E)L Group’s prior period results have been restated to con-form with the current presentation. Assets and liabilities relating to thetransfersthathavenotyetcompletedhavebeenclassifiedasa
Assets/Liabilities held for sale in the Consolidated Statement of Financial Position. No impairment losses were required to be rec-ognised as a result of having to measure the Assets/Liabilities held for sale at fair value less cost to sell. Please see Note 25- Discontinued Operations and Asset Held for sale in the accounts for further details.
Consolidated Statement of Financial PositionAs at 31 December 2016 the CSSEL Group had total assets of USD 119 billion (31 December 2015: USD 144 billion). The reduc-tion in assets is driven by CSS(E)L Group’s goal to reduce balance sheet size, Risk Weighted Assets and lower the capital require-ments in the UK.
Business driven movements in the Consolidated Statement of Financial Position are:p Tradingfinancialassetsatfairvaluethroughprofitorlosshave
decreased by USD 7 billion. The decrease was primarily due to asset and business transfers to other CS group entities for the Systematic Market Making and Global Markets Management businesses and the transfer and subsequent wind down of business in the Strategic Resolution Unit division.
p Assets and liabilities held for sale decreased by USD 12 billion and USD 22 billion respectively due to the migration of the Prime Service business to another CS group entity and also the Prime Service business reducing balance sheet due to management actions.
Further movements in the Consolidated Statement of Financial Positionreflecttheimpactsofmanagingtherequiredliquiditypro-file in accordance with risk appetite, regulatory requirementsincluding European Banking Authority (‘EBA’) Basel III, and overall optimisationofthefundingprofile.Thishasresultedin:p A decrease of USD 7 billion across Cash and due from banks
and Interest bearing deposits with banks due to reducing fund-ing assets for regulatory capital purposes.
p An increase in short term borrowings of USD 1 billion from a CS group entity as a result of underlying business activity.
p A decrease in long term debt of USD 2 billion primarily due to the maturity of long term debt from Credit Suisse Investments (UK).
Total shareholder’s equity has remained stable at USD 8 billion (31 December 2015: USD 8 billion).
Financial instruments carried at fair value are categorised underthethreelevelsofthefairvaluehierarchy,wherethesignifi-cant inputs for the Level 3 assets and liabilities are unobservable.
Total Level 3 assets for CSS(E)L Group were USD 3.1 billion (2015: USD 3.34 billion), which was equivalent to 2.62% (2015: 2.33%) of total assets.
Total Level 3 liabilities for CSS(E)L Group were USD 0.8 bil-lion (2015: USD 0.8 billion) which was equivalent to 0.70% (2015: 0.56%) of total liabilities.
Off-balance sheet arrangements are highlighted in Note 33 – Guarantees and Commitments and Note 34 – Interest in Other Entities.
The CSS(E)L Group has incurred substantial taxes in the UK during 2016, including Bank Levy of USD 37 million (2015: USD

10
51 million), employers social security of USD 70 million (2015: USD 145 million) and irrecoverable UK value added tax (‘VAT’) of USD 72 million (2015: USD 94 million). However, as disclosed in Note 41 – Country-by-Country Reporting, Corporation taxes paid in the United Kingdom (‘UK’) for CSS(E)L are Nil (2015: USD Nil) astheCompanyhasnotmadetaxableprofitsduringtheyear.TheCSS(E)L Group has paid USD 31 million (2015: USD 26 million) in taxes in branches located outside of the UK.
Principal Risks and UncertaintiesThe Company faces a variety of risks that are substantial and inherent in its businesses including Market risk, Liquidity risk, Cur-rency risk, Credit risk, Country risk, Legal and Regulatory risk, Operational risk, Conduct risk, and Reputational risk. These are detailed in Note 38 – Financial Instruments Risk Position.
Therehavebeensignificantchangesinthewaylargefinancialservice institutions are regulated over recent years. There are increased prudential requirements as well as stricter regulations on thefinancialinstitutionsingeneralandmanyofthereformsbeingdiscussed inwiderforumswillchangetheway inwhichfinancialservices is structured affecting the CSS(E)L Group business model.
OutlookCSS(E)L Group is focused on businesses in which the Company hasacompetitiveadvantageandisabletooperateprofitablywithan attractive return on capital in the new regulatory environment, and therefore will continue to refocus resources on opportunities in high-returning businesses such as Cash Equities, residual Prime Service business, and Global Credit Products, and to reduce the impact of the Strategic Resolution Unit.
As a part of the changing business footprint the Strategic Res-olution Unit will effectively wind down businesses and positions thatdonotfittheCompany’sstrategicdirection,byconsolidatingportfolios from former non-strategic units plus additional activities and businesses from the former Investment Banking division that are no longer considered strategic. The Strategic Resolution Unit portfolioprimarilycomprises the legacy lifefinancebusiness forwhich the run off is projected to be gradual due to the long-dated nature of the portfolio.
CSS(E)L Group completed the sale and closure of number of businesses in 2016 and as a result the total assets are estimated to reduce by approximately 43% by the end of 2018. CSS(E)L Group remains committed in the short term to offering its clients a rangeofequitiesandfixedincomeproductsandservices.
The Company will continue to optimise resource allocation and focus on high returning, scalable opportunities. The Company con-tinues with the globally announced cost reduction strategy and as a result, expects the London campus headcount to reduce further, having a direct impact on the cost base of the Company. During 2017 the CSS(E)L Group will move all critical staff in the Compa-ny’s Corporate functions and critical service contracts into a sepa-rate legal vehicle as part of the global Too-Big-To-Fail legislation, where major banks are required to prepare and implement Recov-ery and Resolution Plans (‘RRPs’). The resolution part of the RRP must demonstrate that a bank or a company can be wound down in an orderly fashion, while supporting the continuation of
systemically-important functions in the event of the Company’s impending insolvency. In the UK, the Company has begun the process of establishing Credit Suisse Services AG, London Branch as the local service company. This is a branch of Credit Suisse Services AG (the Service Company parent entity) which was established in Switzerland. The new Service Company will house the employees, contracts and assets required to perform services that are deemed resolution-critical and which support multiple Material Legal Entities on a cross-border basis.
CSS(E)L Group will additionally continue to focus on optimis-ing its risk weighted assets as well as focusing on costs with a viewto returning toprofit,andthereforecapitalaccretion, in thefuture.
UK ReferendumOn 23rd June 2016, voters in the UK voted to leave the European Union(‘EU’) inanon-bindingreferendum.Amongthesignificantglobal implications of the referendum is the increased uncertainty concerning a potentially more persistent and widespread imposi-tion by central banks of negative interest rate policies, caused by general political uncertainty. The European Central Bank (‘ECB’) and others have already introduced negative interest rates to addressdeflationaryconcernsandtopreventappreciationoftheirrespective currencies. The BOE has announced a cut to its bank rate of 25 basis points to 0.25% and introduced a package of measures designed to provide additional monetary stimulus. The package included the rate cut, a new Term Funding Scheme to reinforce the pass-through of the cut in Bank Rate; the purchase of up to GBP 10 billion of UK corporate bonds; and an expansion of the asset purchase scheme for UK government bonds of GBP 60 billion, taking the total stock of these asset purchases to GBP 435billion.Thelastthreeelementswillbefinancedbytheissu-ance of central bank reserves.
In addition, a decision taken to introduce a countercyclical buf-fer for UK exposures of 0.5% from March 2017 has been reversed. Following the UK Referendum result, the Financial Policy Commit-tee (‘FPC’) reduced the UK countercyclical capital buffer rate from 0.5% to 0% of banks’ UK exposures with immediate effect. Absent any material change in the outlook, and given the need to give banks the clarity necessary to facilitate their capital planning, the FPC stated that it expects to maintain a 0% UK counter cycli-cal capital buffer rate until at least June 2017. The FPC expects that this will allow banks to use some of their capital buffers to maintain lending.
CSS(E)L is exploring solutions to various outcomes, post triggering Article 50 in March 2017, including a Hard Brexit, and isrefiningthein-depthanalysisandlookingatwaystooptimisethe current infrastructure, including options for continuing to ser-vice EU clients and accessing markets and leveraging the exist-ing EU presence where appropriate. CSS(E)L already provides a comprehensive range of services to clients through both our Lon-don operations and a number of different subsidiaries and branches across the Continent. This provides CSS(E)L with the flexibilitytorespondtopotentialchangesintheUKandEUfinan-cial services industry in the future.
The UK’s unexpected decision to leave the EU was followed by an initial period of market volatility and a longer-term fall in the

11Credit Suisse Securities (Europe) Limited, Annual Report 2016
Strategic Report for the year ended 31 December 2016
value of sterling. While there have been no instances of counter-party distress in the CSS(E)L portfolio following the referendum, Credit Risk Management (‘CRM’) has downgraded its UK country rating.This reflects theexpecteddifficultiesof theexitnegotia-tions after Article 50 is activated and lower economic growth fore-casts. However, rating strength remains underpinned by the coun-try’swealthyanddiversifiedeconomy,high institutionalstrength,aswellasaflexiblemonetaryandfiscalpolicythatshouldensuresome resilience against the expected challenges over the next two years. CSS(E)L has a high-quality portfolio comprising of relation-ships with regulated funds, qualifying central counterparties and banks. In addition to a UK country exposure limit, CRM has intro-duced a lower exposure review trigger to improve management oversight of the portfolio. CRM continues to assess its risk to fur-ther sterling weakening through GBP-focused scenarios.
Regulatory Market ChangesCSS(E)L Group has implemented the Basel Committee on Bank-ing Supervision (‘BCBS’) and International Organisation of Securi-ties Commission (‘IOSCO’) revised framework for margin require-ments for non-centrally cleared derivatives in each jurisdiction in which this regulation has been implemented. The requirements centre around the posting and collecting of segregated initial mar-gin for non-centrally cleared derivatives and daily settlement of variation margin. Initial Margin and Variation Margin rules impacting CSS(E)L Group and other in-scope, “Phase 1”, market partici-pants were introduced in the U.S., Japan and Canada on 1 Sept 2016and inmostotherglobalfinancialcentreson4Feb2017.Each year for the next 4 years the in-scope market participants qualifying for Initial Margin conditions will increase. Variation Mar-gin conditions impacting the majority of the clients of CSS(E)L Group became effective across most jurisdictions on 1 March 2017. CSS(E)L Group is assessing the impact of increased liquid-ity requirements to fund these margin requirements.
LitigationThe risks in relation to litigation are set out in Note 33 – Guaran-tees and Commitments.
LiquidityThe Company’s Liquidity position is managed in accordance with Liquidity Risk Metrics set both externally and internally. The Liquid-ityCoverageRatio(‘LCR’),asdefinedbythePrudentialRegulationAuthority (‘PRA’) based on recommendations by the Basel Com-mittee on Banking Supervision, ensures adequate unencumbered High Quality Liquid Assets (‘HQLA’) that can easily be converted to cash to meet liquidity needs for a 30 day liquidity stress sce-nario. The Basel III Net Stable Funding Ratio (‘NSFR’) is a 1 year structuralratioensuringafundingprofileprovidingsufficientlong-term stable funding in relation to the composition of its assets and off-balance sheet activities.
TheCSgroupconsidersastrongandefficientliquiditypositionto be a priority. The liquidity position is monitored in accordance with all metrics, taking account of the current regulatory regime and any forthcoming changes to the regulatory framework or to the Company’s business strategy. The CS group continues to pro-videconfirmationthatitwillprovidesufficientfundingtoCSS(E)L
Grouptoensurethatitmaintainsasoundfinancialsituationandisin a position to meet its debt obligations.
Significant Accounting DevelopmentsThe CSS(E)L Group will adopt the IFRS 9 Financial Instruments accounting standard on 1 January 2018. In July 2014, the IASB (InternationalAccountingStandardsBoard)publishedthefinalver-sion of IFRS 9, which replaces the existing guidance in IAS 39 Financial Instruments Recognition and Measurement. The stan-dard includesamendedguidanceforclassificationandmeasure-mentoffinancial instruments,newhedgingguidanceandanewimpairment model which will result in earlier recognition of potential losses. IFRS 9 also requires extensive new disclosures as well as the revision of current disclosure requirements under IFRS 7 Financial Instruments: Disclosures.
The impairment guidance included within IFRS 9 replaces the current incurred loss model with an expected loss model which is based on changes in credit quality since initial recognition. IFRS 9 appliesoneclassificationapproachforalltypesoffinancialassets,basedon thebusinessmodelwithinwhichfinancial assetsaremanaged,andtheircontractualcashflowcharacteristics(whetherthecashflows represent ‘solelypaymentsofprincipaland inter-est’).Nochangeswereintroducedfortheclassificationandmea-surement of financial liabilities, except for the recognition ofchanges in own credit risk in Other Comprehensive Income for liabilitiesdesignatedatfairvaluethroughprofitandloss.
IFRS 15 Revenue from Contracts with Customers, was issued in May 2014 and establishes a single, comprehensive framework for revenue recognition. The core principle of IFRS 15 is that an entity will recognise revenue to depict the transfer of promised goods or services to customers in an amount that reflectstheconsiderationtowhichtheentityexpectstobeenti-tled in exchange for those goods or services. IFRS 15 also includes disclosure requirements to enable users of financialstatements to understand the nature, amount, timing and uncer-taintyofrevenueandcashflowsarisingfromcontractswithcus-tomers. IFRS 15 is effective for annual reporting periods begin-ning on or after 1 January 2018.
The CSS(E)L Group has established a cross-functional imple-mentation team and governance structure for the project to imple-ment IFRS 9 and IFRS 15.
For further information on the guidance in IFRS 9 and IFRS 15, as well as the implementation status for the CSS(E)L Group, please refer to the ‘Standards and Interpretations endorsed by the EUandnotyeteffective’sectioninNote2-SignificantAccountingPolicies.
Key Credit Risk Developments2016wasayearmarkedbysignificantpoliticalevents inseveralcountries and regions, including the UK referendum on leaving the European Union and the US presidential election. Events and other key risks which could potentially have an impact on the credit portfolio of the Company are discussed further below.
European BanksEuropean banks continued to feature in the news in 2016, most notably Deutsche Bank’s settlement with the US Department of

12
Justice over its involvement in US residential-mortgage-backed securities, and the ongoing capital-raising efforts of Italian banks. CSS(E)L’sexposureisweightedtowardsfinancialcounterparties,including a concentration in the banking industry, however this is diversifiedacrossregionsandcounterparties.ExposurestoEuro-pean banks remain within CSS(E)L’s risk appetite. With respect to Italian banks, CRM has actively managed down credit exposure overanumberofyearsandCSS(E)Lhasnosignificantexposureto weaker Italian banks that may require recapitalisation.
Selected credit risk exposure views by country and industry segmentCSS(E)LGroup’screditportfoliobenefitsfromgeographicalandindustrial diversification, by virtue of a balanced risk appetiteframework which dynamically adjusts to market conditions. As part of proactive risk management, limits are adjusted to avoid the build-up of concentrations to risky or volatile industries and coun-tries. The risk management framework includes country and industry limits, and the execution of scenario analyses which trans-late aggregate exposures into potential losses under forward look-ing narratives.
The table below shows selected exposures in CSS(E)L by country, including the three largest countries and risk focus
countries. Two of the three largest country exposures are in large developed countries with stable economies (United States and United Kingdom), while CSS(E)L also has exposure in the Republic of Korea in relation to its Seoul Branch. CSS(E)L undertakes business with counterparties across the Eurozone and the table includes the countries with the largest net expo-sures. With elections in several key countries, 2017 is likely to see increased political risk in the Eurozone, however the table shows that exposures have been reducing in Germany, France and the Netherlands.
Gross credit risk exposures, presented on a risk based view, include loans and loan commitments, investments (such as cash securities and other investments) and all exposures of derivatives (not limited to credit protection purchased and sold), after consid-eration of legally enforceable netting agreements. Gross expo-sures are calculated after offsetting long and short positions, capped at nil for net short positions. Net exposures include the impact of risk mitigation such as Credit Default Swaps (‘CDS’) and other hedges, guarantees, insurance and collateral (primarily cash and securities). Collateral values applied for the calculation of the net exposure are determined in accordance with risk management policiesandreflectapplicablemarginingconsiderations.
Sovereign Financial Institutions Corporate Total AnnualΔ
Net Exposure as % of Gross Net Gross Net Gross Net Gross Net Gross Net All Country 31 December 2016 (USD millions) Exposure Exposure Exposure Exposure Exposure Exposure Exposure Exposure Exposure Exposure Exposures
United States 0 0 2,921 2,669 43 43 2,964 2,712 364 400 31%
United Kingdom 0 0 2,375 1,942 61 61 2,436 2,003 (407) (444) 23%
Republic of Korea 0 0 628 628 0 0 628 628 (87) (87) 7%
Germany 0 0 538 527 88 88 626 615 (335) (340) 7%
France 0 0 454 335 111 111 565 446 (184) (265) 5%
Netherlands 0 0 154 154 51 51 205 205 (106) (104) 5%
Total 0 0 7,070 6,255 354 354 7,424 6,609 (755) (840) 75%
Sovereign Financial Institutions Corporate Total
Gross Net Gross Net Gross Net Gross Net 31 December 2015 (USD millions) Exposure Exposure Exposure Exposure Exposure Exposure Exposure Exposure
United States 0 0 2,511 2,223 89 89 2,600 2,312
United Kingdom 0 0 2,685 2,289 158 158 2,843 2,447
Republic of Korea 58 58 657 657 0 0 715 715
Germany 0 0 809 803 152 152 961 955
France 165 165 496 458 88 88 749 711
Netherlands 0 0 258 256 53 53 311 309
Total 223 223 7,416 6,686 540 540 8,179 7,449
13Credit Suisse Securities (Europe) Limited, Annual Report 2016
Strategic Report for the year ended 31 December 2016
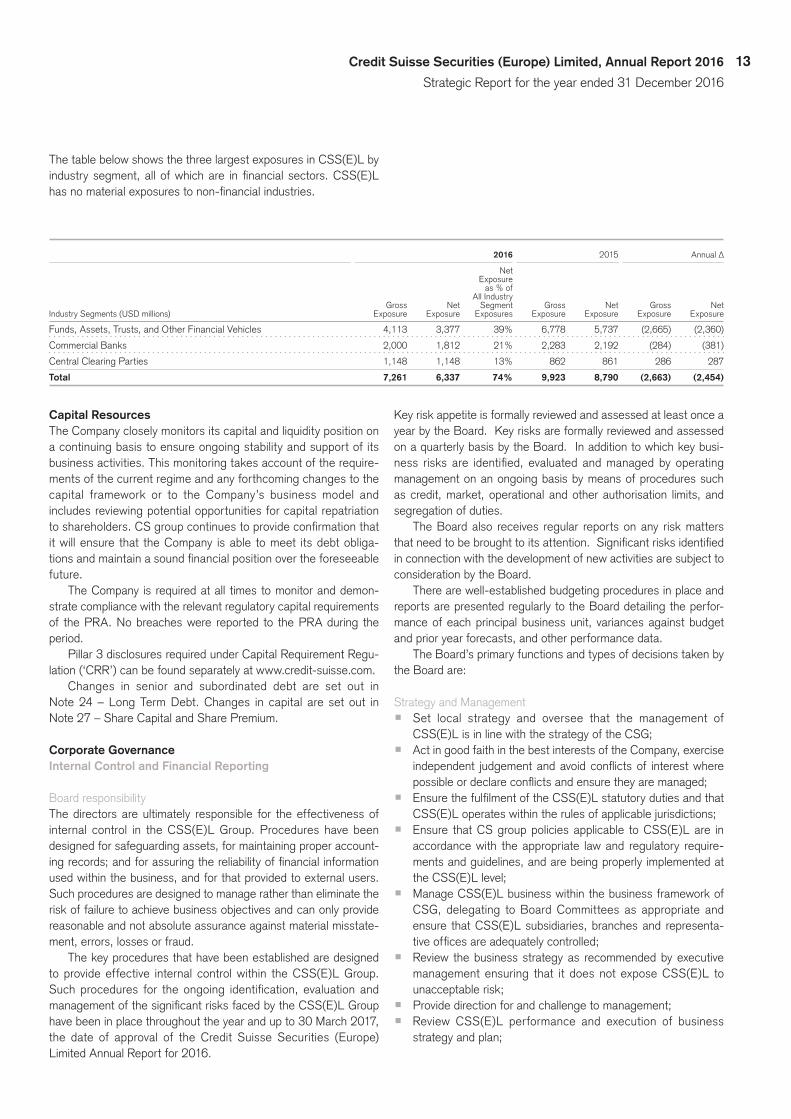
The table below shows the three largest exposures in CSS(E)L by industrysegment,allofwhichare infinancial sectors.CSS(E)Lhasnomaterialexposurestonon-financialindustries.
2016 2015 AnnualΔ
Net Exposure as % of All Industry Gross Net Segment Gross Net Gross Net Industry Segments (USD millions) Exposure Exposure Exposures Exposure Exposure Exposure Exposure
Funds, Assets, Trusts, and Other Financial Vehicles 4,113 3,377 39% 6,778 5,737 (2,665) (2,360)
Commercial Banks 2,000 1,812 21% 2,283 2,192 (284) (381)
Central Clearing Parties 1,148 1,148 13% 862 861 286 287
Total 7,261 6,337 74% 9,923 8,790 (2,663) (2,454)
Capital ResourcesThe Company closely monitors its capital and liquidity position on a continuing basis to ensure ongoing stability and support of its business activities. This monitoring takes account of the require-ments of the current regime and any forthcoming changes to the capital framework or to the Company’s business model and includes reviewing potential opportunities for capital repatriation toshareholders.CSgroupcontinuestoprovideconfirmationthatit will ensure that the Company is able to meet its debt obliga-tionsandmaintainasoundfinancialpositionovertheforeseeablefuture.
The Company is required at all times to monitor and demon-strate compliance with the relevant regulatory capital requirements of the PRA. No breaches were reported to the PRA during the period.
Pillar 3 disclosures required under Capital Requirement Regu-lation (‘CRR’) can be found separately at www.credit-suisse.com.
Changes in senior and subordinated debt are set out in Note 24–LongTermDebt.Changes in capital are set out inNote 27–ShareCapitalandSharePremium.
Corporate GovernanceInternal Control and Financial Reporting
Board responsibilityThe directors are ultimately responsible for the effectiveness of internal control in the CSS(E)L Group. Procedures have been designed for safeguarding assets, for maintaining proper account-ingrecords;andforassuringthereliabilityoffinancialinformationused within the business, and for that provided to external users. Such procedures are designed to manage rather than eliminate the risk of failure to achieve business objectives and can only provide reasonable and not absolute assurance against material misstate-ment, errors, losses or fraud.
The key procedures that have been established are designed to provide effective internal control within the CSS(E)L Group. Suchprocedures for theongoing identification, evaluation andmanagementofthesignificantrisksfacedbytheCSS(E)LGrouphave been in place throughout the year and up to 30 March 2017, the date of approval of the Credit Suisse Securities (Europe) Limited Annual Report for 2016.
Key risk appetite is formally reviewed and assessed at least once a year by the Board. Key risks are formally reviewed and assessed on a quarterly basis by the Board. In addition to which key busi-ness risks are identified, evaluatedandmanagedbyoperatingmanagement on an ongoing basis by means of procedures such as credit, market, operational and other authorisation limits, and segregation of duties.
The Board also receives regular reports on any risk matters thatneedtobebroughttoitsattention.Significantrisksidentifiedin connection with the development of new activities are subject to consideration by the Board.
There are well-established budgeting procedures in place and reports are presented regularly to the Board detailing the perfor-mance of each principal business unit, variances against budget and prior year forecasts, and other performance data.
The Board’s primary functions and types of decisions taken by the Board are:
Strategy and Managementp Set local strategy and oversee that the management of
CSS(E)L is in line with the strategy of the CSG;p Act in good faith in the best interests of the Company, exercise
independent judgementandavoidconflictsof interestwherepossibleordeclareconflictsandensuretheyaremanaged;
p EnsurethefulfilmentoftheCSS(E)LstatutorydutiesandthatCSS(E)L operates within the rules of applicable jurisdictions;
p Ensure that CS group policies applicable to CSS(E)L are in accordance with the appropriate law and regulatory require-ments and guidelines, and are being properly implemented at the CSS(E)L level;
p Manage CSS(E)L business within the business framework of CSG, delegating to Board Committees as appropriate and ensure that CSS(E)L subsidiaries, branches and representa-tiveofficesareadequatelycontrolled;
p Review the business strategy as recommended by executive management ensuring that it does not expose CSS(E)L to unacceptable risk;
p Provide direction for and challenge to management;p Review CSS(E)L performance and execution of business
strategy and plan;

14
p Ensure that CSS(E)L has adequate financial resources tomeet objectives and effectively manage risk;
p Review material new business proposals;p Reviewstandardreporting, includingCSS(E)Lfinancials,risk
exposures, capital, liquidity and funding; andp Review material internal control, regulatory, legal and compli-
ance issues.
Culturep Review initiatives to support appropriate culture, conduct and
behaviour of staff;p Review disciplinary actions by management quarterly and at
year end for compensation purposes;p Review CSS(E)L Executive Committee decisions regarding
registration and de-registration of Senior Managers;p Ensure that HR policies accord with the law and do not expose
CSS(E)L to unacceptable risk; andp Review reports prepared by Compliance and the Audit Com-
mittee on CSS(E)L systems and controls in relation to whistleblowing.
Risk Managementp Review and approve the risk appetite framework, statement
and limits for CSS(E)L;p Review CSS(E)L material credit, market, operational, conduct,
and reputational risk exposures;p Review CSS(E)L liquidity and liability management;p Review the Capital Framework to ensure the safety of CSS(E)L
operations;p Ensure appropriate systems and controls are in place to pro-
vide a reasonable level of assurance that the appetite of risk that CSS(E)L will incur is consistent with that which the Board considers it prudent to take; and
p Review risk limits or exceptions escalated from the Board Risk Committee.
Financial Reporting and Internal Controlp Review quarterly financial information and approve Annual
Financial Statements;p Review and approve the annual Financial Plan;p Review and approve the control frameworks for all business
booked into CSS(E)L;p Review the control framework for all functions that support the
business of CSS(E)L;p Consider reports relating to CSS(E)L financials including
Financial Accounting, Product Control and Tax, market and credit risk exposures, capital, liquidity and funding, internal control, regulatory, legal or compliance escalated from Board Sub-Committees or management committees; and
p Consider the adequacy of management information.
Board EvaluationEach year, the Board undertakes a formal, rigorous Board Evalu-ation against the responsibilities listed in its Terms of Reference and the Board’s objectives to assess Board Committee effec-tiveness and to evaluate and decide on future objectives, and focus topics and work plan, in light of the CS group Strategy and structure,andtoidentifyinternalbriefings/trainingandprofes-sional development required by individual Directors in the coming years. The Evaluation also assists the Board Nomination Com-mittee to assess the structure, size, composition and perfor-mance of the Board, and knowledge, skills, experience and diversity of Board members and Board succession planning and Board member appointments. From time to time, the Board may also mandate an external advisor to facilitate the evaluation pro-cess; usually the evaluation is internal for two years and external for every third year.
The Board held the annual 2016 Board Evaluation and reviewed the Board performance including self-assessment ques-tionnaires and time allocations and considered year-end target achievements compared to the Board objectives, Board gover-nance including structure and composition, and proposed 2017 Board objectives. The 2016 Board Evaluation also took into accountthefindingsoftheFinancialReportingCouncil‘CorporateCulture and the Role of the Board’ statement and the PRA rules regardingdiversitywithinfirms’managementbodies.
It was concluded that the Board was effective and Board Director performance was satisfactory in 2016. The Board agreed its 2017 Objectives.
Board TrainingIn addition to Board Evaluation and Board Director Induction, BoardDirectorsundertakeongoinginternalbriefingsandtrainingwhich are tailored to CSS(E)L business strategy and the Board objectives and to decisions to be taken by the Board; and an exter-nal Board governance course to provide for the professional devel-opment of the Board.
Board MeetingsTen Board meetings and one Board Strategy Onsite were held in 2016. All members of the Board are expected to spend the neces-sary time outside of these meetings to discharge their responsibil-ities appropriately.TheChair calls themeetingswith sufficientnotice and prepares an agenda for each meeting. The Chair has the discretion to invite members of management or others to attend the meetings. The Board also holds separate private ses-sions without management present. Minutes are kept of the pro-ceedings and resolutions of the Board.
Meeting attendanceThe members of the Board are encouraged to attend all meetings of the Board and the committees on which they serve.

15Credit Suisse Securities (Europe) Limited, Annual Report 2016
Strategic Report for the year ended 31 December 2016
Meeting attendance
Board of Audit Risk Nomination Remuneration Conflicts Directors Committee Committee Committee Committee Committee
in 2016
Total number of meetings held 10 6 4 3 4 1
Number of members who missed no meetings 7 3 3 2 4 2
Number of members who missed one meeting 4 1 1 1 – –
Number of members who missed two or more meetings 1 – – – – –
Meeting attendance, in % 93 94 94 89 100 100
1 The Board consisted of seven members as of the beginning of the year and nine members at the end of the year respectively, with three members resigned during the year and five members being appointed.
2 The Audit/Risk/Nomination/Remuneration Committee consisted of three members as of the beginning of the year and at the end of the year, with one member resigning and one being appointed.
3 The Conflicts Committee consists of two members.
CommitteesCertain responsibilities are delegated to Board Committees, which assist the Board in carrying out its functions and ensure that there is independent oversight of internal control and risk management: The Chair of each Board Committee reports to the Board on the matters discussed at Committee meetings.
Credit Suisse Securities (Europe) Limited Audit CommitteeThe Audit Committee’s (‘AC’) primary function is to assist the Board of Directors (‘Board’) in fulfilling its financial oversightresponsibilitiesdefinedbylaw,articlesofassociationandinternalregulations by:p monitoringandassessingtheoverall integrityof thefinancial
statementsanddisclosuresofthefinancialcondition,resultsofoperationsandcashflowsofCSS(E)L;
p reporting to the CSS(E)L Board on the outcome of the statu-tory audit and explaining how the statutory audit contributed to theintegrityoffinancialreportingandwhattheroleoftheACwas in that process;
p monitoringtheadequacyandintegrityofthefinancialaccount-ing and reporting processes and the effectiveness of internal quality controls and risk management systems regarding CSS(E)L’sfinancialreporting;
p monitoring processes designed to ensure compliance by CSS(E)L inall significant respectswith legaland regulatoryrequirements, including disclosure controls and procedures, and the impact (or potential impact) of developments related thereto;
p monitoring the adequacy of the management of operational risks, jointly with the Risk Committee including assessing the effectiveness of internal controls that go beyond the area of financialreporting;
p monitoring the adequacy of the management of reputational risks, jointly with the Risk Committee;
p reviewing and assessing the integrity, independence and effectiveness of CSS(E)L’s policies and procedures on whis-tleblowing, including those policies and procedures intended to protect whistle-blowers from being victimised because they have disclosed reportable concerns;
p being responsible for the procedure for the selection of the External Auditors and recommending the External Auditors to be appointed;
p monitoringthequalifications, independenceandperformanceof the External Auditors including the suitability of the External Auditors’ provision (if any) of non-audit services to the Company;
p monitoring the statutory audit of CSS(E)L annual and consoli-datedfinancialstatements,inparticularitsperformance,tak-ingintoaccountanyfindingsandconclusionsbythecompetentauthority; and
p reviewing and assessing the independence, integrity and ade-quacy of resourcing, and overseeing the performance, of CSS(E)L Internal Audit Department, in particular its implemen-tation and maintenance of an audit plan to examine and evalu-ate the adequacy and effectiveness of CSS(E)L’s systems, internal control mechanisms and arrangements.
In reviewing the Credit Suisse Securities (Europe) Limited Annual Report 2016, the Audit Committee considered critical accounting estimates and judgements including the valuation of Level 3 assets and liabilities, and the recoverability of the deferred tax asset. The Audit Committee additionally considered the projected capital requirements in the next 12 months and, in this context, the con-tinued access to appropriate funding to maintain adequate capital and liquidity positions.
The Audit Committee members are Alison Halsey (Chair), Nor-een Doyle and Robert Endersby.
Credit Suisse Securities (Europe) Limited Risk CommitteeThe Risk Committee’s (‘RC’) primary function is to assist the Boardinfulfillingitsriskmanagementresponsibilitiesasdefinedbyapplicable law and regulations as well as CSS(E)L articles of association and internal regulations, by periodically:p providing advice to the Board on CSS(E)L overall current and
future risk appetite and assisting the Board in overseeing the implementation of that strategy by management;
p reviewing and approving the strategies and policies for taking up,managing,monitoringandmitigatingtherisksthefirmisormight be exposed to, including those posed by the macroeco-nomic environment in which it operates in relation to the status of the business cycle;
p reviewing and assessing the independence, integrity and ade-quacy of resourcing, and overseeing the performance of the risk management function of CSS(E)L in particular as it relates

16
tomarket,credit,andliquidityandfundingrisksandnon-finan-cial risks such as legal, strategic and business risks; and group risk;
p reviewing and assessing the independence, integrity and ade-quacy of resourcing, and overseeing the performance, of the compliance function of CSS(E)L including processes and organizational structures to detect and monitor any risk of fail-ure to comply with applicable regulatory requirements or that CSS(E)Lmaybeusedtofurtherfinancialcrime;
p reviewing the adequacy of CSS(E)L regulatory capital and its allocation to CSS(E)L businesses;
p reviewing certain risk limits and regular risk reports including Risk Appetite and make recommendations to the Board;
p reviewing the Internal Capital Adequacy Assessment Process (ICAAP) and providing input into the range of scenarios and analyses that management should consider;
p reviewing the Internal Liquidity Adequacy Assessment Process (ILAAP) and providing input into the range of scenarios and analyses that management should consider;
p reviewing and assessing the adequacy of the management of reputational risks, jointly with the Audit Committee; and
p reviewing and assessing the adequacy of the management of operational risks including the adequacy of the internal control system, jointly with the Audit Committee.
The Risk Committee members are Robert Endersby (Chair), Nor-een Doyle and Alison Halsey.
Credit Suisse Securities (Europe) Limited Nomination CommitteeCreditSuisseSecurities(Europe)LimitedisdefinedasaCRRfirm(i.e.afirmsubjecttoEUregulationonprudentialrequirementsforcredit institution and investment firms) supervised by thePRAwhich is required to: p establish a Nomination Committee (‘NC’) composed of mem-
bers of the Board who do not perform any executive function in the Company;
p ensure that the NC is able to use any forms of resources the NC deems appropriate, including external advice; and
p ensure that the NC receives appropriate funding.
The duties of the NC are to:p engage a broad set of qualities and competences when recruit-
ing members to the Board and put in place a policy promoting diversity on the Board;
p identify and recommend for approval, by the Company share-holder(CSG),candidatestofillBoardvacancies,havingevalu-ated the balance of knowledge, skills, diversity and experience of the Board;
p make recommendations to the Board concerning the role of the Chair and membership of the Board committees, in consul-tation with the Chairs of those committees;
p prepare a description of the roles and capabilities for a partic-ular appointment, and assess the time commitment required;
p periodically, and at least annually, assess the structure, size, composition and performance of the Board and make recom-mendations to the Board with regard to any changes;
p periodically, and at least annually, assess the knowledge, skills and experience of individual members of the Board and of the Board collectively, and report this to the Board;
p periodically review the policy of the Board for selection and appointment of senior management and make recommenda-tions to the Board;
p in performing its duties and to the extent possible on an ongo-ing basis, take account of the need to ensure that the Board s decision making is not dominated by any one individual or small group of individuals in a manner that is detrimental to the inter-est of the Company as a whole; and
p recommend to the Board the appointment and removal of ChiefExecutiveOfficer (‘CEO’) andChiefFinancialOfficer(‘CFO’).
The Nomination Committee members are Noreen Doyle (Chair), Alison Halsey and Robert Endersby. The NC complies with the requirementsdefinedinthePRAhandbookfor‘GeneralOrganisa-tional Requirements’, chapter 6 (Nomination committee).
Credit Suisse Securities (Europe) Limited Advisory Remuneration CommitteeThe purpose of the Committee is to advise the CSG Compensa-tion Committee in respect of matters relating to remuneration for the employees of CSS(E)L Group, in particular members of the CSS(E)L Executive Committee, PRA/FCA Code Staff and other individuals, whose role, individually or as part of a group, has been identifiedashavingapotential impactonmarket, reputationaloroperational risk.
Consistent with the requirements of the PRA Remuneration Code, the Company has broadened the ‘Malus clause’ which is applicable to Code Staff, UK Managing Directors and certain other identifiedemployees.
The CSS(E)L Advisory Remuneration Committee members are Noreen Doyle (Chair), Alison Halsey and Robert Endersby.
CreditSuisseSecurities(Europe)LimitedConflictsCommitteeTheBoardhasformedaBoardConflictsCommitteeconsistingoftwo independent Non-Executive Directors Alison Halsey and Rob-ert Endersby. The Committee reviews the effectiveness of the ConflictsManagementFrameworkannually.TheCommitteemetin 2016 and concluded that the Framework operated effectively in 2016.
Board Diversity PolicyCSS(E)L recognises and embraces the benefits of building adiverse and inclusive culture and having a diverse board. The Board Diversity Policy sets out the approach to diversity on the Board of Directors. A diverse Board will include and make good use of differences in the skills, regional and industry experience, independence and knowledge, background, race, gender and other distinctions between Directors. The Committee will consider these differences in determining the optimum composition of the Board and when possible will be balanced appropriately. At the date of adoption of this Policy, the Board set a target to ensure that at least 25 per cent female representation on the Board to be achieved by the end of 2016; the Board continue to monitor its

17Credit Suisse Securities (Europe) Limited, Annual Report 2016
Strategic Report for the year ended 31 December 2016
CSS(E)L Audit
Committee
CSS(E)L Risk
Committee
CSS(E)L Nomination Committee
CSS(E)L Advisory Remuneration
Committee
CSS(E)L Conflicts
Committee
Summary of Key Governance Committees
Tier 1
Board Level
Tier 2
CSS(E)L Executive
Committee
CSS(E)L Board of Directors
CSS(E)L Risk Management
Committee
CSS(E)L VARMC
CSS(E)L ALM CARMC
CSS(E)L Operating Committee
Business Management Committees
target in 2017 through periodic reviews of structure, size, compo-sition and performance of the Board.
The aforementioned Board responsibilities and Board commit-teescomplywiththerequirementsdefinedinthePRAhandbookfor ‘General Organisational Requirements’, chapter 5 (Manage-ment Body).
Risk managementOverviewThe Company’s risk management framework is based on transpar-ency, management accountability and independent oversight. Risk management plays an important role in the Company’s business planning process and is strongly supported by senior management and the Board of Directors. The primary objectives of risk man-agementaretoprotecttheCompany’sfinancialstrengthandrep-utation, while ensuring that capital and liquidity is well deployed to support business activities and grow shareholder value. The
Company has implemented risk management processes and con-trol systems and it works to limit the impact of negative develop-ments by monitoring all relevant risks including credit, market, liquidity, operational and reputational risks, and managing concen-trations of risks.
Risk governanceThe prudent taking of risk in line with the Company’s strategic pri-orities is fundamental to its business as part of a leading global banking group. To meet the challenges in a fast changing industry with new market players and innovative and complex products, the Company seeks to continuously strengthen the risk function, which is independent of but closely interacts with the businesses, toensuretheappropriateflowofinformation.
Committees are implemented at a senior management level to support risk management.
The key committees which support the Board of Directors are:Tier 1 comprises a single management committee for CSS(E)L, the CSS(E)L Executive Committee. It is chaired by the Chief ExecutiveOfficer (‘CEO’),CSS(E)L andmembers include theCEO,CSS(E)L;DeputyCEO,CSS(E)L;ChiefFinanceOfficer(‘CFO’),CSS(E)L;ChiefRiskOfficer(‘CRO’),CSS(E)L;HeadofInternal Audit, CSS(E)L; Chief Compliance Officer (‘CCO’),CSS(E)L; Business Heads and other Senior Managers. The Dep-uty CEO, CSS(E)L deputises as Chair when necessary.
The purpose of the CSS(E)L Executive Committee is to sup-port the CEO, CSS(E)L in the day-to-day management of CSS(E)L and, in particular, in the delivery of the strategy agreed by the CSS(E)L Board. The CSS(E)L Executive Committee facilitates the decision-making process which impacts all aspects of CSS(E)L
including: culture, strategy, revenue, reporting, policy, regulatory compliance, risk and control, costs and people. The CSS(E)L Executive Committee is also responsible for identifying and escalat-ing issues to the CSS(E)L Board or relevant Board committees for review, recommendation and/or approval as necessary.
Tier 2 committees were established by the CSS(E)L Executive Committee. Given the breadth of business activities and multiple areas of focus, the CSS(E)L Executive Committee has established a support structure comprising executive committees with a more focused mandate. These Tier 2 committees are chaired by mem-bers of the CSS(E)L Executive Committee and are all accountable to the CSS(E)L Executive Committee. The CSS(E)L Executive Committee has delegated particular aspects of its mandate to these Tier 2 committees.

18
p CSS(E)L Risk Management Committee (‘CSS(E)L RMC’): chaired by the CRO of CSS(E)L, the CSS(E)L RMC is dele-gated authority from the CSS(E)L Executive Committee to establish more granular limits within the bounds of CSS(E)L’ s overall risk limits and risk appetite. Its purpose is to:i ensure that proper standards for risk oversight and man-
agement are in place;ii make recommendations to the CSS(E)L Board on risk
appetite;iii review the Internal Capital Adequacy Assessment Process
(‘ICAAP’) and the Individual Liquidity Adequacy Assess-ment Process (‘ILAAP’) and make recommendations to the CSS(E)L Board;
iv define and establish risk limits for both individual busi-nesses and at the portfolio level within authorities dele-gated by the CSS(E)L Board; and
v review and implement appropriate controls over remote booking risk relating to CSS(E)L.
p Valuation Risk Management Committee (‘VARMC’) is the most senior decision making forum for valuation issues in CSS(E)L, and is run as a sub-committee of CSG VARMC. Its purpose is to:i review, challenge and ratify/modify conclusions from Inven-
tory Valuation Reviews; andii directresolutionofsignificantinventoryvaluationissues.It
also establishes non-actionable variance thresholds (both positive and negative) that are to be monitored on a monthly basis.
p CSS(E)L Asset and Liability Management (‘ALM’) Capital Allocation and Risk Management Committee (‘CARMC’): chaired by the CFO, CSS(E)L , the CSS(E)L ALM CARMC is responsible for assisting the CSS(E)L Board in providing a robust governance and oversight function with respect to cap-ital, liquidity and balance sheet management in relation to CSS(E)L. Its purpose is to:i monitor and challenge the capital and liquidity positions of
CSS(E)L against internal and external regulatory limits;ii monitor and challenge the systems and controls related to
the ALM management framework for CSS(E)L; andiii manage CSS(E)L’s leverage ratio.
p CSS(E)L Operating Committee (‘CSS(E)L OpCo’): The CSS(E)L OpCo is chaired by the Deputy CEO, CSS(E)L and has a remit in relation to CSS(E)L, CSi and CS AG London Branch. In relation to the activities of CSS(E)L, it provides a forum for the effective management of front-to-back issues andtheefficientcommunicationofprioritiestoalldepartmentsof CSS(E)L. It manages both ongoing business activities and also change management activities:
p For ongoing business activities its purpose is to:i communicate strategy / business plans to support
functions;
ii ensure outsourcing activities are managed in line with applicable policies; and
iii ensure good communication between CSS(E)L manage-ment and central function heads and relevant business COO for CSS(E)L activities.
p For change management activities its purpose is to:i ensure that project needs of CSS(E)L are anticipated at an
early stage, are prioritised appropriately against other divi-sion/function priorities, and are reported on accurately; and
ii provide an escalation route for change teams, individual businesses or central function heads to use to resolve pri-oritisation, resource and budget issues (often through onwards escalation to CSS(E)L Executive Committee for matters relating to CSS(E)L).
p CSS(E)L Business Management Committees (‘CSS(E)L BMC’): Divisional CEOs have established management com-mittee structures to undertake the management of divisional operations. Certain of these committees have a key role to play in UK governance, with reporting requirements into the CSS(E)L Executive Committee in relation to the activities of CSS(E)L. The CSS(E)L Executive Committee establishes governancerequirementsappropriateto itsUKspecificremitand agrees with the relevant committee procedures for the ongoing management of, and reporting against, these require-ments. The following divisional committees are responsible for identifying issues relevant to those requirements, for escalation to the CSS(E)L Executive Committee:i Europe, Middle East and Africa (‘EMEA’) Global Markets
Management Committee;ii EMEA Investment Banking & Capital Markets Operating
Committee (‘EMEA IBCM OpCo’);iii Strategic Risk Oversight Board; andiv APAC.
Tier 3 Risk Management Committees are:p The CSS(E)L Credit Risk Committee, chaired by the CSS(E)L
ChiefCreditOfficer, defines and implements theCSS(E)LCredit Risk Framework. It is responsible for reviewing emerg-ing risks and assessing the impact of any issues that impact the CSS(E)L credit portfolio including counterparty, sector and concentration.
p The CSS(E)L Market Risk Committee, chaired by the CSS(E)L HeadofMarketRisk,definesand implements theCSS(E)LMarket Risk Framework. It is responsible for reviewing emerg-ing risks and assessing any issues that impact on the CSS(E)L marketriskprofile.
p The CSS(E)L Operational Risk Management Committee, chaired by the CSS(E)L Head of Operational Risk, provides oversight for operational risk management in the UK entities including reviewandchallengeof theoperational riskprofile,definingandimplementingoperationalriskmitigationstrategiesand supporting the assessment and allocation of operational risk capital.

19Credit Suisse Securities (Europe) Limited, Annual Report 2016
Strategic Report for the year ended 31 December 2016
p The CSS(E)L Stress Test Committee, chaired by the CSS(E)L Head of Enterprise Risk, is responsible for identifying, develop-ing and maintaining appropriate stress scenarios which are relevant for UK entities based on material risk factors.
p The CSS(E)L Reputational Risk Committee, co-chaired by the CSS(E)L CRO, CSS(E)L CCO and Deputy CEO CSS(E)L, is responsible for reviewing and approving transactions that pose a material risk to the company’s reputation and are escalated as having potential to have a negative impact on the CSS(E)L’s reputation.
Risk organisationRisks arise in all of the Company’s business activities and they are monitored and managed through its internal control environment. TheCompany’sriskmanagementorganisationreflectsthespecificnature of the various risks in order to ensure that risks are taken within limits set in a transparent and timely manner.
The Company’s independent risk management function is headed by the Company’s CRO, who reports jointly to the Compa-ny’s CEO and the CRO of CS group. The Company CRO is responsible foroverseeing theCompany’s riskprofileacrossallrisk types and for ensuring that there is an adequate independent risk management function. The Company has strengthened the risk management function to provide a more dedicated focus on the risks at the Company level, in addition to the global risk man-agement processes applied by CS group.
The Risk Management department, as of January 2016, comprises:p Market (Traded and Non Traded) and Liquidity Risk
Management;p Credit Risk Management;p Operational Risk Management;p Enterprise Risk Management; andp Reputational Risk Management.
The Company’s CRO is responsible for providing risk management oversight and establishing an organisational basis to manage all risk management matters through its primary risk functions:p The Market and Liquidity Risk Management (‘MLRM’) depart-
ment is responsible for assessing and monitoring the market and liquidity riskprofilesof theCompanyand recommendscorrective action where necessary;
p Credit Risk Management (‘CRM’) is responsible for approving credit limits, monitoring, and managing individual exposures, and assessing and managing the quality of credit portfolios and allowances;
p Operational Risk Management (‘ORM’) is responsible for the identification,assessmentandmonitoringofoperationalrisks;
p Enterprise Risk Management (‘ERM’) is responsible for cover-ing cross-divisional and cross-functional approaches towards identifyingandmeasuringrisksaswellasdefiningandmanag-ing risk appetite levels; and
p Reputational Risk Management (‘RMR’) is responsible for assessing actions or transactions which may pose a reputa-tional risk to the Company’s reputation as escalated by both the First and Second Lines of Defence, providing independent appraisal and facilitating the calibration of such risks.
These areas form part of a matrix management structure with reporting lines into both the Company CRO and the relevant Global Risk Head. Furthermore, these departments are supported by a global infrastructure and data process which is maintained by the central, Risk and Finance Data and Reporting (‘RFDAR’) group.
Risk limitsA sound system of risk limits is fundamental to effective risk man-agement.The limitsdefineCSS(E)LGroup’s riskappetitegivenmanagement capabilities, the market environment, business strat-egyandfinancial resourcesavailable toabsorbpotential losses.The overall risk limits for the Company are set by the Board of Directors.
Within the bounds of the overall risk appetite of the Company, asdefinedbythelimitssetbytheBoard,theCSS(E)LCROisthenominated executive who is responsible for implementing a limit frameworkwith theaimofensuring that the riskprofile remainswithin the Board’s risk appetite. The Company has a range of more granular limits for individual businesses, concentrations and specificrisks,includinglimitsontransactionsbookedfromremotelocations.
Market risk limit measures are typically based on Value at Risk (‘VaR‘) and scenario analysis, although they also include risk sen-sitivities, notionals and other metrics. Liquidity risk limits include regulatoryandinternalmetricsbasedoncomputingliquidityinflowsandoutflowsunderstressscenariosoverdifferenttimehorizons.Credit risk limits include overall limits on portfolio credit quality and a system of individual counterparty, country, industry, product and scenario limits, which are used to mitigate concentration risks. These risk limits are generally set to ensure that any meaningful increase in riskexposures ispromptly identified, analysedand,where necessary, escalated to more senior levels of management. In addition, the Company has allocated operational risk capital to the businesses and has established thresholds for operational risk losses that trigger additional management action. These thresh-olds are set in both quantitative (considering historical losses and gains) and qualitative (Company-wide statements linked to risk and control indicators) terms.
The majority of these limits are monitored on a daily basis, though those for which the inherent calculation time is longer (such as some credit portfolio limits) are monitored on a weekly or monthly basis.
TheCompany’sfinancialriskmanagementobjectivesandpol-icies and the exposure of the CSS(E)L Group to market risk, credit risk,liquidityriskandcurrencyriskareoutlinedinNote 38–Finan-cial Instruments Risk Position.
Corporate employee policyThe CSS(E)L Group adopts the CS group’s policies which are committed to providing equal opportunities for all employees, irrespective of factors such as race, gender, sexual orientation, gender reassignment, religion or belief, age, marital or family sta-tus, or disability or any other characteristic protected by applica-ble law.
Internal experts work closely with the businesses across all regionstoensurethatthediversityandinclusionstrategyisfirmlyembedded in CSS(E)L’s Group corporate culture. Managers are

20
advised on the planning and implementation of necessary internal structures and measures to ensure CSS(E)L Group can offer an inclusive working environment that is free from discrimination and can take thespecificneedsofclients intoaccount inCSS(E)LGroupproductandserviceoffering. Councilsheadedbyseniorleaders are responsible for ensuring that CSS(E)L Group system-aticallystrivestoachievethetargetsdefinedandappropriatemea-sures are implemented.
The CSS(E)L Group is committed to ensuring it has an appro-priatecorporateculture,reflectingafocusonrisk,ethicsandval-ues. The CSS(E)L Group believes having the right culture will deliveranumberofotherbenefitsincludingtheopportunitytocre-ate a competitive advantage. Leveraging the CS group’s corporate values, the UK Culture Program was set up to articulate the cul-ture aspired to for CS in the UK and also to create the right envi-ronment for those who work here, encouraging individuals to behaveconsistentlyinlinewiththeseaspirations.
In December in anticipation of the global launch of a set of new Conduct and Ethics Standards for the bank in 2017, new gover-nance was implemented in the UK to manage the delivery of our Culture Program and the disciplinary process. As such, the UK Culture Steering Committee and the Disciplinary Review Commit-tee became the UK Conduct and Ethics Board (‘UK CEB’).
The UK CEB has two related purposes:p to establish a clearly articulated and strong corporate culture
across the UK based on the global conduct and ethics stan-dards; and
p to ensure disciplinary decisions for UK employees, and employ-ees outside of the UK who are in the scope of the UK regula-tors, are fair, consistent and meet the expectations of the CS group CEB, the UK CEB and the UK regulators.
With regards to disciplinary decisions the UK CEB:p reviews the outcome of disciplinary cases on a quarterly retro-
spective basis (the “ex-post facto review”) to assess fairness and consistency and meeting both internal and external expectations;
p considers the impact of a disciplinary sanction on compensa-tion, rating and promotion eligibility;
p monitors the conduct and ethics trends in the UK;p implements mitigating measures to ensure disciplinary infrac-
tions are not repeated in alignment with the Divisions/Corpo-rate Functions and escalating concerns to the relevant CEB; and
p collaborates with Divisional/Corporate Functions and any other regional CEBs to ensure the way in which they address mis-conduct for employees in the scope of the UK Legal Entities meets with the expectations of the UK CEB and UK regulators.
The UK CEB is chaired by the Company’s CEO and comprises senior regional representatives from the businesses and Corporate Functions.
The CS group currently supports more than 40 internal employee networks worldwide that serve as a platform for the exchange of knowledge and experience, fostering mutual under-standing and helping to strengthen corporate culture. The net-works within the Company, which are run by employees on a vol-untary basis, and focus on women, families, Lesbian, Gay, Bisexual and Transgender (‘LGBT’) individuals, the older and younger gen-erations and employees from various ethnic backgrounds. The net-works within the Company also support veterans, employees with physical disabilities, mental health issues and employees who have responsibilities of care.
Modern Slavery & Human TraffickingIn its role as an employer, and as a user and provider of services, CS group is committed to human rights and respects them as a key element of responsible business conduct. CS group voluntarily pledged to uphold to international human rights-related agree-ments, including: Equator Principles, Principles for Responsible Investment and UN Global Compact.
A number of internal policies, commitments and controls which are already in place help to eradicate modern slavery and human traffickinginoursupplychainandacrossourbusiness.Inadditionthe CS group Supplier Code of Conduct aims to ensure that our external business partners, including their employees, subsidiaries and subcontractors, respect human rights, labour rights, employ-ment laws and environmental regulations. In 2016 CS introduced a formal Third Party Risk Management (‘TPRM’) framework to scru-tiniseandmonitor theoperational,financialand reputational riskassociated with third party relationships. The TPRM framework provides for structured due diligence assessments of our suppliers toidentifywheremodernslaveryandhumantraffickingrisksmayexist.
The complete statement, made pursuant to section 54, Part 6 of the Modern Slavery Act 2015, is publicly available and can be found at www.credit-suisse.com.
By Order of the Board
Paul E HareCompany Secretary
One Cabot Square London E14 4QJ30 March 2017

21Credit Suisse Securities (Europe) Limited, Annual Report 2016
Directors’ Report for the year ended 31 December 2016
Directors’ Report for the year ended 31 December 2016International Financial Reporting StandardsThe CSS(E)L Group and Company 2016 Financial Statements have been prepared in accordance with International Financial Reporting Standards (‘IFRS’) as adopted for use in the European Union (‘EU’).
The Financial Statements were authorised for issue by the directors on 30 March 2017.
DividendsNo dividends were paid or are proposed for the year ended 31 December 2016 (2015: USD Nil).
DirectorsThe names of the directors as at the date of this report are set out on page 1. Changes in the directorate since 31 December 2015 and up to the date of this report are as follows:Appointment
Stephen Dainton 29 January 2016
David Mathers (CEO) 24 March 2016
Eraj Shirvani 16 June 2016
Robert Arbuthnott 22 July 2016
Robert Endersby 29 September 2016
Resignation
Stephen Dainton 26 January 2017
David Livingstone 04 March 2016
Jason Forrester 25 March 2016
Gael de Boissard 31 December 2015
Richard Thornburgh 31 May 2016
Noneofthedirectorswhoheldofficeattheendofthefinancialyearweredirectlybeneficially interested,atany timeduring theyear, in the shares of the Company. Directors of the Company benefitedfromqualifyingthirdpartyindemnityprovisionsinplaceduringthefinancialyearandatthedateofthisreport.
Statement of Directors’ ResponsibilitiesThe directors are responsible for preparing the Annual Report StrategicReport, theDirectors’Report and thefinancial state-ments in accordance with applicable law and regulations.
Company law requires the directors to prepare CSS(E)L Group andCompanyfinancialstatementsforeachfinancialyear.Underthat law they have elected to prepare both the CSS(E)L Group and Company financial statements in accordance with IFRSs as adopted by the EU and applicable law.
Under company law the directors must not approve the financial statements unless they are satisfied that they give a true and fair view of the state of affairs of the CSS(E)L Group and Company and of their profit or loss for that period. In preparing each of the CSS(E)L Group and Company financial statements, the directors are required to:p select suitable accounting policies and then apply them
consistently;p make judgements and estimates that are reasonable and
prudent;p state whether they have been prepared in accordance with
IFRSs as adopted by the EU; andp prepare the Financial Statements on the going concern basis
unless it is inappropriate to presume that the CSS(E)L Group and the Company will continue in business.
22
The directors are responsible for keeping adequate accounting records that are sufficient to show and explain the CSS(E)LGroup’s and Company’s transactions and disclose with reasonable accuracyatany time thefinancialpositionof theCompanyandenablethemtoensurethatitsfinancialstatementscomplywiththeCompanies Act 2006. They have general responsibility for taking such steps as are reasonably open to them to safeguard the assets of the CSS(E)L Group and Company to prevent and detect fraud and other irregularities.
The directors are responsible for the maintenance and integrity of thecorporateandfinancial information includedonCSS(E)LGroup’s and of the Company’s website. Legislation in the UK gov-erning thepreparationanddisseminationoffinancial statementsmay differ from legislation in other jurisdictions.
Risk and CapitalThe way in which these risks are managed is detailed in the Stra-tegic Report, and the risks are detailed in Note 38 – Financial Instruments Risk Position.
ChangesmadetothecapitalstructurearesetoutinNote 27–Share Capital and Share Premium.
Disclosure of Information to AuditorTheDirectorswhoheldofficeatthedateofapprovalofthisDirec-tors’Reportconfirmthat,sofarastheyareeachaware,thereisno relevant audit information of which CSS(E)L Group’s auditor is
unaware and each Director has taken all the steps that he ought to have taken as a Director to make himself aware of any relevant audit information and to establish that CSS(E)L Group’s auditor is aware of that information.
AuditorPursuant to Section 487 of the Companies Act 2006 the auditor will be deemed to be reappointed and KPMG LLP will therefore continueinoffice.
By Order of the Board
Robert Arbuthnott Director
One Cabot Square London E14 4QJ30 March 2017

23Credit Suisse Securities (Europe) Limited, Annual Report 2016
Independent Auditor’s Report to the Members of Credit Suisse Securities (Europe) Limited
Independent Auditor’s Report to the Members of Credit Suisse Securities (Europe) LimitedWehaveauditedthefinancialstatementsofCreditSuisseSecuri-ties (Europe) Limited (‘CSS(E)L’) for the year ended 31 December 2016setoutonpages24to136.Thefinancialreportingframe-work that has been applied in their preparation is applicable law and International Financial Reporting Standards (IFRSs) as adopted by the EU and, as regards the parent company (‘the Com-pany’)financialstatements,asappliedinaccordancewiththepro-visions of the Companies Act 2006.
This report is made solely to the company’s members, as a body, in accordance with Chapter 3 of Part 16 of the Companies Act 2006. Our audit work has been undertaken so that we might state to the company’s members those matters we are required to state to them in an auditor’s report and for no other purpose. To the fullest extent permitted by law, we do not accept or assume responsibility to anyone other than the company and the compa-ny’s members, as a body, for our audit work, for this report, or for the opinions we have formed.
Respective responsibilities of directors and auditorAs explained more fully in the Directors’ Responsibilities Statement as set out on pages 21 to 22, the directors are responsible for the preparationofthefinancialstatementsandforbeingsatisfiedthatthey give a true and fair view. Our responsibility is to audit, and expressanopinionon,thefinancialstatementsinaccordancewithapplicable law and International Standards on Auditing (UK and Ireland). Those standards require us to comply with the Auditing Practices Board’s Ethical Standards for Auditors.
Scope of the audit of the Financial StatementsAdescription of the scope of an audit of financial statementsis provided on the Financial Reporting Council’s website at https://frc.org.uk/auditscopeukprivate.
Opinion on Financial StatementsIn our opinion:p thefinancialstatementsgiveatrueandfairviewofthestateof
the CSS(E)L Group’s and of the Company’s affairs as at 31 December 2016 and of the CSS(E)L Group’s loss for the year then ended;
p theCSS(E)LGroupfinancial statementshavebeenproperlyprepared in accordance with IFRSs as adopted by the EU
p theCompanyfinancial statementshavebeenproperly pre-pared in accordance with IFRSs as adopted by the EU and as applied in accordance with the provisions of the Companies Act 2006; and
p thefinancial statementshavebeenprepared inaccordancewith the requirements of the Companies Act 2006.
Opinion on other matters prescribed by the Companies Act 2006In our opinion the information given in the Strategic Report and the Directors’Reportforthefinancialyearisconsistentwiththefinan-cial statements.
Based solely on the work required to be undertaken in the courseof theauditof thefinancialstatementsandfromreadingthe Strategic report and the Directors’ report:p wehavenotidentifiedmaterialmisstatementsinthosereports;
andp in our opinion, those reports have been prepared in accor-
dance with the Companies Act 2006.
Matters on which we are required to report by exceptionWe have nothing to report in respect of the following matters where the Companies Act 2006 requires us to report to you if, in our opinion:p adequate accounting records have not been kept by the Com-
pany, or returns adequate for our audit have not been received from branches not visited by us; or
p theCompanyfinancialstatementsarenot inagreementwiththe accounting records and returns; or
p certaindisclosuresofdirectors’remunerationspecifiedbylaware not made; or
p we have not received all the information and explanations we require for our audit.
Dean Rogers(Senior Statutory Auditor)
for and on behalf of KPMG LLP, Statutory AuditorChartered Accountants15 Canada SquareLondonE14 5GL30 March 2017

24
Financial Statements for the year ended 31 December 2016Consolidated Statement of Income for the Year ended 31 December 2016
Reference
to note in
2016 2015 1
Consolidated Statement of Income (USD million)
Continuing Operations
Interest income 4 304 249
Interest expense 4 (470) (471)
Net interest expense (166) (222)
Commission and fee income 5 532 594
Commission and fee expense 5 (64) (56)
Net commission and fee income 468 538
Net gains from financial assets/liabilities at fair value through profit or loss 6 637 575
Other revenues 7 (26) (67)
Net revenues 913 824
Compensation and benefits 8 (546) (878)
General, administrative and trading expenses 9 (453) (497)
Restructuring expenses 10 (10) (54)
Total operating expenses (1,009) (1,429)
Loss before taxes from continuing operations (96) (605)
Income tax (expense)/benefit from continuing operations 11 (5) 42
Loss after taxes from continuing operations (101) (563)
Discontinued Operations
Profit before tax from discontinued operations 25 116 8
Income tax expense from discontinued operations 25 (43) (3)
Profit after taxes from discontinued operations 73 5
Net loss attributable to Credit Suisse Securities (Europe) Limited shareholders (28) (558)
1 2015 numbers have been restated to disclose the impact of discontinued operations. Refer to Note 25 for details.
The notes on pages 33 to 136 form an integral part of the Financial Statements.

25Credit Suisse Securities (Europe) Limited, Annual Report 2016
Financial Statements for the year ended 31 December 2016
Consolidated Statement of Comprehensive Income for the Year ended 31 December 2016
CSS(E)L Group and Company 2016 2015
Consolidated Statement of Comprehensive Income (USD million)
Net loss (28) (558)
Re-measurement of net defined benefit asset 184 (7)
Total items that will not be reclassified to net income 184 (7)
Foreign currency translation differences (17) (40)
Net investment hedge – net gain 10 22
Cash flow hedges – effective portion of changes in fair value – (13)
Cash flow hedges – reclassified to profit or loss 6 46
Total items that may be reclassified to net income (1) 15
Other comprehensive income, net of tax 183 8
Total comprehensive income/(loss) 155 (550)
Attributable to Credit Suisse Securities (Europe) Limited shareholders 155 (550)
Refer to Note 26 Accumulated Other Comprehensive Income for details.
The Company’s loss after tax was USD 28 million for the year ended 31 December 2016 (2015: Loss USD 558 million). As per-mitted by s408 of the Companies Act 2006, no separate income statement is presented in respect of the Company.
The notes on pages 33 to 136 form an integral part of the Financial Statements.

26
Consolidated Statement of Financial Position as at 31 December 2016
Reference
to note end of
2016 2015
Assets (USD million)
Cash and due from banks 3,187 8,874
Interest bearing deposits with banks 8,763 9,700
Securities purchased under resale agreements and securities borrowing transactions 13 11,686 5,143
Trading financial assets at fair value through profit or loss 14 13,880 20,682
ofwhichpositivemarketvaluesfromderivativeinstruments 14 3,345 4,482
Financial assets designated at fair value through profit or loss 15 23,613 28,587
Financial assets available-for-sale 16 33 33
Current tax assets 117 99
Deferred tax assets 12 18 18
Other assets 17 6,213 6,525
Property and equipment 19 7 4
Intangible Assets 20 1 1
Assets held for sale 26 51,435 63,876
Total assets 118,953 143,542
Liabilities (USD million)
Deposits 21 169 160
Securities sold under repurchase agreements and securities lending transactions 13 72 62
Trading financial liabilities at fair value through profit or loss 14 7,537 9,789
ofwhichnegativemarketvaluesfromderivativeinstruments 14 2,964 4,876
Financial liabilities designated at fair value through profit or loss 15 23,810 25,732
Short term borrowings 22 3,667 2,761
Current tax liabilities 1 –
Deferred tax liabilities 12 52 –
Other liabilities 17 18,078 16,141
Provisions 23 6 2
Long term debt 24 24,762 26,419
Liabilities held for sale 25 32,670 54,502
Total liabilities 110,824 135,568
Shareholders’ equity (USD million)
Share capital 27 3,859 3,859
Share premium 27 5,661 5,661
Capital contribution 5,662 5,662
Retained earnings (7,025) (6,997)
Accumulated other comprehensive income 26 (28) (211)
Total shareholders’ equity 8,129 7,974
Total liabilities and shareholders’ equity 118,953 143,542
Approved by the Board of Directors on 30 March 2017 and signed on its behalf by:
Robert ArbuthnottDirector
The notes on pages 33 to 136 form an integral part of the Financial Statements.

27Credit Suisse Securities (Europe) Limited, Annual Report 2016
Financial Statements for the year ended 31 December 2016
Company Statement of Financial Position as at 31 December 2016
Reference
to note end of
2016 2015
Assets (USD million)
Cash and due from banks 3,183 8,870
Interest bearing deposits with banks 8,763 9,700
Securities purchased under resale agreements and securities borrowing transactions 13 11,686 5,143
Trading financial assets at fair value through profit or loss 14 14,433 21,249
ofwhichpositivemarketvaluesfromderivativeinstruments 14 3,898 5,049
Financial assets designated at fair value through profit or loss 15 23,010 27,962
Financial assets available-for-sale 16 33 33
Current tax assets 117 99
Deferred tax assets 12 18 18
Other assets 17 6,189 6,506
Property and equipment 19 7 4
Intangible Assets 20 1 1
Assets held for sale 25 51,435 63,876
Total assets 118,875 143,461
Liabilities (USD million)
Deposits 21 169 160
Securities sold under repurchase agreements and securities lending transactions 13 72 62
Trading financial liabilities at fair value through profit or loss 14 7,505 9,755
ofwhichnegativemarketvaluesfromderivativeinstruments 14 2,932 4,842
Financial liabilities designated at fair value through profit or loss 15 23,798 25,720
Short term borrowings 22 3,667 2,761
Current tax liabilities 1 –
Deferred tax liabilities 12 52 –
Other liabilities 17 18,048 16,110
Provisions 23 6 2
Long term debt 24 24,762 26,419
Liabilities held for sale 25 32,670 54,502
Total liabilities 110,750 135,491
Shareholders’ equity
Share capital 27 3,859 3,859
Share premium 27 5,661 5,661
Capital contribution 5,662 5,662
Retained earnings (7,029) (7,001)
Accumulated other comprehensive income 26 (28) (211)
Total shareholders’ equity 8,125 7,970
Total liabilities and shareholders’ equity 118,875 143,461
Approved by the Board of Directors on 30 March 2017 and signed on its behalf by:
Robert ArbuthnottDirector
The notes on pages 33 to 136 form an integral part of the Financial Statements.
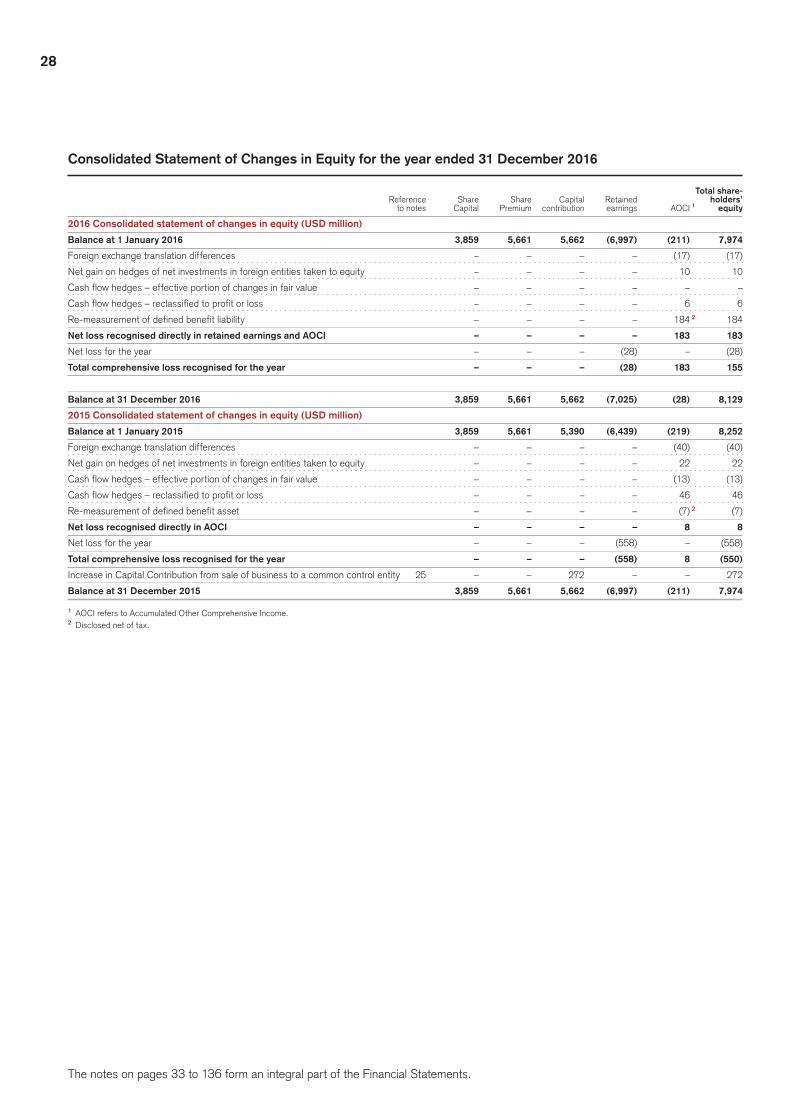
28
Consolidated Statement of Changes in Equity for the year ended 31 December 2016
Total share- Reference Share Share Capital Retained holders’ to notes Capital Premium contribution earnings AOCI 1 equity
2016 Consolidated statement of changes in equity (USD million)
Balance at 1 January 2016 3,859 5,661 5,662 (6,997) (211) 7,974
Foreign exchange translation differences – – – – (17) (17)
Net gain on hedges of net investments in foreign entities taken to equity – – – – 10 10
Cash flow hedges – effective portion of changes in fair value – – – – – –
Cash flow hedges – reclassified to profit or loss – – – – 6 6
Re-measurement of defined benefit liability – – – – 184 2 184
Net loss recognised directly in retained earnings and AOCI – – – – 183 183
Net loss for the year – – – (28) – (28)
Total comprehensive loss recognised for the year – – – (28) 183 155
Balance at 31 December 2016 3,859 5,661 5,662 (7,025) (28) 8,129
2015 Consolidated statement of changes in equity (USD million)
Balance at 1 January 2015 3,859 5,661 5,390 (6,439) (219) 8,252
Foreign exchange translation differences – – – – (40) (40)
Net gain on hedges of net investments in foreign entities taken to equity – – – – 22 22
Cash flow hedges – effective portion of changes in fair value – – – – (13) (13)
Cash flow hedges – reclassified to profit or loss – – – – 46 46
Re-measurement of defined benefit asset – – – – (7) 2 (7)
Net loss recognised directly in AOCI – – – – 8 8
Net loss for the year – – – (558) – (558)
Total comprehensive loss recognised for the year – – – (558) 8 (550)
Increase in Capital Contribution from sale of business to a common control entity 25 – – 272 – – 272
Balance at 31 December 2015 3,859 5,661 5,662 (6,997) (211) 7,974
1 AOCI refers to Accumulated Other Comprehensive Income.2 Disclosed net of tax.
The notes on pages 33 to 136 form an integral part of the Financial Statements.

29Credit Suisse Securities (Europe) Limited, Annual Report 2016
Financial Statements for the year ended 31 December 2016
Company Statement of Changes in Equity for the year ended 31 December 2016
Total share- Reference Share Share Capital Retained holders’ to notes Capital Premium contribution earnings AOCI 1 equity
2016 Company statement of changes in equity (USD million)
Balance at 1 January 2016 3,859 5,661 5,662 (7,001) (211) 7,970
Foreign exchange translation differences – – – – (17) (17)
Net gain on hedges of net investments in foreign entities taken to equity – – – – 10 10
Cash flow hedges – effective portion of changes in fair value – – – – – –
Cash flow hedges – reclassified to profit or loss – – – – 6 6
Re-measurement of defined benefit liability – – – – 184 2 184
Net loss recognised directly in retained earnings and AOCI – – – – 183 183
Net loss for the year – – – (28) – (28)
Total comprehensive loss recognised for the year – – – (28) 183 155
Balance at 31 December 2016 3,859 5,661 5,662 (7,029) (28) 8,125
2015 Company statement of changes in equity (USD million)
Balance at 1 January 2015 3,859 5,661 5,390 (6,443) (219) 8,248
Foreign exchange translation differences – – – – (40) (40)
Net gain on hedges of net investments in foreign entities taken to equity – – – – 22 22
Cash flow hedges – effective portion of changes in fair value – – – – (13) (13)
Cash flow hedges – reclassified to profit or loss – – – – 46 46
Re-measurement of defined benefit asset – – – – (7) 2 (7)
Net loss recognised directly in AOCI – – – – 8 8
Net loss for the year – – – (558) – (558)
Total comprehensive loss recognised for the year – – – (558) 8 (550)
Increase in Capital Contribution from sale of business to a common control entity 25 – – 272 – – 272
Balance at 31 December 2015 3,859 5,661 5,662 (7,001) (211) 7,970
1 AOCI refers to Accumulated Other Comprehensive Income.2 Disclosed net of tax.
The notes on pages 33 to 136 form an integral part of the Financial Statements.

30
Consolidated Statement of Cash Flows for the year ended 31 December 2016
Reference to notes 2016 1 2015 1
Cash flows from operating activities (USD million)
Loss before tax for the period 20 (597)
Adjustments to reconcile net profit to net cash used in operating activities
Non-cash items included in net profit/(loss) before tax and other adjustments:
Impairment, depreciation and amortisation 19,20 3 16
Pension plan charge 28 (83) (33)
Foreign exchange losses / (gains) (1,303) (1,767)
Accrued interest on long term debt 447 442
Share-based payment expense (9) (219)
Cash generated before changes in operating assets and liabilities (925) (2,158)
Net (increase) /decrease in operating assets:
Interest bearing deposits with banks 937 (7,521)
Securities purchased under resale agreements and securities borrowing transactions 13,25 667 8,283
Trading financial assets at fair value through profit or loss 14,25 8,656 18,695
Financial assets designated at fair value through profit or loss 15,25 4,974 12,452
Other assets 3,823 5,113
Net decrease in operating assets 19,057 37,022
Net increase /(decrease) in operating liabilities:
Securities sold under repurchase agreements and securities lending transactions 13,25 (10,978) (14,000)
Deposits 21 9 (1,549)
Short term borrowings 22 906 (3,240)
Trading financial liabilities at fair value through profit or loss 14,25 (4,912) (2,834)
Financial liabilities designated at fair value through profit or loss 15,25 (1,918) (17,830)
Accrued expenses and other liabilities (6,689) (5,132)
Provisions 23 4 –
Net decrease in operating liabilities (23,578) (44,585)
Income taxes paid (31) (26)
Income tax refunded 16 45
Pension plan contribution 28 (11) (10)
Net cash from/(used in) operating activities (5,472) (9,712)
Cash flows from investing activities (USD million)
Proceeds from sale of premises, equipment and intangible assets 19,20 141 162
Capital expenditure for property, equipment and intangible assets 19,20 (151) (162)
Net cash from/(used in) from investing activities (10) –
Cash flows from financing activities (USD million)
Issuance of long term debt (including long term debt at fair
value through profit or loss) 6,308 10,125
Repayment of long term debt (6,513) (13,539)
Increase In Capital Contribution due to sale of business to common control entity 25 – 272
Net cash generated/(provided) by financing activities (205) (3,142)
Net increase in cash and due from banks (5,687) (12,854)
Cash and due from banks at beginning of period 8,874 21,728
Cash and due from banks at end of period 3,187 8,874
Cash and due from banks 1,407 1,624
Demand deposits 1,780 7,250
Cash and due from banks at end of period 3,187 8,874
1 The Group has elected to present a statement of cash flows that analyses all cash flows in total – i.e. including both continuing and discontinued operations; amounts related to discontinued operations are disclosed in Note 25
The notes on pages 33 to 136 form an integral part of the Financial Statements.
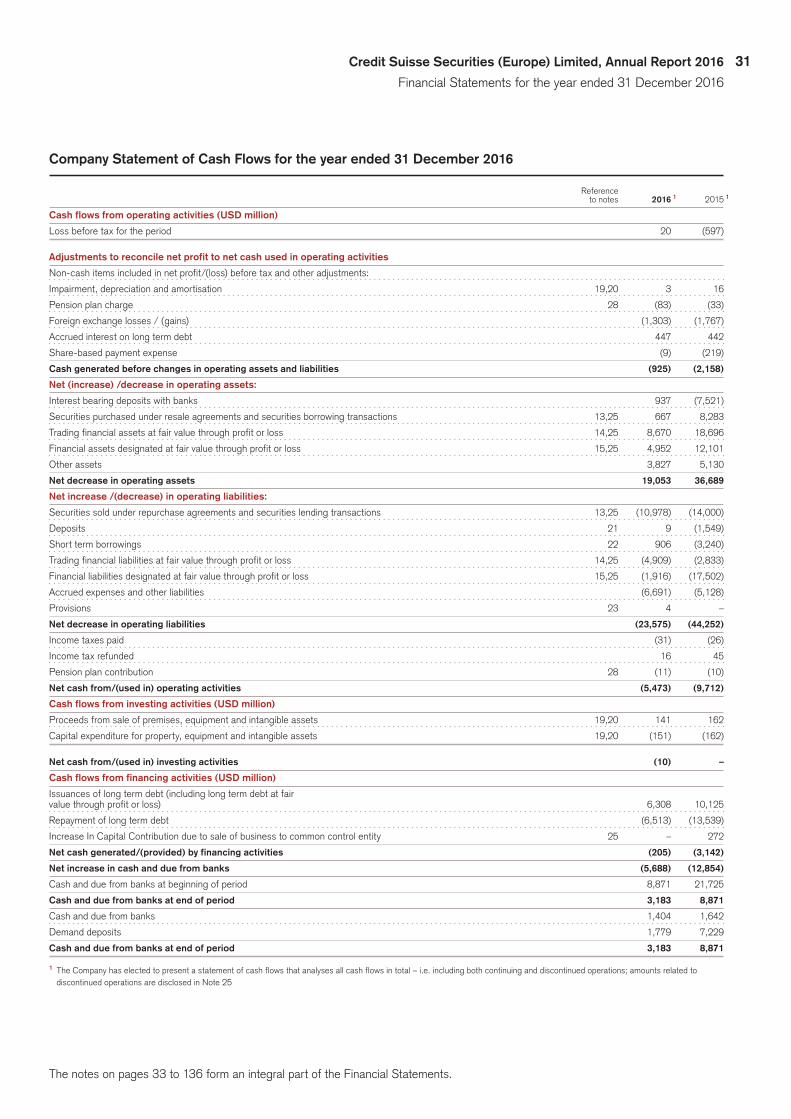
31Credit Suisse Securities (Europe) Limited, Annual Report 2016
Financial Statements for the year ended 31 December 2016
Company Statement of Cash Flows for the year ended 31 December 2016
Reference to notes 2016 1 2015 1
Cash flows from operating activities (USD million)
Loss before tax for the period 20 (597)
Adjustments to reconcile net profit to net cash used in operating activities
Non-cash items included in net profit/(loss) before tax and other adjustments:
Impairment, depreciation and amortisation 19,20 3 16
Pension plan charge 28 (83) (33)
Foreign exchange losses / (gains) (1,303) (1,767)
Accrued interest on long term debt 447 442
Share-based payment expense (9) (219)
Cash generated before changes in operating assets and liabilities (925) (2,158)
Net (increase) /decrease in operating assets:
Interest bearing deposits with banks 937 (7,521)
Securities purchased under resale agreements and securities borrowing transactions 13,25 667 8,283
Trading financial assets at fair value through profit or loss 14,25 8,670 18,696
Financial assets designated at fair value through profit or loss 15,25 4,952 12,101
Other assets 3,827 5,130
Net decrease in operating assets 19,053 36,689
Net increase /(decrease) in operating liabilities:
Securities sold under repurchase agreements and securities lending transactions 13,25 (10,978) (14,000)
Deposits 21 9 (1,549)
Short term borrowings 22 906 (3,240)
Trading financial liabilities at fair value through profit or loss 14,25 (4,909) (2,833)
Financial liabilities designated at fair value through profit or loss 15,25 (1,916) (17,502)
Accrued expenses and other liabilities (6,691) (5,128)
Provisions 23 4 –
Net decrease in operating liabilities (23,575) (44,252)
Income taxes paid (31) (26)
Income tax refunded 16 45
Pension plan contribution 28 (11) (10)
Net cash from/(used in) operating activities (5,473) (9,712)
Cash flows from investing activities (USD million)
Proceeds from sale of premises, equipment and intangible assets 19,20 141 162
Capital expenditure for property, equipment and intangible assets 19,20 (151) (162)
Net cash from/(used in) investing activities (10) –
Cash flows from financing activities (USD million)
Issuances of long term debt (including long term debt at fair
value through profit or loss) 6,308 10,125
Repayment of long term debt (6,513) (13,539)
Increase In Capital Contribution due to sale of business to common control entity 25 – 272
Net cash generated/(provided) by financing activities (205) (3,142)
Net increase in cash and due from banks (5,688) (12,854)
Cash and due from banks at beginning of period 8,871 21,725
Cash and due from banks at end of period 3,183 8,871
Cash and due from banks 1,404 1,642
Demand deposits 1,779 7,229
Cash and due from banks at end of period 3,183 8,871
1 The Company has elected to present a statement of cash flows that analyses all cash flows in total – i.e. including both continuing and discontinued operations; amounts related to discontinued operations are disclosed in Note 25
The notes on pages 33 to 136 form an integral part of the Financial Statements.

32
Notes to the consolidated financial statements
Page Note Description
33 1 General33 2 Significant Accounting Policies43 3 Critical Accounting Estimates and Judgements in Applying Accounting Policies 46 4 Net Interest Expense46 5 Net Commissions and Fee Income47 6 Net Gains from Financial Assets/Liabilities at Fair Value through Profit or Loss 47 7 Other Revenues47 8 Compensation and Benefits48 9 General, Administrative and Trading Expenses48 10 Restructuring Expenses49 11 Income Tax50 12 Deferred Taxes51 13 Securities Borrowed, Lent and Purchased/Sold under Resale/Repurchase Agreements52 14 Trading Financial Assets and Liabilities at Fair Value Through Profit or Loss52 15 Financial Assets and Liabilities Designated at Fair Value through Profit or Loss53 16 Financial Assets Available-For-Sale54 17 Other Assets and Other Liabilities55 18 Brokerage Receivables and Brokerage Payables56 19 Property and Equipment57 20 Intangible Assets57 21 Deposits58 22 Short Term Borrowings58 23 Provisions58 24 Long Term Debt59 25 Discontinued Operations and Assets Held for Sale62 26 Accumulated Other Comprehensive Income 62 27 Share Capital and Share Premium63 28 Retirement Benefit Obligations68 29 Employee Share-based Compensation and Other Compensation Benefits72 30 Related Parties75 31 Employees76 32 Derivatives and Hedging Activities79 33 Guarantees and Commitments81 34 Interests in Other Entities84 35 Financial Instruments113 36 Assets Pledged or Assigned113 37 Derecognition of Financial Assets114 38 Financial Instruments Risk Position127 39 Offsetting of Financial Assets and Financial Liabilities132 40 Capital Adequacy133 41 Country-by-Country Reporting135 42 CSS(E)L’s Subsidiaries and Associates

33Credit Suisse Securities (Europe) Limited, Annual Report 2016
Notes to the Financial Statements for the year ended 31 December 2016
Notes to the Financial Statements for the year ended 31 December 20161 General
Credit Suisse Securities (Europe) Limited is domiciled in the United Kingdom.TheaddressoftheCSS(E)LGroup’sregisteredofficeisOne Cabot Square, London, E14 4QJ. The Consolidated Financial Statements for the year ended 31 December 2016 comprise
Credit Suisse Securities (Europe) Limited and its subsidiaries (including structured entities). The Consolidated Financial State-ments were authorised for issue by the Directors on 30 March 2017.
2 Significant Accounting Policies
a) Statement of complianceBoth the Company Financial Statements and the CSS(E)L Group Financial Statements have been prepared on a going concern basis and approved by the Directors in accordance with Interna-tional Financial Reporting Standards as adopted by the EU (‘Adopted IFRSs’).Onpublishing theparent companyfinancialstatementsheretogetherwiththeCSS(E)LGroupfinancialstate-ments, the Company is taking advantage of the exemption in s408 of the Companies Act 2006 not to present its individual Statement of Income and related notes.
b) Basis of preparationThe Consolidated Financial Statements are presented in United States Dollars (‘USD’) rounded to the nearest million. They are prepared on the historical cost basis except that the following assetsandliabilitiesarestatedattheirfairvalue:derivativefinan-cial instruments, financial instrumentsheld for trading, financialassetsavailable-for-saleandfinancial instrumentsdesignatedbytheCSS(E)LGroupatfairvaluethroughprofitorloss.
The preparation of Financial Statements in conformity with adopted IFRS requires management to make judgements, esti-mates and assumptions that affect the application of policies and reported amounts of assets and liabilities, income and expenses. The estimates and associated assumptions are based on historical experience and various other factors that are believed to be rea-sonable under the circumstances, the results of which form the basis of making the judgements about carrying values of assets and liabilities that are not readily apparent from other sources. Actual results may differ from these estimates. Critical accounting estimates and judgements applied to these Financial Statements aresetoutinNote 3–CriticalAccountingEstimatesandJudge-ments in Applying Accounting Policies.
The estimates and underlying assumptions are reviewed on an ongoing basis. Revisions to accounting estimates are recognised in the period in which the estimate is revised if the revision affects only that period or in the period of revision and future periods if the revision has a significant effect on both current and future periods.
CSGcontinuestoprovideconfirmationthatitwillprovidesuffi-cient funding to the Company to ensure that it maintains a sound financialsituationandisinapositiontomeetitsdebtobligations
for the foreseeable future. Accordingly the Directors have pre-pared these accounts on a going concern basis.
Standards and Interpretations effective in the current period The CSS(E)L Group has adopted the following amendments in the current year: p Annual Improvements to IFRSs 2012-2014 Cycle: In Septem-
ber 2014, the IASB issued ‘Annual Improvements to IFRSs 2012-2014 cycle’ (Improvements to IFRSs 2012-2014). The adoption of the Improvements to IFRSs 2012-2014 on 1 Jan-uary 2016, did not have an impact to the CSS(E)L Group’s financialposition,resultsofoperationorcashflows.
p Amendments to IAS 27: Equity Method in Separate Financial Statements: In August 2014 the IASB issued ‘Equity Method in Separate Financial Statements’ (Amendments to IAS 27). The Amendments reinstate the equity method as an account-ing option for investments in subsidiaries, joint ventures and associates inanentity’s separatefinancial statements.Theadoption of the Amendments to IAS 27 on 1 January 2016, didnothaveanimpacttotheCSS(E)LGroup’sfinancialposi-tion,resultsofoperationorcashflows.
p Disclosure Initiative (Amendments to IAS 1): In December 2014, the IASB issued Amendments to IAS 1 as part of their Disclosure Initiative. The Amendments clarify guidance regard-ingmateriality,notestothefinancialstatementsandthepre-sentation of the Statement of Financial Position and Statement of Profit or Loss and Other Comprehensive income. TheAmendments allow entities to use more judgement when pre-paringandpresentingfinancial statements.As theAmend-ments to IAS 1 impact disclosures only, the adoption on 1 Jan-uary 2016, did not have an impact to the CSS(E)L Group’s financialposition,resultsofoperationorcashflows.
p Investment entities: Applying the Consolidation Exception (Amendments to IFRS 10, IFRS 12 and IAS 28); In December 2014, the IASB issued ‘Investment Entities: Applying the Con-solidation Exception’ (Amendments to IFRS 10, IFRS 12 and IAS 28). The Amendments address issues that have arisen in relation to the exemption from consolidation for investment entities. The adoption of the Amendments to IFRS 10, IFRS 12 and IAS 28 did not have an impact on the CSS(E)L Group’s financialposition,resultsofoperationorcashflows.

34
Standards and Interpretations endorsed by the EU and not yet effectiveThe CSS(E)L Group is not yet required to adopt the following standards and interpretations which are issued by the IASB but not yet effective and have been endorsed by the EU.p IFRS 9 Financial Instruments: In November 2009 the IASB
issued IFRS 9 ‘Financial Instruments’ (IFRS 9) covering the classificationandmeasurementoffinancialassetswhichintro-ducesnewrequirementsforclassifyingandmeasuringfinan-cial assets. In October 2010, the IASB reissued IFRS 9, which incorporatednewrequirementsontheaccountingforfinancialliabilities. In July 2014, the IASB issued IFRS 9 as a complete standard. The standard includes requirements for recognition and measurement, impairment, derecognition and general hedge accounting. The amendments to IFRS 7 resulting from IFRS 9 also require new disclosures as well as the revision of current disclosure requirements.
UnderIFRS9,financialassetswillbeclassifiedonthebasisoftwocriteria:1)thebusinessmodelofhowthefinancialassetsaremanagedand2)thecontractualcashflowcharacteristicsof thefinancialasset. These factorswilldeterminewhetherthe financial assets aremeasured at AmortisedCost, Fairvalue through Other Comprehensive Income or Fair value throughProfit&Loss.Theaccounting forfinancial liabilitiesremainslargelyunchangedexceptforthosefinancialliabilitiesdesignatedatfairvaluethroughprofitorloss,wherethegainsand losses arising from changes in credit risk will be presented inOtherComprehensiveIncomeratherthanprofitorloss.TheCSS(E)LGrouphasnotyetidentifiedanymaterialchangestotheclassificationandmeasurementof financial instrumentshowever this review remains ongoing.
Under IFRS 9, the new impairment requirements will primarily applytofinancialassetsmeasuredatamortisedcostandfairvalue through other comprehensive income as well as certain loan commitments and financial guarantee contracts. Theimpairment requirements will change from an incurred loss model to an expected loss model by incorporating reasonable and supportable forecasts of future economic conditions avail-able at the reporting date.
Ifthecreditriskhasincreasedsignificantlysinceinitialrecogni-tionofthefinancial instrument,theimpairmentmeasurementwill change from 12-month expected credit losses (Stage 1) to lifetime expected credit losses (Stage 2). Therefore impairment will be recognized earlier than is the case under IAS 39 because IFRS 9 requires the recognition of expected credit lossesbeforea losseventoccursand thefinancial asset isdeemedtobecredit-impaired(Stage3).Thedefinitionofcred-it-impaired under IFRS 9 will be similar to the current indicators in IAS 39 of objective evidence of impairment. The assess-mentofasignificantincreaseincreditrisksinceinitialrecogni-tion will be based on different quantitative and qualitative fac-torsthatwillberelevanttotheparticularfinancialinstrumentinscope.
The CSS(E)L Group has established a cross-functional imple-mentation team and governance structure for the project. The CSS(E)L Group has decided on a point-in-time, forward-look-ing approach, incorporating probability of default, loss given
default and exposure at default, as an expected credit loss (“ECL”)methodologyforfinancialinstrumentssubjecttoStage1andStage2.TheIFRS9definitionofdefaultisintendedtobealignedwiththecurrentregulatorydefinitionofdefault.TheCSS(E)L Group is currently in the process of building the ECL models. Once completed this will be followed by a test phase and subsequently a parallel-run. The CSS(E)L Group expects that the new ECL methodology would generally result in increased and more volatile allowance for loan losses. The main impact drivers include:p the requirement to measure lifetime expected credit losses,
if there isasignificant increase incredit risksince initialrecognitiononafinancialinstrument;
p the point of time in the economic cycle at the adoption date because of the new requirement to incorporate reasonable and supportable forward looking information and macro-economic factors; and
p thecreditqualityof thefinancial instruments inscopeatthe adoption date.
IFRS 9 is effective for annual periods beginning on or after 1 January 2018. However certain sections of IFRS 9 relating to financialliabilitiesdesignatedatfairvaluethroughprofitorlosscan be early adopted in isolation. The CSS(E)L Group does not plan to early adopt. Upon adoption the CSS(E)L Group expects an adjustment to be posted to retained earnings for any changes in impairment losses. As the implementation pro-gresses, the CSS(E)L Group will continue evaluating the extent of the impact of adopting IFRS 9, however it is not prac-tical todisclose reliable financial impactestimatesuntil theimplementation programme is further advanced. Impacts are expected tobedisclosed in thefinancial statements for theyear ended 31 December 2017.
p IFRS 15 Revenue from Contracts with Customers: In May 2014, the IASB issued ‘Revenue from Contracts with Custom-ers’ (IFRS 15). IFRS 15 establishes a single, comprehensive framework for revenue recognition. The core principle of IFRS 15 is that an entity will recognise revenue to depict the transfer of promised goods or services to customers in an amount that reflects theconsideration towhich theentityexpects tobeentitled in exchange for those goods or services. IFRS 15 also includesdisclosure requirements toenableusersoffinancialstatements to understand the nature, amount, timing and uncertaintyofrevenueandcashflowsarisingfromcontractswithcustomers.InApril2016,theIASBissuedClarificationstoIFRS15‘RevenuefromContractswithCustomers’(Clarifica-tions to IFRS 15), which is yet to be endorsed by the EU. The ClarificationstoIFRS15areintendedtoaddressimplementa-tion questions that were discussed by the Joint Transition Resource Group for Revenue Recognition on licenses of intel-lectual property, identifying performance obligations, principal versus agent application guidance and transition. IFRS 15 is effective for annual reporting periods beginning on or after 1 January 2018. The CSS(E)L Group has established a cross-functional implementation team and governance struc-ture for the project. The CSS(E)L Group’s implementation effortsincludetheidentificationofrevenuewithinthescopeofthe guidance, as well as the evaluation of revenue contracts

35Credit Suisse Securities (Europe) Limited, Annual Report 2016
Notes to the Financial Statements for the year ended 31 December 2016
under the new guidance. The guidance does not apply to reve-nueassociatedwithfinancialinstruments,includingloansandsecurities that are accounted for under other IFRSs. The CSS(E)LGrouphasnotyetidentifiedanymaterialchangesinthe timing and amount of revenue recognition however this evaluation remains ongoing.
Standards and Interpretations not endorsed by the EU and not yet effectiveThe CSS(E)L Group is not yet required to adopt the following standards and interpretations which are issued by the IASB but not yet effective and have not yet been endorsed by the EU.p IFRS 16 Leases: In January 2016 the IASB issued IFRS 16
‘Leases’ (IFRS 16) which sets out the principles for the recog-nition, measurement, presentation and disclosure of leases for both lessees and lessors. IFRS 16 includes disclosure require-ments to provide more information about the amount, timing and uncertainty of cash flows arising from leases. Lessoraccounting is substantially unchanged compared to the current accounting guidance. Under the current lessee accounting model the CSS(E)L Group is required to distinguish between finance leases,whichare recognisedonbalancesheet,andoperating leases, which are not. IFRS 16 will require lessees to present a right-of-use asset and a corresponding lease lia-bility on the balance sheet for all leases with a lease term of greater than twelve months, unless the underlying asset is of low value. IFRS 16 is effective for annual periods beginning on or after 1 January 2019. The CSS(E)L Group has established a cross-functional implementation team and governance structure for the project. The CSS(E)L Group is currently reviewing its existing contracts to determine the impact of the adoption of IFRS 16. The CSS(E)L Group expects an increase in total assets and total liabili-ties as a result of recognising right-of use-assets and lease liabili-ties for all leases under the new guidance and is currently evaluat-ing the extent of the impact of the adoption of IFRS 16 on the CSS(E)L Group’s results of operations and cash flows.
p Amendments to IAS 12: Income Taxes: In January 2016, the IASB issued ‘Recognition of Deferred Tax Assets for Unreal-ised Losses’ (Amendments to IAS 12). The Amendments clar-ify how to account for deferred tax assets related to debt instruments measured at fair value. The adoption of the Amend-ments to IAS 12 on 1 January 2017, will not have a material impact to the CSS(E)L Group’s financial position, results of operation or cash flows.
p Disclosure Initiative (Amendments to IAS 7): In January 2016, the IASB issued amendments to IAS 7 as part of their Disclo-sure Initiative. The Amendments require enhanced statement ofcashflowdisclosuresregardingchangesinliabilitiesarisingfromfinancingactivities, includingchanges fromcashflowsand non-cash changes. As the Amendments to IAS 7 impact disclosures only, the adoption on 1 January 2017 will not have animpacttotheCSS(E)LGroup’sfinancialposition,resultsofoperationorcashflows.
p Amendments to IFRS 2: Share-based Payment: In June 2016, the IASB issued narrow scope amendments to IFRS 2 Share-based payments (Amendments to IFRS 2). The Amendments
clarify how to account for certain types of share-based pay-ment transactions. The Amendments to IFRS 2 are effective for annual periods beginning on or after 1 January 2018, with early application permitted. The CSS(E)L Group is currently evaluating the impact of adopting the Amendments to IFRS 2.
p IFRIC 22: In December 2016, the IASB issued IFRIC 22 “For-eign Currency Transactions and Advance Consideration” (IFRIC22). IFRIC22clarifiesthedateof thetransactionforthe purposes of determining the exchange rate used on initial recognition of related asset, expense or income, when an entity has received or paid advance consideration in a foreign currency. IFRIC 22 is effective for annual periods beginning on or after 1 January 2018. The CSS(E)L Group is currently eval-uating the impact of adopting IFRIC 22.
p Annual Improvements to IFRSs 2014-2016 Cycle: In Decem-ber 2016, the IASB issued ‘Annual Improvements to IFRSs 2014-2016 cycle’ (Improvements to IFRSs 2014-2016). The Improvements to IFRSs 2014-2016 are effective for annual periods beginning on or after 1 January 2017. The CSS(E)L Group is currently evaluating the impact of adopting the Improvements to IFRSs 2014-2016.
The accounting policies have been applied consistently by the CSS(E)LGroupentities.Certainreclassificationshavebeenmadeto the prior year Consolidated Financial Statements of the CSS(E)L Group to conform to the current year’s presentation and had no impact on net income/ (loss) or total shareholders’ equity.
c) Basis of consolidationTheconsolidatedfinancialstatementsincludetheresultsandposi-tions of the CSS(E)L Group and its subsidiaries (which includes consolidated structured entities). Subsidiaries are entities con-trolled by the CSS(E)L Group. The CSS(E)L Group controls an entity when it is exposed to, or has rights to, variable returns from its involvement with the entity and has the ability to affect those returns through its power over the entity. When the CSS(E)L Group has decision making rights, it assesses whether it controls an entity and determines whether it is a principal or an agent. The CSS(E)L Group also determines whether another entity with deci-sion-making rights is acting as an agent for the CSS(E)L Group. An agent is a party primarily engaged to act on behalf and for the benefitofanotherparty(theprincipal)andthereforedoesnotcon-trol the entity when it exercises its decision-making authority. A decision maker considers the overall relationship between itself and other parties involved with the entity, in particular all of the factors below, in determining whether it is an agent:p The scope of its decision making authority over the entity;p The rights held by other parties;p The remuneration to which it is entitled; andp The decision maker’s exposure to variability of returns from
other interests that it holds in the entity.
TheCSS(E)LGroupmakessignificant judgementsandassump-tions when determining if it has control of another entity. The CSS(E)L Group may control an entity even though it holds less than half of the voting rights of that entity, for example if the

36
CSS(E)L Group has control over an entity on a de facto basis because the remaining voting rights are widely dispersed and/or there is no indication that other shareholders exercise their votes collectively. Conversely, the CSS(E)L Group may not control an entity even though it holds more than half of the voting rights of that entity, for example where the CSS(E)L Group holds more than half of the voting power of an entity but does not control it, as it has no right to variable returns from the entity and is not able to useitspowerovertheentitytoaffectthosereturns.Thefinancialstatementsofsubsidiariesareincludedintheconsolidatedfinan-cial statements from the date which control commences until the date on which control ceases. The CSS(E)L Group reassesses consolidation status on at least a quarterly basis.
The effects of intra-group transactions and balances, and any unrealised income and expenses arising from such transactions havebeeneliminatedinpreparingtheconsolidatedfinancialstate-ments. Unrealised gains arising from transactions with equity-ac-counted investees are eliminated against the investment to the extent of the CSS(E)L Group’s interest in the investee. Unrealised losses are eliminated in the same way as unrealised gains, but only to the extent that there is no evidence of impairment.
CSS(E)L Group accounts for a combination of entities or busi-nesses under common control at book value. If the consideration transferred in such a transaction is higher than the carrying amount of the net assets received and CSS(E)L Group is the acquirer in the transaction, the difference is recorded as a reduction in retained earnings. If CSS(E)L Group is the seller in the transac-tion, the difference is recorded as an increase in Capital Contribu-tion. If the consideration transferred in such a transaction is lower than the carrying amount of the net assets received and CSS(E)L Group is the acquirer in the transaction, the difference is recorded as an increase in Capital Contribution. If CSS(E)L Group is the seller in the transaction, the difference is recorded as a reduction in retained earnings. No goodwill or gain or loss is recorded in such a transaction.
d) Equity method investmentsThe CSS(E)L Group’s interest(s) in an associate(s) is/are accounted for using the equity method. Associates are entities in whichtheCSS(E)LGrouphassignificantinfluence,butnotcontrol(orjointcontrol),overtheoperatingandfinancialmanagementpol-icy decisions. This is generally demonstrated by the CSS(E)L Group holding in excess of 20%, but no more than 50%, of the votingrights.TheCSS(E)LGroupmakessignificant judgementsandassumptionswhendetermining if ithassignificant influenceoveranotherentity.TheCSS(E)LGroupmayhavesignificantinflu-ence with regards to an entity even though it holds less than 20% of the voting rights of that entity, for example, if the CSS(E)L Grouphasthepowertoparticipateinthefinancialandoperatingdecisions by sitting on the Board. Conversely, the CSS(E)L Group maynothavesignificantinfluencewhenitholdsmorethan20%ofthe voting rights of that entity as it does not have the power to par-ticipateinthefinancialandoperatingdecisionsofanentity.
Equity method investments are initially recorded at cost and increased (or decreased) each year by the CSS(E)L Group’s share of the post-acquisition net income (or loss), or other movements
reflecteddirectly in theequityof theequitymethod investment,until the date on which significant influence (or joint control)ceases.
e) Foreign currencyThe Company’s functional currency is United States Dollars (‘USD’). Transactions denominated in currencies other than the functional currency of the reporting entity are translated at the for-eign exchange rate ruling at the date of the transaction. Monetary assets and liabilities denominated in foreign currencies at the reporting date are translated to USD at the foreign exchange rate ruling at that date. Foreign exchange differences arising from translation are recognised in the Consolidated Statement of Income. Non-monetary assets and liabilities denominated in for-eign currencies at the reporting date are not revalued for move-ments in foreign exchange rates.
Assets and liabilities of CSS(E)L Group companies with func-tional currencies other than USD are translated to USD at foreign exchange rates ruling at the Statement of Financial Position date. The revenue and expenses of these CSS(E)L Group companies are translated to USD at the average foreign exchange rates for the year. The resulting translation differences are recognised directly in a separate component of equity. On disposal, these translationdifferencesarereclassifiedtotheConsolidatedState-ment of Income as part of gain or loss on disposal.
f) Cash and due from Banks For the purpose of preparation and presentation of the Consoli-dated Statement of Cash Flows, cash and cash equivalents com-prise the components of cash and due from banks that are short term, highly liquid instruments with original maturities of three monthsorlesswhicharesubjecttoaninsignificantriskofchangesin their fair value and that are held or utilised for the purpose of cash management.
Where cash is received or deposited as collateral, the obliga-tion to repay or the right to receive that collateral is recorded in ‘Other assets’ or ‘Other liabilities’.
The CSS(E)L Group collects and remits cash between its cli-ents and various Central Counterparty Clearing Houses (‘CCPs’), Brokers and Deposit Banks. Where the CSS(E)L Group obtains benefitsfromorcontrolsthecashfromitsclients,thecashisanasset of the CSS(E)L Group and is included within cash and due from banks on the Consolidated Statement of Financial Position and the corresponding liability is included in ‘Other liabilities’. Where the CSS(E)L Group has contractually agreed with the client that:p The CSS(E)L Group will pass through to the client all interest
paid by the CCP, Broker or Deposit Bank on cash deposits;p The CSS(E)L Group is not permitted to transform cash bal-
ances into other assets; andp The CSS(E)L Group does not guarantee and is not liable to the
client for the performance of the CCP, Broker or Deposit Bank.Then cash collected from clients and remitted to the CCP, Broker orDepositBankisnotreflectedontheCSS(E)LGroup’sConsoli-dated Statement of Financial Position. Examples include initial margin where the CSS(E)L Group acts as Broker in an agency

37Credit Suisse Securities (Europe) Limited, Annual Report 2016
Notes to the Financial Statements for the year ended 31 December 2016
capacity and cash designated as client money under the Client Assets (‘CASS’) client money rules of the UK’s Financial Conduct Authority (‘FCA’).
g) Interest income and expenseInterest income and expense includes interest income and expense ontheCSS(E)LGroup’sfinancialinstrumentsownedandfinancialinstruments sold not yet purchased, short-term and long-term bor-rowings, reverse repurchase and repurchase agreements and securities borrowed and securities lending transactions. Interest income and expense does not include interest flows on the CSS(E)L Group’s trading derivatives (except for hedging relationships) and certain financial instruments classified as at fair value throughprofitorlosswhichareincludedin‘Netgainsfromfinancialassets/liabilitiesat fairvalue throughprofitor loss’. Interest incomeandexpense is accrued, and any related net deferred premiums, dis-counts, origination fees or costs are amortised as an adjustment to the yield over the life of the related asset or liability.
h) Commissions and fees Fee and commission revenue is recognised from a diverse range of services provided to its customers and is accounted for as follows:p Incomeearnedon theexecutionof a significantact is rec-
ognised as revenue when the act is completed (these include brokerage activities as well as fees arising from negotiating, or participating in the negotiation of, a transaction for a third party, such as revenues from underwriting and fees from mergersandacquisitionsandothercorporatefinanceadvisoryservices);
p Income earned from the provision of services is recognised as revenue as the services are provided (for example, portfolio management, granting of loan commitments where it is not probable that theCSS(E)LGroupwill enter into a specificlending arrangement, customer trading and custody services);
p Income which forms an integral part of the effective interest rateofafinancialinstrumentisrecognisedasanadjustmenttothe effective interest rate (for example, certain loan commit-ment fees where it is probable that the CSS(E)L Group will enterintoaspecificlendingagreement)andrecordedin‘Inter-est income’; and
p Performance-linked fees or fee components are recognised whentherecognitioncriteriaarefulfilled.
Incremental costs that are directly attributable to securing invest-ment management contracts may be deferred to match the reve-nue recognised in relation to that transaction. These costs are recognised as and when the CSS(E)L Group recognises the related revenue.
i) Income taxIncome tax recognised in the Consolidated Statement of Income and the Statement of Other Comprehensive Income for the year comprises current and deferred taxes. Income tax is recognised in the Consolidated Statement of Income unless it relates to items recognised in the Statement of Other Comprehensive Income or directly in equity, in which case the income tax is recognised in the
Statement of Other Comprehensive Income or directly in equity respectively. For items initially recognised in equity and subse-quently recognised in the Consolidated Statement of Income, the related income tax initially recognised in equity is also subse-quently recognised in the Consolidated Statement of Income.
Current tax is the expected tax payable on the taxable income for the year and includes any adjustment to tax payable in respect of previous years. Current tax is calculated using tax rates enacted or substantively enacted at the reporting date. Withholding taxes are also treated as income taxes.
For UK corporation tax purposes CSS(E)L Group may surren-der or claim certain losses from another UK group company. The surrendering company will be compensated in full for the value of the tax losses surrendered to the claimant company. The surren-deringentitywill showabenefit received for the lossessurren-dered which will be recorded as a reduction to current tax expense and taxes payable whereas the claimant entity will have an increase in current tax expense and taxes payable respectively.
Deferred tax is provided using the Statement of Financial Posi-tion liability method, providing for temporary differences between thecarryingamountsofassetsandliabilitiesforfinancialreportingpurposes and their tax-base. The amount of deferred tax provided is based on the amount at which it is expected to recover or settle the carrying amount of assets and liabilities on the Consolidated Statement of Financial Position, using tax rates that are expected to be applied to the temporary differences when they reverse, based on the laws that have been enacted or substantively enacted at the Consolidated Statement of Financial Position date.
Deferred tax is not recognised for the following temporary dif-ferences: the initial recognition of assets or liabilities in a transac-tion that is not a business combination and that affects neither accountingnor taxableprofitor lossanddifferences relating toinvestments in subsidiaries and jointly controlled entities to the extent that it is probable that they will not reverse in the foresee-able future. In addition, deferred tax is not recognised for taxable temporary differences arising on the initial recognition of goodwill.
A deferred tax asset is recognised only to the extent that it is probablethatfuturetaxableprofitswillbeavailableagainstwhichthe asset can be utilised. Deferred tax assets are reduced to the extentthatitisnolongerprobablethattherelatedtaxbenefitwillbe realised. Tax assets and liabilities of the same type (current or deferred) are offset when they arise from the same tax reporting group, they relate to the same tax authority, the legal right to offset exists, and they are intended to be settled net or realised simultaneously.
Additional income taxes that may arise from the distribution of dividends are recognised at the same time as the liability to pay the related dividend arises. Information as to the calculation of income tax recognised in the Consolidated Statement of Income for the periodspresentedisincludedinNote 11–IncomeTax.
Tax contingencies Significant judgement isrequiredindeterminingtheeffectivetaxrate and in evaluating certain tax positions. The CSS(E)L Group may accrue for tax contingencies on a best estimate basis. Tax contingency accruals are adjusted due to changing facts and cir-cumstances, such as case law, progress of tax authority audits or
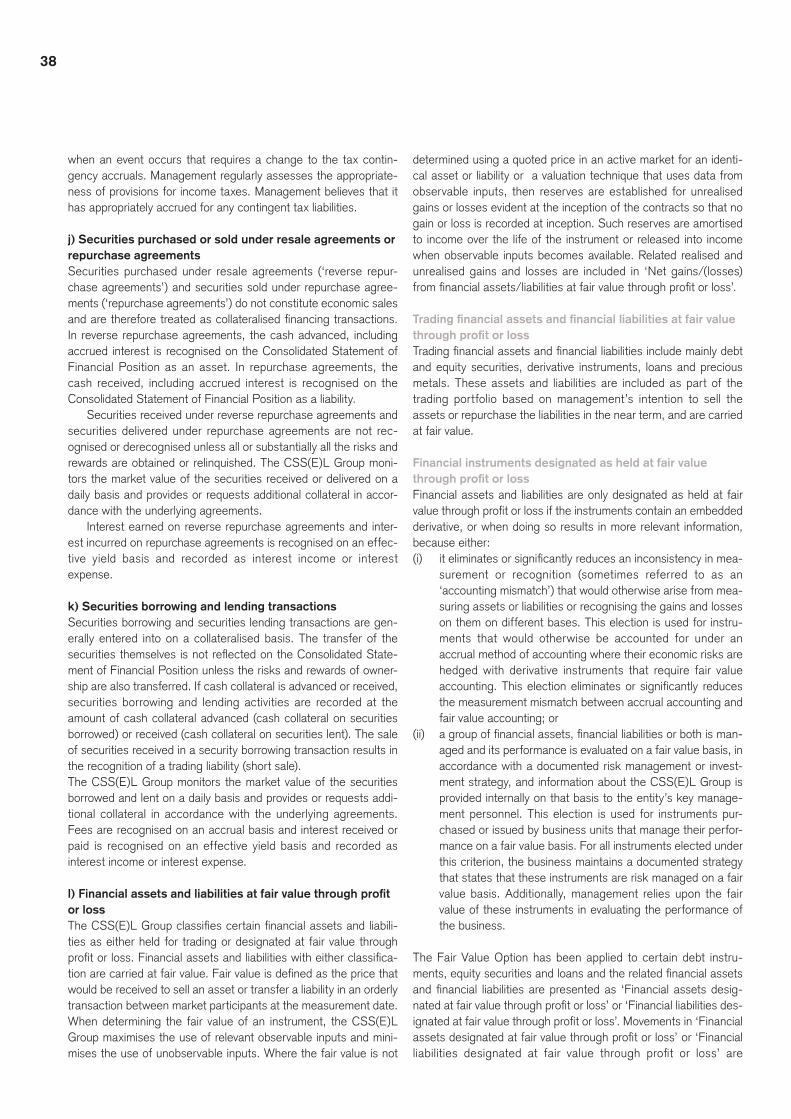
38
when an event occurs that requires a change to the tax contin-gency accruals. Management regularly assesses the appropriate-ness of provisions for income taxes. Management believes that it has appropriately accrued for any contingent tax liabilities.
j) Securities purchased or sold under resale agreements or repurchase agreementsSecurities purchased under resale agreements (‘reverse repur-chase agreements’) and securities sold under repurchase agree-ments (‘repurchase agreements’) do not constitute economic sales andarethereforetreatedascollateralisedfinancingtransactions.In reverse repurchase agreements, the cash advanced, including accrued interest is recognised on the Consolidated Statement of Financial Position as an asset. In repurchase agreements, the cash received, including accrued interest is recognised on the Consolidated Statement of Financial Position as a liability.
Securities received under reverse repurchase agreements and securities delivered under repurchase agreements are not rec-ognised or derecognised unless all or substantially all the risks and rewards are obtained or relinquished. The CSS(E)L Group moni-tors the market value of the securities received or delivered on a daily basis and provides or requests additional collateral in accor-dance with the underlying agreements.
Interest earned on reverse repurchase agreements and inter-est incurred on repurchase agreements is recognised on an effec-tive yield basis and recorded as interest income or interest expense.
k) Securities borrowing and lending transactionsSecurities borrowing and securities lending transactions are gen-erally entered into on a collateralised basis. The transfer of the securitiesthemselvesisnotreflectedontheConsolidatedState-ment of Financial Position unless the risks and rewards of owner-ship are also transferred. If cash collateral is advanced or received, securities borrowing and lending activities are recorded at the amount of cash collateral advanced (cash collateral on securities borrowed) or received (cash collateral on securities lent). The sale of securities received in a security borrowing transaction results in the recognition of a trading liability (short sale).The CSS(E)L Group monitors the market value of the securities borrowed and lent on a daily basis and provides or requests addi-tional collateral in accordance with the underlying agreements. Fees are recognised on an accrual basis and interest received or paid is recognised on an effective yield basis and recorded as interest income or interest expense.
l) Financial assets and liabilities at fair value through profit or lossTheCSS(E)LGroupclassifiescertainfinancialassetsandliabili-ties as either held for trading or designated at fair value through profitorloss.Financialassetsandliabilitieswitheitherclassifica-tionarecarriedatfairvalue.Fairvalueisdefinedasthepricethatwould be received to sell an asset or transfer a liability in an orderly transaction between market participants at the measurement date. When determining the fair value of an instrument, the CSS(E)L Group maximises the use of relevant observable inputs and mini-mises the use of unobservable inputs. Where the fair value is not
determined using a quoted price in an active market for an identi-cal asset or liability or a valuation technique that uses data from observable inputs, then reserves are established for unrealised gains or losses evident at the inception of the contracts so that no gain or loss is recorded at inception. Such reserves are amortised to income over the life of the instrument or released into income when observable inputs becomes available. Related realised and unrealised gains and losses are included in ‘Net gains/(losses) fromfinancialassets/liabilitiesatfairvaluethroughprofitorloss’.
Trading financial assets and financial liabilities at fair value through profit or lossTradingfinancialassetsandfinancialliabilitiesincludemainlydebtand equity securities, derivative instruments, loans and precious metals. These assets and liabilities are included as part of the trading portfolio based on management’s intention to sell the assets or repurchase the liabilities in the near term, and are carried at fair value.
Financial instruments designated as held at fair value through profit or lossFinancial assets and liabilities are only designated as held at fair valuethroughprofitorlossiftheinstrumentscontainanembeddedderivative, or when doing so results in more relevant information, because either:(i) iteliminatesorsignificantlyreducesaninconsistencyinmea-
surement or recognition (sometimes referred to as an ‘accounting mismatch’) that would otherwise arise from mea-suring assets or liabilities or recognising the gains and losses on them on different bases. This election is used for instru-ments that would otherwise be accounted for under an accrual method of accounting where their economic risks are hedged with derivative instruments that require fair value accounting.Thiselectioneliminatesorsignificantly reducesthe measurement mismatch between accrual accounting and fair value accounting; or
(ii) agroupoffinancialassets,financialliabilitiesorbothisman-aged and its performance is evaluated on a fair value basis, in accordance with a documented risk management or invest-ment strategy, and information about the CSS(E)L Group is provided internally on that basis to the entity’s key manage-ment personnel. This election is used for instruments pur-chased or issued by business units that manage their perfor-mance on a fair value basis. For all instruments elected under this criterion, the business maintains a documented strategy that states that these instruments are risk managed on a fair value basis. Additionally, management relies upon the fair value of these instruments in evaluating the performance of the business.
The Fair Value Option has been applied to certain debt instru-ments,equitysecuritiesandloansandtherelatedfinancialassetsandfinancial liabilitiesarepresentedas ‘Financialassetsdesig-natedatfairvaluethroughprofitorloss’or‘Financialliabilitiesdes-ignatedatfairvaluethroughprofitorloss’.Movementsin‘Financialassetsdesignatedatfairvaluethroughprofitorloss’or‘Financialliabilities designated at fair value through profit or loss’ are

39Credit Suisse Securities (Europe) Limited, Annual Report 2016
Notes to the Financial Statements for the year ended 31 December 2016
recognisedin‘Netgains/(losses)fromfinancialassets/liabilitiesatfairvaluethroughprofitor loss’.Oncedesignatedthiselectionisirrevocable.
Financial assets available for saleFinancialassetsthatarenotclassifiedatfairvaluethroughprofitorloss, as loans and receivables or as held-to-maturity investments are classified as available-for-sale. Certain marketable equitysecuritiesareclassifiedasavailable-for-sale.
Equity securities available for saleEquity securitiesclassifiedasavailable for saleare initially rec-ognised at fair value plus transaction costs that are directly attrib-utable to the acquisition of the securities. Securities available-for-sale are carried at fair value with the changes in fair value reported in AOCI until such investments are sold or impaired. For equity securities available-for-sale, the gain or loss is recognised in AOCI including any related foreign exchange component. Gains and losses recorded in AOCI are transferred to the Consolidated State-ment of Income on disposal of assets available-for-sale and pre-sented as other revenues. Generally, the weighted average cost method is used to determine the gain or loss on disposals. Divi-dendincomeonavailable-for-salefinancialassetsispresentedinnet interest income.The CSS(E)L Group assesses at each Consolidated Statement of Financial Position date whether there is objective evidence that an asset or group of assets available-for-sale is impaired. In the case of equity securities available-for-sale, objective evidence would includeasignificantorprolongeddecline in the fair valueof theinvestment below cost that is if the fair value has been below cost for more than six months or by more than 20%. Where there is evidence of impairment, the cumulative unrealised loss previously recognised in AOCI within equity is transferred to the Consolidated Statement of Income for the period and reported in other reve-nues. This amount is determined as the difference between the acquisition cost (net of any principal repayments and amortisation) and current fair value of the asset less any impairment loss on that investment previously recognised in the Consolidated Statement of Income. Impairment losses on equity securities available-for-sale are not reversed; increases in their fair value after impairment are recognised in AOCI.
m) Property and equipmentProperty and equipment are stated at historical cost less accumu-lated depreciation and accumulated impairment losses. Historical cost includes expenditure that is directly attributable to the acquisi-tion of the items.
Subsequent costs are included in the asset’s carrying amount or are recognised as a separate asset, as appropriate, only when it isprobablethatfutureeconomicbenefitsassociatedwiththeitemwillflowtotheCSS(E)LGroupandthecostof the itemcanbereliably measured. All other repairs and maintenance are charged to the Consolidated Statement of Income during the financialperiod in which they are incurred.
Depreciation on assets is calculated using the straight-line method to allocate their cost to their residual values over their maximum useful lives, as follows:
Long leasehold buildings 67 years
lower of lease term or useful life, Leasehold improvements generally not exceeding 10 years
Computer equipment 2 – 7 years
Office equipment 5 years
The carrying amounts of property and equipment are reviewed at each reporting date to determine whether there is any indication of impairment. An impairment charge is recorded in the Consolidated Statement of Income to the extent the recoverable amount, which is the higher of fair value less costs to sell and value in use, is less than its carrying amount. Value in use is the present value of the futurecashflowsexpectedtobederivedfromtheasset.Aftertherecognition of impairment, the depreciation charge is adjusted in futureperiodstoreflecttheasset’srevisedcarryingamount.Thecarrying amount of an asset for which an impairment loss has been recognised in prior years shall be increased to its recoverable amount only in the event of a change in estimate in the asset’s recoverable amount.
Gains and losses on disposals are determined by comparing proceeds with the carrying amount. These are included in the ‘General, Administrative and Trading expenses’ in the Consolidated Statement of Income.
n) Intangible AssetsIntangible assets consist primarily of internally developed software. Expenditure on internally developed software is recognised as an asset when the CSS(E)L Group is able to demonstrate its intention and ability to complete the development and use the software in a mannerthatwillgeneratefutureeconomicbenefits,andcanreli-ably measure the costs to complete the development. The capital-ised costs of internally developed software include all costs directly attributable to developing the software. Internally developed software that is capitalised is depreciated on a straight-line basis over a maximum useful life of seven years. The amortisation of the intangible assets is included in the ‘Gen-eral, Administrative and Trading expenses’ in the Consolidated Statement of Income. The carrying amounts of the CSS(E)L Group’s intangible assets are reviewed at each reporting date to determine whether there is any indication of impairment. If any such indication exists, then the asset’s recoverable amount is estimated. The recoverable amount of an asset is the greater of its value in use and its fair value less costs to sell. In assessing value inuse,theestimatedfuturecashflowsarediscountedtotheirpresentvalueusingapre-taxdiscountratethatreflectscur-rent market assessments of the time value of money and the risksspecifictotheasset.Animpairmentlossisrecognisedifthecarrying amount of an asset exceeds its estimated recoverable amount. Impairment losses are recognised in Consolidated Statement of Income.

40
o) DepositsDeposits include overdrawn bank accounts. Deposits are initially recognised at fair value and subsequently recognised at amortised cost, which represents the nominal values of the deposits less any unearned discounts or nominal value plus any unamortised premiums.
p) ProvisionsProvisions are recognised for present obligations as a result of past events which can be reliably measured, where it is probable thatanoutflowofresourcesembodyingeconomicbenefitswillberequired to settle the obligations. The amount recognised as a pro-vision is the best estimate of the consideration required to settle the present obligation as of the Consolidated Statement of Finan-cial Position date, taking into account the risks and uncertainties surrounding the obligation. The expense recognised when provi-sions are established is recorded in ‘General, Administrative and Trading expenses’ on the Consolidated Statement of Income.
q) Long term debtDebt issued by the CSS(E)L Group is initially measured at fair value, which is the fair value of the consideration received, net of transaction costs incurred. Subsequent measurement is at amor-tised cost, using the effective interest method to amortise cost at inception to the redemption value over the life of the debt. CSS(E)L Group’s long-term debt also includes instruments with embedded derivative features which are substantially all accounted for at fair value.
r) Disposal Groups and Discontinued OperationsAdisposalgroupcomprisingassetsand liabilities isclassifiedasheld for sale if it is highly probable that it will be recovered primarily through sale rather than through continuing use.
A disposal group is generally measured at the lower of its car-rying amount and fair value less costs to sell. However, certain assets, such as deferred tax assets, assets arising from employee benefits,financialassetsandtherelatedliabilitiesareexemptfromthis measurement requirement. Rather, those assets and liabilities are measured in accordance with other applicable IFRSs. The dis-posal groups presented in CSS(E)L Group’s Statement of Finan-cial Position consist exclusively of assets and liabilities that are measured in accordance with other applicable IFRSs.
A discontinued operation is a component of CSS(E)L Group thateitherhasbeendisposedofor isclassifiedasheld forsaleand: (a) represents a separate major line of business or geographical
area of operations; (b) is part of a single co-ordinated plan to dispose of a separate
major line of business or geographical area of operations; or(c) is a subsidiary acquired exclusively with a view to resale.
Classificationasadiscontinuedoperationoccursattheearlierofdisposalorwhentheoperationmeetsthecriteriatobeclassifiedasheldforsale.Whenanoperationisclassifiedasadiscontinuedoperation, the comparative Consolidated Statement of Income is re-presented as if the operation had been discontinued from the start of the comparative year.
s) Retirement benefit costsTheCSS(E)LGrouphasbothdefinedcontributionanddefinedbenefitpensionplans.ThedefinedbenefitplansareCSGschemes,in which the Company is the sponsoring entity. CSS(E)L Group’s DefinedBenefitObligations(‘DBO’)arecalculatedusingthepro-jectedunitcreditmethod.Obligationsforcontributionstodefinedcontribution pension plans are recognised as an expense in the Consolidated Statement of Income as incurred. Remeasurements of thenetdefinedbenefit liabilityare recognised immediately inOther Comprehensive Income (‘OCI’). The CSS(E)L Group deter-minesthenetinterestexpenseonthenetdefinedbenefitliabilityfor the period by applying the discount rate used to measure the definedbenefitobligationatthebeginningoftheannualperiodtothe then net defined benefit liability, taking into account anychangesinthenetdefinedbenefitliabilityduringtheperiodasaresultofcontributionsandbenefitpayments.Netinterestexpenseandotherexpensesrelatedtodefinedbenefitplansarerecognisedinprofitorloss.
When thebenefitsofaplanarechangedorwhenaplan iscurtailed,theresultingchangeinbenefitthatrelatestopastser-vice or the gain or loss on curtailment is recognised immediately in the Consolidated Statement of Income. The CSS(E)L Group rec-ognisesgainsand losseson thesettlementofadefinedbenefitplan when the settlement occurs. The Company has no contrac-tualagreementorstatedpolicyforchargingthenetdefinedbenefitcost to participating entities.
t) Share-based paymentsThe Company grants shares in its ultimate parent, Credit Suisse Group (‘CSG’) to certain employees. The Company pays for CSG shares at market value at the time of settlement to employees. Theshare-basedawardsareclassifiedasacash-settledsharebased payment plan. A liability equal to the portion of the services received is recognised at the current market value determined at each balance sheet date.
The expense for share-based payments is determined by treat-ing each tranche as a separate grant of share awards and is accrued over the vesting period for each tranche, unless the employee is eligible for early retirement or retirement before the end of the vesting period, in which case recognition of the expense would be accelerated over the shorter period.
Share awards are made to employees in one of the following ways: (a) Phantom Share Awards(b) Special Awards, which are typically awarded upon hiring of
certain senior employees or in relation to business acquisi-tions. The terms (including amount, vesting, settlement, etc) ofspecialawardsvarysignificantlyfromawardtoaward
(c) Performance Share Awards(d) Contingent Capital share awards
Phantom shares and Performance share awards are accrued over the 3 or 4 year vesting period. Certain awards vest at grant date and are therefore accrued fully at grant date. Special awards are accrued over the vesting period as per award terms.
Changes in foreign exchange and market value of the above share plan obligations between grant date and settlement date are

41Credit Suisse Securities (Europe) Limited, Annual Report 2016
Notes to the Financial Statements for the year ended 31 December 2016
expensed within operating expenses. Total value of awards accrued and outstanding at end of the accounting period is classi-fiedasaliability.Share awards granted between January 1, 2014 and December 31, 2015 do not include the right to receive dividend equivalents during the vesting period, while share awards granted after Janu-ary 1, 2016 include the right to receive dividend equivalents.
u) Other compensation plansThe CSS(E)L Group has other deferred compensation plans which can be in the form of fixed or variable deferred cash compensation. The expense for these awards is recognised over the service period, which is the period the employee is obligated to work in order to become entitled to the cash compensation. Fixed deferred cash compensation is generally awarded in the form of sign-on bonuses and employee forgivable loans. Variable deferred cash compensa-tions are awards where the final cash payout is determined by the performance of certain assets, a division or the CS group as a whole. The awards are expensed over the required service period and accruals are adjusted for changes to the expected final payout.
v) Derivative financial instruments and hedgingAll freestanding derivative contracts are carried at fair value in the Consolidated Statement of Financial Position regardless of whether these instruments are held for trading or risk management purposes.Derivativesclassifiedas tradingassetsand liabilitiesinclude those held for trading purposes and those used for risk management purposes that do not qualify for hedge accounting. Derivatives held for trading purposes arise from proprietary trading activity and from customer-based activity, with changes in fair value included in ‘Netgains/(losses) fromfinancialassets/liabili-tiesatfairvaluethroughprofitorloss’.
Derivative contracts, which are both designated and qualify for hedge accounting, are reported in the Consolidated Statement of Financial Position as ‘Other assets’ or ‘Other liabilities’.
Embedded derivativesWhen derivative features embedded in certain contracts that meet thedefinitionofaderivativearenotconsideredcloselyrelatedtothe host instrument, either the embedded feature will be accounted for separately at fair value, with changes in fair value recorded in the Consolidated Statement of Income, or the instrument, includ-ing the embedded feature, is accounted for at fair value either underthefairvalueoptionorduetoclassificationasheldfortrad-ing. In the latter case the entire instrument is recorded at fair value with changes in fair value recorded in the Consolidated Statement of Income. If separated for measurement purposes, the derivative is recorded in the same line in the Consolidated Statement of Financial Position as the host instrument.
Hedge accountingWhere hedge accounting is applied, the CSS(E)L Group formally documents all relationships between hedging instruments and hedged items, including the risk management objectives and strat-egy for undertaking hedge transactions. At inception of a hedge and on an ongoing basis, the hedge relationship is formally assessed to determine whether the derivatives that are used in
hedging transactions are highly effective in offsetting changes in fair values of hedged items attributable to the hedged risk on both a retrospective and prospective basis. The CSS(E)L Group discon-tinues hedge accounting prospectively in circumstances where:p it is determined that the derivative is no longer effective in off-
setting changes in the fair value of a hedged item (including forecasted transactions);
p the derivative expires or is sold, terminated, or exercised;p the derivative is no longer designated as a hedging instrument
because it is unlikely that the forecasted transaction will occur; or
p the CSS(E)L Group otherwise determines that designation of the derivative as a hedging instrument is no longer appropriate.
Net investment hedgesFor hedges of a net investment in a foreign operation, the change in the fair value of the hedging instrument is recorded in AOCI to the extent the hedge is effective. The change in fair value repre-senting hedge ineffectiveness is recorded in ‘Net gains/(losses) fromfinancialassets/liabilitiesatfairvaluethroughprofitorloss’.The CSS(E)L Group uses the forward method of determining effectiveness for net investment hedges, which results in the time value portion of a foreign currency forward being reported in AOCI to the extent the hedge is effective.
Cash flow hedge accountingForhedgesofthevariabilityofcashflowsfromforecastedtrans-actionsandfloatingrateassetsorliabilities,theeffectiveportionofthe change in the fair value of a designated derivative is recorded in AOCI as part of shareholders’ equity. These amounts are reclas-sifiedintotheConsolidatedStatementofIncomewhenthevariablecashflowfromthehedgeditemimpactsearnings(e.g.whenperi-odic settlements on a variable rate asset or liability are recorded in the Consolidated Statement of Income or when the hedged item is disposed of). Hedge ineffectiveness is recorded in ‘Net gains/(losses)fromfinancialassets/liabilitiesatfairvaluethroughprofitor loss’.
Whenhedgeaccountingisdiscontinuedonacashflowhedge,thenetgainorlosswillremaininAOCIandbereclassifiedintotheConsolidated Statement of Income in the same period or periods during which the formerly hedged transaction is reported in the Consolidated Statement of Income.
When the CSS(E)L Group discontinues hedge accounting because a forecasted transaction is no longer expected to occur, the derivative will continue to be carried on the Consolidated State-ment of Financial Position at its fair value, and gains and losses that were previously recorded in equity will be recognised immedi-ately in the Consolidated Statement of Income. When the CSS(E)L Group discontinues hedge accounting but the forecasted transac-tion is still expected to occur, the derivative will continue to be recorded at its fair value with all subsequent changes in value recorded directly in the Consolidated Statement of Income. Any gains or losses recorded in equity prior to the date hedge account-ingisnolongerappliedwillbereclassifiedtonetincomewhentheforecasted transaction takes place.

42
w) Financial guarantee contractsFinancialguaranteecontractsrequiretheissuertomakespecifiedpayments to reimburse the holder for a loss it incurs because a specifieddebtorfailstomakepaymentswhendueinaccordancewiththetermsofadebtinstrument.Suchfinancialguaranteecon-tractsaregiventobanks,financialinstitutionsandotherpartiesonbehalf of customers to secure loans, overdrafts and other payables.Financial guarantee contracts are initially recognised in the Con-solidated Financial Statements at fair value on the date the guar-antee was given, which is generally the fee received or receivable. Subsequent to initial recognition, the CSS(E)L Group’s liabilities under such guarantees are measured at the higher of the initial fair value, less cumulative amortisation, and the best estimate for the expenditurerequiredtosettleanyfinancialobligationarisingasofthe Statement of Financial Position date when it is probable that thefinancialobligationwilloccur.Theseestimatesaredeterminedbased on experience with similar transactions and history of past losses, and management’s determination of the best estimate. Any increase in the liability relatedtofinancialguaranteecontracts isrecorded in the Consolidated Statement of Income under ‘Provi-sion for credit losses’.
x) Operating leasesThe leases entered into by the CSS(E)L Group are exclusively operating leases. The total payments made under operating leases are charged to the Consolidated Statement of Income on a straight-line basis over the period of the lease. When an operating lease is terminated before the lease period has expired, any early termination payment required to be made to the lessor is rec-ognised as an expense in the period in which termination takes place. If leased premises are vacated before the minimum lease term ends, a provision for the remaining minimum lease payments, net of any expected sublease income, is recognised in the period in which the CSS(E)L group makes the decision to leave the prop-erty. For lease incentives provided by the lessor, the CSS(E)L Group,aslessee,recognisestheaggregatebenefitasareductionof rental expense over the lease term on a straight-line basis.
If the CSS(E)L Group is the lessor in an operating lease it con-tinues to present the asset subject to the lease in its Financial Statements and recognises lease income on a straight line basis over the period of the lease.
SubleasesThe subleases entered into by the CSS(E)L Group are exclusively operating leases. Sublease payments received are recognised through ‘General, Administrative and Trading expenses’ in the Consolidated Statement of Income on a straight-line basis over the period of the lease.
y) Contingent liabilitiesContingent liabilities are possible obligations that arise from past eventsandwhoseexistencewillbeconfirmedonlybytheoccur-rence or non-occurrence of one or more uncertain future events not wholly within the control of the entity or are present obligations where it isnotprobablethatanoutflowofresourcesembodyingeconomicbenefitswillbe required tosettle theobligationor the
amountoftheobligationcannotbemeasuredwithsufficientreli-ability. A contingent liability is not recognised as a liability but is disclosed (unless the possibility of an outflow of economicresources is remote), except for those acquired under business combinations, which are recognised at fair value.
z) Recognition and derecognitionRecognitionTheCSS(E)LGrouprecognisesfinancialinstrumentsonitsCon-solidated Statement of Financial Position when the CSS(E)L Group becomes a party to the contractual provisions of the instrument.
Regular-way securities transactionsAregular-waypurchaseorsaleisapurchaseorsaleofafinancialasset under a contract whose terms require delivery of the asset within the time frame established generally by regulation or con-vention in the marketplace concerned. The CSS(E)L Group recog-nisesregular-waypurchasesorsalesoftradingfinancialassetsatthe settlement date unless the instrument is a derivative.
DerecognitionThe CSS(E)L Group enters into transactions where it transfers assets including securitisation assets, recognised on its Consoli-dated Statement of Financial Position, but retains either all risks and rewards of the transferred assets or a portion of them. If all or substantially all risks and rewards are retained, the transferred assets are not derecognised from the Consolidated Statement of Financial Position. Transactions where substantially all risk and rewards are retained include securities purchased or sold under repurchase agreements, securities borrowing and lending transac-tions,andsalesoffinancialassetswithconcurrentreturnswapson the transferred assets.
In transactions where the CSS(E)L Group neither retains nor transfers substantially all risks and rewards of ownership of a financialasset,itderecognisestheassetifcontrolovertheassetislost. The rights and obligations retained in the transfer are rec-ognised separately as assets and liabilities as appropriate. In trans-fers where control over the asset is retained, the CSS(E)L Group continues to recognise the asset to the extent of its continuing involvement, determined by the extent to which it is exposed to changes in the value of the transferred asset.
TheCSS(E)LGroupderecognisesafinancialliabilitywhenitscontractual obligations are discharged or cancelled or expire. WheretheCSS(E)LGrouphasafinancialliabilityandafinancialinstrument isexchanged foranewfinancial instrumentwith thesame counterparty, which is substantially different, or when an existingfinancialinstrumentclassifiedasafinancialliabilityissub-stantiallymodified, theoldfinancial instrument isdeemed tobeextinguishedandanewfinancialliabilityisrecognised.Anygainorloss due to derecognition of the extinguished instrument is recorded in the Consolidated Statement of Income. Where a mod-ificationandnotanextinguishment isdeemedtohaveoccurred,the difference is adjusted to the carrying value of the new instru-ment and reclassified into income using the effective interestmethod.

43Credit Suisse Securities (Europe) Limited, Annual Report 2016
Notes to the Financial Statements for the year ended 31 December 2016
SecuritisationThe CSS(E)L Group securitises assets, which generally results in the sale of these assets to structured entities, which in turn issue securities to investors. The transferred assets may qualify for derecognition in full or in part, under the above mentioned policy onderecognitionoffinancialassets.
Interestsinsecuritisedfinancialassetsmayberetainedintheform of senior or subordinated tranches, interest only strips or other residual interests (collectively referred to as ‘retained inter-ests’). Provided the CSS(E)L Group‘s retained interests do not result in consolidation of the structured entity, nor in continued recognition of the transferred assets, these retained tranches are typicallyrecordedin‘Tradingfinancialassetsatfairvaluethroughprofitorloss’.GainsorlossesonsecuritisationarerecognisedinConsolidated Statement of Income. The line item in the Consoli-dated Statement of Income, in which the gain or loss is presented, will depend on the nature of the asset securitised.
aa) Netting TheCSS(E)LGrouponlyoffsetsfinancialassetsandliabilitiesandpresents the net amount on the Consolidated Statement of Finan-cial Position where it:p currently has a legally enforceable right to set off the rec-
ognised amounts; andp intends either to settle on a net basis, or to realise the asset
and liability simultaneously.
In many instances the CSS(E)L Group’s net position on multiple bilateral OTC derivative transactions with the same counterparty is
legally protected by Master Netting Agreements. Such agree-ments normally ensure that the net position is settled in the event of default of either counterparty and effectively limits credit risk on gross exposures. However, because such contracts are not cur-rently enforceable in the normal course of business and the trans-actions themselves are not intended to be settled net, nor will they settle simultaneously, it is not permissible under IAS 32 Financial Instruments: Presentation (IAS 32) to offset transactions falling under Master Netting Agreements. For certain derivative transac-tions cleared with a central clearing counterparty (CCP) , the off-setting criteria under IAS 32 are met because the CSS(E)L Group has the current legally enforceable right to set off (based on the offsetting provisions in the CCP rulebook) and the intention to set-tle net or simultaneously (considering the daily payment process with the CCP). For securities purchased or sold under resale agreements or repurchase agreements, such legally enforceable agreements qualify for offsetting under IAS 32, if the gross settle-ment mechanism for these transactions has features that eliminate orresult ininsignificantcreditandliquidityrisk,andthatwillpro-cess receivables and payables in a single settlement process or cycle and will therefore meet the net settlement criterion as an equivalent.
ab) DividendsDividends on ordinary shares are recognised as a liability and deducted from equity when declared.
3 Critical Accounting Estimates and Judgements in Applying Accounting Policies
In order to prepare the Consolidated Financial Statements in accordance with International Financial Reporting Standards as adopted by the EU (‘Adopted IFRS’), management is required to make certain accounting estimates to ascertain the value of assets and liabilities. These estimates are based upon judgement and the information available at the time, and actual results may differ materially from these estimates. Management believes that the estimates and assumptions used in the preparation of the Consol-idated Financial Statements are reasonable and consistently applied.
Forfurtherinformationonsignificantaccountingpolicies,referto Note 2 – Significant Accounting Policies, specifically thefollowing: (i) Income tax(l) Financialassetsand liabilitiesat fair value throughprofitor
loss(p) Provisions(s) Retirementbenefitcosts(t) Share-based payments(v) Derivativefinancialinstrumentsandhedging(y) Contingent liabilities(z) Recognition and derecognition
Management believes that the critical accounting estimates dis-cussedbelowinvolvethemostsignificantjudgementsandassess-ments. Use of available information and application of judgement are inherent in the formation of estimates. Actual results in the future could differ from such estimates and the differences, may be material to the Consolidated Financial Statements.
TaxesDeferred tax valuation Deferred tax assets (‘DTA’) and deferred tax liabilities (‘DTL’) are recognised for the estimated future tax effects of operating loss carry-forwards and temporary differences between the carrying amounts of existing assets and liabilities and their respective tax bases at the Consolidated Statement of Financial Position date. The realisation of deferred tax assets on temporary differences is dependent upon the generation of taxable income in future accounting periods after those temporary differences become deductible. The realisation of deferred tax assets on net operating losses is dependent upon the generation of future taxable income. Management regularly evaluates whether deferred tax assets can be realised. Only if management considers it probable that a deferred tax asset will be realised is a corresponding deferred tax asset established without impairment.

44
In evaluating whether deferred tax assets can be realised, management considers both positive and negative evidence, including projected future taxable income, the scheduled reversal of deferred tax liabilities and tax planning strategies. This evalua-tion requires significantmanagement judgement, primarilywithrespect to projected taxable income, also taking into account the history of losses of the Company. The future taxable income can never be predicted with certainty, but management also evaluated the factors contributing to the losses and considered whether or not they are temporary or indicate an expected permanent decline in earnings. The evaluation is derived from budgets and strategic business plans but is dependent on numerous factors, some of whicharebeyondmanagement’scontrol, suchas thefiscalandregulatory environment and external economic growth conditions. Substantial variance of actual results from estimated future tax-ableprofits,or changes inCSS(E)LGroup’sestimateof futuretaxableprofitsandpotentialrestructurings,couldleadtochangesin the amount of deferred tax assets that are realisable, or consid-ered realisable, and would require a corresponding adjustment to the level of recognised DTA. Please see Note 12 – Deferred Taxes for more information.
Fair Value AsignificantportionoftheCSS(E)LGroup‘sfinancialinstruments(tradingfinancialassetsand liabilities,derivative instrumentsandfinancialassetsandliabilitiesdesignatedatfairvalue)arecarriedat fair value in the Consolidated Statement of Financial Position. Related changes in the fair value are recognised in the Consoli-datedStatement of Income.Deterioration of financialmarketscouldsignificantly impact the fair valueof thesefinancial instru-ments and the results of operations.
ThefairvalueofthemajorityoftheCSS(E)LGroup’sfinancialinstruments is based on quoted prices in active markets or observ-able inputs. These instruments include government securities, most investment grade corporate debt, certain high grade debt securities, exchange-traded and certain OTC derivative instru-ments and most listed equity securities.
Inaddition,theCSS(E)LGroupholdsfinancialinstrumentsforwhich no prices are available and which have little or no observable inputs. For these instruments, the determination of fair value requires subjective assessment judgement, depending on liquidity, pricing assumptions, the current economic and competitive envi-ronmentand the risksaffecting thespecific instrument. Insuchcircumstances, valuation is determined based on management’s own judgements about the assumptions that market participants would use in pricing the asset or liability, including assumptions aboutrisk.Theseinstrumentscompriseoflifefinanceinstrumentsand OTC derivatives, including longevity swaps.
Thefairvalueoffinancialassetsandliabilitiesisimpactedbyfactorssuchasbenchmarkinterestrates,pricesoffinancialinstru-ments issued by third parties, commodity prices, foreign exchange rates and index prices or rates. In addition, valuation adjustments are an integral part of the valuation process when market prices are not indicative of the credit quality of a counterparty, and are applied to both OTC derivatives and debt instruments.
The impact of changes in a counterparty’s credit spreads (known as credit valuation adjustments or ‘CVA’) is considered
when measuring the fair value of assets and the impact of changes in the CSS(E)L Group’s own credit spreads (known as debit valu-ation adjustments or ‘DVA’) is considered when measuring the fair value of its liabilities.
For OTC derivatives, the impact of changes in both the CSS(E)L Group’s and the counterparty’s credit standing is considered when measuring their fair value, based on current Credit Default Swaps (‘CDS’) prices. The adjustments also take into account contractual factors designed to reduce the CSS(E)L Group’s credit exposure to a counterparty, such as collateral held and master netting agreements.
For hybrid debt instruments with embedded derivative features, the impact of changes in the CSS(E)L Group’s credit standing is considered when measuring their fair value, based on current funded debt spreads.
As of the end of 2016, 46.91% and 40.33% of the total assets and total liabilities, respectively, were measured at fair value (2015: 48.37% and 38.0%, respectively). The CSS(E)L Group Level 3 assets were USD 3.12 billion (2015: USD 3.34 billion), which was equivalent to 2.62% (2015: 2.33%) of total assets and 5.59% of total assets measured at fair value (2015: 4.82%).
For further information on the fair value hierarchy and a descriptionofthevaluationtechniques,refertoNote 35–Finan-cial Instruments.
TheCSS(E)LGroup does not recognise a dealer profit orunrealised gains or losses at the inception of a derivative or non-derivative transaction unless the valuation underlying the unrealised gains or losses is evidenced by quoted market prices in an active market, observable prices of other current market trans-actions, or other observable data supporting a valuation technique inaccordancewithIAS39AG76.Thefinancialinstrumentisrec-ognisedatfairvaluewithanyprofitorlossimpliedfromthevalua-tion technique at trade date is deferred and amortised over the life of the contract or over the period up to when the fair value is expected to become observable.
Control processes are applied to ensure that the fair value of the financial instruments reported in the CSS(E)LGroup andCompany Financial Statements, including those derived from pric-ing models, are appropriate and determined on a reasonable basis. For further information related to the CSS(E)L Group’s control and governanceprocesseson the fair valueoffinancial instrumentspleasereferNote 35–FinancialInstruments.
Disposal Group and Discontinued OperationsTheclassificationofassetsandliabilitiesasadisposalgroupheldfor sale and the related presentation of discontinued operations requires a judgement by management, as to whether it is highly probable that the assets and liabilities will be recovered primarily through a sale, rather than through continuing use. For manage-ment to consider a sale to be highly probable, it must be commit-ted to a plan to sell the disposal group and an active programme to locate a buyer and complete the plan must have been initiated. Further, the disposal group must be actively marketed for sale at a price that is reasonable in relation to its current fair value. The evaluation performed by management focused on the timing of these plans within the wider strategic plan of the company and the reduction plans of the SRU. The sale should be expected to

45Credit Suisse Securities (Europe) Limited, Annual Report 2016
Notes to the Financial Statements for the year ended 31 December 2016
qualify for recognition as a completed sale within one year from thedateof classificationandactions required to complete theplanshouldindicatethatitisunlikelythatsignificantchangestothe plan will be made or that the plan will be withdrawn. Events or circumstances may extend the period to complete the sale beyond one year. The estimate of the time period required until the transfer of a disposal group held for sale is recognised as a completed sale represents a critical accounting estimate. Note 25 – Discontinued Operations and Assets Held for Sale dis-closes those disposal groups for which management expects that a completed sale will be recognised within one year or for which events or circumstances have extended the period to complete the sale beyond one year.
Retirement Benefit Costs The following relates to the assumptions the Company, as sponsor ofthedefinedbenefitplans,hasmadeinarrivingatthevaluationsofthevariouscomponentsofthedefinedbenefitplans.
The calculation of the expense and liability associated with the definedbenefitpensionplans requires theuseofassumptions,which include the discount rate and rate of future compensation increases as determined by the Company. Management deter-mines these assumptions based upon currently available market and industry data and the historical performance of the plans and their assets.
Managementalsoconsultswithanindependentactuarialfirmto assist in selecting appropriate assumptions and valuing its related liabilities. The actuarial assumptions used by the Company may differ materially from actual results due to changing market and economic conditions, higher or lower withdrawal rates or lon-ger or shorter life spans of the participants. Any such differences couldhaveasignificantimpactontheamountofpensionexpenserecorded in future years.
Thediscountrateusedindeterminingthebenefitobligationisbased on high-quality corporate bonds. In estimating the discount rate the Company takes into consideration the relationship between the corporate bonds and the timing and amount of the futurecashoutflowsofitsbenefitpayments.PleaseseeNote28–RetirementBenefitObligationsformoreinformation.
Share-based payments The CSS(E)L Group uses the liability method to account for its share-based payment plans, which requires the CSS(E)L Group’s obligation under these plans to be recorded at its current esti-mated fair value. Share awards and share unit awards that contain market conditions are marked-to-market based on the latest share price information reflecting the termsof theaward.Shareunitawards that contain earnings performance conditions are marked-to-market based on CSG’s actual earnings performance to date and CSG’s internal earnings projections over the remaining vesting periodoftheaward.Indeterminingthefinalliability,CSGalsoesti-mates the number of forfeitures over the life of the plan based on management’s expectations for future periods, which also considers past experience. Please see Note 29 – Employee Share-based Compensation and Other Compensation Benefits for moreinformation.
Transfer PricingTransfer pricing charges are determined based on arm’s length pricing principles. These net charges are adjusted as required due to evolving facts and changes in tax laws, progress of tax authority audits as well tax authority negotiated arrangements for current and prior periods. Management continuously assess these factors and make adjustments as required. Please see Note 30 – Related Parties for more information.
Contingencies and loss provisions According to IAS 37 ‘Provisions, Contingent Liabilities and Contin-gent Assets’, a provision shall be recognised when; (a) an entity has a present obligation (legal or constructive) as a
result of a past event; (b) it isprobable thatanoutflowof resourcesembodyingeco-
nomicbenefitswillberequiredtosettletheobligation;and(c) a reliable estimate can be made of the amount of the
obligation.
A contingency is an existing condition that involves a degree of uncertainty that will ultimately be resolved upon the occurrence of future events. Please see Note 23 – Provisions for more information.
Litigation contingencies The CSS(E)L Group is involved in a variety of legal, regulatory and arbitration matters in connection with the conduct of its businesses.
It is inherently difficult to predict the outcomeofmany ofthese matters, particularly those cases in which the matters are brought on behalf of various classes of claimants, which seek damages of unspecified or indeterminate amounts or whichinvolve questionable legal claims. A provision is recognised if, and only if a present obligation (legal or constructive) has arisen as a result of a past event (the obligating event). In presenting the Consolidated Financial Statements, management makes esti-mates regarding the outcome of legal, regulatory and arbitration matters and takes a charge to income when losses with respect to such matters are probable and can be reasonably estimated. Charges, are not established for matters when losses cannot be reasonably estimated. Estimates, by their nature, are based on judgement and currently available information and involve a vari-ety of factors, including but not limited to the type and nature of the litigation, claim or proceeding, the progress of the matter, the advice of legal counsel and other advisers, the CSS(E)L Group’s defences and its experience in similar cases or proceedings, as well as the CSS(E)L Group’s assessment of matters, including settlements, involving other defendants in similar or related cases or proceedings. Please see Note 23 – Provisions for more information.
Structured Entities As part of normal business, the CSS(E)L Group engages in vari-ous transactions that include entities which are considered struc-tured entities. A structured entity is an entity that has been designed so that voting or similar rights are not the dominant factor in deciding who controls the entity, such as when any voting rights

46
relate to administrative tasks only and the relevant activities are directed by means of contractual arrangements.Transactions with structured entities are generally executed to facilitatesecuritisationactivitiesor tomeetspecificclientneeds,such as providing liquidity or investment opportunities, and, as part of these activities, the CSS(E)L Group may hold interests in the structured entities. If the CSS(E)L Group controls the structured entity then that entity is included in the CSS(E)L Group’s consoli-dated financial statements. The CSS(E)L Group discloses
informationaboutsignificantjudgementsandassumptionsmadeindetermining whether the CSS(E)L Group has (joint) control of, or significantinfluenceover,anotherentityincludingstructuredenti-ties. The CSS(E)L Group also provides disclosures with regards to unconsolidated structured entities such as when it sponsors or has an interest in such an entity. Please see Note 34 – Interests in Other Entities for more information.
4 Net Interest Expense
2016 2015 1
Net interest expense (USD million)
Securities purchased under resale agreements and securities borrowing transactions 172 73
Financial assets designated at fair value through profit or loss 27 83
Other 105 93
Interest income 304 249
Deposits (3) (7)
Securities sold under repurchase agreements and securities lending transactions (120) (134)
Financial liabilities designated at fair value through profit or loss 151 107
Short term borrowings (64) (100)
Long term debt (319) (288)
Other (115) (49)
Interest expense (470) (471)
Net interest expense (166) (222)
1 2015 numbers have been restated to disclose the impact of discontinued operations. Refer to Note 25 for details.
For securities purchased under resale agreements and securities borrowing transactions if the interest rate is negative the associ-ated interest expense is recorded in interest income. For securities
sold under repurchase agreements and securities lending transac-tions if the interest rate is negative the associated interest income is recorded in interest expense.
5 Net Commissions and Fee Income
2016 2015 1
Commission and fee income/(expense) (USD million)
Underwriting 165 219
Brokerage 347 355
Underwriting and brokerage 512 574
Other customer services 20 20
Total commission and fee income 532 594
Total commission and fee expense (64) (56)
Net commission and fee income 468 538
1 2015 numbers have been restated to disclose the impact of discontinued operations. Refer to Note 25 for details.
Feeexpenserepresentsfeespaidtoaffiliatesandexchangesonexchange traded products under agency agreements.

47Credit Suisse Securities (Europe) Limited, Annual Report 2016
Notes to the Financial Statements for the year ended 31 December 2016
6 Net Gains from Financial Assets/Liabilities at Fair Value through Profit or Loss
2016 2015 1
Net gains/(losses) from financial assets/liabilities at fair value through profit or loss (USD million)
Interest rate (11) 21
Foreign exchange (322) (747)
Equity 343 432
Net income on trading financial assets and trading financial liabilities 331 796
Other 296 73
Total net gains from financial assets/liabilities at fair value through profit or loss 637 575
Of which:
Net gains/(losses) from financial assets/liabilities designated at fair value through profit or loss (USD million)
Securities purchased under resale agreements and securities borrowing transactions (4) (18)
Other financial assets designated at fair value through profit or loss 69 (52)
ofwhichrelatedtocreditrisk (1) –
Securities sold under repurchase agreements and securities lending transactions (2) 19
Long term debt (1) (4)
Other financial liabilities designated at fair value through profit or loss 1 –
Total net gains/(losses) from financial assets/liabilities at fair value through profit or loss 62 (55)
1 2015 numbers have been restated to disclose the impact of discontinued operations. Refer to Note 25 for details.
7 Other Revenues
2016 2015 1
Other revenues (USD million)
Revenue sharing agreements (30) (59)
Other 4 (8)
Total other revenues (26) (67)
1 2015 numbers have been restated to disclose the impact of discontinued operations. Refer to Note 25 for details.
8 Compensation and Benefits
2016 2015 1
Compensation and benefits (USD million)
Salaries and variable compensation (454) (690)
Social security (60) (102)
Pensions (13) (28)
Other (19) (58)
Total compensation and benefits (546) (878)
1 2015 numbers have been restated to disclose the impact of discontinued operations. Refer to Note 25 for details.
Included in the above table are amounts relating to Directors’ remuneration. Further details are disclosed in Note 30 – Related Parties. Staff costs and staff numbers do not differ between CSS(E)L Group and Company.
Decrease in staff cost is primarily driven by movement of staff from CSS(E)L to Credit Suisse International due to continuing business migrations and cost reduction program in 2016. The
number of employees reduced by 1,025 from 4,955 in 2015 to 3,930 as at the end of 2016.
TheCSS(E)LGroupincurscompensationandbenefitscostswhicharerechargedtotherelevantCS groupcompaniesthrough‘Expenses receivable from other Credit Suisse group companies’ inNote 9–General,AdministrativeandTradingExpenses.

48
9 General, Administrative and Trading Expenses
Reference to note 2016 2015 1
General, administrative and trading expenses (USD million)
Brokerage charges and clearing house fees (85) (105)
Trading expenses (85) (105)
Occupancy expenses (100) (92)
IT and machinery (164) (207)
Depreciation expense 19 (3) (9)
Provisions 23 (7) (2)
Travel and entertainment (14) (26)
Auditors’ remuneration (1) (2)
Professional services (391) (602)
UK Bank levy (35) (48)
Non income taxes (104) (142)
Marketing data, publicity and subscription (25) (32)
Communication expenses (28) (35)
Other (17) (10)
General and administrative expenses (889) (1,207)
Expenses receivable from other Credit Suisse group companies 521 815
Total General, administrative and trading expenses (453) (497)
1 2015 numbers have been restated to disclose the impact of discontinued operations. Refer to Note 25 for details.
The CSS(E)L Group incurs expenses on behalf of other CS group companies under common control. These are subsequently recharged to the relevant companies through ‘Expenses receivable from other CS group companies’. The recharges comprise of com-pensation and benefit expenses and general administrativeexpenses. See Note – 30- Related Parties.
Auditor’s remunerationAuditor’s remuneration in relation to the statutory audit amounted to USD 1.03 million (2015: USD 1.2 million).
The following fees were payable by the CSS(E)L Group to the auditor, KPMG LLP.
CSS(E)L Auditor’s Remuneration (USD ‘000) 2016 2015
Fees payable to CSS(E)L Group’s auditor for the audit of the CSS(E)L Group’s annual accounts (1,033) (1,245)
Fees payable to CSS(E)L Group’s auditor and its associates for other services: – (371)
Audit-related assurance services (392) (266)
Other assurance services (25) –
Total Fees (1,450) (1,882)
10 Restructuring Expenses
In connection with the strategic review of the CS Group, restruc-turing expenses of USD 10 million (2015: USD 54 million) were recognised during 2016. Restructuring expenses primarily include
termination costs, expenses in connection with the acceleration of certain deferred compensation awards.
2016 2015
Restructuring expenses by type (USD million)
Compensation and benefits-related expenses (10) (54)
ofwhichseverance (8) (42)
ofwhichaccelerateddeferredcompensation (2) (12)
Total Restructuring expenses by type (10) (54)
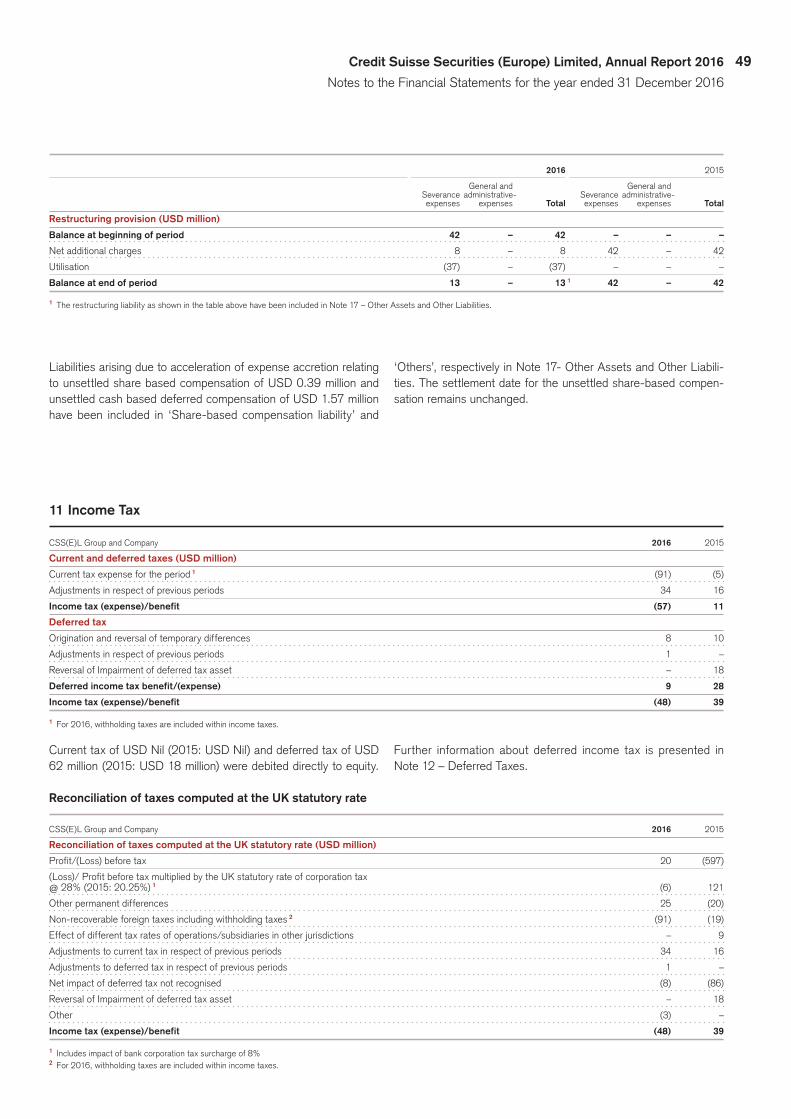
49Credit Suisse Securities (Europe) Limited, Annual Report 2016
Notes to the Financial Statements for the year ended 31 December 2016
2016 2015
General and General and Severance administrative- Severance administrative- expenses expenses Total expenses expenses Total
Restructuring provision (USD million)
Balance at beginning of period 42 – 42 – – –
Net additional charges 8 – 8 42 – 42
Utilisation (37) – (37) – – –
Balance at end of period 13 – 13 1 42 – 42
1 The restructuring liability as shown in the table above have been included in Note 17 – Other Assets and Other Liabilities.
Liabilities arising due to acceleration of expense accretion relating to unsettled share based compensation of USD 0.39 million and unsettled cash based deferred compensation of USD 1.57 million have been included in ‘Share-based compensation liability’ and
‘Others’, respectively in Note 17- Other Assets and Other Liabili-ties. The settlement date for the unsettled share-based compen-sation remains unchanged.
11 Income Tax
CSS(E)L Group and Company 2016 2015
Current and deferred taxes (USD million)
Current tax expense for the period 1 (91) (5)
Adjustments in respect of previous periods 34 16
Income tax (expense)/benefit (57) 11
Deferred tax
Origination and reversal of temporary differences 8 10
Adjustments in respect of previous periods 1 –
Reversal of Impairment of deferred tax asset – 18
Deferred income tax benefit/(expense) 9 28
Income tax (expense)/benefit (48) 39
1 For 2016, withholding taxes are included within income taxes.
Current tax of USD Nil (2015: USD Nil) and deferred tax of USD 62 million (2015: USD 18 million) were debited directly to equity.
Further information about deferred income tax is presented in Note 12 – Deferred Taxes.
Reconciliation of taxes computed at the UK statutory rate
CSS(E)L Group and Company 2016 2015
Reconciliation of taxes computed at the UK statutory rate (USD million)
Profit/(Loss) before tax 20 (597)
(Loss)/ Profit before tax multiplied by the UK statutory rate of corporation tax
@ 28% (2015: 20.25%) 1 (6) 121
Other permanent differences 25 (20)
Non-recoverable foreign taxes including withholding taxes 2 (91) (19)
Effect of different tax rates of operations/subsidiaries in other jurisdictions – 9
Adjustments to current tax in respect of previous periods 34 16
Adjustments to deferred tax in respect of previous periods 1 –
Net impact of deferred tax not recognised (8) (86)
Reversal of Impairment of deferred tax asset – 18
Other (3) –
Income tax (expense)/benefit (48) 39
1 Includes impact of bank corporation tax surcharge of 8%
2 For 2016, withholding taxes are included within income taxes.

50
12 Deferred Taxes
Deferred taxes are calculated on all temporary differences under the liability method using an effective tax rate of 25% (2015: 26%). Deferred taxes are calculated on carry forward tax losses using effective tax rates of 17% or 25% (2015: 18%).
The Finance Act 2013, which passed into law on 17 July 2013, reduced the UK corporation tax rate from 23% to 21% with effect from 1 April 2014 and 21% to 20% with effect from 1 April 2015.
The Finance (No. 2) Act 2015, which passed into law on 18 November 2015, included rate reductions in the UK corporation tax rate from 20% to 19% with effect from 1 April 2017 and 19% to 18% with effect from 1 April 2020. The Finance (No.2) Act 2015 also introduced legislation to levy a surcharge of 8% on the profitsofbankingcompanies.TheCompanyissubjecttothissur-charge from 1 January 2016.
The Finance Act 2016, which was enacted on 15 September 2016, further reduced the UK corporation tax rate from 18% to 17% with effect from 1 April 2020.
From 1 April 2015, the use of tax losses carried forward by UK banks is restricted to amaximumof50%of taxableprofits inrespect of losses incurred prior to 1 April 2015. From 1 April 2016, the use of tax losses carried forward by UK banks is further restricted toamaximumof25%of taxableprofits in respectoflosses incurred prior to 1 April 2015. Furthermore, the UK budget announcement of 16 March 2016 included proposals for new rules on corporation tax loss relief with effect from 1 April 2017. This UK tax law change and the future enactment of the further loss restriction proposals is not expected to have a material impact on the recoverability of the net deferred tax asset.
CSS(E)L Group and Company 2016 2015
Deferred tax (USD million)
Deferred tax assets 18 18
Deferred tax liabilities (52) –
Net position (34) 18
Balance at 1 January, net position 18 16
Credit to income for the year 9 28
Tax booked to other comprehensive income (62) (18)
Adjustments related to the previous year 1 –
Other movements 1 (5)
Exchange differences (1) (3)
Balance at 31 December, net position (34) 18
Deferred tax assets and liabilities are attributable to the following items:
Components of net deferred tax assets
CSS(E)L Group and Company 2016 2015
Components of net deferred tax assets (USD million)
Share-based compensation 100 154
Decelerated tax depreciation 30 32
Other short term temporary differences 34 34
Tax losses 29 –
Pensions and other post-retirement benefits (175) (202)
Balance at 31 December 18 18
Components of net deferred tax liabilities
CSS(E)L Group and Company 2016 2015
Components of deferred tax liabilities (USD million)
Pensions and other post-retirement benefits (52) –
Balance at 31 December (52) –

51Credit Suisse Securities (Europe) Limited, Annual Report 2016
Notes to the Financial Statements for the year ended 31 December 2016
Details of the tax effect of temporary differencesThedeferredtaxbenefitintheStatementofIncomecomprisesthefollowingtemporarydifferences:
CSS(E)L Group and Company 2016 2015
Tax effect of temporary differences (USD million)
Share-based compensation (54) 42
Decelerated tax depreciation (2) 8
Other short term temporary differences – 7
Tax losses 29 –
Pensions and other post-retirement benefits 36 (30)
Total deferred tax benefit/(expense) in the Statement of Income 9 27
The deferred tax expense in Other Comprehensive Income related to:
CSS(E)L Group and Company 2016 2015
Tax expense in Other Comprehensive Income (USD million)
Defined benefit (Asset)/Liability (62) (18)
Total deferred tax expense in the Statement of Income (62) (18)
Deferred tax assets (DTA) and deferred tax liabilities (DTL) are recognised for the estimated future tax effects of operating loss carry-forwards and temporary differences between the carrying amounts of existing assets and liabilities and their respective tax bases at the balance sheet date. The realisation of deferred tax assets on temporary differences is dependent upon the generation of taxable income in future accounting periods after those tempo-rary differences become deductible. The realisation of deferred tax assets on net operating losses is dependent upon the generation of future taxable income. Management regularly evaluates whether deferred tax assets can be realised. Only if management considers it probable that a deferred tax asset will be realised is a corresponding deferred tax asset established without impairment.
In evaluating whether deferred tax assets can be realised, management considers both positive and negative evidence, including projected future taxable income, the scheduled reversal of deferred tax liabilities and tax planning strategies. This evalua-tion requires significantmanagement judgement, primarilywithrespect to projected taxable income, also taking into account the history of losses of the Company. The future taxable income can
never be predicted with certainty, but management also evaluated the factors contributing to the losses and considered whether or not they are temporary or indicate an expected permanent decline in earnings. The evaluation is derived from budgets and strategic business plans but is dependent on numerous factors, some of whicharebeyondmanagement’scontrol, suchas thefiscalandregulatory environment and external economic growth conditions. Substantial variance of actual results from estimated future tax-ableprofits,orchanges inourestimateof future taxableprofitsand potential restructurings, could lead to changes in the amount of deferred tax assets that are realisable, or considered realisable, and would require a corresponding adjustment to the level of rec-ognised DTA.
As a consequence of this evaluation, deferred tax assets of USD 759 million (2015: USD 868 million) have not been rec-ognised.Ifstrategiesandbusinessplanswillsignificantlydeviateinthe future from current management assumptions, the current level of deferred tax assets may need to be adjusted, if full recov-ery of the deferred tax asset balance is no longer probable.
13 Securities Borrowed, Lent and Purchased/Sold under Resale/Repurchase Agreements
Thefollowingtablesummarisesthefinancialassetsresultingfromthesecuritiespurchasedunderresaleagreements,attheirrespectivecarrying values:
CSS(E)L Group and Company 2016 2015
Securities purchased under resale agreements and securities borrowing transactions (USD million)
Securities purchased under resale agreements 11,686 5,143
Total Securities purchased under resale agreements and securities borrowing transactions 11,686 5,143

52
Thefollowingtablesummarisesthefinancial liabilitiesresultingfromthesecurities lentunderrepurchaseagreementsandsecuritieslending transactions, at their respective carrying values:
CSS(E)L Group and Company 2016 2015
Securities sold under repurchase agreements and securities lending transactions (USD million)
Securities sold under repurchase agreements 72 62
Total Securities sold under repurchase agreements and securities lending transactions 72 62
See Note 15 – Financial Assets and Liabilities Designated at Fair Value throughProfitorLoss forSecuritiesBorrowed,LentandPurchased/Sold under Resale/Repurchase Agreements that have been held at fair value. Increase in Securities purchased under resale agreements and securities borrowing transactions is primar-ily driven by increase in transactions with entities in CS group.
Securities Borrowed, Lent and Purchased/Sold under Resale/Repurchase Agreements are mainly due within one year.
Resale and repurchase agreements represent collateralised financingtransactionsusedtoearnnetinterestincome,increaseliquidity or facilitate trading activity. These instruments are
collateralised principally by government securities and money mar-ket instruments and have terms ranging from overnight to a longer orunspecifiedperiodofmaturity (generallymaturingwithinoneyear). The CSS(E)L Group monitors the fair value of securities received or delivered. For securities purchased under resale agree-ments, the CSS(E)L Group requests additional securities, or the return of a portion of the cash disbursed when appropriate, in response to a decline in the market value of the securities received. Similarly, the return of excess securities or additional cash is requested, when appropriate, in response to an increase in the market value of securities sold under repurchase agreements.
14 Trading Financial Assets and Liabilities at Fair Value Through Profit or Loss
CSS(E)L Group Company
Securities purchased under resale agreements and securities borrowing transactions (USD million) 2016 2015 2016 2015
Trading financial assets at fair value through profit or loss (USD million)
Debt securities 2,603 5,801 2,603 5,801
Equity securities 7,932 10,399 7,932 10,399
Derivative instruments 3,345 4,482 3,898 5,049
Total trading financial assets at fair value through profit or loss 13,880 20,682 14,433 21,249
Trading financial liabilities at fair value through profit or loss (USD million)
Debt securities 1,787 1,826 1,787 1,826
Equity securities 2,786 3,087 2,786 3,087
Derivative instruments 2,964 4,876 2,932 4,842
Total trading financial liabilities at fair value through profit or loss 7,537 9,789 7,505 9,755
Debt securities primarily consist of corporate bonds and govern-ment securities. Decrease in Trading Financial Assets and Liabili-tiesatFairValueThroughProfitorLossisprimarilydrivenbydis-continued operations in 2016. Refer Note 25 for details.
Tradingfinancial assets includeUSD 16,809million (2015:USD 22,958million)whichareencumbered, representingdebt
and equity securities from both continued and discontinued opera-tions. Refer Note – 36 Assets Pledged or Assigned. The transac-tions in relation to the encumbered assets are conducted under terms that are usual and customary for securities lent, resale agreements or other collateralised borrowings.
15 Financial Assets and Liabilities Designated at Fair Value through Profit or Loss
CSS(E)L Group Company
2016 2015 2016 2015
Financial assets designated at fair value through profit or loss (USD million)
Securities purchased under resale agreements and securities borrowing transactions 21,568 26,450 21,568 26,450
Other financial assets designated at fair value through profit or loss 2,045 2,137 1,442 1,512
Total financial assets designated at fair value through profit or loss 23,613 28,587 23,010 27,962
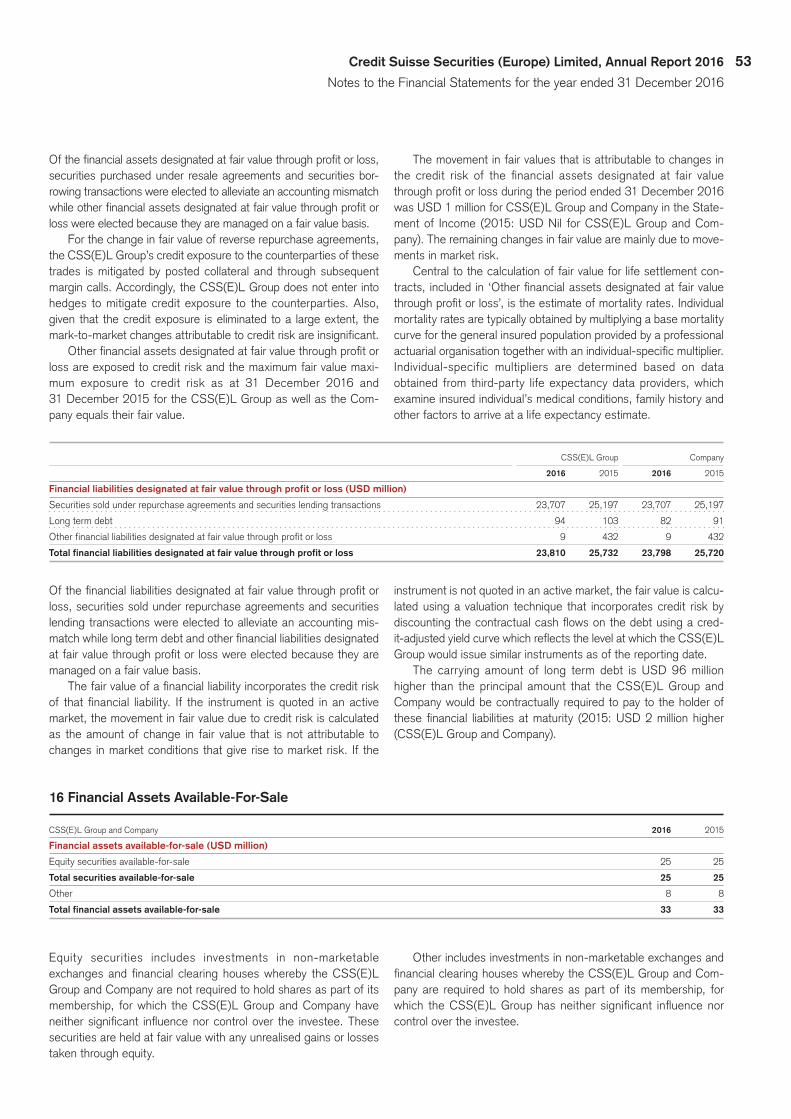
53Credit Suisse Securities (Europe) Limited, Annual Report 2016
Notes to the Financial Statements for the year ended 31 December 2016
Of the financial assets designated at fair value through profit or loss, securities purchased under resale agreements and securities bor-rowing transactions were elected to alleviate an accounting mismatch while other financial assets designated at fair value through profit or loss were elected because they are managed on a fair value basis.
For the change in fair value of reverse repurchase agreements, the CSS(E)L Group’s credit exposure to the counterparties of these trades is mitigated by posted collateral and through subsequent margin calls. Accordingly, the CSS(E)L Group does not enter into hedges to mitigate credit exposure to the counterparties. Also, given that the credit exposure is eliminated to a large extent, the mark-to-market changes attributable to credit risk are insignificant.
Otherfinancialassetsdesignatedatfairvaluethroughprofitorloss are exposed to credit risk and the maximum fair value maxi-mum exposure to credit risk as at 31 December 2016 and31 December2015fortheCSS(E)LGroupaswellastheCom-pany equals their fair value.
The movement in fair values that is attributable to changes in the credit risk of the financial assets designated at fair valuethroughprofitorlossduringtheperiodended31 December2016wasUSD 1millionforCSS(E)LGroupandCompanyintheState-mentof Income (2015:USD Nil forCSS(E)LGroupandCom-pany). The remaining changes in fair value are mainly due to move-ments in market risk.
Central to the calculation of fair value for life settlement con-tracts,includedin‘Otherfinancialassetsdesignatedatfairvaluethroughprofitorloss’,istheestimateofmortalityrates.Individualmortality rates are typically obtained by multiplying a base mortality curve for the general insured population provided by a professional actuarialorganisationtogetherwithanindividual-specificmultiplier.Individual-specific multipliers are determined based on data obtained from third-party life expectancy data providers, which examine insured individual’s medical conditions, family history and other factors to arrive at a life expectancy estimate.
CSS(E)L Group Company
2016 2015 2016 2015
Financial liabilities designated at fair value through profit or loss (USD million)
Securities sold under repurchase agreements and securities lending transactions 23,707 25,197 23,707 25,197
Long term debt 94 103 82 91
Other financial liabilities designated at fair value through profit or loss 9 432 9 432
Total financial liabilities designated at fair value through profit or loss 23,810 25,732 23,798 25,720
Ofthefinancialliabilitiesdesignatedatfairvaluethroughprofitorloss, securities sold under repurchase agreements and securities lending transactions were elected to alleviate an accounting mis-matchwhilelongtermdebtandotherfinancialliabilitiesdesignatedatfairvaluethroughprofitorlosswereelectedbecausetheyaremanaged on a fair value basis.
Thefairvalueofafinancialliabilityincorporatesthecreditriskof thatfinancial liability. If the instrument isquoted inanactivemarket, the movement in fair value due to credit risk is calculated as the amount of change in fair value that is not attributable to changes in market conditions that give rise to market risk. If the
instrument is not quoted in an active market, the fair value is calcu-lated using a valuation technique that incorporates credit risk by discountingthecontractualcashflowsonthedebtusingacred-it-adjusted yield curve which reflects the level at which the CSS(E)L Group would issue similar instruments as of the reporting date.
The carrying amount of long term debt is USD 96millionhigher than the principal amount that the CSS(E)L Group and Company would be contractually required to pay to the holder of thesefinancial liabilitiesatmaturity (2015:USD 2millionhigher(CSS(E)L Group and Company).
16 Financial Assets Available-For-Sale
CSS(E)L Group and Company 2016 2015
Financial assets available-for-sale (USD million)
Equity securities available-for-sale 25 25
Total securities available-for-sale 25 25
Other 8 8
Total financial assets available-for-sale 33 33
Equity securities includes investments in non-marketable exchangesandfinancial clearinghouseswhereby theCSS(E)LGroup and Company are not required to hold shares as part of its membership, for which the CSS(E)L Group and Company have neithersignificant influencenorcontrolover the investee.Thesesecurities are held at fair value with any unrealised gains or losses taken through equity.
Other includes investments in non-marketable exchanges and financialclearinghouseswherebytheCSS(E)LGroupandCom-pany are required to hold shares as part of its membership, for which theCSS(E)LGrouphasneither significant influencenorcontrol over the investee.
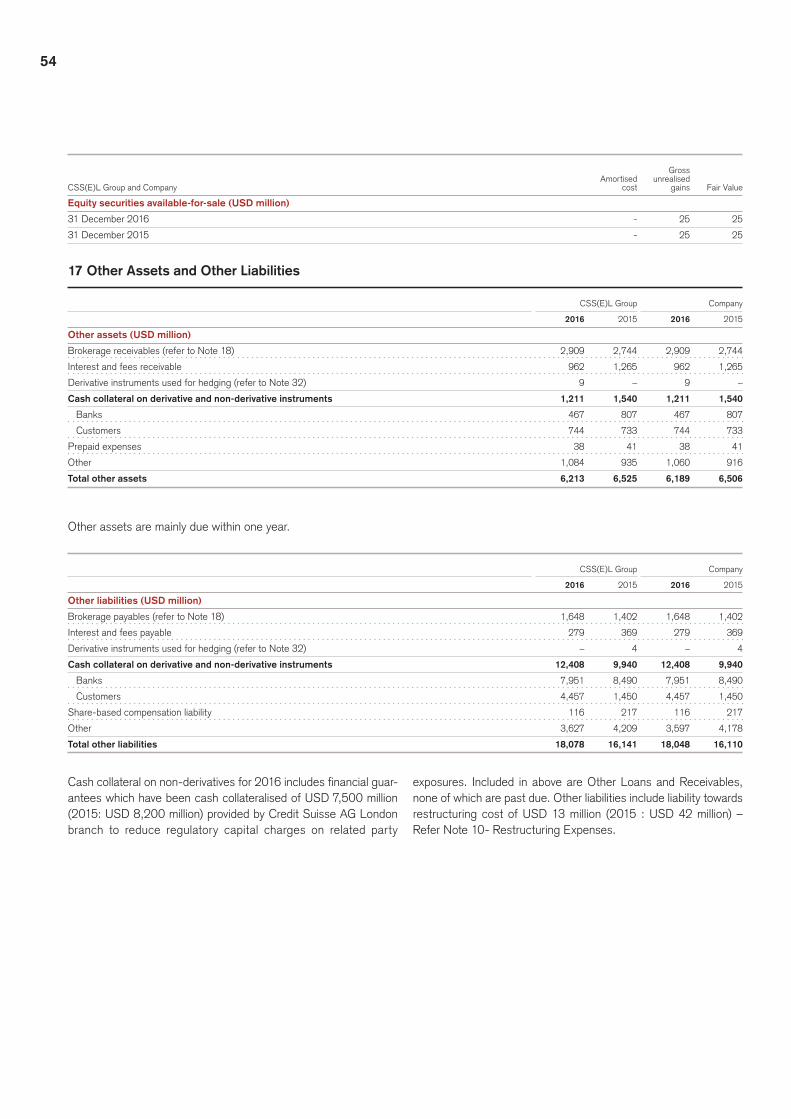
54
Gross Amortised unrealised
CSS(E)L Group and Company cost gains Fair Value
Equity securities available-for-sale (USD million)
31 December 2016 - 25 25
31 December 2015 - 25 25
17 Other Assets and Other Liabilities
CSS(E)L Group Company
2016 2015 2016 2015
Other assets (USD million)
Brokerage receivables (refer to Note 18) 2,909 2,744 2,909 2,744
Interest and fees receivable 962 1,265 962 1,265
Derivative instruments used for hedging (refer to Note 32) 9 – 9 –
Cash collateral on derivative and non-derivative instruments 1,211 1,540 1,211 1,540
Banks 467 807 467 807
Customers 744 733 744 733
Prepaid expenses 38 41 38 41
Other 1,084 935 1,060 916
Total other assets 6,213 6,525 6,189 6,506
Other assets are mainly due within one year.
CSS(E)L Group Company
2016 2015 2016 2015
Other liabilities (USD million)
Brokerage payables (refer to Note 18) 1,648 1,402 1,648 1,402
Interest and fees payable 279 369 279 369
Derivative instruments used for hedging (refer to Note 32) – 4 – 4
Cash collateral on derivative and non-derivative instruments 12,408 9,940 12,408 9,940
Banks 7,951 8,490 7,951 8,490
Customers 4,457 1,450 4,457 1,450
Share-based compensation liability 116 217 116 217
Other 3,627 4,209 3,597 4,178
Total other liabilities 18,078 16,141 18,048 16,110
Cashcollateralonnon-derivativesfor2016includesfinancialguar-antees which have been cash collateralised of USD 7,500 million (2015: USD 8,200 million) provided by Credit Suisse AG London branch to reduce regulatory capital charges on related party
exposures. Included in above are Other Loans and Receivables, none of which are past due. Other liabilities include liability towards restructuring cost of USD 13 million (2015 : USD 42 million) – Refer Note 10- Restructuring Expenses.

55Credit Suisse Securities (Europe) Limited, Annual Report 2016
Notes to the Financial Statements for the year ended 31 December 2016
18 Brokerage Receivables and Brokerage Payables
The CSS(E)L Group recognises receivables and payables from transactions infinancial instrumentspurchased fromandsold tocustomers, banks, brokers and dealers. The CSS(E)L Group is exposed to a risk of loss resulting from the inability of counterpar-tiestopayforordeliverfinancialinstrumentssoldorpurchased,inwhich case the CSS(E)L Group would have to sell or purchase,
respectively, these financial instruments at prevailing marketprices. To the extent that an exchange or clearing organisation acts as a counterparty to a transaction, credit risk is considered to be reduced. The CSS(E)L Group requires customers to maintain margin collateral in compliance with applicable regulatory and internal guidelines.
CSS(E)L Group and Company 2016 2015
Brokerage receivables (USD million)
Due from customers 986 773
Due from banks, brokers and dealers 1,923 1,971
Total brokerage receivables 2,909 2,744
Brokerage payables (USD million)
Due to customers 595 578
Due to banks, brokers and dealers 1,053 824
Total brokerage payables 1,648 1,402
Brokeragereceivablesandpayablesincludetransactionsinfinan-cial instruments purchased from and sold to customers, banks, brokers and dealers which have not settled as at the reporting date (excluding debt and equity securities which have not reached their settlement date as these are recognised on settlement date of the transaction), receivables and payables from the Prime Brokerage business and cash collateral from futures trading.
Includedwithinpayablesare liabilities identified in respectofeither initial margin or client money received from clients, but only
where it has been determined that the cash received represents an asset of the CSS(E)L Group. The CSS(E)L Group and Company heldUSD1,860millionofclientmoneyasat31 December2016(2015:USD 2,375million),USD 1,264millionasof31 December2016(2015:USD 1,437million)ofwhichwasnotrecordedintheConsolidated Statement of Financial Position as those balances did not represent assets of the CSS(E)L Group and Company. This cash, when recognised on the balance sheet, is recorded under ‘Cash and due from banks’ and ‘Other assets’.
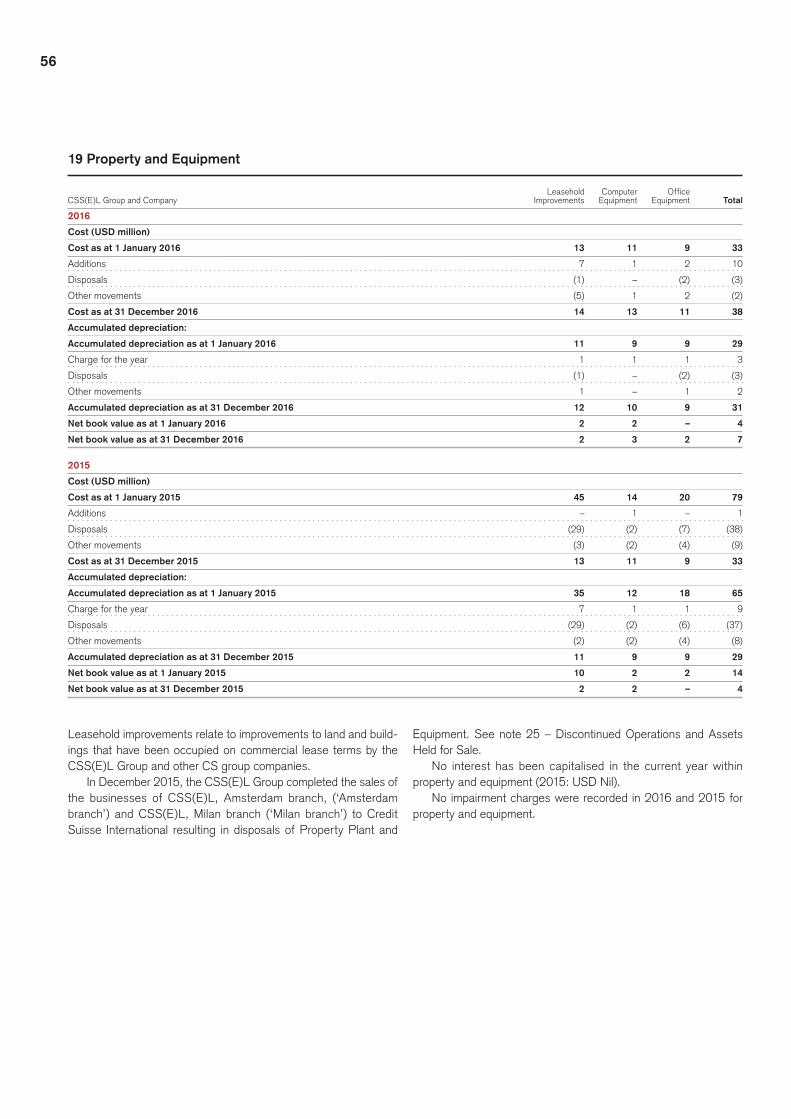
56
19 Property and Equipment
Leasehold Computer Office
CSS(E)L Group and Company Improvements Equipment Equipment Total
2016
Cost (USD million)
Cost as at 1 January 2016 13 11 9 33
Additions 7 1 2 10
Disposals (1) – (2) (3)
Other movements (5) 1 2 (2)
Cost as at 31 December 2016 14 13 11 38
Accumulated depreciation:
Accumulated depreciation as at 1 January 2016 11 9 9 29
Charge for the year 1 1 1 3
Disposals (1) – (2) (3)
Other movements 1 – 1 2
Accumulated depreciation as at 31 December 2016 12 10 9 31
Net book value as at 1 January 2016 2 2 – 4
Net book value as at 31 December 2016 2 3 2 7
2015
Cost (USD million)
Cost as at 1 January 2015 45 14 20 79
Additions – 1 – 1
Disposals (29) (2) (7) (38)
Other movements (3) (2) (4) (9)
Cost as at 31 December 2015 13 11 9 33
Accumulated depreciation:
Accumulated depreciation as at 1 January 2015 35 12 18 65
Charge for the year 7 1 1 9
Disposals (29) (2) (6) (37)
Other movements (2) (2) (4) (8)
Accumulated depreciation as at 31 December 2015 11 9 9 29
Net book value as at 1 January 2015 10 2 2 14
Net book value as at 31 December 2015 2 2 – 4
Leasehold improvements relate to improvements to land and build-ings that have been occupied on commercial lease terms by the CSS(E)L Group and other CS group companies.
In December 2015, the CSS(E)L Group completed the sales of the businesses of CSS(E)L, Amsterdam branch, (‘Amsterdam branch’) and CSS(E)L, Milan branch (‘Milan branch’) to Credit Suisse International resulting in disposals of Property Plant and
Equipment. See note 25 – Discontinued Operations and Assets Held for Sale.
No interest has been capitalised in the current year within propertyandequipment(2015:USD Nil).
No impairment charges were recorded in 2016 and 2015 for property and equipment.

57Credit Suisse Securities (Europe) Limited, Annual Report 2016
Notes to the Financial Statements for the year ended 31 December 2016
20 Intangible Assets
Internally Right to Use Developed
CSS(E)L Group and Company Leisure Facility Software Total
2016
Cost (USD million)
Cost as at 1 January 2016 4 – 4
Additions – 141 141
Disposals – (141) (141)
Cost as at 31 December 2016 4 – 4
Accumulated amortisation:
Accumulated amortisation as at 1 January 2016 3 – 3
Amortisation for the year – – –
Impairment – – –
Disposals – – –
Accumulated amortisation as at 31 December 2016 3 – 3
Net book value as at 1 January 2016 1 – 1
Net book value as at 31 December 2016 1 – 1
Net book value as at 1 January 2016
Cost (USD million)
Cost as at 1 January 2015 4 – 4
Additions – 161 161
Disposals – (161) (161)
Cost as at 31 December 2015 4 – 4
Accumulated amortisation:
Accumulated amortisation as at 1 January 2015 2 – 2
Amortisation for the year – – –
Impairment 1 – 1
Disposals – – –
Accumulated amortisation as at 31 December 2015 3 – 3
Net book value as at 1 January 2015 2 – 2
Net book value as at 31 December 2015 1 – 1
No interest has been capitalised within intangible assets (2015: USD Nil).
Impairment chargesofUSD Nil (2015:USD 1million)wasrecorded on right to use leisure facility. No impairment charges were recorded for internally developed software in 2016 and 2015. The impairment of the right to use leisure facility reduces the asset down to current market rate. This asset is held in Seoul
Branch. The assets’ fair value was calculated based on an aver-age from external price quotes and is level 2 of the fair value hierarchy. The fair value of the asset is also equal to its recover-able amount.
The internally developed software capitalised USD 141 million (2015: USD 161 million) was transferred to Credit Suisse International.
21 Deposits
CSS(E)L Group and Company 2016 2015
Deposits from banks (USD million)
Interest-bearing demand deposits 146 157
Non-interest bearing demand deposits 23 –
Time Deposits – 3
Total deposits 169 160

58
22 Short Term Borrowings
CSS(E)L Group and Company 2016 2015
Short-term borrowings (USD million)
Short term borrowings:
from banks 2,403 2,499
from customers 1,264 262
Total short term borrowings 3,667 2,761
23 Provisions
CSS(E)L Group and Company Property Litigation Total
Provisions (USD million)
Balance at 1 January 2016 1 1 2
Charges during the year – 7 7
Utilised during the year – (3) (3)
Balance at 31 December 2016 1 5 6
CSS(E)L Group and Company Property Litigation Total
Provisions (USD million)
Balance at 1 January 2015 1 1 2
Charges during the year – 7 7
Utilised during the year – (7) (7)
Balance at 31 December 2015 1 1 2
Property provisionThe property provision mainly relates to property (Hanwha Build-ing, Seoul) reinstatement obligations that will be incurred when the leases expire.
Litigation provisionThe CSS(E)L Group accrues litigation provisions (including fees and expenses of external lawyers and other service providers) in connection with certain judicial, regulatory and arbitration proceed-ings when reasonably possible losses, additional losses or ranges of loss are more likely than not and can be reasonably estimated. General Counsel in consultation with the business reviews CS
group’s judicial, regulatory and arbitration proceedings each quar-ter to determine the adequacy of its litigation provisions and may increase or release provisions based on management’s judgement and the advice of counsel. The anticipated utilisation of these liti-gation provisions typically ranges from six to eighteen month period, however certain litigation provisions are anticipated to extend beyond this period. Further provisions or releases of litiga-tion provisions may be necessary in the future as developments in such litigation, claims or proceedings warrant. The litigation provi-sion relates to legal cases that the Company is defending. The exact timingofoutflowofeconomicbenefits cannotbeascer-tained at 31 December 2016.
24 Long Term Debt
CSS(E)L Group and Company 2016 2015
Long-term debt (USD million)
Senior debt 21,261 22,918
Subordinated debt 3,501 3,501
Total long term debt 24,762 26,419
Senior DebtDuring 2010, in response to the UK liquidity requirements required by the PRA as set out in its policy statement (PS) 09/16, new
termprofileswereput inplace fromCreditSuisseAG (LondonBranch).

59Credit Suisse Securities (Europe) Limited, Annual Report 2016
Notes to the Financial Statements for the year ended 31 December 2016
Senior Debt as at December 2016 comprises:
CSS(E)L Group and Company
Outstanding as at December 2016 Counterparty Name Date of facility
EUR 2,700 million Credit Suisse AG (London Branch) 24 March 2014 400 days call loans evergreen
GBP 5,500 million Credit Suisse AG (London Branch) 24 March 2014 400 days call loans evergreen
USD 11,675 million Credit Suisse AG (London Branch) 24 March 2014 400 days call loans evergreen
Senior Debt as at December 2015 comprises:
CSS(E)L Group and Company
Outstanding as at December 2015 Counterparty Name Date of facility
USD 1,000 million Credit Suisse Investments (UK) 18 December 2013 Interest payable at 3 months USD LIBOR plus 87.5 basis points
per annum, maturing on 19 December 2016
EUR 6,050 million Credit Suisse AG (London Branch) 24 March 2014 400 days call loans evergreen
GBP 4,000 million Credit Suisse AG (London Branch) 24 March 2014 400 days call loans evergreen
USD 9,375 million Credit Suisse AG (London Branch) 24 March 2014 400 days call loans evergreen
During 2016, USD 1,000 million of long term senior unsecured funding from Credit Suisse Investment (UK) was repaid. In 2016, the currency composition of the 400 day evergreen funding changedduetocurrencyspecificrequirementsresultinginfurtherissuance of evergreen call loans, denominated in USD and GBP and repayment of such loans, denominated in Euro.
Subordinated DebtAt 31 December 2016 subordinated debt comprises an amount of USD 3,501 million (2015: USD 3,501 million). This comprised of USD 1,251 million (2015: USD 1,251 million) advanced by Credit Suisse PSL GmbH and USD 2,250 million (2015: 2,250 million) advanced by Credit Suisse Investment UK Limited.
On 15 April 2014 as part of restructuring of subordinated debt Company borrowed USD 1,500 million from Credit Suisse Investment UK Limited. Interest on subordinated debt is payable at a rate of 3 months LIBOR plus 342 basis points per annum.
Under the terms of the loan, the Company may repay, in whole or in part, any amounts outstanding upon giving prior written notice to the lender and PRA. The earliest date at which the Company may make a repayment is 15 April 2019. The maturity of the loan is 15 April 2026. In addition to this Company borrowed addi-tional USD 750 million under the subordinated loan facility dated 14th April 2014. The maturity of additional loan is 29 December 2025.
On 29 October 2010, USD 1,000 million was advanced by CS PSL GmbH, under a subordinated loan facility agreement for USD 1,500 million dated 29 October 2010. Interest on subordinated debt is payable at a rate of 3 months LIBOR plus 545 basis points per annum. The Company borrowed a further USD 500 million under this facility on 15 December 2010. Interest on subordinated debt of USD 500 million is payable at a rate of 3 months LIBOR plus 695 basis points per annum. During the year 2015, USD 250 million was early repaid.
25 Discontinued Operations and Assets Held for Sale
In 2016 the Systematic Market Making (‘SMM’) business was sub-stantially closed, there remains a small section of the business that is closing in early 2017. The assets and liabilities were and will be closed out and these represent equity securities and listed derivative positions. The market making activities of the SMM business are short dated and traded over short periods of time. In 2016 CSS(E)L Group has closed out USD 2,441 million of assets and cash inflow relating to operational activities for 2016 was USD 126 million. None of the net profit or loss in relation to this business is attribut-able to non-controlling interest.
The CSS(E)L Group has committed to sell its Prime Services platform to Credit Suisse AG (acting through its Dublin Branch). During 2016 USD 7,268 million of assets and USD 8,074 million liabilities have been transferred, the transfer will continue through 2017. During 2016 CSS(E)L Group revised the transaction structure due to regulatory reasons and a portion of the assets andliabilitiesidentifiedformigrationtoCreditSuisseAG(acting
through its Dublin Branch) will now move to another CS group entity. Although the migration to another CS group entity requires infrastructure development the CSS(E)L Group remains commit-ted to the transactions and this part of the transfer is expected to commence in and be substantially complete by 2018. Cash inflowrelatingto investmentandoutflowsforoperationalactivi-ties in 2016 were USD Nil and USD 9,528 million respectively. Noneofthenetprofitorlossinrelationtothisbusinessisattrib-utable to non-controlling interest. In September 2015, CSS(E)L Group sold its investment banking business (including client relationships) to CSi, and adjusted capital contribution in 2015 by USD 207 million being the cash proceeds of the sale. No assets or liabilities were transferred as part of the transaction, and these will be unwound in the CSS(E)L Group. Detailsof theprofitand loss in relation to thebusinessarepro-videdinthetablebelow.CashinflowsrelatingtoinvestmentandoutflowsforoperationalactivitieswereUSDNil(2015:USD207
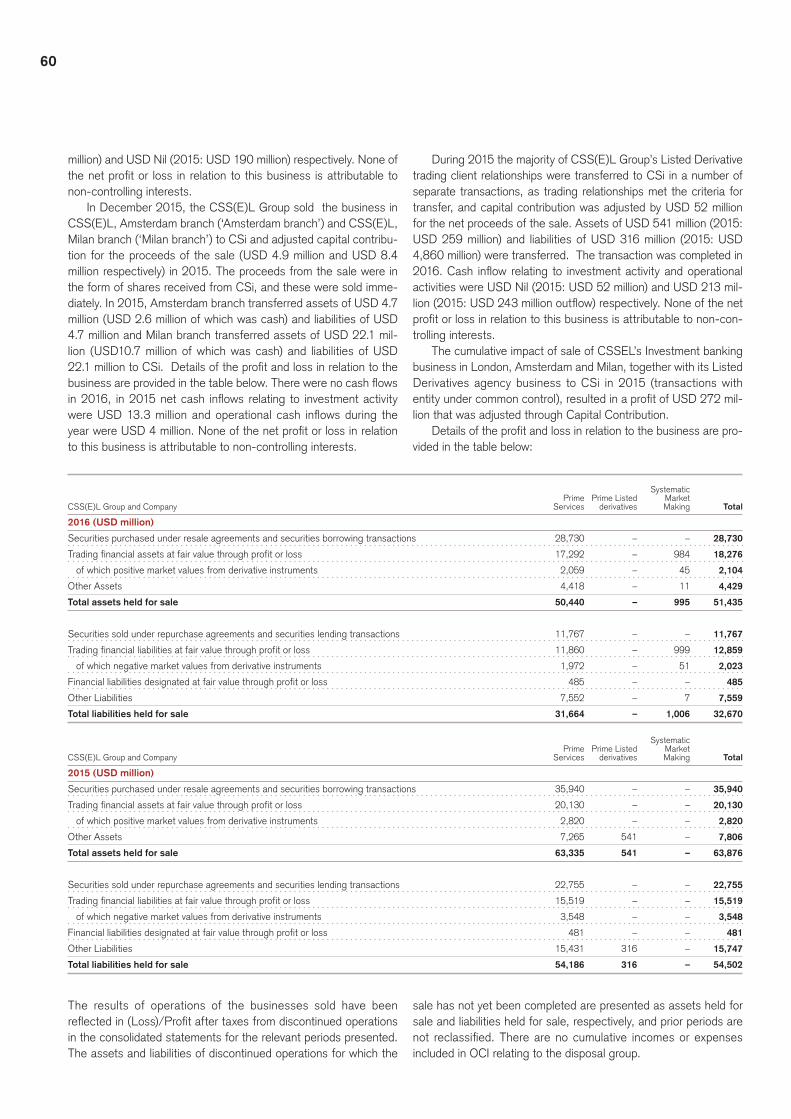
60
million) and USD Nil (2015: USD 190 million) respectively. None of thenetprofitor loss inrelationtothisbusiness isattributabletonon-controlling interests.
In December 2015, the CSS(E)L Group sold the business in CSS(E)L, Amsterdam branch (‘Amsterdam branch’) and CSS(E)L, Milan branch (‘Milan branch’) to CSi and adjusted capital contribu-tion for the proceeds of the sale (USD 4.9 million and USD 8.4 million respectively) in 2015. The proceeds from the sale were in the form of shares received from CSi, and these were sold imme-diately. In 2015, Amsterdam branch transferred assets of USD 4.7 million (USD 2.6 million of which was cash) and liabilities of USD 4.7 million and Milan branch transferred assets of USD 22.1 mil-lion (USD10.7 million of which was cash) and liabilities of USD 22.1milliontoCSi.Detailsoftheprofitandlossinrelationtothebusinessareprovidedinthetablebelow.Therewerenocashflowsin2016, in2015netcash inflows relating to investmentactivitywereUSD13.3millionandoperational cash inflowsduring theyearwereUSD4million.Noneofthenetprofitorlossinrelationto this business is attributable to non-controlling interests.
During 2015 the majority of CSS(E)L Group’s Listed Derivative trading client relationships were transferred to CSi in a number of separate transactions, as trading relationships met the criteria for transfer, and capital contribution was adjusted by USD 52 million for the net proceeds of the sale. Assets of USD 541 million (2015: USD 259 million) and liabilities of USD 316 million (2015: USD 4,860 million) were transferred. The transaction was completed in 2016.Cash inflowrelating to investmentactivityandoperationalactivities were USD Nil (2015: USD 52 million) and USD 213 mil-lion(2015:USD243millionoutflow)respectively.Noneofthenetprofitorlossinrelationtothisbusinessisattributabletonon-con-trolling interests.
The cumulative impact of sale of CSSEL’s Investment banking business in London, Amsterdam and Milan, together with its Listed Derivatives agency business to CSi in 2015 (transactions with entityundercommoncontrol),resultedinaprofitofUSD272mil-lion that was adjusted through Capital Contribution.
Details of the profit and loss in relation to the business are pro-vided in the table below:
Systematic Prime Prime Listed Market
CSS(E)L Group and Company Services derivatives Making Total
2016 (USD million)
Securities purchased under resale agreements and securities borrowing transactions 28,730 – – 28,730
Trading financial assets at fair value through profit or loss 17,292 – 984 18,276
ofwhichpositivemarketvaluesfromderivativeinstruments 2,059 – 45 2,104
Other Assets 4,418 – 11 4,429
Total assets held for sale 50,440 – 995 51,435
Securities sold under repurchase agreements and securities lending transactions 11,767 – – 11,767
Trading financial liabilities at fair value through profit or loss 11,860 – 999 12,859
ofwhichnegativemarketvaluesfromderivativeinstruments 1,972 – 51 2,023
Financial liabilities designated at fair value through profit or loss 485 – – 485
Other Liabilities 7,552 – 7 7,559
Total liabilities held for sale 31,664 – 1,006 32,670
Systematic Prime Prime Listed Market
CSS(E)L Group and Company Services derivatives Making Total
2015 (USD million)
Securities purchased under resale agreements and securities borrowing transactions 35,940 – – 35,940
Trading financial assets at fair value through profit or loss 20,130 – – 20,130
ofwhichpositivemarketvaluesfromderivativeinstruments 2,820 – – 2,820
Other Assets 7,265 541 – 7,806
Total assets held for sale 63,335 541 – 63,876
Securities sold under repurchase agreements and securities lending transactions 22,755 – – 22,755
Trading financial liabilities at fair value through profit or loss 15,519 – – 15,519
ofwhichnegativemarketvaluesfromderivativeinstruments 3,548 – – 3,548
Financial liabilities designated at fair value through profit or loss 481 – – 481
Other Liabilities 15,431 316 – 15,747
Total liabilities held for sale 54,186 316 – 54,502
The results of operations of the businesses sold have been reflectedin(Loss)/Profitaftertaxesfromdiscontinuedoperationsin the consolidated statements for the relevant periods presented. The assets and liabilities of discontinued operations for which the
sale has not yet been completed are presented as assets held for sale and liabilities held for sale, respectively, and prior periods are not reclassified.Therearenocumulative incomesorexpensesincluded in OCI relating to the disposal group.

61Credit Suisse Securities (Europe) Limited, Annual Report 2016
Notes to the Financial Statements for the year ended 31 December 2016
The presentation of assets and liabilities held for sale required the separation of certain assets and liabilities that were previously treated as a single unit of account into disaggregated asset and lia-bility positions. This resulted in an increase of USD 2,400 million (2015: USD 3,200 million) in Total assets and Total liabilities in the
Consolidated Statement of Financial Position (Total assets increased from USD 116,553 million (2015: USD 140,375 million) to USD 118,953 million (2015: USD 143,542 million) and Total liabilities increased from USD 108,424 million (2015: USD 132,400 million) to USD 110,824 million (2015: USD 135,568 million).
IBD IBD Systematic Prime Investment Amsterdam Milan Prime Listed Market
CSS(E)L Group and Company Services Banking Branch Branch Derivatives Making Total
2016 (USD million)
Interest income 835 – – – 6 – 841
Interest expense (987) – – – (6) (21) (1,014)
Net interest expense (152) – – – – (21) (173)
Commission and fee income 76 1 – – 6 – 83
Commission and fee expense (85) (3) – – – – (88)
Net commission and fee income/(expense) (9) (2) – – 6 – (5)
Net gains from financial assets/liabilities at FV through profit or loss 639 – – – 8 162 809
Other revenues/(expenses) (4) 11 – 1 – (11) (3)
Net revenues 474 9 – 1 14 130 628
Compensation and benefits (46) 6 – 3 (1) (52) (90)
General and administrative expenses (286) (13) – – (25) (98) (422)
Total Operating expense (332) (7) – 3 (26) (150) (512)
Profit/(Loss) before tax 142 2 – 4 (12) (20) 116
Income tax (43) – – – – – (43)
Net Income/(Loss) 99 2 – 4 (12) (20) 73
2015 (USD million)
Interest income 871 – – – 32 – 903
Interest expense (953) (2) – – (15) (11) (981)
Net interest income/(expense) (82) (2) – – 17 (11) (78)
Commission and fee income 136 203 – 3 27 1 370
Commission and fee expense (111) (5) – – – (1) (117)
Net commission and fee income 25 198 – 3 27 – 253
Net gains/(losses) from financial assets/liabilities at FV through profit or loss 544 (1) – (1) (1) 293 834
Other revenues/(expenses) 24 (34) 7 14 – 8 19
Net revenues 511 161 7 16 43 290 1,028
Compensation and benefits (58) (182) (5) (12) (13) (109) (379)
General and administrative expenses (294) (172) (1) (3) (62) (109) (641)
Total Operating expense (352) (354) (6) (15) (75) (218) (1,020)
Profit/(Loss) before tax 159 (193) 1 1 (32) 72 8
Income tax – – (2) (1) – – (3)
Net Income/(Loss) 159 (193) (1) – (32) 72 5
The above table does not present a gain or loss recognised on the measurement to fair value less costs to sell or on the disposal of the assets or disposal groups constituting the discontinued operation. This is because the disposal group does not contain assets or liabil-ities that are measured at the lower of the carrying amount or fair
value less cost to sell. The proceeds of the sales of the businesses are recorded as an adjustment to Capital Contribution, rather than in profit or loss due to the two parties being under common control.

62
26 Accumulated Other Comprehensive Income
Unrealised gains/ Gains/ Unrealised (losses) Accum- (losses) on gain/(loss) Cumulative on financial ulated other cash flow on Pension translation assets avail- comprehen-
CSS(E)L Group and Company hedges Fund adjustment able for sale sive income
2016
Accumulated other comprehensive income (USD million)
Balance at 1 January 2016 (6) 113 (343) 25 (211)
Increase/(decrease):
Foreign exchange translation differences – – (17) – (17)
Cash flow hedges – effective portion of changes in fair value – – – – –
Cash flow hedges – reclassified to income statement 6 – – – 6
Net gain on hedges of net investments in foreign entities taken to equity – – 10 – 10
Re-measurement of defined benefit liability/(asset) – 184 1 – – 184
Balance at 31 December 2016 – 297 (350) 25 (28)
2015
Accumulated other comprehensive income (USD million)
Balance at 1 January 2015 (39) 120 (325) 25 (219)
Increase/(decrease):
Foreign exchange translation differences – – (40) – (40)
Cash flow hedges – effective portion of changes in fair value (13) – – – (13)
Cash flow hedges – reclassified to income statement 46 – – – 46
Net gain on hedges of net investments in foreign entities taken to equity – – 22 – 22
Re-measurement of defined benefit liability/(asset) – (7) – – (7)
Balance at 31 December 2015 (6) 113 (343) 25 (211)
1 Disclosed net of tax
27 Share Capital and Share Premium
CSS(E)L Group and Company 2016 2015
Share Capital (USD million)
Opening balance 3,859 3,859
38,593,205,057 ordinary voting shares of USD 0.10 each 3,859 3,859
Total called-up share capital 3,859 3,859
Share Premium (USD million)
Share Premium 5,661 5,661
Total share premium 5,661 5,661
The ordinary shares have attached to them full voting, dividend and capital distribution (including on winding up) rights.

63Credit Suisse Securities (Europe) Limited, Annual Report 2016
Notes to the Financial Statements for the year ended 31 December 2016
28 Retirement Benefit Obligations
The Company has several pension schemes covering substantially allemployees,includingdefinedbenefitpensionplansanddefinedcontribution pension plans, mainly located in the UK but also in other European and Asian locations. The most material pension arrangement isoperated in theUK,whereafunded,finalsalarydefinedbenefitplanisoperated.Theassetsofthisplanareheldindependently of the Company’s assets in separate trustee admin-istered funds. Responsibility for governance and running of the UK Plan, including investment decisions (after consultation with the Company) and contribution schedules (which requires the agree-ment of the Company) lies with the board of trustees. The UK plan is closed to futuredefinedbenefitaccrualhoweverpast servicebenefitsforactivemembersarestill linkedtopensionablesalary.Smallerdefinedbenefitplansareoperatedelsewhere,consistingof unfunded plans in Germany and France and a funded plan in Korea. A full actuarial valuation is completed by independent actu-aries, for these schemes once a year using the projected unit credit method and updated for each Consolidated Statement of Financial Position date. The Company does not contribute to any otherpost-retirementdefinedbenefitplans.
Profile of the pension plansApproximately 10% of the UK plan’s final salary liabilities are attrib-utable to current employees, 73% to former employees yet to retire and 17% to current pensioners and dependants. The liabilities of the other plans in aggregate are broadly split 30% to current employees, 66% to former employees yet to retire and 4% to current pensioners and dependents. The UK plan duration is an indicator of the weight-ed-average time until benefits payments are made.
For the UK plan as a whole the duration is around 25 years reflecting the approximate split of the defined benefit obligation between current employees (duration of 28 years), deferred members (duration of 26 years) and current pensioners (duration of 16 years).
The following disclosures contain the balances for the entire defined benefit plans, including the plan sponsored by the Company in the UK, of which the Company is one of many par-ticipants, who are all related parties under common control. The Company has no contractual agreement or stated policy for chargingthenetdefinedbenefitcosttotheparticipatingentities,therefore as the legal sponsor, the Company accounts for the entireplanusingdefinedbenefitaccounting.
All expensesarising from retirementbenefitobligationsarerecorded in the Consolidated Statement of Income under ‘Com-pensationandbenefits’.
Defined benefit pension and other post-retirement defined benefit plans
UK International
CSS(E)L Group and Company 2016 2015 2016 2015
Defined benefit pension and other post-retirement defined benefit plans (USD million)
Operating Cost
Current service costs on benefit obligation 5 5 2 3
Administrative expense 2 2 – –
Financing Cost
Net Interest (credits)/costs (30) (30) 1 1
Total periodic pension (credits)/costs (23) (23) 3 4

64
Thefollowingtableshowsthechangesinthedefinedbenefitobligationandthefairvalueofplanassetsduring2016and2015,andtheamountsincludedintheConsolidatedStatementofFinancialPositionfortheCompany’sdefinedbenefitpensionandotherpost-re-tirementdefinedbenefitplansasat31 December2016and2015respectively:
UK International
CSS(E)L Group and Company 2016 2015 2016 2015
Defined benefit pension and other post-retirement defined benefit plans (USD million)
Defined benefit obligation – 1 January 1,745 1,876 65 67
Current service cost 5 5 2 3
Interest cost 61 68 1 1
Actuarial (gains)/losses on assumptions 444 (60) 8 (2)
arisingoutofchangesindemographicassumptions (17) 6 – –
arisingoutofchangesinfinancialassumptions 461 (66) 8 (2)
Actuarial (gains)/losses – experience (15) (1) – –
Benefit payments (70) (55) (1) –
Special termination benefits – – 1 2
Exchange rate (gains)/losses (301) (88) (2) (6)
Defined benefit obligation – 31 December 1,869 1,745 74 65
Fair value of plan assets – 1 January 2,578 2,704 10 9
Interest on plan assets 91 98 – –
Actuarial gains/(losses) on plan assets 683 (49) – –
Actual return on plan assets 774 49 – –
Employer contributions 9 9 2 1
Administrative expense (2) (2) – –
Benefit payments (70) (55) – –
Exchange rate (losses)/gains (448) (127) (1) –
Fair value of plan assets – 31 December 2,841 2,578 11 10
Total funded status – 31 December
Plan assets 2,841 2,578 11 10
Defined benefit obligation related to funded plans (1,869) (1,745) (13) (11)
Funded status for funded plans 972 833 (2) (1)
Defined benefit obligation related to non-funded plans – – (61) (54)
Funded status recognised – 31 December 972 833 (63) (55)
Funding requirementsUK legislation requires that pension schemes are funded pru-dently. The last funding valuation of the UK plan was carried out by aqualifiedactuaryasat31December2014andshowedasurplusof GBP 39.1 million. The next funding valuation will be as at 31 December 2017.
For additional Pension Fund security, the Company has pledged securities of GBP 247 million as at 31 December 2016. These securities are included in the balances in Note 36 (Assets Pledged or Assigned). At 31 December 2016 and 2015 the pen-sion fund plan assets hold no material amounts of CSS(E)L Group debt and equity securities.
Movement in the Pension Asset/Liability recognised in the Consolidated Statement of Financial Position:
UK International
CSS(E)L Group and Company (USD million) 2016 2015 2016 2015
At 1 January 833 828 (55) (58)
Total amount recognised in profit and loss and OCI (charge)/credit 277 35 (11) (2)
Other economic events – – – (2)
Contributions paid 9 9 2 1
Gains/(Losses) due to changes in exchange rates (147) (39) 1 6
At 31 December 972 833 (63) (55)

65Credit Suisse Securities (Europe) Limited, Annual Report 2016
Notes to the Financial Statements for the year ended 31 December 2016
The Company recognises the surplus in the UK pension plan in accordance with the requirements of IFRIC 14. The trustees of the UK plan do not have the unilateral right to commence wind-up of the scheme. Thus, the Company assumes that the scheme continuesinexistenceuntilthelastbenefitpaymentsaremadeto
members, at which point any residual assets are returned to the employer in line with the rules of the scheme. The Company will review the IASB’s amendments to IFRIC 14 and how it will affect itsabilitytoreceivearefundofsurplusoncefinalised.
AssumptionsTheassumptionsusedinthemeasurementofthebenefitobligationandnetperiodicpensioncostforthemaindefinedbenefitpensionplanasat31 Decemberwereasfollows:
UK International
CSS(E)L Group and Company (31 December in %) 2016 2015 2016 2015
Benefit obligation
Discount rate 2.65% 3.90% 1.80% 2.50%
Retail Price Inflation 3.15% 3.10% – –
Consumer Price Inflation 2.05% 2.00% 1.80% 1.80%
Pension increases 1 3.00% 3.04% 1.50% 1.50%
Salary increases 3.30% 3.25% 3.50% 3.60%
Net periodic pension cost
Discount rate 3.90% 3.70% 2.50% 2.50%
Salary increases 3.25% 4.25% 3.60% 3.80%
1 Pension earned pre 6 April 1997 are subject to pension increases on a discretionary basis, which are considered to be nil.
Mortality AssumptionsThe life expectancy assumptions for 2016 have been updated from those used for 2015.
Theassumptionsforlifeexpectancyforthe2016UKbenefitobligation pursuant to IAS 19 are based on the ‘SAPS 2 light’
base table with improvements in mortality in line with the proposed new CMI model with core assumptions calibrated to end of 2015 as published in working paper 91, and a scaling factor of 95%. Underpins to future mortality improvement have also been incorpo-rated, the annual long term rate of improvement being 1.50% p.a.
On this basis the post-retirement mortality assumptions are as follows:
2016 2015
Life expectancy at age 60 for current pensioners aged 60 (years)
Males 28.8 28.9
Females 29.9 30.1
Life expectancy at age 60 for future pensioners currently aged 40 (years)
Males 30.5 31.2
Females 31.7 32.5
Sensitivity AnalysisChangesintheprincipalassumptionsusedtomeasurethebenefitobligationandtotalperiodicpensioncostwouldhavehadthefollowingeffects:
UK International
DBO Increase DBO Decrease DBO Increase DBO Decrease (USD million) % (USD million) % (USD million) % (USD million) %
Benefit obligation
One-percentage point change
-1% / +1% Discount rate 2,382 27% 1,472 (21%) 90 23% 61 (17%)
+1% / -1% Inflation rate 2,185 17% 1,598 (14%) 81 11% 68 (8%)
+1% / -1% Salary increases rate 1,878 – 1,860 – 76 4% 70 (5%)
+1 / -1 year to life expectancy at 60 1,906 2% 1,831 (2%) 76 3% 71 (3%)
The sensitivity analysis above has been derived using a number of additional full valuation runs that have been carried out using the samedataas thatusedforcalculating the2016definedbenefitobligation. The sensitivity analysis focuses on changes to the
obligation.Forthesensitivitiestodiscountrateandinflationratesthe impact on the UK funded status will most likely be lower to the impacton thebenefitobligation,asa resultof theassetsbeing(partially) matched to the obligations.
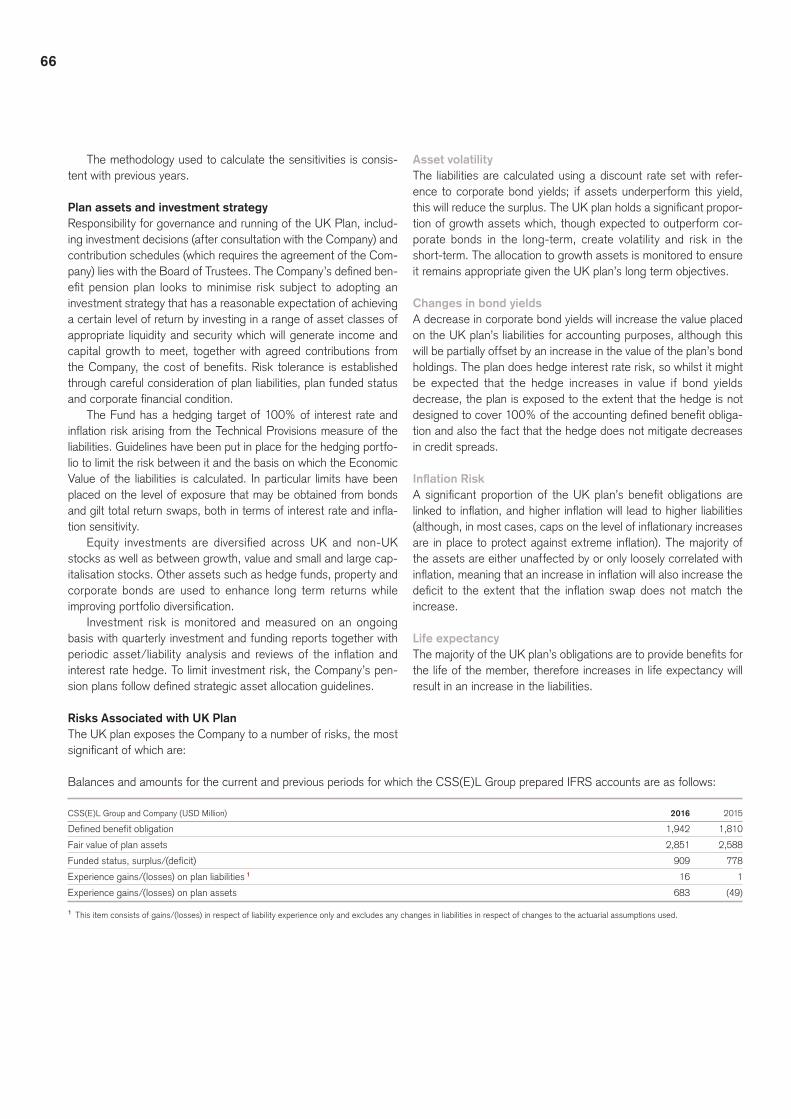
66
The methodology used to calculate the sensitivities is consis-tent with previous years.
Plan assets and investment strategyResponsibility for governance and running of the UK Plan, includ-ing investment decisions (after consultation with the Company) and contribution schedules (which requires the agreement of the Com-pany)lieswiththeBoardofTrustees.TheCompany’sdefinedben-efitpensionplan looks tominimise risk subject to adoptinganinvestment strategy that has a reasonable expectation of achieving a certain level of return by investing in a range of asset classes of appropriate liquidity and security which will generate income and capital growth to meet, together with agreed contributions from theCompany, thecostofbenefits.Risk tolerance isestablishedthrough careful consideration of plan liabilities, plan funded status andcorporatefinancialcondition.
The Fund has a hedging target of 100% of interest rate and inflation risk arising from the Technical Provisions measure of the liabilities. Guidelines have been put in place for the hedging portfo-lio to limit the risk between it and the basis on which the Economic Value of the liabilities is calculated. In particular limits have been placed on the level of exposure that may be obtained from bonds and gilt total return swaps, both in terms of interest rate and infla-tion sensitivity.
Equity investments are diversified across UK and non-UKstocks as well as between growth, value and small and large cap-italisation stocks. Other assets such as hedge funds, property and corporate bonds are used to enhance long term returns while improvingportfoliodiversification.
Investment risk is monitored and measured on an ongoing basis with quarterly investment and funding reports together with periodic asset/liability analysis and reviewsof the inflationandinterest rate hedge. To limit investment risk, the Company’s pen-sionplansfollowdefinedstrategicassetallocationguidelines.
Risks Associated with UK PlanThe UK plan exposes the Company to a number of risks, the most significantofwhichare:
Asset volatilityThe liabilities are calculated using a discount rate set with refer-ence to corporate bond yields; if assets underperform this yield, thiswillreducethesurplus.TheUKplanholdsasignificantpropor-tion of growth assets which, though expected to outperform cor-porate bonds in the long-term, create volatility and risk in the short-term. The allocation to growth assets is monitored to ensure it remains appropriate given the UK plan’s long term objectives.
Changes in bond yieldsA decrease in corporate bond yields will increase the value placed on the UK plan’s liabilities for accounting purposes, although this will be partially offset by an increase in the value of the plan’s bond holdings. The plan does hedge interest rate risk, so whilst it might be expected that the hedge increases in value if bond yields decrease, the plan is exposed to the extent that the hedge is not designedtocover100%oftheaccountingdefinedbenefitobliga-tion and also the fact that the hedge does not mitigate decreases in credit spreads.
Inflation RiskAsignificantproportionof theUKplan’sbenefitobligationsarelinkedtoinflation,andhigherinflationwill leadtohigherliabilities(although,inmostcases,capsonthelevelofinflationaryincreasesare inplacetoprotectagainstextremeinflation).Themajorityofthe assets are either unaffected by or only loosely correlated with inflation,meaningthatanincreaseininflationwillalsoincreasethedeficit to theextent that the inflationswapdoesnotmatch theincrease.
Life expectancyThemajorityoftheUKplan’sobligationsaretoprovidebenefitsforthe life of the member, therefore increases in life expectancy will result in an increase in the liabilities.
Balances and amounts for the current and previous periods for which the CSS(E)L Group prepared IFRS accounts are as follows:
CSS(E)L Group and Company (USD Million) 2016 2015
Defined benefit obligation 1,942 1,810
Fair value of plan assets 2,851 2,588
Funded status, surplus/(deficit) 909 778
Experience gains/(losses) on plan liabilities 1 16 1
Experience gains/(losses) on plan assets 683 (49)
1 This item consists of gains/(losses) in respect of liability experience only and excludes any changes in liabilities in respect of changes to the actuarial assumptions used.
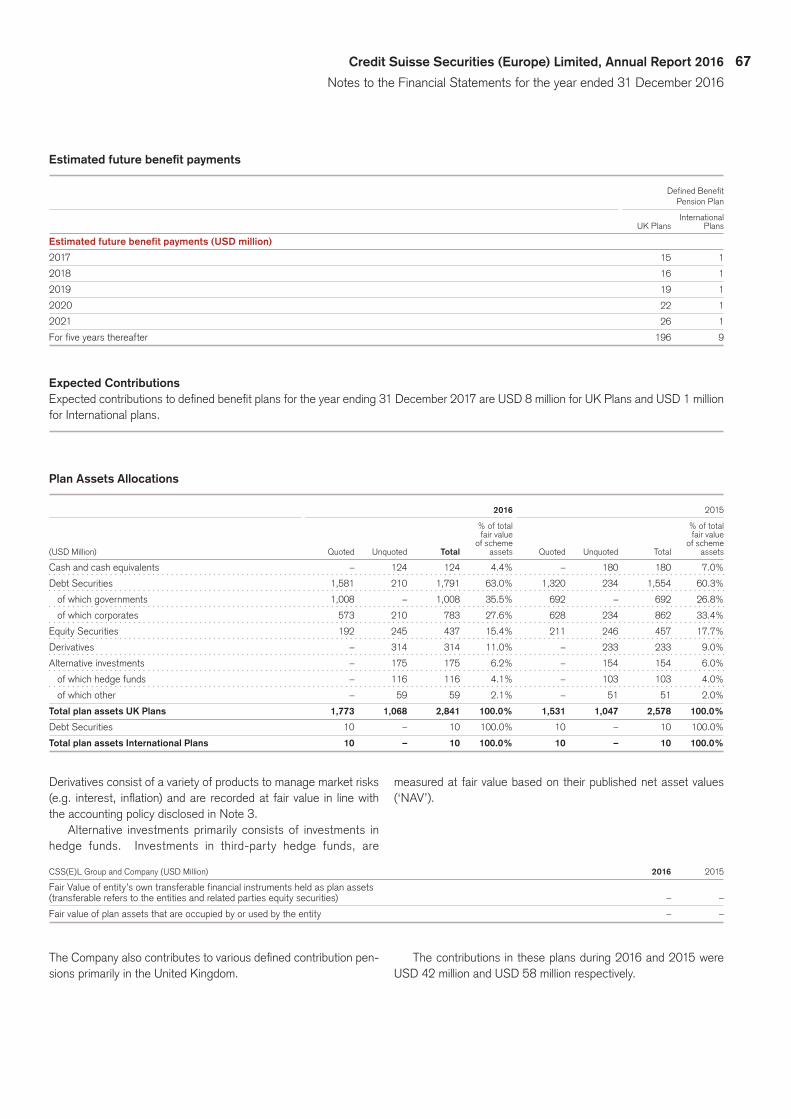
67Credit Suisse Securities (Europe) Limited, Annual Report 2016
Notes to the Financial Statements for the year ended 31 December 2016
Estimated future benefit payments
Defined Benefit Pension Plan
International UK Plans Plans
Estimated future benefit payments (USD million)
2017 15 1
2018 16 1
2019 19 1
2020 22 1
2021 26 1
For five years thereafter 196 9
Expected ContributionsExpectedcontributionstodefinedbenefitplansfortheyearending31 December2017areUSD 8millionforUKPlansandUSD 1 millionfor International plans.
Plan Assets Allocations
2016 2015
% of total % of total fair value fair value of scheme of scheme
(USD Million) Quoted Unquoted Total assets Quoted Unquoted Total assets
Cash and cash equivalents – 124 124 4.4% – 180 180 7.0%
Debt Securities 1,581 210 1,791 63.0% 1,320 234 1,554 60.3%
ofwhichgovernments 1,008 – 1,008 35.5% 692 – 692 26.8%
ofwhichcorporates 573 210 783 27.6% 628 234 862 33.4%
Equity Securities 192 245 437 15.4% 211 246 457 17.7%
Derivatives – 314 314 11.0% – 233 233 9.0%
Alternative investments – 175 175 6.2% – 154 154 6.0%
ofwhichhedgefunds – 116 116 4.1% – 103 103 4.0%
ofwhichother – 59 59 2.1% – 51 51 2.0%
Total plan assets UK Plans 1,773 1,068 2,841 100.0% 1,531 1,047 2,578 100.0%
Debt Securities 10 – 10 100.0% 10 – 10 100.0%
Total plan assets International Plans 10 – 10 100.0% 10 – 10 100.0%
Derivatives consist of a variety of products to manage market risks (e.g. interest, inflation)andarerecordedat fairvalue in linewiththe accounting policy disclosed in Note 3.
Alternative investments primarily consists of investments in hedge funds. Investments in third-party hedge funds, are
measured at fair value based on their published net asset values (‘NAV’).
CSS(E)L Group and Company (USD Million) 2016 2015
Fair Value of entity’s own transferable financial instruments held as plan assets
(transferable refers to the entities and related parties equity securities) – –
Fair value of plan assets that are occupied by or used by the entity – –
TheCompanyalsocontributestovariousdefinedcontributionpen-sions primarily in the United Kingdom.
The contributions in these plans during 2016 and 2015 were USD 42millionandUSD 58millionrespectively.
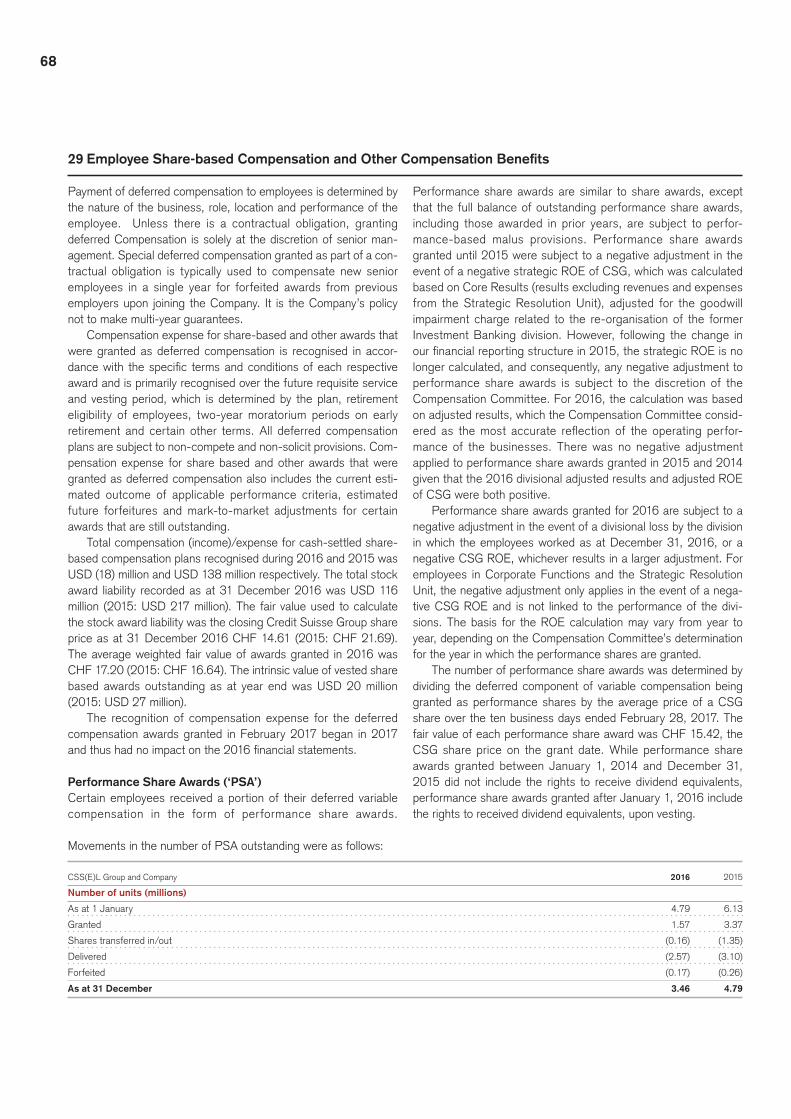
68
29 Employee Share-based Compensation and Other Compensation Benefits
Payment of deferred compensation to employees is determined by the nature of the business, role, location and performance of the employee. Unless there is a contractual obligation, granting deferred Compensation is solely at the discretion of senior man-agement. Special deferred compensation granted as part of a con-tractual obligation is typically used to compensate new senior employees in a single year for forfeited awards from previous employers upon joining the Company. It is the Company’s policy not to make multi-year guarantees.
Compensation expense for share-based and other awards that were granted as deferred compensation is recognised in accor-dancewith thespecific termsandconditionsofeach respectiveaward and is primarily recognised over the future requisite service and vesting period, which is determined by the plan, retirement eligibility of employees, two-year moratorium periods on early retirement and certain other terms. All deferred compensation plans are subject to non-compete and non-solicit provisions. Com-pensation expense for share based and other awards that were granted as deferred compensation also includes the current esti-mated outcome of applicable performance criteria, estimated future forfeitures and mark-to-market adjustments for certain awards that are still outstanding.
Total compensation (income)/expense for cash-settled share-based compensation plans recognised during 2016 and 2015 was USD (18) million and USD 138 million respectively. The total stock award liability recorded as at 31 December 2016 was USD 116 million (2015: USD 217 million). The fair value used to calculate the stock award liability was the closing Credit Suisse Group share price as at 31 December 2016 CHF 14.61 (2015: CHF 21.69). The average weighted fair value of awards granted in 2016 was CHF 17.20 (2015: CHF 16.64). The intrinsic value of vested share based awards outstanding as at year end was USD 20 million (2015: USD 27 million).
The recognition of compensation expense for the deferred compensation awards granted in February 2017 began in 2017 andthushadnoimpactonthe2016financialstatements.
Performance Share Awards (‘PSA’)Certain employees received a portion of their deferred variable compensation in the form of performance share awards.
Performance share awards are similar to share awards, except that the full balance of outstanding performance share awards, including those awarded in prior years, are subject to perfor-mance-based malus provisions. Performance share awards granted until 2015 were subject to a negative adjustment in the event of a negative strategic ROE of CSG, which was calculated based on Core Results (results excluding revenues and expenses from the Strategic Resolution Unit), adjusted for the goodwill impairment charge related to the re-organisation of the former Investment Banking division. However, following the change in ourfinancialreportingstructurein2015,thestrategicROEisnolonger calculated, and consequently, any negative adjustment to performance share awards is subject to the discretion of the Compensation Committee. For 2016, the calculation was based on adjusted results, which the Compensation Committee consid-ered as themost accurate reflection of the operating perfor-mance of the businesses. There was no negative adjustment applied to performance share awards granted in 2015 and 2014 given that the 2016 divisional adjusted results and adjusted ROE of CSG were both positive.
Performance share awards granted for 2016 are subject to a negative adjustment in the event of a divisional loss by the division in which the employees worked as at December 31, 2016, or a negative CSG ROE, whichever results in a larger adjustment. For employees in Corporate Functions and the Strategic Resolution Unit, the negative adjustment only applies in the event of a nega-tive CSG ROE and is not linked to the performance of the divi-sions. The basis for the ROE calculation may vary from year to year, depending on the Compensation Committee’s determination for the year in which the performance shares are granted.
The number of performance share awards was determined by dividing the deferred component of variable compensation being granted as performance shares by the average price of a CSG share over the ten business days ended February 28, 2017. The fair value of each performance share award was CHF 15.42, the CSG share price on the grant date. While performance share awards granted between January 1, 2014 and December 31, 2015 did not include the rights to receive dividend equivalents, performance share awards granted after January 1, 2016 include the rights to received dividend equivalents, upon vesting.
Movements in the number of PSA outstanding were as follows:
CSS(E)L Group and Company 2016 2015
Number of units (millions)
As at 1 January 4.79 6.13
Granted 1.57 3.37
Shares transferred in/out (0.16) (1.35)
Delivered (2.57) (3.10)
Forfeited (0.17) (0.26)
As at 31 December 3.46 4.79
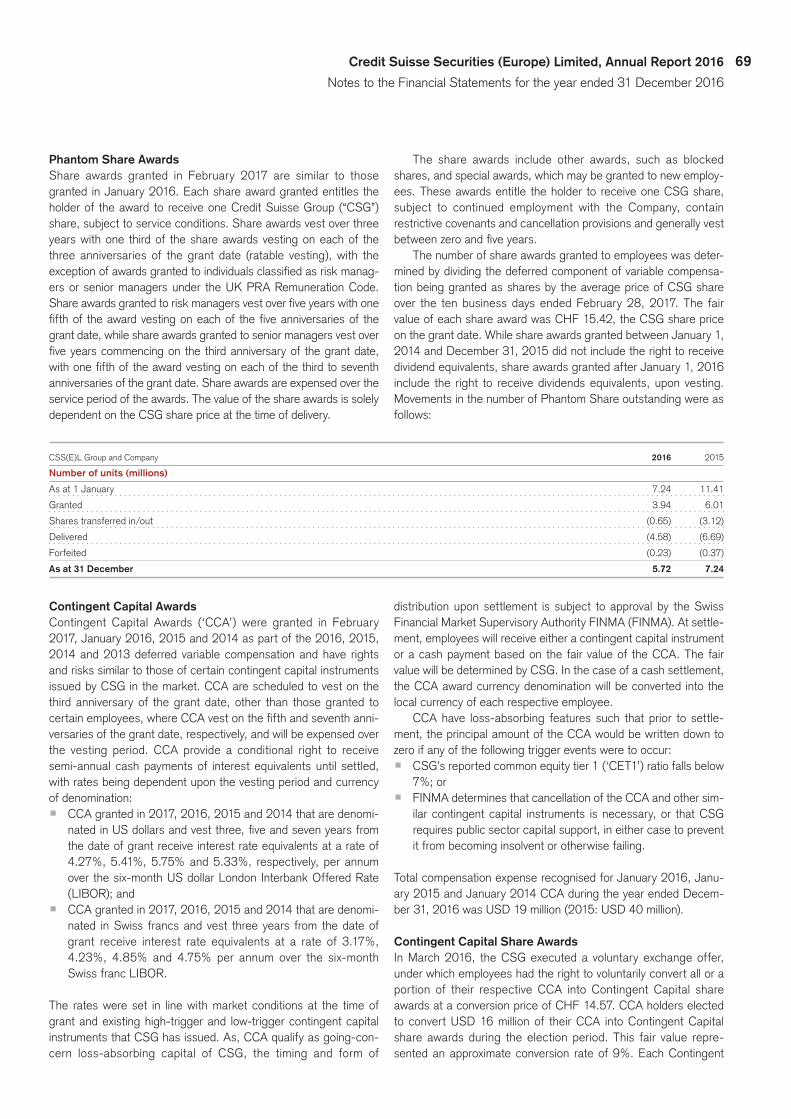
69Credit Suisse Securities (Europe) Limited, Annual Report 2016
Notes to the Financial Statements for the year ended 31 December 2016
Phantom Share AwardsShare awards granted in February 2017 are similar to those granted in January 2016. Each share award granted entitles the holder of the award to receive one Credit Suisse Group (“CSG”) share, subject to service conditions. Share awards vest over three years with one third of the share awards vesting on each of the three anniversaries of the grant date (ratable vesting), with the exception of awards granted to individuals classified as risk manag-ers or senior managers under the UK PRA Remuneration Code. Share awards granted to risk managers vest over five years with one fifth of the award vesting on each of the five anniversaries of the grant date, while share awards granted to senior managers vest over five years commencing on the third anniversary of the grant date, with one fifth of the award vesting on each of the third to seventh anniversaries of the grant date. Share awards are expensed over the service period of the awards. The value of the share awards is solely dependent on the CSG share price at the time of delivery.
The share awards include other awards, such as blocked shares, and special awards, which may be granted to new employ-ees. These awards entitle the holder to receive one CSG share, subject to continued employment with the Company, contain restrictive covenants and cancellation provisions and generally vest betweenzeroandfiveyears.
The number of share awards granted to employees was deter-mined by dividing the deferred component of variable compensa-tion being granted as shares by the average price of CSG share over the ten business days ended February 28, 2017. The fair value of each share award was CHF 15.42, the CSG share price on the grant date. While share awards granted between January 1, 2014 and December 31, 2015 did not include the right to receive dividend equivalents, share awards granted after January 1, 2016 include the right to receive dividends equivalents, upon vesting. Movements in the number of Phantom Share outstanding were as follows:
CSS(E)L Group and Company 2016 2015
Number of units (millions)
As at 1 January 7.24 11.41
Granted 3.94 6.01
Shares transferred in/out (0.65) (3.12)
Delivered (4.58) (6.69)
Forfeited (0.23) (0.37)
As at 31 December 5.72 7.24
Contingent Capital Awards Contingent Capital Awards (‘CCA’) were granted in February 2017, January 2016, 2015 and 2014 as part of the 2016, 2015, 2014 and 2013 deferred variable compensation and have rights and risks similar to those of certain contingent capital instruments issued by CSG in the market. CCA are scheduled to vest on the third anniversary of the grant date, other than those granted to certainemployees,whereCCAvestonthefifthandseventhanni-versaries of the grant date, respectively, and will be expensed over the vesting period. CCA provide a conditional right to receive semi-annual cash payments of interest equivalents until settled, with rates being dependent upon the vesting period and currency of denomination: p CCA granted in 2017, 2016, 2015 and 2014 that are denomi-
natedinUSdollarsandvestthree,fiveandsevenyearsfromthe date of grant receive interest rate equivalents at a rate of 4.27%, 5.41%, 5.75% and 5.33%, respectively, per annum over the six-month US dollar London Interbank Offered Rate (LIBOR); and
p CCA granted in 2017, 2016, 2015 and 2014 that are denomi-nated in Swiss francs and vest three years from the date of grant receive interest rate equivalents at a rate of 3.17%, 4.23%, 4.85% and 4.75% per annum over the six-month Swiss franc LIBOR.
The rates were set in line with market conditions at the time of grant and existing high-trigger and low-trigger contingent capital instruments that CSG has issued. As, CCA qualify as going-con-cern loss-absorbing capital of CSG, the timing and form of
distribution upon settlement is subject to approval by the Swiss Financial Market Supervisory Authority FINMA (FINMA). At settle-ment, employees will receive either a contingent capital instrument or a cash payment based on the fair value of the CCA. The fair value will be determined by CSG. In the case of a cash settlement, the CCA award currency denomination will be converted into the local currency of each respective employee.
CCA have loss-absorbing features such that prior to settle-ment, the principal amount of the CCA would be written down to zero if any of the following trigger events were to occur:p CSG’s reported common equity tier 1 (‘CET1’) ratio falls below
7%; orp FINMA determines that cancellation of the CCA and other sim-
ilar contingent capital instruments is necessary, or that CSG requires public sector capital support, in either case to prevent it from becoming insolvent or otherwise failing.
Total compensation expense recognised for January 2016, Janu-ary 2015 and January 2014 CCA during the year ended Decem-ber 31, 2016 was USD 19 million (2015: USD 40 million).
Contingent Capital Share AwardsIn March 2016, the CSG executed a voluntary exchange offer, under which employees had the right to voluntarily convert all or a portion of their respective CCA into Contingent Capital share awards at a conversion price of CHF 14.57. CCA holders elected to convert USD 16 million of their CCA into Contingent Capital share awards during the election period. This fair value repre-sented an approximate conversion rate of 9%. Each Contingent

70
Capital share award had a grant-date fair value of CHF 14.45 and contains the same contractual term, vesting period, performance criteria and other terms and conditions as the original CCA.
Movements in the number of Contingent Capital Shares outstanding were as follows:
CSS(E)L Group and Company 2016
Number of units (millions)
As at 1 January –
Granted 1.06
Shares transferred in/out 0.01
Delivered (0.19)
Forfeited (0.01)
As at 31 December 0.87
Other variable compensationIn 2016, CSG granted deferred cash retention awards relating to the reorganisation of the Global Markets and Investment Banking & Capital Markets businesses. These awards will be expensed over a period of up to seven years from the grant date. Amortisa-tion of these awards was recognised in the Corporate Center.
Total compensation expense recognised during the year ended December 31, 2016 was USD 1 million (2015: Nil).
Plus Bond awardsCertain employees received a portion of 2012 deferred variable compensation in the form of Plus Bond awards. The Plus Bond awardwasessentiallyafixedincomeinstrument,denominatedinUS dollars, which provided a coupon payment that was commen-surate with market-based pricing. Plus Bond award holders were entitled to receive semi-annual cash payments on their adjusted award amounts at the rate of LIBOR plus 7.875% per annum until settlement. The Plus Bond settled in July 2016 based on the amount of the initial award less any portfolio losses in excess of a firstlossportionretainedbyCSGofUSD600million.Thevalueofthe Plus Bond awards was based on the performance of a portfo-lio of unrated and sub-investment-grade asset-backed securities (ABS) that were held in inventory by various trading desks. The Plus Bond award plan contributed to a reduction of CSG’s risk-weighted assets and constituted a risk transfer from CSG to the Plus Bond award holders. Final payout upon settlement of these awards was 100% of the amount awarded.
Total compensation expense recognised during the year ended December 31, 2016 was USD 1 million (2015: USD 3 million).
2011 Partner Asset FacilityAs part of the 2011 annual compensation process, CSG awarded a portion of deferred variable compensation for certain employees in the form of 2011 Partner Asset Facility (PAF2) units. PAF2 unitsareessentiallyfixedincomestructurednotesthatareexposedto a portion of the credit risk that arises in CSG’s derivative activi-ties, including both current and possible future swaps and other derivative transactions. The value of the award (for both the inter-estaccrualandthefinalredemption)willbereducediftheamountofrealisedcreditlossesfromaspecificreferenceportfolioexceedsapre-definedthreshold.CSGwillbearthefirstUSD500millionofsuch losses and the PAF2 holders, across a number of CSG
entities including the Company, will bear any losses in excess of USD 500 million, up to the full amount of the deferred compensa-tion awarded.
Certain employees received PAF2 awards, which vested in the firstquarterof2012.
PAF2 awards were linked to a portfolio of CSG’s credit expo-sures, providing risk offset and capital relief. Due to regulatory changes, this capital relief would no longer be available. As a result, CSG restructured the awards in March 2014, requiring PAF2 holders to reallocate the exposure of their awards from the pool of counterparty credit risks in the original PAF2 structure to one of the following options, or a combination thereof:p Capital Opportunity Facility: participants elect for their award
to be referenced to a Capital Opportunity Facility (COF). The COF is a seven-year facility that is linked to the performance of a portfolio of risk-transfer and capital mitigation transactions, to be entered into with CSG, chosen by a COF management team. The value of the COF awards will be reduced if there are losses from the COF portfolio, up to the full amount of the award. Participants who elect the COF will receive semi-an-nual US dollar cash distributions of 6.5% per annum until set-tlement in cash in 2021, and such semi-annual distributions will reduce the cash settlement amount payable in 2021; and
p Contingent Capital Awards: participants elect to receive CCA, with similar terms to the instruments granted as part of the 2013 compensation awards. Settlement of these awards occurredinthefirsthalfof2016,followingregulatoryapprov-als. Final payout upon settlement of these awards was 94% of the amount awarded.
Total compensation (income)/expense recognised for the PAF2 CCA during the year ended December 31, 2016 was USD (6) million (2015: USD 8 million).
Total compensation expense recognised for the COF during the year ended December 31, 2016 was USD 2 million (2015: USD 2 million).
2008 Partner Asset Facility As part of the 2008 annual compensation process, CSG granted certain employees the majority of the deferred compensation in the form of 2008 Partner Asset Facility (‘PAF’) awards, denomi-nated in US dollars. The PAF awards are indexed to, and represent

71Credit Suisse Securities (Europe) Limited, Annual Report 2016
Notes to the Financial Statements for the year ended 31 December 2016
afirst-loss interest in, a specifiedpool of illiquidassets (AssetPool) that originated in the former Investment Banking division.
The notional value of the Asset Pool was based on the fair market value of the assets within the Asset Pool on December 31, 2008, and those assets will remain static throughout the contrac-tual term of the award or until liquidated. The PAF holders will par-ticipate in the potential gains on the Asset Pool if the assets within the pool are liquidated at prices above the initial fair market value. If the assets within the Asset Pool are liquidated at prices below theinitialfairmarketvalue,thePAFholderswillbearthefirstlossontheAssetPool.Asaresult,asignificantportionofriskpositionsassociated with the Asset Pool has been transferred to the employees and removed from CSG’s risk-weighted assets, result-ing in a reduction in capital usage.
The PAF awards, which have a contractual term of eight years, are fully vested. Each PAF holder will receive a semi-annual cash interest payment of LIBOR plus 250 basis points applied to the notional value of the PAF award granted throughout the contrac-tualtermoftheaward.Beginninginthefifthyearafterthegrantdate, the PAF holders will receive an annual cash payment equal to 20% of the notional value of the PAF awards if the fair market value of the Asset Pool in that year has not declined below the ini-tialfairmarketvalueoftheAssetPool.Inthefinalyearofthecon-tractual term, thePAFholderswill receiveafinal settlement incash equal to the notional value, less all previous cash payments
made to the PAF holder, plus any related gains or less any related losses on the liquidation of the Asset Pool. Settlement is expected tooccurinthefirsthalfof2017.
Total compensation expense recognised during the year ended December31,2016wasUSD 1million(2015:USD 6million).
Stock OptionsUnder the Credit Suisse Group Master Share Plan, for employees inAsia-Pacific region, the lastgrantofoptionsoverCSG regis-tered shares was in September 2003 under the Option Reduction Program. The new options were granted in exchange for previ-ously granted options under the CSG Share Plan. All option awards related to service provided in prior years were fully expensed during the year of service. The exercise price of options granted is generally the market value of CSG registered shares on the date of grant or higher as in the case of the options granted under the Option Reduction Program. All options currently held by employees are fully vested and exercisable. The options generally have a contractual option term of ten years except for the options granted under the Option Reduction Program which has a term of seven years. The liability for these awards is held in the books of CSGand therefore,any fair valuechangesare reflected in thebooks of CSG. CSG has no legal or constructive obligation to repurchase or settle the options in cash.
Movements in the number of share options and their related weighted average exercise prices:
CSS(E)L Group and Company 2016 2015
Weighted Weighted average average exercise exercise in Units price (CHF) in Units price (CHF)
As at 1 January 16,367 73.06 76,712 53.39
Granted – – – –
Exercised – – – –
Forfeited – – 60,345 48.05
Expired 16,367 73.06 – –
As at 31 December – – 16,367 73.06
The number of options exercisable as at year end was Nil (2015: 16,367). The average weighted exercise price of options exercis-able at year end was CHF Nil (2015: CHF 73.06). Weighted
average remaining contractual life of options is Nil years (2015: Nil years). The intrinsic value of vested options outstanding as at year end was USD Nil (2015: USD Nil).
Share options outstanding at the end of the year were as follows:
Exercise Price (CHF) 2016 2015
Jan 2005 Options 48.05 – –
Jan 2006 Options 73.06 – 16,367
– 16,367

72
30 Related Parties
The Company is controlled by CSG, its ultimate parent, which is incorporated in Switzerland. The Company’s parent company, Credit Suisse Investment Holdings (UK), which holds all of the vot-ing rights in the undertaking, is incorporated in the UK. The regis-tered address of CSG is Paradeplatz 8, 8070 Zurich, Switzerland and that of Credit Suisse Investment Holdings (UK) is One Cabot Square, London E14 4QJ.
The Company acts primarily in the investment banking sector asafinancialintermediaryforfellowCS groupcompaniesinpro-viding investment banking and securities products and services for the Americas, European and Asian regions. The Company acts as one of the main booking entities in the European region for trans-acting in securities and derivatives. The Company generally enters into these transactions in the ordinary course of business and these transactions are on market terms that could be obtained from unrelated parties. The Company has extensive transfer
pricing policies (revenue sharing and cost plus agreements) to gov-ern its intercompany relationships.
The Company employs the majority of the London based employeesandisthesponsoringcompanyfortheUKdefinedben-efitpensionplan.TheCompanyalsoholdsleasesandservicecon-tracts in the UK. The costs associated with these are allocated to fellowCS groupcompanies(see‘ExpensesreceivablefromotherCS groupcompanies’ inNote 9–General,AdministrativeandTrading Expenses based on detailed cost allocation statistics. The Company generally enters into these transactions in the ordinary course of business and these transactions are on market terms that could be obtained from unrelated parties.
Transactions with CS Investment Holdings (UK) have been reportedas‘Parent’andwithotherCS groupcompaniesareunder‘Fellow group companies’.
a) Related party assets and liabilities
31 December 2016 31 December 2015
Fellow Fellow group group
CSS(E)L Group Parent companies Total Parent companies Total
Assets (USD million)
Cash and due from banks – 1,848 1,848 – 7,352 7,352
Interest bearing deposits with banks – 8,763 8,763 – 9,700 9,700
Securities purchased under resale agreements and securities borrowing transactions – 11,639 11,639 – 5,020 5,020
Trading financials assets designated at fair value through profit or loss – 2,537 2,537 – 3,356 3,356
Financial assets designated at fair value through profit or loss – 9,915 9,915 – 9,734 9,734
Other assets – 1,315 1,315 – 806 806
Assets Held for sale – 25,686 25,686 – 35,171 35,171
Total assets – 61,703 61,703 – 71,139 71,139
Liabilities and Equity (USD million)
Deposits – 3 3 – 20 20
Securities sold under repurchase agreements and securities lending transactions – 72 72 – 43 43
Trading financial liabilities designated at fair value through profit or loss – 2,221 2,221 – 3,170 3,170
Financial liabilities designated at fair value through profit or loss – 15,334 15,334 – 16,551 16,551
Short term borrowings – 3,667 3,667 – 2,761 2,761
Other liabilities – 10,768 10,768 – 11,181 11,181
Long term debt – 24,762 24,762 – 26,419 26,419
Liabilities Held for sale – 11,443 11,443 – 23,459 23,459
Share capital 3,859 – 3,859 3,859 – 3,859
Share premium 5,661 – 5,661 5,661 – 5,661
Capital contribution 5,662 – 5,662 5,662 – 5,662
Total liabilities and equity 15,182 68,270 83,452 15,182 83,604 98,786

73Credit Suisse Securities (Europe) Limited, Annual Report 2016
Notes to the Financial Statements for the year ended 31 December 2016
31 December 2016 31 December 2015
Fellow Fellow group Subsidiaries group Subsidiaries
CSS(E)L Company Parent companies and SPEs Total Parent companies and SPEs Total
Assets (USD million)
Cash and due from banks – 1,848 – 1,848 – 7,352 – 7,352
Interest bearing deposits with banks – 8,763 – 8,763 – 9,700 – 9,700
Securities purchased under resale agreements
and securities borrowing transactions – 11,639 – 11,639 – 5,020 – 5,020
Trading financials assets designated at fair value through profit or loss – 2,534 12 2,546 – 3,356 16 3,372
Financial assets designated at fair value through profit or loss – 9,915 – 9,915 – 9,734 – 9,734
Other assets – 1,315 – 1,315 – 806 – 806
Assets Held for sale – 25,686 – 25,686 35,171 – 35,171
Total assets – 61,700 12 61,712 – 71,139 16 71,155
Liabilities and Equity (USD million)
Deposits – 3 – 3 – 20 – 20
Securities sold under repurchase agreements
and securities lending transactions – 72 – 72 – 43 – 43
Trading financial liabilities designated at fair value through profit or loss – 2,182 6 2,188 – 3,132 5 3,137
Financial liabilities designated at fair value through profit or loss – 15,322 – 15,322 – 16,539 – 16,539
Short term borrowings – 3,667 – 3,667 – 2,749 – 2,749
Other liabilities – 10,768 – 10,768 – 11,181 – 11,181
Long term debt – 24,762 – 24,762 – 26,419 – 26,419
Liabilities Held for sale – 11,443 – 11,443 – 23,459 – 23,459
Share capital 3,859 – – 3,859 3,859 – – 3,859
Share premium 5,661 – – 5,661 5,661 – – 5,661
Capital contribution 5,662 – – 5,662 5,662 – – 5,662
Total liabilities and equity 15,182 68,219 6 83,407 15,182 83,542 5 98,729
Related party off-balance sheet transactions
31 December 2016 1 31 December 2015
Fellow Fellow group group
CSS(E)L Group and Company (USD million) Parent companies Total Parent companies Total
Credit Guarantees – 194 194 – 241 241
Commitments to purchase cash securities <1 year – 2,494 2,494 – 3,127 3,127
Total – 2,688 2,688 – 3,368 3,368
1 Above table shows off-balance sheet transactions of continued and discontinued operations.
b) Related party revenues and expenses
31 December 2016 1 31 December 2015
Fellow Fellow group group
CSS(E)L Group (USD million) Parent companies Total Parent companies Total
Interest income – 375 375 – 337 337
Interest expense – (809) (809) – (814) (814)
Net interest expense – (434) (434) – (477) (477)
Commissions and fee income/(expense) – (157) (157) – (170) (170)
Revenue sharing agreements’ expense – (30) (30) – (48) (48)
Total non-interest revenues – (187) (187) – (218) (218)
Net revenue/(expense) – (621) (621) – (695) (695)
Total operating expenses – 244 244 – 571 571
1 Above table shows revenues and expenses of continued and discontinued operations.

74
c) RemunerationDisclosure required by the Companies Act 2006
Remuneration of Directors
(USD ‘000) 2016 2015
Emoluments 2,548 1,669
Long term incentive schemes:
AmountsPaidunderDeferredCashAwards 584 987
AmountsDeliveredunderShareBasedAwards 1,333 1,767
Total 4,465 4,423
Compensation for loss of office 5 –
Bank’s contributions to defined contribution plan 44 28
Total 4,514 4,451
Emoluments include amounts paid to or receivable by the Direc-tors. Only vested Cash Retention Awards are included in emolu-ments. Long term incentive schemes consist of deferred cash awards and share based awards and are only given to Executive Directors.TheNon-ExecutiveDirectorsonly receiveafixed fee.Deferred cash awards are included in the period when the amounts vest and are paid, and share based awards are included in the period when the amounts vest and are delivered.
Where directors perform services for a number of companies within the CS group, the total remuneration payable to each direc-tor has been apportioned to the respective entities based on a time spent per company allocation for that director.
The aggregate of emoluments and deferred cash awards paid to or receivable by the highest paid director was USD 1,412,000
(2015: USD 2,207,000). The director was also a member of a definedcontributionpensionplanandthecontributionpaidduringthe year into the plan was USD 7,000 (2015: USD 3,000). There werenocontributionsmadefordefinedbenefitlumpsum(2015:USD Nil). During the year the highest paid director also received an entitlement to shares under a long term incentive scheme.
The amounts included in the Companies Act disclosures are on a different basis than the recognition requirements of IFRS 2 and IAS 37 and the disclosure requirements of IAS 24. The aggregate amount of remuneration accrued in the Company’s accounts for directors in accordance with IFRS requirements for 2016 was USD 4,437,000 (2015: USD 3,585,000).
Number of Directors and Benefits 2016 2015
Retirement benefits are accruing to the following number of Directors under:
Defined contribution schemes 6 6
No Scheme 4 4
Both defined contribution and defined benefit 1 –
Both defined contribution and defined benefit lump sum 1 –
Directors in respect of whom services were received or receivable under long term incentive schemes 9 7

75Credit Suisse Securities (Europe) Limited, Annual Report 2016
Notes to the Financial Statements for the year ended 31 December 2016
Remuneration of Key Management Personnel
(USD’ 000) 2016 2015
Remuneration of Key Management Personnel
Emoluments 6,212 6,119
Long term incentive schemes 2,321 6,533
Total 8,533 12,652
Compensation for loss of office – –
Bank’s contributions to defined contribution plan 118 101
Bank’s contributions to defined benefits sum plan 206 –
Total 8,857 12,753
The numbers disclosed in the ‘Remuneration of Key Management Personnel’arebasedonamountsaccrued inthefinancialstate-ments for all emoluments and long term incentive schemes.
Where Key Management Personnel perform services for a number of companies within the CS group, the total remuneration payable to each key management person has been apportioned to the respective entities based on a time spent per company alloca-tion for that key management person.
Key management personnel are those persons having author-ity and responsibility for planning, directing and controlling the activities of the CSS(E)L Group, directly or indirectly, including any director of the CSS(E)L Group.
Key management personnel include Directors and the mem-bers of the CSS(E)L Executive Committee, (2015 the UK Invest-ment Bank Executive Committee).
CSG Shares awarded to Key Management Personnel
2016 2015
Number of shares 331,140 286,834
The shares included in the table are the shares accrued in the period under the requirements of IFRS 2. These numbers differ from the share awards included in the Company’s Act disclosures above, which are disclosed in the period in which they vest and are delivered.
d) Loans and Advances to Directors and Key Management PersonnelLoans outstanding to or due from Directors or Key management personnel of the CSS(E)L Group at 31 December 2016 were USD 6,000 (2015: USD 3,000), of which loans to Directors were USD 2,000 (2015: USD 1,000).
31 Employees
The average number of persons employed during the year was as follows:
CSS(E)L Group and Company (Number) 2016 2015
Business Functions 1,415 1,231
Corporate Functions 2,515 3,724
Total 3,930 4,955
The CSS(E)L Group receives a range of services from related CS group companies. The headcount related to these services received cannot be accurately ascertained and is not therefore included in the above numbers. Additionally CSS(E)L is the main CS employing company in the UK and provides a number of ser-vices to other related CS group companies. The headcount related to these services cannot be accurately segregated and is therefore
included in the above numbers. Decrease in head count is primarily due to movement of staff from CSS(E)L to Credit Suisse Interna-tional due to continuing business migrations and cost reduction program in 2016. The Business function head count has increased as certain Corporate functions have been transferred into the busi-ness functions in 2016.

76
32 Derivatives and Hedging Activities
Derivatives are generally either privately negotiated OTC contracts or standard contracts transacted through regulated exchanges. The CSS(E)L Group’s most frequently used freestanding deriva-tive products, entered into for trading and risk management pur-poses, include interest rate, equity, cross currency and credit default swaps, interest rate and foreign currency options, foreign exchange forward contracts, and foreign currency and interest rate futures.
Furthermore, the CSS(E)L Group enters into contracts that are not considered derivatives in their entirety but include embed-ded derivatives features. Such transactions primarily include issued and purchased structured debt instruments where the return may be calculated by reference to an equity security, index, or
third-party credit risk or that have non-standard or foreign currency terms.
On the date the derivative contract is entered into, the CSS(E)L Group designates the derivative as belonging to one of the follow-ing categories:p trading activities;p a risk management transaction that does not qualify as a
hedge under accounting standards (referred to as an economic hedge); or
p ahedgeofthevariabilityofcashflowstobereceivedorpaidrelated to a recognised asset or liability or a forecasted trans-action; or
p a hedge of a net investment in a foreign operation.
The following table sets forth details of trading and hedging derivatives instruments:
31 December 2016 31 December 2015
Trading 1 Hedging Trading Hedging
Positive Negative Positive Negative Positive Negative Positive Negative replacement replacement replacement replacement replacement replacement replacement replacement CSS(E)L Group value value value value value value value value
Trading and hedging derivatives instruments (USD million)
Forwards and forward rate agreements 13 17 – – 7 9 – –
Swaps 1,228 1,289 – – 1,619 2,383 – –
Options bought and sold (OTC) 1 4 – – 15 5 – –
Interest rate products 1,242 1,310 – – 1,641 2,397 – –
Forwards and forward rate agreements 500 236 9 – 342 343 – 4
Swaps 236 166 – – 749 762 – –
Options bought and sold (OTC) 19 19 – – 119 119 – –
Foreign exchange products 755 421 9 – 1,210 1,224 – 4
Forwards and forward rate agreements 2 4 – – 2 6 – –
Swaps 2,582 2,525 – – 3,573 4,074 – –
Options bought and sold (traded) 9 11 – – 75 57 – –
Equity/indexed-related products 2,593 2,540 – – 3,650 4,137 – –
Credit Swaps 7 26 – – 20 68 – –
Life finance related mortality swaps and others 856 694 – – 838 655 – –
Other products 856 694 – – 838 655 – –
Total derivative instruments 5,453 4,991 9 – 7,359 8,481 – 4
1 Above table includes both continued and discontinued operations. Assets and liabilities pertaining to discontinued operations in 2016 are USD 2,104 million (2015: USD 2,820 million) and USD 2,023 million (USD: 3,548 million) respectively. Decrease in derivative instruments, primarily interest rate and foreign exchange products, driven by migration of Prime services business to another CS group entity. Refer to Note 25- Discontinued Operations and Assets Held for Sale.
2016 2015
Positive Negative Positive Negative replacement replacement replacement replacement CSS(E)L Group value value value value
Replacement values (USD million)
Replacement values (trading and hedging) before netting 5,462 4,991 7,359 8,485
Replacement values (trading and hedging) after netting 5,458 4,987 7,302 8,428

77Credit Suisse Securities (Europe) Limited, Annual Report 2016
Notes to the Financial Statements for the year ended 31 December 2016
31 December 2016 31 December 2015
Trading 1 Hedging Trading Hedging
Positive Negative Positive Negative Positive Negative Positive Negative replacement replacement replacement replacement replacement replacement replacement replacement Company value value value value value value value value
Trading and hedging derivatives instruments (USD million)
Forwards and forward rate agreements 13 17 – – 7 9 – –
Swaps 1,228 1,289 – – 1,620 2,384 – –
Options bought and sold (OTC) 1 4 – – 15 5 – –
Interest rate products 1,242 1,310 – – 1,642 2,398 – –
Forwards and forward rate agreements 500 236 9 – 342 343 – 4
Swaps 236 166 – – 749 762 – –
Options bought and sold (OTC) 19 19 – – 119 119 – –
Foreign exchange products 755 421 9 – 1,210 1,224 – 4
Forwards and forward rate agreements 2 4 – – 2 6 – –
Swaps 2,582 2,525 – – 3,573 4,072 – –
Options bought and sold (traded) 9 11 – – 75 57 – –
Equity/indexed-related products 2,593 2,540 – – 3,650 4,135 – –
Credit Swaps 7 26 – – 20 68 – –
Life finance related mortality swaps and others 1,409 662 – – 1,404 622 – –
Other products 1,409 662 – – 1,404 622 – –
Total derivative instruments 6,006 4,959 9 – 7,926 8,447 – 4
1 Above table includes both continued and discontinued operations. Assets and liabilities pertaining to discontinued operations in 2016 are USD 2,104 million (2015: USD 2,820 million) and USD 2,023 million (USD: 3,548 million) respectively. Decrease in derivative instruments, primarily interest rate and foreign exchange products, driven by migration of Prime services business to another CS group entity. Refer to Note 25- Discontinued Operations and Assets Held for Sale.
2016 2015
Positive Negative Positive Negative replacement replacement replacement replacement Company value value value value
Replacement values (USD million)
Replacement values (trading and hedging) before netting 6,015 4,959 7,926 8,451
Replacement values (trading and hedging) after netting 6,011 4,955 7,869 8,394
Trading ActivitiesThe CSS(E)L Group is active in most of the principal trading mar-kets and transacts in many popular trading and hedging products. As noted above, this includes the use of swaps, futures, options and structured products (custom transactions using combinations of derivatives) in connection with its sales and trading activities. Trading activities include market-making, positioning and arbitrage activities. The majority of the CSS(E)L Group’s derivatives held as at 31 December 2016 were used for trading activities.
Economic HedgesEconomic hedges arise when the CSS(E)L Group enters into derivative contracts for its own risk management purposes, but the contracts entered into do not qualify for hedge accounting under IFRS. These economic hedges include the following types:
p interest rate derivatives to manage net interest rate risk on cer-tain banking business assets and liabilities;
p foreign exchange derivatives to manage foreign exchange risk on certain banking business revenue and expense items, as well as on banking business assets and liabilities; and
p credit derivatives to manage credit risk on certain loan portfolios.
Net Investment HedgesThe CSS(E)L Group typically uses forward foreign exchange con-tracts to hedge selected net investments in foreign operations. The objective of these hedging transactions is to protect against adverse movements in foreign exchange rates.
The fair value of open derivative transactions used as net investment hedges for the CSS(E)L Group and Company as at 31 December2016wasanassetofUSD 9million(2015:liabilityofUSD 3million).Therearenoineffectivenetinvestmenthedgesas of 31 December 2016.

78
Cash Flow HedgesTheCSS(E)LGroupusesderivatives, suchasForeignExchangeForwards, tohedge its cashflowsassociatedwith forecastedtransactions.
CSS(E)L Group and Company 2016 2015
Fair value of derivative instruments designated as cash flow hedges
Liabilities – 1
Total – 1
Refer to Note 26 – Accumulated Other Comprehensive Income for further information on balances recognised in AOCI related to cash flowhedgesandongains/lossesrecognisedinAOCIinrespectofeffectivecashflowhedges.
There are no ineffective cash flow hedges as of 31 December 2016.
Hedge effectiveness assessmentThe CSS(E)L Group assesses the effectiveness of hedging rela-tionships both prospectively and retrospectively. The prospective assessment is made both at the inception of a hedging relationship and on an ongoing basis and requires the CSS(E)L Group to jus-tify its expectation that the relationship will be highly effective over future periods. The retrospective assessment is also performed on an ongoing basis and requires the CSS(E)L Group to determine whether or not the hedging relationship has actually been effec-tive. If the CSS(E)L Group concludes, through a retrospective evaluation, that hedge accounting is appropriate for the current period, then it measures the amount of hedge ineffectiveness to be recognised in earnings.
Disclosures relating to contingent credit riskCertain of the Company’s derivative instruments contain provisions thatrequireittomaintainaspecifiedcreditratingfromeachofthemajor credit rating agencies. If the ratings fall below the level specified in thecontract, thecounterparties to theagreementscould request payment of additional collateral on those derivative instruments that are in a net liability position. Certain of the deriv-ative contracts also provide for termination of the contract, gener-ally upon a downgrade of either Credit Suisse AG or the counter-party, at the existing mark to market replacement value of the derivative contract.
On a daily basis, the level of incremental collateral that would be required by derivative counterparties in the event of a Credit Suisse AG ratings downgrade is monitored. Collateral triggers are maintained by the Collateral Management department and vary by counterparty.
The impact of downgrades in the Credit Suisse AG’s long-term debt ratings are considered in the stress assumptions used to determine the liquidityand fundingprofileof theCompany.TheCompany holds a liquidity pool made up of ‘high quality liquid assets’ (‘HQLA’) to meet any additional collateral calls as a result of a downgrade. The assessment takes into consideration a two-notch downgrade in credit rating of Credit Suisse AG.

79Credit Suisse Securities (Europe) Limited, Annual Report 2016
Notes to the Financial Statements for the year ended 31 December 2016
33 Guarantees and Commitments
The following tables set forth details of contingent liabilities associated with guarantees and other commitments:
Maturity
Total gross Collateral Net of CSS(E)L Group and Company <year 1-3 years 3-5 years >5 years amount received collateral
31 December 2016
Guarantees (USD million)
Credit guarantees and similar instruments – – – 194 194 – 194
Total guarantees – – – 194 194 – 194
Maturity
Total gross Collateral Net of CSS(E)L Group and Company <year 1-3 years 3-5 years >5 years amount received collateral
31 December 2016
Other commitments (USD million)
Forward reverse repurchase agreements with maturity <1 year 75 – – – 75 – 75
Commitments to purchase cash securities <1 year 5,653 – – – 5,653 – 5,653
Total other commitments 5,728 – – – 5,728 – 5,728
Maturity
Total gross Collateral Net of CSS(E)L Group and Company <year 1-3 years 3-5 years >5 years amount received collateral
31 December 2015
Guarantees (USD million)
Credit guarantees and similar instruments – – – 241 241 – 241
Total guarantees – – – 241 241 – 241
Maturity
Total gross Collateral Net of CSS(E)L Group and Company <year 1-3 years 3-5 years >5 years amount received collateral
31 December 2015
Other commitments (USD million)
Forward reverse repurchase agreements with maturity <1 year 42 – – – 42 – 42
Commitments to purchase cash securities <1 year 4,578 – – – 4,578 – 4,578
Commitments in underwriting securities <1 year – – – – – – –
Total other commitments 4,620 – – – 4,620 – 4,620
Forward reverse repo agreements represent transactions in which the initial cash exchange of the reverse repurchase transactions takesplaceonspecifiedfuturedates.
Credit guarantees are contracts that require the CSS(E)L Group to make payments, should a third party fail to do so under a specifiedexistingcreditobligation.Forexample,inconnectionwithits corporate lending business and other corporate activities, the CSS(E)L Group provides guarantees to counterparties in the form of standby letters of credit, which represent obligations to make payments to third parties if the counterparty fails to fulfil its
obligation under a borrowing arrangement or other contractual obligation.
Commitments to purchase cash securities represents the value of debt and equity cash security contracts which requires CSS(E)L Group to make payments to customers, banks, brokers and deal-ers which have not settled as at the reporting date.
Commitment in underwriting securities represents CSS(E)L Group future obligations in the capacity of underwriter of equity and debt securities.

80
Lease CommitmentsThe following table sets forth details of future minimum operating lease commitments under non-cancellable operating leases:
2016 2015
Operating lease commitments (USD million)
Up to 1 year 19 33
From 1 year and no later than 5 years 77 103
From 5 years and over 250 341
Future operating lease commitments 346 477
The following table sets forth details of rental expenses for all operating leases:
CSS(E)L Group and Company 2016 2015
Net rental expense (USD million)
Minimum rentals 19 36
Total net rental expenses 19 36
The rental expenses include service charges of USD 2 million (2015: 4 million). During the year, there was no sublease rental.
Contingent Liabilities and Other CommitmentsThe Company is party to various legal proceedings as part of its normal course of business. The Directors of the Company believe that the aggregate liabilities, if any, resulting from these proceed-ingswill not significantly prejudice the financial position of theCompany and have been provided for where deemed necessary in accordance with accounting policy.
In late 2014, the Monte dei Paschi di Siena Foundation (‘Foun-dation’)filedalawsuitintheCivilCourtofMilan,ItalyseekingEUR3 billion in damages jointly from Credit Suisse Securities (Europe) Limited (CSSEL), Banca Leonardo & Co S.p.A. and former mem-bers of the Foundation’s management committee. The lawsuit relates to the fairness opinions CSSEL and Banca Leonardo & Co S.p.A. delivered to the Foundation in connection with the EUR 9 billion acquisition of Banca Antonveneta S.p.A. by Banca Monte dei Paschi di Siena S.p.A. (BMPS) in 2008. BMPS funded the acquisition by a EUR 5 billion rights offer and the issuance of irre-deemable securities convertible into BMPS shares, in which the Foundation invested EUR 2.9 billion and EUR 490 million
respectively. The Foundation alleges that the fairness opinions were issued in theabsenceofkeyfinancial information.CSSELbelieves that the claim lacks merit and is not supported by the available evidence.
CSSEL has been defending clawback claims of USD 16 mil-lion and EUR 22 million brought by the Winding Up Committees (‘WUC’s) of the Icelandic banks Kaupthing Bank hf and LBI hf (previously Landsbanki Islands hf) in the District Court of Reykja-vik, Iceland. The claims concern the buyback by the Icelandic banks of their own bonds from CSSEL in the months prior to the Icelandic banks’ insolvency. The primary basis for the clawback is that the buybacks constituted early repayments of debt to CSSEL.TheWUCswere claiming significant penalty interestunder Icelandic law. CSSEL argued that the buyback transac-tions were governed by English or New York law which does not provide a legal basis for such clawback actions. In October 2014, the Court of the European Free Trade Association States issued a non-binding decision supporting CSSEL’s position that the gov-erning law of the transactions was relevant. In December 2016 CSS(E)L and Kaupthing ehf (formerly Kaupthing Bank hf) enteredintoaconfidentialsettlementagreementbringinganendto these proceedings.

81Credit Suisse Securities (Europe) Limited, Annual Report 2016
Notes to the Financial Statements for the year ended 31 December 2016
34 Interests in Other Entities
SubsidiariesComposition of the GroupSubsidiaries are entities (including structured entities) controlled by the CSS(E)L Group. The CSS(E)L Group controls an entity when it is exposed to, or has rights to, variable returns from its involve-ment with the entity and has the ability to affect those returns
throughitspowerovertheentity.Thefinancialstatementsofsub-sidiariesareincludedintheconsolidatedfinancialstatementsfromthe date on which control commences until the date on which con-trol ceases.
The following table sets forth all the subsidiaries the CSS(E)L Group owns, directly or indirectly.
Composition of the Group
Percentage Percentage of of ownership ownership Company Name Domicile 1 Currency held 2016 held 2015
Credit Suisse First Boston Trustees Limited United Kingdom USD 100% 100%
Credit Suisse First Boston PF (Europe) Limited United Kingdom USD 100% -
Credit Suisse Client Nominees (UK) Limited United Kingdom USD 100% 100%
Credit Suisse AF Trust United States of America USD 100% 100%
CSSEL Bare Trust United States of America USD 100% 100%
Redwood Trust I United States of America USD 100% 100%
Redwood Trust II United States of America USD 100% 100%
Redwood Master Trust I United States of America USD 100% 100%
Redwood Master Trust II United States of America USD 100% 100%
Redwood Funding Trust I United States of America USD 100% 100%
Redwood Funding Trust II United States of America USD 100% 100%
Redwood – Master Client Trust United States of America USD 100% 100%
Sail Trust I United States of America USD 100% 100%
Sail Trust II United States of America USD 100% 100%
Sail Master Trust I United States of America USD 100% 100%
Sail Master Trust II United States of America USD 100% 100%
Sail Funding Trust I United States of America USD 100% 100%
Sail Funding Trust II United States of America USD 100% 100%
Positive – Master Client LLC United States of America USD 100% 100%
Saxon S.a.r.l. Luxembourg EUR - 100%
Lutetia Finance Limited Ireland USD - 100%
1 Detailed Registered Office Address mentioend in Note-42 CSS(E)L’s Subsidiaries and Associates
There are no material differences between the date of the end of the reportingperiodof thefinancial statementsof theCSS(E)LGroup and those of any of its subsidiaries (including any consoli-dated structured entities).
Therewereno significant changes inownershipduring theyear ended 31 December 2016 in relation to the CSS(E)L Group’s subsidiaries that resulted in a loss of control.
Therewereno significant changes inownershipduring theyear ended 31 December 2016 that resulted in a change in the consolidation conclusion.
TheCSS(E)LGrouphasnotprovidedfinancialorothersup-port to consolidated structured entities that it was not contractually required to provide.
The CSS(E)L Group does not have the intention to provide financialorothersupporttoconsolidatedstructuredentitiesthatitis not contractually required to provide.
RestrictionsThe CSS(E)L Group and its subsidiaries have certain restrictions which may restrict the ability of the CSS(E)L Group to access or use the assets and settle the liabilities of the CSS(E)L Group. These restrictions may be statutory, contractual or regulatory in nature.
The Company must at all times monitor and demonstrate com-pliance with the relevant regulatory capital requirements set out in the EU Capital Requirements Regulation (‘CRR’) and additionally as laid down by the PRA. The Company has put into place pro-cesses and controls to monitor and manage its capital adequacy. For more information regarding the Company’s capital adequacy and how the capital resources are managed and monitored please refertoNote 40–CapitalAdequacy.
CSS(E)L is required to maintain minimum levels of capital in the form of equity shares and reserves to meet PRA requirements.

82
Restricted assets include those assets protected under client segregation rules.Please refer toNote 18–BrokerageReceiv-ables and Brokerage Payables for further information.
CSS(E)L Group pledges assets mainly for repurchase agree-mentsandothersecuritiesfinancing.Certainpledgedassetsmaybe encumbered, meaning the counterparty has the right to resell orrepledgethepledgedasset.PleaserefertoNote 14–TradingFinancialAssets andLiabilities atFairValueThroughProfit orLoss for more information on encumbered assets.
Other restrictions include those that prevent some subsidiaries from making any distributions to the parent such as restrictions on redemption or the payments of dividends.
Unconsolidated structured entitiesThe CSS(E)L Group has interests in structured entities which are not consolidated. An interest is either a contractual or non-con-tractual involvement that exposes the CSS(E)L Group to variability in returns from the performance of another entity. An interest in another entity can be evidenced by, but is not limited to, the hold-ing of equity or debt instruments as well as other forms of involve-ment such as the provision of funding, liquidity support, credit enhancement and guarantees. The CSS(E)L Group does not have an interest in another entity solely because of a Typical Customer Supplier Relationship such as, fees other than management and performance fees that are passively earned and are typically one-off in nature.
Type of structured entitySecuritisationsSecuritisations are primarily Commercial Mortgage Backed Secu-rities (‘CMBS’), Residential Mortgage Backed Securities (‘RMBS’) and Asset Backed Securities (‘ABS’) vehicles. The CSS(E)L Group acts as an underwriter, market maker, liquidity provider, derivative counterparty and/or provider of credit enhancements to structured entities related to certain securitisation transactions.
The maximum exposure to loss is the carrying value of the loan securities and derivative positions that are variable returns if any, plus the exposure arising from any credit enhancements the CSS(E)L Group provided. The CSS(E)L Group’s maximum expo-suretolossdoesnotincludeanyeffectsfromfinancialinstrumentsused to economically hedge the risks of the structured entities.
LoansLoansare single-financing vehicleswhere theCSS(E)LGroupprovidesfinancing forspecifiedassetsorbusinessventuresandthe respective owner of the assets or manager of the businesses provides the equity in the vehicle. These tailored lending arrange-mentsareestablishedtopurchase,leaseorotherwisefinanceandmanage clients’ assets.
The maximum exposure to loss is the carrying value of the CSS(E)L Group’s loan exposure, which is subject to the same credit risk management procedures as loans issued directly to cli-ents. The clients’ creditworthiness is carefully reviewed, loan-to-value ratios are strictly set and, in addition, clients provide equity, additionalcollateralorguarantees,allofwhichsignificantlyreducethe CSS(E)L Group’s exposure. The CSS(E)L Group considers the likelihood of incurring a loss equal to the maximum exposure to be remote because of the CSS(E)L Group’s risk mitigation efforts which includes over-collateralisation and effective monitoring to ensurethatasufficientloan-to-valueratioismaintained.
Collateralised Debt Obligations (‘CDO’)The CSS(E)L Group engages in CDO transactions to meet client and investor needs, earn fees and sell financial assets. TheCSS(E)L Group may act as underwriter, placement agent or asset manager and may warehouse assets prior to the closing of a trans-action.Aspartof its structuredfinancebusiness, theCSS(E)LGroup purchases loans and other debt obligations from and on behalf of clients for the purpose of securitisation. The loans and other debt obligations are sold to structured entities, which in turn issue CDOs to fund the purchase of assets such as investment grade and high yield corporate debt instruments.
The maximum exposure to loss consists of the fair value of instruments issued by such structures that are held by the CSS(E)L Group.
Thefollowingtableprovidesthecarryingamountsandclassifi-cations of the assets and liabilities of interests recorded in the CSS(E)L Group’s Consolidated Statement of Financial Position, the maximum exposure to loss and the total assets of the uncon-solidated structured entities.
Interests in unconsolidated structured entities
Structured Structured
2016 entity type entity type
Securiti-
Balance sheet line item (USD millions) sations CDO Total
Other liabilities – – –
Total – – –
Maximum exposure to loss – – –
Unconsolidated structured entity assets 11,498 340 11,838
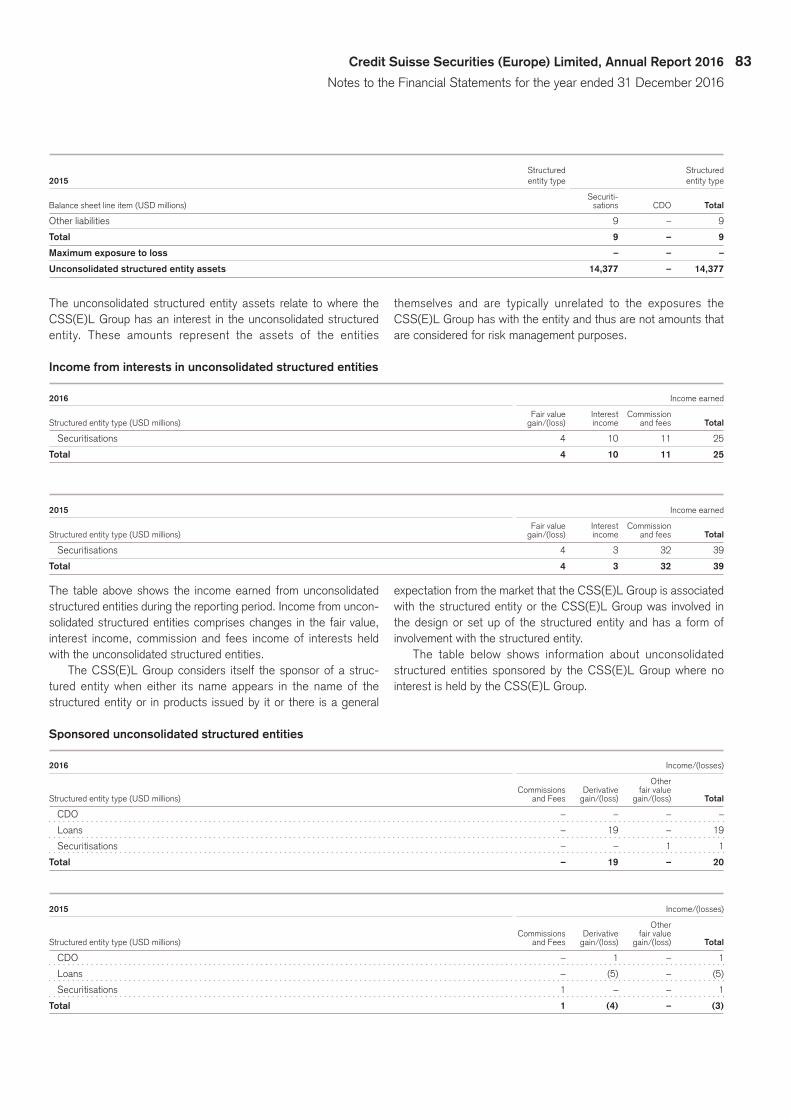
83Credit Suisse Securities (Europe) Limited, Annual Report 2016
Notes to the Financial Statements for the year ended 31 December 2016
Structured Structured
2015 entity type entity type
Securiti-
Balance sheet line item (USD millions) sations CDO Total
Other liabilities 9 – 9
Total 9 – 9
Maximum exposure to loss – – –
Unconsolidated structured entity assets 14,377 – 14,377
The unconsolidated structured entity assets relate to where the CSS(E)L Group has an interest in the unconsolidated structured entity. These amounts represent the assets of the entities
themselves and are typically unrelated to the exposures the CSS(E)L Group has with the entity and thus are not amounts that are considered for risk management purposes.
Income from interests in unconsolidated structured entities
2016 Income earned
Fair value Interest Commission
Structured entity type (USD millions) gain/(loss) income and fees Total
Securitisations 4 10 11 25
Total 4 10 11 25
2015 Income earned
Fair value Interest Commission
Structured entity type (USD millions) gain/(loss) income and fees Total
Securitisations 4 3 32 39
Total 4 3 32 39
The table above shows the income earned from unconsolidated structured entities during the reporting period. Income from uncon-solidated structured entities comprises changes in the fair value, interest income, commission and fees income of interests held with the unconsolidated structured entities.
The CSS(E)L Group considers itself the sponsor of a struc-tured entity when either its name appears in the name of the structured entity or in products issued by it or there is a general
expectation from the market that the CSS(E)L Group is associated with the structured entity or the CSS(E)L Group was involved in the design or set up of the structured entity and has a form of involvement with the structured entity.
The table below shows information about unconsolidated structured entities sponsored by the CSS(E)L Group where no interest is held by the CSS(E)L Group.
Sponsored unconsolidated structured entities
2016 Income/(losses)
Other Commissions Derivative fair value
Structured entity type (USD millions) and Fees gain/(loss) gain/(loss) Total
CDO – – – –
Loans – 19 – 19
Securitisations – – 1 1
Total – 19 – 20
2015 Income/(losses)
Other Commissions Derivative fair value
Structured entity type (USD millions) and Fees gain/(loss) gain/(loss) Total
CDO – 1 – 1
Loans – (5) – (5)
Securitisations 1 – – 1
Total 1 (4) – (3)

84
The table above shows the income earned from the unconsoli-dated structured entities during the reporting period. Income from unconsolidated structured entities includes, but is not limited to recurring and non-recurring fees, interest and dividends income, gains or losses from the transfer of assets and liabilities and changes in the fair value of derivative instruments and other instru-ments held at fair value.
TheCSS(E)LGrouphasnotprovidedfinancialorothersup-port to unconsolidated structured entities that it was not contractu-ally required to provide.
The CSS(E)L Group does not have the intention to provide financialorothersupporttounconsolidatedstructuredentitiesthatit is not contractually required to provide.
35 Financial Instruments
ThedisclosureoftheCSS(E)LGroup’sfinancialinstrumentsbelowincludes the following sections:p Analysisoffinancialinstrumentsbycategories;p Fair value measurement (including fair value hierarchy; transfers
between levels; level 3 reconciliation; qualitative and quantitative disclosures of valuation techniques; sensitivity analysis of unob-servable input parameters; and recognition of trade date profit).
p Fairvalueoffinancialinstrumentsnotcarriedatfairvalue.
Analysis of financial instruments by categoriesFinancial instruments are measured on an ongoing basis either at fair value or at amortised cost. The following table sets out the carryingamountsandfairvaluesoftheCSS(E)LGroup’sfinancialinstruments.
Financial assets and liabilities by categories
Total
31 December 2016 Carrying amount fair value
Total Other carrying Held for Designated Loans and Available- amortised
CSS(E)L Group (USD million) value trading at fair value receivables for-sale cost
Financial Assets
Cash and due from banks 3,187 – – – – 3,187 3,187
Interest-bearing deposits with banks 8,763 – – – – 8,763 8,763
Securities purchased under resale agreements
and securities borrowing transactions 11,686 – – – – 11,686 11,686
Trading financial assets at fair value through profit or loss 13,880 13,880 – – – – 13,880
Financial assets designated at fair value through profit or loss 23,613 – 23,613 – – – 23,613
Financial assets available-for-sale 33 – – – 33 – 33
Other assets 5,269 – – – – 5,269 5,269
Assets held for sale 51,435 18,276 – – – 33,159 51,435
Total financial assets 117,866 32,156 23,613 – 33 62,064 117,866
Total
31 December 2016 Carrying Amount fair value
Total Other carrying Held for Designated amortised
CSS(E)L Group (USD million) value trading at fair value cost
Financial Liabilities
Deposits 169 – – 169 169
Securities sold under repurchase agreements and securities lending transactions 72 – – 72 72
Trading financial liabilities at fair value through profit or loss 7,537 7,537 – – 7,537
Financial liabilities designated at fair value through profit or loss 23,810 – 23,810 – 23,810
Short term borrowings 3,667 – – 3,667 3,667
Other liabilities 17,658 – – 17,658 17,658
Long term debt 24,762 – – 24,762 24,762
Liabilities held for sale 32,670 12,859 485 19,326 32,670
Total financial liabilities 110,345 20,396 24,295 65,654 110,345

85Credit Suisse Securities (Europe) Limited, Annual Report 2016
Notes to the Financial Statements for the year ended 31 December 2016
Financial assets and liabilities by categories
Total
31 December 2015 Carrying amount fair value
Total Other carrying Held for Designated Loans and Available- amortised
CSS(E)L Group (USD million) value trading at fair value receivables for-sale cost
Financial Assets
Cash and due from banks 8,874 – – – – 8,874 8,874
Interest-bearing deposits with banks 9,700 – – – – 9,700 9,700
Securities purchased under resale agreements
and securities borrowing transactions 5,143 – – – – 5,143 5,136
Trading financial assets at fair value through profit or loss 20,682 20,682 – – – – 20,682
Financial assets designated at fair value through profit or loss 28,587 – 28,587 – – – 28,587
Financial assets available-for-sale 33 – – – 33 – 33
Other assets 5,679 – – – – 5,679 5,679
Assets held for sale 63,876 20,130 – – – 43,746 63,876
Total financial assets 142,574 40,812 28,587 – 33 73,142 142,567
Total
31 December 2015 Carrying Amount fair value
Total Other carrying Held for Designated amortised
CSS(E)L Group (USD million) value trading at fair value cost
Financial Liabilities
Deposits 160 – – 160 160
Securities sold under repurchase agreements and securities lending transactions 62 – – 62 62
Trading financial liabilities at fair value through profit or loss 9,789 9,789 – – 9,789
Financial liabilities designated at fair value through profit or loss 25,732 – 25,732 – 25,732
Short term borrowings 2,761 – – 2,761 2,761
Other liabilities 15,237 – – 15,237 15,237
Long term debt 26,419 – – 26,419 26,459
Liabilities held for sale 54,502 15,519 481 38,502 54,502
Total financial liabilities 134,662 25,308 26,213 83,141 134,702
Financial assets and liabilities by categories
Total
31 December 2016 Carrying amount fair value
Total Other carrying Held for Designated Loans and Available- amortised
Company (USD million) value trading at fair value receivables for-sale cost
Financial Assets
Cash and due from banks 3,183 – – – – 3,183 3,183
Interest-bearing deposits with banks 8,763 – – – – 8,763 8,763
Securities purchased under resale agreements
and securities borrowing transactions 11,686 – – – – 11,686 11,686
Trading financial assets at fair value through profit or loss 14,433 14,433 – – – – 14,433
Financial assets designated at fair value through profit or loss 23,010 – 23,010 – – – 23,010
Financial assets available-for-sale 33 – – – 33 – 33
Other assets 5,245 – – – – 5,245 5,245
Assets held for sale 51,435 18,276 – – – 33,159 51,435
Total financial assets 117,788 32,709 23,010 – 33 62,036 117,788
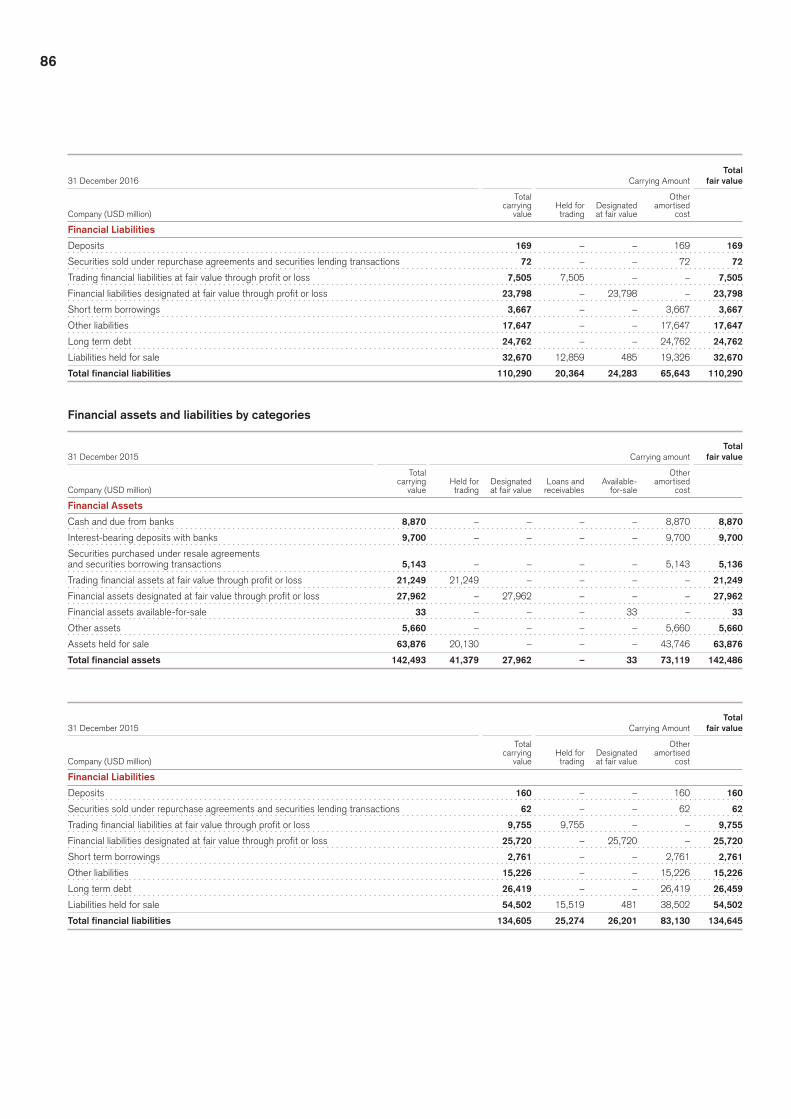
86
Total
31 December 2016 Carrying Amount fair value
Total Other carrying Held for Designated amortised
Company (USD million) value trading at fair value cost
Financial Liabilities
Deposits 169 – – 169 169
Securities sold under repurchase agreements and securities lending transactions 72 – – 72 72
Trading financial liabilities at fair value through profit or loss 7,505 7,505 – – 7,505
Financial liabilities designated at fair value through profit or loss 23,798 – 23,798 – 23,798
Short term borrowings 3,667 – – 3,667 3,667
Other liabilities 17,647 – – 17,647 17,647
Long term debt 24,762 – – 24,762 24,762
Liabilities held for sale 32,670 12,859 485 19,326 32,670
Total financial liabilities 110,290 20,364 24,283 65,643 110,290
Financial assets and liabilities by categories
Total
31 December 2015 Carrying amount fair value
Total Other carrying Held for Designated Loans and Available- amortised
Company (USD million) value trading at fair value receivables for-sale cost
Financial Assets
Cash and due from banks 8,870 – – – – 8,870 8,870
Interest-bearing deposits with banks 9,700 – – – – 9,700 9,700
Securities purchased under resale agreements
and securities borrowing transactions 5,143 – – – – 5,143 5,136
Trading financial assets at fair value through profit or loss 21,249 21,249 – – – – 21,249
Financial assets designated at fair value through profit or loss 27,962 – 27,962 – – – 27,962
Financial assets available-for-sale 33 – – – 33 – 33
Other assets 5,660 – – – – 5,660 5,660
Assets held for sale 63,876 20,130 – – – 43,746 63,876
Total financial assets 142,493 41,379 27,962 – 33 73,119 142,486
Total
31 December 2015 Carrying Amount fair value
Total Other carrying Held for Designated amortised
Company (USD million) value trading at fair value cost
Financial Liabilities
Deposits 160 – – 160 160
Securities sold under repurchase agreements and securities lending transactions 62 – – 62 62
Trading financial liabilities at fair value through profit or loss 9,755 9,755 – – 9,755
Financial liabilities designated at fair value through profit or loss 25,720 – 25,720 – 25,720
Short term borrowings 2,761 – – 2,761 2,761
Other liabilities 15,226 – – 15,226 15,226
Long term debt 26,419 – – 26,419 26,459
Liabilities held for sale 54,502 15,519 481 38,502 54,502
Total financial liabilities 134,605 25,274 26,201 83,130 134,645

87Credit Suisse Securities (Europe) Limited, Annual Report 2016
Notes to the Financial Statements for the year ended 31 December 2016
Fair value measurementFair value is the price that would be received to sell an asset or paid to transfer a liability in an orderly transaction in the principal (or most advantageous) market at the measurement date. A signif-icantportionof theCSS(E)LGroup’s financial instrumentsarecarriedatfairvalue.Deteriorationoffinancialmarketscouldsignifi-cantlyimpactthefairvalueofthesefinancialinstrumentsandtheresults of operations.
ThefairvalueofthemajorityoftheCSS(E)LGroup’sfinancialinstruments is based on quoted prices in active markets or observ-able inputs. These instruments include government and agency securities, most investment grade corporate debt, certain high grade debt securities, exchange-traded and certain OTC derivative instruments and most listed equity securities.
Inaddition,theCSS(E)LGroupholdsfinancialinstrumentsforwhich no prices are available and which have little or no observable inputs.Furtherdeteriorationoffinancialmarketscouldsignificantlyimpactthevalueofthesefinancialinstrumentsandtheresultsofoperations. For these instruments, the determination of fair value requires subjective assessment and judgement, depending on liquidity, pricing assumptions, the current economic and competi-tiveenvironmentandtherisksaffectingthespecificinstrument.Insuch circumstances, valuation is determined based on manage-ment’s own judgements about the assumptions that market partic-ipants would use in pricing the asset or liability, including assump-tions about risk. These instruments include certain OTC derivatives including equity and credit derivatives, certain corporate equi-ty-linked securities, mortgage-related securities, private equity investments, certain loans and credit products including leveraged financeandcertainhighyieldbonds,andlifefinanceinstruments.
Thefairvalueoffinancialassetsandliabilitiesisimpactedbyfactorssuchasbenchmarkinterestrates,pricesoffinancialinstru-ments issued by third parties, commodity prices, foreign exchange rates and index prices or rates. In addition, valuation adjustments are an integral part of the valuation process when market prices are not indicative of the credit quality of a counterparty, and are applied to both OTC derivatives and debt instruments. The impact of changes in a counterparty’s credit spreads (known as credit val-uation adjustments) is considered when measuring the fair value of assets and the impact of changes in the CSS(E)L Group’s own credit spreads (known as debit valuation adjustments) is consid-ered when measuring the fair value of its liabilities. For OTC deriv-atives, the impact of changes in both the CSS(E)L Group’s and the counterparty’s credit standing is considered when measuring their fair value, based on current CDS prices. The adjustments also take into account contractual factors designed to reduce the CSS(E)L Group’s credit exposure to a counterparty, such as col-lateral held and master netting agreements. For hybrid debt instru-ments with embedded derivative features, the impact of changes in the CSS(E)L Group’s credit standing is considered when mea-suring their fair value, based on current funded debt spreads.
IFRS 13 permits a reporting entity to measure the fair value of agroupoffinancialassetsandfinancial liabilitiesonthebasisofthe price that would be received to sell a net long position or paid to transfer a net short position for a particular risk exposure in an orderly transaction between market participants at the measure-ment date. This is consistent with industry practice. As such, the CSS(E)L Group applies bid and offer adjustments to net portfolios of cash securities and/or derivative instruments to adjust the value of the net position from a mid-market price to the appropriate bid or offer level that would be realised under normal market condi-tions for thenet longornetshortposition foraspecificmarketrisk. Inaddition, theCSS(E)LGroup reflects thenetmaximumexposure to credit risk for its derivative instruments where the CSS(E)L Group has legally enforceable agreements with its coun-terparties that mitigate credit risk exposure in the event of default. Valuation adjustments are recorded in a reasonable and consistent manner that results in an allocation to the relevant disclosures in thenotestothefinancialstatementsasifthevaluationadjustmenthad been allocated to the individual unit of account.
Fair value hierarchyThefinancial instrumentscarriedat fair valuewerecategorisedunder the three levels of the fair value hierarchy as follows:p Level 1: Quoted market prices (unadjusted) in active markets
for identical assets or liabilities that the CSS(E)L Group has the ability to access. This level of the fair value hierarchy pro-vides the most reliable evidence of fair value and is used to measure fair value whenever available.
p Level 2: Inputs other than quoted prices included within level 1 that are observable for the asset or liability, either directly or indirectly. These inputs include: (i) quoted prices for similar assets or liabilities in active markets; (ii) quoted prices for identical or similar assets or similar liabilities in markets that are not active, that is, markets in which there are few transac-tions for the asset and liability, the prices are not current or price quotations vary substantially either over time or among market makers, or in which little information is publicly avail-able; (iii) input other than quoted prices that are observable for the asset or liability; or (iv) inputs that are derived principally from or corroborated by observable market data by correlation or other means.
p Level 3: Inputs for the asset or liability that are not based on observable market data (unobservable inputs). These inputs reflect the CSS(E)L Group’s own assumptions about theassumptions that market participants would use in pricing the asset or liability (including assumptions about risk). These inputs are developed based on the best information available in the circumstances, which include the CSS(E)L Group’s own data. The CSS(E)L Group’s own data used to develop unob-servable inputs is adjusted if information indicates that market participants would use different assumptions.

88
Thefollowingtablepresentsthecarryingvalueofthefinancial instrumentsheldatfairvalueacrossthethreelevelsofthefairvaluehierarchy.
Fair value of assets and liabilities measured at fair value on a recurring basis
31 December 2016 Impact Total at CSS(E)L Group Level 1 Level 2 Level 3 of netting fair value
Assets (USD million)
Debt securities 810 1,721 72 – 2,603
Ofwhichforeigngovernments 810 213 – – 1,023
Ofwhichcorporates – 1,506 68 – 1,574
Ofwhichresidentialmortgagebackedsecurities – 2 4 – 6
Equity securities 7,573 336 23 – 7,932
Derivatives 10 2,517 822 (4) 3,345
Ofwhichinterestrateproducts – 1,237 – – 1,237
Ofwhichforeignexchangeproducts 1 750 – – 751
Ofwhichequity/index-relatedproducts 9 487 2 (4) 1 494
Ofwhichcreditderivatives – 1 6 – 7
Ofwhichotherderivatives – 42 814 – 856
Trading financial assets at fair value through profit or loss 8,393 4,574 917 (4) 13,880
Securities purchased under resale agreements and securities borrowing transactions – 30,586 170 (9,188) 2 21,568
Loans – – 49 – 49
Ofwhichloanstofinancialinstitutions – – 49 – 49
Other financial assets designated at fair value through profit or loss – 73 1,923 – 1,996
Ofwhichlifefinanceinstruments – – 1,767 – 1,767
Ofwhichfailedpurchases – 73 156 – 229
Financial assets designated at fair value through profit or loss – 30,659 2,142 (9,188) 23,613
Financial assets available-for-sale – – 33 – 33
Debt – 187 – – 187
Ofwhichforeigngovernments – 6 – – 6
Ofwhichcorporates – 181 – – 181
Equity securities 15,817 157 11 – 15,985
Derivatives – 2,086 18 – 2,104
Ofwhichinterestrateproducts – 5 – – 5
Ofwhichforeignexchangeproducts – 4 – – 4
Ofwhichequity/index-relatedproducts – 2,077 18 – 2,095
Trading financial assets at fair value through profit or loss 15,817 2,430 29 – 18,276
Assets Held for Sale 15,817 2,430 29 – 18,276
Total assets at fair value 24,210 37,663 3,121 (9,192) 55,802
1 Trading Financial assets at fair value through profit or loss are reported on a gross basis by level. The impact of netting represents an adjustment related to exchange traded derivatives with eligible exchanges.
2 Securities purchased under resale agreements and securities borrowing transactions are reported on a gross basis by level. The impact of netting represents an adjustment related to counterparty netting.

89Credit Suisse Securities (Europe) Limited, Annual Report 2016
Notes to the Financial Statements for the year ended 31 December 2016
Fair value of assets and liabilities measured at fair value on a recurring basis
31 December 2016 Impact Total at CSS(E)L Group Level 1 Level 2 Level 3 of netting fair value
Liabilities (USD million)
Debt securities 732 1,054 1 – 1,787
Ofwhichforeigngovernments 732 101 – – 833
Ofwhichcorporates – 953 1 – 954
Equity securities 2,760 26 – – 2,786
Derivatives 11 2,301 656 (4) 2,964
Ofwhichinterestrateproducts – 1,307 2 – 1,309
Ofwhichforeignexchangeproducts – 421 – – 421
Ofwhichequity/index-relatedproducts 11 504 3 (4) 1 514
Ofwhichcreditderivatives – 26 – – 26
Ofwhichotherderivatives – 43 651 – 694
Trading financial liabilities at fair value through profit or loss 3,503 3,381 657 (4) 7,537
Securities sold under resale agreements and securities borrowing transactions – 32,895 – (9,188) 2 23,707
Long Term Debt – – 94 – 94
Ofwhichotherdebtinstruments – – 94 – 94
Other financial liabilities designated at fair value through profit or loss – 9 – – 9
Ofwhichfailedsales – 9 – – 9
Financial liabilities designated at fair value through profit or loss – 32,904 94 (9,188) 23,810
Debt – 141 – – 141
Ofwhichforeigngovernments – 11 – – 11
Ofwhichcorporates – 130 – – 130
Equity securities 10,627 62 6 – 10,695
Derivatives – 1,999 24 – 2,023
Ofwhichinterestrateproducts – 1 – – 1
Ofwhichequity/index-relatedproducts – 1,998 24 – 2,022
Long-term debt – 485 – – 485
Of which debt instruments – 485 – – 485
Liabilities held for sale 10,627 2,687 30 – 13,344
Total liabilities at fair value 14,130 38,972 781 (9,192) 44,691
1 Trading Financial assets at fair value through profit or loss are reported on a gross basis by level. The impact of netting represents an adjustment related to exchange traded derivatives with eligible exchanges.
2 Securities purchased under resale agreements and securities borrowing transactions are reported on a gross basis by level. The impact of netting represents an adjustment related to counterparty netting.
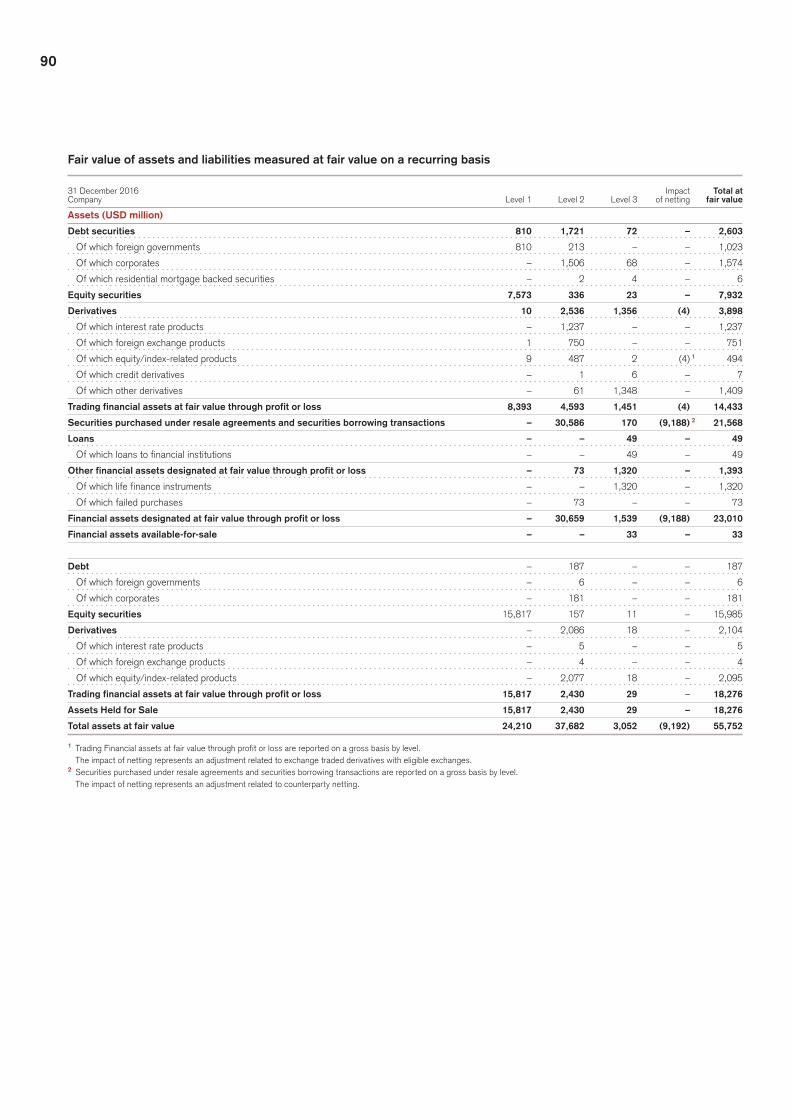
90
Fair value of assets and liabilities measured at fair value on a recurring basis
31 December 2016 Impact Total at Company Level 1 Level 2 Level 3 of netting fair value
Assets (USD million)
Debt securities 810 1,721 72 – 2,603
Ofwhichforeigngovernments 810 213 – – 1,023
Ofwhichcorporates – 1,506 68 – 1,574
Ofwhichresidentialmortgagebackedsecurities – 2 4 – 6
Equity securities 7,573 336 23 – 7,932
Derivatives 10 2,536 1,356 (4) 3,898
Ofwhichinterestrateproducts – 1,237 – – 1,237
Ofwhichforeignexchangeproducts 1 750 – – 751
Ofwhichequity/index-relatedproducts 9 487 2 (4) 1 494
Ofwhichcreditderivatives – 1 6 – 7
Ofwhichotherderivatives – 61 1,348 – 1,409
Trading financial assets at fair value through profit or loss 8,393 4,593 1,451 (4) 14,433
Securities purchased under resale agreements and securities borrowing transactions – 30,586 170 (9,188) 2 21,568
Loans – – 49 – 49
Ofwhichloanstofinancialinstitutions – – 49 – 49
Other financial assets designated at fair value through profit or loss – 73 1,320 – 1,393
Ofwhichlifefinanceinstruments – – 1,320 – 1,320
Ofwhichfailedpurchases – 73 – – 73
Financial assets designated at fair value through profit or loss – 30,659 1,539 (9,188) 23,010
Financial assets available-for-sale – – 33 – 33
Debt – 187 – – 187
Ofwhichforeigngovernments – 6 – – 6
Ofwhichcorporates – 181 – – 181
Equity securities 15,817 157 11 – 15,985
Derivatives – 2,086 18 – 2,104
Ofwhichinterestrateproducts – 5 – – 5
Ofwhichforeignexchangeproducts – 4 – – 4
Ofwhichequity/index-relatedproducts – 2,077 18 – 2,095
Trading financial assets at fair value through profit or loss 15,817 2,430 29 – 18,276
Assets Held for Sale 15,817 2,430 29 – 18,276
Total assets at fair value 24,210 37,682 3,052 (9,192) 55,752
1 Trading Financial assets at fair value through profit or loss are reported on a gross basis by level. The impact of netting represents an adjustment related to exchange traded derivatives with eligible exchanges.
2 Securities purchased under resale agreements and securities borrowing transactions are reported on a gross basis by level. The impact of netting represents an adjustment related to counterparty netting.

91Credit Suisse Securities (Europe) Limited, Annual Report 2016
Notes to the Financial Statements for the year ended 31 December 2016
Fair value of assets and liabilities measured at fair value on a recurring basis
31 December 2016 Impact Total at Company Level 1 Level 2 Level 3 of netting fair value
Liabilities (USD million)
Debt securities 732 1,054 1 – 1,787
Ofwhichforeigngovernments 732 101 – – 833
Ofwhichcorporates – 953 1 – 954
Equity securities 2,760 26 – – 2,786
Derivatives 11 2,320 605 (4) 2,932
Ofwhichinterestrateproducts – 1,307 2 – 1,309
Ofwhichforeignexchangeproducts – 421 – – 421
Ofwhichequity/index-relatedproducts 11 504 3 (4) 1 514
Ofwhichcreditderivatives – 26 – – 26
Ofwhichotherderivatives – 62 600 – 662
Trading financial liabilities at fair value through profit or loss 3,503 3,400 606 (4) 7,505
Securities sold under resale agreements and securities borrowing transactions – 32,895 – (9,188) 2 23,707
Long Term Debt – – 82 – 82
Ofwhichotherdebtinstruments – – 82 – 82
Other financial liabilities designated at fair value through profit or loss – 9 – – 9
Ofwhichfailedsales – 9 – – 9
Financial liabilities designated at fair value through profit or loss – 32,904 82 (9,188) 23,798
Debt – 141 – – 141
Ofwhichforeigngovernments – 11 – – 11
Ofwhichcorporates – 130 – – 130
Equity securities 10,627 62 6 – 10,695
Derivatives – 1,999 24 – 2,023
Ofwhichinterestrateproducts – 1 – – 1
Ofwhichequity/index-relatedproducts – 1,998 24 – 2,022
Long-term debt – 485 – – 485
Ofwhichdebtinstruments – 485 – – 485
Liabilities held for sale 10,627 2,687 30 – 13,344
Total liabilities at fair value 14,130 38,991 718 (9,192) 44,647
1 Trading Financial assets at fair value through profit or loss are reported on a gross basis by level. The impact of netting represents an adjustment related to exchange traded derivatives with eligible exchanges.
2 Securities purchased under resale agreements and securities borrowing transactions are reported on a gross basis by level. The impact of netting represents an adjustment related to counterparty netting.

92
Fair value of assets and liabilities measured at fair value on a recurring basis
31 December 2015 Impact Total at CSS(E)L Group Level 1 Level 2 Level 3 of netting fair value
Assets (USD million)
Debt securities 3,921 1,753 127 – 5,801
Ofwhichforeigngovernments 3,921 221 – – 4,142
Ofwhichcorporates – 1,518 113 – 1,631
Ofwhichresidentialmortgagebackedsecurities – 14 14 – 28
Equity securities 10,024 274 101 – 10,399
Derivatives 41 3,690 808 (57) 4,482
Ofwhichinterestrateproducts – 1,632 – – 1,632
Ofwhichforeignexchangeproducts 1 1,209 – – 1,210
Ofwhichequity/index-relatedproducts 18 833 – (57) 1 794
Ofwhichcreditderivatives – 11 8 – 19
Ofwhichotherderivatives 22 5 800 – 827
Trading financial assets at fair value through profit or loss 13,986 5,717 1,036 (57) 20,682
Securities purchased under resale agreements and securities borrowing transactions – 38,758 160 (12,468) 2 26,450
Loans – – 45 – 45
Ofwhichloanstofinancialinstitutions – – 45 – 45
Other financial assets designated at fair value through profit or loss – 49 2,043 – 2,092
Ofwhichlifefinanceinstruments – – 1,898 – 1,898
Ofwhichfailedpurchases – 49 145 – 194
Financial assets designated at fair value through profit or loss – 38,807 2,248 (12,468) 28,587
Financial assets available-for-sale – – 33 – 33
Debt 9 83 – – 92
Ofwhichforeigngovernments 9 – – – 9
Ofwhichcorporates – 83 – – 83
Equity securities 17,080 138 – – 17,218
Derivatives 19 2,771 30 – 2,820
Ofwhichinterestrateproducts – 2 – – 2
Ofwhichequity/index-relatedproducts – 2,769 30 – 2,799
Ofwhichotherderivatives 19 – – – 19
Assets held for sale 17,108 2,992 30 – 20,130
Total assets at fair value 31,094 47,516 3,347 (12,525) 69,432
1 Trading Financial assets at fair value through profit or loss are reported on a gross basis by level. The impact of netting represents an adjustment related to exchange traded derivatives with eligible exchanges.
2 Securities purchased under resale agreements and securities borrowing transactions are reported on a gross basis by level. The impact of netting represents an adjustment related to counterparty netting.
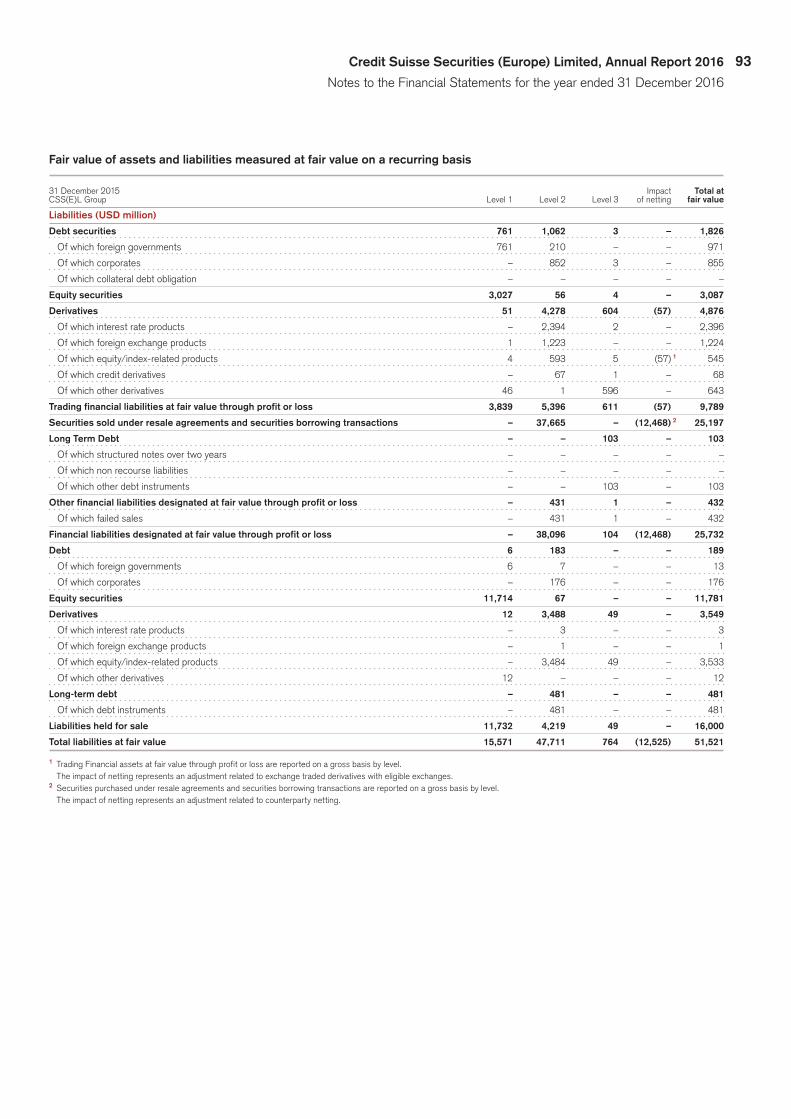
93Credit Suisse Securities (Europe) Limited, Annual Report 2016
Notes to the Financial Statements for the year ended 31 December 2016
Fair value of assets and liabilities measured at fair value on a recurring basis
31 December 2015 Impact Total at CSS(E)L Group Level 1 Level 2 Level 3 of netting fair value
Liabilities (USD million)
Debt securities 761 1,062 3 – 1,826
Ofwhichforeigngovernments 761 210 – – 971
Ofwhichcorporates – 852 3 – 855
Ofwhichcollateraldebtobligation – – – – –
Equity securities 3,027 56 4 – 3,087
Derivatives 51 4,278 604 (57) 4,876
Ofwhichinterestrateproducts – 2,394 2 – 2,396
Ofwhichforeignexchangeproducts 1 1,223 – – 1,224
Ofwhichequity/index-relatedproducts 4 593 5 (57) 1 545
Ofwhichcreditderivatives – 67 1 – 68
Ofwhichotherderivatives 46 1 596 – 643
Trading financial liabilities at fair value through profit or loss 3,839 5,396 611 (57) 9,789
Securities sold under resale agreements and securities borrowing transactions – 37,665 – (12,468) 2 25,197
Long Term Debt – – 103 – 103
Ofwhichstructurednotesovertwoyears – – – – –
Ofwhichnonrecourseliabilities – – – – –
Ofwhichotherdebtinstruments – – 103 – 103
Other financial liabilities designated at fair value through profit or loss – 431 1 – 432
Ofwhichfailedsales – 431 1 – 432
Financial liabilities designated at fair value through profit or loss – 38,096 104 (12,468) 25,732
Debt 6 183 – – 189
Ofwhichforeigngovernments 6 7 – – 13
Ofwhichcorporates – 176 – – 176
Equity securities 11,714 67 – – 11,781
Derivatives 12 3,488 49 – 3,549
Ofwhichinterestrateproducts – 3 – – 3
Ofwhichforeignexchangeproducts – 1 – – 1
Ofwhichequity/index-relatedproducts – 3,484 49 – 3,533
Ofwhichotherderivatives 12 – – – 12
Long-term debt – 481 – – 481
Ofwhichdebtinstruments – 481 – – 481
Liabilities held for sale 11,732 4,219 49 – 16,000
Total liabilities at fair value 15,571 47,711 764 (12,525) 51,521
1 Trading Financial assets at fair value through profit or loss are reported on a gross basis by level. The impact of netting represents an adjustment related to exchange traded derivatives with eligible exchanges.
2 Securities purchased under resale agreements and securities borrowing transactions are reported on a gross basis by level. The impact of netting represents an adjustment related to counterparty netting.

94
Fair value of assets and liabilities measured at fair value on a recurring basis
31 December 2015 Impact Total at Company Level 1 Level 2 Level 3 of netting fair value
Assets (USD million)
Debt securities 3,921 1,753 127 – 5,801
Ofwhichforeigngovernments 3,921 221 – – 4,142
Ofwhichcorporates – 1,518 113 – 1,631
Ofwhichresidentialmortgagebackedsecurities – 14 14 – 28
Equity securities 10,024 274 101 – 10,399
Derivatives 41 3,689 1,376 (57) 5,049
Ofwhichinterestrateproducts – 1,632 – – 1,632
Ofwhichforeignexchangeproducts 1 1,209 – – 1,210
Ofwhichequity/index-relatedproducts 18 832 – (57) 1 793
Ofwhichcreditderivatives – 11 8 – 19
Ofwhichotherderivatives 22 5 1,368 – 1,395
Trading financial assets at fair value through profit or loss 13,986 5,716 1,604 (57) 21,249
Securities purchased under resale agreements and securities borrowing transactions – 38,758 160 (12,468) 2 26,450
Loans – – 45 – 45
Ofwhichloanstofinancialinstitutions – – 45 – 45
Other financial assets designated at fair value through profit or loss – 49 1,418 – 1,467
Ofwhichlifefinanceinstruments – – 1,418 – 1,418
Ofwhichfailedpurchases – 49 – – 49
Financial assets designated at fair value through profit or loss – 38,807 1,623 (12,468) 27,962
Financial assets available-for-sale – – 33 – 33
Debt 9 83 – – 92
Ofwhichforeigngovernments 9 – – – 9
Ofwhichcorporates – 83 – – 83
Equity securities 17,080 138 – – 17,218
Derivatives 19 2,771 30 – 2,820
Ofwhichinterestrateproducts – 2 – – 2
Ofwhichequity/index-relatedproducts – 2,769 30 – 2,799
Ofwhichotherderivatives 19 – – – 19
Assets held for sale 17,108 2,992 30 – 20,130
Total assets at fair value 31,094 47,515 3,290 (12,525) 69,374
1 Trading Financial assets at fair value through profit or loss are reported on a gross basis by level. The impact of netting represents an adjustment related to exchange traded derivatives with eligible exchanges.
2 Securities purchased under resale agreements and securities borrowing transactions are reported on a gross basis by level. The impact of netting represents an adjustment related to counterparty netting.

95Credit Suisse Securities (Europe) Limited, Annual Report 2016
Notes to the Financial Statements for the year ended 31 December 2016
Fair value of assets and liabilities measured at fair value on a recurring basis
31 December 2015 Impact Total at Company Level 1 Level 2 Level 3 of netting fair value
Liabilities (USD million)
Debt securities 761 1,062 3 – 1,826
Ofwhichforeigngovernments 761 210 – – 971
Ofwhichcorporates – 852 3 – 855
Equity securities 3,027 56 4 – 3,087
Derivatives 51 4,277 571 (57) 4,842
Ofwhichinterestrateproducts – 2,393 2 – 2,395
Ofwhichforeignexchangeproducts 1 1,223 – – 1,224
Ofwhichequity/index-relatedproducts 4 593 5 (57) 1 545
Ofwhichcreditderivatives – 67 1 – 68
Ofwhichotherderivatives 46 1 563 – 610
Trading financial liabilities at fair value through profit or loss 3,839 5,395 578 (57) 9,755
Securities sold under resale agreements and securities borrowing transactions – 37,665 – (12,468) 2 25,197
Long Term Debt – – 92 – 92
Ofwhichstructurednotesovertwoyears – – – – –
Ofwhichotherdebtinstruments – – 92 – 92
Other financial liabilities designated at fair value through profit or loss – 431 – – 431
Ofwhichfailedsales – 431 – – 431
Financial liabilities designated at fair value through profit or loss – 38,096 92 (12,468) 25,720
Debt 6 183 – – 189
Ofwhichforeigngovernments 6 7 – – 13
Ofwhichcorporates – 176 – – 176
Equity securities 11,714 67 – – 11,781
Derivatives 12 3,488 49 – 3,549
Ofwhichinterestrateproducts – 3 – – 3
Ofwhichforeignexchangeproducts – 1 – – 1
Ofwhichequity/index-relatedproducts – 3,484 49 – 3,533
Ofwhichotherderivatives 12 – – – 12
Long-term debt – 481 – – 481
Ofwhichdebtinstruments – 481 – – 481
Liabilities held for sale 11,732 4,219 49 – 16,000
Total liabilities at fair value 15,571 47,710 719 (12,525) 51,475
1 Trading Financial assets at fair value through profit or loss are reported on a gross basis by level. The impact of netting represents an adjustment related to exchange traded derivatives with eligible exchanges.
2 Securities purchased under resale agreements and securities borrowing transactions are reported on a gross basis by level. The impact of netting represents an adjustment related to counterparty netting.
Transfers between level 1 and level 2Transfers out of level 1 to level 2 are primarily driven by debt and equity securities where there is lack of activity in market or low trading volume. Transfers to level 1 out of level 2 are primarily
driven by debt and equity securities where the values become observable or higher trading volume and subsequently lacked pric-ing transparency. All transfers were reported at the end of the reporting period.
Thefollowingtableshowsthetransfersfromlevel 1 tolevel 2andfromlevel 2tolevel 1 ofthefairvaluehierarchy.
CSS(E)L Group and Company (USD million) 2016 1 2015 1
Transfers Transfers to Transfers Transfers to out of level level 1 out out of level level 1 out 1 to level 2 of level 2 1 to level 2 of level 2
Assets
Trading financial assets at fair value through profit or loss 1,312 673 854 449
Total transfers in assets at fair value 1,312 673 854 449
Liabilities
Trading financial liabilities at fair value through profit or loss 46 70 87 456
Total transfers in liabilities at fair value 46 70 87 456
1 Amounts in the above table includes both continued and discontinued operations.

96
Movements of level 3 instrumentsThe following tablepresentsa reconciliationof financial instru-ments categorised in level 3 of the fair value hierarchy.
Assets and liabilities measured at fair value on a recurring basis for Level 3
Gains/
Balance at (Losses) Balance
beginning Transfers Transfers Issua- Settle- Trading included at end
As at December 2016 of period in out Purchases Sales nces ments revenues in OCI of period
On transfers On all
CSS(E)L Group Assets in/out 1 other
Assets at fair value (USD million)
Debt securities 127 4 (13) 155 (171) – – – (30) – 72
Ofwhichcorporates 113 2 (10) 154 (165) – – – (26) – 68
Ofwhichresidentialmortgage
backedsecurities 14 2 (3) 1 (6) – – – (4) – 4
Ofwhichcommercialmortgage
backedsecurities – – – – – – – – – – –
Equity securities 101 22 (50) 85 (122) – – (2) (11) – 23
Derivatives 808 – – – – 311 (369) – 72 – 822
Ofwhichequity/index-relatedproducts – – – – – 1 – – 1 – 2
Ofwhichcreditderivatives 8 – – – – – (2) – – – 6
Ofwhichotherderivatives 800 – – – – 310 (367) – 71 – 814
Trading financial assets at fair value
through profit or loss 1,036 26 (63) 240 (293) 311 (369) (2) 31 – 917
Securities purchased under resale
agreements and securities
borrowing transactions 160 – – – – 232 (223) – 1 – 170
Loans 45 – – – – 85 (87) – 6 – 49
Ofwhichloanstofinancialinstitutions 45 – – – – 85 (87) – 6 – 49
Other financial assets designated
at fair value through profit or loss 2,043 – – 247 (436) – – – 69 – 1,923
Ofwhichlifefinanceinstruments 1,898 – – 240 (429) – – – 58 – 1,767
Ofwhichfailedpurchases 145 – – 7 (7) – – – 11 – 156
Financial assets designated
at fair value through profit or loss 2,248 – – 247 (436) 317 (310) – 76 – 2,142
Financial assets available-for-sale 33 – – – – – – – – – 33
Equity securities – 16 – 15 (26) – – – 6 – 11
Derivatives 30 19 (2) – – 2 (43) 2 10 – 18
Ofwhichequity/index-relatedproducts 30 19 (2) – – 2 (43) 2 10 – 18
Assets held for sale 30 35 (2) 15 (26) 2 (43) 2 16 – 29
Total assets at fair value 3,347 61 (65) 502 (755) 630 (722) – 123 – 3,121
1 For all the transfers to level 3 or out of level 3, the CSS(E)L Group determines and discloses as level 3 events only gains or losses through the last day of the reporting period.

97Credit Suisse Securities (Europe) Limited, Annual Report 2016
Notes to the Financial Statements for the year ended 31 December 2016
Assets and liabilities measured at fair value on a recurring basis for Level 3
Gains/
Balance at (Losses) Balance
beginning Transfers Transfers Issua- Settle- Trading included at end
As at December 2016 of period in out Purchases Sales nces ments revenues in OCI of period
On transfers On all
CSS(E)L Group Liabilities in/out 1 other
Liabilities at fair value (USD million)
Debt securities 3 – (3) 7 (3) – – – (3) – 1
Ofwhichcorporates 3 – (3) 7 (3) – – – (3) – 1
Equity securities 4 1 – 3 (8) – – – – – –
Derivatives 604 2 – – (2) 282 (240) (1) 11 – 656
Ofwhichinterestrateproducts 2 – – – – – – – – – 2
Ofwhichequity/index-relatedproducts 5 – – – – – – – (2) – 3
Ofwhichcreditderivatives 1 2 – – – – (1) (1) (1) – –
Ofwhichotherderivatives 596 – – – (2) 282 (239) – 14 – 651
Trading financial liabilities
at fair value through profit or loss 611 3 (3) 10 (13) 282 (240) (1) 8 – 657
Long term debt 103 – – – – 21 (31) – 1 – 94
Ofwhichnonrecourseliabilities – – – – – – – – – – –
Ofwhichotherdebtinstruments 103 – – – – 21 (31) – 1 – 94
Other financial liabilities designated
at fair value through profit or loss 1 – – – – – – – (1) – –
Of which failed sales 1 – – – – – – – (1) – –
Financial liabilities designated
at fair value through profit or loss 104 – – – – 21 (31) – – – 94
Equity securities – 7 – 3 – – – – (4) – 6
Derivatives 49 17 (12) – – 11 (49) 5 3 – 24
Ofwhichequity/index-relatedproducts 49 17 (12) – – 11 (49) 5 3 – 24
Liabilities held for sale 49 24 (12) 3 – 11 (49) 5 (1) – 30
Total liabilities at fair value 764 27 (15) 13 (13) 314 (320) 4 7 – 781
1 For all the transfers to level 3 or out of level 3, the CSS(E)L Group determines and discloses as level 3 events only gains or losses through the last day of the reporting period.

98
Assets and liabilities measured at fair value on a recurring basis for Level 3
Gains/
Balance at (Losses) Balance
beginning Transfers Transfers Issua- Settle- Trading included at end
As at December 2016 of period in out Purchases Sales nces ments revenues in OCI of period
On transfers On all
Company Assets in/out 1 other
Assets at fair value (USD million)
Debt securities 127 4 (13) 155 (171) – – – (30) – 72
Ofwhichcorporates 113 2 (10) 154 (165) – – – (26) – 68
Ofwhichresidentialmortgage
backedsecurities 14 2 (3) 1 (6) – – – (4) – 4
Ofwhichcommercialmortgage
backedsecurities – – – – – – – – – – –
Equity securities 101 22 (50) 85 (122) – – (2) (11) – 23
Derivatives 1,376 – – – – 289 (369) – 60 – 1,356
Ofwhichequity/index-relatedproducts – – – – – 1 – – 1 – 2
Ofwhichcreditderivatives 8 – – – – – (2) – – – 6
Ofwhichotherderivatives 1,368 – – – – 288 (367) – 59 – 1,348
Trading financial assets at fair value
through profit or loss 1,604 26 (63) 240 (293) 289 (369) (2) 19 – 1,451
Securities purchased under resale
agreements and securities
borrowing transactions 160 – – – – 232 (223) – 1 – 170
Loans 45 – – – – 85 (87) – 6 – 49
Ofwhichloanstofinancialinstitutions 45 – – – – 85 (87) – 6 – 49
Other financial assets designated
at fair value through profit or loss 1,418 – – 132 (254) – – – 24 – 1,320
Of which life finance instruments 1,418 – – 132 (254) – – – 24 – 1,320
Financial assets designated
at fair value through profit or loss 1,623 – – 132 (254) 317 (310) – 31 – 1,539
Financial assets available-for-sale 33 – – – – – – – – – 33
Equity securities – 16 – 15 (26) – – – 6 – 11
Derivatives 30 19 (2) – – 2 (43) 2 10 – 18
Ofwhichequity/index-relatedproducts 30 19 (2) – – 2 (43) 2 10 – 18
Assets held for sale 30 35 (2) 15 (26) 2 (43) 2 16 – 29
Total assets at fair value 3,290 61 (65) 387 (573) 608 (722) – 66 – 3,052
1 For all the transfers to level 3 or out of level 3, the CSS(E)L Group determines and discloses as level 3 events only gains or losses through the last day of the reporting period.

99Credit Suisse Securities (Europe) Limited, Annual Report 2016
Notes to the Financial Statements for the year ended 31 December 2016
Assets and liabilities measured at fair value on a recurring basis for Level 3
Gains/
Balance at (Losses) Balance
beginning Transfers Transfers Issua- Settle- Trading included at end
As at December 2016 of period in out Purchases Sales nces ments revenues in OCI of period
On transfers On all
Company Liabilities in/out 1 other
Liabilities at fair value (USD million)
Debt securities 3 – (3) 7 (3) – – – (3) – 1
Ofwhichcorporates 3 – (3) 7 (3) – – – (3) – 1
Equity securities 4 1 – 3 (8) – – – – – –
Derivatives 571 2 – – – 253 (232) (1) 12 – 605
Ofwhichinterestrateproducts 2 – – – – – – – – – 2
Ofwhichequity/index-relatedproducts 5 – – – – – – – (2) – 3
Ofwhichcreditderivatives 1 2 – – – – (1) (1) (1) – –
Ofwhichotherderivatives 563 – – – – 253 (231) – 15 – 600
Trading financial liabilities
at fair value through profit or loss 578 3 (3) 10 (11) 253 (232) (1) 9 – 606
Long term debt 92 – – – – 21 (32) – 1 – 82
Ofwhichstructurednotesovertwoyears – – – – – – – – – – –
Ofwhichotherdebtinstruments 92 – – – – 21 (32) – 1 – 82
Other financial liabilities designated
at fair value through profit or loss – – – – – – – – – – –
Of which failed sales – – – – – – – – – – –
Financial liabilities designated
at fair value through profit or loss 92 – – – – 21 (32) – 1 – 82
Equity securities – 7 – 3 – – – – (4) – 6
Derivatives 49 17 (12) – – 11 (49) 5 3 – 24
Ofwhichequity/index-relatedproducts 49 17 (12) – – 11 (49) 5 3 – 24
Liabilities held for sale 49 24 (12) 3 – 11 (49) 5 (1) – 30
Total liabilities at fair value 719 27 (15) 13 (11) 285 (313) 4 9 – 718
1 For all the transfers to level 3 or out of level 3, the CSS(E)L Group determines and discloses as level 3 events only gains or losses through the last day of the reporting period.

100
Assets and liabilities measured at fair value on a recurring basis for Level 3
Gains/
Balance at (Losses) Balance
beginning Transfers Transfers Issua- Settle- Trading included at end
As at December 2015 of period in out Purchases Sales nces ments revenues in OCI of period
On transfers On all
CSS(E)L Group Assets in/out 1 other
Assets at fair value (USD million)
Debt securities 109 52 (27) 125 (123) – – (1) (8) – 127
Ofwhichcorporates 102 49 (27) 97 (102) – – (1) (5) – 113
Ofwhichresidentialmortgage
backedsecurities 5 3 – 28 (21) – – – (1) – 14
Ofwhichcommercialmortgage
backedsecurities 2 – – – – – – – (2) – –
Equity securities 130 113 (100) 22 (62) – – 13 (15) – 101
Derivatives 901 8 (4) – – 313 (486) 56 20 – 808
Ofwhichequity/index-relatedproducts 38 8 (4) – – – (67) 56 (31) – –
Ofwhichcreditderivatives 22 – – – – – (1) – (13) – 8
Ofwhichotherderivatives 841 – – – – 313 (418) – 64 – 800
Trading financial assets at fair value
through profit or loss 1,140 173 (131) 147 (185) 313 (486) 68 (3) – 1,036
Securities purchased under resale
agreements and securities
borrowing transactions 78 – (41) – – 270 (147) – – – 160
Loans 106 – – – – 66 (67) – (60) – 45
Ofwhichloanstofinancialinstitutions 106 – – – – 66 (67) – (60) – 45
Other financial assets designated
at fair value through profit or loss 2,073 – – 411 (449) – – – 8 – 2,043
Of which life finance instruments 1,957 – – 404 (442) – – – (21) – 1,898
Ofwhichfailedpurchases 116 – – 7 (7) – – – 29 – 145
Financial assets designated
at fair value through profit or loss 2,257 – (41) 411 (449) 336 (214) – (52) – 2,248
Financial assets available-for-sale 33 – – – – – – – – – 33
Assets held for sale – 6 (3) – – 41 (2) 3 (15) – 30
Derivatives
Ofwhichequity/index-relatedproducts – 6 (3) – – 41 (2) 3 (15) – 30
Total assets at fair value 3,430 179 (175) 558 (634) 690 (702) 71 (70) – 3,347
1 For all the transfers to level 3 or out of level 3, the CSS(E)L Group determines and discloses as level 3 events only gains or losses through the last day of the reporting period.
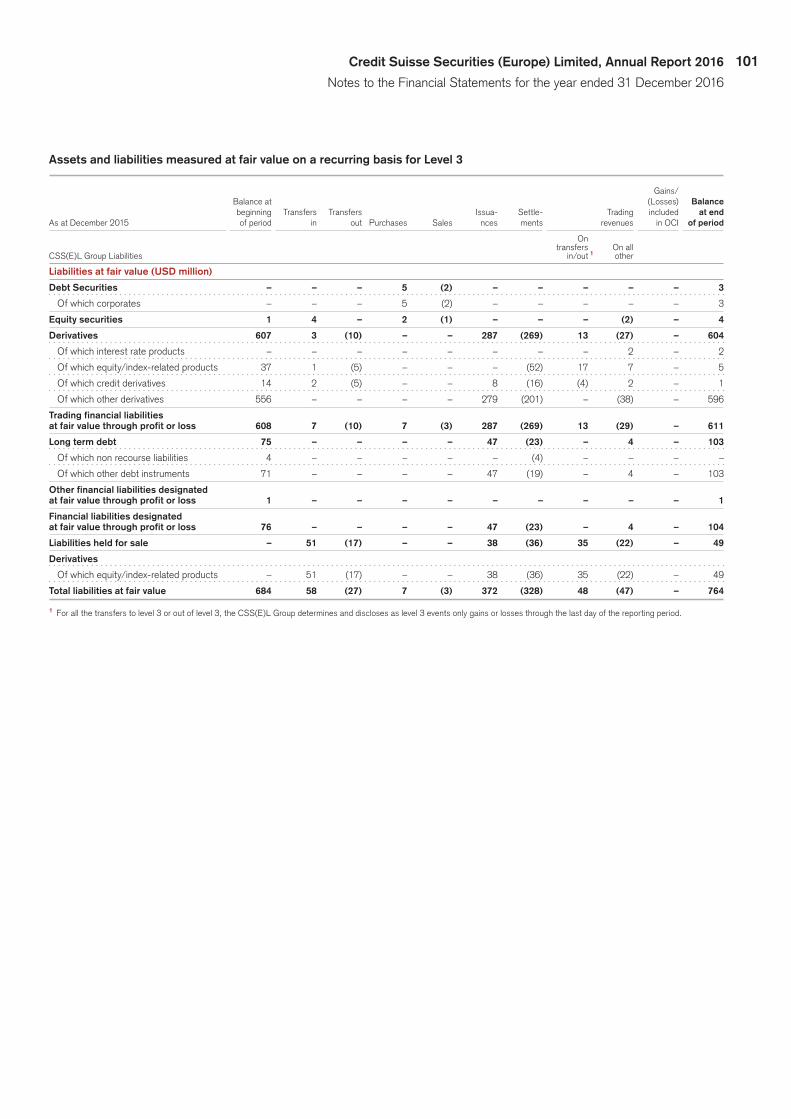
101Credit Suisse Securities (Europe) Limited, Annual Report 2016
Notes to the Financial Statements for the year ended 31 December 2016
Assets and liabilities measured at fair value on a recurring basis for Level 3
Gains/
Balance at (Losses) Balance
beginning Transfers Transfers Issua- Settle- Trading included at end
As at December 2015 of period in out Purchases Sales nces ments revenues in OCI of period
On transfers On all
CSS(E)L Group Liabilities in/out 1 other
Liabilities at fair value (USD million)
Debt Securities – – – 5 (2) – – – – – 3
Ofwhichcorporates – – – 5 (2) – – – – – 3
Equity securities 1 4 – 2 (1) – – – (2) – 4
Derivatives 607 3 (10) – – 287 (269) 13 (27) – 604
Ofwhichinterestrateproducts – – – – – – – – 2 – 2
Ofwhichequity/index-relatedproducts 37 1 (5) – – – (52) 17 7 – 5
Ofwhichcreditderivatives 14 2 (5) – – 8 (16) (4) 2 – 1
Ofwhichotherderivatives 556 – – – – 279 (201) – (38) – 596
Trading financial liabilities
at fair value through profit or loss 608 7 (10) 7 (3) 287 (269) 13 (29) – 611
Long term debt 75 – – – – 47 (23) – 4 – 103
Ofwhichnonrecourseliabilities 4 – – – – – (4) – – – –
Ofwhichotherdebtinstruments 71 – – – – 47 (19) – 4 – 103
Other financial liabilities designated
at fair value through profit or loss 1 – – – – – – – – – 1
Financial liabilities designated
at fair value through profit or loss 76 – – – – 47 (23) – 4 – 104
Liabilities held for sale – 51 (17) – – 38 (36) 35 (22) – 49
Derivatives
Ofwhichequity/index-relatedproducts – 51 (17) – – 38 (36) 35 (22) – 49
Total liabilities at fair value 684 58 (27) 7 (3) 372 (328) 48 (47) – 764
1 For all the transfers to level 3 or out of level 3, the CSS(E)L Group determines and discloses as level 3 events only gains or losses through the last day of the reporting period.

102
Assets and liabilities measured at fair value on a recurring basis for Level 3
Gains/
Balance at (Losses) Balance
beginning Transfers Transfers Issua- Settle- Trading included at end
As at December 2015 of period in out Purchases Sales nces ments revenues in OCI of period
On transfers On all
Company Assets in/out 1 other
Assets at fair value (USD million)
Debt securities 111 52 (27) 125 (125) – – (1) (8) – 127
Ofwhichforeigngovernments – – – – – – – – – – –
Ofwhichcorporates 102 49 (27) 97 (102) – – (1) (5) – 113
Ofwhichresidentialmortgage
backedsecurities 7 3 – 28 (23) – – – (1) – 14
Ofwhichcommercialmortgage
backedsecurities 2 – – – – – – – (2) – –
Equity securities 130 113 (100) 22 (62) – – 13 (15) – 101
Derivatives 1,453 8 (4) – – 355 (514) 56 22 – 1,376
Ofwhichequity/index-relatedproducts 38 8 (4) – – – (67) 56 (31) – –
Ofwhichcreditderivatives 22 – – – – – (1) – (13) – 8
Ofwhichotherderivatives 1,393 – – – – 355 (446) – 66 – 1,368
Trading financial assets at fair value
through profit or loss 1,694 173 (131) 147 (187) 355 (514) 68 (1) – 1,604
Securities purchased under resale
agreements and securities
borrowing transactions 78 – (41) – – 270 (147) – – – 160
Loans 106 – – – – 66 (67) – (60) – 45
Ofwhichloanstofinancialinstitutions 106 – – – – 66 (67) – (60) – 45
Other financial assets designated
at fair value through profit or loss 1,427 – – 150 (167) – – – 8 – 1,418
Ofwhichlifefinanceinstruments 1,427 – – 150 (167) – – – 8 – 1,418
Financial assets designated
at fair value through profit or loss 1,611 – (41) 150 (167) 336 (214) – (52) – 1,623
Financial assets available-for-sale 33 – – – – – – – – – 33
Assets held for sale – 6 (3) – – 41 (2) 3 (15) – 30
Derivatives
Ofwhichequity/index-relatedproducts – 6 (3) – – 41 (2) 3 (15) – 30
Total assets at fair value 3,338 179 (175) 297 (354) 732 (730) 71 (68) – 3,290
1 For all the transfers to level 3 or out of level 3, the CSS(E)L Group determines and discloses as level 3 events only gains or losses through the last day of the reporting period.
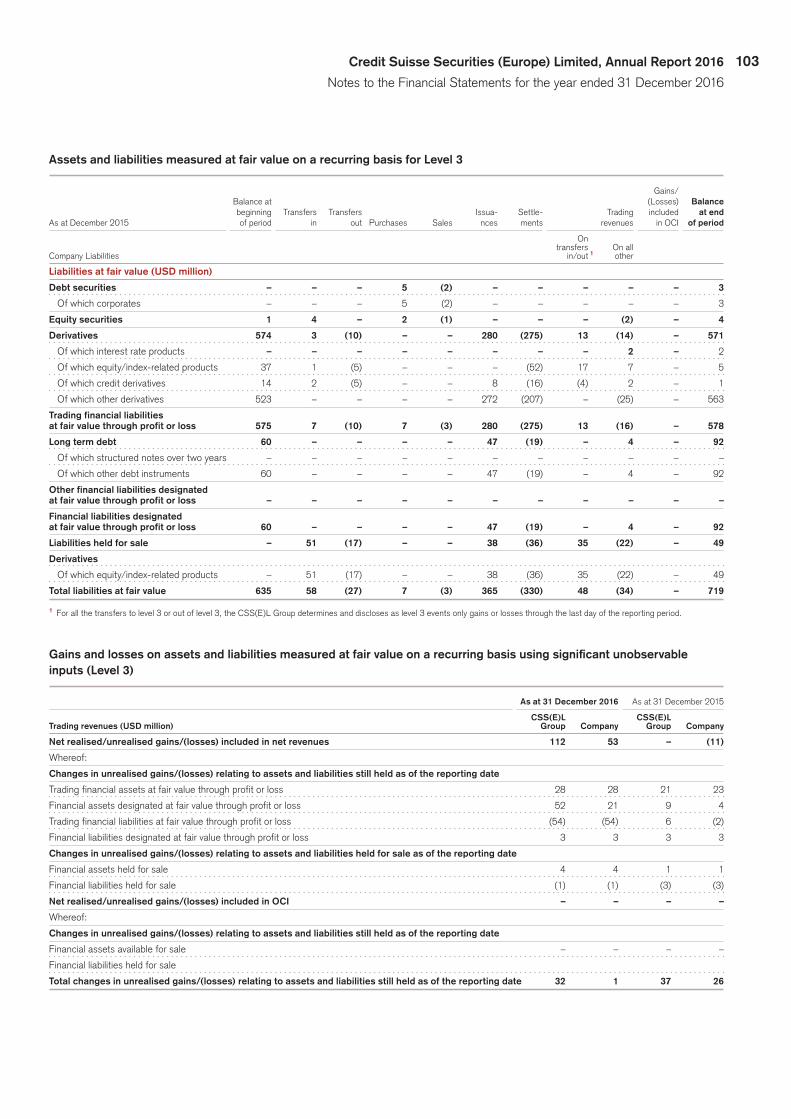
103Credit Suisse Securities (Europe) Limited, Annual Report 2016
Notes to the Financial Statements for the year ended 31 December 2016
Assets and liabilities measured at fair value on a recurring basis for Level 3
Gains/
Balance at (Losses) Balance
beginning Transfers Transfers Issua- Settle- Trading included at end
As at December 2015 of period in out Purchases Sales nces ments revenues in OCI of period
On transfers On all
Company Liabilities in/out 1 other
Liabilities at fair value (USD million)
Debt securities – – – 5 (2) – – – – – 3
Ofwhichcorporates – – – 5 (2) – – – – – 3
Equity securities 1 4 – 2 (1) – – – (2) – 4
Derivatives 574 3 (10) – – 280 (275) 13 (14) – 571
Ofwhichinterestrateproducts – – – – – – – – 2 – 2
Ofwhichequity/index-relatedproducts 37 1 (5) – – – (52) 17 7 – 5
Ofwhichcreditderivatives 14 2 (5) – – 8 (16) (4) 2 – 1
Ofwhichotherderivatives 523 – – – – 272 (207) – (25) – 563
Trading financial liabilities
at fair value through profit or loss 575 7 (10) 7 (3) 280 (275) 13 (16) – 578
Long term debt 60 – – – – 47 (19) – 4 – 92
Ofwhichstructurednotesovertwoyears – – – – – – – – – – –
Ofwhichotherdebtinstruments 60 – – – – 47 (19) – 4 – 92
Other financial liabilities designated
at fair value through profit or loss – – – – – – – – – – –
Financial liabilities designated
at fair value through profit or loss 60 – – – – 47 (19) – 4 – 92
Liabilities held for sale – 51 (17) – – 38 (36) 35 (22) – 49
Derivatives
Ofwhichequity/index-relatedproducts – 51 (17) – – 38 (36) 35 (22) – 49
Total liabilities at fair value 635 58 (27) 7 (3) 365 (330) 48 (34) – 719
1 For all the transfers to level 3 or out of level 3, the CSS(E)L Group determines and discloses as level 3 events only gains or losses through the last day of the reporting period.
Gains and losses on assets and liabilities measured at fair value on a recurring basis using significant unobservable inputs (Level 3)
As at 31 December 2016 As at 31 December 2015
CSS(E)L CSS(E)L
Trading revenues (USD million) Group Company Group Company
Net realised/unrealised gains/(losses) included in net revenues 112 53 – (11)
Whereof:
Changes in unrealised gains/(losses) relating to assets and liabilities still held as of the reporting date
Trading financial assets at fair value through profit or loss 28 28 21 23
Financial assets designated at fair value through profit or loss 52 21 9 4
Trading financial liabilities at fair value through profit or loss (54) (54) 6 (2)
Financial liabilities designated at fair value through profit or loss 3 3 3 3
Changes in unrealised gains/(losses) relating to assets and liabilities held for sale as of the reporting date
Financial assets held for sale 4 4 1 1
Financial liabilities held for sale (1) (1) (3) (3)
Net realised/unrealised gains/(losses) included in OCI – – – –
Whereof:
Changes in unrealised gains/(losses) relating to assets and liabilities still held as of the reporting date
Financial assets available for sale – – – –
Financial liabilities held for sale
Total changes in unrealised gains/(losses) relating to assets and liabilities still held as of the reporting date 32 1 37 26
104
Both observable and unobservable inputs may be used to deter-mine the fair valueofpositions thathavebeenclassifiedwithinLevel 3. As a result, the unrealised gains and losses from assets and liabilities within Level 3 presented in the table above may include changes in fair value that were attributable to both observ-able and unobservable inputs.
The CSS(E)L Group employs various economic hedging tech-niques inorder tomanage risks, including risks inLevel 3posi-tions.Suchtechniquesmayincludethepurchaseorsaleoffinan-cial instruments that are classified in Levels 1 and/or 2. Therealised and unrealised gains and losses for assets and liabilities in Level 3presentedinthetableabovedonotreflecttherelatedreal-ised or unrealised gains and losses arising on economic hedging instrumentsclassifiedinLevels1 and/or2.
Transfers in and out of level 3Trading financial assets at fair value through profit or lossTradingfinancialassetstransferredintoandoutoflevel3in2016amounted to USD 26 million and USD 63 million, respectively for Group and Company. USD 4 million of transfers into level 3 was related to debt securities and USD 22 million of transfer into level 3 related to equity securities due to limited observability of pricing data and reduced pricing information from external providers USD 50 million of transfers out of level 3 largely comprises equity secu-rities due to improved observability of pricing data and increased availability of pricing information from external providers.
Assets held for sale transferred into and out of level 3 in 2016 amounted to USD 35 million and USD 2 million, respectively for Group and Company. USD 19 million of assets held for sale trans-fers into level 3 was related to derivatives and USD 16 million relates to equity securities due to limited observability of pricing data and reduced pricing information from external providers.
Tradingfinancialassets transferred intoandoutof level3 in2015 amounted to USD 173 million and USD 131 million, respec-tively for Group and Company. USD 49 million of transfers into level 3 was related to debt securities primarily in Leveraged Finance trading business and Investment Grade trading business due to limited observability of pricing data and reduced pricing information from external providers and USD 113 million of transfer into level 3 related to equity securities, primarily in Leveraged Finance trading business. USD 100 million of transfers out of level 3 largely comprises equity securities primarily in Leveraged Finance trading business due to improved observability of pricing data and increased availability of pricing information from external providers.
Assets held for sale transferred into and out of level 3 in 2015 amounted to USD 6 million and USD 3 million, respectively for Group and Company
Trading financial liabilities at fair value through profit or lossTradingfinancial liabilities transferred intoandoutof level3 in2016 amounted to USD 3 million for Group and Company both.
Tradingfinancialliabilitiestransferredintoandoutoflevel3in2015 amounted to USD 7 million and USD 10 million, respectively for Group and Company.
Liabilities held for sale transferred into and out of level 3 in 2016 amounted to USD 24 million and USD 12 million,
respectively for Group and Company. USD 17 million of liabilities held for sale transfers into level 3 relates to derivatives due to lim-ited observability of pricing data and reduced pricing information from external providers.
Liabilities held for sale transferred into and out of level 3 in 2015 amounted to USD 51 million and USD 17 million, respec-tively for Group and Company. USD 51 million of transfers into level 3 was related to derivatives, due to limited observability of pricing data and reduced pricing information from external provid-ers. USD 17 million transfers out of level 3 largely comprises of derivativesprimarilyinprimeflowbusinessduetoimprovedobserv-ability of pricing data and increased availability of pricing informa-tion from external providers.
Qualitative disclosures of valuation techniquesThe CSS(E)L Group has implemented and maintains a valuation control framework, which is supported by policies and procedures that define the principles for controlling the valuation of theCSS(E)LGroup’sfinancialinstruments.ProductControlandRiskManagementcreate,reviewandapprovesignificantvaluationpoli-cies and procedures. The framework includes three main internal processes:(i)valuationgovernance;(ii)independentpriceverifica-tion and significant unobservable inputs review; and (iii) across-functional pricing model review. Through this framework, the CSS(E)L Group determines the reasonableness of the fair valueofitsfinancialinstruments.
On a monthly basis, meetings are held for each business line withseniorrepresentativesoftheFrontOfficeandProductControltodiscussindependentpriceverificationresults,valuationadjust-ments,andothersignificantvaluationissues.Onaquarterlybasis,areviewofsignificantchangesinthefairvalueoffinancialinstru-ments is undertaken by Product Control and conclusions are reached regarding the reasonableness of those changes. Addi-tionally, on a quarterly basis, meetings are held for each business linewithseniorrepresentativesoftheFrontOffice,ProductCon-trol, Risk Management, and Financial Accounting to discuss inde-pendentpriceverification results, valuation issues,businessandmarketupdates,aswellasareviewofsignificantchangesinfairvalue from thepriorquarter, significantunobservable inputsandprices used in valuation techniques, and valuation adjustments.
The results of these meetings are aggregated for presentation to the Valuation and Risk Management Committee (‘VARMC’) and the Audit Committee. The VARMC, which is run as a sub-commit-tee of CSG VARMC and is comprised of Credit Suisse Group AG’s Executive Board members and the heads of the business and con-trol functions meets to review and ratify valuation review conclu-sions,andtoresolvesignificantvaluationissuesfortheCSS(E)LGroup. Oversight of the valuation control framework is through specificand regular reportingonvaluationdirectly to theCreditSuisse Group AG’s Executive Board through the VARMC.
One of the key components of the governance process is the segregationofdutiesbetweentheFrontOfficeandProductCon-trol.TheFrontOfficeisresponsibleformeasuringinventoryatfairvalue on a daily basis, while Product Control is responsible for independently reviewing and validating those valuations on a peri-odicbasis.TheFrontOfficevaluestheinventoryusing,whereverpossible, observable market data which may include executed
105Credit Suisse Securities (Europe) Limited, Annual Report 2016
Notes to the Financial Statements for the year ended 31 December 2016
transactions, dealer quotes, or broker quotes for the same or sim-ilar instruments. Product Control validates this inventory using independently sourced data that also includes executed transac-tions, dealer quotes, and broker quotes.
Product Control utilises independent pricing service data as part of their review process. Independent pricing service data is analysed to ensure that it is representative of fair value including confirmingthatthedatacorrespondstoexecutedtransactionsorexecutable broker quotes, review and assessment of contributors to ensure they are active market participants, review of statistical data and utilisation of pricing challenges. The analysis also includes understanding the sources of the pricing service data and any models or assumptions used in determining the results. The pur-pose of the review is to judge the quality and reliability of the data for fair value measurement purposes and its appropriate level of usage within the Product Control independent valuation review.
Forcertainfinancialinstrumentsthefairvalueisestimatedinfull or in part using valuation techniques based on assumptions that are not supported by market observable prices, rates, or other inputs. In addition, there may be uncertainty about a valuation, which results from the choice of valuation technique or model used, the assumptions embedded in those models, the extent to which inputs are not market observable, or as a consequence of other elements affecting the valuation technique or model. Model calibration isperformedwhensignificantnewmarket informationbecomes available or at a minimum on a quarterly basis as part of thebusinessreviewofsignificantunobservable inputsfor level3instruments.
Formodels thathavebeendeemed tobesignificant to theoverallfairvalueofthefinancialinstrument,modelvalidationisper-formed as part of the periodic review of the related model.
The CSS(E)L Group performs a sensitivity analysis of its sig-nificantlevel3financialinstruments.Thissensitivityanalysisesti-matesafairvaluerangebychangingtherelatedsignificantunob-servable inputs value. Where a model-based technique is used to determinethefairvalueofthelevel3financialinstrument,analter-native input value is utilised to derive an estimated fair value range. Where a price-based technique is used to determine the fair value ofthelevel3financialinstrument,FrontOfficeprofessionaljudge-ment is used to estimate a fair value range.
The following information on the valuation techniques and sig-nificantunobservable inputsof thevariousfinancial instruments,and the sensitivity of fair value measurements to changes in signif-icant unobservable inputs, should be read in conjunction with the table ‘Quantitative disclosure of valuation techniques’.
Securities purchased/sold under resale/repurchase agreements and securities borrowing/lending transactionsSecurities purchased under resale agreements and securities sold under repurchase agreements are measured at fair value using discountedcashflowanalysis.Futurecashflowsarediscountedusing observable market interest rate repurchase/resale curves for the applicable maturity and underlying collateral of the instruments. As such, the significantmajority of both securities purchasedunder resale agreements and securities sold under repurchase agreements are included in level 2 of the fair value hierarchy. Structured resale and repurchase agreements include embedded
derivatives, which are measured using the same techniques as described below for stand-alone derivative contracts held for trad-ing purposes or used in hedge accounting relationships. If the valueof theembeddedderivative isdeterminedusingsignificantunobservable inputs, those structured resale and repurchase agreementsareclassifiedwithinlevel3ofthefairvaluehierarchy.Thesignificantunobservableinputsforthoseclassifiedaslevel3are funding spread and general collateral rate.
Securities purchased under resale agreements are usually fully collateralised or over collateralised by government securities, money market instruments, corporate bonds, or other debt instru-ments. In the event of counterparty default, the collateral service agreement provides the CSS(E)L Group with the right to liquidate the collateral held.
Debt securitiesForeign governments and corporatesGovernment debt securities typically have quoted prices in active markets and are categorised as level 1 instruments. For debt securities for which market prices are not available, valuations are basedon yields reflectingcredit rating,historical performance,delinquencies, loss severity, the maturity of the security, recent transactions in the market or other modelling techniques, which may involve judgement. Those securities where the price or model inputs are observable in the market are categorised as level 2 instruments, while those securities where prices are not observ-ableandsignificantmodelinputsareunobservablearecategorisedas level 3 of the fair value hierarchy.
Corporatebondsarepriced to reflect currentmarket levelseither through recent market transactions or broker or dealer quotes. Where a market price for the particular security is not directlyavailable,valuationsareobtainedbasedonyieldsreflectedbyotherinstrumentsinthespecificorsimilarentity’scapitalstruc-ture and adjusting for differences in seniority and maturity, bench-marking to a comparable security where market data is available (taking into consideration differences in credit, liquidity and matu-rity),orthroughtheapplicationofcashflowmodellingtechniquesutilising observable inputs, such as current interest rate curves and observableCDSspreads.Thesignificantunobservable input isprice. For securities using market comparable price, the differen-tiation between level 2 and level 3 is based upon the relative signif-icance of any yield adjustments as well as the accuracy of the comparison characteristics (i.e., the observable comparable secu-rity may be in the same country but a different industry and may have a different seniority level – the lower the comparability the more likely the security will be level 3).
CMBS, RMBS and CDO securitiesFair values of RMBS, CMBS and CDOs may be available through quoted prices, which are often based on the prices at which simi-larly structured and collateralised securities trade between dealers and to and from customers. Fair values of RMBS, CMBS and CDOsforwhichtherearesignificantunobservableinputsareval-ued using capitalisation rate. Price may not be observable for fair value measurement purposes for many reasons, such as the length of time since the last executed transaction for the related security, use of a price from a similar instrument, or use of a price

106
from an indicative quote. Fair values determined by market compa-rablepricemay includediscountedcashflowmodelsusing theinputs prepayment rates, default rates, loss severity and discount rates. Prices from similar observable instruments are used to cal-culate implied inputs which are then used to value unobservable instrumentsusingdiscountedcashflow.Thediscountedcashflowprice is then compared to the unobservable prices and assessed for reasonableness.
For most structured debt securities, determination of fair value requires subjective assessment depending on liquidity, ownership concentration, and the current economic and competitive environ-ment.Valuation isdeterminedbasedon theFrontOffice’sownassumptions about how market participants would price the asset. Collateralised bond and loan obligations are split into various struc-tured tranches and each tranche is valued based upon its individ-ual rating and the underlying collateral supporting the structure. Valuation models are used to value both cash and synthetic CDOs.
Equity securities
The majority of the CSS(E)L Group’s positions in equity securities are traded on public stock exchanges for which quoted prices are readily and regularly available and are therefore categorised as level 1 instruments. Level 2 and level 3 equities include, convert-ible bonds or equity securities with restrictions that are not traded inactivemarkets.Thesignificantunobservableinputisprice.
DerivativesDerivatives held for trading purposes or used in hedge accounting relationships include both OTC and exchange-traded derivatives. The fair values of exchange-traded derivatives measured using observable exchange prices are included in level 1 of the fair value hierarchy. For exchange-traded derivatives where the market is not considered active, the observable exchange prices may not be considered executable at the reporting date. These derivatives are valued in the same manner as similar observable OTC derivatives and are included in level 2 of the fair value hierarchy. If the similar OTC derivative used for valuing the exchange-traded derivative is not observable, then the exchange-traded derivative is included in level 3 of the fair value hierarchy.
The fair values of OTC derivatives are determined on the basis of either industry standard models or internally developed propri-etary models. Both model types use various observable and unob-servable inputs in order to determine fair value. The inputs include those characteristics of the derivative that have a bearing on the economics of the instrument. The determination of the fair value of many derivatives involves only a limited degree of subjectivity because the required inputs are observable in the marketplace, while more complex derivatives may use unobservable inputs that relyonspecificproprietarymodelingassumptions.Whereobserv-able inputs (prices from exchanges, dealers, brokers or market consensus data providers) are not available, attempts are made to infer values from observable prices through model calibration (spot and forward rates, mean reversion, benchmark interest rate curves and volatility inputs for commonly traded option products). For inputs that cannot be derived from other sources, estimates from historical data may be made. OTC derivatives where the majority of the value is derived from market observable inputs are categorised aslevel 2instruments,whilethosewherethemajorityofthevalueisderivedfromunobservableinputsarecategorisedaslevel 3ofthe fair value hierarchy.
The CSS(E)L Group’s valuation of derivatives includes an adjustment for the cost of funding uncollateralised OTC deriva-tives. The impact of changes in a counterparty’s credit spreads
(known as credit valuation adjustments or ‘CVA’) is considered when measuring the fair value of assets and the impact of changes in the CSS(E)L Group’s own credit spreads (known as debit valu-ation adjustments or ‘DVA’) is considered when measuring the fair value of its liabilities.
Interest rate derivativesOTC vanilla interest rate products, such as interest rate swaps, swaptions, and caps and floors are valued by discounting theanticipatedfuturecashflows.Thefuturecashflowsanddiscount-ing are derived from market standard yield curves and industry standard volatility inputs. Where applicable, exchange-traded prices are also used to value exchange-traded futures and options and can be used in yield curve construction. For more complex products, inputs include, but are not limited to correlation, volatility, volatility skew, prepayment rate, credit spread, basis spread and mean reversion.
Foreign exchange derivativesForeign exchange derivatives include vanilla products such as spot, forward and option contracts where the anticipated discounted futurecashflowsaredeterminedfromforeignexchangeforwardcurves and industry standard optionality modelling techniques. Where applicable, exchange-traded prices are also used for futures and option prices. For more complex products inputs include, but are not limited to prepayment rate and correlation.
Equity and index-related derivativesEquity derivatives include vanilla options and swaps in addition to dif-ferent types of exotic options. Inputs for equity derivatives can include price, correlation, volatility, skew, buyback probability and gap risk.
Credit derivativesCredit derivatives include index and single name CDS in addition to more complex structured credit products. Vanilla products are val-ued using industry standard models and inputs that are generally market observable including credit spread and recovery rate.
Complex structured credit derivatives are valued using propri-etary models requiring unobservable inputs such as recovery rate, credit spread, correlation and price. These inputs are generally implied from available market observable data. Fair values deter-mined by price may include discounted cash flow models using the inputs prepayment rate, default rate, loss severity and discount rate.
107Credit Suisse Securities (Europe) Limited, Annual Report 2016
Notes to the Financial Statements for the year ended 31 December 2016
Other derivativesOther derivatives include longevity swaps where the CSS(E)L Group enters into longevity and mortality swap transactions with institutional investors to transfer mortality risk. Generally, in a lon-gevity swap, counterparty ‘A’ pays life contingent premiums to counterparty‘B’andinreturnreceivedeathbenefitatmaturityofthe underlying life. Longevity swaps are also structured to exchangefixed vs life contingent cashflowswithout any refer-enceddeathbenefits.Thelongevityswapscashflowsmayalsobecredit linked to underlying insurance carriers. Longevity swaps are valued using the discounted cash flowmodel and the primaryunobservable input is market implied remaining life expectancy.
Other financial assets designated at fair value through profit or lossLife Finance InstrumentsLifefinanceinstrumentsincludeSinglePremiumImmediateAnnu-ities (‘SPIA’), life settlementandpremiumfinance instruments.SPIAsarevaluedusingdiscountedcashflowmodelsandarepur-chased with an upfront payment to receive life contingent annuity incomestream.Annuitystreamsarefixedand receiveduntil theindividualmatures.SPIAsannuityhelpsfinanceongoingpremiumobligation on the underlying policies and also acts as mortality hedge.Lifesettlementandpremiumfinanceinstrumentsareval-ued using proprietary models with the primary input being market implied remaining life expectancy. Life settlement policies are life insurance policies issued by insurance companies and pay a lump sumdeathbenefituponinsured’sdeathtobeneficiariesinreturnforpremiumspaidoverthelifeofanindividual.Premiumfinanceiswhere the CSS(E)L Group finances policy premiums for theinsured / borrower set up as an Irrevocable Life Insurance Trust in returnfor receivingthemajorityof the insured’sdeathbenefitatmaturity. The primary unobservable input for SPIAs, life settlement andpremiumfinanceinstrumentsismarketimpliedremaininglifeexpectancy.
LoansLoans include fully funded swaps, which are valued using dis-countedcashflowmodels.Theprimaryunobservableinputismar-ket implied remaining life expectancy.
Short-termfinancialinstrumentsCertain short-term financial instruments are not carried at fairvalue on the Statement of Financial Position, but a fair value has beendisclosed in the table ‘Analysisoffinancial instrumentsbycategories’ above on pages 78 to 80. These instruments include: cash and due from banks, cash collateral receivables and payables and other receivables and payables arising in the ordinary course ofbusiness.For thesefinancial instruments, thecarrying valueapproximates the fair value due to the relatively short period of time between their origination and expected realisation, as well as the minimal credit risk inherent in these instruments.
Sensitivity of fair value measurements to changes in significant unobservable inputsForlevel3assetsinstrumentswithasignificantunobservableinputof price, funding spread, general collateral rate and market implied remaininglifeexpectancy(forlifefinanceinstruments),ingeneral,an increase in thesignificantunobservable inputwould increasethe fair value.For level3assets instrumentswitha significantunobservable input of market implied remaining life expectancy (for lifesettlement instrumentsandpremiumfinance instruments), ingeneral,an increase in thesignificantunobservable inputwoulddecrease the fair value.
Forlevel 3liabilitiesanincreaseintherelatedsignificantunob-servable inputs would have the inverse impact on fair value.
Interrelationships between significant unobservable inputsTherearenomaterial interrelationshipsbetween thesignificantunobservable inputs for thefinancial instruments.As thesignifi-cant unobservable inputs move independently, generally an increaseor decrease inone significant unobservable inputwillhavenoimpactontheothersignificantunobservableinputs.

108
Quantitative disclosures of valuation techniquesThe following tables provide the representative range of minimum and maximum values and the associated weighted average of
eachsignificantunobservableinputforlevel3assetsandliabilitiesby therelatedvaluation techniquemostsignificant to therelatedfinancialinstrument.
Quantitative information about level 3 assets and liabilities at fair value
As at 31 December 2016 Valuation Unobservable Minimum Maximum Weighted
CSS(E)L Group (USD million, except as indicated) Fair Value technique input value value average 1,2
Assets
Trading financial Assets at fair value through profit or loss
Debt securities 72
Ofwhichcorporates 68
Ofwhich 54 Market comparable Price, in % 0 123 38
Equity securities 34
Ofwhich 29 Vendor price Price in actuals 0 100 24
Derivatives 840
Ofwhichequity/index-relatedproducts 20
Ofwhich 18 Vendor price Price in actuals 0 43 1
Ofwhich otherderivatives 814
Ofwhich 390 Discounted cash flows UK Mortality 76 92 91
Market implied remaining life
Ofwhich 421 Discounted cash flows expectancy, in years 2 18 6
Financial assets designated at fair value through profit or loss
Securities purchased under resale agreements
and securities borrowing transactions 170
Ofwhich 118 Discounted cash flows Funding spread, in bps 350 450 361
Ofwhich 52 Discounted cash flows General collateral rate, in % 10 101 27
Other financial assets designated at fair value
through profit or loss 1,923
Ofwhich lifefinanceinstruments 1,767
Market implied remaining life
Ofwhich 1,653 Discounted cash flows expectancy, in years 2 19 7
Financial assets available-for-sale 33
Ofwhich 25 Vendor price Price, in actuals 25 1,077 625
Liabilities
Trading financial liabilities at fair value through profit or loss
Equity securities 6
Ofwhich 6 Vendor price Price in actuals 0 71 4
Derivatives 680
Ofwhichequity/index-relatedproducts 27
Ofwhich 27 Vendor price Price in actuals 0 43 1
Ofwhichotherderivatives 651
Market implied remaining life
Ofwhich 615 Discounted cash flows expectancy, in years 2 21 7
Long-term debt 94
Market implied remaining life
Ofwhichotherdebtinstruments 78 Discounted cash flows expectancy, in years 2 18 7
1 Cash instruments are generally presented on a weighted average basis while certain derivative instruments either contain a combination of weighted averages and arithmetic means of the related inputs or are presented on the arithmetic mean basis.
2 Above quantitative information about Level 3 assets and liabilities at fair value pertains to continued and discontinued operations.

109Credit Suisse Securities (Europe) Limited, Annual Report 2016
Notes to the Financial Statements for the year ended 31 December 2016
As at 31 December 2015 Valuation Unobservable Minimum Maximum Weighted
CSS(E)L Group (USD million, except as indicated) Fair Value technique input value value average 1,2
Assets
Trading financial Assets at fair value through profit or loss
Debt securities 127
Ofwhichcorporates 113
Ofwhich 89 Market comparable Price, in % 0 150 24
Equity securities 101
Ofwhich 27 Vendor price Price in actuals 0 125 32
Ofwhich 73 Market comparable Price, in % 1 202 97
Derivatives 838
Ofwhichequity/index-relatedproducts 30 Vendor price Price, in actuals 0 4 0
Ofwhich otherderivatives 800
Market implied remaining life
Ofwhich 790 Discounted cash flows expectancy, in years 1 19 4
Financial assets designated at fair value through profit or loss
Securities purchased under resale agreements
and securities borrowing transactions 160
Ofwhich 119 Discounted cash flows Funding spread, in bps 350 475 361
Ofwhich 41 Discounted cash flows General collateral rate, in % 0 0 0
Other financial assets designated at fair value
through profit or loss 2,088
Market implied remaining life
Ofwhich lifefinanceinstruments 1,898 Discounted cash flows expectancy, in years 1 20 8
Financial assets available-for-sale 33
Ofwhich 11 Vendor price Price, in actuals 1,118 1,118 1,118
Liabilities
Trading financial liabilities at fair value through profit or loss
Equity Securities 4
Ofwhich 4 Vendor price Price, in actuals 0 24 1
Derivatives 653
Ofwhichequity/index-relatedproducts 49 Vendor price Price, in actuals 0 4 0
Ofwhich otherderivatives 596
Market implied remaining life
Ofwhich 561 Discounted cash flows expectancy, in years 2 22 8
Long-term debt 103
Market implied remaining life
Ofwhichotherdebtinstruments 103 Discounted cash flows expectancy, in years 1 19 7
1 Cash instruments are generally presented on a weighted average basis while certain derivative instruments either contain a combination of weighted averages and arithmetic means of the related inputs or are presented on the arithmetic mean basis.
2 Above quantitative information about Level 3 assets and liabilities at fair value pertains to continued and discontinued operations.
Qualitative discussion of the ranges of significant unobservable inputsThe following sections provide further information about the ranges of significantunobservable inputs included in the tablesabove.The levelofaggregationanddiversitywithin thefinancial instru-ments disclosed in the tables above result in certain ranges of significantinputsbeingwideandunevenlydistributedacrossassetand liability categories.
Market implied remaining life expectancyThe CSS(E)L Group’s market implied remaining life expectancy determines an individual’s mortality curve and is the primary unob-servable input used on various longevity instruments including life settlements, premium finance, SPIAs and longevity swaps. Market implied remaining life expectancy is determined based on individual’s
gender, age, and health status. It is calibrated to the market data when transaction data is available.
Mortality RateMortalityrateistheprimarysignificantunobservableinputforpen-sionswaps.Theexpectedpresentvalueoffuturecashflowofthetrades depend on the mortality of individuals in the pension fund who are grouped into categories such as gender, age, pension amount, and other factors.
PriceBondequivalentprice isaprimarysignificantunobservable inputfor bonds and equities. Where market prices are not available for an instrument, benchmarking may be utilised to identify compara-ble issues (same industry and similar product mixes) while

110
adjustments are considered for differences in deal terms and performance.
Funding spreadFundingspreadistheprimarysignificantunobservableinputforStructured Entities funding facilities. Synthetic funding curves which represent the assets pledged as collateral are used to value structured financing transactions.Thecurvesprovideanestimate of where secured funding can be sourced and are expressed as a basis point spread in relation to the referenced benchmark rate.
General collateral rate General collateral rate is the primary significant unobservable input for repurchase/resale transactions involving emerging markets bonds.
Credit spreadCreditspreadistheprimarysignificantinputforCDStrades.Thelower end of the credit spread range typically represents short-er-dated instruments and/or those with better perceived credit risk. The higher end of the range typically comprises longer-dated financial instrumentsor those referencingnon-performing,dis-tressed or impaired reference credits. Similarly, the spread between the referencecreditandan indexcanvarysignificantlybased on the risk of the instrument.
Sensitivity of fair values to reasonably possible alternative assumptionsThe fair valueofcertainfinancial instruments recognised in theconsolidatedfinancialstatementsisdependentinpartorfullyuponunobservable parameters which may include market inputs, prices or other data.
Thefollowingtablesummarisesthesensitivityofthesefinancialinstrumentstoreasonablechangesintheassumptionsunderlyingtheseparameters:
CSS(E)L Group and Company As at 31 December 2016 As at 31 December 2015
Un- Un- Favourable favourable Favourable favourable changes changes changes changes
Impact on net income/(loss)(USD million)
Life insurance products 130 (137) 187 (201)
Derivative assets and liabilities 17 (17) – –
Asset backed securities – – 1 (1)
Debt and equity securities 14 (6) 56 (45)
Other liabilities – – 4 (3)
Total 161 (160) 248 (250)
When the fair value of an instrument has multiple unobservable inputs, there is assumed to be no correlation between those inputs,assuchthetotalsensitivity reflected in thetablemaybelarger than if correlation had been included in the analysis. The analysis also ignores any correlation between the different catego-riesoffinancialinstrumentslistedinthetable.
Life insurance products, both physical and synthetic, are sen-sitive to mortality assumption. Sensitivity analysis is carried out by stressing market life expectancy of each underlying product in months between 2 to 9 months. Asset backed securities include RMBS and CDO positions. RMBS positions were subjected to sensitivities on price which were generally subjected to an 8% movement up and down of the price of the security.
Debt and equity securities include corporate bonds. The parameter subjected to sensitivity for corporate debt is price. Cor-porate debt positions are generally subjected to movements up
and down of 3% to 4% of the price of the security. Other liabilities include the CSS(E)L Group’s PAF obligations. The sensitivity of the PAF obligations was based upon an estimate of the related PAF Asset Pool.
The sensitivities applied to the unobservable parameters are in all cases dependent upon management judgement and derived from multiple sources including historical and statistical information as well as analysing the range of bids and offers on observable market information as a proxy for the unobservable portion of the market.
Recognition of trade date profit/lossIf therearesignificantunobservable inputsused in thevaluationtechnique,thefinancialinstrumentisrecognisedatthetransactionpriceandanyprofitimpliedfromthevaluationtechniqueattradedate is deferred over the life of the contract or until the fair value is expected to become observable.

111Credit Suisse Securities (Europe) Limited, Annual Report 2016
Notes to the Financial Statements for the year ended 31 December 2016
The following table sets out the aggregate difference yet to be recognised in Statement of Income at the beginning of the year and end of the year with a reconciliation of the changes of the balance during the year.
CSS(E)L Group and Company 2016 2015
Deferred trade date profit and loss (USD million)
Balance at 1 January 110 127
Reduction due to passage of time (30) (17)
Balance at 31 December 80 110
Fair value of financial instruments not carried at fair valueIFRSrequiresthedisclosureofthefairvalueoffinancialinstrumentsnotcarriedatfairvalueintheconsolidatedStatementsofFinancialPosition.IFRSalsorequiresthedisclosureofthefairvaluesofthesefinancialinstrumentswithinthefairvaluehierarchy.
As at 31 December 2016 Impact Total at CSS(E)L Group (USD million) Level 1 Level 2 Level 3 of Netting fair value
Assets
Cash and due from banks 3,187 – – – 3,187
Interest-bearing deposits with banks – 8,763 – – 8,763
Securities purchased under resale agreements
and securities borrowing transactions – 12,072 – (386) 11,686
Other financial assets – 5,269 – – 5,269
Assets held for sale – 33,159 – – 33,159
Total fair value of financial assets 3,187 59,263 – (386) 62,064
Liabilities
Deposits 169 – – – 169
Securities sold under repurchase agreements
and securities lending transactions – 458 – (386) 72
Short term borrowings – 3,667 – – 3,667
Long term debt – 24,762 – – 24,762
Other financial liabilities – 17,658 – – 17,658
Liabilities held for sale – 19,326 – – 19,326
Total fair value of financial liabilities 169 65,871 – (386) 65,654
As at 31 December 2016 Impact Total at Company (USD million) Level 1 Level 2 Level 3 of Netting fair value
Assets
Cash and due from banks 3,183 – – – 3,183
Interest-bearing deposits with banks – 8,763 – – 8,763
Securities purchased under resale agreements
and securities borrowing transactions – 12,072 – (386) 11,686
Other financial assets – 5,245 – – 5,245
Assets held for sale – 33,159 – – 33,159
Total fair value of financial assets 3,183 59,239 – (386) 62,036
Liabilities
Deposits 169 – – – 169
Securities sold under repurchase agreements
and securities lending transactions – 458 – (386) 72
Short term borrowings – 3,667 – – 3,667
Long term debt – 24,762 – – 24,762
Other financial liabilities – 17,647 – – 17,647
Liabilities held for sale – 19,326 – – 19,326
Total fair value of financial liabilities 169 65,860 – (386) 65,643

112
As at 31 December 2015 Impact Total at CSS(E)L Group (USD million) Level 1 Level 2 Level 3 of Netting fair value
Assets
Cash and due from banks 8,874 – – – 8,874
Interest-bearing deposits with banks – 9,700 – – 9,700
Securities purchased under resale agreements
and securities borrowing transactions – 5,570 – (434) 5,136
Other financial assets – 5,679 5,679
Assets held for sale – 43,746 – – 43,746
Total fair value of financial assets 8,874 64,695 – (434) 73,135
Liabilities
Deposits 160 – – – 160
Securities sold under repurchase agreements
and securities lending transactions – 496 – (434) 62
Short term borrowings – 2,761 – – 2,761
Long term debt – 26,459 – – 26,459
Other financial liabilities – 15,237 15,237
Liabilities held for sale – 38,502 – – 38,502
Total fair value of financial liabilities 160 83,455 – (434) 83,181
As at 31 December 2015 Impact Total at Company (USD million) Level 1 Level 2 Level 3 of Netting fair value
Assets
Cash and due from banks 8,870 – – – 8,870
Interest-bearing deposits with banks – 9,700 – – 9,700
Securities purchased under resale agreements
and securities borrowing transactions – 5,570 – (434) 5,136
Other financial assets – 5,660 – – 5,660
Assets held for sale – 43,746 – – 43,746
Total fair value of financial assets 8,870 64,676 – (434) 73,112
Liabilities
Deposits 160 – – – 160
Securities sold under repurchase agreements
and securities lending transactions – 495 – (434) 62
Short term borrowings – 2,761 – – 2,761
Long term debt – 26,459 – – 26,459
Other financial liabilities – 15,226 – – 15,226
Liabilities held for sale – 38,502 – – 38,502
Total fair value of financial liabilities 160 83,443 – (434) 83,170
113Credit Suisse Securities (Europe) Limited, Annual Report 2016
Notes to the Financial Statements for the year ended 31 December 2016
36 Assets Pledged or Assigned
The following table sets forth details of assets pledged or assigned:
CSS(E)L Group and Company 2016 2015
Assets pledged or assigned (USD million)
Trading financial assets at fair value through profit or loss 16,809 22,958
Collateral received (USD million)
Fair value of collateral received with the right to resell or repledge 146,014 191,952
Ofwhichsoldorrepledged 115,621 159,307
Assets pledged or assigned represents the Statements of Finan-cialPositionof tradingassetsat fair value throughprofitor losswhich have been pledged as collateral under securities sold under repurchase agreements, securities lending transactions and deriv-ative instruments. Refer to Note 14 – Trading Financial Assets and LiabilitiesatFairValueThroughProfitorLossfortheamountofsecurities transferred which are encumbered.
Asat31 December2016and2015,collateralwasreceivedinconnection with resale agreements, securities borrowings and loans, derivative transactions and margined broker loans. As at these dates, a substantial portion of the collateral received by the CSS(E)L Group had been sold or repledged in connection with repurchase agreements, securities sold not yet purchased, securi-ties lent, pledges to clearing organisations, segregation
requirements under securities laws and regulations, derivative transactions, and bank loans.
These transactions were generally conducted under terms that are usual and customary for standard securitised lending activities and the other transactions described. The CSS(E)L Group, as the secured party, has the right to sell or repledge such collateral, sub-ject to the CSS(E)L Group returning equivalent securities upon completion of the transaction.
The CSS(E)L Group enters into agreements with counterpar-ties where collateral or security interests in positions which the CSS(E)L Group holds, has been provided. This includes situations where the CSS(E)L Group has registered charges to certain coun-terparties over the CSS(E)L Group’s assets in connection with its normal operating activities.
37 Derecognition of Financial Assets
In the normal course of business, the CSS(E)L Group enters into transactions where it transfers previously recognised financialassets,suchasdebtsecurities,equitysecuritiesandotherfinan-cial instruments. The CSS(E)L Group’s accounting policy regard-ing derecognition of such assets under IAS 39 is described in Note2–SignificantAccountingPolicies.
Transferred Financial Assets that are not derecognised in their entiretyCertain transactions may include provisions that prevent derecog-nition of the transferred financial asset and the transfers areaccounted for as secured financing transactions. Repurchaseagreements, securities lending agreements and total return swaps,
in which the CSS(E)L Group retains substantially all of the associ-ated credit, market, interest rate and foreign exchange risks and rewards associated with the assets, represent the most common examples of such transactions. Where the transfer of an asset does not meet derecognition, it remains on the CSS(E)L Group’s statementoffinancialpositionwithacorrespondingliabilityestab-lished to represent an obligation to the counterparty. As part of the CSS(E)L Group’s repurchase agreements and securities lending transactions, there is an obligation to return equivalent securities at the end of the transaction.
The following tableprovidesdetailsoffinancialassetswhichhave been sold or otherwise transferred, but which do not qualify for derecognition, together with their associated liabilities.
Carrying amount of transferred assets not derecognised and associated liabilities
2016 2015
Carrying Carrying Carrying amount of Carrying amount of amount associated amount associated
CSS(E)L Group (USD million) of assets liabilities of assets liabilities
Financial assets not derecognised due to the following transactions
RepurchaseagreementsandSecuritieslendingagreements 16,809 16,809 22,958 22,958
Totalreturnswaps – – 402 409
Other 530 9 545 21

114
2016 2015
Carrying Carrying Carrying amount of Carrying amount of amount associated amount associated
Company (USD million) of assets liabilities of assets liabilities
Financial assets not derecognised due to the following transactions
RepurchaseagreementsandSecuritieslendingagreements 16,809 16,809 22,958 22,958
Totalreturnswaps – – 402 409
Other 9 9 21 21
The CSS(E)L Group also participates in securities lending agreements where the counterparty provides security as collateral. The carrying amount of the assets not derecognised in such trans-actionsisequaltoUSD 1,359million(2015:USD 1,346million).
Where the CSS(E)L Group sells the contractual rights to the cashflowsofthesecuritiesincludedabove,itdoesnothavetheability to use the transferred assets during the term of the arrange-ment. The counterparties to the associated liabilities included above, have full recourse to the CSS(E)L Group.
Assetsnotderecognisedare included inNote 14–TradingFinancialAssets andLiabilities atFairValueThroughProfit orLossandcorresponding liabilities inNote 13–SecuritiesBor-rowed, Lent and Subject to Resale or Repurchase Agreements andNote 15–FinancialAssetsandLiabilitiesDesignatedatFairValueThroughProfitorLoss.
Oftheabove,otherfinancialassetsnotderecognisedincludesfailed sale items including fair value elected items which are shown under ‘Financialassetsdesignatedat fair value throughprofitorlossintheconsolidatedstatementoffinancialposition.
38 Financial Instruments Risk Position
Risks Detaili) Market riskOverviewMarket risk is the risk of loss arising from adverse changes in inter-est rates, foreign currency exchange rates, equity prices, com-modity prices and other relevant parameters, such as market vola-tilitiesandcorrelations.TheCompanydefines itsmarket riskaspotential changes in the fair values of financial instruments inresponse to market movements. A typical transaction will be exposed to a number of different market risks.
The Company has policies and processes in place to ensure that market risk is captured, accurately modelled and reported, and effectively managed. Trading and non-trading portfolios are managed at various organisational levels, from the overall risk posi-tionsattheCompanyleveldowntospecificportfolios.TheCom-pany uses market risk measurement and management methods in line with regulatory and industry standards. These include general tools capable of calculating comparable risk metrics across the Bank’smany activities and focused tools that can specificallymodel the unique characteristics of certain instruments or portfo-lios. The tools are used for internal market risk management, inter-nal market risk reporting and external disclosure purposes. The principal measurement methodologies are Value-at-Risk (‘VaR’) and scenario analysis. The risk management techniques and poli-cies are regularly reviewed to ensure they remain appropriate.
Value-at-RiskVaRmeasuresthepotentiallossintermsoffairvalueoffinancialinstrumentsduetoadversemarketmovementsoveradefinedtimehorizonataspecifiedconfidencelevel.VaRisapplicableformar-ket risk exposures with price histories. Positions product can be aggregated in several ways, across risk factors, products and busi-nesses. For example, interest rate risk includes risk arising from
money market and swap transactions, bonds, and interest rate, foreign exchange, equity and commodity options. The use of VaR allows the comparison of risk across different asset classes, busi-nesses and divisions, and also provides a means of aggregating andnettingavarietyofpositionswithinaportfoliotoreflectactualcorrelations and offsets between different assets.
Historical financialmarket rates, prices and other relevantparameters serve as a basis for the statistical VaR model underly-ing the potential loss estimation. The Company uses a ten-day holdingperiodandaconfidencelevelof99%tomodeltheriskinits trading portfolios. These assumptions are compliant with the standards published by the Basel Committee on Banking Supervi-sion (‘BCBS’).
The Company uses a historical simulation model for the major-ity of the risk types and businesses within its trading portfolios. Where insufficient data is available for such an approach, an‘extreme-move’ methodology is used. The model is based on the profitorlossdistributionresultingfromhistoricalchangesinmar-ket rates, prices and other relevant parameters applied to evaluate the portfolio. This methodology also avoids any explicit assump-tions on the correlation between risk factors. The Company uses a three-year historical dataset to compute VaR. To ensure that VaR responds appropriately in times of market stress, the Company uses a scaling technique that automatically increases VaR where the short-term market volatility is higher than the long-term volatil-ity in the three year dataset. This results in a more responsive VaR model, as the impact of changes in the overall market volatility is reflectedpromptlyintheVaRmodeloutput.
The Company has approval from the PRA to use its regulatory VaR model in the calculation of the trading book market risk capital requirements.
The VaR model uses assumptions and estimates that the Company believes are reasonable, but changes to assumptions or
115Credit Suisse Securities (Europe) Limited, Annual Report 2016
Notes to the Financial Statements for the year ended 31 December 2016
estimates could result in a different VaR measure. The main assumptions and limitations of VaR as a risk measure are:p VaR relies on historical data to estimate future changes in mar-
ket conditions, which may not capture all potential future out-comes,particularlywheretherearesignificantchangesinmar-ket conditions and correlations across asset classes.
p VaRprovidesanestimateoflossesata99%confidencelevel,which means that it does not provide any information on the size of losses that could occur beyond that threshold.
p VaR is based on a ten-day holding period. This assumes that risks can be either sold or hedged over that period, which may not be possible for all types of exposure, particularly during periods of market illiquidity or turbulence.
p VaR is calculated using positions held at the end of each busi-ness day and does not include intra-day changes in exposures.
Scenario analysisStress testing complements other risk measures by capturing the Company’s exposure to unlikely but plausible events, which can be expressed through a range of significant moves across multiple financial markets. The majority of scenario analysis calculations per-formed are specifically tailored toward the risk profile of particular businesses, and limits may be established if they are considered the most appropriate control. In addition, to identify areas of risk con-centration and potential vulnerability to stress events at CSS(E)L Group level, a set of scenarios which are consistently applied across all businesses and assess the impact of significant, simultaneous movements across a broad range of markets and asset classes.
Stress testing is a fundamental element of the Company’s risk control framework, stress testing results are monitored against limits, used in risk appetite discussions and strategic business planning, and support the Company’s internal capital adequacy assessment. Stress testing is conducted on a regular basis and the results, trend information and supporting analysis are reported to the Board, senior management and shared and discussed with the business lines.
Scenarioscanbedefinedwithreferencetohistoriceventsorbased on forward looking, hypothetical events that could impact theCompany’spositions, capital, or profitability.Thescenariosused within the Company are reviewed at the individual risk com-mittee level as well as by a dedicated scenario design forum. It is expected that the scenarios used within the Company are rede-finedasrequiredbychangesinmarketconditionsandasbusinessstrategies evolve.
Trading portfoliosRisk measurement and managementMarket risk arises in the Company’s trading portfolios primarily through the trading activities within the bank.
For the purposes of this disclosure, VaR is used to quantify marketriskinthetradingportfolio.Thisclassificationofassetsastrading is based on the trading intent and for the purpose of ana-lysingtheCompany’smarketriskexposure,notforfinancialstate-ment purposes.
The Company is active in the principal global trading markets, using the majority of common trading and hedging products, including derivatives such as swaps, futures, options and struc-tured products (some of which are customised transactions using combinationsofderivativesandexecutedtomeetspecificclientorproprietary needs). As a result of the Company’s broad participa-tion in products and markets, trading strategies are correspond-ingly diverse and exposures are generally spread across a range of risk factors and locations.
Development of trading portfolio risksThe table below shows the trading-related market risk exposure for CSS(E)L Group, as measured by regulatory ten-day, 99% VaR. The VaR in the table has been calculated using a three-year historical dataset. VaR estimates are computed separately for each risk type and for the whole portfolio using the historical sim-ulationmethodology.Thediversificationbenefit reflects thenetdifference between the sum of the 99th percentile loss for each individual risk type and for the total portfolio.
Ten-day, 99% VaR – trading portfolios
Interest rate Diversi- and credit Foreign fication
in / end of period spread exchange Commodity Equity benefit 1 Total
2016 (USD million)
Average 10 3 2 24 (8) 31
Minimum 6 1 – 8 – 2 15
Maximum 16 9 5 39 – 2 48
End of period 12 2 – 12 (5) 21
2015 (USD million)
Average 17 3 1 23 (9) 35
Minimum 9 1 1 16 – 2 22
Maximum 30 9 3 34 – 2 53
End of period 10 4 1 29 (8) 36
1 VaR estimates are calculated separately for each risk type and for the whole portfolio using the historical simulation methodology. Diversification benefit reflects the net difference between the sum of the 99% percentile loss.
2 As the minimum and maximum occur on different days for different risk types, it is not meaningful to calculate a portfolio diversification benefit.

116
VaR resultsThe CSS(E)L Group’s ten-day, 99% regulatory VaR as of 31 December 2016 decreased by 42% to USD 21 million com-pared to 31 December 2015 (USD 36 million).
Banking portfoliosRisk measurement and managementThe market risks associated with the non-trading portfolios are measured, monitored and limited using several tools, including scenario analysis, sensitivity analysis and VaR. For the purpose of
this disclosure, the aggregated market risks associated with the Company’s non-trading portfolios are measured using sensitivity analysis. The sensitivity analysis for the non-trading activities mea-sures the amount of potential change in economic value resulting fromspecifiedhypothetical shocks tomarket factors. It isnotameasure of the potential impact on reported earnings in the cur-rent period, since the non-trading activities generally are not marked to market through earnings. Foreign exchange translation risk is not included in this analysis.
Development of non-trading portfolio risks
Interest rate risk on non-trading positions is shown using sensitivity analysis that estimates the potential change in value resulting from definedchangesininterestrateyieldcurves.Theimpactofaone-basis-point parallel move in yield curves on the fair value of interest rate-sensitive non-trading book positions would have amounted to USD 0.0 million as at 31 December 2016 compared to USD 0.2 million as of 31 December 2015. Non-trading interest rate risk is assessed using other measures including the potential value changeresultingfromasignificantchangeinyieldcurves.
As of 31 December 2016 the fair value impacts of a200-basis-pointmoveinyieldcurves(noflooringatzero)were:
AfairvaluelossofUSD 9million(2015gainofUSD 4million)for a +200bps move.
AfairvaluelossofUSD 10million(2015lossofUSD 871 mil-lion) for a -200bps move. 1 The fair value impact of a -200bps move across all currencies is shown. In last year’s sub-
mission the fair value impact for a -200bps move for USD interest rates only was used.
ii) Liquidity RiskLiquidity risk is the risk that a company is unable to fund assets and meet obligations as they fall due under both normal and stressed market conditions.
CS group wide management of liquidity riskLiquidity, as with funding, capital and foreign exchange exposures, is centrally managed by Treasury. Oversight of these activities is provided by the Capital Allocation and Risk Management Commit-tee (‘CARMC’), a committee that includes the Chief Executive Officers (‘CEOs’) of theCSgroupand thedivisions, theChiefFinancial Officer (‘CFO’), the Chief Risk Officer (‘CRO’) andTreasurer.
The liquidity and funding strategy is approved by CARMC with ultimate responsibility residing with the CSG Board of Directors. The implementation and execution of the funding and liquidity strategy is managed by Treasury for adherence to the funding pol-icyand theefficientcoordinationof thesecured fundingdesks.The liquidityand fundingprofile is regularly reported toCARMCandtheBoardofDirectors,whodefinetheCompany’srisktoler-ance and set parameters for the balance sheet usage of businesses.
The liquidity and fundingprofileofCreditSuisseAG (‘CS’)reflectstheriskappetite,businessactivities,strategy,marketcon-ditions and overall operating environment. CS’s liquidity and fund-ing policy is designed to ensure that funding is available to meet all
obligations in times of stress, whether caused by market events and/orissuesspecifictoCS.ThisapproachenhancesCS’sabilityto manage potential liquidity and funding risks and to promptly adjust the liquidity and funding levels in response to stressed conditions.
The funding sourced by CS is part of an Asset-Liability Man-agement (‘ALM’) strategy aimed at maintaining a funding structure with long term stable funding sources being in excess of illiquid assets. CS primarily funds the balance sheet through core cus-tomer deposits, long-term debt and shareholders’ equity.
The fundingprofile isdesigned toenableCS tocontinue topursue activities for an extended period of time without changing business plans during times of stress. To address short term liquid-ity needs in any stress, a liquidity buffer consisting of a portfolio of highly liquid securities and cash is maintained which can be utilised in the event of a crisis. The principal measure used to monitor the structural liquidity position of the Company and as the basis for funds transfer pricing policy is the Net Stable Funding Ratio (‘NSFR’). This is complemented by CS’s internal liquidity barometer, which measures survival days under stressed conditions and consid-ers the adjusted market value of unencumbered assets (including cash) against the aggregate value of expected contractual, contin-gent and client behavioural liquidity outflows. This framework is sup-plemented by the modelling of additional stress events and addi-tional liquidity risk measurement tools.
In the event of a liquidity crisis, CS would activate its Contin-gencyFundingPlan(‘CFP’),whichfocusesonthespecificactionsthat would be taken as a response, including a detailed communi-cation plan for creditors, investors and customers.
The contingency plan would be activated by the Funding Exe-cution Committee (‘FEC’), which includes senior business line, fundingandfinancedepartmentmanagementadaptedtoincludethe relevant stakeholders depending upon the degree and nature of stress. This committee would meet frequently throughout the crisis to ensure that the plan is executed.
On regulatory developments, the BCBS issued the Basel III international framework for liquidity risk measurement, standards and monitoring. The framework includes a liquidity coverage ratio (‘LCR’) and an NSFR.
TheLCR,whichisbeingphasedinbeginning1 January2015through1 January2019, followinganobservationperiodwhichbegan in 2011, addresses liquidity risk over a 30-day period. The LCR aims to ensure that banks have a stock of unencumbered high-quality liquid assets available to meet liquidity needs for a

117Credit Suisse Securities (Europe) Limited, Annual Report 2016
Notes to the Financial Statements for the year ended 31 December 2016
30-day time horizon under a severe stress scenario. The LCR is comprised of two components: the value of the stock of high qual-ity liquid assets in stressed conditions and the total net cash out-flowscalculatedaccordingtospecifiedscenarioparameters.Theratioofliquidassetsovernetcashoutflowswassubjecttoaninitialproposed minimum requirement of 60%, which increases by 10% eachyear,reaching100%by1 January2019.
The NSFR, which under BCBS is expected to be introduced on1 January2018followinganobservationperiodwhichbeganin2012, establishes criteria for a minimum amount of stable funding based on the liquidity of a bank’s assets and activities over a one-year horizon. The NSFR is intended to ensure banks maintain a structurallysoundlong-termfundingprofilebeyondoneyearandisacomplementarymeasuretotheLCR.Thestandardisdefinedasthe ratio of available stable funding over the amount of required stable funding and should always be at least 100%.
It should be noted that local regulators are free to interpret the BCBS proposals and have implemented various aspects differently including timescales for implementation of the LCR and NSFR.
Legal entity management of liquidity riskThe liquidity risk of the Company is managed as an integral part of the overall CS global liquidity risk management framework. The Company aims to achieve a prudent approach in the management of liquidity to ensure it can meet its obligations as they fall due. The core liquidity adequacy analysis used for the Company is aligned to those used globally for the CS barometer.
The legal entity internal liquidity risk management framework incorporates local regulatory compliance requirements. Such com-pliance requirements are measured as part of the Prudential Reg-ulation Authority’s Individual Liquidity Guidance (‘ILG’) which results in CSS(E)L Group holding term funding and a local liquid asset buffer of qualifying securities.
Following global regulatory developments, the European Bank-ing Authority (‘EBA’) has published its version of the LCR and NSFR as part of the implementation guidance for Basel III. Under CRDIV guidelines, the LCR was initially introduced with a minimum requirement of 80% on October 1, 2015 with an increase to 90% from January 1, 2017 and full compliance by January 1, 2018 (one
year prior to BCBS guidelines). The NSFR was expected to be introduced on January 1, 2018 in-line with the BCBS proposal, howeverinNovember2016theEuropeanCommissionconfirmedthat it will not apply at a level of 100% until two years after the date of entry in to force of the proposed regulation. The date for this is not yet known however entry in to force is expected around mid-2018.
In the context of legal entity liquidity management, the Compa-ny’s Board is responsible for setting the liquidity risk appetite. Some of the key characteristics determining the Company’s liquid-ity risk management approach include, but are not limited to: p Board approved legal entity risk appetite;p Compliance with local regulatory requirements;p Holding a liquid asset portfolio composed of highly liquid unen-
cumbered assets;p The liquidity value of assets, liabilities and the calibration of
contingent liabilities being aligned with the CS global liquidity risk methodologies.
The Company has implemented a liquidity risk management frame-work including legal entity governance, systems and controls and frequent management information to measure, monitor and man-age liquidity risk.
The legal entity risk appetite and assumptions underlying the relevant stress tests, which form part of CSS(E)L’s liquidity risk management framework, are reviewed by Risk and Treasury and ultimately approved by the Company’s Board of Directors on at least an annual basis or as market conditions dictate.
Treasury is responsible for maintaining a CFP that details spe-cific dealing strategies, actions and responsibilities required depending upon severity of the crisis. Treasury supports the plan with key liquidity tools, including early warning indicators. The CFP gives consideration to the impact of operational constraints in terms of time and ability to monetise assets, trapped liquidity, day-light collateral requirements and communication strategies.
Incremental to the Company’s unsecured funding sources from CS, the Company has the ability to access secured funding mar-kets via repurchase and stock lending agreements. These funding streamsprovidediversificationtothefundingprofileoftheentity.

118
Thefollowingtablesetsoutdetailsoftheremainingcontractualmaturityofallfinancialliabilities:
Current Noncurrent Total
Between Between Due within 3 and 1 and Due after
CSS(E)L Group On Demand 3 months 12 months Total 5 years 5 years Total
2016 Contractual maturity of Financial Liabilities (USD million)
Deposits 169 – – 169 – – – 169
Securities sold under repurchase agreements
and securities lending transactions 72 – – 72 – – – 72
Trading financial liabilities at fair value through profit or loss 7,537 – – 7,537 – – – 7,537
Financial liabilities designated at fair value through profit or loss 17,482 5,972 261 23,715 27 68 95 23,810
Short term borrowings – 742 2,925 3,667 – – – 3,667
Other liabilities 10,578 – 7,500 18,078 – – – 18,078
Long term debt – 61 182 243 21,801 2,689 24,490 24,733
Perpetual debt – – – – – 1,251 1,251 1,251
Liabilities held for sale 24,066 – 8,119 32,185 485 – 485 32,670
Total financial liabilities 59,904 6,775 18,987 85,666 22,313 4,008 26,321 111,987
2015 Contractual maturity of Financial Liabilities (USD million)
Deposits 157 – 3 160 – – – 160
Securities sold under repurchase agreements
and securities lending transactions 24 38 – 62 – – – 62
Trading financial liabilities at fair value through profit or loss 9,789 – – 9,789 – – – 9,789
Financial liabilities designated at fair value through profit or loss 7,746 17,703 70 25,520 147 66 213 25,732
Short term borrowings – 43 2,718 2,761 – – – 2,761
Other liabilities 7,941 – – 7,941 8,200 – 8,200 16,141
Long term debt – 67 1,200 1,267 22,433 2,663 25,096 26,363
Perpetual debt – – – – – 1,251 1,251 1,251
Liabilities held for sale 32,499 42 21,479 54,020 482 – 482 54,502
Total financial liabilities 58,156 17,893 25,470 101,520 31,262 3,980 35,242 136,761

119Credit Suisse Securities (Europe) Limited, Annual Report 2016
Notes to the Financial Statements for the year ended 31 December 2016
Current Noncurrent Total
Between Between Due within 3 and 1 and Due after
CSS(E)L Company On Demand 3 months 12 months Total 5 years 5 years Total
2016 Contractual maturity of Financial Liabilities (USD million)
Deposits 169 – – 169 – – – 169
Securities sold under repurchase agreements
and securities lending transactions 72 – – 72 – – – 72
Trading financial liabilities at fair value through profit or loss 7,505 – – 7,505 – – – 7,505
Financial liabilities designated at fair value through profit or loss 17,482 5,972 261 23,715 27 56 83 23,798
Short term borrowings – 742 2,925 3,667 – – – 3,667
Other liabilities 10,548 – 7,500 18,048 – – – 18,048
Long term debt – 61 182 243 21,801 2,689 24,490 24,733
Perpetual debt – – – – – 1,251 1,251 1,251
Liabilities held for sale 24,066 – 8,119 32,185 485 – 485 32,670
Total financial liabilities 59,842 6,775 18,987 85,604 22,313 3,996 26,309 111,913
2015 Contractual maturity of Financial Liabilities (USD million)
Deposits 157 – 3 160 – – – 160
Securities sold under repurchase agreements
and securities lending transactions 24 38 – 62 – – – 62
Trading financial liabilities at fair value through profit or loss 9,755 – – 9,755 – – – 9,755
Financial liabilities designated at fair value through profit or loss 7,746 17,703 70 25,519 147 54 201 25,720
Short term borrowings – 43 2,718 2,761 – – – 2,761
Other liabilities 7,910 – – 7,910 8,200 – 8,200 16,110
Long term debt – 67 1,200 1,267 22,433 2,663 25,096 26,363
Perpetual debt – – – – – 1,251 1,251 1,251
Liabilities held for sale 32,499 42 21,479 54,020 482 – 482 54,502
Total financial liabilities 58,091 17,893 25,470 101,454 31,262 3,968 35,230 136,684
Liabilities in trading portfolios have not been analysed by con-tractual maturity because these liabilities are used to risk manage positions held across CS group and can be closed out at very short notice. They have been classified as being ‘on demand’ at their fair value.
For instruments with perpetual features (i.e. no maturity dates), the projected coupons have been excluded. Callable deposits, open ended positions and overnight funding will be recorded at theirpresentvalueinan‘ondemand’categorisation.Thisclassifi-cation will be based on the underlying legal and contractual ability of the counterparty or the Company to put or call the positions at short notice.
iii) Currency RiskTheCompanytakesonexposuretotheeffectsoffluctuationsintheprevailingforeigncurrencyexchangeratesonitsfinancialposi-tionandcashflows.
TheCompanyhasapproval tomanage itsown tradingprofitand loss related foreign exchange risk through a formal trading mandateandhasdefinedrisk limitsusingtheVaRmethodology.Its currency exposure within the non-trading portfolios is managed throughtheCS grouplevellingprocessassetoutintheCorporateForeign Exchange Policy. Both these methodologies are discussed in more detail in section i) Market Risk, of this note.
iv) Credit RiskCredit risk in CSS(E)L Group is managed by the CSS(E)L Credit Risk Management (‘CSS(E)L CRM’) department, which is headed bytheCSS(E)LChiefCreditOfficer(‘CSS(E)LCCO’),whointurnreports to theCompanyChief RiskOfficer (‘CRO’). CSS(E)LCredit Risk Management (‘CRM’) is a part of the wider CRM department, which is an independent function with responsibility for approving credit limits, monitoring and managing individual exposures and assessing and managing the quality of the segment and business areas’ credit portfolios and allowances. The head of CRMreportstotheChiefRiskOfficerofCSgroup.Allcreditlimitsin CSS(E)L Group are subject to approval by CSS(E)L CRM.
Definition of credit riskCredit risk is the possibility of a loss being incurred as the result of aborrowerorcounterpartyfailingtomeetitsfinancialobligationsor as a result of deterioration in the credit quality of the borrower or counterparty. In the event of a customer default a company gener-ally incurs a loss equal to the amount owed by the debtor, less any recoveries from foreclosure, liquidation of collateral or the restruc-turing of the debtor company. A change in the credit quality of the counterparty has an impact on the valuation of assets eligible for fair value measurement, with valuation changes recorded in the Consolidated Statement of Income.

120
Credit risk management approachEffective credit risk management is a structured process to assess, quantify, measure, monitor and manage risk on a consis-tent basis. This requires careful consideration of proposed exten-sionsofcredit,thesettingofspecificlimits,monitoringduringthelife of the exposure, active use of credit mitigation tools and a dis-ciplined approach to recognising credit impairment.
Credit limits are used to manage concentration to individual counterparties. A system of limits is also established to address concentration risk in the portfolio, including country limits, industry limits and limits for certain products. In addition, credit risk con-centration is regularly supervised by credit and risk management committees, taking current market conditions and trend analysis into consideration. A credit quality review process provides an early identificationofpossiblechangesinthecreditworthinessofclientsand includes regular asset and collateral quality reviews, business andfinancialstatementanalysisandrelevanteconomicandindus-try studies. Regularly updated watch lists and review meetings are used for the identification of counterparties where adverse changes in creditworthiness could occur. As of 1st January 2017 CSS(E)L must comply with the EBA’s guidelines on the manage-ment of exposure to non-regulated entities carrying out credit intermediation activities (so-called “shadow banks”). CSS(E)L CRM has established a framework for managing exposures to shadow banks, the majority of which will be managed under the principal approach. A small number of counterparties will be man-aged under the regulatory fallback approach, and exposure to these entities is well below the regulatory limit (25% of net EAD over capital).
Counterparty and transaction ratingThe CSS(E)L Group employs a set of credit ratings for the pur-pose of internally rating counterparties to which it is exposed to credit risk as the contractual party. Credit ratings are intended to reflect the risk of default of each counterparty. Ratings areassigned based on internally developed rating models and pro-cesses, which are subject to governance and internally indepen-dent validation procedures.
The CSS(E)L Group’s internal ratings may differ from counter-parties external ratings where present. Policy requires the review of internal ratings at least annually. For the calculation of internal risk estimates and Risk Weighted Assets (‘RWAs’), a probability of default (‘PD’) is assigned to each facility, with the PD determined by the internal credit rating. Internal ratings are based on the anal-ysis and evaluation of both quantitative and qualitative factors. The specific factorsanalysedaredependenton the typeofcounter-party. The analysis emphasises a forward looking approach,
concentrating on economic trends and financial fundamentals.Analysts make use of peer analysis, industry comparisons, exter-nal ratings and research, other quantitative tools and the judge-ment of credit experts. The PD for each rating is calibrated based on historic default experience, using external data from Standard & Poor’s, and back-tested to ensure consistency with internal experience.
The CSS(E)L Group assigns an estimate of expected loss in the event of a counterparty default based on the structure of each transaction. The counterparty credit rating is used in combination with credit (or credit equivalent) exposure and the loss given default (‘LGD’) assumption to estimate the potential credit loss. LGD rep-resents the expected loss on a transaction should default occur and takes into account structure, collateral, seniority of the claim and, in certain areas, the type of counterparty. CSS(E)L Group uses credit risk estimates consistently for the purposes of approval, establishment and monitoring of credit limits and credit portfolio management, credit policy, management reporting and allocation and certain financial accounting purposes. This approach alsoallows us to price transactions involving credit risk more accurately, based on risk/return estimates. CSS(E)L Group has been granted permission by the PRA to use internal credit rating models under the CRD4 A-Internal Rating Based (‘A-IRB’) approach for the majority of credit exposures in CSS(E)L Group. Exposures which are not covered by A-IRB treatment are subject to the standardised approach.
Credit Risk OverviewAll transactions that are exposed to potential losses due to failure of a counterparty to meet an obligation are subject to credit risk exposure measurement and management.
Maximum exposure to credit riskThe following table presents the maximum exposure to credit risk of balance sheet and off-balance sheet financial instruments,before taking account of the fair value of any collateral held or other credit enhancements unless such credit enhancements meet offsettingrequirementsassetoutinIAS32.Forfinancialassetsrecognised on the balance sheet the maximum exposure to credit risk equals their carrying amount as at 31 December 2016. For financialguaranteesgrantedandothercredit-relatedcontingen-cies the maximum exposure to credit risk is the maximum amount that CSS(E)L Group would have to pay if the guarantees and con-tingencies are called upon. For loan commitments and other cred-it-related commitments that are irrevocable over the life of the respective facilities the maximum exposure to credit risk is the full amount of the committed facilities.

121Credit Suisse Securities (Europe) Limited, Annual Report 2016
Notes to the Financial Statements for the year ended 31 December 2016
Maximum exposure to credit risk:
Group Company
Gross Collateral Net Gross Collateral Net
2016 Maximum exposure to credit risk (USD million) 1
Cash and due from banks 3,187 – 3,187 3,183 – 3,183
Interest-bearing deposits with banks 8,763 – 8,763 8,763 – 8,763
Securities purchased under resale agreements and securities borrowing transactions 40,416 37,391 3,025 40,416 37,391 3,025
Trading financial assets at fair value through profit or loss
Debtsecurities 2,790 – 2,790 2,790 – 2,790
Derivativetradingpositions 5,449 4,884 565 6,002 5,258 744
Financial assets designated at fair value through profit or loss
Securitiespurchasedunderresaleagreementsandsecuritiesborrowingtransactions 21,568 21,568 – 21,568 21,568 –
Other 2,045 – 2,045 1,442 – 1,442
Financial assets available-for-sale 33 – 33 33 – 33
Other assets 9,656 4,195 5,461 9,656 4,195 5,461
Maximum exposure to credit risk – total assets 93,907 68,038 25,869 93,853 68,412 25,441
Off-balance sheet items
Loancommitmentsandothercreditrelatedcommitments 5,920 – 5,920 5,920 – 5,920
Maximum exposure to credit risk – total off-balance sheet 5,920 – 5,920 5,920 – 5,920
Maximum exposure to credit risk 99,827 68,038 31,789 99,773 68,412 31,361
2015 Maximum exposure to credit risk (USD million)
Cash and due from banks 8,874 – 8,874 8,871 – 8,871
Interest-bearing deposits with banks 9,700 – 9,700 9,700 – 9,700
Securities purchased under resale agreements and Securities borrowing transactions 41,083 39,226 1,857 41,083 39,171 1,912
Trading financial assets at fair value through profit or loss
Debtsecurities 5,855 – 5,855 5,855 – 5,855
Derivativetradingpositions 7,303 6,766 537 7,870 6,965 905
Financial assets designated at fair value through profit or loss
Securitiespurchasedunderresaleagreementsandsecuritiesborrowingtransactions 26,450 26,241 209 26,449 26,241 208
Other 2,137 – 2,137 1,513 – 1,513
Financial assets available-for-sale 33 – 33 33 – 33
Other assets 13,473 5,833 7,640 13,473 5,833 7,640
Maximum exposure to credit risk – total assets 114,908 78,066 36,842 114,847 78,210 36,637
Off-balance sheet items
Loancommitmentsandothercreditrelatedcommitments 4,860 – 4,860 4,860 – 4,860
Maximum exposure to credit risk – total off-balance sheet 4,860 – 4,860 4,860 – 4,860
Maximum exposure to credit risk 119,768 78,066 41,702 119,707 78,210 41,497
1 Above table includes both continued and discontinued operations.
The CSS(E)L Group is exposed to credit risk as a result of a coun-terparty, borrower or issuer being unable or unwilling to honour its contractual obligations. These exposures to credit risk exist within financingrelationships,derivativesandothertransactions.
The CSS(E)L Group typically enters into master netting arrangements (‘MNA’s’) with over the counter (‘OTC’) derivative counterparties. The MNA’s allow the CSS(E)L Group to offset derivative liabilities against the derivative assets with the same counterparty in the event the counterparty defaults. Collateral on these derivative contracts is usually posted on a net counterparty basis and comprises either cash or marketable securities or a combination thereof. Included in the table above as collateral and other credit enhancements are the derivative liability amounts which would be offset against the derivative asset position upon default of the counterparty as well as any cash or marketable securities collateral held. Amounts disclosed as collateral and
credit enhancements are where a counterparty has an offsetting derivative exposure with the CSS(E)L Group, a legally enforceable MNA exists, and the credit risk exposure is managed on a net basisor theposition is specificallycollateralised, typically in theform of cash.
Also included in the table within both loans and receivables andfinancialassetsdesignatedatfairvaluethroughprofitandlossis collateral which the CSS(E)L Group holds against loans in the form of guarantees, cash and marketable securities. The CSS(E)L Group also mitigates its credit exposures on certain loans primarily with credit default swaps, which economically hedge the position and as such the notional on the relevant credit default swap has been included. For further information on the collateral and credit enhancements held against loans designated at fair value, refer to Note 15–FinancialAssetsandLiabilitiesDesignatedatFairValuethroughProfitandLoss.

122
Reverse repurchase agreements and securities borrowings are typically fully collateralised instruments and in the event of default, the agreement provides the CSS(E)L Group the right to liquidate the collateral held. Reverse repos are included either within Secu-ritiespurchasedunderresaleagreementsorfinancialassetsdes-ignatedatfairvaluethroughprofitandloss,basedontheaccount-ing methodology. These instruments are collateralised principally by government securities, money market instruments, corporate bonds and cash. The CSS(E)L Group monitors the fair value of securities borrowed and loaned on a daily basis with additional col-lateral obtained as necessary. The fair value of the collateral has been included in the table above. For further information on the collateral and credit enhancements held against reverse repur-chaseagreementsandsecuritiesborrowing refer toNote 13–Securities Borrowed, Lent and Subject to Resale or Repurchase Agreements.
In July 2016, the PRA granted CSS(E)L permission to use Financial Collateral Comprehensive Method (‘FCCM’) Own-Esti-mates (‘OE’) Haircuts for capital computations under the Capital Requirements Directive (‘CRDIV’) regime for derivatives, Securi-ties Financing Transactions (‘SFT’s), Equity Prime Brokerage (‘EPB’) and CCP business lines. The FCCM waiver allows CSS(E)L to use its own internal models to calculate haircuts which are then used within the Current Exposure Method (‘CEM’) method for capital computations. These own-estimate haircuts are much more sophisticated than the broad-based supervisory hair-cuts, and hence more appropriately capture the risk of CSS(E)L’s portfolios.
Included within Other (Financial assets designated at fair value through profit or loss) are failed purchases that arise when a
transaction to purchase an asset has not met the conditions for sale accounting. The CSS(E)L Group typically holds collateral in the form of insurance or securities against the failed purchases.
Collateralheldagainstfinancialguaranteesandloancommit-ments typically includes securities and letters of credit. For further information about the collateral and credit enhancements held against financial guarantees and loan commitments refer to Note 33–GuaranteesandCommitments.
For further information on collateral held as security that the CSS(E)LGroupispermittedtosellorrepledgerefertoNote 36–Assets Pledged or Assigned.
If collateral or the credit enhancement value for a particular instrument is in excess of the maximum exposure then the value of collateral and other credit enhancements included in the table has been limited to the maximum exposure to credit risk.
Risk MitigationThe CSS(E)L Group actively manages its credit exposure utilising credit hedges and monetiseable collateral (cash and marketable securities). Credit hedges represent the notional exposure that has been transferred to other market counterparties, generally through the use of credit default swaps. The CSS(E)L Group also actively enters into collateral arrangements for OTC derivatives and other traded products, which allows us to limit the counterparty exposure risk associated with these products. Collateral taken generally rep-resents cash or government securities although other securities maybeaccepted.Thevalueofcollateralreflectedasariskmiti-gant is net of an appropriate haircut.
Counterparty Exposure before Collateral by Rating
Company 2016 2015
USD million % USD million %
AAA 17 0 24 1
AA+ to AA- 3,692 47 4,926 45
A+ to A- 3,264 41 4,293 39
BBB+ to BBB- 470 6 1,080 10
BB+ to BB- 388 5 466 4
B+ and below 62 1 100 1
7,893 100 10,889 100
Unsecured Exposure by Counterparty Rating
Company 2016 2015
USD million % USD million %
AAA 17 0 24 0
AA+ to AA- 3,260 48 4,837 50
A+ to A- 3,084 44 3,954 41
BBB+ to BBB- 422 6 773 8
BB+ to BB- 101 1 109 1
B+ and below 48 1 55 0
6,932 100 9,752 100

123Credit Suisse Securities (Europe) Limited, Annual Report 2016
Notes to the Financial Statements for the year ended 31 December 2016
FrameworkdefinesQuantitativeand QualitativeSpecificand General Wrong Way Risk Processes
Anautomatedlogicflagsandtreats legal connection. Correlation based processes require feedback from CRMofficers
Trade and Collateral Processes definedwithintheFramework
Specific Wrong Way Risk
Legal Connection
Material Positive
Correlation
Trade TradeCollateral Collateral
General Wrong Way Risk
Wrong Way Risk
The above tables include all loans, commitments, derivatives, securities purchased and sold under resale and repurchase agree-ments, and short term cash trades on a net counterparty exposure basis for the Company as most of the trading portfolio mainly residesintheCompany.Thefirsttablerepresentsmarktomarketexposures before offsetting any eligible collateral held; the second table represents mark to market exposures after offsetting collateral.
Wrong-way riskWrong-way exposuresIn a wrong-way trading situation, the Company’s exposure to the counterparty increaseswhile thecounterparty’sfinancial healthand its ability to pay on the transaction diminishes. Capturing wrong-way risk requires the establishment of basic assumptions regarding correlations within a given trading product. The
Company has multiple processes that allows it to capture and esti-mate wrong-way risk.
Credit approval and reviewsA primary responsibility of CRM is the approval of new counter-party trading relationships and the subsequent ongoing review of the creditworthiness of the client. Part of the review and approval process involves consideration of the motivation of the client and to identify the directional nature of the trading in which the client is engaged. Credit limits are sized to the level of comfort the CRM officerhaswiththestrategyofthecounterparty,thelevelofdis-closureoffinancial informationandtheamountofriskmitigationthat is present in the trading relationship (e.g. level of collateral).
Exposure adjusted risk calculationWrong way risk can arise from different business relationships.
An exposure methodology based on jump to default assumptions, ineligibility of collateral or scenario based add-ons is in place to identify andadjustexposuresforallspecificwrongwayrisktypesasperthedistinctioninthetablebelow.
With respect to general wrong-way risk, a scenario based expo-sureadd-onisappliedtothosecounterpartiesidentifiedfollowingthequantitativeandqualitativereviewfromCreditOfficers.
Wrong-way risk monitoringRegular reporting of wrong-way risk at both the individual trade and portfolio level allows wrong-way risk to be monitored and corrective action taken by CRM in the case of heightened con-cern. General Wrong way risk (‘WWR”) and transactions con-tainingspecificwrong-wayriskduetolegalconnectionareauto-maticallyflaggedandincludedinregularreporting.Transactionscontainingwrong-wayriskduetocorrelationareflaggedtoCRM
officers forconfirmationand then included in regular reporting.Theoutcomeof theWWR identification process is subject tomonthly review from the CSS(E)L Management team via a regu-lar forum.
Settlement RiskSettlement risk arises whenever the settlement of a transaction results in timing differences between the disbursement of cash or securities and the receipt of counter-value from the counter-party. This risk arises whenever transactions settle on a ‘free of payment’ basis and is especially relevant when operating across time zones.

124
In those instances where market convention and/or products preclude a value-for-value exchange, the CSS(E)L Group man-ages its risk throughconfirmationandaffirmationof transactiondetails with counterparties. In order to reduce gross settlement risk, the CSS(E)L Group leverages Clearing Houses, Central Counterparties and Central Settlement services and will also net grosscashflowswithagivencounterpartywherepossible.Itpro-actively seeks to manage the timing of settlement instructions to its agents and the reconciliation of incoming payments in order to reduce the window of exposure. In addition, CRM establishes and monitors limits to control the amount of settlement risk incurred to each counter party.
v) Country RiskCountry risk is the risk of a substantial, systemic loss of value in the financial assets of a country or group of countries, which may be caused by dislocations in the credit, equity and/or currency mar-kets. CSS(E)L has incorporated country limits into its Credit Risk Appetite Framework in order to mitigate this risk in CSS(E)L Group.
For CSS(E)L Group, country limits are set for both developed and emerging markets, based on a potential future exposure view and on a scenario view respectively. Upon CSS(E)L recommenda-tion, maximum appetite and operational limits are calibrated and approved by the CSS(E)L Risk Management Committee (CSS(E)L RMC) on an annual basis or more frequently if warranted by a fun-damental change in strategy or market conditions. The measure-ment of exposures against country limits is reported weekly to CSS(E)Ldedicatedteamsandseniormanagement.FrontOfficerepresentatives are responsible for ensuring limits are respected and any breach is promptly managed. CRM provides independent oversight to ensure that businesses operate within their limits. During the course of the year, reserves are available to CSS(E)L ChiefCreditOfficerandtheCSS(E)LCROincaseatemporaryorpermanentlimitincreaseisneededandjustifiedfromarisk/returnperspective.MorefundamentalchangestothecountryriskprofileofthefirmnecessitatediscussionsandapprovalattheCSS(E)LRMC.
vi) Legal and Regulatory RiskTheCSgroupfacessignificantlegalrisksinitsbusinesses.Legalrisks include, among other things, disputes over the terms of trades and other transactions in which the CS group acts as prin-cipal; the unenforceability or inadequacy of the documentation used to give effect to transactions in which the CS group partici-pates; investment suitability concerns; compliance with the laws and regulations (including change in laws or regulations) of the many countries in which the CS group does business; and dis-putes with its employees. Some of these transactions or disputes result in potential or actual litigation that the CS group must incur legal expenses to defend.
TheCS groupseekstominimiselegalriskthroughtheadop-tion of compliance and other policies and procedures, continuing torefinecontrolsoverbusinesspracticesandbehaviour,employeetraining sessions, the use of appropriate legal documentation, and the involvement of the General Counsel and Compliance depart-ment and outside legal counsel and other external specialists. In addition,theCS groupisanactiveparticipantinanumberofkey
industry and other professional market forums including Interna-tional Swaps and Derivatives Association (‘ISDA’), Association for Financial Markets in Europe (‘AFME’) and British Bankers’ Associ-ation (‘BBA’) which inter alia focus on improving levels of market andproductstandardisation,legaldefinitionandprotocol.
Asaparticipantinthefinancialservicesindustry,theCSgroupis subject to extensive regulation by governmental agencies, supervisory authorities and self-regulatory organisations around the world. Such regulation is increasingly more extensive and com-plex and, in recent years, costs related to our compliance with these requirements and the penalties and fines sought and imposedonthefinancialservicesindustrybyregulatoryauthoritieshaveall increasedsignificantlyandmay increase further.Theseregulations often serve to limit activities, including through the application of increased capital, leverage and liquidity require-ments, customer protection and market conduct regulations and direct or indirect restrictions on the businesses in which the CSS(E)L Group may operate. Such limitations can have a negative effect on the CSS(E)L Group’s business and ability to implement strategic initiatives. To the extent that disinvestment is required from certain businesses, losses could be incurred, as the CSS(E)L Group may be forced to sell such businesses at a dis-count, which in certain instances could be substantial, as a result of both the constrained timing of such sales and the possibility that otherfinancialinstitutionsareliquidatingsimilarinvestmentsatthesame time.
Thefinancialservicesindustrycontinuestobeaffectedbysig-nificantcomplexityofongoingregulatoryreforms,alongsidemorerecently, the potential impacts of Brexit. Changes in laws, rules or regulations, or in their interpretation or enforcement, or the imple-mentation of new laws, rules or regulations, may adversely affect the results of operations.
vii) Operational RiskDefinitionOperationalriskistheriskoffinanciallossarisingfrominadequateor failed internal processes, people or systems, or from external events.
Sources of operational riskOperational risk is inherent in most aspects of CSS(E)L’s busi-ness, including the systems and processes that support CSS(E)L’s activities. It comprises a large number of disparate risks that can manifest in a variety of ways. Particularly relevant examples of operational risk include the risk of fraudulent transactions, trade processing errors, business disruptions, failures in regulatory com-pliance, defective transactions, and unauthorised trading events. Operational risk can arise from human error, inappropriate con-duct, failures in systems, processes and controls, or natural and man-made disasters.
Evaluation and management of operational riskOperational risk frameworkThe diverse nature and wide extent of operational risk makes it inherentlydifficult tomeasure.CSS(E)Lbelieves thateffectivemanagement of operational risk requires a common operational riskframeworkthatfocusesontheearlyidentification,recording,

125Credit Suisse Securities (Europe) Limited, Annual Report 2016
Notes to the Financial Statements for the year ended 31 December 2016
assessment, monitoring, prevention and mitigation of operational risks, as well as timely and meaningful management reporting. CSS(E)L started to introduce CSS(E)L’s current operational risk framework in 2013, which improved the integration of previously separate operational risk processes, providing a more coherent approach to managing all aspects of the operational risk land-scape. Over the past three years, CSS(E)L has redesigned the framework, introducing new components and upgrading existing components with a particular focus on ensuring that the compo-nents work well together.
The operational risk framework provides a structured approach to managing operational risk. It seeks to apply consistent stan-dards and techniques for evaluating risks while providing individual businesseswithsufficientflexibilitytotailorspecificcomponentstoreflecttherisksthattheyrun.Themaincomponentsoftheopera-tional risk framework are described below: p Governance and policies: The operational risk framework relies
on an effective governance process that establishes clear roles andresponsibilitiesformanagingoperationalriskanddefinesappropriate escalation processes for outcomes that are out-side expected levels. CSS(E)L utilises a comprehensive set of policies and procedures that set out how employees are expected to conduct their activities.
p Operational risk appetite: This determines CSS(E)L’s approach to risk-taking and articulates the motivations for taking, accept-ing or avoiding certain types of risks or exposures. Senior management expresses their risk appetite in terms of quantita-tive tolerance levels that apply to operational risk incidents and qualitative statements covering outcomes that should be avoided.TheydefinetheirriskappetitewiththeBoardandrel-evant risk management committees in agreement with the operational risk management function.
p Operational risk register: The register comprises a catalog of inherent operational risks arising as a consequence of CSS(E)L’s business activities. It provides a consistent approach for classifying operational risks which ensures that they are treated consistently by other operational risk framework com-ponents using the appropriate processes and tools.
p Internal control assessment: CSS(E)L utilises a comprehen-sive set of internal controls that are designed to ensure that CSS(E)L’s activities follow agreed policies and that processes operate as intended. Certain key controls are subject to inde-pendent testing to evaluate their effectiveness. The results of these tests are considered by other operational risk framework components, such as in the risk and control self-assessment (‘RCSA’) process.
p Risk and control indicators: These are metrics that are used to monitor particular operational risks and controls over time. Theyareassociatedwith thresholds that defineacceptableperformance and provide early warning signals about potential issues.
p Incident data: CSS(E)L systematically collect, analyse and report data on operational risk incidents to ensure that CSS(E)L understands the reasons why they occurred and how controls can be improved to reduce the risk of future incidents. CSS(E)L focuses on both incidents that result in economic losses and events that provide information on potential control
gaps, even if no losses occurred. CSS(E)L also collects and utilisesavailabledataon incidentsat relevantpeer firms toidentify potential risks that may be relevant in the future, even if they have not impacted the CSS(E)L Group.
p Risk and control self-assessments: RCSAs are comprehen-sive, bottom-up assessments of the key operational risks in each business and control function. They comprise a self-as-sessment that covers the inherent risks of each business and control function, an evaluation of the effectiveness of the con-trols in place to mitigate these risks and a decision to either accept or remediate any residual risks. The self-assessments are subject to quality assurance by the operational risk man-agement function to ensure that they have been conducted appropriately. RCSA’s utilise other components of the opera-tional risk framework, such as risk and control indicators and incident data, and they generate outputs that are used to man-age and monitor risks.
p Top operational risks and remediation plans: A set of top oper-ationalrisksareusedtohighlightthemostsignificantriskstosenior management, along with associated risk remediation efforts. Top operational risks are generated using both a top-down assessment by senior management and a bottom-up process that collates the main themes arising from the RCSA process.
p Reporting: CSS(E)L produces a wide range of regular man-agement information reports covering the key inputs and out-puts of the operational risk framework. These reports are used by senior management to monitor outcomes against agreed targets and tolerance levels.
p Responses framework: This provides a structured approach to responding to operational risk incidents and breaches of oper-ational risk appetite. The incident management component includesadefinedprocessforidentifying,categorising,inves-tigating, escalating and remediating incidents. CSS(E)L con-ductsdetailedinvestigationsforsignificantoperationalriskinci-dents. These investigations seek to assess the causes of control failings, establish appropriate remediation actions and ascertain whether events have implications for other busi-nesses. They can result in recommendations to impose restric-tions on businesses while risk management processes and controls are improved. The breach component provides a methodology for evaluating breaches of quantitative and quali-tative operational risk appetite statements. Its goal is to provide senior management with the information needed to make deci-sions on how best to remediate issues that fall outside agreed risk appetite levels.
p Scenarios and capital modelling: Scenarios are used to identify and measure exposure to a range of adverse events, such as unauthorised trading. These scenarios help businesses assess the suitability of controls in the light of potential losses. Regu-latory capital is determined using the Business Indicator Approach and supplemented by scenario analysis. These cap-ital requirements are allocated to individual businesses for per-formance measurement purposes and to incentivise appropri-ate management actions.
p Operational risk change assessments: Operational risks asso-ciatedwithmajor change initiativesare identified,assessed

126
and managed throughout the life of each program using the relevant components of the operational risk framework. It also considers the fact that even initiatives that are expected to deliveroperationalriskbenefitsuponcompletionmayresultinincreased risks during the implementation phase. Outsourcing initiatives may be considered where the operational risk man-agement department has determined certain materiality criteria are met.
p Conduct and behaviour: Recognising that effective operational risk management relies on employees conducting themselves appropriately, several operational risk framework components include assessments of behaviour. For example, investigations of incidents typically consider whether employees escalated issues at an appropriately early stage. Risks that have implica-tionsforconduct riskcanbe identifiedandassessedvia theoperational risk register and the RCSA process.
In addition to managing and mitigating operational risks under the operational risk framework through business- and risk-related pro-cesses and organisation, CSS(E)L also transfers the risk of poten-tial loss from certain operational risks to third-party insurance companies, where appropriate.
Developments in 2016CSS(E)L is continuously enhancing its operational risk manage-ment practices through an ongoing program to roll out improve-ments to each of the components of the operational risk frame-work and to ensure that the links between individual components work effectively. Potential enhancements are typically tested in onearea tocheck that theydeliver the intendedbenefitsbeforebeing rolled out more broadly.
Maintaining the effectiveness of the CSS(E)L control environ-ment is critical to ensuring that operational risks remain within acceptable levels. In 2016, CSS(E)L made improvements to approaches of cataloging, documenting and evaluating key con-trols, which will provide more robust and supportable control assessments for use in the RCSA process. This work now forms a significantpartoftheEnterpriseRiskandControlFrameworkthatwas launched in 2016 which focuses on introducing a systematic control activities framework that applies consistent standards and approaches to relevant business activities. This is a multi-year ini-tiative thatstartswith themostsignificantcontrolsand rollsoutnew processes using a phased approach.
CSS(E)L has continued to make progress in embedding assessments of employee behaviour in the risk assessment frame-work. In 2016, the business conduct behaviours continued to be reference in a number of HR processes, including recruitment, induction, performance assessment, promotion, and compensa-tion. CSS(E)L has also introduced enhanced risk indicator report-ing covering behaviour and conduct-related matters.
Operational Risk GovernanceEach individual business area takes responsibility for its opera-tional risks and the provision of adequate resources and proce-dures for the management of those risks. Businesses are sup-ported by designated operational risk teams who are responsible for the implementation of the operational risk management
framework, methodologies, tools and reporting within their areas as well as working with management on any operational risk issues that arise. Businesses and relevant control functions meet regu-larly to discuss operational risk issues and identify required actions to mitigate risks.
The operational risk management function is responsible for the overall design of the operational risk management framework, for operational risk capital modelling and for providing assistance and challenge to business line operational risk teams. It ensures the cohesiveness of policies, tools and practices for operational riskmanagement, specificallywith regard to the identification,evaluation, mitigation, monitoring and reporting of relevant UK IB operational risks.
Operational risk exposures, metrics, issues and remediation efforts are discussed at the CSS(E)L Board and Board Risk with standing updates to the CSS(E)L Risk Management committee and CSS(E)L Operational Risk Management committee.
viii) Conduct RiskConduct risk is the risk that poor conduct by the CSS(E)L Group, employees or representatives could result in clients not receiving a fairtransaction,damagetotheintegrityofthefinancialmarketsorthewiderfinancialsystem,or ineffectivecompetition in themar-kets in which CSS(E)L operate that disadvantages clients.
Conduct risk may arise from a variety of sources, including unauthorised trading, the potential unsuitability of products sold or advice provided to clients, inadequate disclosure, trade processing errors, inaccurate benchmark submissions, failure to safeguard client data or assets, and breaches of regulatory rules or laws by individual employees or market conduct.
Conduct risk is embedded into the RCSA process within the operational risk framework, which considers the risks gene-rated by each business and the strength of the associated miti-gating controls. Conduct risk is also assessed by reviewing past incidents and those fromother firms in the financial servicessector.
Conduct risk isprimarilyaddressed throughspecificsupervi-sory controls implemented across the UK IB and targeted training activities. CSS(E)L seeks to promote good behaviour and conduct through the Code of Conduct, which provides a clear statement of the ethical values and professional standards as a basis for main-taining and strengthening CSS(E)L’s reputation for integrity, fair dealing and measured risk-taking, and the set of business conduct behaviours. The Code of Conduct and the set of business conduct behaviours are linked to CSS(E)L’s employee performance assessment and compensation processes.
ix) Reputational RiskThe Credit Suisse (‘CS’) Code of Conduct states that ‘Our most valuable asset is our reputation’. CS’ reputation is driven by the perception of key stakeholders such as clients, shareholders, the media and the public. The CS Global Policy on Reputational Risk (‘the Policy’) states that each employee is responsible for assess-ing the potential reputational impact of all businesses in which they engage, and for determining whether any actions or transactions should be formally submitted through the Reputational Risk Review Process (‘RRRP’) for review.

127Credit Suisse Securities (Europe) Limited, Annual Report 2016
Notes to the Financial Statements for the year ended 31 December 2016
Reputational risk may arise from a variety of sources, including, but not limited to, the nature or purpose of a proposed transaction, action or client relationship, the identity or nature of a potential cli-ent, the regulatory or political climate in which the business will be transactedorsignificantpublicattentionsurroundingthetransac-tion itself.
The Company’s Board has formally delegated reputational risk issues to CS group’s global RRRP which includes an overview of thetransactionoractionbeingconsidered,therisksidentifiedandrelevant mitigating factors and views from internal subject matter experts. All formal submissions in the RRRP require review by the UK Senior Manager in the relevant division, and assuming they are supportive of the proposal are then subsequently referred to one of CS group’s Reputational Risk Approvers (‘RRA’), each of whom is
independent of the business divisions and has the authority to approve, reject, or impose conditions on CS group’s participation. If the RRA considers there to be a material reputational risk asso-ciated with a submission, it is escalated to the EMEA Reputational Risk Committee (‘the Committee’) for further discussion, review andfinaldecision.TheCommitteeiscomprisedofseniorCompanyentity management across divisions and corporate functions.
Reputational risk is assessed on an entity based approach whereby the region of the RRRP submission is driven by the loca-tion of the booking entity. Where a submission relates to a Remote Booking, a submission will be made through to EMEA RRRP and the RRAs in other regions will be consulted as appropriate, which may include escalation to the Committee.
39 Offsetting of Financial Assets and Financial Liabilities
The disclosures set out in the tables below include derivative instruments, reverse repurchase and repurchase agreements, securitieslendingandborrowingtransactions,andotherfinancialassetsandfinancialliabilitiesthat:p are offset in the CSS(E)L Group’s Consolidated Statement of
Financial Position; orp are subject to an enforceable master netting agreement or
similar agreement (enforceable master netting agreements), irrespective of whether they are offset in the CSS(E)L Group’s Consolidated Statement of Financial Position.
Similar agreements include derivative clearing agreements, global master repurchase agreements, global master securities lending agreements,andanyrelatedrightstofinancialcollateral.
Financial instruments such as loans and deposits are not dis-closed in the tables below. They are not offset in the Consolidated Statement of Financial Position.
DerivativesThe CSS(E)L Group transacts bilateral OTC derivatives mainly under International Swaps and Derivatives Association (‘ISDA’) Master Agreements. These agreements provide for the net settle-ment of all transactions under the agreement through a single pay-ment in the event of default or termination under the agreement.
The above ISDA Master Agreements do not meet the criteria for offsetting in the Consolidated Statement of Financial Position. This is because they create a right of set-off of recognised amounts that is enforceable only following an event of default, insolvency or bankruptcy of the CSS(E)L Group or the counterpar-ties or following other predetermined events. In addition CSS(E)L Group and its counterparties do not intend to settle on a net basis or to realise the assets and settle the liabilities simultaneously.
Collateral for OTC derivatives is received and provided in the form of cash and marketable securities. Such collateral may be subject to the standard industry terms of an ISDA Credit Support Annex. The terms of an ISDA Credit Support Annex provide that securities received or provided as collateral may be pledged or sold during the term of the transactions and must be returned upon maturity of the transaction. These terms also give each
counterparty the right to terminate the related transactions upon the other counterparty’s failure to post collateral. Financial collat-eral received or pledged for OTC derivatives may also be subject to collateralagreementswhichrestricttheuseoffinancialcollateral.
For exchange-traded derivatives, positive and negative replace-ment values and related cash collateral are offset if the terms of the rules and regulations governing these exchanges respectively central clearing counterparties permit such netting and offset because the CSS(E)L Group:1 currently has a legally enforceable right to set off the rec-
ognised amounts; and2 intends either to settle on a net basis, or to realise the asset
and settle the liability simultaneously.
To meet criterion (1), the right of set-off:p must not be contingent on a future event; andp must be legally enforceable in all of the following
circumstances:i the normal course of business;ii the event of default; andiii the event of insolvency or bankruptcy of the entity and all
of the counterparties.
Criterion (2) may only be met, if – depending on the settlement mechanism – certain criteria are met (e.g., derivatives with the same currency).
Where no such agreements exist, fair values are recorded on a gross basis.
Under IFRS, the CSS(E)L Group has elected to account for sub-stantially all hybrid financial instruments with an embedded derivative that is not considered closely related to the host contract at fair value. Where these hybrid financial instruments are subject to an enforce-able master netting agreement or similar agreement, they are included in the tables Offsetting of ‘Funded Derivatives’ on page 131.
The following table presents the gross amount of derivative instruments subject to enforceable master netting agreements, the amount of offsetting, the amount of derivatives not subject to enforceable master netting agreements and the net amount pre-sented in the Consolidated Statement of Financial Position.

128
Offsetting of derivative instruments
2016 2015
CSS(E)L Group (USD million) Gross Offsetting Net 2 Gross Offsetting Net
Derivative Assets
Derivative instruments subject to enforceable master netting agreements 5,342 (4) 5,338 7,224 (57) 7,167
Derivative instruments not subject to enforceable master netting agreements 1 120 – 120 135 – 135
Total derivative instruments presented
in the Consolidated Statement of Financial Position 5,462 (4) 5,458 7,359 (57) 7,302
ofwhichrecordedintradingfinancialassetsatfairvaluethroughprofitorloss 5,453 (4) 5,449 7,359 (57) 7,302
ofwhichrecordedinotherassets 9 – 9 – – –
Derivative Liabilities
Derivative instruments subject to enforceable master netting agreements 4,794 (4) 4,790 8,196 (57) 8,139
Derivative instruments not subject to enforceable master netting agreements 1 197 – 197 289 – 289
Total derivative instruments presented
in the Consolidated Statement of Financial Position 4,991 (4) 4,987 8,485 (57) 8,428
ofwhichrecordedintradingfinancialliabilitiesatfairvaluethroughprofitorloss 4,991 (4) 4,987 8,481 (57) 8,424
ofwhichrecordedinotherliabilities – – – 4 – 4
1 Represents derivative instruments where a legal opinion supporting the enforceability of netting in the event of default or termination under the agreement is not in place. 2 Above table includes both continued and discontinued operations. Assets and liabilities pertaining to discontinued operations are USD 2,104 and USD 2,023 respectively
2016 2015
Company (USD million) Gross Offsetting Net 2 Gross Offsetting Net
Derivative Assets
Derivative instruments subject to enforceable master netting agreements 5,895 (4) 5,891 7,776 (57) 7,719
Derivative instruments not subject to enforceable master netting agreements 1 120 – 120 150 – 150
Total derivative instruments presented
in the Company Statement of Financial Position 6,015 (4) 6,011 7,926 (57) 7,869
ofwhichrecordedintradingfinancialassetsatfairvaluethroughprofitorloss 6,006 (4) 6,002 7,926 (57) 7,869
ofwhichrecordedinotherassets 9 – 9 – – –
Derivative Liabilities
Derivative instruments subject to enforceable master netting agreements 4,762 (4) 4,758 8,157 (57) 8,100
Derivative instruments not subject to enforceable master netting agreements 1 197 – 197 294 – 294
Total derivative instruments presented
in the Company Statement of Financial Position 4,959 (4) 4,955 8,451 (57) 8,394
ofwhichrecordedintradingfinancialliabilitiesatfairvaluethroughprofitorloss 4,959 (4) 4,955 8,447 (57) 8,390
ofwhichrecordedinotherliabilities – – – 4 – 4
1 Represents derivative instruments where a legal opinion supporting the enforceability of netting in the event of default or termination under the agreement is not in place. 2 Above table includes both continued and discontinued operations. Assets and liabilities pertaining to discontinued operations are USD 2,104 and USD 2,023 respectively
Reverse repurchase and repurchase agreements and securities lending and borrowing transactionsReverse repurchase and repurchase agreements are generally cov-ered by global master repurchase agreements. In certain situations, for example in the event of default, all contracts under the agree-ments are terminated and are settled net in one single payment. Global master repurchase agreements also include payment or set-tlement netting provisions in the normal course of business that state that all amounts in the same currency payable by each party to the other under any transaction or otherwise under the global master repurchase agreement on the same date shall be set off.
Reverse repurchase and repurchase agreements may also be novated with central clearing counterparties and therefore covered by the central clearing counterparty’s rules and regulations.
Bilateral as well as centrally cleared reverse repurchase and repurchase transactions are netted in the Consolidated Statement of Financial Position if the global master repurchase agreements
respectively the terms of the rules and regulations governing the central clearing counterparties permit such netting and offset because the CSS(E)L Group:1 currently has a legally enforceable right to set off the rec-
ognised amounts; and2 intends either to settle on a net basis, or to realise the asset
and settle the liability simultaneously.
The net settlement criterion in (2) will also be met, if the CSS(E)L Group can settle amounts in a manner such that the outcome is, in effect, equivalent to net settlement. This will occur if, and only if, the gross settlement mechanism has features that eliminate or resultininsignificantcreditandliquidityrisk,andthatwillprocessreceivables and payables in a single settlement process or cycle.
The amounts offset are measured on the same basis as the underlying transaction (i.e. on an accrual basis or fair value basis).

129Credit Suisse Securities (Europe) Limited, Annual Report 2016
Notes to the Financial Statements for the year ended 31 December 2016
Securities lending and borrowing transactions are generally executed under global master securities lending agreements with netting terms similar to ISDA Master Agreements. In certain situa-tions, for example in the event of default, all contracts under the agreement are terminated and are settled net in one single pay-ment. Securities lending and borrowing transactions may also be novated with central clearing counterparties and therefore covered by the central clearing counterparty’s rules and regulations. Trans-actions under these similar agreements are not netted in the Con-solidated Statement of Financial Position because most securities lending and borrowing transactions do not meet the criterion of having the same settlement date specified at inception of thetransaction, and therefore they are not eligible for netting in the Consolidated Statement of Financial Position apart from the other conditions to be met for netting.
Reverse repurchase and repurchase agreements are collater-alised principally by government securities, money market
instruments and corporate bonds and have terms ranging from overnighttoalongerorunspecifiedperiodoftime.Intheeventofcounterparty default, the reverse repurchase agreement or securi-ties lending agreement provides the CSS(E)L Group with the right to liquidate the collateral held. As is the case in the CSS(E)L Group’s normal course of business, substantially all of the collat-eral received that may be sold or repledged was sold or repledged as of December 31, 2016 and December 31, 2015. In certain cir-cumstances,financialcollateralreceivedmayberestrictedduringthe term of the agreement (e.g. in tri-party arrangements).
The following table presents the gross amount of securities purchased under resale agreements and securities borrowing transactions subject to enforceable master netting agreements, the amount of offsetting, the amount of securities purchased under resale agreements and securities borrowing transactions not sub-ject to enforceable master netting agreements and the net amount presented in the Consolidated Statement of Financial Position.
Offsetting of securities purchased under resale agreements and securities borrowing transactions
2016 2015
CSS(E)L Group and Company (USD million) Gross Offsetting Net 3 Gross Offsetting Net
Securities purchased under resale agreements and securities borrowing transactions
Securities purchased under resale agreements 41,607 (9,574) 32,033 41,991 (12,902) 29,089
Securities borrowing transactions 28,052 – 28,052 36,469 – 36,469
Total subject to enforceable master netting agreements 69,659 (9,574) 60,085 78,460 (12,902) 65,558
Total not subject to enforceable master netting agreements 1 1,897 – 1,897 1,975 – 1,975
Total 71,556 (9,574) 61,982 80,435 (12,902) 67,533 2
1 Represents securities purchased under resale agreements and securities borrowing transactions where a legal opinion supporting the enforceability of netting in the event of default or termination under the agreement is not in place.
2 USD 21,568 million (2015: USD 26,450 million) of the total net amount are reported at fair value. 3 Above table includes both continued and discontinued operations.
The following table presents the gross amount of securities sold under repurchase agreements and securities lending transactions subject to enforceable master netting agreements, the amount of offsetting, the amount of securities sold under repurchase
agreements and securities lending transactions not subject to enforceable master netting agreements and the net amount pre-sented in the Consolidated Statement of Financial Position.
Offsetting of securities sold under repurchase agreements and securities lending transactions
2016 2015
CSS(E)L Group and Company (USD million) Gross Offsetting Net 3 Gross Offsetting Net
Securities sold under repurchase agreements and securities lending transactions
Securities sold under repurchase agreements 32,930 (9,574) 23,356 37,148 (12,902) 24,246
Securities lending transactions 13,137 – 13,137 24,839 – 24,839
Total subject to enforceable master netting agreements 46,067 (9,574) 36,493 61,987 (12,902) 49,085
Total not subject to enforceable master netting agreements 1 413 – 413 (1,071) – (1,071)
Total 46,480 (9,574) 36,906 60,916 (12,902) 48,014 2
1 Represents securities purchased under resale agreements and securities borrowing transactions where a legal opinion supporting the enforceability of netting in the event of default or termination under the agreement is not in place.
2 USD 23,707 (2015: USD 25,197 million) of the total net amount are reported at fair value. 3 Above table includes both continued and discontinued operations.

130
The following table presents the gross amount of Prime Brokerage Receivables and Funded Derivative Assets subject to enforceable master netting agreements, the amount of offsetting, the amount
of Funded Derivative Assets not subject to enforceable master netting agreements and the net amount presented in the Consoli-dated Statement of Financial Position.
Offsetting of prime brokerage receivables and funded derivative assets
2016 2015
CSS(E)L Group (USD million) Gross Offsetting Net Gross Offsetting Net
Prime brokerage receivables and funded derivative assets
Prime brokerage receivables subject to enforceable master netting agreements 4,195 – 4,195 5,833 – 5,833
Funded derivative assets subject to enforceable master netting agreements – – – – – –
Total subject to enforceable master netting agreements 4,195 – 4,195 5,833 – 5,833
Total not subject to enforceable master netting agreements 1 120 – 120 398 – 398
Total 4,315 – 4,315 6,231 – 6,231
1 Represents funded derivative assets where a legal opinion supporting the enforceability of netting in the event of default or termination under the agreement is not in place.
2016 2015
Company (USD million) Gross Offsetting Net Gross Offsetting Net
Prime brokerage receivables and funded derivative assets
Prime brokerage receivables subject to enforceable master netting agreements 4,195 – 4,195 5,833 – 5,833
Funded derivative assets subject to enforceable master netting agreements – – – – – –
Total subject to enforceable master netting agreements 4,195 – 4,195 5,833 – 5,833
Total not subject to enforceable master netting agreements 1 120 – 120 398 – 398
Total 4,315 – 4,315 6,231 – 6,231
1 Represents funded derivative assets where a legal opinion supporting the enforceability of netting in the event of default or termination under the agreement is not in place.
Funded Derivative Assets are recorded in Financial Assets Desig-natedatFairValueThroughProfitandLossandPrimeBrokerageReceivables are recorded in Other Assets in the Consolidated Statement of Financial Position.
The following table presents the gross amount of Prime Bro-kerage Payables and Funded Derivative Liabilities subject to
enforceable master netting agreements, the amount of offsetting, the amount of Funded Derivative Liabilities not subject to enforce-able master netting agreements and the net amount presented in the Consolidated Statement of Financial Position.
Offsetting of prime brokerage payables and funded derivative liabilities
2016 2015
CSS(E)L Group (USD million) Gross Offsetting Net Gross Offsetting Net
Prime brokerage payables and funded derivative liabilities
Prime brokerage payables subject to enforceable master netting agreements 6,314 – 6,314 10,896 – 10,896
Funded derivative liabilities subject to enforceable master netting agreements 485 – 485 482 – 482
Total subject to enforceable master netting agreements 6,799 – 6,799 11,378 – 11,378
Total not subject to enforceable master netting agreements 1 1,142 – 1,142 2,021 – 2,021
Total 7,941 – 7,941 13,399 – 13,399
1 Represents funded derivative liabilities where a legal opinion supporting the enforceability of netting in the event of default or termination under the agreement is not in place.

131Credit Suisse Securities (Europe) Limited, Annual Report 2016
Notes to the Financial Statements for the year ended 31 December 2016
2016 2015
Company (USD million) Gross Offsetting Net Gross Offsetting Net
Prime brokerage payables and funded derivative liabilities
Prime brokerage payables subject to enforceable master netting agreements 6,314 – 6,314 10,896 – 10,896
Funded derivative liabilities subject to enforceable master netting agreements 485 – 485 482 – 482
Total subject to enforceable master netting agreements 6,799 – 6,799 11,378 – 11,378
Total not subject to enforceable master netting agreements 1 1,142 – 1,142 2,009 – 2,009
Total 7,941 – 7,941 13,387 – 13,387
1 Represents funded derivative liabilities where a legal opinion supporting the enforceability of netting in the event of default or termination under the agreement is not in place.
Funded Derivative Liabilities are recorded in Financial Liabilities DesignatedatFairValueThroughProfitandLossandPrimeBro-kerage Payables are recorded in Other liabilities in the Consoli-dated Statement of Financial Position.
The following table presents the net amount presented in the ConsolidatedStatementofFinancialPositionoffinancialassetsand liabilities subject to enforceable master netting agreements andthegrossamountoffinancialinstrumentsandcashcollateralnot offset in the Consolidated Statement of Financial Position. The gross amount of financial instruments not offset in the
Consolidated Statement of Financial Position includes amounts relatedtorecognisedfinancialinstrumentsthatdonotmeetsomeor all of the offsetting criteria in IAS 32.42 as well as non-cash financial collateral. The table excludes derivative instruments,reverse repurchase and repurchase agreements, securities lending and borrowing transactions and funded derivatives not subject to enforceable master netting agreements where a legal opinion sup-porting the enforceability of netting in the event of default or termi-nationundertheagreementisnotinplace.Netexposurereflectsrisk mitigation in the form of collateral.
Amounts not offset in the Consolidated Statement of Financial Position
2016 2015
Cash Cash collateral collateral
CSS(E)L Group Financial received/ Net Financial received/ Net (USD million) Net 1 instruments 2 pledged 2 exposure Net 1 instruments 2 pledged 2 exposure
Financial assets subject to enforceable master netting agreements
Derivative instruments 5,338 (3,849) (1,035) 454 7,167 (5,176) (1,406) 585
Securities purchased under resale agreements 32,033 (32,009) (24) – 29,088 (29,043) (45) –
Securities borrowing transactions 28,052 (26,883) – 1,169 36,469 (35,011) – 1,458
Prime brokerage receivables 4,195 – (4,195) – 5,833 – (5,833) –
Funded derivative instruments – – – – – – – –
Total financial assets subject to
enforceable master netting agreements 69,618 (62,741) (5,254) 1,623 78,557 (69,230) (7,284) 2,043
Financial liabilities subject to enforceable master netting agreements
Derivative instruments 4,790 (3,304) (356) 1,130 8,139 (4,695) (1,216) 2,228
Securities sold under repurchase agreements 23,356 (23,343) (13) – 24,246 (24,196) (50) –
Securities lending transactions 13,137 (13,137) – – 24,839 (22,237) – 2,602
Prime brokerage payables 6,314 – – 6,314 10,896 – – 10,896
Funded derivative instruments 485 – – 485 482 – – 482
Total financial liabilities subject to
enforceable master netting agreements 48,082 (39,784) (369) 7,929 68,602 (51,128) (1,266) 16,208
1 Net amount presented in the Consolidated Statement of Financial Position and subject to enforceable master netting agreements, as per the preceding tables. 2 The total amount reported in financial instruments and cash collateral is limited to the net amount for the related instruments presented
in the Consolidated Statement of Financial Position.

132
Amounts not offset in the Company Statement of Financial Position
2016 2015
Cash Cash collateral collateral
Company Financial received/ Net Financial received/ Net (USD million) Net 1 instruments 2 pledged 2 exposure Net 1 instruments 2 pledged 2 exposure
Financial assets subject to enforceable master netting agreements
Derivative instruments 5,891 (4,077) (1,180) 634 7,719 (5,430) (1,535) 754
Securities purchased under resale agreements 32,033 (32,009) (24) – 29,088 (29,043) (45) –
Securities borrowing transactions 28,052 (26,883) – 1,169 36,469 (35,011) – 1,458
Prime brokerage receivables 4,195 – (4,195) – 5,833 – (5,833) –
Funded derivative instruments – – – – – – – –
Total financial assets subject to
enforceable master netting agreements 70,171 (62,969) (5,399) 1,803 79,109 (69,484) (7,413) 2,212
Financial liabilities subject to enforceable master netting agreements
Derivative instruments 4,758 (3,361) (356) 1,041 8,100 (4,750) (1,216) 2,134
Securities sold under repurchase agreements 23,356 (23,343) (13) – 24,246 (24,196) (50) –
Securities lending transactions 13,137 (13,137) – – 24,839 (22,237) – 2,602
Prime brokerage payables 6,314 – – 6,314 10,896 – – 10,896
Funded derivative instruments 485 – – 485 482 – – 482
Total financial liabilities subject to
enforceable master netting agreements 48,050 (39,841) (369) 7,840 68,563 (51,183) (1,266) 16,114
1 Net amount presented in the Company Statement of Financial Position and subject to enforceable master netting agreements, as per the preceding tables. 2 The total amount reported in financial instruments and cash collateral is limited to the net amount for the related instruments presented
in the Company Statement of Financial Position.
Net exposure is subject to further credit mitigation through the trans-fer of the exposure to other market counterparties by the general use
of CDSs. Therefore the net exposure presented in the table above is not representative for the CSS(E)L Group’s counterparty exposure.
40 Capital Adequacy
The Company’s capital adequacy is managed and monitored based on practices developed by the Basel Committee on Banking Supervision (the ‘Basel Committee’) and governed by European Union regulations as set by the European Banking Authority (‘EBA’). These are set out in the Capital Requirements Regulation (‘CRR’) and the Capital Requirements Directive (‘CRD’), collec-tively referred to as CRDIV.
The CS group considers a strong and efficient capital position to be a priority. Consistent with this, the Company closely monitors its capital position on a continuing basis to ensure ongoing stability and support of its business activities. This monitoring takes account of the requirements of the current regulatory regime and any forth-coming changes to the capital framework or to the Company’s business model. CS group continues to provide confirmation that it will ensure that the Company is able to meet its debt obligations and maintain a sound financial position over the foreseeable future.
Multi-year business forecasts and capital plans are prepared by the Company, taking into account its business strategy and the impact of known regulatory changes. These plans are subjected to variousstress tests, reflectingbothmacroeconomicandspecificrisk scenarios, as part of the ICAAP. Within these stress tests, potential management actions, that are consistent with both the market conditions implied by the stress test and the stress test outcome, are identified. The results of these stress tests andassociated management actions are updated regularly, as part of
the ICAAP, with results documented and reviewed by the Board of Directors. The ICAAP then forms the basis for any Supervisory Review and Evaluation Process (‘SREP’) review that the PRA con-ducts when assessing an institution’s level of regulatory capital.
Own FundsOwn Funds comprise a number of ‘tiers’. Tier 1 capital principally comprises shareholders’ equity (Common Equity Tier 1 (‘CET1’)). This is supplemented by Tier 2 capital, which consists mainly of sub-ordinated debt instruments. Total capital equals the sum of these with adjustments including regulatory deductions and prudential filters.
The Company’s overall capital needs are reviewed to ensure that its own funds can appropriately support the anticipated needs of its businesses. The capital management framework is designed toensurethatownfundsaresufficienttosupporttheunderlyingrisks of the business activity, to meet the objectives of manage-ment and to meet the requirements of regulators, rating agencies and market participants.
During 2016 there was no repayment of subordinated debt or shareholders’ equity repatriation. In 2015, USD 250 million of Tier 2 subordinated debt was repaid to Credit Suisse PSL GmbH and USD 500 million was repaid to Credit Suisse First Boston Finance BV. This was replaced with USD 750 million subordinated debt received from Credit Suisse Investments (UK).
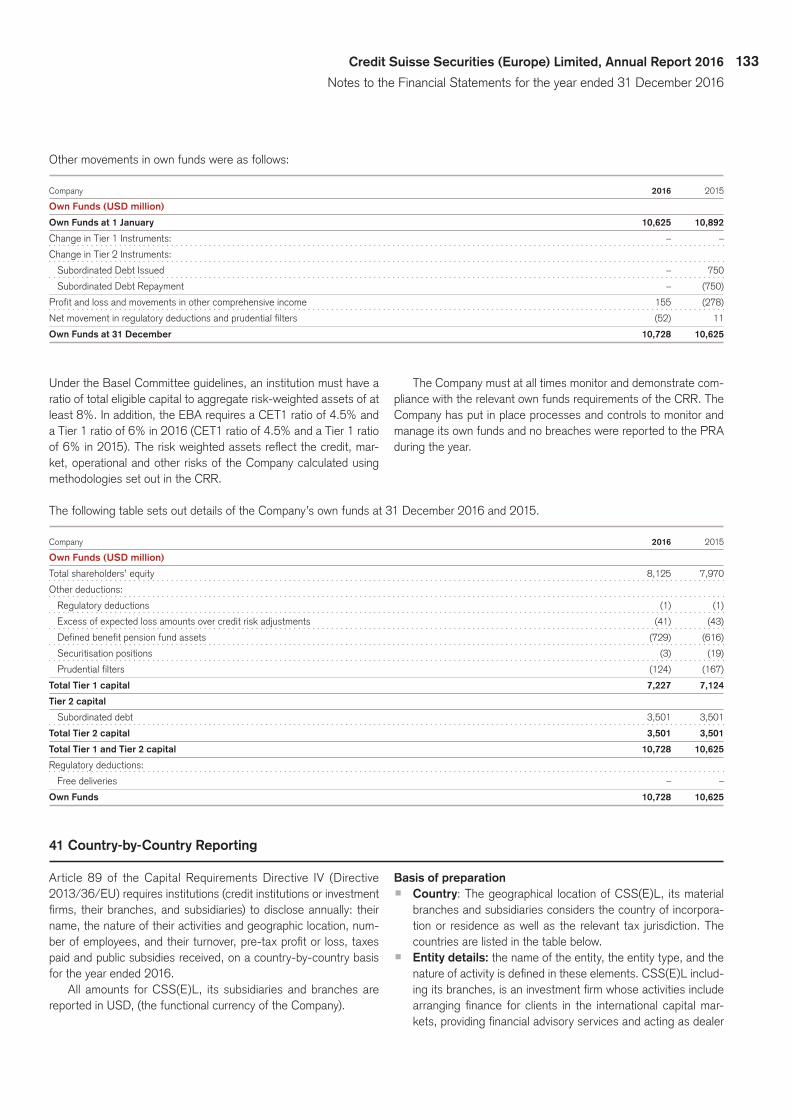
133Credit Suisse Securities (Europe) Limited, Annual Report 2016
Notes to the Financial Statements for the year ended 31 December 2016
Other movements in own funds were as follows:
Company 2016 2015
Own Funds (USD million)
Own Funds at 1 January 10,625 10,892
Change in Tier 1 Instruments: – –
Change in Tier 2 Instruments:
SubordinatedDebtIssued – 750
SubordinatedDebtRepayment – (750)
Profit and loss and movements in other comprehensive income 155 (278)
Net movement in regulatory deductions and prudential filters (52) 11
Own Funds at 31 December 10,728 10,625
Under the Basel Committee guidelines, an institution must have a ratio of total eligible capital to aggregate risk-weighted assets of at least 8%. In addition, the EBA requires a CET1 ratio of 4.5% and a Tier 1 ratio of 6% in 2016 (CET1 ratio of 4.5% and a Tier 1 ratio of6%in2015).Theriskweightedassetsreflectthecredit,mar-ket, operational and other risks of the Company calculated using methodologies set out in the CRR.
The Company must at all times monitor and demonstrate com-pliance with the relevant own funds requirements of the CRR. The Company has put in place processes and controls to monitor and manage its own funds and no breaches were reported to the PRA during the year.
ThefollowingtablesetsoutdetailsoftheCompany’sownfundsat31 December2016and2015.
Company 2016 2015
Own Funds (USD million)
Total shareholders’ equity 8,125 7,970
Other deductions:
Regulatorydeductions (1) (1)
Excessofexpectedlossamountsovercreditriskadjustments (41) (43)
Definedbenefitpensionfundassets (729) (616)
Securitisationpositions (3) (19)
Prudentialfilters (124) (167)
Total Tier 1 capital 7,227 7,124
Tier 2 capital
Subordinateddebt 3,501 3,501
Total Tier 2 capital 3,501 3,501
Total Tier 1 and Tier 2 capital 10,728 10,625
Regulatory deductions:
Freedeliveries – –
Own Funds 10,728 10,625
41 Country-by-Country Reporting
Article 89 of the Capital Requirements Directive IV (Directive 2013/36/EU) requires institutions (credit institutions or investment firms,theirbranches,andsubsidiaries)todiscloseannually: theirname, the nature of their activities and geographic location, num-berofemployees,andtheirturnover,pre-taxprofitorloss,taxespaid and public subsidies received, on a country-by-country basis for the year ended 2016.
All amounts for CSS(E)L, its subsidiaries and branches are reported in USD, (the functional currency of the Company).
Basis of preparationp Country: The geographical location of CSS(E)L, its material
branches and subsidiaries considers the country of incorpora-tion or residence as well as the relevant tax jurisdiction. The countries are listed in the table below.
p Entity details: the name of the entity, the entity type, and the natureofactivityisdefinedintheseelements.CSS(E)Linclud-ingitsbranches,isaninvestmentfirmwhoseactivitiesincludearrangingfinance forclients in the international capitalmar-kets,providingfinancialadvisoryservicesandactingasdealer

134
in securities, derivatives and foreign exchange on a principal and agency basis. CSS(E)L’s material subsidiaries are dis-closed separately.
p Average Number of Employees:Definedasthenumberofemployees on a full time equivalent basis, compensated directly by the entity.
p Turnover:Definedasnet revenues, and is consistentwithCSS(E)L’s financial statements.Net revenues include totalincome before impairment and operating expenses, but after net interest, net commissions/fees income and investment and trading income.
p Pre Tax Profit/(Loss):Definitionofprofit/(loss)beforetaxisconsistentwith thatwithinCSS(E)L’s financial statements,which includes net revenues, less total operating expenses.
p Corporation Taxes Paid:Definedasthecorporationtaxpaidfor CSS(E)L in each country and does not include taxes refunded back to CSS(E)L on account of tax overpayments in prior years during 2016 or 2015. Other taxes paid are detailed in the Strategic Report, and throughout the Annual Report.
p Public Subsidies Received: Interpreted as direct support by the government and there were no public subsidies received by CSS(E)L in 2016 (2015 : Nil).
Country-by-Country report for the year ended 31 December 2016
Parent, Average Pre Tax Corporation Public Subsidiary Number of Turnover Profit/(Loss) Taxes Paid Subsidies Name of Entity or Branch Nature of Activity Employees USD Million USD Million USD Million 2 Received
United Kingdom
Credit Suisse Securities (Europe) Limited Parent Investment firm 3,666 1,260 (105) – –
CSFB Trustees Limited Subsidiary Trustee Company for the – – . – –
Credit Suisse Group Pension
and Life Assurance Scheme
Credit Suisse Client Nominees (UK) Limited Subsidiary Nominee Company – – – – –
Italy
Credit Suisse Securities (Europe) Limited, Branch Branch of an investment firm – 1 3 – –
Milan Branch
Sweden
Credit Suisse Securities (Europe) Limited, Branch Branch of an investment firm 1 1 – – –
Filial Stockholm
France
Credit Suisse Securities (Europe) Limited, Branch Branch of an investment firm 87 100 11 10 –
Paris Branch
Poland
Credit Suisse Securities (Europe) Limited Branch Branch of an investment firm 4 2 1 – –
spolka z. o.o. Oddzial w Polsce
Germany
Credit Suisse Securities (Europe) Limited, Branch Branch of an investment firm 77 48 8 2 –
Niederlassung Frankfurt
The Netherlands
Credit Suisse Securities (Europe) Limited, Branch Branch of an investment firm – – – – –
Amsterdam Branch
South Korea
Credit Suisse Securities (Europe) Limited, Branch Branch of an investment firm 95 129 102 19 –
Seoul Branch
Credit Suisse Securities (Europe) Limited Consolidated 1 3,930 1,541 20 31 –
1 Variable Interest entities are not included in the above reporting for a full list please see Note 34.2 The Corporation taxes paid above do not include taxes refunded during 2016. Taxes refunded during 2016 for CSS(E)L amounted to USD 1.5 million.
Although no Corporation Taxes were paid in the UK, the Company incurred Bank Levy of USD 37 million, employees social security
of USD 70 million and irrecoverable UK value added tax of USD 72 million.

135Credit Suisse Securities (Europe) Limited, Annual Report 2016
Notes to the Financial Statements for the year ended 31 December 2016
Country-by-Country report for the year ended 31 December 2015
Parent, Average Pre Tax Corporation Public Subsidiary Number of Turnover Profit/(Loss) Taxes Paid Subsidies Name of Entity or Branch Nature of Activity Employees USD Million USD Million USD Million 2 Received
United Kingdom
Credit Suisse Securities (Europe) Limited Parent Investment firm 4,651 1,429 (664) – –
CSFB Trustees Limited Subsidiary Trustee Company for the – – – – –
Credit Suisse Group Pension
and Life Assurance Scheme
Credit Suisse Client Nominees (UK) Limited Subsidiary Nominee Company – – – – –
Italy
Credit Suisse Securities (Europe) Limited, Branch Branch of an investment firm 17 16 1 – –
Milan Branch
Sweden
Credit Suisse Securities (Europe) Limited, Branch Branch of an investment firm – 1 – – –
Filial Stockholm
France
Credit Suisse Securities (Europe) Limited, Branch Branch of an investment firm 102 145 (13) 4 –
Paris Branch
Poland
Credit Suisse Securities (Europe) Limited Branch Branch of an investment firm 3 2 1 – –
spolka z. o.o. Oddzial w Polsce
Germany
Credit Suisse Securities (Europe) Limited, Branch Branch of an investment firm 79 47 (3) 5 –
Niederlassung Frankfurt
The Netherlands
Credit Suisse Securities (Europe) Limited, Branch Branch of an investment firm 13 7 – 1 –
Amsterdam Branch
South Korea
Credit Suisse Securities (Europe) Limited, Branch Branch of an investment firm 90 116 81 16 –
Seoul Branch
Credit Suisse Securities (Europe) Limited Consolidated 1 4,955 1,763 (597) 26 –
1 Variable Interest entities are not included in the above reporting for a full list please see Note 34.2 The Corporation taxes paid above do not include taxes refunded during 2015. Taxes refunded during 2015 for CSS(E)L amounted to USD 45 million
Although no Corporation Taxes were paid in the UK, the Company incurred Bank Levy of USD 51 million, employees social security
of USD 145 million and irrecoverable UK value added tax of USD 94 million.
42 CSS(E)L’s Subsidiaries and Associates
In accordance with Section 409 of the Companies Act 2006 a list of CSS(E)L’s subsidiaries and associates, the country of
incorporation and the effective percentage of equity owned at 31 December 2016 is disclosed below.

136
Country Security Immediate parent Total (%)
31 December 2016
Subsidiaries
Credit Suisse AF Trust USA 2 Beneficiary CSS(E)L 100
CSSEL Bare Trust USA 2 Beneficiary CSS(E)L 100
Redwood Master Trust I USA 2 Beneficiary CSS(E)L 100
Redwood Master Trust II USA 2 Beneficiary CSS(E)L 100
Redwood – Master Client Trust USA 2 Beneficiary CSS(E)L 100
Redwood Funding Trust I USA 2 No shares Redwood Master Trust I – 1
Redwood Funding Trust II USA 2 No shares Redwood Master Trust II – 1
Redwood Trust I USA 2 No shares Redwood Master Trust I – 1
Redwood Trust II USA 2 No shares Redwood Master Trust II – 1
Sail Master Trust I USA 2 Beneficiary CSS(E)L 100
Sail Master Trust II USA 2 Beneficiary CSS(E)L 100
Sail Funding Trust I USA 2 No shares Sail Master Trust I – 1
Sail Funding Trust II USA 2 No shares Sail Master Trust II – 1
Sail Trust I USA 2 No shares Sail Master Trust I – 1
Sail Trust II USA 2 No shares Sail Master Trust II – 1
Positive – Master Client LLC USA 2 Beneficiary CSS(E)L 100
Credit Suisse Client Nominees (UK) Limited United Kingdom 2 GBP 1 Ordinary shares CSS(E)L 100
Credit Suisse First Boston PF (Europe) Limited United Kingdom 2 GBP 1 Ordinary shares CSS(E)L 100
Credit Suisse First Boston Trustees Limited United Kingdom 2 GBP 1 Ordinary shares CSS(E)L 100
Associates
Peninsula HEDGE CSHG Fundo de Investimento Brazil 2 Quotas with no par value Investing partners 25.21
em Cotas de Fundo de Investimento Multmercado
Gaoh Offshore (UK) Ltd United Kingdom 2 GBP 0.001p Ordinary shares No immediate parent 20.30
1 Subsidiaries included in Note 34 – Interests in Other Entities, where CSSEL does not hold any share capital.2 Detailed Registered Office Address mentioned in below Table.
CSG is the ultimate parent for the above subsidiaries.
31 December 2016
Subsidiaries Country Registered Office
Credit Suisse AF Trust USA 11 Madison Avenue, New York, New York 10010 – USA
CSSEL Bare Trust USA Wells Fargo Delaware Trust Company, 919 North Market Street, Wilmington, Delaware 19801 – USA
Redwood Master Trust I USA Wells Fargo Delaware Trust Company, 919 North Market Street, Wilmington, Delaware 19801 – USA
Redwood Master Trust II USA Wells Fargo Delaware Trust Company, 919 North Market Street, Wilmington, Delaware 19801 – USA
Redwood Funding Trust I USA Wells Fargo Delaware Trust Company, 919 North Market Street, Wilmington, Delaware 19801 – USA
Redwood Funding Trust II USA Wells Fargo Delaware Trust Company, 919 North Market Street, Wilmington, Delaware 19801 – USA
Redwood – Master Client Trust USA Wells Fargo Delaware Trust Company, 919 North Market Street, Wilmington, Delaware 19801 – USA
Redwood Trust I USA Wells Fargo Delaware Trust Company, 919 North Market Street, Wilmington, Delaware 19801 – USA
Redwood Trust II USA Wells Fargo Delaware Trust Company, 919 North Market Street, Wilmington, Delaware 19801 – USA
Sail Master Trust I USA Wells Fargo Delaware Trust Company, 919 North Market Street, Wilmington, Delaware 19801 – USA
Sail Master Trust II USA Wells Fargo Delaware Trust Company, 919 North Market Street, Wilmington, Delaware 19801 – USA
Sail Funding Trust I USA Wells Fargo Delaware Trust Company, 919 North Market Street, Wilmington, Delaware 19801 – USA
Sail Funding Trust II USA Wells Fargo Delaware Trust Company, 919 North Market Street, Wilmington, Delaware 19801 – USA
Sail Trust I USA Wells Fargo Delaware Trust Company, 919 North Market Street, Wilmington, Delaware 19801 – USA
Sail Trust II USA Wells Fargo Delaware Trust Company, 919 North Market Street, Wilmington, Delaware 19801 – USA
Positive – Master Client LLC USA Wells Fargo Delaware Trust Company, 919 North Market Street, Wilmington, Delaware 19801 – USA
Credit Suisse Client Nominees (UK) Limited United Kingdom One Cabot Square, London E14 4QJ – United Kingdom
Credit Suisse First Boston PF (Europe) Limited United Kingdom One Cabot Square, London E14 4QJ – United Kingdom
Credit Suisse First Boston Trustees Limited United Kingdom One Cabot Square, London E14 4QJ – United Kingdom
Associates
Peninsula HEDGE CSHG Fundo de Investimento Brazil Rua Leopoldo Couto de Magalhães Junior, 700, 11º (parte), 13, 14º (parte), São Paulo – Brazil em Cotas de Fundo de Investimento Multmercado
Gaoh Offshore (UK) Ltd United Kingdom Ocean House, 22 Cousin Lane, London, EC4R 3TE


1440
526
03.2
014
CREDIT SUISSE SECURITIES (EUROPE) LIMITEDOne Cabot SquareLondon E14 4QJcredit-suisse.com
Credit Suisse is committed to a professional and inclusive work environment where all individuals are treated with respect and dignity.Credit Suisse is an equal opportunity employer. © 2017 CREDIT SUISSE GROUP AG and/or its affiliates. All rights reserved.