crime in india: an inter-state analysis issn 0972-706x
TRANSCRIPT
Maharshi Dayanand UniversityResearch Journal ARTS
2019, Vol. 18 (1) pp.81-101ISSN 0972-706X
© The Author(s) 2019http://www.mdu.ac.in/Journals/about.html
AbstractThe main objective of this paper is to present a general profile of crime in India. This paperinvestigates the relative impact of socio-economic variables (NSDP as a proxy of economicgrowth, poverty, unemployment, gender ratio and education) on crime rates in India. State-level data of sixteen major states are used on the above variables for the period 1991 to2011.This includes the study of changes in the composition of crime, trends, patterns andcontribution of selected crime-heads, viz. murder, rape, kidnapping & abduction and crimesagainst property (dacoity, preparation & assembly for dacoity, robbery, burglary and theft).Murder represents assault to human life and security. Similarly, rape represents crimesagainst women, as women of all age group are generally vulnerable to this crime and thesecrimes also represent violence crime in the economy. Crimes against property includedacoity, burglary, preparation & assembly for dacoity, robbery and theft. These acquireimportance for their preponderance in the total rate of crime at any point of time.
Neha GuptaPGT-Economics (SHIS,Gurugram), Former Assistant Professor, DU
Corresponding author:Neha Gupta, PGT-Economics (SHIS,Gurugram), Former Assistant Professor, DU [email protected]
Keywords: Crime, Crime rate, Interstate comparison.
Crime in India:An Inter-State Analysis
Article
LalitAssistant Professor (VNC, DU), Ph.D Scholar

Neha Gupta & Lalit8 2
Introduction
Peace is one of the most important necessities of human being in any society. The economicdevelopment and hence overall development of the economy to a large extent depends onthe peaceful environment i.e. absence of violence. Freedom from violence, as an aspectof the quality of life, is a neglected issue in development studies. Many people wouldrather avoid being mugged, beaten, wounded, or tortured, and it is also nice to live withoutfear of these traumatic experiences. Therefore, protection from violence may be thoughtof as one of the "capabilities" that contribute to the quality of life (Sen 1985). Violence alsoaffects human wellbeing in indirect ways, as armed conflicts undermine economic growthor the functioning of public services. If development is concerned with improving thequality of life, the issue of violence should then be a major interest of the discipline. Therecent upward trend in crime rates of developing countries has spurred widespread publicconcern about personal and proprietary insecurity. In some countries, the questions ofcrime, violence, and victimization are attracting more attention from academics and policymakers than traditional economic problems.
Objectives
l To study the interstate variation in the crime pattern and plausible reasons for thesame.
Data Source
In India, the Criminal Procedure Code divides crimes into two heads: cognizable and non-cognizable. The police have the responsibility to take prompt action on receipt of a complaintor of credible information in the case of cognizable crimes. Cognizable crimes are againsub-divided as those falling under either the Indian Penal Code (IPC), or under the Specialand Local Laws (SLL). Non-cognizable crimes, on the other hand, are left to be pursuedby the affected parties themselves in Courts. The police force initiates investigation intosuch crimes except with magisterial permission. In India statistics on crime are publishedannually by the National Crime Records Bureau, under the Ministry of Home Affairs.State, City and district wise data is available on number of different crimes committed,judicial institutions and enforcement mechanism in a standardized format. 'Crime in India'was first brought out 1954. Since then it is being regularly published. The focus of thisstudy will be only on IPC crimes (cognizable crime). The reason is that the motivationsand enforcement mechanism for SLL crimes are different from that of IPC crimes.Thestudy is restricted on 16 major states because of non-availability of data.
Methodology
Firstly, annual crime incidence have been taken for the years 1991 to 2011. Based on these

Crime in India: An Inter-State Analysis 8 3
crime incidences, linear graph has been constructed to see the trend. Secondly, in order tofind out changes in the composition of crime, crime rates for different heads of crime atthree different points of time i.e. 1991, 2001 and 2011 is calculated. For the same timeperiods crime heads as percentage to total crime are also represented in the form oftables.
Composition of crime (1991, 2001 and 2011)
The composition of crime in a region or state becomes part of the basic exercise in thestudy of crime. This section aims to finding out the composition of crime in India and tohighlight the changes taken therein from 1991 to 2011.
Table: 3.1 Percentage (per cent) Contribution of Different Crime Heads in TotalCrime
Table 3.1 shows different crime heads as a % to total crime from 1991 to 2011. In 1991,theft alone had highest percentage (21.6%). And, preparation & assembly for dacoityshares the lowest % (0.1);whereas in 2001,major crime heads retain their position. Again,theft is found sharing highest percentage (14.3%) but lowest percentage (0.1%) here isbeing shared by counterfeiting (0.1%). However, in 2011, again theft had highest percentage(14.7%) and preparation & assembly for dacoity and counterfeiting shares the lowest %(0.1).

Neha Gupta & Lalit8 4
Changes in the composition of crime are apparent (table 3.1) .In 1991, the total incidenceof IPC crime in India was 16,78, 375 which increased to 17, 69, 308 crimes in 2001.Therefore, the decadal growth becomes 5.4% and average annual rate comes to 0.8%. Interms of %, dominance of crimes against property which include theft, robbery, burglary,and dacoity is evident at all points of time. Nonetheless, their % has declined considerably(from 31.8% in 1991 to 21.5% in 2001). This change may be attributed to the growth ofother crimes. In fact, rapes and cheating have almost doubled in these years and kidnapping& abduction have increased due to rise in the incidence in India. However, murder andcounterfeiting seem to have gradually declined. Though, there is a decline in the percentageof riots in 2001 (4.3%) compared to 1991 (6.3%).There is also a rise in the % of otherscrime from 52.8% (1991) to 64.4% (2001). This increase shows the decline in the % ofother crime in this decade.
The different pictures comes when we compare next decade i.e. 2001and 2011. Inthese years, total incidence of IPC crime has also gone up from 17, 69,308 in 2001 to 2325,575 in 2011.The decadal growth becomes 31.4% and average annual rate was 3.0%.This represents a massive increase in the growth of this decade because in the earlierdecade (1991-2001) it was only 5.4% which was much lower than the current decade(2001-2011).In term of %, same scenario has come up in this decade. Crime againstproperty which include theft, preparation & assembly for dacoity, robbery, burglary, anddacoity have declined from 21.5% in 2001 to 20.0%, but this decline is very small only0.5%. There is sharp decline in the murder from 2.0% (2001) to 1.5% (2011) and riotsfrom 4.3% to 2.9%. There are gradually increase in the % of rape and kidnapping andabduction from 0.9% and 1.3% to 1.0% and 1.9% respectively in this decade. The mainpoint to note here is that the % of kidnapping and abduction of women & girls have almostdouble. Crime against women has also gone up in these years.

Crime in India: An Inter-State Analysis 8 5
Trends of Crime Rate
Figure: 3.1 Trend of Crime rate (IPC) in India (1953 to 2011)
Analysis of crime-rates (at national level) for the last two decades does not show a smoothtrend. Figure 3.1 represents the smooth picture of total crime incidences and crime rate(per 1, 00,000) of the last six decades. It showed how the pattern of crime rate has beenchanging from 1950 to 2011. In 1950 the rate of crime was 182.5 and total incidences ofcrime were 635508 in India. The crime incidences declined in 1953 from 635508 to 601964and rate from 182.5 to 160.7 and further to 137.4 in 1955. The rate of crime was lowest in1955 in the history of independent era of India. Why did this happen? And, what factorscould have involved in this process? Such questions are important to be looked into. From1955 to 1959 the reverse process gets in as the crime rate which was only 137. 4. In 1955kept on rising to 147.2 in 1959. In the 1960s, a good deal of fluctuations was observed. In1980 the crime-rate rose to 206.2 which again declined till 1987.
At the time of adoption of new economic policy 1991, the crime rate was 198.2 almostnear to 200. The years become important in the 1991- 2011 decades in two ways. Firstly,it was the year having lowest crime-rate (160. 0 crimes only) in the second decade i.e.2001-2011. Secondly, it was the year from which the crime-rate started increasing againand reached the level of almost 192.5 crimes per 1, 00,000 persons in 2011. Although it isnot possible to explain such strange fluctuations but at the same time it is equally importantto mark the abrupt changes after the introduction of new economic reform. Have the twin
Source: national crime records bureau.
0
50
100
150
200
250
1950
1953
1956
1959
1962
1965
1968
1971
1974
1977
1980
1983
1986
1989
1992
1995
1998
2001
2004
2007
2010
crime rate

Neha Gupta & Lalit8 6
processes of industrialization - urbanization led to overall increase in crime? Or it is growingawareness among masses responsible for a comparatively higher reporting of crimesbecause of the education? Have our social-priorities and cultural goals become dominantover the 'sanctioned - means' to achieve them? Also, it is important to find out is the basicneeds of human being one of the factor of rising crime in this decades? Sometime peoplechoose illegal activities rather than legal activities because of fewer opportunities in theeconomy. It is important to know about the state level pattern of the some important crimein which study will focus on like murder, rape, kidnapping & abduction and burglary.
Contribution in total IPC crime at State level
The following Table 3.2 tell us the contribution (in %) of IPC crime of sixteen major statein all India IPC crime, it shows the contribution of a state in total IPC crime and theirchanging contribution with the time period from 1991 to 2011. The idea behind this table isthat it will give us a clear pattern of crime contribution of different states in total all IndiaIPC during the liberalization era. Before going on state wise explanation of different majorcrime heads it is important to know about the state wise contribution of IPC crime in totalcrime in India and this contribution includes all the IPC crime heads. In this table, thefollowing years have been taken; 1991, 2001 and 2011, because it represent decadal trendsand is simple to understand and more comparable.
Table: 3.2 Percentage contributions to all India total (IPC crime)

Crime in India: An Inter-State Analysis 8 7
As depicted in the above table, in 1991, Madhya Pradesh was the highest % contributedstate in all India IPC crime. MP has shown highest incidence (218431) and 13% contributionin total IPC. The second highest contributed state was Uttar Pradesh (UP), having 12.4%contribution with 208561total incidences. The lowest contributed states were HimachalPradesh and Punjab. The state which lies in southern part of India also contributed onefourth of total IPC crime together. On the other hand, the states on the northern part ofIndia like Haryana, Delhi and Bihar have contributed 1.7%, 2.1% and 7.1%. The totalcontribution of Gujarat and Rajasthan which are the western part of India in all IPC crimewas 14.2%.The eastern part of India, state like Orissa and West Bengal contributed 3.1%and 4.1% respectively. Thus, overall the major contribution of IPC crime in all total Indiawere came from those states which are the central part of India.
In 2001, some major decline and increase were found in the contribution of IPC crimeof some states. Again, Madhya Pradesh shown highest contribution in all India; UttarPradesh and Maharashtra have also shown declining trend in their contribution. Bihar,Gujarat, Orissa and West Bengal have also shown a declined contribution in all India. Onthe other side some states like Kerala, Tamil Nadu, Rajasthan, Delhi, Haryana andKarnataka have shown rising trend in contribution as compared to 1991.
However in 2011, MP, Maharashtra and UP have shown continually decline share ofcontribution in total IPC crime in India.MP still has larger contribution in India's total crimebut its declined from last two decadal. Only Bihar and West Bengal have shown upwardtrend from 2001 to 2011. The same trend, which was found in 1991 to 2001 of other states,has shown in 2011.The contribution of Andhra Pradesh, Haryana and Kerala were furtherincreased in 2011. On the other hand, the contribution of following states has significantlydeclined in 2011 named by Gujarat, Karnataka and Orissa. Some states like Delhi, Punjaband Rajasthan were shown upward trend from 1991 to 2001 and have shown downwardtrend of contribution from 2001 to 2011.
State wise contributions (per cent) in different Crime Heads
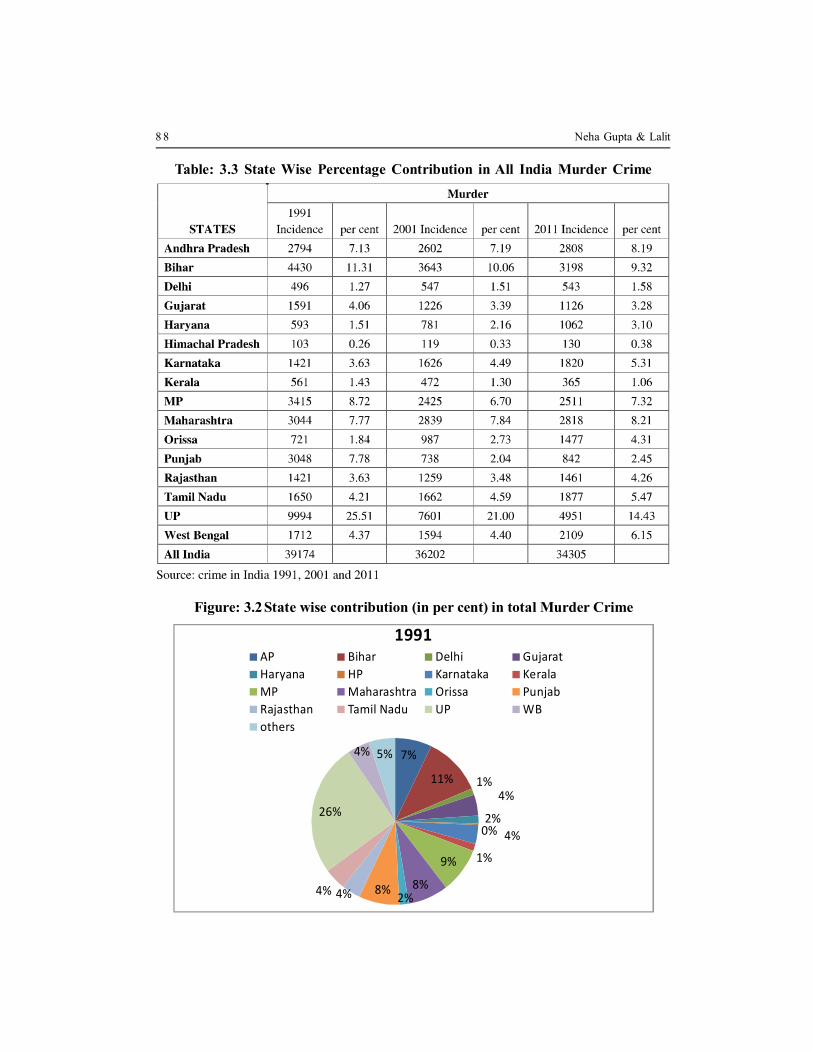
Table (3.4) represent the state wise contribution (in %) of murder in all India (total murder).This table gives state wise decadal trend of murder from 1991 to 2011 and has also explainedhow the pattern of murder has been changing within states over the decades.
Neha Gupta & Lalit8 8
Table: 3.3 State Wise Percentage Contribution in All India Murder Crime
Figure: 3.2 State wise contribution (in per cent) in total Murder Crime
7%
11% 1%4%
2%0% 4%
1%9%
8%2%8%4%4%
26%
4% 5%
1991AP Bihar Delhi GujaratHaryana HP Karnataka KeralaMP Maharashtra Orissa PunjabRajasthan Tamil Nadu UP WBothers

Crime in India: An Inter-State Analysis 8 9
In 1991, the total incidence of murder in India was observed 39174. From the sixteenstates, Uttar Pradesh was reported highest incidence of murder (9994) and its contributionin the total murder was 25.5%. The lowest contributed state was Himachal Pradesh (0.26%)and reported only (103) incidence of murder. One fourth of all murder in India was accountedfor by the Uttar Pradesh and more than half of all murder in India was accounted for bythe four states UP (25%), Bihar (11%), MP (9%) and Maharashtra (8%). Most of themurder was accounted by the central and east (Bihar) part of India.
In 2001, the total incidence of murder was 36202 in India which shows a sharp declinein the murder. Again the highest contributed state in all India murder was UP (21%) andthe lowest share contributed state was Himachal Pradesh (0.33%). Those states whoseshares were declining from 1991 to 2001 are Gujarat, Kerala, MP, Punjab, and Bihar.Although some states shown larger share in 2001 as compare to 1991 named as AndhraPradesh, Delhi, Haryana, HP, Karnataka, Orissa, Tamil Nadu and West Bengal.
In 2011, the number of murder was declined from 36202 in 2001 to 34305 in 2011.Moreover, there was a sharp decline in murder incidence in India from 1991 to 2011.Though the dominated state was UP in the share contribution but a major decline in sharewas found in the UP on the; other hand, share of Andhra Pradesh, Haryana, Orissa,Maharashtra and West Bengal were gone up. Surprisingly, different picture has emergedin 2011 as compared to 1991 and 2001. The new states have emerged with larger share inthe all India murder as before mention as their name by Delhi, Karnataka, Rajasthan, West
Source: crime in India 1991, 2001 and 2011.
7%
10%2%
3% 2%0%
4%
1%7%
8%
3%2%
3%5%
21%
4%
17%
2001
8%
9%2%
3%3%
0%5%
1%7%
8%4%
2%4%
5%
14%
6%
15%
2011

Neha Gupta & Lalit9 0
Bengal and Tamil Nadu. These states were shown continuously upward trend of theirshare in total murder.
Table: 3.4 State Wise Percentage Contribution in All India Rape Crime
Table (3.4) shows us the state wise incidence of rape and the % share of the states in totalrape incidence in India. In 1991, the total incidence of rape was (10410) reported in India.The highest rape incidences were observed in Madhya Pradesh (2596) i.e. 25% in allIndia total rape incidence. The state which follows MP was Uttar Pradesh. The lowestcontribution in total rape cases in India done by Punjab (0.61%) and followed by HimachalPradesh (0.87%).
In 2001, there was major rise in total incidences of rape in India (16075). Again MPhas contributed (18%) in total India but there was decline in the share % in total. The statewhich was reported lower incidence of rape in India was Himachal Pradesh (124) followedby Gujarat (286). There was major decline in the per cent share in total India of somestates namely were Gujarat, Bihar, Maharashtra, Rajasthan, Tamil Nadu, UP and WestBengal. But from the above state, only in Gujarat the incidence of rape has declined (notmajor fall) from (304 to 286) otherwise rest of the states were shown upward trend in thisdecade (1991-2001). Again, most of the incidences of rape were observed in the centraland western part of India.

Crime in India: An Inter-State Analysis 9 1
Figure: 3.3 State wise contribution (in per cent) in Rape Crime
6% 8% 2% 3% 1%1% 2%
2%
25%9%
3%1%
8%3%
14%
5%8%
1991Andhra Pradesh Bihar DelhiGujarat Haryana Himachal PradeshKarnataka Kerala MPMaharashtra Orissa Punjab
However, in 2011 the total incidences of rapes were reported in India was 24602 whichwas higher than from 2001. The lowest contributed state in total was Himachal Pradesh(0.69%). The major increase was observed in West Bengal where the total incidence was2363 recorded in 2011. On the other hand, contribution of UP and MP in total has declinedbut it shows upward trend of rape incidence from l991 to 2011. Overall the data of all threeyears has shown that the crimes against women have increased over the years; wheremost of the rape cases accounted in central, eastern and western part of India from lasttwo decades.
Source: crime in India 1991, 2001 and 2011.
5% 6%2%
2%2% 1%
2%
4%
18%
8%5%
2%
7%
3%
12%
4% 18%
2001
6%
4%2%
2%
3%1%3%
5%
14%
7%5%
2%
7%
3%
8%
10%
19%
2011

Neha Gupta & Lalit9 2
Table: 3.5 State Wise Percentage Contribution in All India Kidnapping & Abduction
Figure: 3.4 State wise contribution (in per cent) in Kidnapping & Abduction
4% 11% 4%
6% 1%1%2%
1%
6%6%
2%2%
11%
4%
25%
5%10%
1991AP Bihar Delhi GujaratHaryana HP Karnataka KeralaMP Maharashtra Orissa Punjab

Crime in India: An Inter-State Analysis 9 3
Table (3.5) represents the state wise incidence of the Kidnapping & Abduction of decadalyears (1991, 2001 and 2011). The total incidence of K & A were reported in 1991 was20079 in India. From among the sixteen states, UP has the largest contribution; one fourth% share of K &A in total India were accounted by UP. The lowest contributed state wasKerala. The most of the incidence of K & A were reported in the central, western andeastern regions of India. The southern region has shown smallest share in all India total.
In 2001, the incidence of K & A has increased from 20079 in 1991 to 22487 in 2001.Himachal Pradesh has contributed smallest with some states namely Bihar, Gujarat, HP,MP, Maharashtra, UP and West Bengal have shown declining trend of K & A (incidence)in this decade. UP has shown largest contribution in all India in 2001 which is quite low ascompare to 1991. A sharp increase in the incidence of K & A in the following states mainlyin Andhra Pradesh, Delhi, Haryana, Orissa, Punjab, Rajasthan and Tamil Nadu. The majorityof this crime came from the central, eastern and north-west part of India.
In 2011, the total incidence of K & A observed in India was 44664. These incidenceswere twice from the year of 1991. The most important state for observing was Delhi, theincidence of K & A risen very fast during the decades. In West Bengal and Bihar, therewas huge jump in the reported cases of K & A in the year of 2011 as compare to other.These two states contributed almost 21% share together in total all India. Again UP wasthe top and HP was bottom in the share list. The states whose share has been increasedfrom last two decades were Delhi, Haryana, Karnataka, Orissa and Tamil Nadu.
Source: crime in India 1991, 2001 and 2011.
5%6% 2% 2%
2%1%2%
4%
18%
8%5%
2%
7%3%
12%
4% 18%
2001
6%4% 2%2%
3%1%3%
5%
14%
7%5%
2%
7%
3%
8%
10%
19%
2011

Neha Gupta & Lalit9 4
Table: 3.6 State Wise Percentage Contributions in All India Property Crime
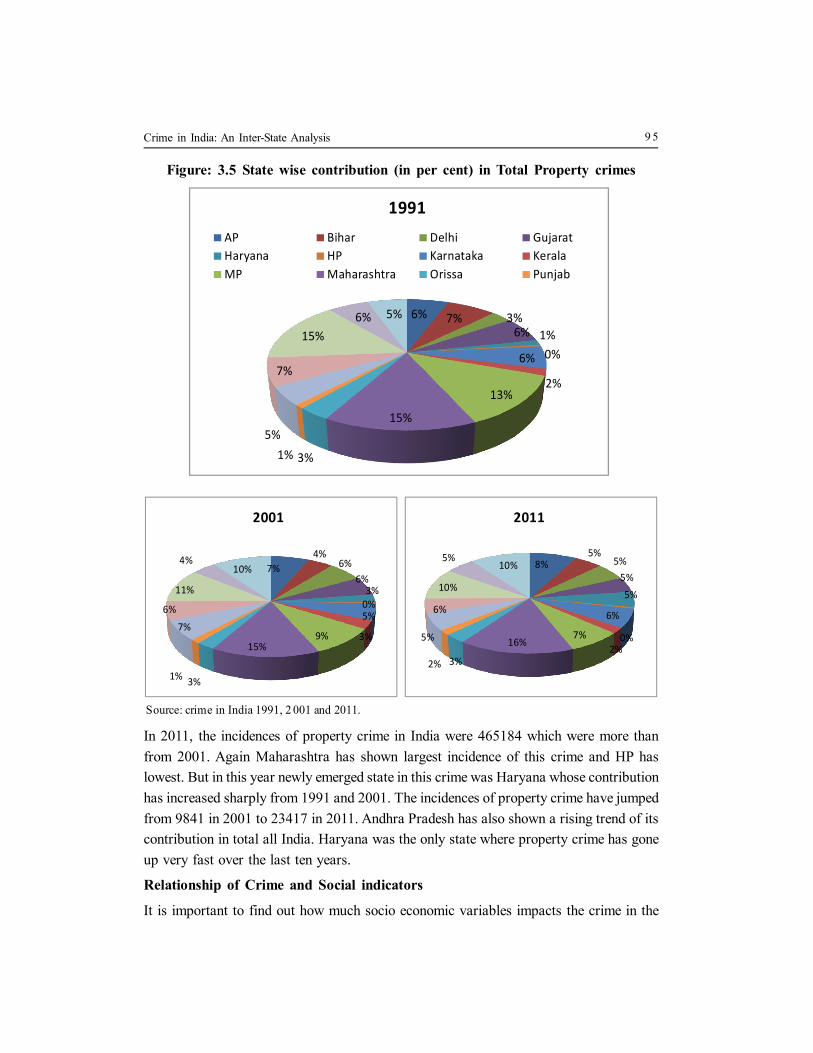
Table (3.6) represents the property crime of the India states and their contribution in the allIndia property crime of three years i.e. 1991, 2001 and 2011. In 1991, total crimes againstproperty observed in India were 533667. Out of this total incidence, UP has contributedlargest 80573 incidences and its share in percentage was 15.1% in 1991. AltogetherMaharashtra, MP and Uttar Pradesh were contributed more than two third share of India'stotal. Thus, majority of the property crimes in India came from the central region in 1991.
In 2001, there was decline in total incidence of crimes against property from 533667 in1991 to 381654 in 2001. There was sharp fall in the incidence of property crime in UP andBihar. On the other hand, states like Kerala, Delhi, Haryana and Punjab where the incidenceof property crime have gone up. The contribution share of Delhi was raised in this year; onthe other hand % share of Bihar, Gujarat, MP, Orissa, Tamil Nadu and West Bengal havegone down. UP and Maharashtra together contributed one fourth share of total all India.
Crime in India: An Inter-State Analysis 9 5
Figure: 3.5 State wise contribution (in per cent) in Total Property crimes
6% 7% 3%6% 1%
0%6%
2%13%
15%
3%1%5%
7%
15%6% 5%
1991AP Bihar Delhi GujaratHaryana HP Karnataka KeralaMP Maharashtra Orissa Punjab
Source: crime in India 1991, 2 001 and 2011.
7%4%
6%6%
3%0%5%
3%9%15%
3%1%
7%
6%
11%
4%10%
2001
8%5%
5%5%5%
0%
6%
2%7%
16%
3%2%
6%
5%
10%
5%10%
2011
In 2011, the incidences of property crime in India were 465184 which were more thanfrom 2001. Again Maharashtra has shown largest incidence of this crime and HP haslowest. But in this year newly emerged state in this crime was Haryana whose contributionhas increased sharply from 1991 and 2001. The incidences of property crime have jumpedfrom 9841 in 2001 to 23417 in 2011. Andhra Pradesh has also shown a rising trend of itscontribution in total all India. Haryana was the only state where property crime has goneup very fast over the last ten years.
Relationship of Crime and Social indicators
It is important to find out how much socio economic variables impacts the crime in the
Neha Gupta & Lalit9 6
economy. Are these socio economic variables determining the crime in the society? Dothese variables contribute any role in the determination of crime rate in the economy or isthere any relationship between these variables and the different crime heads in India? Theanswer of these questions is very important.
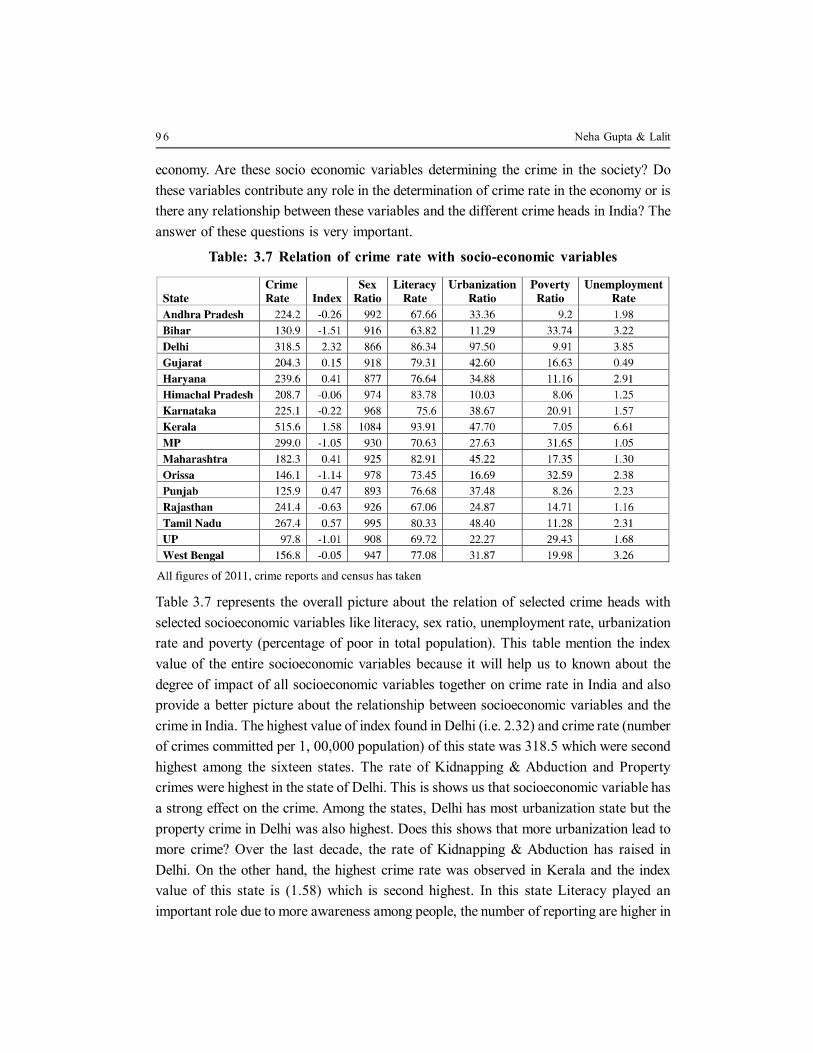
Table: 3.7 Relation of crime rate with socio-economic variables
Table 3.7 represents the overall picture about the relation of selected crime heads withselected socioeconomic variables like literacy, sex ratio, unemployment rate, urbanizationrate and poverty (percentage of poor in total population). This table mention the indexvalue of the entire socioeconomic variables because it will help us to known about thedegree of impact of all socioeconomic variables together on crime rate in India and alsoprovide a better picture about the relationship between socioeconomic variables and thecrime in India. The highest value of index found in Delhi (i.e. 2.32) and crime rate (numberof crimes committed per 1, 00,000 population) of this state was 318.5 which were secondhighest among the sixteen states. The rate of Kidnapping & Abduction and Propertycrimes were highest in the state of Delhi. This is shows us that socioeconomic variable hasa strong effect on the crime. Among the states, Delhi has most urbanization state but theproperty crime in Delhi was also highest. Does this shows that more urbanization lead tomore crime? Over the last decade, the rate of Kidnapping & Abduction has raised inDelhi. On the other hand, the highest crime rate was observed in Kerala and the indexvalue of this state is (1.58) which is second highest. In this state Literacy played animportant role due to more awareness among people, the number of reporting are higher in
Crime in India: An Inter-State Analysis 9 7
Kerala (Even little crimes are reported in Kerala because of growing citizen rightsawareness).
A study done by (Kumari, 2001), states that Kerala has a high rate of charge sheets;it lags behind India in convicting the crimes against women. When the strength of policewas analyzed it was found that in Kerala policemen have to deal with more number ofcases than overall in India. The high work load of the police could be one of the reasonsfor Kerala's lower conviction rate and better women's status with educational background,may be the reason for the high number of reported cases of crime in Kerala. The femaleliteracy are also higher in this state which represent that awareness of female populationis also higher as compared to other states where female population generally not knownabout their rights. That is number of reporting rape cases also higher as compared toothers states. A research study conducted by Chandrika, C.S. 1998., on sexual harassmentat the workplace as a part of the study for SAKSHI, an NGO in New Delhi found that 95percent of the women felt that there was prevalence of sexual harassment at the workplace in Kerala. The state like Uttar Pradesh where crime rate was observed only 97.8per one lakh person in 2011 shows that the lowest crime state in India. This doesn't meanthat crime in UP were very less but numbers of reporting were very less due to lessawareness of the people. The literacy rate in UP only was 69.72 due to which peopledoesn't report the crime specially crime against women. The poverty and unemploymentwere responsible in the increasing crimes incidence in UP. Earlier tables of states contributionof different crime heads in total IPC crime in India also shown that the contribution of UPin murder and kidnapping & abduction was the highest and in other crimes not too muchbehind in 2011. It shows that people are more involved in illegal activities rather than legalbecause of lack of opportunities and also because of less awareness. Similarly in Biharwhere the literacy rate was only (63 per cent) and the poor percentage was (24 per cent)in 2011 which was the lowest as compared to other states. The index has also shown thatsocio economic variable affects overall crimes in Bihar. The crime rate was observed 131per lakh population in Bihar which is again least reported number of cases but again socioeconomic variable are responsible in determination of different crimes rate. The low levelof urbanization found as per the data in Bihar and crime rate is also lower in Bihar (ascompared to Delhi). Bihar contributed second highest in all India murder which shown amajor part of India from where murder incidence were reported but in other crime thereporting were very less that is why crime rate were lower in Bihar. On the other hand,unemployment rate played crucial role in the determination of crime in Bihar theunemployment rate was 2.1 in 2001 and the crime rate was 106 per lakh persons but in2011 there was major increase in the crime rate and unemployment rate (3.2) which

Neha Gupta & Lalit9 8
shows there is positive relationship between crime rate and unemployment. The lacking ofopportunities pushes people into the illegal work such as kidnapping and abduction and theProperty crimes like theft etc. The rate of kidnapping & abduction and theft wereconsiderably increases over the last decade in Bihar. In Madhya Pradesh , crime rate was299 per lakh population in 2011 and 301 in 2001 there was minor decline in rate in lastdecade but there was major decline found in the burglary and theft. On the other handliteracy rate has gone up from 63 per cent (2001) to 70 per cent in 2011 but there isincrease in the unemployment rate from 0.9 to 1.5. The highest rape rate found in this state(4.7) which clearly shown the awareness doesn't reduce the rape incidence even in Keralawhere the literacy was highest, also reported larger numbers of rape cases. It meansawareness doesn't reduce the amount of rape cases. But urbanization level raises theopportunities of the illegal work; the urbanization rate in MP was 28 per cent in 2011.
Theories suggest that urbanization is good for promoting growth of industries anddevelopment in the economy. The other face of this urbanization may be the encouragementof crimes as well, since, crimes normally occur in large cities and in urbanized areas(Krivo & Peterson, 1996). In rural areas, due to lower population density, criminal personshave less chance of hiding themselves because people know each other. The opposite istrue for urban areas. The main facts of crimes in urban areas are the fewer chances ofarrest and recognition (Glaeser & Sacerdote, 1996). So it is argued that as urbanizationincreases so does crime (Galvin & Gaviria, 2002). The pattern in our study has also similarto other study where in the state like Delhi has shown higher crime rate in comparisons toUP and MP (lower urban areas).
In Gujarat, the states who have shown highest employment rate found lower crimerate as compared to other states. The literacy rate was 80 per cent in 2011 and povertyratio was 16 per cent. The crime rate was not influenced in last decade and also shown adeclining trend of different crime heads with improvement of the socio economic conditions.But state like Haryana where the murder rate was found highest (4.2) in comparison ofother states, awareness doesn't too much influence the crime rate specially crime againstproperty. The crime rate in Haryana was considerably raising even rate of selected differentcrime heads like murder, rape, K & A, burglary and theft also shown upward trends duringlast decades. But on the other hand, literacy level has gone up over the period of time. Thepercent contribution of property crime in total India property crimes in the last decade inHaryana was continually gone up.
In a nutshell, socio economic factors play key contributory role in explaining crimetrends in India in general and across states in particular. However, it cannot be ignored thatthe crime figures provided by NCRB may not as close to the reality as it should be given

Crime in India: An Inter-State Analysis 9 9
the nature of reporting in India. It cannot be debunked that the crimes that are mostfrequently occurring in our society like rape, sexual harassment etc are often seen associal stigma and hence are under reported by the victims.
Conclusion
We can conclude that the annual crime rates are not following any specific trend line. Linegraph shows there have been high irregularity and thus, a smooth curve line is not formed.What factors have given shape to such trends necessarily arouse curiosity. As far aspatterns of crime rates are concerned it is difficult to present a general picture becauseevery specific crime has its own patterns and such a condition does not allow to constructgeneralization, which, if drawn could give distorted imagery. Yet, specific crime wisewatersheds may be identified. It is important to bear in mind that patterns show major shiftduring 1991 -2011. Patterns of murder suggest that the central and north central region isprone to higher rates of murder than the rest of the country. In case of rape the samepattern stands true. But, the patterns of rape rates in 1991 are totally different from 2011patterns. Except states like Bihar, UP and Gujarat, all remaining states have shown risingtrend which is important to note that what factors are responsible for upward trend of rapein Indian states. Does social factor are for this or other? K & A and property crime patternare, on the other hand, very interesting. Why states like Delhi is showing highest rate of K& A as compare to all other states? One of the factors responsible for this rising trend maybe the increasing growth of this state which led to inequalities among other state. Peoplewant to live in a state where the standard of living is high but due to less opportunities oflegal work, their involvement in such kind of crime are increasing with the time period. Noteven in Delhi but other states also have shown upward trend of K & A and their contributionin total India have also raised in last few years. Crimes against property patterns suggestthe central and northern region have the highest rate among the all regions. Specially,northern regions are showing highest crime against property, Delhi has shown highest rateof these crimes and Haryana have shown upward trend of property crime rate from lastfew years. Even the murder rate has shown highest in Haryana in 2011. The study hasalso shown that the contribution of states in different crime heads is also raised in last fewyears. Among the crime heads, the number of rape cases have increased significantlybecause of large reporting, due to increasing awareness among women for their rights ascitizen and also because of the criminal justice in India.
Moreover, it has also been observed that socio-economic variables play a crucial rolein the determination of crime in India and across the states. In fact, in few states due tosome social factor the variation in crime heads have been found. These descriptions andconclusions are attempted at broader level as the objective was to outline the general

Neha Gupta & Lalit100
image of crime in India. But certain questions are relevant to be mentioned. First, is it thatall given state has similar rates? If not, why do certain states is prone to higher rates ofcrimes? Second, why the patterns of crime in some states have not changed even in adecade time? Does it mean that patterns of crime manifest their deep roots in socialsanctions and socio-economic structure of these states? And, many more such questionsneed to be looked into.
The composition of crime and changes, therein support the preponderance of crimesagainst property in the total crime, at all points of time and gradual decline in their percentageover the years. Murder rate have also declined significantly. Rape rate and kidnapping &abduction s of women and girls has shown rising trend. Trends show great fluctuation inthe patter of crime over the period of time.
The patterns at the state level show that there has been major shift in some of thecrime heads from 1991 to 2011. The overall crime rate has been fluctuating during theperiods but different picture come up when crime rate was taken at state level. Thedecadal trend of total crime in some states have shown upward trend like Andhra Pradesh,Kerala, Tamil Nadu and Haryana. The murder rate has significantly risen in Haryana andOrissa but declined in many states during the decadal period. The central region andnorthern region of India have found higher murder rate. At aggregate level, rape rate hasshown upward trend which means crime against women has raised over the time. At statelevel, except UP, Bihar and Gujarat, other states have shown upward trend of rape rate.On the other hand kidnapping and abduction rate have also increased in many states butmajor and noticeable rise has been found in Delhi. The crime against property or totalproperty crime has significantly declined at aggregate level and at state level but againHaryana has shown major rise in that rate.
References
Becker, G.S., (1968). "Crime and Punishment: An Economic Approach", Journal of PoliticalEconomy. 76 (2), 169-217.
Chaudhuri, K., Chowdhury, P., Reilly, K., (2013). A new perspective on violent crime burdenindex: evidence from Indian districts. Social Indicators Research. 110, 771-789.
Detotto, C., Otranto, E., (2010). Does crime affect economic growth?Edmark, Karin, (2003). The Effects of Unemployment on Property Crime: Evidence from a Period
of Unusually Large Swings in the Business Cycle. Department of Economics,UppsalaUniversity.
Ehrlich, I., (1973). Participation in Illegitimate Activities: A Theoretical and Empirical Investigation,Journal of Political Economy, 81 (3), 521-565.

Crime in India: An Inter-State Analysis 101
Freeman, R.B., (1999). The Economics of Crime, Handbook of Labor Economics(3rd ed.). ch. 52,3529-3571.
Gould, E.D., Weinberg, B.A. and Mustard, D.B., (2002). Crime rates and local labor marketopportunities in the United States. The Review of Economics and Statistics, 84(1), 45-61.
Imrohoroglu, A., Merlo, A. and P. Rupert (2001). What Accounts for the Decline in Crime?Kelly, M., (2000). "Inequality and Crime", the Review of Economics and Statistics. 82 (4), 530-
539.Kumari, A.: crimes against women in Kerala: what do the trends reveal?National Crime Records bureau, Ministry of Home Affairs.National Sample Survey Organisation, Government of India.Sinha, S. Crime and Violence in India.Sharma, G., (2011). Crime and Inequality in India, University of Missouri, unpublished Paper.

Neha Gupta & Lalit102
