critical infrastructure protection phase iii iii final revised report … · web viewan inventory...
TRANSCRIPT

FINAL CONTRACT REPORT
ASSESSING AND MANAGING RISK OF TERRORISM TO VIRGINIA’S INTERDEPENDENT TRANSPORTATION SYSTEMS
K. G. Crowther, R. Y. Dicdican, M. F. Leung, C. Lian, G. M. Williams Graduate Students
Y. Y. HaimesQuarles Professor of Systems and Information Engineering and Civil Engineering, and
Director
J. H. LambertResearch Associate Professor of Systems and Information Engineering, and
Associate Director
B. M. HorowitzProfessor of Systems and Information Engineering
J. R. SantosResearch Scientist
Center for Risk Management of Engineering SystemsUniversity of Virginia
Project ManagersWayne S. Ferguson, Virginia Transportation Research Council
Steven M. Mondul, Virginia Department of Transportation
Contract Research Sponsored byVirginia Transportation Research Council
Virginia Transportation Research Council(A Cooperative Organization Sponsored Jointly by the
Virginia Department of Transportation and theUniversity of Virginia)
Charlottesville, Virginia
June 2004VTRC-

NOTICE
The project that is the subject of this report was done under contract for the Virginia Department of Transportation, Virginia Transportation Research Council. The contents of this report reflect the views of the authors, who are responsible for the facts and the accuracy of the data presented herein. The contents do not necessarily reflect the official views or policies of the Virginia Department of Transportation, the Commonwealth Transportation Board, or the Federal Highway Administration. This report does not constitute a standard, specification, or regulation.
Each contract report is peer reviewed and accepted for publication by Research Council staff with expertise in related technical areas. Final editing and proofreading of the report are performed by the contractor.
Copyright 2004 by the Commonwealth of Virginia
ii

ABSTRACT
This study expanded on the scope of two previous contract studies for the Virginia Transportation Research Council (VTRC) completed in March 2002 and April 2003. The objective was to develop a methodology for the assessment and management of the risk of terrorism to Virginia’s interdependent transportation infrastructure.
As the economy of the Commonwealth continues to grow and to expand, the importance of the transportation system increases. Many economic sectors use the transportation system either for transport or commuting purposes. These sectors continue to become more and more interdependent with the transportation system. A disruption to the transportation system, such as a terrorist attack, will propagate to other sectors. This study sought to assess the risk due to interdependency and develop risk management options to mitigate that risk.
Three levels of analysis were conducted: statewide, regional, and asset-specific. At the statewide level, the impact of a terrorist act was assessed using the Inoperability Input-Output Model (IIM). The outcome was measured in two metrics: economic losses and percentage of inoperability. The top affected sectors were identified and risk management options are recommended. The regional level risk assessment made use of publicly available databases to structure a perturbation. The perturbation was then analyzed using the IIM, and the resulting economic loss and inoperability was computed. For the asset-specific level, 3 assets were selected: the Midtown Tunnel, I-81, and Sentara Norfolk General Hospital. The risk of terrorism was assessed using publicly available databases and interviews with related experts. Risk management options were developed to mitigate the risks. A computer tool was developed to facilitate the analysis process for other VDOT assets.
iii

FINAL CONTRACT REPORT
ASSESSING AND MANAGING RISK OF TERRORISM TO VIRGINIA’S INTERDEPENDENT TRANSPORTATION SYSTEMS
K. G. Crowther, Graduate StudentR. Y. Dicdican, Graduate StudentM. F. Leung, Graduate Student
C. Lian, Graduate StudentG. M. Williams, Graduate Student
Y. Y. HaimesQuarles Professor of Systems and Information Engineering and Civil Engineering, and
Director
J. H. LambertResearch Assistant Professor of Systems and Information Engineering, and Associate
Director
B. M. HorowitzProfessor of Systems and Information Engineering
J. R. SantosResearch Scientist
Center for Risk Management of Engineering SystemsUniversity of Virginia
INTRODUCTION
No single infrastructure is completely isolated from its environment. For example, the transportation infrastructure is designed to support the movement of workforce and products needed by various industry sectors. Such interdependencies create vulnerabilities that affect not only the transportation infrastructure, but also many industry sectors. Interdependencies may or may not be readily observable. The general lack of understanding, compounded by the technical complexities of interdependent relationships, often result in unrecognized vulnerabilities until a major failure occurs and the authorities are caught unprepared for the consequences. Moreover, tight coupling magnifies systemic disruptions stemming from cascading effects of transportation failures to other sectors. The complexity of the effect imposes new assurance challenges that need to be addressed on several decision-making levels involving multiple stakeholders.
On September 18, 2003, Hurricane Isabel swept through Virginia causing mass power outages, loss of property, and disruptions to the transportation infrastructure. As a result, the Midtown Tunnel flooded and was closed for a month, disrupting traffic between Norfolk and other parts of the state. The port of Norfolk receives and ships containers and bulk products.
1

The tunnel’s closure resulted in a cascading effect of delays and the re-routing of commercial cargo. This illustrates how interdependencies between infrastructures can cause failures in multiple sectors, including businesses, emergency response services, and port operations, among others.
Another illustration of interdependencies is the derailment of a CSX freight train in Howard Street Tunnel in Baltimore on July 18, 2001. The direct impact of this incident included the closure of the Howard Street Tunnel and some major highways into the city, resulting in diversions or cancellations of many freight trains carrying coal, paper, and other manufacturing supplies. Telecommunication services were affected due to damage to a major line of fiber optic cables supporting the areas between New York and Miami. Damage included loss of cellular phone services in some Baltimore areas and loss of e-mail services in the Northeast corridor. Also, a water main ruptured due to high temperature, resulting in massive flooding that hampered rescue operations and knocked out phone services. Among the major economic impacts were commercial losses incurred due to transport delays and a sudden increase in demand for other modal carriers such as trucking.
PURPOSE AND SCOPE
The focus of the study was to understand how the failure of one infrastructure or any of its elements propagates to other infrastructures in order to implement management policies that can mitigate the consequences.
The Baltimore tunnel incident showed that a physical disruption of transportation can have severe physical and economic consequences. The direct effect of a highway disruption is obviously on the flow of traffic. An accident, depending on its severity, would cause delay or even closure of the road artery. This disruption in turn affects other sectors that are physically supported by the transportation infrastructure, such as electric power, telecommunications, business sectors in the surrounding areas, and transportation-related sectors responsible for transport of products. Understanding the interdependent relationships between the transportation infrastructure and other sectors will significantly contribute to planning for response, assessing the risk to allow VDOT to determine the acceptability, and encouraging cooperation among stakeholders, particularly during emergency situations.
The research objective was to develop an integrated methodology for risk assessment and risk management of the impacts associated with transportation infrastructure interdependencies. An inventory of the interdependent sectors was conducted to facilitate prioritization of the most critical interdependencies. The methodology developed for the research includes a multiobjective analysis framework aimed at responding to various complex policymaking issues. These issues would typically include integrating the objectives of various stakeholders and assessing long-term impacts of decisions. Additionally, the methodology employs extreme-event analysis to capture the magnitude of potential losses associated with catastrophic incidents, such as a successful terrorist attack.
2

The research demonstrates how to exploit the various databases for interdependency analysis. One specific database, the economic input-output database published by the Bureau of Economic Analysis (BEA), is by the Center impact of sector interdependencies. Case studies were conducted to understand and quantify such interdependencies; at the same time, they provide a demonstration of the research approach and methodology.
DEVELOPMENT OF METHODOLOGY
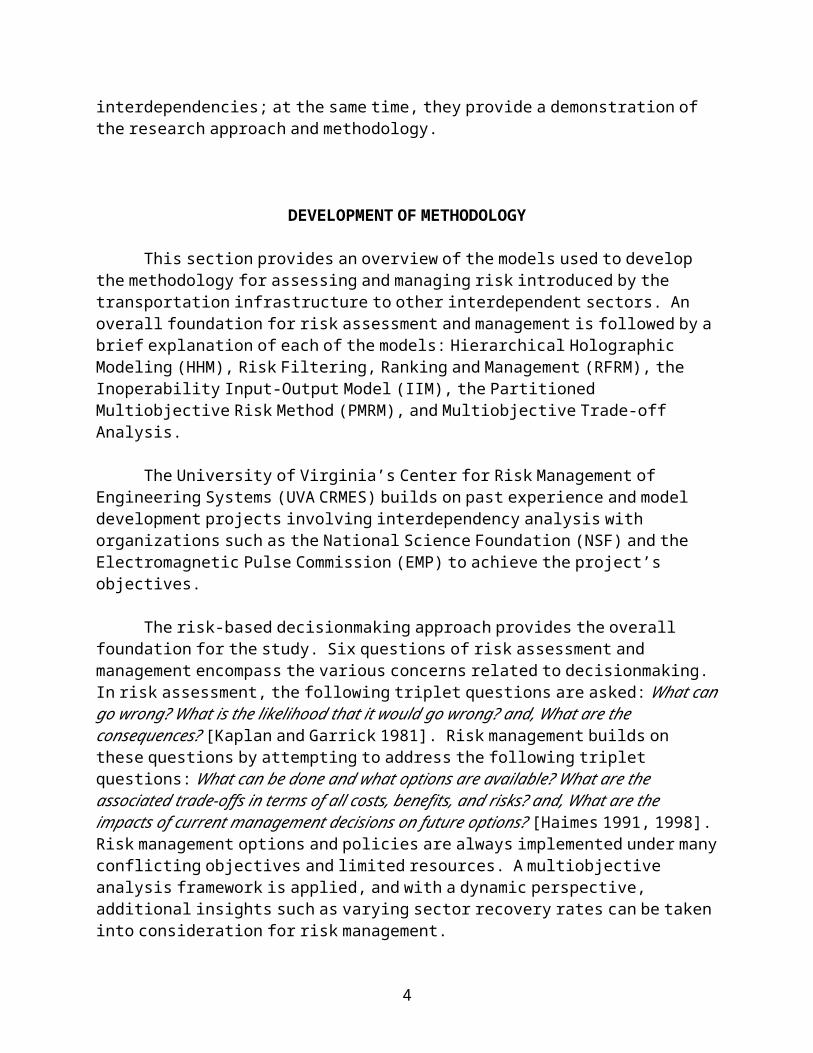
This section provides an overview of the models used to develop the methodology for assessing and managing risk introduced by the transportation infrastructure to other interdependent sectors. An overall foundation for risk assessment and management is followed by a brief explanation of each of the models: Hierarchical Holographic Modeling (HHM), Risk Filtering, Ranking and Management (RFRM), the Inoperability Input-Output Model (IIM), the Partitioned Multiobjective Risk Method (PMRM), and Multiobjective Trade-off Analysis.
The University of Virginia’s Center for Risk Management of Engineering Systems (UVA CRMES) builds on past experience and model development projects involving interdependency analysis with organizations such as the National Science Foundation (NSF) and the Electromagnetic Pulse Commission (EMP) to achieve the project’s objectives.
The risk-based decisionmaking approach provides the overall foundation for the study. Six questions of risk assessment and management encompass the various concerns related to decisionmaking. In risk assessment, the following triplet questions are asked: What can go wrong? What is the likelihood that it would go wrong? and, What are the consequences? [Kaplan and Garrick 1981]. Risk management builds on these questions by attempting to address the following triplet questions: What can be done and what options are available? What are the associated trade-offs in terms of all costs, benefits, and risks? and, What are the impacts of current management decisions on future options? [Haimes 1991, 1998]. Risk management options and policies are always implemented under many conflicting objectives and limited resources. A multiobjective analysis framework is applied, and with a dynamic perspective, additional insights such as varying sector recovery rates can be taken into consideration for risk management.
3

Figure 1. Risk assessment and risk management methodology for analysis of Virginia’s transportation infrastructure and interdependent sectors.
A. Model Components of the Risk Assessment and Management Methodology
Following are the models composing the integrated risk assessment and management methodology for analysis of Virginia’s transportation infrastructure and interdependent sectors.
Hierarchical Holographic Modeling
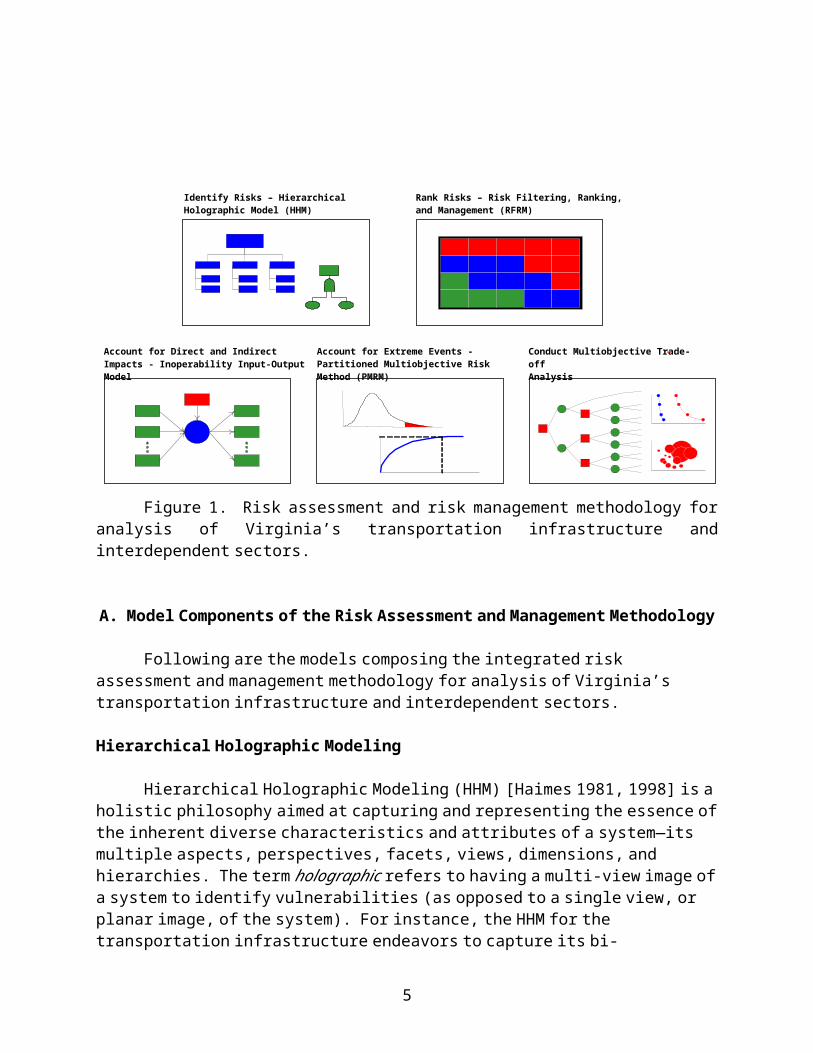
Hierarchical Holographic Modeling (HHM) [Haimes 1981, 1998] is a holistic philosophy aimed at capturing and representing the essence of the inherent diverse characteristics and attributes of a system—its multiple aspects, perspectives, facets, views, dimensions, and hierarchies. The term holographic refers to having a multi-view image of a system to identify vulnerabilities (as opposed to a single view, or planar image, of the system). For instance, the HHM for the transportation infrastructure endeavors to capture its bi-directional interdependency relationships with other external sectors: (1) the effects to the external sectors brought about by transportation-related disruptions; and (2) the effects to the transportation infrastructure caused by changes in industry sectors’ travel demands (e.g., spikes in sector demands impacting the current transportation infrastructure capacity). These critical interdependent relationships are identified through various perspectives such as jurisdictional, intermodal, economic, and users, among others.
Risk Filtering, Ranking and Management Method
Haimes, Kaplan, and Lambert [2002] offer a modeling framework that identifies, prioritizes, assesses, and manages risks to complex, large-scale systems. The risk filtering,
4
Identify Risks – Hierarchical Holographic Model (HHM)
Rank Risks – Risk Filtering, Ranking,and Management (RFRM)
Account for Direct and Indirect Impacts - Inoperability Input-Output Model
Account for Extreme Events - Partitioned Multiobjective Risk Method (PMRM)
Conduct Multiobjective Trade-offAnalysis
-

ranking, and management (RFRM) encapsulates the six questions of risk assessment and management, thereby adhering to a comprehensive risk analysis process. The RFRM consists of eight phases: (see Figure 2):
Phase I. Scenario Identification through Hierarchical Holographic Modeling Phase II. Scenario FilteringPhase III. Bi-Criteria Filtering and RankingPhase IV. Multi-Criteria EvaluationPhase V. Quantitative RankingPhase VI. Risk ManagementPhase VII. Safeguarding Against Missing Critical ItemsPhase VIII. Operational Feedback
RFRM builds on hierarchical holographic modeling to identify risks. It then filters and ranks the many sources of risks, enabling decisionmakers to focus on those that are most critical. The prioritized risks are further considered in the risk management phase, where potential policy options are evaluated for implementation. During the last phase of the RFRM, an iterative process for reviewing and improving the analysis derived from prior phases is conducted.
Inoperability Input-Output Model (IIM)
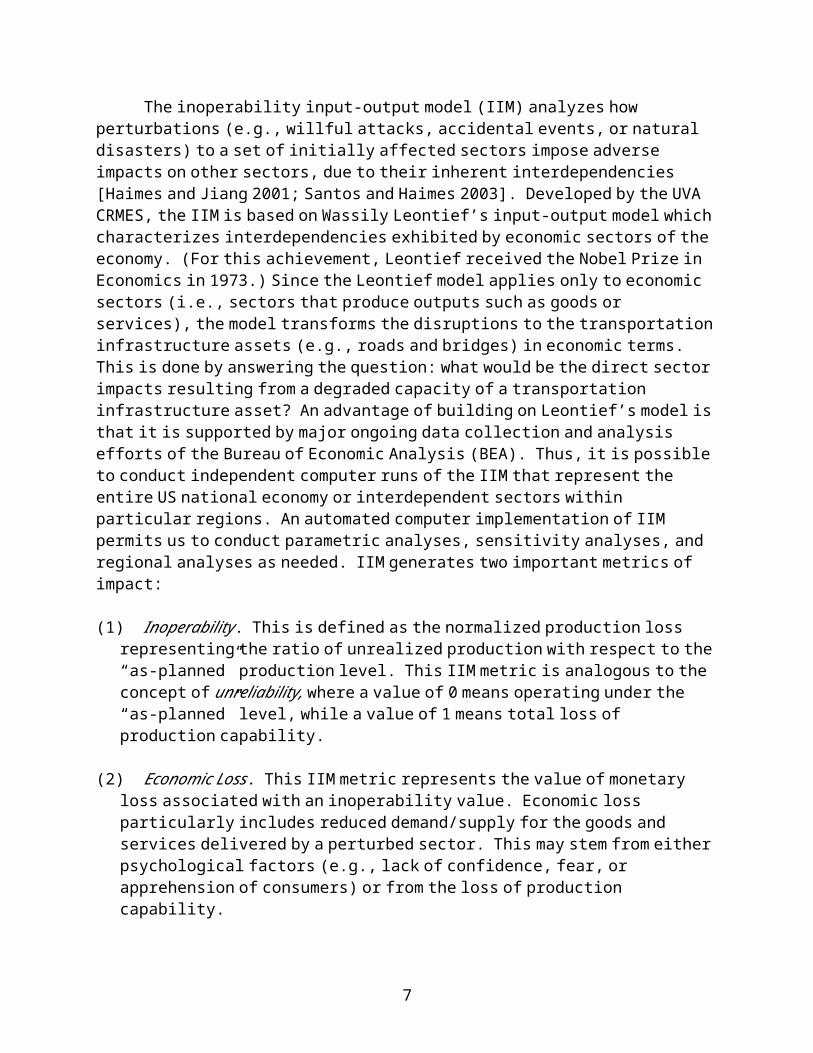
The inoperability input-output model (IIM) analyzes how perturbations (e.g., willful attacks, accidental events, or natural disasters) to a set of initially affected sectors impose adverse impacts on other sectors, due to their inherent interdependencies [Haimes and Jiang 2001; Santos and Haimes 2003]. Developed by the UVA CRMES, the IIM is based on Wassily Leontief’s input-output model which characterizes interdependencies exhibited by economic sectors of the economy. (For this achievement, Leontief received the Nobel Prize in Economics in 1973.) Since the Leontief model applies only to economic sectors (i.e., sectors that produce outputs such as goods or services), the model transforms the disruptions to the transportation infrastructure assets (e.g., roads and bridges) in economic terms. This is done by answering the question: what would be the direct sector impacts resulting from a degraded capacity of a transportation infrastructure asset? An advantage of building on Leontief’s model is that it is supported by major ongoing data collection and analysis efforts of the Bureau of Economic Analysis (BEA). Thus, it is possible to conduct independent computer runs of the IIM that represent the entire US national economy or interdependent sectors within particular regions. An automated computer implementation of IIM permits us to conduct parametric analyses, sensitivity analyses, and regional analyses as needed. IIM generates two important metrics of impact:
(1) Inoperability. This is defined as the normalized production loss representing the ratio of unrealized production with respect to the “as-planned” production level. This IIM metric is analogous to the concept of unreliability, where a value of 0 means operating under the “as-planned” level, while a value of 1 means total loss of production capability.
(2) Economic Loss. This IIM metric represents the value of monetary loss associated with an inoperability value. Economic loss particularly includes reduced demand/supply for the goods and services delivered by a perturbed sector. This may stem from either psychological
5
factors (e.g., lack of confidence, fear, or apprehension of consumers) or from the loss of production capability.
Example Input RFRM Phases Example Tools
Domain knowledgeLiterature
Past incidents
Phase IScenario Identification
Construct hierarchicalholographic model (HHM) of
sources of risks
Hierarchical holographic modeling (HHM)Anticipatory failure determination (AFD)Fault trees
Phase IIDecisionmaker Filtering
Identify scenarios relevant todecisionmaker(s)
Risk scenarios
Decisionmaker’s input(scope, temporal domain,level of decisionmaking)
Interview / Survey
Phase IIIBi-Criteria Filtering
Determine qualitativelikelihood and associated
consequence
Filtered risk scenarios
Historical dataExpert judgment
Interview / SurveyRisk severity matrix
Phase IVMulti-Criteria Evaluation
Evaluate against system’sdefensive properties related toredundancy, robustness, and
resilience
Interview / SurveyDomain knowledgeHistorical data
Expert judgment
Phase VQuantitative Ranking
Determine quantitativelikelihood and associated
consequence
Scenarios withhigh and extremely highrisk severity level
Phase VIRisk Management
Determine and evaluateoptions to address risks
Domain knowledgeHistorical data
Expert judgment
Interview / SurveyInfluence diagramFault trees / Event treesRisk severity matrix
Multiobjective trade-off analysisPartitioned multiobjective risk methodSimulationDecision treeImpact analysis
Policy, engineering informationCost estimates
Expert judgment
Critical risk scenarios
Phase VIISafeguard Against Missing
Items
Re-evaluate
Phase VIIIOperational Feedback
Iterate to improve process
Interview / Survey
Interview / SurveyPerformance measures
User feedback
Source: Haimes et al. [2002]
Figure 2. Risk Filtering, Ranking and Management (RFRM) Phases
6
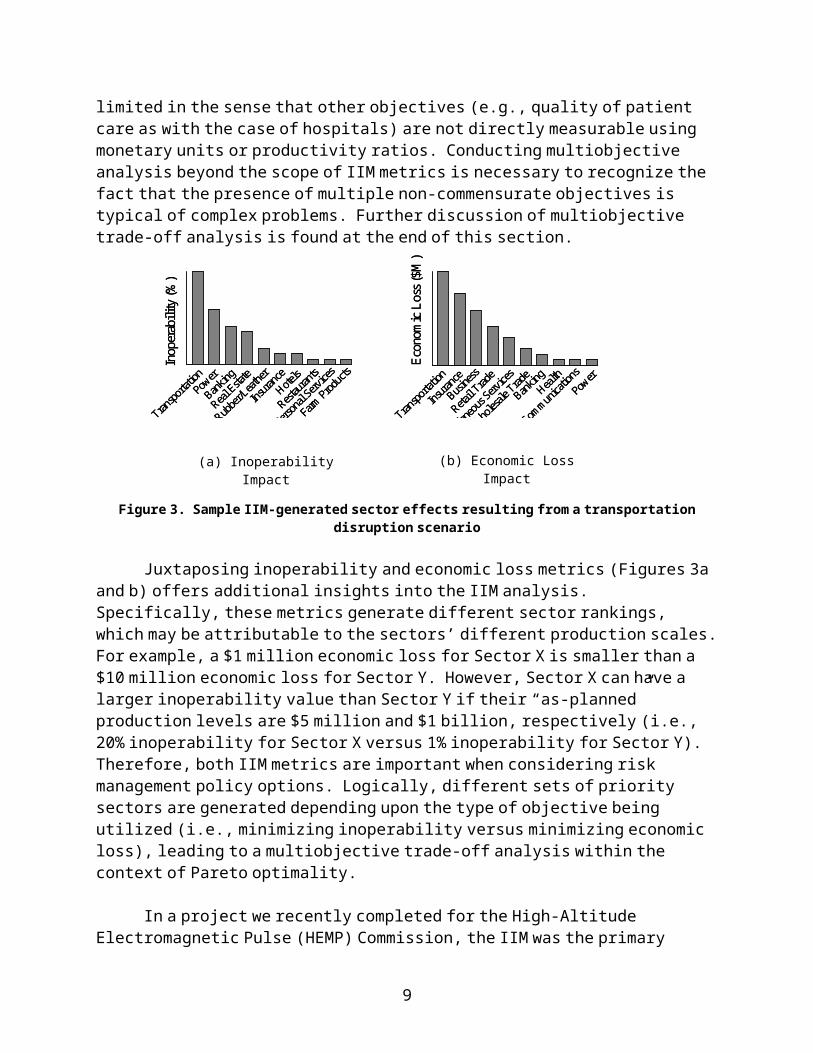
Note that the IIM (inoperability and economic loss) are sector performance metrics related to productivity. These metrics may be limited in the sense that other objectives (e.g., quality of patient care as with the case of hospitals) are not directly measurable using monetary units or productivity ratios. Conducting multiobjective analysis beyond the scope of IIM metrics is necessary to recognize the fact that the presence of multiple non-commensurate objectives is typical of complex problems. Further discussion of multiobjective trade-off analysis is found at the end of this section.
Figure 3. Sample IIM-generated sector effects resulting from a transportation disruption scenario
Juxtaposing inoperability and economic loss metrics (Figures 3a and b) offers additional insights into the IIM analysis. Specifically, these metrics generate different sector rankings, which may be attributable to the sectors’ different production scales. For example, a $1 million economic loss for Sector X is smaller than a $10 million economic loss for Sector Y. However, Sector X can have a larger inoperability value than Sector Y if their “as-planned” production levels are $5 million and $1 billion, respectively (i.e., 20% inoperability for Sector X versus 1% inoperability for Sector Y). Therefore, both IIM metrics are important when considering risk management policy options. Logically, different sets of priority sectors are generated depending upon the type of objective being utilized (i.e., minimizing inoperability versus minimizing economic loss), leading to a multiobjective trade-off analysis within the context of Pareto optimality.
In a project we recently completed for the High-Altitude Electromagnetic Pulse (HEMP) Commission, the IIM was the primary method used for conducting various case studies associated with HEMP-attack scenarios. The case studies featured parametric and uncertainty analyses focusing on: (a) intensity of perturbation to an initial set of affected sectors; (b) temporal characteristics of sector recoveries; (c) economic loss reductions via curtailment of HEMP effects on prioritized sectors; and (d) the regional scope of an attack. Sectors susceptible to a HEMP attack were highlighted in the case studies, including electric power, electronic equipment, and workforce sectors. Trade-off analyses were performed to analyze the effectiveness of resource allocation strategies associated with restoring diversely affected sectors.
7
Econ
omic
Los
s ($
M)
Power
Health
Bankin
g
Commun
icatio
ns
Busine
ss
Retail T
rade
Transpo
rtatio
n
Insura
nce
Miscell
aneo
us Serv
ices
Who
lesale
Trade
Econ
omic
Los
s ($
M)
Power
Health
Bankin
g
Commun
icatio
ns
Busine
ss
Retail T
rade
Transpo
rtatio
n
Insura
nce
Miscell
aneo
us Serv
ices
Who
lesale
Trade
Inop
erab
ility
(%)
Power
Farm Prod
ucts
Person
al Serv
ices
Transpo
rtatio
n
Insura
nce
Restau
rants
Hotels
Bankin
g
Real Esta
te
Rubbe
r/Leat
her
Inop
erab
ility
(%)
Power
Farm Prod
ucts
Person
al Serv
ices
Transpo
rtatio
n
Insura
nce
Restau
rants
Hotels
Bankin
g
Real Esta
te
Rubbe
r/Leat
her
(a) Inoperability Impact (b) Economic Loss Impact

In a recent report from the Center, Risk Modeling, Assessment and Management of the August 2003 Northeast Blackout by Anderson et al., IIM was used to calculate the total dollar loss in an ex post analysis of the Northeast Blackout. The figure generated by the IIM deviated within 4% of the Anderson Economic Group (AEG)’s published calculation. To perform our calculation, we decomposed the disruption into 2 parts: to the electric power sector and to the workforce. The disruptions to the electric power sector and to the workforce were quantified using the following data respectively: electric power outage data (e.g., “fraction affected” or unserved electric power demand) from Anderson Economic Group (AEG) and Gross State Production (GSP) and Local Area Personal Income (LAPI) information from the Bureau of Economic Analysis (BEA). The disruption was input to the IIM. The resulting output agreed with AEG’s aggregate total and provided a detailed breakdown of the losses experienced by each economic sector represented in the BEA database.
Regional IIM. The Regional IIM provides a focused analysis of interdependencies for regions or interests within the United States. The Regional I-O Multiplier System II (RIMS II) division of the U.S. Department of Commerce is the agency responsible for releasing the regional multipliers for desired geographic resolutions (economic areas, states, and counties). RIMS II multipliers are derived mainly from two data sources: (1) national I-O tables from the BEA, which show the input and output structure of approximately 500 national-level industries, and (2) location quotients established from regional earnings and employment data. These are used for adjusting the national I-O tables according to the region’s industrial structure and trading patterns. Several types of RIMS II multipliers are:
• Output Multiplier—gives the change in a sector’s production output resulting from a $1 million change in the demand for another sector’s output.
• Earnings Multiplier—gives the change in the workforce earnings of a sector resulting from a $1 million change in the demand for another sector’s output.
• Employment Multiplier—gives the change in the number of workers of a sector resulting from a $1-million change in the demand for another sector’s output.
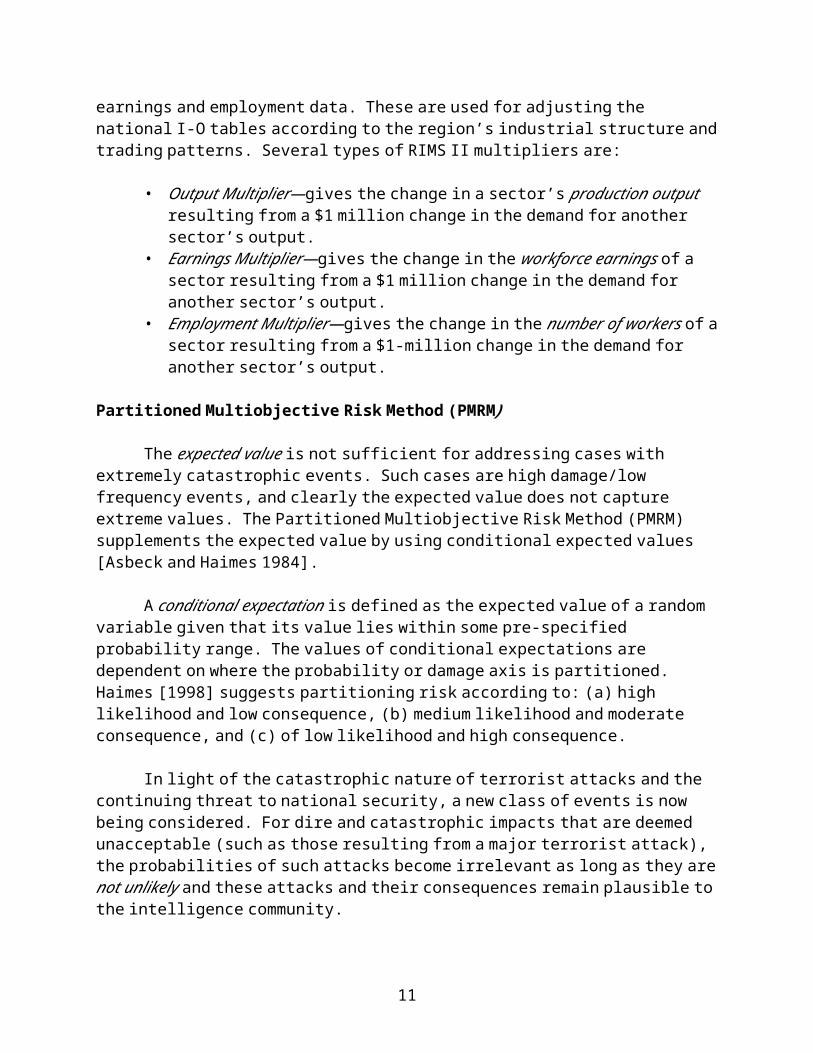
Partitioned Multiobjective Risk Method (PMRM)
The expected value is not sufficient for addressing cases with extremely catastrophic events. Such cases are high damage/low frequency events, and clearly the expected value does not capture extreme values. The Partitioned Multiobjective Risk Method (PMRM) supplements the expected value by using conditional expected values [Asbeck and Haimes 1984].
A conditional expectation is defined as the expected value of a random variable given that its value lies within some pre-specified probability range. The values of conditional expectations are dependent on where the probability or damage axis is partitioned. Haimes [1998] suggests partitioning risk according to: (a) high likelihood and low consequence, (b) medium likelihood and moderate consequence, and (c) of low likelihood and high consequence.
In light of the catastrophic nature of terrorist attacks and the continuing threat to national security, a new class of events is now being considered. For dire and catastrophic impacts that are deemed unacceptable (such as those resulting from a major terrorist attack), the probabilities
8
of such attacks become irrelevant as long as they are not unlikely and these attacks and their consequences remain plausible to the intelligence community.
Multiobjective Trade-Off Analysis
Benefit-cost (B/C) analysis typically requires monetary terms for the valuation of costs and benefits. This raises questions on the values of non-monetary factors such as human lives. Haimes [2001] raises the issue of judging safety—the level of acceptable risk. Safety is not absolute (and it is immeasurable); consequently, it must be traded off with corresponding costs in relative as well as absolute terms, ideally by the decisionmaker. In essence, the B/C framework involves trade-offs between two conflicting objectives: minimize costs and maximize benefits (or minimize risk/damage). Traditional B/C analysis converts these multiple objectives into a single-objective problem, thereby losing relevant information and the capability to perform trade-offs in relative terms.
Multiobjective trade-off analysis offers a richer perspective of the information for evaluating risk management options. First, there is no need to pre-commensurate units (i.e., transform units to be the same for all objectives). Trade-off analysis allows the decisionmaker to choose from a set of Pareto-optimal options (i.e., options that offer an improvement in one objective at the expense of another). The choice depends on the level of risk that is acceptable given the constraints of the available investment resources.
B. Case Studies of Interdependencies in Virginia’s Transportation Infrastructure
Case studies were conducted to provide specific insights into interdependencies and vulnerabilities. The specific objectives were to:
Identify interdependencies and collect an inventory of the critical sectors that are dependent upon the transportation infrastructure,
Identify the sectors that are most sensitive to transportation infrastructure disruptions,
Study the nature of cascading effects due to sector interactions, and Generate risk management options to reduce the risks.
These case studies encompass: Application of the Inoperability Input-Output Model (IIM) Examination of databases pertaining to traffic volumes (e.g., workforce and
commodity flow data) for interdependency analysis Analysis of specific sites within Virginia
The interdependencies with the transportation infrastructure are identified, and an inventory or catalog of interdependencies is generated for existing transportation infrastructure assets in Virginia. For the HHM categories identified in Table 1, we enumerated the parameters with which to measure the criticality of interdependencies. These parameters (e.g., ADT,
9

revenue) would indicate the magnitude of the consequence(s) that might result from transportation infrastructure disruptions.
Table 1. Sample inventory and parameters for different HHM interdependency categories
HHM Category
Inventory Parameters for Prioritization
Jurisdiction Virginia agenciesVDOT districts
Role or nature of support, delay caused
Intermodal HighwaysAirportsRail stations (passenger and freight)Transit
ADT, ADTT, detour, road classificationrevenue, # of passengers, freight volume, special value
Economic Industrial parks or export zonesTop companiesTop export commodities
Revenue, special value/criticality to nation/state
Users Military installations
Hospitals
Proximity, power projection platform (PPP) or power support platform (PSP)proximity, level classification
Critical interdependent sectors are prioritized, and VDOT transportation infrastructure assets that have high interdependencies with these sectors are identified. Two sets of priorities are generated: (1) critical sectors affected by transportation disruptions (e.g., businesses, retail trade, recreation), and (2) critical sectors that impact the operations of the transportation infrastructure (e.g., sectors dealing with transport of hazardous materials). Given a prioritized number of sectors in terms of their criticality, additional information is collected (e.g., specific road segments that support the sectors, and alternative transportation modes). Further studies are conducted to determine the impacts of different scenarios (e.g., terrorist attacks) on specific transportation infrastructure assets and their impact on interdependent sectors.
An inventory (or catalog) of the available risk management options that can be implemented to address risks due to interdependencies is prepared in terms of: (1) detection, (2) prevention, (3) hardening, (4) preparedness, (5) recovery, and (6) response. Metrics are developed that facilitate determining the effectiveness of the risk management options. Risks, costs, and benefits for the identified options are evaluated using multiobjective trade-off analysis. The evaluated risk management options are then recommended to VDOT.
RESULTS
The research methodology developed for this study was applied for assessing and managing the risk of terrorism to Virginia’s transportation infrastructure and the ripple effects to the industry sectors. They are presented in this section, which is organized as follows: Highway Transportation Interdependencies, Application of the Inoperability Input-Output Model (IIM), Application of Other Databases for Interdependency Analysis, Analysis of the Interdependencies of Specific Assets in Virginia, and Development of a Computer Interdependency Analysis Tool.
10
A. Highway Transportation Interdependencies
Rinaldi et al. [2001] defines interdependency as the bi-directional relationship between infrastructures through which the state of each infrastructure influences the state of the others. In our use of the word interdependency, we do not restrict its applicability to infrastructure interactions; it also applies to interactions between an infrastructure and an industry sector (e.g., effect of transportation infrastructure disruptions on the productivity of industry sectors).
A transportation infrastructure disruption, whether caused by natural forces, accidents, or willful attacks, can cascade and affect many dependent sectors. It will directly affect traffic flow and economic activities such as transport of raw materials and workforce, tourism activities, and others. It is equally important to recognize how operations of industry sectors would impact the highway system. For instance, failures in electric power or telecommunications service sectors, or a surge in travel demand (as with the case of emergency evacuations) can affect the highway operations. Thus, vulnerabilities stemming from interdependencies come from two frontiers:
(a) cascading effects originating from the transportation infrastructure affecting industry sectors, and
(b) cascading effects originating from industry sectors to the transportation infrastructure.
Hierarchical Holographic Model (HHM) of Critical Interdependencies
This section presents some of the interdependencies of the highway transportation system using hierarchical holographic modeling. An inventory of the facilities is conducted according to the categories identified in the HHM. The HHM helps identify the risks from interdependencies by allowing them to be viewed from multiple perspectives, or Head Topics. Six HHM perspectives relating to transportation interdependencies are depicted in Figure 4, namely: (a) Emergency Response and Recovery (ERR) Jurisdiction, (b) Intermodal, (c) Physical, (d) Economic, (e) Functional, and (f) Users. Further improvements can be made by adding interdependencies that are not identified in the current version. Ultimately, HHM can offer a comprehensive list of the critical interdependencies that need closer scrutiny.
Six Perspectives of Interdependencies
(a) ERR Jurisdictional. The emergency response and recovery (ERR) jurisdictional aspect looks at the connections among the governmental, private sector, and volunteer organizations that respond to emergency situations. The main concerns for this head topic are:
Understanding the interactions (roles and responsibilities) of VDOT with sectors and organizations involved in ERR.
Identifying sources of failures that cause delays or inefficiencies (e.g., miscommunications, lack of resources, etc.).
Quantifying the consequences of failures. Managing the consequences of failures
11

– Emergency Response and Recovery
Figure 4. HHM showing six major categories of highway transportation interdependencies
12
Specific sectors are identified, as well as their dependence on the transportation infrastructure (i.e., the interstates and highways that they mainly use).
(b) Intermodal. The intermodal aspect covers the interconnections among the various modes of transportation. These include: highway, railroad, aviation, ports, and public transportation/transit. Specific modes are selected for interdependency analysis with emphasis on their connections and reliance on the transportation infrastructure, and vice versa. The implications of losing certain operations of these modes due to transportation infrastructure disruptions are investigated.
(c) Physical. The physical aspect looks at infrastructure elements that are located near the transportation infrastructure or integrated into it, such as electric power and communication lines (especially those carried by bridges). Because of the proximity, physical damage to the transportation infrastructure can also affect operation of sectors that are connected to the damaged power and communication lines. Other vulnerable elements are pipelines that are proximate to highways and railroad tracks. Physical structures along a road or on top of tunnels would also be a concern.
(d) Economic. The economic aspect looks at different economic sectors and their interdependencies with transportation. Some of the major industries are manufacturing, agriculture, service, and trade. Inventories of the diverse companies that comprise these economic sectors are included in the interdependency analysis.
(e) Functional. The functional aspect looks at the agencies directly involved in the operation and maintenance of the transportation infrastructure and their relationship with supporting agencies (e.g., contractors and service providers such as electric power and, communication). Significant degradations in the “business as usual” support from these agencies can cause some disruption to the transportation infrastructure’s critical operations, such as emergency response, for example.
(f) Users. The users aspect pertains to industry sectors that depend on the transportation infrastructure. For instance, roads are used by the military for transporting supplies and moving troops; by the workforce to get to the places of work; by commercial industries to transport freight and cargo; by emergency response units to respond to calls for help or assistance; and by public or government units to evacuate areas in cases of emergency.
Inventory and Prioritization of Critical Interdependencies
The statewide inventory details the transportation infrastructure assets in the categories identified in the HHM (shown in Figure 4). Due to immense data collection efforts required, the inventory is limited to four of the six perspectives presented above, namely: ERR jurisdiction, intermodal, economic, and users. Data for the physical and functional aspects had to be assembled from various sources and thus required a more intensive collection effort.
The inventory is intended to help VDOT identify its major transportation assets and the sectors that depend on or provide support to the transportation infrastructure. A computer interdependency analysis model (to be discussed in Section E) has a module that contains an
13

asset inventory either as a link to a website or as data files. Interdependencies are prioritized by using various parameters and other statistics indicating the level of usage. Examples of these parameters include freight volume, port usage, proximity to military facilities, volume of patients in health care institutions, proximity to radiological facilities, and economic areas, among others. Various rankings of the critical sectors dependent on the transportation infrastructure can result based on the prioritization objective specified by the decisionmaker. As such, different perspectives for assessing the criticality of interdependencies were analyzed. This process yielded multiple interdependency characteristics associated with the sectors utilizing the transportation infrastructure.
Six scenarios were conducted making use of the IIM: three scenarios used the IIM to model an example disruption and three scenarios made use of publicly available databases to quantify a disruption to input to the IIM. Figure 5 provides an overview of the results. Further results supported these analyses are discussed in the coming sections.
B. Application of the Inoperability Input-Output Model (IIM)
A specific aim of this study is to study the extent to which the inoperability of a transportation infrastructure asset (e.g., road or bridge) would affect the dependent industry sectors. The challenge to our use of the inoperability input-output model (IIM) is that it is an economic model. Hence, we have devised a process for translating the physical inoperability of certain assets within the transportation infrastructure into compatible economic perturbation inputs. We considered “what-if” scenarios; say 10% reduction in the availability of Hampton Roads Bridge Tunnel, which allowed us to generate economic-based inputs for the IIM (e.g., direct effects on the workforce and commodity flow, which enables forecasting of ripple effects on the industry sectors).
The Bureau of Economic Analysis (BEA) is the agency responsible for documenting the transactions among various industry sectors in the U.S. economy. The detailed national input-output accounts are composed of nearly 500 sectors, organized according to the Standard Industry Classification (SIC) codes [see, for example, U.S. Department of Commerce 1998]. Currently, the U.S. Census Bureau uses the 1997 North American Industry Classification System (NAICS) in its data publications. This includes emerging industries that are beyond the scope of the SIC system. Examples of such industries are cellular and wireless communications, reproduction of computer software, diet and weight-reducing centers, and telemarketing bureaus, among others [Economic Classification Policy 2002]. The NAICS is reviewed and updated every five years to reflect the changes in the composition of the economy.
14

Figure 5. Summary of top affected sectors for the different interdependency analyses
The inoperability input-output model (IIM) is utilized in conducting interdependency analysis to assess the direct and indirect economic impacts of transportation infrastructure disruptions on various sectors in the U.S. and its regions. The model structure follows the form q = A*q + c*. The details of model derivation and extensive discussion of model components are found in Santos [2003]. In a nutshell, the terms in the above IIM formulation are defined as follows:
15
Model IIMD IIMS IIMD-U IIMD-W IIMD-C CFSMetric % % % % % VA-%
APPR*CHEM* 2 7 6 7COAL* 5 9 4 8ELEQ* 10 5FARM* 5FMET* 9 10 10FOOD* 3FRST* 9 3INST* 5LMBR* 8 8 4 10MACH* 6MIN* 7 9 6MOTR* 9 3 9MSMG* 8 7O&G* 3 6 1PAPR* 3 5PMET* 7 4 4 1 1 4PRNT* 8RUBR* 6 8STNE* 2 3 2TEXT* 10 2 2 7TREQ* 5BSRVCOMMCONSDEPETNGHLTHHTLINSCMSRVPSRVREALRTRD 10TRNS 1 1 1UTIL 4 2 6WTRD
Model IIMD IIMS IIMD-U IIMD-W IIMD-C CFSMetric $ $ $ $ $ VA-$
APPR*CHEM* 3 2 5COAL* 8ELEQ* 1FARM* 10FMET*FOOD* 9 10 2FRST* 6INST*LMBR* 3 4MACH*MIN* 6MOTR*MSMG*O&G* 4 3PAPR* 9PMET* 7PRNT*RUBR*STNE* 1TEXT* 7TREQ*BSRV 2 2 4 2 5COMM 9 10 10CONS 10 4 5 5DEP 6 8 9ETNGHLTH 7 8 4HTL 7INSCMSRV 8 3 3 1PSRVREAL 4 6 8RTRD 5 6 3TRNS 1 1 1 8 9UTIL 7 2 9 10WTRD 5 6 7
The top sectors impacted with perturbations to the transportation, in terms of % inoperability are predominantly SHIPPER sectors such as chemicals and machinery.
In contrast, the top sectors impacted in terms of economic loss ($) are predominantly NON-SHIPPER sectors such as utilities and transportation services.

− c* is a perturbation vector expressed in terms of normalized degraded final demand (i.e., “as-planned” final demand minus actual final demand, divided by the “as-planned” production level);
− A* is the interdependency matrix which indicates the degree of coupling of the industry sectors. The elements in a particular row of this matrix can tell how much additional inoperability is contributed by a column industry to the row industry; and
− q is the inoperability vector expressed in terms of normalized economic loss. The elements of q represent the ratio of unrealized production (i.e., “as-planned” production minus degraded production) with respect to the “as-planned” production level of the industry sectors.
The inoperability q is the resulting normalized economic loss that can be potentially realized after an industry sector experiences a prolonged demand-side perturbation of c* (e.g., a terrorist-induced demand reduction). The A* matrix represents the magnitude of interdependencies of the industry sectors, which can be derived from BEA-published interdependency coefficients. The elements of the interdependency matrix provide the basis for calculating the inoperability of the industry sectors. Logically, the impact of a perturbation to an industry sector of interest depends on its degree of dependence on a primarily perturbed sector (in our case, the initial perturbation would be to the economic sector that handles the operation and maintenance of the transportation infrastructure).
Extreme events such as acts of terrorism and natural disasters degrade the capability of a sector to supply its as-planned level of output. This supply reduction necessarily leads to demand reduction (e.g., consumption adjusts when available supply is below the as-planned demand level). The Regional Input-Output Multiplier System II (RIMS II) multipliers can be utilized to predict the impact of a sector’s supply reduction (and consequently, its demand reduction) on various interconnected sectors of a region.
The IIM-based case studies in the forthcoming discussions consider several scenarios featuring the transportation sector within the State of Virginia. Prior to describing the scenarios utilized in the case studies, we first review the advantages of IIM for systemic interdependency analysis of the Virginia economy. IIM provides a comprehensive ranking of sector impacts according to inoperability and economic loss metrics in graphic formats (e.g., histograms and evaluation matrices). The resulting rankings in terms of inoperability and economic loss metrics vary because of significantly different sector production scales. Therefore, both the calculated inoperability and economic loss values are important metrics to use for evaluating the impact of sector perturbations. IIM provides analysts with a tool for systemically prioritizing sectors deemed to be economically critical. As such, it is also capable of identifying those sectors whose continued operability is critical during recovery operations.
An important feature of IIM analysis is its capability to pinpoint the sectors affected by an attack to a primary sector [Santos and Haimes 2003]. The IIM case studies in this section are scenarios of perturbation to the trucking and electric power sectors. The trucking sector is a subset of the general transportation sector. According to the standard industry classification (SIC) scheme, the trucking sector encompasses local and long-distance trucking, transfer, and storage for agricultural products, household commodities, or any commercial goods. Trucking
16

constitutes about 35% of Virginia’s entire transportation sector based on gross state product data (www.bea.gov). On the other hand, the electric power sector is a subset of the utility sector. It encompasses establishments that provide electricity, gas, or steam for residential or commercial consumption. It includes services such as power generation, transmission, and distribution, and may also encompass other related types of services, such as transportation, communications, and refrigeration (www.bea.gov). The annual gross outputs of transportation and utility sectors in Virginia were approximately $17B and $7.5B, respectively, based on year 2000 data.
We considered three statewide scenarios to demonstrate the sector rankings that can be generated from IIM analysis:
• IIM Scenario 1: A 10% perturbation to the demand for the transportation sector pursuant to a terrorist attack. Demand-driven perturbation to transportation sector’s output may be caused by public fear or reduced output availability, consequently creating forced curtailment of demand. In this scenario, the demand perturbation can stem from reduction in availability of trucking services, which consequently limit the “as-planned” demand level (e.g., long-term closure of vital commodity truck routes in Virginia resulting in reduced operations of the trucking sector).
IIM Scenario 2: A 10% perturbation of the supply to the transportation sector’s output (i.e., products and services). Supply-driven perturbation to transportation sector’s output may be caused by price changes to “value-added” components (which include employee compensation, taxes, capital expenditures, etc.). In this scenario, the supply perturbation may result from higher cost of transportation due to increased requirement of man-hours and higher expense on gas and toll due to congestion and re-routing.
IIM Scenario 3: A simultaneous 10% supply-driven perturbation to transportation and utility sectors in Virginia. As discussed earlier, the transportation sector comprises various modes (e.g., transit, trucking, water, air, etc.). The utility sector in the Regional Input-Output Multiplier System II (RIMS II) comprises: electric services (utilities), natural gas transportation, natural gas distribution, water supply and sewage systems, sanitary services, steam supply, and irrigation systems.
IIM Scenario 1: Demand-Driven Perturbation to Virginia Sector
Consider a 10% demand-driven perturbation to the transportation sector’s output (i.e., products and services). This may be caused by public fear or reduced output availability, consequently creating forced curtailment of demand. Referring to Figure 6, the top 10 sectors in terms of inoperability impact are: (1) transportation; (2) chemicals and allied products and petroleum and coal products; (3) oil and gas extraction; (4) electric, gas, and sanitary services; (5) other transportation equipment; (6) industrial machinery and equipment; (7) primary metal industries; (8) miscellaneous manufacturing industries; (9) fabricated metal products; and (10) electronic and other electric equipment. On the other hand, the top 10 sectors in terms of economic loss impact are: (1) transportation; (2) business services; (3) chemicals and allied products and petroleum and coal products; (4) real estate; (5) wholesale trade; (6) depository and nondepository institutions and security and commodity brokers; (7) electric, gas, and sanitary services; (8) miscellaneous services; (9) communications; and (10) construction.
17

Since we have two metrics (i.e., inoperability and economic loss) that yield different sector impacts, we can identify the critical sectors by integrating the rankings generated from these metrics. In Figure 7, we arrange the sector impacts according to three types of zones, namely the top 10, top 20, and top 30 zones. For example, the top 10 zone is generated by taking those sectors that appear in both top 10 rankings of inoperability and economic loss metrics. Referring again to Figure 7, the “intersection” of the top 10 sectors generated from these metrics constitutes the top 10 zone. This includes: transportation; chemicals and allied products and petroleum and coal products; and electric, gas, and sanitary services.
Figure 6a. Top-10 Sectors with Highest Inoperability Due to 10% Demand Reduction in Transportation Sector (Virginia)
18
Top-20 Affected Sectors in Terms of Inoperability Impact
0%2%4%6%8%
10%12%14%
TRNSCHEM
O&GUTIL
TREQMACH
PMET
MSMGFMET
ELEQAPPR
PAPRRUBR
DEPPRNT
FRSTBSRV
COALSTNE
INSC
Sector
Inop
erab
ility
(%)
TRNS TransportationCHEM Chemicals and allied products and petroleum and coal productsO&G Oil and gas extractionUTIL Electric, gas, and sanitary servicesTREQ Other transportation equipmentMACH Industrial machinery and equipmentPMET Primary metal industriesMSMG Miscellaneous manufacturing industriesFMET Fabricated metal productsELEQ Electronic and other electric equipment
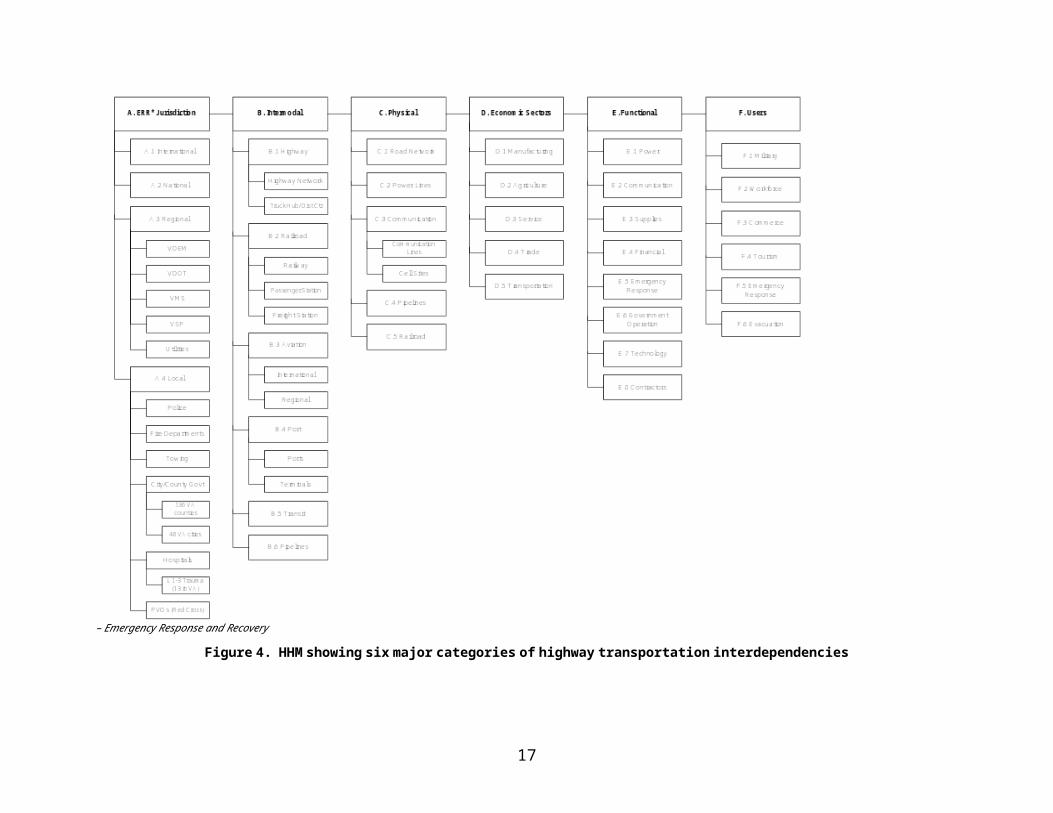
Figure 6b. Top-10 Sectors with Economic Losses Due to 10% Demand Reduction in Transportation Sector (Virginia)
Figure 7. A matrix of the impacts on interdependent economic sectors given a 10% demand-driven perturbation to the transportation infrastructure
19
TRNS TransportationBSRV Business servicesCHEM Chemicals and allied products and petroleum and coal productsREAL Real estateWTRD Wholesale tradeDEP Depository and nondepository institutions and security and commodity brokersUTIL Electric, gas, and sanitary servicesMSRV Miscellaneous servicesCOMM CommunicationsCONS Construction
Top-20 Affected Sectors in Terms of Economic Loss Impact
0
5
10
15
20
25
TRNSBSRV
CHEMREAL
WTRDDEP
UTIL
MSRV
COMMCONS
TREQO&G
MACHELE
QIN
SCETNG
PRNTHTL
RUBRPAPR
Sector
Econ
omic
Los
s ($
B)
TRN
S
BS
RV
CH
EM
RE
AL
WTR
D
DE
P
UTI
L
MS
RV
CO
MM
CO
NS
TRE
Q
O&
G
MA
CH
ELE
Q
INS
C
ETN
G
PR
NT
HTL
RU
BR
PA
PR
PM
ET
FME
T
RTR
D
LMB
R
PS
RV
MO
TR
STN
E
INS
T
CO
AL
TEX
T
TRNS 1CHEM 1O&G 1UTIL 1
TREQ 1MACH 1PMET 1MSMGFMET 1ELEQ 1APPRPAPR 1RUBR 1DEP 1
PRNT 1FRSTBSRV 1COAL 1STNE 1INSC 1
WTRD 1REAL 1HTL 1INST 1ETNG 1COMM 1PSRV 1MOTR 1CONS 1LMBR 1
Top-n Affected Sectors in Terms of Economic Losses
Legend:Top-10 ZoneTop-20 ZoneTop-30 Zone

Workforce analysis is an important feature of IIM that identifies and highlights critical workforce segments. In the event of an attack on the transportation infrastructure, for example, recovery activities greatly hinge on the availability of essential manpower for continued operation of lifeline sectors. In the following figures, two types of workforce impacts are depicted: (i) workforce earnings losses in Figure 8, and (ii) number of affected workforce personnel in Figure 9. A workforce earnings loss can be interpreted as an income reduction of a particular workforce sector resulting from inability to perform desired functions (e.g., due to sickness, injury, loss of access to workplace, etc.). Number of affected workforce, on the other hand, refers to the headcount of workers that are unable to perform (in terms of full-time equivalent, or FTE, unit). Figures 8 and 9 suggest that the workforce sectors rendered critical by a perturbation to the transportation sector are as follows: (i) Transportation; (ii) Health Services; (iii) Retail Trade; (iii) Miscellaneous Services; (iv) Depository and Nondepository Institutions and Security and Commodity Brokers; (v) Wholesale Trade; and (vi) Eating and Drinking Places.
Figure 8. Top 10 Sectors with Highest Workforce Earnings Losses Due to 10% Demand Reduction in Virginia Transportation Sector
20
$0$50
$100$150$200$250$300
24 34 36 28 37 29 27 35 25 30
Sector Index
Wor
kfor
ce E
arni
ngs
Loss
es ($
M/y
ear)
Index Loss ($M) Sector Description24 $241.81 Transportation34 $27.58 Business services36 $19.75 Health services28 $19.57 Retail trade37 $15.84 Miscellaneous services29 $14.92 Depository and nondepository institutions and security and commodity brokers27 $13.03 Wholesale trade35 $6.36 Eating and drinking places25 $5.87 Communications30 $5.69 Insurance

Figure 9. Top 10 Sectors with Highest Number of Affected Workforce Due to 10% Demand Reduction in Virginia Transportation Sector
IIM Scenario 2: Supply-Driven Perturbation to Virginia Transportation Sector
Consider a 10% supply-driven perturbation to the transportation sector’s output (i.e., products and services). This may be caused by price changes to “value added” components, which include employee compensation, taxes, and capital expenditures, among others. Figure 11 shows the rankings for a 10% supply-driven perturbation of the transportation sector within Virginia. In terms of inoperability impact, the top 10 most affected sectors are: (1) transportation; (2) stone, clay, and glass products; (3) paper and allied products; (4) primary metal industries; (5) coal mining; (6) rubber and miscellaneous plastic products and leather and leather products; (7) chemicals and allied products and petroleum and coal products; (8) lumber and wood products and furniture and fixtures; (9) motor vehicles and equipment; and (10) fabricated metal products. In terms of economic loss impact, the top 10 most affected sectors are: (1) transportation; (2) business services; (3) miscellaneous services; (4) construction; (5) retail trade; (6) wholesale trade; (7) health services; (8) depository and nondepository institutions and security and commodity brokers; (9) food and kindred products and tobacco products; and (10) communications. The impact matrix depicted in Figure 12 shows an integration of the inoperability and economic loss metrics into different zones. Referring to the top 10 zone, we see that the top 10 rankings generated from using inoperability and economic loss metrics are entirely different, clearly suggesting that both metrics are important to consider when implementing risk management policies. Hence, the decisionmaker has to carefully study which perspective generates a better cost-benefit effectiveness (i.e., minimizing inoperability versus minimizing economic loss).
21
Top-10 Sectors with Highest Number of Affected Workforce Due to 10% Reduction in Trucking
Demand (Virginia)
0
2,000
4,000
6,000
8,000
24 28 34 37 36 35 29 32 27 33
Sector Index
Num
ber o
f Affe
cted
W
orkf
orce
Index # Affected Sector Description24 7,816 Transportation28 1,031 Retail trade34 853 Business services37 657 Miscellaneous services36 546 Health services35 503 Eating and drinking places29 335 Depository and nondepository institutions and security and commodity brokers32 317 Hotels and other lodging places, amusement and recreation services, and motion pictures27 260 Wholesale trade33 178 Personal services

Figure 10. Impact ranking for the interdependent economic sectors affected by a 10% supply-driven perturbation to VA transportation infrastructure
Figure 11. Impact ranking for the interdependent economic sectors affected by a 10% supply-driven perturbation to VA transportation infrastructure
22
Top-20 Affected Sectors in Terms of Inoperability Impact
0%2%4%6%8%
10%12%14%
TRNSSTNE
PAPRPM
ET
COALRUBR
CHEMLM
BRMOTR
FMETPRNT
TEXTUTIL
FOODFARM
MSMGCONS
FRSTMIN
APPR
Sector
Inop
erab
ility
(%)
TRNS TransportationSTNE Stone, clay, and glass productsPAPR Paper and allied productsPMET Primary metal industriesCOAL Coal miningRUBR Rubber and miscellaneous plastic products and leather and leather productsCHEM Chemicals and allied products and petroleum and coal productsLMBR Lumber and wood products and furniture and fixturesMOTR Motor vehicles and equipmentFMET Fabricated metal products
Top-20 Affected Sectors in Terms of Economic Loss Impact
0
5
10
15
20
25
TRNSBSRV
MSRVCONS
RTRD
WTRDHLT
HDEP
FOOD
COMMLM
BRUTIL
CHEMREAL
PAPRPRNT
INSC
RUBRHTL
ETNG
Sector
Econ
omic
Los
s ($
B)
TRNS TransportationBSRV Business servicesMSRV Miscellaneous servicesCONS ConstructionRTRD Retail tradeWTRD Wholesale tradeHLTH Health servicesDEP Depository and nondepository institutions and security and commodity brokersFOOD Food and kindred products and tobacco productsCOMM Communications
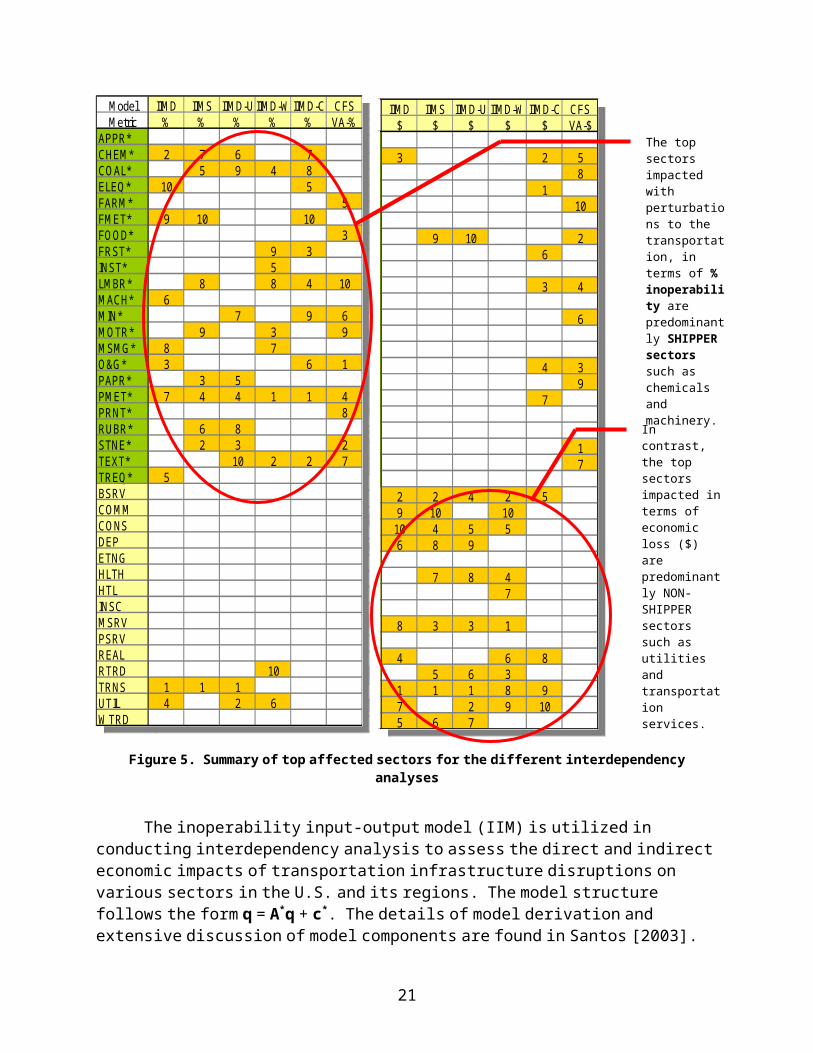
Figure 12. A matrix of the impacts on interdependent economic sectors given a 10% supply-driven perturbation to the transportation infrastructure
IIM Scenario 3: Supply-Driven Perturbation to Virginia Transportation and Utility Sector
While the transportation sector in the IIM scenarios analyzed above is comprised of various modes (e.g., transit, trucking, water, air, etc.), the general utility sector as defined in the Regional Input-Output Multiplier System II (RIMS II) consists of electric services, natural gas transportation, natural gas distribution, water supply and sewage systems, sanitary services, steam supply, and irrigation systems.. For the current scenario, we consider a simultaneous 10% supply-driven perturbation to the transportation and utility sectors in Virginia; this results in inoperability and economic loss rankings as depicted in Figure 13. In terms of the inoperability metric, the top 10 most-impacted sectors are: (1) transportation; (2) electric, gas, and sanitary services; (3) stone, clay, and glass products; (4) primary metal industries; (5) paper and allied products; (6) chemicals and allied products and petroleum and coal products; (7) metal mining and nonmetallic minerals, except fuels; (8) rubber and miscellaneous plastic products and leather and leather products; (9) coal mining; and (10) textile mill products. In terms of the economic loss metric, the top 10 most-impacted sectors are: (1) transportation; (2) electric, gas, and sanitary services; (3) miscellaneous services; (4) business services; (5) construction; (6) retail trade; (7) wholesale trade; (8) health services; (9) depository and non-depository institutions and security and commodity brokers; and (10) food and kindred products and
23
TRN
S
BS
RV
MS
RV
CO
NS
RTR
D
WTR
D
HLT
H
DE
P
FOO
D
CO
MM
LMB
R
UTI
L
CH
EM
RE
AL
PA
PR
PR
NT
INS
C
RU
BR
HTL
ETN
G
PM
ET
MO
TR
STN
E
ELE
Q
MA
CH
TRE
Q
TEX
T
FAR
M
FME
T
CO
AL
TRNS 1STNE 1PAPR 1PMET 1COAL 1RUBR 1CHEM 1LMBR 1MOTR 1FMET 1PRNT 1TEXT 1UTIL 1
FOOD 1FARM 1MSMGCONS 1FRSTMIN
APPRDEP 1
MACH 1TREQ 1ELEQ 1INSC 1HTL 1
HLTH 1PSRVINST
WTRD 1
Top-n Affected Sectors in Terms of Economic Losses
Legend:Top-10 ZoneTop-20 ZoneTop-30 Zone

tobacco products. Figure 14 depicts the impact matrix corresponding to the sector rankings generated using inoperability and economic loss metrics. Similar to the previous sections, the impact matrix shows the top 10, top 20, and top 30 zones encapsulating the integrated information on the inoperability and economic loss rankings.
Figure 13. Impact rankings for the interdependent economic sectors affected by a 10% supply-driven perturbation to VA transportation sector and power sector
A perturbation to the Virginia economy (whether natural, accidental, or willful) can affect multiple industry sectors as demonstrated in the current scenario, namely the simultaneous perturbation to the transportation and utility sectors. In such scenarios, the losses come from multiple sources and cascade through interdependencies to other sectors in the economy. From a temporal perspective, the total economic loss is essentially a function of the perturbation time-length for the initially disrupted sectors. Varying the perturbation time-lengths of the two sectors (i.e., transportation and utility) leads to different iso-economic loss contours, as depicted in Figure 15. Decreasing any of the two perturbation time-lengths drives down the total economic loss, but with different magnitudes. The effectiveness of reducing the perturbation time of the transportation sector versus reducing the perturbation time of the utility sector depends on the current positions in the contour plot suggesting the benefit of synergistic recovery efforts. Therefore, effective risk management entails evaluating balanced cost-benefit-risk policies for a concerted recovery of various impacted sectors (in this case, transportation and utility.). Additionally, different measures of effectiveness such as investment cost, level of commitment in terms of time and manpower, and other feasibility issues need to be quantified and studied to methodically evaluate the trade-offs among available risk management policies.
24
Top-20 Affected Sectors in Terms of Inoperability Impact
0%2%4%6%8%
10%12%14%
Sector
Inop
erab
ility
(%)
Top-20 Affected Sectors in Terms of Economic Loss Impact
0
5
10
15
20
25
Sector
Econ
omic
Los
s ($
B)
TRNS TransportationUTIL Electric, gas, and sanitary servicesSTNE Stone, clay, and glass productsPMET Primary metal industriesPAPR Paper and allied productsCHEM Chemicals and allied products and petroleum and coal productsMIN Metal mining and nonmetallic minerals, except fuelsRUBR Rubber and miscellaneous plastic products and leather and leather productsCOAL Coal miningTEXT Textile mill products
TRNS TransportationUTIL Electric, gas, and sanitary servicesMSRV Miscellaneous servicesBSRV Business servicesCONS ConstructionRTRD Retail tradeWTRD Wholesale tradeHLTH Health servicesDEP Depository and nondepository institutions and security and commodity brokersFOOD Food and kindred products and tobacco products

Figure 14. A matrix of the impacts on interdependent economic sectors given a 10% supply-driven perturbation to the transportation sector and power sector
Figure 15. Temporal trade-off analysis for a 10% supply-driven perturbation to Virginia transportation and utility sectors.
25
TRN
S
UTI
L
MS
RV
BS
RV
CO
NS
RTR
D
WTR
D
HLT
H
DE
P
FOO
D
RE
AL
CH
EM
CO
MM
HTL
LMB
R
ETN
G
PA
PR
PM
ET
RU
BR
PR
NT
INS
C
ELE
Q
TEX
T
STN
E
MO
TR
MA
CH
FME
T
TRE
Q
FAR
M
PS
RV
TRNS 1UTIL 1STNE 1PMET 1PAPR 1CHEM 1
MINRUBR 1COALTEXT 1FMET 1LMBR 1MOTR 1APPRFARM 1HTL 1O&G
FOOD 1PRNT 1MSMGMACH 1CONS 1ELEQ 1RTRD 1PSRV 1TREQ 1FRSTETNG 1DEP 1INST
Top-n Affected Sectors in Terms of Economic Losses
Legend: Top-10 ZoneTop-20 ZoneTop-30 Zone
30 434.83 506.44 567.87 620.55 665.74 704.5 737.74 766.25 790.71 811.68 829.67 845.1 858.33 869.68 879.42 887.77 894.93 901.07 906.34 910.86 914.74 918.06 920.91 923.36 925.46 927.25 928.8 930.12 931.26 932.23
29 434.24 505.85 567.28 619.96 665.15 703.91 737.15 765.66 790.12 811.09 829.08 844.51 857.74 869.1 878.83 887.18 894.34 900.49 905.75 910.27 914.15 917.47 920.32 922.77 924.87 926.67 928.21 929.53 930.67 931.64
28 433.55 505.17 566.59 619.28 664.47 703.22 736.47 764.98 789.43 810.41 828.39 843.82 857.06 868.41 878.14 886.49 893.66 899.8 905.07 909.59 913.46 916.79 919.64 922.08 924.18 925.98 927.52 928.85 929.98 930.95
27 432.75 504.37 565.79 618.48 663.67 702.42 735.66 764.18 788.63 809.6 827.59 843.02 856.26 867.61 877.34 885.69 892.86 899 904.27 908.79 912.66 915.99 918.84 921.28 923.38 925.18 926.72 928.04 929.18 930.15
26 431.82 503.43 564.86 617.54 662.73 701.49 734.73 763.24 787.7 808.67 826.66 842.09 855.32 866.68 876.41 884.76 891.92 898.07 903.33 907.85 911.73 915.05 917.9 920.35 922.45 924.25 925.79 927.11 928.25 929.22
25 430.73 502.35 563.77 616.46 661.64 700.4 733.64 762.16 786.61 807.58 825.57 841 854.24 865.59 875.32 883.67 890.83 896.98 902.25 906.76 910.64 913.96 916.82 919.26 921.36 923.16 924.7 926.02 927.16 928.13
24 429.46 501.08 562.5 615.19 660.38 699.13 732.38 760.89 785.34 806.32 824.3 839.73 852.97 864.32 874.05 882.4 889.57 895.71 900.98 905.5 909.37 912.7 915.55 917.99 920.09 921.89 923.43 924.76 925.89 926.86
23 427.98 499.6 561.02 613.71 658.9 697.65 730.9 759.41 783.86 804.84 822.83 838.26 851.49 862.84 872.58 880.93 888.09 894.23 899.5 904.02 907.89 911.22 914.07 916.51 918.61 920.41 921.95 923.28 924.41 925.38
22 426.26 497.87 559.3 611.99 657.17 695.93 729.17 757.68 782.14 803.11 821.1 836.53 849.76 861.12 870.85 879.2 886.36 892.51 897.77 902.29 906.17 909.49 912.34 914.79 916.89 918.69 920.23 921.55 922.69 923.66
21 424.25 495.86 557.29 609.97 655.16 693.92 727.16 755.67 780.13 801.1 819.09 834.52 847.75 859.11 868.84 877.19 884.35 890.49 895.76 900.28 904.16 907.48 910.33 912.78 914.88 916.67 918.22 919.54 920.68 921.65
20 421.9 493.52 554.95 607.63 652.82 691.58 724.82 753.33 777.78 798.76 816.75 832.18 845.41 856.76 866.5 874.85 882.01 888.15 893.42 897.94 901.81 905.14 907.99 910.43 912.53 914.33 915.87 917.2 918.33 919.31
19 419.17 490.79 552.21 604.9 650.09 688.84 722.08 750.6 775.05 796.02 814.01 829.44 842.68 854.03 863.76 872.11 879.28 885.42 890.69 895.21 899.08 902.41 905.26 907.7 909.8 911.6 913.14 914.46 915.6 916.57
18 415.98 487.6 549.03 601.71 646.9 685.66 718.9 747.41 771.86 792.84 810.83 826.26 839.49 850.84 860.58 868.93 876.09 882.23 887.5 892.02 895.89 899.22 902.07 904.52 906.61 908.41 909.95 911.28 912.41 913.39
17 412.27 483.89 545.31 598 643.18 681.94 715.18 743.69 768.15 789.12 807.11 822.54 835.78 847.13 856.86 865.21 872.37 878.52 883.79 888.3 892.18 895.5 898.35 900.8 902.9 904.7 906.24 907.56 908.7 909.67
16 407.94 479.55 540.98 593.67 638.85 677.61 710.85 739.36 763.82 784.79 802.78 818.21 831.44 842.8 852.53 860.88 868.04 874.19 879.45 883.97 887.85 891.17 894.02 896.47 898.57 900.37 901.91 903.23 904.37 905.34
15 402.89 474.5 535.93 588.62 633.8 672.56 705.8 734.31 758.77 779.74 797.73 813.16 826.39 837.75 847.48 855.83 862.99 869.14 874.4 878.92 882.8 886.12 888.97 891.42 893.52 895.32 896.86 898.18 899.32 900.29
14 397 468.62 530.04 582.73 627.91 666.67 699.91 728.43 752.88 773.85 791.84 807.27 820.51 831.86 841.59 849.94 857.1 863.25 868.52 873.03 876.91 880.23 883.09 885.53 887.63 889.43 890.97 892.29 893.43 894.4
13 390.13 461.75 523.18 575.86 621.05 659.81 693.05 721.56 746.02 766.99 784.98 800.41 813.64 824.99 834.73 843.08 850.24 856.38 861.65 866.17 870.05 873.37 876.22 878.67 880.76 882.56 884.11 885.43 886.56 887.54
12 382.13 453.75 515.17 567.86 613.05 651.8 685.05 713.56 738.01 758.99 776.98 792.4 805.64 816.99 826.72 835.07 842.24 848.38 853.65 858.17 862.04 865.37 868.22 870.66 872.76 874.56 876.1 877.43 878.56 879.53
11 372.8 444.42 505.84 558.53 603.71 642.47 675.71 704.23 728.68 749.65 767.64 783.07 796.31 807.66 817.39 825.74 832.9 839.05 844.32 848.83 852.71 856.03 858.89 861.33 863.43 865.23 866.77 868.09 869.23 870.2
10 361.92 433.54 494.96 547.65 592.83 631.59 664.83 693.35 717.8 738.77 756.76 772.19 785.43 796.78 806.51 814.86 822.02 828.17 833.44 837.95 841.83 845.15 848.01 850.45 852.55 854.35 855.89 857.21 858.35 859.32
9 349.23 420.85 482.28 534.96 580.15 618.91 652.15 680.66 705.11 726.09 744.08 759.51 772.74 784.09 793.83 802.18 809.34 815.48 820.75 825.27 829.15 832.47 835.32 837.77 839.86 841.66 843.21 844.53 845.66 846.64
8 334.44 406.06 467.49 520.17 565.36 604.12 637.36 665.87 690.33 711.3 729.29 744.72 757.95 769.3 779.04 787.39 794.55 800.69 805.96 810.48 814.36 817.68 820.53 822.98 825.07 826.87 828.42 829.74 830.87 831.85
7 317.2 388.82 450.24 502.93 548.12 586.87 620.12 648.63 673.08 694.06 712.05 727.47 740.71 752.06 761.79 770.14 777.31 783.45 788.72 793.24 797.11 800.44 803.29 805.73 807.83 809.63 811.17 812.5 813.63 814.6
6 297.1 368.71 430.14 482.82 528.01 566.77 600.01 628.52 652.98 673.95 691.94 707.37 720.6 731.96 741.69 750.04 757.2 763.34 768.61 773.13 777.01 780.33 783.18 785.63 787.73 789.52 791.07 792.39 793.53 794.5
5 273.66 345.27 406.7 459.38 504.57 543.33 576.57 605.08 629.54 650.51 668.5 683.93 697.16 708.52 718.25 726.6 733.76 739.9 745.17 749.69 753.57 756.89 759.74 762.19 764.29 766.08 767.63 768.95 770.09 771.06
4 246.33 317.94 379.37 432.06 477.24 516 549.24 577.75 602.21 623.18 641.17 656.6 669.84 681.19 690.92 699.27 706.43 712.58 717.84 722.36 726.24 729.56 732.41 734.86 736.96 738.76 740.3 741.62 742.76 743.73
3 214.46 286.08 347.51 400.19 445.38 484.14 517.38 545.89 570.34 591.32 609.31 624.74 637.97 649.32 659.06 667.41 674.57 680.71 685.98 690.5 694.38 697.7 700.55 703 705.09 706.89 708.44 709.76 710.89 711.87
2 177.31 248.93 310.36 363.04 408.23 446.99 480.23 508.74 533.19 554.17 572.16 587.59 600.82 612.17 621.91 630.26 637.42 643.56 648.83 653.35 657.23 660.55 663.4 665.85 667.94 669.74 671.29 672.61 673.74 674.72
1 134 205.62 267.04 319.73 364.92 403.67 436.92 465.43 489.88 510.86 528.84 544.27 557.51 568.86 578.59 586.94 594.11 600.25 605.52 610.04 613.91 617.24 620.09 622.53 624.63 626.43 627.97 629.3 630.43 631.4
0 1 2 3 4 5 6 7 8 9 10 11 12 13 14 15 16 17 18 19 20 21 22 23 24 25 26 27 28 29 30
Time To Recovery of Transportation Sector (days)
Legend:$800M$700M$600M
Iso-Economic Loss Contours
Sample Interpretations:
Reducing transportation sector’s time to recovery by 3 days or utility sector’s time to recovery by 12 days will result in a $100M economic loss reduction.
Reducing transportation sector’s time to recovery by 10 days or utility sector’s time to recovery by 3 days will result in a $100M economic loss reduction.
Ti
me
To R
ecov
ery
of U
tility
Sec
tor (
days
)

C. Application of Other Databases for Interdependency Analysis
This section demonstrates how a disruption in the transportation infrastructure can be quantified so that the IIM can be structured using real data. The impact of the disruption is then measured in the economic losses and inoperability of the interdependent economic sectors. The section provides an overview of quantifying a disruption, details a scenario in the Hampton Roads region, and then performs the analysis using Journey to Work data publicly available via the U.S. Census. A second analysis is performed on the Southeastern Virginia region using commodity flow data available from Bureau of Transportation Statistics (BTS).
Documentation of specific Virginia transportation sites/facilities (e.g., roads, bridges, tunnels, airports, etc.) in terms of their vulnerabilities enables the generation of reasonable perturbation inputs for IIM analysis. For regional levels, RIMS II provides data for 38 sector aggregations. Of these, the transportation sector reflects an aggregation of various modes of transportation (e.g., land, water, air). Even for such a coarse level of resolution, aggregated perturbation input to the regional-level transportation sector provides insights useful for analysis of transportation interdependencies. For example, one might be interested to estimate the impact of reduced transportation capacity to dependent sectors such as manufacturing and trade. The IIM is useful for assessing both direct and indirect impacts—the losses projected by the transportation sector to other sectors ultimately revert to itself through inter-industry feedbacks. The regional IIM, which utilizes the BEA and RIMS II data, is capable of pinpointing the “top-n” sectors with greatest sensitivity to a given perturbation input. This ranking provides guidance for addressing resource allocation issues.
The IIM focuses on examining interdependencies resulting from major disruptions (either natural, accidental, or willful). It is being adapted to assess the transportation infrastructure interdependencies. However, the implementation of IIM poses some challenges—the implementation I-O analysis and the available data would have been straightforward, but the transportation infrastructure is not explicitly defined as an economic sector in the Bureau of Economic Analysis (BEA) I-O accounts. Only producing and income-generating sectors (or industries) are included, hence we devised a process for converting transportation infrastructure disruptions as reductions in the productivity of transportation-related sectors. The aggregated transportation sector classification in RIMS II can be decomposed into the following sub-sectors:
• Railroad transportation, • Local and interurban passenger transit,• Trucking and warehousing, • Water transportation,• Transportation by air, and • Transportation services.
Nonetheless, when an extreme event impairs a transportation infrastructure asset (e.g., a highway or bridge) for a significant duration of time, it can be represented as simultaneous perturbation inputs to a set of sectors that directly use that asset (e.g., trucking sector, trade, postal system, and workforce, among others). The hierarchical holographic model (HHM) identifies interdependencies of the transportation infrastructure with other sectors. There are several ways wherein the HHM and IIM are related and can augment each other’s results. First,
26

there is a two-way relationship between them (see Figure 16). The information gathered from the HHM can be used as input to the IIM and its consequent analysis, and vice versa. Examples of HHM Head Topic considerations for identifying the degree of interconnectedness between a transportation system and other economic sectors are as follows:
• Transportation Modes – modes of transporting a sector’s products to intermediate and end-users (e.g., land, air, water)
• Workforce – Residence and place of work (e.g., census data on “journey to work” (in http://www.census.gov/population/www/socdemo/journey.html)
• Spatial – Linkages of a particular region to other regions and vice versa, assessed using trade data superimposed onto available transportation networks
• Sectoral – supply- and demand-side sectors required for the “as-planned” operation of a particular sector, which can be assessed using input-output technical coefficients
• Distance – proximity of a particular sector to its supply- and demand-side sectors• Accessibility – Number and efficiency of modes/paths that can be used in the delivery
of input/output between sectors• Priority – measures a sector’s priority for satisfying various sectors’ demand
requirements dictated by factors such as time-sensitiveness, pre-specified contractual agreements, government regulations, proximity, profit considerations, etc.
Figure 16. Proposed relationship of physical highway network and IIM to allow for interdependency analysis.
A particular sector may experience either a supply-side or demand-side perturbation (or in combination). Supply-side perturbation can stem from shortage of outputs (goods/services) required from a sector of interest. On the other hand, a demand-side perturbation is manifested as a reduction in consumption of outputs produced by a particular sector. For our purposes, we do not distinguish the two types of perturbations since a supply reduction can be expressed as a demand reduction (i.e., consumption, and therefore the demand level, is more often than not constrained by the level of available supply). For the Virginia transportation sector, perturbation may be manifested as reductions in the “as-planned” demand levels of the freight, rail, air, and water transportation sub-sectors. The demand perturbation to the transportation sector can range from 0% to 100%, with 100% representing the worst-case scenario with no demand for transportation. Specifying the demand perturbation brought about by an attack is a daunting task. When can an analyst say that a 5%, 15%, or 50% demand perturbation for transportation has occurred? These perturbation percentages need to be defined succinctly. Guidelines on when a demand perturbation (or range, thereof) occurs need to be developed for the use of analysts.
27
Inoperability Input-Output Model (IIM)
INPUT: Perturbation to affected sectors
OUTPUT: Sectorinoperability (%, $)
TransportationInfrastructure
(HHM, GIS)
OUTPUT:Affected sectors
INPUT in prioritization:Top-n affected sectors
Inoperability Input-Output Model (IIM)
INPUT: Perturbation to affected sectors
OUTPUT: Sectorinoperability (%, $)
Physical HighwayNetwork
(HHM, GIS)
OUTPUT:Affected sectors
INPUT in prioritization:Top n affected sectors

Given the knowledge on critical roads and facilities, one can then determine the relationship between transportation network inoperability (physical and functional) and demand perturbation values (in IIM). The IIM is capable of calculating the propagating impacts of diverse perturbation inputs for various sectors and sub-regions within the state. In generating scenarios of perturbation to the transportation network (e.g., terrorist attacks or natural disasters), the IIM application is based upon the observation that the level of economic interdependencies between sectors is often representative of physical interconnectedness (i.e., in general, two sectors that have a large volume of economic transactions have a similarly large degree of physical linkages). This knowledge would help quantify the percent of demand perturbations to ultimately assess the resulting inoperability cascaded to other sectors.
Table 2 summarizes the airport activities in terms of enplaned passengers, freight, and mail in the year 2000 (Data Source: Bureau of Transportation Statistics, http://www.bts.gov). For example, Dulles International Airport serves 61% of the airfreight transport demand. If this airport is made inaccessible to its users, and assuming that 50% of its customers (of commodity shipments) find alternate ways to transport the commodities, then there would be approximately a 50% demand perturbation to transportation. Given that Richmond serves 61% of air demand, this would result in 30.5% demand perturbation for the airfreight service. The foregoing procedure can be used as a guideline for generating perturbation inputs that can be utilized for IIM analysis.
Table 2. Summary of activities for four major airports in Virginia
Airport Enplaned Passengers Freight MailDulles Intl 6,649,323
40.21%94,355.9161%
33,224.8953.76%
Washington Nat’l 6,983,21242.23%
4,377.532.81%
19,901.0732.20%
Norfolk Regional 1,292,2017.86%
9,759.649.03%
3,825.026.19%
Richmond Intl 1,213,1967.34%
34,425.9222.13%
4,678.677.57%
Hampton Roads Scenario
A transportation infrastructure asset can fail for many reasons, including congestion, closure, and collapse. The impacts will be felt in workforce commute, commodity flow, and business accessibility. Losses will accrue in each of these areas from delayed or absent workers, delayed commodities, and potential business demand reduction. An analysis of this scenario can be performed using publicly available databases that were collected in the course of this project. Those used in this analysis include Journey to Work Data, Regional Employment Data, Regional Earnings Data, Commodity Flow (CF) Data to Destination, CF Data from Origin, CF Data through Corridors, RIMS II Data, and Geographic Location Data. These databases are included in the data matrix that is part of the computer interdependency analysis tool created for this project.
Consider a scenario where both the Hampton Roads Bridge-Tunnel (HRBT) and Monitor-Merrimac Bridge-Tunnel (MMBT) are closed to traffic. HRBT is a section of I-64
28

located in southeastern Virginia near the mouth of the James River. The alternative route nearby is a portion of I-664, the MMBT. Our analysis will consider both to be disabled since if the HRBT is closed, the MMBT would have to handle the traffic and vice versa.
Figure 17. Map of region around the bridge-tunnels at the mouth of the James River
Workforce-IIM Analysis
This analysis utilizes the workforce data module that consists mainly of Journey to Work data from Bureau of Labor Statistics and Local Earnings and Employment data from the Bureau of Economic Analysis. The Journey to Work data can give us an idea of what counties may use the HRBT or MMBT for commuting, and which residences and economic sectors will be most affected by the inability of commuters to arrive at work. We make the assumption that commuters traveling from the Northwest Region (as defined in Figure 17) to the Southeast Region will use this asset.
This analysis began with a map of the region to determine the counties or cities that might send commuters through the asset. Those that might be applicable were selected from the Journey to Work Data. The truncated Journey to Work data was copied from the appropriate worksheet and pasted into a new spreadsheet for analysis. The following diagram illustrates how the James River divides the cities and counties into two groups that would utilize the HRBT or the MMBT to commute to work. The groups are separated and totals are calculated. There are four main sections--two sections are for those commuters that are required to cross the bridge. (i.e., go from the SE to the NW or from the NW to the SE.) Table 3 summarizes the calculated totals.
Table 3. Summary of Journey to Work Data across the James River
From To NW To SE TotalsNW 214,952 22,658 250,705SE 22,410 534,551 571,822Totals 247,348 563,811 3,164,052
29
Northwest Region:EssexGloucesterHampton (city)James City & WilliamsburgKing and QueenKing WilliamMathewsMiddlesexNewport News (city)York & Poquoson
Southeast Region:AccomackChesapeake (city)Greensville & EmporiaIsle of WightNorfolk (city)NorthamptonPortsmouth (city)Southampton & FranklinSuffolk (city)SurrySussexVirginia Beach (city)

This summary illustrates that about 45,000 commuters must cross a bridge to get to work. If we estimate that every commuter goes to work and returns daily, then we would conclude that commuters contribute 90,000 cars per day to the average daily traffic across the James River. This analysis makes the assumption that the effects of carpooling are insignificant.
The next step of the analysis is to consider the final destination of workers and the economic sector in which they work. The Journey to Work data can answer the first question, and the Employment and Earnings data can yield insight into the second based on an assumption that the number of workers that commute across the bridge is similar to the distribution of workers in the city.
Figures18 and 19 summarize the cities that receive commuters who cross the river. Only the cities that receive a large portion of the commuters are marked. Figure 18 shows the commuters that travel from SE of the river to the NW. Newport News and Hampton receive 87% of all the commuters. If we compare this number with the summary of commuters above, this totals to about 19,500 people each way (87% of 22,410). Similar conclusions are drawn from Figure 19.
Figure 18. Major cities where commuters cross the James River from the Southeast.
Figure 19. Major cities where commuters cross the James Riverfrom the Northwest.
Having established the major destination cities for the commuters, we can evaluate the economic sectors that characterize the work in those cities. To do this we use the Earnings and Employment data. Earnings data reports the total amount of dollars that are spent on employees per year in each economic sector, and the employment data reports the average number of employees in each major industry over the course of the year. Figure 20 summarizes employment data to illustrate the economic sectors that more heavily rely on workers that cross
30

the river. Approximately 12,000 workers cross the river to work in Newport News and this graph illustrates their approximate distribution (an exact distribution of commuters would have to be done by time-consuming survey of the commuters).
Figure 20. Approximate distribution of workers in Newport News (12,000 across river)
Similar distributions can be produced for each city answering the questions of which economic sectors are most heavily affected if commuters are unable to work as scheduled. Table 4 summarizes top economic sectors for other cities that rely on a number of employees commuting to work across the bridge-tunnels.
Table 4. Top three sectors for cities that rely on commuters to cross James RiverDestination
CityWorkers to cross river
Top employing sector
#2 sector #3 sector
Norfolk 11,000 Health care and social assistance (11%)
Warehousing (9%) Manufacturing (8%)
Hampton City 8,000 Retail Trade (19%) Manufacturing (11%)
Professional and Technical Services (11%)
Virginia Beach 4,000 Retail Trade (15%) Professional and Technical Services (11%)
Administration and Waste Services (10%)
These workforce data yield insight into transportation interdependencies that stem from commuters accessing their places of employment safely and without delay. This is the first step in understanding economic losses that result from failure of critical transportation assets. Another contributor to economic losses is the stoppage, or delay, of commodities that are trucked across a specific transportation asset.
Assuming travelers are distributed across sectors similarly to workers, this data can structure the perturbation vector to use the IIM to measure the inoperability and economic losses due to interdependencies. Given the perturbation scenario, the estimated annual losses are $110 million to the economy of the Southeastern Virginia region (see Figure 21).
31
Health care and social assistance
11%
Administrative and waste services
7%
Professional and technical
services8%
Retail trade12%
Manufacturing25%

Figure 21. Sector impact rankings for the closure of the HRBT and MMBT using Journey to Work data from the U.S. Census and the IIM
Commodity Flow-IIM Analysis: Commodity Flow for Southeastern Virginia
This analysis establishes the economic sectors that are primarily affected by the trucking sector. These data are not highly resolved by region, but higher resolution analysis can be achieved by seeking data through the Department of Motor Vehicles that tracks commodities in weigh stations along major highway corridors. Figure 22 presents the 1997 Commodity Flow Survey (CFS) for trucking flows by sector for the Norfolk-Virginia Beach-Hampton region of the Commonwealth of Virginia.
32
Top-20 Affected Sectors in Terms of Economic
0
10
20
30
40
Sector
Econ
omic
Los
s ($
M)
Top-20 Affected Sectors in Terms of Inoperability
0%2%4%6%8%
10%12%14%16%
Sector
Inop
erab
ility
(%)
Top-20 Affected Sectors in Terms of Economic
0
10
20
30
40
Sector
Econ
omic
Los
s ($
M)
Top-20 Sectors in Terms ofEconomic Losses
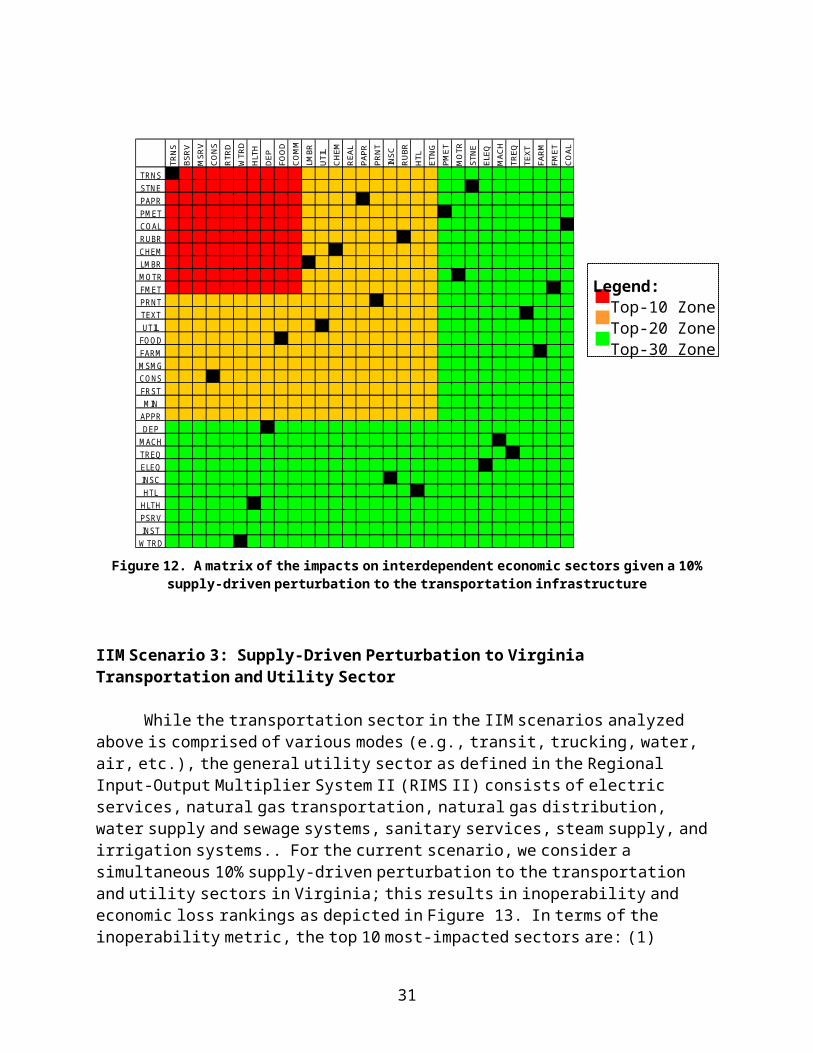
Figure 22. Hampton Road Truck Flows (1997 CFS) used to quantify a disruption to the transportation sector
Commodity flow data indicate the main economic sectors that are affected by losses in trucking capacity, thus providing insights in sector interdependencies. Once interdependencies with transportation are established, we can view the economic interdependencies of those industries within themselves.
A perturbation vector can be structured based on the delayed commodity flows in the region. Calibrating the impact of the disruption to commodity flows to this section requires further analysis and data collection. Given the scenario perturbation, the estimated annual losses are $50 million to the economy of the Southeastern Virginia region, distributed according to the sectors depicted in Figure 23.
The U.S. economy relies significantly on trucks for its domestic freight movement, with an estimated $4.98 trillion (71.7%) worth of goods carried by truck in 1997, and $6.2 trillion (73.1%) in 2002 (see Figure 24). In Virginia, the trucking share was 83.7% of total value shipped, and 77.2% of total volume shipped in 1997 (Bureau of Transportation Statistics, BTS). The Commodity Flow data adds information to the inoperability input-output (I-O) data, since I-O data accounts only for transactions that occur in Virginia. The BEA I-O data used in the IIM accounts for the flows both within and from Virginia. The Commodity Flow data accounts for the flows to and through Virginia (see Table 5).
33
$0
$500
$1,000
$1,500
$2,000
$2,500
$3,000
$3,500
Dolla
r Val
ue ($
Mill
ion)
0%
5%
10%
15%
20%
25%
Perc
enta
ge %
Value($ mil) Value %
Value($ mil) $3,135 $2,457 $2,120 $1,768 $1,726 $1,406 $1,193 $858 $100 $100
Value % 21% 17% 14% 12% 12% 9% 8% 6% 1% 1%
Grains, alcohol, and tobacco
products
Agricultural products and
fish
Base metal and machinery
Furniture and miscellaneous manufactured
Electronics, motorized
vehicles, and
Wood products, and textiles and
Coal and petroleum products
Pharmaceutical and chemical
products
Stone, Nonmetallic
minerals, and
Commodity Unknow n

Figure 23. Sector impact rankings given a major disruption in the southeastern Virginia region using Commodity Flow data from the BTS and the IIM
34
0
2
4
6
8
10
12
35 30 9 24 40 36 34 21 7 43 5 29 26 17 33 23 39 8 32 27 3 28 6 31 15 38 18 4 -- 19 20 37 22 25 12 41 2 13 11 1 10 14
Industries (1987 SIC Code)
Perc
ent o
f of T
otal
Val
ue S
hipp
ed
% Other Modes %Truck
Top-20 Affected Sectors in Terms of Economic
0
5
10
15
20
ELEQCHEM
LMBR
O&GBSRV
FRSTPMET
REALTRNS
UTILFMET
CONSDEP
MACHPAPR
WTRDSTNE
COALFARM
TEXT
Sector
Econ
omic
Los
s ($
M)
Top-20 Affected Sectors in Terms of Inoperability
0%
10%
20%
30%
40%
50%
Sector
Inop
erab
ility
(%)
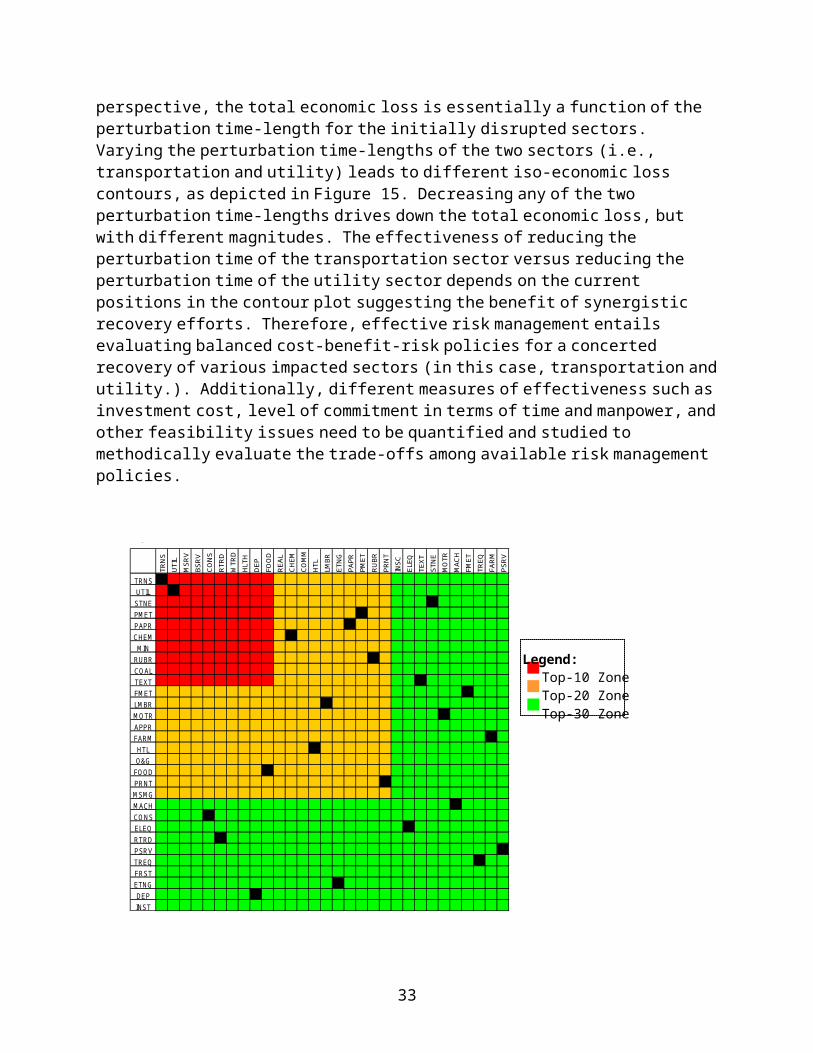
Figure 24. Histogram of distribution of modes of shipping for interdependent economic sectors showing U.S. reliance on the trucking industry
Table 5. Top ten commodities in Virginia (based on total value shipped)
Top Ten Commodities in Virginia (based on total value shipped)SCTG Commodity35 Electronic and other electrical equipment and components and office equipment30 Textiles, leather, and articles of textiles or leather 9 Tobacco products 24 Plastics and rubber 40 Miscellaneous manufactured products 36 Motorized and other vehicles (including parts) 34 Machinery 21 Pharmaceutical products 7 Other prepared foodstuffs and fats and oils 43 Mixed freight
Trucks are the dominant freight carrier, hauling more than 75% of the total value shipped for 32 out of 39 commodities (see Table 6).
Table 6. Low-volume, high-value commodities (Source: BTS 1997 CFS Table 8)
Only three commodities use trucks for less than 50% of its shipments (see Table 7).
Table 7. Commodities using trucks for less than 50% of shipments representing low interdependency with transportation system (Source: BTS 1997 CFS Table 8)
35
2784.5104.2104276Pharmaceutical products
3181.694.294343*Machinery
996.284.384411Mixed freight
398.874.374428Meat, fish, seafood, and ..
1195.564.564607Other prepared foodstuffs..
2485.254.654784Motorized and other …
2286.445.045190Plastics and rubber
3955.936.436607*Electronic and other …
2584.929.329577Textiles, leather, …
597.319.9110201Tobacco products
Rank%Rank%RankValue (mil $)
% Value to Sector% Value to TruckValue ShippedCommodity

D. Analysis of the Interdependencies of Specific Assets in Virginia
Case studies were conducted to provide specific insights into interdependencies and vulnerabilities. With guidance from the project steering committee (consisting of representatives from VDOT and VTRC), three specific Virginia assets were selected to be studied in depth: the Midtown Tunnel, Interstate 81, and Sentara Norfolk General Hospital. Each case study considers specific risks facing the assets along with specific risk management strategies for mitigating those risks.
Midtown Tunnel
The tunnel that provides the basis for this project connects two port cities in the Hampton Roads area of Virginia. The tunnel has an AADT of over 49,000, 7% of which is truck traffic between the two marine terminals. The land on either side of the tunnel includes a mix of residential, manufacturing, light industrial, marine terminals, military, and other commercial uses. There are two large marine terminals in this area as well as a naval shipyard for the East coast. This tunnel, therefore, provides a vital connection between the two portside cities. In late September of 2003, the tunnel was closed for a period of a month due to extreme flooding caused by Hurricane Isabel. This closure made the tunnel an ideal choice for collecting interdependency impacts for our case study.
Addressing the first question of risk assessment (What can go wrong?), many adverse scenarios can be conceived, both natural and willful, including fire, HAZMAT spill, extreme flooding in the tunnel, or bombing of the tunnel or proximate structures, among others. This case study focuses on the extreme flooding that occurred in the Midtown Tunnel after Hurricane Isabel. This extreme flooding is only expected to occur once every 50 years, according to an interview with the facility manager of the Hampton Roads Smart Travel Center (Mr. Stephany Hanshaw).
The first step in this analysis was to determine the sectors that were most affected by the tunnel closure. To determine the impacts of the closure on surrounding sectors, we ran the regional IIM with a 15% transportation perturbation to determine the top eight critically affected sectors. The output of the model is a ranking of the 38 sectors of the BEA database according to estimated impact in terms of dollars lost and percent inoperability of those sectors. The top eight affected sectors in the BEA database are shown in Table 8. Due to time constraints and difficulties associated with data collection, only a portion of these sectors was included in this project. Difficulties were primarily encountered in gathering data from sources outside of
36

VDOT. For example, business sectors generally do not disclose financial-related performance data.
The transportation, commerce/trade, workforce, military, and health services sectors were chosen from the initial list of critically affected sectors identified in Table 8. Furthermore, Table 9 identifies the primary impact of HRBT closure on the chosen sectors.
Table 8. Top Eight Critically Affected Sectors
Critically Affected SectorTransportationMilitaryWorkforceCommunicationsEmergency ServicesBankingHealth ServicesCommerce/Trade
Table 9. Impacts of Tunnel Closure to Facilities
Facility / Sector Economic Sector Represented Primary ImpactAirport Transportation NoneMarine Terminal Transportation Economic LossesTrucking Transportation Economic LossesCommerce/Trade Commerce/Trade Economic LossesWorkforce Workforce Delay of workforceMilitary Military Delay of workforceHealth Service Health Services Delay of workforce
Impact on Number of Enplaned Passengers (Airports)
To assess airport inoperability, time series analysis was used to determine if there were any statistically significant differences between the number of outgoing passengers during the time the tunnel was closed and any other time of the year. To ensure a robust analysis, ten years worth of monthly data on the outgoing passengers from the airport were analyzed. The output from the Winter's Additive, Multiplicative, and ARIMA models include confidence intervals indicating the predicted value of outgoing passengers per year as well as an upper and lower confidence bound for the value. Since the actual value of outgoing passengers for September and October of 2003 fell within the confidence intervals provided by the three models, it appears that there were no statistically significant differences between the number of outgoing passengers from these months and the number of outgoing passengers from other previous months. See Table 10.
Table 10. Output from Statistical Analysis of Airports, Values in number of enplaned passengers
Type of Lower Upper Predicted Actual Value
37

ModelConfidence
BoundConfidence
Bound ValueWinter's Additive 112,838 150,741 131,790 121,576Winter's
Multiplicative 111,821 145,882 128,851 121,576ARIMA 113,925 144,559 129,242 121,576
Economic Losses in Cargo Tonnage of Marine Terminals
Both the transportation and commerce/trade sectors experienced economic losses. The available data for the marine terminals consisted of historical general cargo tonnage per month; going back for a period of ten years. Time series analysis was used to determine if there were any statistically significant differences between the general cargo tonnage during the time the tunnel was closed and any other time of the year. Using Winter's Multiplicative, Additive, and ARIMA models, a predicted value and confidence interval for the cargo tonnage for September and October of 2003 was obtained. The Multiplicative and ARIMA model provided a confidence interval in which the actual value of cargo tonnage for the months was included; however the actual value of cargo tonnage was extremely close to the lower bound of the confidence interval. The Additive Model provided a confidence interval that did not include the actual value of the cargo tonnage for September and October. Since the actual value of cargo tonnage fell close to the lower bound of the confidence interval, it appears that there was a significant impact on the marine terminals in terms of lost cargo tonnage. The confidence intervals along with the predicted and actual values for the marine terminal data can be found in Table 11.
Table 11. Analysis Output Marine Terminals, Pounds of Cargo Tonnage
Type of Model
Lower Confidence
Bound
Upper Confidence
Bound Predicted Value Actual ValueWinter's Additive 1,077,563 1,278,343 1,177,953 1,060,010
Winter's Multiplicative 1,059,533 1,262,661 1,161,097 1,060,010
ARIMA 1,059,629 1,248,979 1,154,304 1,060,010
As shown in the above analyses, airports did not experience a statistically significant impact due to the closure of the tunnel, while the marine terminals did. This may be because the airport does not depend directly on the tunnel for day-to-day operations. The impact on the marine terminals may be due to their relationship with the trucking firms in the area. The marine terminals depend on local trucking companies to either transport goods into the port for further export or transport goods out of the port to other regions in the state. It is intuitive that the impact of the tunnel closure would be felt not only by those sectors that primarily use HRBT (e.g., trucking) but also other sectors (e.g., marine ports) that have close business interactions with primary users of HRBT.
Economic Losses in Truck Driver Earnings
38

According to articles printed in the Virginian Pilot between September 18 and October 18, 2003, truckers experienced an impact due to the closure both in terms of delays and of lost salaries. The detour routes set up by VDOT increased travel times to marine terminals by about thirty minutes [Hanshaw 2004]. This figure did not include any additional time delays that were experienced due to increases in traffic volume on alternate roads because of the tunnel closure. Over 35,000 other vehicles displaced by the closure also used the alternate routes provided by VDOT [Hanshaw 2004]. Local drivers who are paid by the trip lost about 25-30% of their earning ability due to increases in travel time associated with the tunnel closure. Therefore, the impact on the trucking portion of the transportation system was 25-30% inoperability [Dinsmore 2003].
Economic Losses in Commerce/Trade
Midtown Tunnel is a major connecting route between two important east coast marine terminals. On any given day about 200 trucks go back and forth between the two marine terminals transporting goods for shipment. Specific data concerning economic impacts on the commerce and trade sectors were not made available. Using the economic losses of truck drivers as a surrogate measure, we estimated that there was also a 25-30% loss experienced in commerce/trade in the Hampton Roads region associated with the tunnel closure.
Delay of Workforce: Economic Establishments and Military
The impact of the tunnel closure was also very strongly felt in the workforce sector of Southeastern Virginia. Commuters using the tunnel to travel to work on a daily basis suffered the most impact in terms of the delays associated with alternate routes and the increase in traffic volume due to the tunnel closure. According to polls conducted during the tunnel closure, travel delay times ranged anywhere from 20 minutes to three hours depending on the alternate route taken [Dinsmore 2003]. The impact of the tunnel closure was also felt on roadways that were not part of the advised detour routes. Commuters intending to avoid already congested roadways switched to routes that were out of the way to circumvent the traffic. As a result, instead of the congestion being limited to detour routes it spilled onto much of the neighboring roadways and resulted in region-wide traffic delays [Hanshaw 2004].
Intuitively, this workforce delay directly impacted other sectors, such as the military and the health services sectors. According to a communication with Mr. Stephen Milner from the Norfolk Naval Shipyard, the tunnel closure inconvenienced some employees in their travel to and from the shipyard, and they were encouraged to take alternate routes. Hence, these employees also experienced to some extent travel delays as a result of the tunnel closure.
Risk Management
The goal of risk management is to reduce the impact of a transportation disruption to interdependencies by implementing policies to unlock those interdependencies. Tables 12-14 enumerate sample risk management policies in terms of preparedness, prevention, response and recovery to decrease the impact of transportation-related disruption due to interdependencies. All of these options may not be directly implementable by VDOT. Some options are
39

recommendations for VDOT to address with other agencies, public and private. The effort to manage of the risk of interdependencies will be a collaborative affair.
Table 12. Policies to Unlock Interdependent Sectors
Type of Policy Policies for Interdependent SectorsPreparedness 1. Require hospitals to overstock inventory in case of a highway system
disruptionPreparedness 2. Increase inventory of critical materials at interdependent facilities to
reduce the impact of a tunnel closure Preparedness 3. Have established work stagger schedules to reduce work delay in case
of a highway disturbancePrevention 4. Provide incentives for workers to use alternate forms of transportation
such as buses, rail, or ferriesPreparedness 5. For commerce/trade, have alternate form of delivery available such as
rail or airplane that does not rely on highways for transportPreparedness 6. Form Emergency Response Teams to respond to incidents and keep
lines of communication openPreparedness 7. Develop radio communication lines in case of an emergencyPrevention 8. Construct a rail line between the two Marine Terminals to transport
goodsPreparedness 9. Increase number of Nightingale flight pads to reduce ambulance usage
Table 13. Policies to Unlock Interdependencies, VDOT
Type of Policy Policies for VDOT
Prevention 1. Establish certain highway routes or lanes for exclusive use of truckingPrevention 2. Hire security guards to provide tunnel surveillance for increased
protectionPrevention 3. Build redundant routes for critical tunnels or bridges in areas with high
traffic volumes Prevention 4. Install additional security cameras to monitor tunnel trafficPrevention 5. Reduce or relocate the number of communication and power lines
running through tunnel infrastructuresPrevention / Response 6. Provide connections, signing and controls to facilitate contra flow use
of selected facilitiesDetection / Prevention 7. Devote additional resources to detection and clearance of incidents on
critical corridors
Table 14. Response Options
Type of Policy Response OptionsResponse 1. Develop a set of alternative routes to handle excess traffic caused by
road closureResponse 2. Companies and employers can stagger work hours to reduce the
number of cars on the road during peak travel hours
40
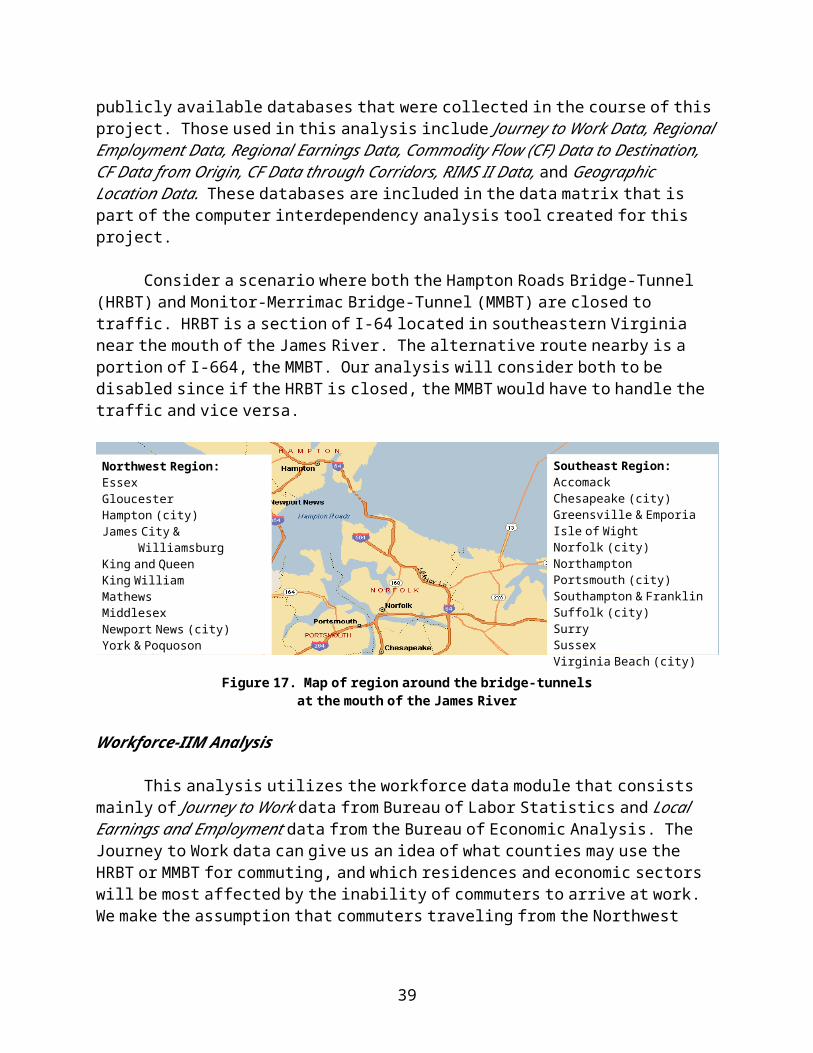
Recovery 3. Routes can be established for only trucking routesRecovery 4. Inter-agency emergency response teams with representatives from
transportation-related agencies and other sectorsResponse 5. Work together with Coast Guard to delay drawbridge openings until
non-peak commute times Response 6. Lift tolls on adjacent roadwaysResponse 7. Lift HOV restrictions on alternate routes to encourage detoursRecovery 8. Increase number of public transportation buses, ferries, and rail running
through the area
Many of the above policies were implemented during the tunnel closure in September 2003. According to Stephany Hanshaw at the Smart Traffic Center in Hampton Roads, the alternate routes were effective in handling the increase in traffic up to their road capacity but that traffic delays of at least 15 to 20 minutes were experienced. Alternate routes have limitations in capacity and there are concerns about the effect of diverting heavy trucks onto roads with inadequate pavement. Other methods of prevention and response are consequently desirable to reduce the impact of a tunnel closure.
Collecting data to measure the efficacy of various risk management options (e.g., cost, implementation horizon, and manpower requirements) requires substantial amount of time and effort that would be impractical to carry out within the study period. Nevertheless, the trade-off analysis needed for evaluating risk management options can be illustrated using expert-elicited values. Costs of management options can be determined using expert judgment and the triangular distribution. Each management policy is assigned a low, most likely, and high cost by the expert. After these values are assigned, an expected cost for each policy can be determined by taking the average of the three values. The benefits from the option may not be commensurate requiring a multi-objective methodology to be used. The commensurate benefits are assigned a low, most likely, and high cost by the expert with ann expected value of commensurate benefits determined by taking the average of the three values. The expected value of costs and commensurate benefits can be placed on a graph to determine the Pareto-optimal frontier. The Pareto-optimal points are those that cannot be improved for one objective without degrading the value of another objective. Using assumed values, the two Pareto-optimal policies were determined from Table 12:
1. Have established work stagger schedules to reduce work delay in case of a highway disturbance.
2. Develop radio communication lines in case of an emergency.
Interstate 81
I-81 is a 325-mile stretch of highway that ranks consistently as one of the top eight trucking corridors in the United States. It traverses five states and numerous state routes. It also intersects with I-40, which runs from North Carolina to southern California, thus linking commodity flows through Virginia to the west coast (VDOT 2004). The highway was designed to hold 15% of total volume as trucking; however currently, depending on the area of this stretch, it contains between 20 to 40% of its total volume as trucks. This four-lane highway was designed for a total capacity of approximately 25,000 average daily traffic (ADT). Today’s volume, however, ranges from 16,000 to 33,550 ADT [Fluor Virginia, Inc. 2003].
41

Roanoke County is home to approximately 86,000 people and Roanoke City’s population is approximately 95,000 (City of Roanoke; Roanoke County Department of Economic Development). It consistently ranks as one of the top ten localities along the I-81 corridor for Average Annual Daily Traffic (AADT), Average Daily Truck Traffic (ADTT), commodity flow value, and size of workforce, thus making it a critical location along the I-81 corridor. It is home to a Level I trauma center and an airport, and is situated on four Norfolk Southern freight train routes.
The following scenarios were created for I-81 in Roanoke:
Major HAZMAT incident Minor HAZMAT incident Damage to a bridge or overpass Bombing of a critical facility in the region (e.g., rail terminal) Sabotage of a transportation infrastructure (such as destruction of a bridge or
overpass)
According to an interview with VDOT officials, conducted on March 17, 2004, HAZMAT incidents in the Roanoke Valley are of major concern due to their consequences to the transportation system. This is because 75-90% of all traffic incidents involving trucks will result in a diesel fuel spill. This can be a major or minor incident depending upon the amount of fuel spilled and the area affected. A fuel tanker, for example could shut down I-81 for a minimum of 8-10 hours, and at worst three days if the fuel burns. Single-lane closures will follow in order to clean up the spill, which causes significant delays since I-81 is a four-lane highway. Minor spills can also close the road for 6 to 10 hours. The likelihood of major spills is increased because a fuel depot is located just outside of Roanoke. Thus, all fuel being distributed travels back through Roanoke and up and down I-81, which increases the risk to the highway system (interview with Altizer and Prezioso, March 17, 2004).
Bridge and overpass damage also significantly affects the highway system. Fred Altizer, VDOT’s I-81 corridor program manager, stated that if an overpass is hit during an accident, it takes a minimum of 12 hours to deem the overpass safe. This occurs, on average, three to four times a year. If there is significant structural damage, lane closures could occur for six months to a year. This could have major impacts on those commodities that are time sensitive by causing these supplies to be shipped via alternate, and assumedly, longer routes.
Although the VDOT officials could not address the likelihood of bombing and sabotage, these occurrences were deemed “unlikely to seldom” because they are not common. They have, however, catastrophic consequences due to the high impacts they would have not only on transportation per se , but on other interdependent sectors. For example, sabotage to a major bridge would reroute traffic on already overcrowded roads for a minimum of one year (interview with Altizer and Prezioso, March 17, 2004). This would not only cause traffic delays, it would affect the trucking sector and emergency service officials as well.
42

Sectors could be affected in a variety of ways. Jurisdictional services could be affected through communication failures or through inaccessibility to emergency situations. Intermodal sites could be affected if users cannot reach the sites or if these sites become inaccessible. This could cause a loss of money or a loss of time-sensitive goods. The economic sectors could be severely affected due to the volume of commodities that flow through the region. These commodities may be ruined because of time delays or they could cause delays in scheduled manufacturing processes. Local businesses could be disturbed through loss of traffic to their sites. Users could be severely affected due to time delays, loss of time at work, and through inconvenient rerouting.
Traffic numbers exceed capacity by as much as 39,000 vehicles and truck traffic is double what it should be along I-81 in Roanoke. Thus, if there is an incident or attack along this corridor or the surrounding areas, demand will only build and exacerbate the problem. Other risks occur when time-sensitive commodities do not reach their destinations on schedule. Goods are lost and businesses suffer. Business productivity is also affected when workers cannot reach their destinations in a reasonable amount of time. Emergency personnel may have difficulties reaching both emergency situations and hospitals, potentially putting lives at risk.
If another asset is simultaneously attacked, significant risk can be brought to the transportation infrastructure. For example, if an industrial rail station becomes inoperable, there could be an increase in truck traffic along I-81 and primary routes in Roanoke. AADT frequently reaches above the capacity level of the site on normal days. A disastrous incident could exaggerate the capacity problem and cause significant time delays. Also, additional truck traffic in Roanoke would increase the danger to other travelers along the highway and would increase traffic delays.
To reduce the vulnerabilities of I-81 in Roanoke, there are two important types of risk management options: response and prevention. A response management option protects and limits risk during an incident. A prevention policy option unlocks the interdependencies with the site. Currently VDOT has policies in place to address preparedness, response, and recovery in case of an incident along I-81 in Roanoke: the 511 system and a highway advisory radio system inform motorists of current incidents. There are also plans for installing additional variable message signs and cameras along the interstate. More management options could be in place to aid VDOT in reducing risks during incident response. The following is a list of sample options created for VDOT to improve their response:
Add variable message signs (VMS) to inform motorists of road hazards Add cameras along the interstate to monitor traffic and quickly spot incidents Increase capacity along alternate routes: for example, temporarily allow driving
on the shoulder of the road Station security personnel at all major bridges in the immediate vicinity Increase staffing to provide quicker response time Ensure that all highway personnel have an adequate two-way radio that can
connect to key agencies (fire, police, EMS, etc.)
43

There are real tradeoffs associated with these risk management options. For example, installing additional VMS has a low capital cost but a high operational cost. On the other hand, increasing capacity along alternate routes has a high capital, public relations and environmental cost but requires much less maintenance during the response to an emergency.
Cooperation between VDOT and businesses, the workforce, and other essential agencies is necessary to effectively unlock the interdependencies with the highway system. The following is a sample of risk management options that future cooperation could realize:
Stagger work schedules during inoperability periods Create incentives for trucking companies to send their freight through rail: for
example, temporary toll increases. Overstock critical facilities (such as hospitals and gas stations) with critical
supplies Form emergency response teams that include all interdependent sectors in order to
address each sector’s needs
Sentara Norfolk General Hospital
The Sentara Norfolk General Hospital in Norfolk, Virginia was chosen for this case study out of 18 other hospitals in the Hampton Roads area. As shown in Table 15, it is the only Level I trauma hospital in the area (out of only five in the entire state) and therefore is required to have all major resources available 24 hours a day. It is also the only hospital in the area that has a burn unit and the regional medical air ambulance unit, the Nightingales. Sentara is the third largest employer in the city of Norfolk and was previously identified as one of the critical “assets” in Norfolk because it is the largest in the area, has the most physicians available, and the greatest number of facilities and services. Therefore, a terrorist attack in the area would have a major impact on hospital operations.
Table 15. Trauma Center Level Definitions [VDH 2004]
Levels of trauma centers as defined in Virginia
Level I: Tertiary care facility that provides all major resources 24 hours a dayLevel II: Community-based facility; not required to have 24-hour resourcesLevel III: Rural facility whose primary function is to stabilize and transfer; may keep stable
and uncomplicated cases
A terrorist attack in the vicinity of the hospital would have several potential effects on transportation. Due to roads blockages in the area surrounding the attack, there could be an overflow of traffic onto other roads causing delays to emergency vehicles needing to get to ground zero. It could also delay hospital staff and patients trying to get to the hospital. The closing of roads could have four possible consequences to the hospital, which are listed in Table 16, along with the size of the impact to hospital operations.
Table 16. Potential Consequences to the Hospital [from interview with Barger 2004]
Potential Consequences to the Hospital Size of Impact
44
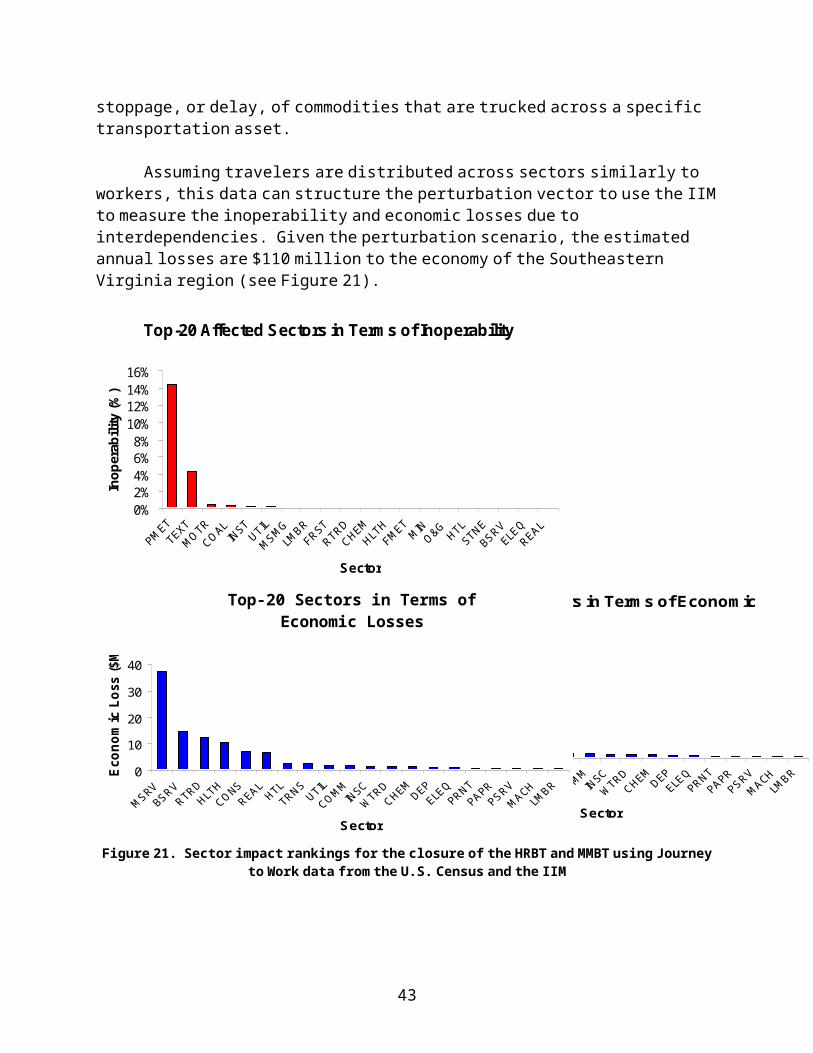
Delay the employees trying to get to work Large impactDelay the transport of supplies Small impactPrevent patients from getting to their appointments on time Medium impactDelay transport and response vehicles Large impact
The delay in the transport of organs actually is not a key factor because most organs are transported by air and therefore, the closing of roads would have no effect [from interview with Barger 2004].
It is also very likely in a terrorist attack situation that there would be a large influx of people needing medical attention and a shortage of beds. If this happened, patients might be transported to other hospitals for several reasons, as shown in Table 17.
Table 17. Reasons a Patient Might be Moved [from interview with Barger 2004]
Reasons a Patient Might be Moved LikelihoodThe hospital does not have the kind of care the patient needs
Unlikely for a Level I trauma hospital
There is an communicable disease and it was agreed that one hospital will take all those patients to prevent the disease from spreading
Likely in the event of a hazmat attack
The patient can be moved to long term care elsewhere which is non-emergency and therefore not a priority
Likely in the event that there is a large influx of patients and beds need to be cleared
There is a mass casualty incident and there are more people needing medical attention than they can provide for
Unlikely, so far there has never been an event this large including 9/11
During a terrorist attack situation, the closing of roads would delay the transport vehicles carrying the patients and for many patients, time is critical.
In the case of a terrorist attack in the vicinity of a Level I trauma center, the likelihood that it will be rendered inoperable is very slim. Because Sentara Norfolk General Hospital is a tertiary facility, it is required to have all resources available 24 hours a day and it usually keeps enough supplies to run for 48 hours [from interview with Barger 2004]. Most hospitals also have contracts, which promise to provide supplies in the event of an emergency. Therefore critical supplies, which include food, water, gas, and beds, would not be a critical issue for the 48 hours pursuant to an emergency situation. Staff, emergency vehicles, and patients would be delayed in getting to the hospital. If the hospital were in dire need of aid, federal agencies would intervene to provide it [from interview with Barger 2004]. Therefore, in most cases, the hospital can sustain its operation in the near aftermath of an emergency situation. The only case where the hospital would close would be if there were too many patients and no way of providing the best medical attention to them. In this case, the patients would be transported to another region [from interview with Sidebottom 2004].
With the understanding that the hospital would most likely be operating, the next greatest consequence would be the impact of road closures. The most likely delay would be for hospital staff traveling to work in private vehicles since there is no way to identify them or give them priority, they would have to wait with traffic [from interview with Sidebottom 2004].
45
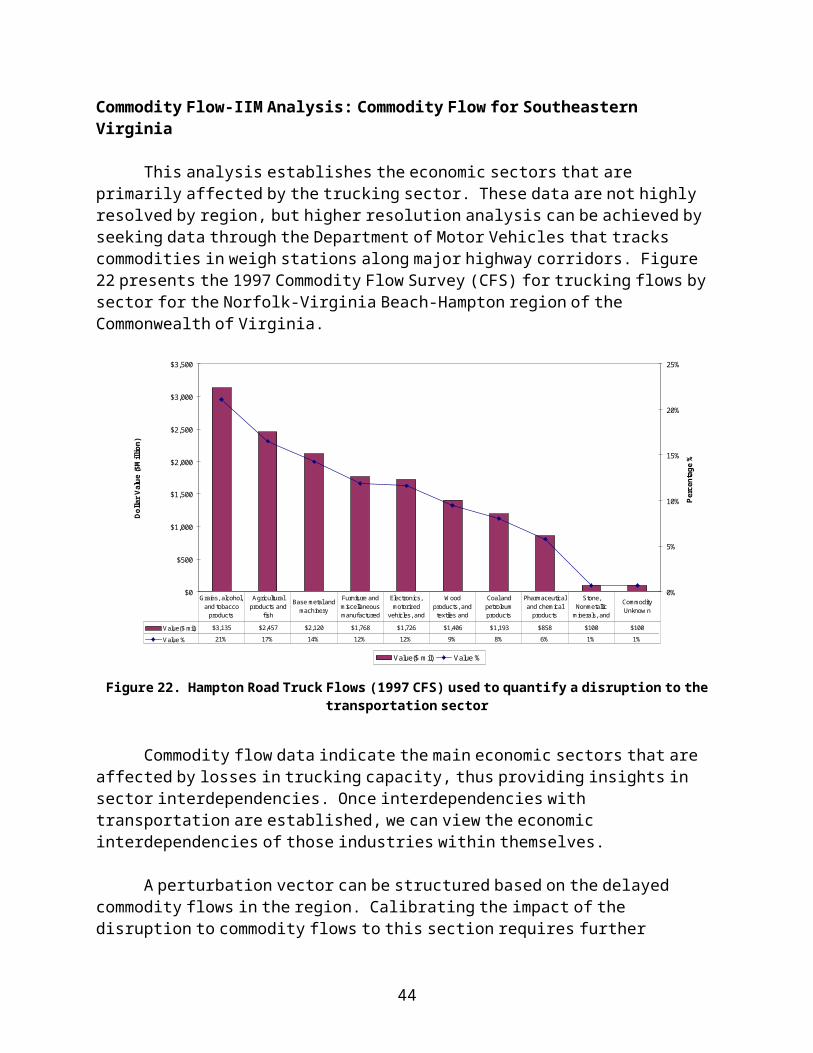
It is also likely that supplies might be delayed, but as discussed before, due to contracts and multiple suppliers, there would never be long-term shortages. The supplies that would be most critical to a hospital are gas, medical supplies, food, and water, all of which are transported by trucks [from interview with Sidebottom, 2004]. If the power were out as a result of a terrorist attack, fuel oil would also need to be transported by trucks to keep generators running [from interview with Barger 2004].
It is unlikely that patients would be delayed in getting to the hospital because in the case of an attack, most likely all non-emergency appointments would be cancelled to allow staff to help with the emergency situation [from interview with Barger 2004]. Emergency and hospital transport vehicles would have a safe route when traveling between ground zero and the hospital, would have the right of way through crowded streets, and could rely on alternate routes or air transport. Therefore, it is unlikely that vehicles would have long delays even if roads connecting to the hospital were closed.
Table 18. Likelihood of Delays in Transportation [from interview with Barger 2004]
Potential Delays in Getting to the Hospital LikelihoodDelay the employees trying to get to work Very likelyDelay the transport of supplies LikelyPrevent patients from getting to their appointments on time UnlikelyDelay transport and response vehicles Unlikely
Hospitals are always a priority during emergencies, so that in the event of a terrorist attack and closed roads, VDOT, which has already prioritized the critical routes leading to the hospital based on the volume of hospital traffic, would clear roads in order of importance.
If there were a large influx of patients in the Hampton Roads area, the hospitals, including Sentara Norfolk would try to handle as many as they could. Each hospital is required to have available 500 beds for every one million population in the area. Beyond that surge capacity, the patients would be transferred out of the area. The transferring of patients would be delegated by the Virginia Department of Health (VDH) and the regions to see how much each could handle [from interview with Barger 2004].
During 9/11, despite the large number of people needing medical attention, the surge capacity was not exceeded and therefore no one had to be transferred out of the area. If the number had exceeded the surge capacity, the Federal Emergency Management Agency (FEMA), which is a part of the Department of Homeland Security, would have taken over and transported those patients [from interview with Barger 2004].
In cases where the capacity is too great for the hospital to handle, federal systems take over and provide the necessary services. For example, if there were a biological or chemical attack that impacted a large number of people, the Center for Disease Control (CDC) would access the Strategic National Stockpile. There are 12 of these in secret locations throughout the United States, located strategically so that any stockpile can be transported by the military to any
46

hospital within 12 hours. It contains ventilators, pharmaceuticals, respirators, etc., and would treat over 150,000 people within three days of the attack [from interview with Sidebottom 2004].
Therefore, in any emergency situation, hospitals will be able to operate, either through their own means or with federal support. The people needing medical attention will receive it whether they get it locally or are transported to another region. The greatest impact that a hospital will face in a terrorist attack is the delay in transportation due to traffic.
Currently, the first agency on the scene of an emergency becomes the incident commander. They notify all other emergency response agencies and set up the incident command center on location. Included in this group is the VDOT representative who helps to set up a safe route from the scene to the hospital, to allow for the passage of emergency vehicles. The police then go out and create the route, creating a lockdown of normal traffic, and utilizing signs and signals to direct traffic [from interview with Sidebottom 2004].
In terms of transportation impacts on the hospital, preparedness and response are the two stages to which risk management policies can be applied. In order to lessen the delay that staff, patients, and deliverers of supplies face, it is important that people are notified of the situation through the rapid deployment of signs. In order to do this, VDOT has three options, which are shown in Table 19. The first option is manually positioning signs and signals throughout the area to notify people. This is the most primitive and slowest system because first it needs to be decided where the signs go and then people need to be dispatched to set them in place. The next option is the Variable Messaging System (VMS). This system allows signs and signals to be deployed through a computer and displayed digitally on already existing boards located throughout the interstate. The advantage of this system is that it is quick and it can be done from a remote location. A third option is to communicate with the public via dedicated radio stations. This option would allow VDOT to communicate real-time travel information and instructions to the public.
Table 19. Risk Management Options for VDOT and the Hospital
Options Short/Long Term Risk Management Characteristic
VDOT Signs and Signals Short Term ResponseVMS Long Term PreparednessDedicated radio Long Term Response/Preparedness
Hospital Staff housing Long Term PreparednessChildcare Long Term Preparedness
The hospital also has a few options in order to be better prepared in an emergency. By providing staff housing for emergency situations, staff will not need to deal with traffic because they will have a place to rest between shifts. This will minimize delays that staff might face and ensure that there is always staff available. Childcare provisions will also aid staff in allowing them to work without needing to find a place for their children to go.
E. Development of a Computer Interdependency Analysis Tool
47

The objective of this effort was to develop a methodology to assess and manage the risk of terrorism due to interdependencies. We have expanded on this objective to include a prototype Computer Interdependency Analysis Tool (hereafter referred to as “Computer Tool” for brevity). This will enable VDOT to continue developing risk assessment and management case analyses. This tool includes a user-friendly Graphical User Interface (GUI). It provides a quick and efficient means to assess and manage risk, and is able to save the results of the assessment and management suggestions. The end product is only a prototype that can be continued beyond the current study.
Three case studies were analyzed in the previous section (Hampton Roads, I-81, Sentara Hospital). Additional analyses are needed because it would be impossible to make the conclusions based on the current case studies that could characterize and capture all risks to Virginia’s transportation infrastructure assets and its interdependencies. Comprehensive risk assessment necessitates multiple case studies from multiple parts of the state. Furthermore, these analyses would need to focus on a broad range of VDOT assets (including bridges, bridge-tunnels, and overpasses). Therefore, the computer tool seeks to capture the general framework and data of the analyses and thus provide VDOT with a means to pursue additional case studies to describe the risk across the Commonwealth.
Flowchart
There are two main functions of the Computer Tool. First risk assessment leads the user through a framework of identifying the most interdependent sectors for analysis. This process is displayed in Figure 25. Second, risk management directs the user through a framework to identify the most optimal policies for mitigation of risk. This process is illustrated in Figure 26.
Figure 25. Flowchart illustrating risk assessment functions of Computer Tool for interdependency analysis of transportations systems
The users begin their analysis when they open the program, view the introduction screen, and read directions to familiarize themselves with the tool. The next screen prompts the users to enter their personal information so that the subsequent analysis may be saved and later viewed. This identifying information includes the user’s name, VDOT district, and phone number, among other things. Next, the users choose the asset they wish to study and enter information about the asset, including the average daily traffic and infrastructure location. The user may choose the asset from a drop-down list or enter an infrastructure not on the list.
48
InterdependencyIdentificationAsset Definition
User Information
Asset Location
Tool links to Data Matrix
Tool displays IIM Interdependency Matrix
Interdependent Sector Selection
Sector Risk Identification
Sector-specific scenarios
Define likelihood & consequences of scenarios
Tool filters critical sectors

Now the user continues risk assessment by selecting which of the 38 BEA sectors are applicable to the asset being studied. Only the sectors which are selected in this phase will continue to the next phases. The data matrix is provided to aid the user in interdependent sector identification. The computer model tool will have internal links within the program to display a color-coded matrix that represents the sectors’ strength of interdependency.
Risk assessment leads the user to risk management, which aids in the design of management techniques and policies to mitigate risk. Figure 26 illustrates the functionality of this portion of the tool.
Figure 26. Flowchart illustrating risk management functions in Computer Tool
Now, the program guides the user through the process of creating risk management options and evaluating their cost and effectiveness. For each scenario, the user will either choose a management option from a drop-down list or create one. The list of current options derives from management options that can be retrieved from the previously conducted case studies. Next, the user will estimate a cost for each alternative and evaluate its effectiveness in terms of risk reduction. These parameters will be taken from a triangular distribution that requires the user to enter values of a low estimate, a high estimate, and a most-likely estimate. From these three estimations, an expected value will be calculated for both the cost and effectiveness variables and will be plotted on a Pareto-optimal graph. The computer model’s representation of the Pareto-optimal frontier will show the user the risk management options that are recommended to VDOT for implementation.
CONCLUSIONS
The transportation system is integral to the economy because most economic sectors require goods and services that use this system either for transport or commute. Disruptions to the transportation system, such as a terrorist attack, will propagate to the other sectors producing economic losses beyond the immediate cost of the damage to the structure. In this effort, we developed a methodology for assessing the consequences of failure in the transportation
49
OptionsGeneration
Risk Detection
Metrics for Risk Detection
11 Criteria Ranking
Generate sector-specific options
Generate effectiveness distribution
Generation cost distribution
Option Ranking
Tool calculates Pareto optimal options

infrastructure and propagating into interdependent sectors. If the cost of recovery is less than the cost of delay, there is a logical impetus for obtaining funding for recovery. This section highlights the major conclusions of this research.
Generally
There is a need for the Commonwealth of Virginia to better understand the interdependencies of the transportation sector because any perturbation will markedly affect the economy, efficient operation of sectors, and safety.
The impacts of highway transportation failure are: (1) delay in workforce commute(2) delay in commodity flow(3) loss of business accessibility, or demand reduction(4) impact on other lifeline sectors (power, communications, water, health, etc.)(5) impact on emergency response operations(6) impact on recovery operations
Long-term inoperability of the highway transportation system affects the trucking services, thereby impacting sectors that are interdependent with trucking. The IIM analysis yielded top-n sectors with highest economic losses, which include business services, real estate, heath services, electric, gas, and sanitary services, among others.
Emergency response interdependencies with the highway system have important distinctions from other interdependencies. Highway infrastructure that may be critical to day-to-day commerce may not be relevant in emergency response operations. The nature of emergency response activities could be considered more concentrated on local infrastructures. Furthermore, the metric of success is on lives saved, which falls under short-term or transient impact rather than long-term impact.
Economic recovery after a major incident is closely tied to transportation as it enables workers to go back to their jobs and commodities to be delivered.
Data Collection
There is a need to improve data collection efforts for quantifying transportation interdependencies to support the development of a comprehensive risk assessment and management process that addresses the trade-offs among all relevant costs, benefits, and risks associated with transportation systems. Specifically, securing data from economic sectors, independent of the BEA database, that quantifies the impact of transportation disruptions, is necessary to increase the accuracy of the input to the IIM.
50

Inoperability Input-Output Model
The Inoperability Input-Output Model (IIM) can provide a comprehensive ranking of sector impacts according to inoperability and economic loss metrics. It takes advantage of the Bureau of Economic Analysis (BEA) Input-Output Table and RIMS II data.
Other databases such as the U.S. Census workforce data (e.g., Journey-to-Work), and commodity flow data can be used to quantify the disruption to the transportation system produced by an act of terrorism.
o The workforce data by the U.S. Census quantifies the disruption by identifying the travel patterns (county-to-county) of the workforce, and the top employers in the area.
o The Commodity Flow data supplements the input-output (I-O) information with inclusion of “through” flows in Virginia. This is not accounted for in the I-O data. 22 out of 37 sectors in SIC are included in the commodity flow survey SHIPPER GROUP (i.e., their outputs are being transported).
The resulting rankings in terms of inoperability and economic loss metrics (using variations on the IIM model and supplementing analysis with other databases) vary because of the significantly different sector production scales.
• The interdependency analysis showed that other sectors, and entities, have a high stake in the continued efficient operation of the highway system. Finding ways to coordinate efforts with the business sectors and public-private organizations at various levels (federal, state, local) is vital.
• Trade-off and sensitivity/parametric analyses guide the development of balanced cost-benefit-risk policies and solutions for managing infrastructure disruptions resulting from a potential terrorist attack and for expediting recovery time
• Performance metrics (e.g., inoperability and economic loss) can be used to evaluate viable risk management strategies for implementing recovery policies that appropriately and equitably distribute costs among infrastructure sectors, and between public and private entities.
• The workforce is significantly impacted by disruptions to the highway system. When the transportation sector’s “as-planned” level of operation decreases by 10%, the economic losses annually could total $110 million for the economy of the Southeastern Virginia region.
Midtown Tunnel Case Study
• The closure of Midtown Tunnel after Hurricane Isabel (9/18/2003 to 10/19/2003) showed that VDOT effectively managed traffic through re-routing and alternative modes using ferries. These risk management options can be adapted for the response to an act of terrorism.
51

• In the risk assessment phase, the impacts of the tunnel closure were more apparent in the workforce and the trucking sector than they were on the marine terminals or the airports. These sectors will require more attention in the recovery phase.
• Adaptability of dynamic systems: Transportation, Commerce/Trade, Health Services, Emergency Services, Military, Workforce, Banking and Communications cannot operate on high level of inoperability for long periods of time. The sectors adapted naturally to ensure minimal losses and impact on their facilities in the short-term.
Interstate 81 Case Study
• Trucking is the dominant freight carrier for the Commonwealth of Virginia. Low reliance on rail and other alternative carriers increases the motivation for a methodology for assessing the economic consequences of a disruption to the transportation infrastructure.
• The top five origins/destinations of commodities used are North Carolina, Maryland, Pennsylvania, California and New York. These states represent entities that are geographically interdependent with Virginia’s transportation infrastructure.
• The through-flow of goods in Virginia is generally from the Southeastern region (North Carolina, South Carolina, Florida, and Georgia) and from the Northeastern region (New York, Pennsylvania, Maryland and Massachusetts). Long-haul traffic such as those from the Southwest region going to the Northeast (e.g., TX to MA) can make easier re-routing adjustments compared to short-haul traffic (e.g., NC to MD).
• The critical routes in Virginia for commodity flow are I-81, I-64 and I-95. These assets are prominent in the inventory of interdependent assets that were created for this effort.
• Traffic volume exceeds capacity by as much as 39,000 vehicles per day and truck traffic is double what it should be along I-81 in Roanoke. These facts contributed to ranking I-81 as a significant asset in the inventory of interdependent assets. A disruption to this asset will propagate severe consequences to other economic sectors.
• Amount of hazardous materials (hazmat) flowing through the region is significant. In the event of an act of terrorism, the presence of HAZMAT could increase the severity and length of the disruption.
Sentara Norfolk General Hospital Case Study
• Emergency personnel response may be hampered due to high traffic situations. VDOT has always prioritized hospital routes during emergencies. An improvement to the current procedure is to install VMS on strategic places along evacuation routes, and just near the
52

exits to hospitals so that the public can be advised on the status of hospital occupancy and redirected to other hospitals prior to joining the local traffic.
• Management of the delivery of hospital supplies is important. The supplies that would be most critical to a hospital are gas, medical supplies, food, and water, all of which are transported by trucks. If the power were out as a result of a terrorist attack, fuel oil would also need to be transported by trucks to keep generators running.
FUTURE WORK
For the fourth phase of this research, the objective is to address the following four topical areas of study and thereby provide VDOT with models and tools that support the security of critical transportation infrastructures. The areas of study are:
1. Develop and enhance the Computer Model Interdependency Analysis Tool (developed in prototype in the current Phase 3 of this research).
2. Identify critical resources and organizational structures for VDOT to respond to emergencies and provide security
3. Develop an intelligence collection model for transportation systems. 4. Study the propagation of inoperability into transportation from other sectors
REFLECTIONS
The feasibility of utilizing the statewide travel-forecasting model to assess the effects of terrorism on interstate person and goods movement could be examined. The first statewide multimodal transportation plan, VTrans 2025, could be analyzed to link the findings and recommendations of the risk assessment report. Additional databases that could be exploited include the Federal Highway Administration’s HPMS database and the Virginia Employment Commission. An analysis of various scenarios for accommodating changes in demand that may follow a terrorist attack could be examined; for example, lifting or relaxing truck size and weight restrictions, instituting shuttle service, designating temporary HOV lanes and creating reversible lanes. Applying the results of the effort’s modeling process to the regional travel forecasting models could be explored. Recent reports concerning the feasibility of diverting freight from truck to rail could be examined to further analyze risk management options. An analysis of the most likely threats to the transportation infrastructure could be conducted to determine their effects on safety and the state’s economy. The metrics generated by the IIM, such as dollar loss, may not be as effective when measuring the output of certain economic sectors, such as health care.
ACKNOWLEDGMENTS
53

The authors are grateful to the Virginia Transportation Research Council (VTRC), and Virginia Department of Transportation (VDOT) for supporting the efforts described herein. We would like to thank the members of the project steering committee from VTRC, VDOT Virginia National Guard, and Virginia Department of Emergency Management: Patrick Grimes, George Foresman, Jim Keck, Ray Khoury, Perry Cogburn, Janet Clements, and Mike Coleman. We would like to thank the reviewers at VTRC whose feedback have made this report better: Roger Howe, Cheryl Lynn, John Miller, Ken Lantz and Matt Grimes, Thanks are also extended to Della Dirickson, Lisa M. Dryden, Matt S. Haggerty, Lindsey M. Lane, and Christine S. Lee of the Center for Risk Management of Engineering Systems.
REFERENCES
Asbeck, E.L. and Haimes, Y.Y. The partitioned multiobjective risk method (PMRM). Large Scale Systems, 6(1), 1984, pp. 13-38.
Associated Press. “Hampton Roads Officials Pointing Finger at FEMA In Storm's Aftermath.” Daily Press 25 Sept. 2003: C1.
Barger, Nelson, Registered Nurse with Sentara Norfolk General Hospital and member of Hampton Roads Metropolitan Medical Response System (created in response to the 9/11 attacks). Personal Interview. 17 Mar. 2004.
Bureau of Transportation Statistics (BTS). 1997 Commodity Flow Survey. U.S. Department of Transportation, Washington D.C., 1997.
Bureau of Transportation Statistics (BTS). The Changing Face of Transportation. Report BTS00-007. 2000. http://199.79.179.77/transtu/cft/ Accessed February 12, 2002.
Economic Classification Policy Committee (ECPC), 2002. The North American Industry Classification System. Washington, DC: Office of Management and Budget (OMB).
Fluor Virginia, Inc. (2003). Conceptual proposal for Interstate 81 corridor improvement project. Retrieved March 3, 2004 from http://www.virginiadot.org/infoservice/resources/is-I-81-Fluor.pdf
Haimes, Y.Y. (1981) Hierarchical holographic modeling. IEEE Transactions on Systems, Man, and Cybernetics, 11(9): 606-617.
Haimes, Y.Y. (1991). Total risk management. Risk Analysis, 11(2): 169-171.
Haimes, Y.Y. (1998) Risk Modeling, Assessment, and Management. John Wiley and Sons, Inc. New York.
Haimes, Y.Y. (2001) Water system complexity and the misuse of modeling and optimization. Risk-based Decision-making in Water Resources IX, Haimes, Moser, and Stakhiv, Editors. ASCE, New York.
54

Haimes, Y.Y., and Jiang, P. (2001). Leontief-based model of risk in complex interconnected infrastructures, ASCE Journal of Infrastructure Systems, 7(1): 1-12.
Haimes, Y.Y., Kaplan, S., and Lambert, J.H. (2002). Risk filtering, ranking, and management framework using hierarchical holographic modeling. Risk Analysis, 22(2): 381-395.
Hanshaw, Stephany. Personal Interview, March 4, 2004.
Kaplan, S. and Garrick, B.J. (1981). On the quantitative definition of risk. Risk Analysis, 1(1): 11-27.
Milner, Stephen. Norfolk Naval Shipyard. Personal Correspondence. March 5, 2004.
Santos, J. R., 2003. Interdependency Analysis: Extensions to Demand Reduction Inoperability Input-Output Modeling and Portfolio Selection, Ph.D. Dissertation, University of Virginia, Charlottesville, VA.
Santos, J.R., and Haimes, Y.Y. (2003). Demand Reduction Input-Output (I-O) Model for Modeling Interconnectedness. Risk-Based Decision-making in Water Resources X: Risks of Terrorism, Y.Y. Haimes, D.A. Moser, and E.Z. Stakhiv (editors). Reston, VA: American Society of Civil Engineers.
Sidebottom, Marge. UVA Director of Emergency Services. Personal Interview. March 24, 2004.
U.S. Department of Commerce, Bureau of Economic Analysis, 1998. Benchmark Input-Output Accounts of the United States, 1992. Washington DC: U.S. Government Printing Office.
Virginia Department of Transportation (2003). I-81 Corridor overview. Retrieved February 25, 2004 from http://www.virginiadot.org/projects/constSTAN-I81-overview2.asp
55