critical sector data update - pg.jrj.com.cn
TRANSCRIPT

Equi
ty R
esea
rch
Equi
ty R
esea
rch
Rep
ort
Crit
ical
Sec
tor D
ata
Upd
ate
Sect
or R
epor
t
行
业
关
键
数
据
更
新
股
票
研
究
行
业
报
告
证
券
研
究
报
告
Research Department
研究部
15 December 2017
Critical Sector Data Update
行业关键数据更新
See the last page for disclaimer Critical Sector Data Update 行业关键数据更新 15 December 2017 Page 1 of 24

Critical Sector Data Update
Sector: Oil & Gas, Petrochemicals
Sector: Nonferrous Metals, Precious Metal
Figure 1 1-Y Crude Oil Prices Figure 2 10-Y Crude Oil Prices 一年国际油价 十年国际油价
Brent Oil Spot
WTI Oil Spot
Dubai Oil Spot
YTD 15.2% 6.2% 11.1%
YTD YOY 23.6% 18.0% 29.1%
wow 0.3% -0.6% -0.3%
mom 3.8% 3.1% 0.6% yoy 19.6% 12.1% 17.6%
52w H / L 65 / 44
59 / 42
62 / 44
10
20
30
40
50
60
70
80
90
Dec-16 Feb-17 Apr-17 Jun-17 Aug-17 Oct-17 Dec-17
Brent Oil Spot(US$/bbl)
WTI Oil Spot(US$/bbl)
Dubai Oil Spot(US$/bbl)
0
40
80
120
160
2007 2008 2009 2010 2011 2012 2013 2014 2015 2016 2017
Brent Oil Spot (US$/bbl)
WTI Oil Spot (US$/bbl)
Dubai Oil Spot(US$/bbl)
Source: Bloomberg Source: Bloomberg
Figure 3 3-Y Domestic Gasoline & Diesel Retail Price Cap
三年国内汽油柴油最高零售价
Gasoline (RMB
/Tonne)
Diesel (RMB
/Tonne) YTD 4.6% 5.0%
YTD YOY 9.4% 10.2%
wow 0.0% 0.0%
mom 3.3% 3.5%
yoy 5.9% 6.3%
52w H / L 8331 / 7361
7400 / 6470
5,000.00
6,000.00
7,000.00
8,000.00
9,000.00
10,000.00
11,000.00
12,000.00
Dec/14 Jun/15 Dec/15 Jun/16 Dec/16 Jun/17 Dec/17
Gasoline (RMB/Tonne) Diesel (RMB/Tonne)
Source: China NDRC
Figure 4 1-Y Gold Prices & Dollar Index Figure 5 10-Y Gold Prices & Dollar Index
一年国际金价和美元指数 十年国际金价和美元指数
Gold Price
Dollar Index (RHS)
YTD 8.8% -8.5%
YTD YOY 0.4% 0.1%
wow 0.4% -0.4%
mom -1.9% -0.3%
yoy 11.1% -9.3%
52w H / L 1349 / 1128
103 / 91
90
93
96
99
102
105
1,000
1,100
1,200
1,300
1,400
1,500
Dec-16 Feb-17 Apr-17 Jun-17 Aug-17 Oct-17 Dec-17
Gold price (USD/Oz) Dollar Index (RHS)
70
75
80
85
90
95
100
105
200
500
800
1,100
1,400
1,700
2,000
2,300
2007 2008 2009 2010 2011 2012 2013 2014 2015 2016 2017
Gold price (USD/Oz) Dollar Index (RHS)
Source: Bloomberg Source: Bloomberg
See the last page for disclaimer Critical Sector Data Update 行业关键数据更新 15 December 2017 Page 2 of 24

Critical Sector Data Update
Figure 6&7 1-Y Copper Prices & Stock Figure 8&9 10-Y Copper Prices & Stock 一年铜价格与库存 十年铜价格与库存
LME Copper
Price LME Copper
Inventory YTD 22.7% -40.6%
YTD YOY 27.1% N/A
wow 3.4% -1.8%
mom 0.3% -25.0%
yoy 18.5% -35.1%
52w H / L 7135 / 5469
354650 / 182425
SHFE Copper
Price SHFE Copper
Inventory YTD 16.1% 7.9%
YTD YOY 29.7% N/A
wow 2.4% 0.0%
mom -0.8% 8.7%
yoy 13.0% 9.8%
52w H / L 55570 / 44280
326732 / 103151
0
50,000
100,000
150,000
200,000
250,000
300,000
350,000
400,000
4,000
4,500
5,000
5,500
6,000
6,500
7,000
7,500
Dec-16 Feb-17 Apr-17 Jun-17 Aug-17 Oct-17 Dec-17
LME Copper Price (USD/Tonne) LME Copper Inventory (Tonne-RHS)
0
50,000
100,000
150,000
200,000
250,000
300,000
350,000
15,000
20,000
25,000
30,000
35,000
40,000
45,000
50,000
55,000
60,000
Dec-16 Feb-17 Apr-17 Jun-17 Aug-17 Oct-17 Dec-17
SHFE Copper price (RMB/Tonne)
SHFE Copper Inventory (Tonne-RHS)
0
100,000
200,000
300,000
400,000
500,000
600,000
700,000
800,000
0
2,000
4,000
6,000
8,000
10,000
12,000
2007 2008 2009 2010 2011 2012 2013 2014 2015 2016 2017
LME Copper Price (USD/Tonne)
LME Copper Inventory (Tonne-RHS)
0
50,000
100,000
150,000
200,000
250,000
300,000
350,000
400,000
450,000
0
10,000
20,000
30,000
40,000
50,000
60,000
70,000
80,000
2007 2008 2009 2010 2011 2012 2013 2014 2015 2016 2017
SHFE Copper price (RMB/Tonne)
SHFE Copper Inventory (Tonne-RHS)
Source: Bloomberg Source: Bloomberg
Figure 10&11 1-Y Aluminum Prices & Stock
Figure 12&13 10-Y Aluminum Prices & Stock
一年铝价格与库存 十年铝价格与库存
LME Aluminum
Price LME Aluminum
Inventory YTD 21.1% -49.7%
YTD YOY 22.8% N/A
wow 1.9% 1.5%
mom -2.7% -4.7%
yoy 18.1% -46.8%
52w H / L 2190 / 1679
2300550 / 1094525
SHFE Aluminum
Price SHFE Aluminum
Inventory YTD 12.4% 609.7%
YTD YOY 21.6% N/A
wow 1.0% 0.0%
mom -6.9% 7.2%
yoy 11.4% 643.1%
52w H / L 17050 / 12590
714816 / 96196
0
500,000
1,000,000
1,500,000
2,000,000
2,500,000
1,420
1,520
1,620
1,720
1,820
1,920
2,020
2,120
2,220
2,320
Dec-16 Feb-17 Apr-17 Jun-17 Aug-17 Oct-17 Dec-17
LME Aluminum Price (USD/Tonne)
LME Aluminum Inventory (Tonne-RHS)
0
100,000
200,000
300,000
400,000
500,000
600,000
700,000
800,000
8,000
9,000
10,000
11,000
12,000
13,000
14,000
15,000
16,000
17,000
18,000
Dec-16 Feb-17 Apr-17 Jun-17 Aug-17 Oct-17 Dec-17
SHFE Aluminum price (RMB/Tonne)
SHFE Aluminum Inventory (Tonne-RHS)
0
1,000,000
2,000,000
3,000,000
4,000,000
5,000,000
6,000,000
0
500
1,000
1,500
2,000
2,500
3,000
3,500
2007 2008 2009 2010 2011 2012 2013 2014 2015 2016 2017
LME Aluminum Price (USD/Tonne)
LME Aluminum Inventory (Tonne-RHS)
0
100,000
200,000
300,000
400,000
500,000
600,000
700,000
800,000
0
5,000
10,000
15,000
20,000
25,000
2007 2008 2009 2010 2011 2012 2013 2014 2015 2016 2017
SHFE Aluminum price (RMB/Tonne)
SHFE Aluminum Inventory (Tonne-RHS)
Source: Bloomberg Source: Bloomberg
See the last page for disclaimer Critical Sector Data Update 行业关键数据更新 15 December 2017 Page 3 of 24
Critical Sector Data Update
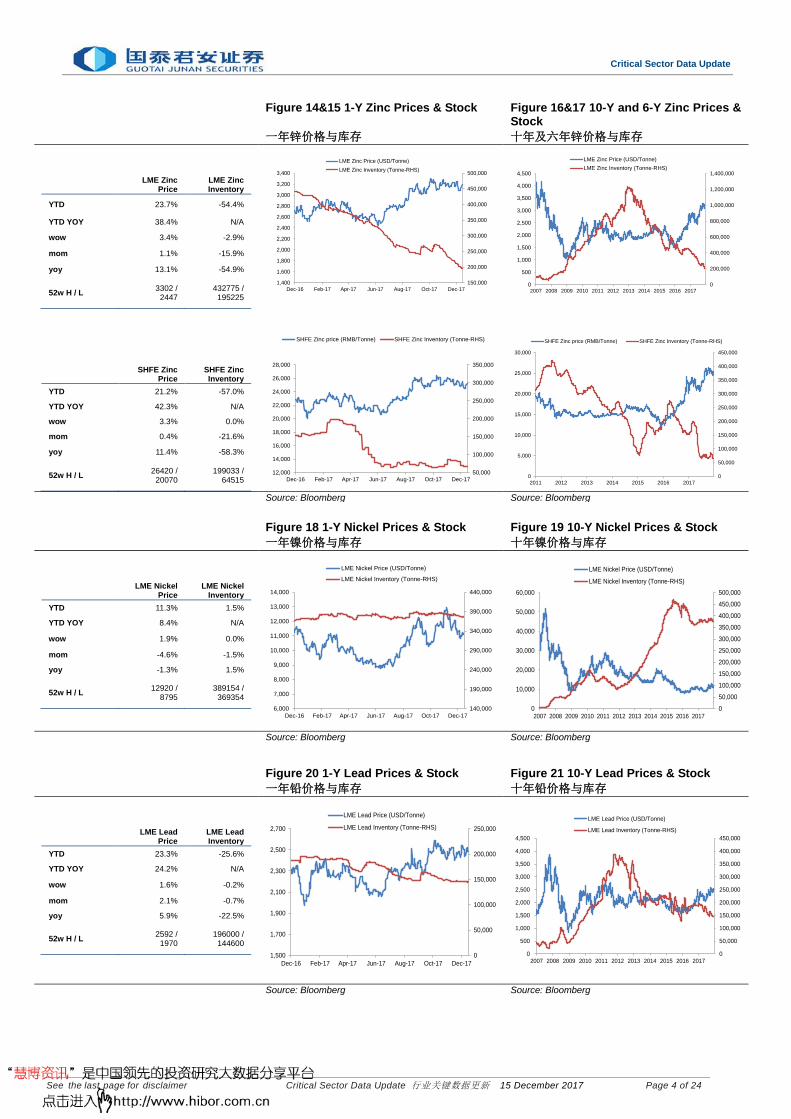
Figure 14&15 1-Y Zinc Prices & Stock Figure 16&17 10-Y and 6-Y Zinc Prices & Stock
一年锌价格与库存 十年及六年锌价格与库存
LME Zinc
Price LME Zinc Inventory
YTD 23.7% -54.4%
YTD YOY 38.4% N/A
wow 3.4% -2.9%
mom 1.1% -15.9%
yoy 13.1% -54.9%
52w H / L 3302 / 2447
432775 / 195225
SHFE Zinc
Price SHFE Zinc Inventory
YTD 21.2% -57.0%
YTD YOY 42.3% N/A
wow 3.3% 0.0%
mom 0.4% -21.6%
yoy 11.4% -58.3%
52w H / L 26420 / 20070
199033 / 64515
150,000
200,000
250,000
300,000
350,000
400,000
450,000
500,000
1,400
1,600
1,800
2,000
2,200
2,400
2,600
2,800
3,000
3,200
3,400
Dec-16 Feb-17 Apr-17 Jun-17 Aug-17 Oct-17 Dec-17
LME Zinc Price (USD/Tonne)LME Zinc Inventory (Tonne-RHS)
50,000
100,000
150,000
200,000
250,000
300,000
350,000
12,000
14,000
16,000
18,000
20,000
22,000
24,000
26,000
28,000
Dec-16 Feb-17 Apr-17 Jun-17 Aug-17 Oct-17 Dec-17
SHFE Zinc price (RMB/Tonne) SHFE Zinc Inventory (Tonne-RHS)
0
200,000
400,000
600,000
800,000
1,000,000
1,200,000
1,400,000
0
500
1,000
1,500
2,000
2,500
3,000
3,500
4,000
4,500
2007 2008 2009 2010 2011 2012 2013 2014 2015 2016 2017
LME Zinc Price (USD/Tonne)LME Zinc Inventory (Tonne-RHS)
0
50,000
100,000
150,000
200,000
250,000
300,000
350,000
400,000
450,000
0
5,000
10,000
15,000
20,000
25,000
30,000
2011 2012 2013 2014 2015 2016 2017
SHFE Zinc price (RMB/Tonne) SHFE Zinc Inventory (Tonne-RHS)
Source: Bloomberg Source: Bloomberg
Figure 18 1-Y Nickel Prices & Stock Figure 19 10-Y Nickel Prices & Stock 一年镍价格与库存 十年镍价格与库存
LME Nickel
Price LME Nickel
Inventory YTD 11.3% 1.5%
YTD YOY 8.4% N/A
wow 1.9% 0.0%
mom -4.6% -1.5%
yoy -1.3% 1.5%
52w H / L 12920 / 8795
389154 / 369354
140,000
190,000
240,000
290,000
340,000
390,000
440,000
6,000
7,000
8,000
9,000
10,000
11,000
12,000
13,000
14,000
Dec-16 Feb-17 Apr-17 Jun-17 Aug-17 Oct-17 Dec-17
LME Nickel Price (USD/Tonne)
LME Nickel Inventory (Tonne-RHS)
0
50,000
100,000
150,000
200,000
250,000
300,000
350,000
400,000
450,000
500,000
0
10,000
20,000
30,000
40,000
50,000
60,000
2007 2008 2009 2010 2011 2012 2013 2014 2015 2016 2017
LME Nickel Price (USD/Tonne)
LME Nickel Inventory (Tonne-RHS)
Source: Bloomberg Source: Bloomberg
Figure 20 1-Y Lead Prices & Stock Figure 21 10-Y Lead Prices & Stock 一年铅价格与库存 十年铅价格与库存
LME Lead
Price LME Lead Inventory
YTD 23.3% -25.6%
YTD YOY 24.2% N/A
wow 1.6% -0.2%
mom 2.1% -0.7%
yoy 5.9% -22.5%
52w H / L 2592 / 1970
196000 / 144600
0
50,000
100,000
150,000
200,000
250,000
1,500
1,700
1,900
2,100
2,300
2,500
2,700
Dec-16 Feb-17 Apr-17 Jun-17 Aug-17 Oct-17 Dec-17
LME Lead Price (USD/Tonne)
LME Lead Inventory (Tonne-RHS)
0
50,000
100,000
150,000
200,000
250,000
300,000
350,000
400,000
450,000
0
500
1,000
1,500
2,000
2,500
3,000
3,500
4,000
4,500
2007 2008 2009 2010 2011 2012 2013 2014 2015 2016 2017
LME Lead Price (USD/Tonne)
LME Lead Inventory (Tonne-RHS)
Source: Bloomberg Source: Bloomberg
See the last page for disclaimer Critical Sector Data Update 行业关键数据更新 15 December 2017 Page 4 of 24
Critical Sector Data Update
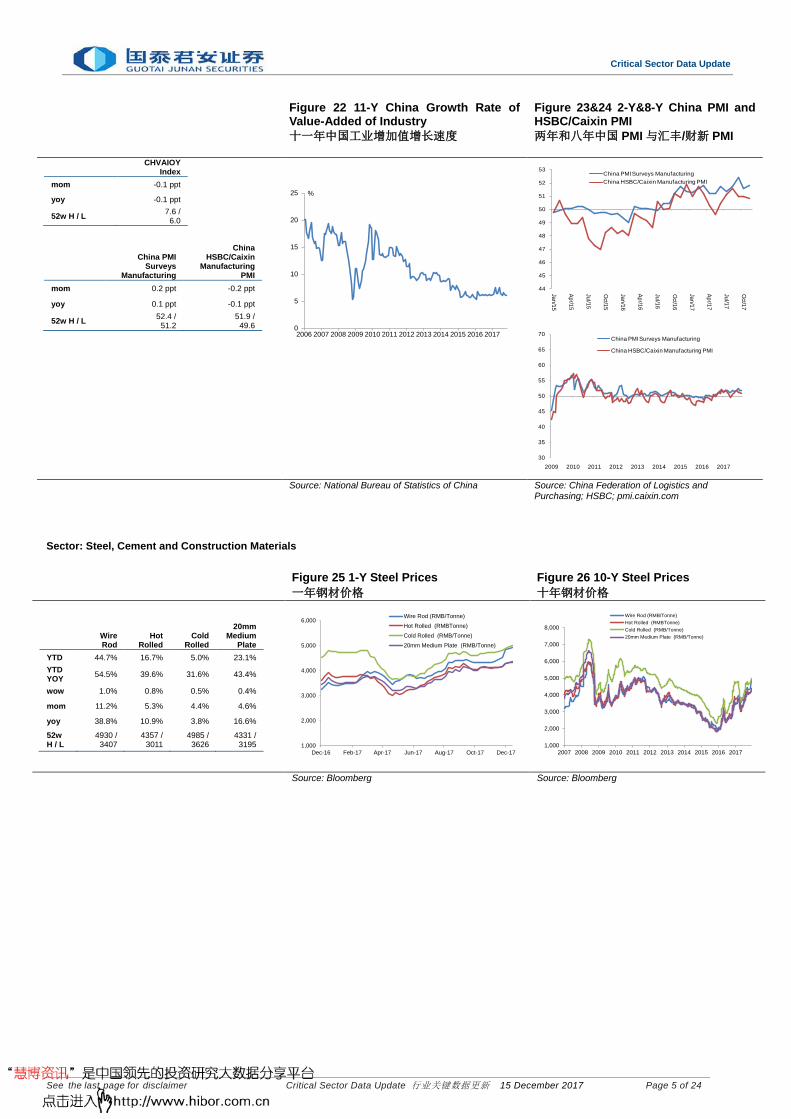
Figure 22 11-Y China Growth Rate of
Value-Added of Industry Figure 23&24 2-Y&8-Y China PMI and HSBC/Caixin PMI
十一年中国工业增加值增长速度 两年和八年中国 PMI 与汇丰/财新 PMI
CHVAIOY
Index mom -0.1 ppt
yoy -0.1 ppt
52w H / L 7.6 / 6.0
China PMI
Surveys Manufacturing
China HSBC/Caixin
Manufacturing PMI
mom 0.2 ppt -0.2 ppt
yoy 0.1 ppt -0.1 ppt
52w H / L 52.4 / 51.2
51.9 / 49.6
0
5
10
15
20
25
2006 2007 2008 2009 2010 2011 2012 2013 2014 2015 2016 2017
%
44
45
46
47
48
49
50
51
52
53
Jan/15
Apr/15
Jul/15
Oct/15
Jan/16
Apr/16
Jul/16
Oct/16
Jan/17
Apr/17
Jul/17
Oct/17
China PMI Surveys ManufacturingChina HSBC/Caixin Manufacturing PMI
30
35
40
45
50
55
60
65
70
2009 2010 2011 2012 2013 2014 2015 2016 2017
China PMI Surveys Manufacturing
China HSBC/Caixin Manufacturing PMI
Source: National Bureau of Statistics of China Source: China Federation of Logistics and
Purchasing; HSBC; pmi.caixin.com
Sector: Steel, Cement and Construction Materials
Figure 25 1-Y Steel Prices Figure 26 10-Y Steel Prices 一年钢材价格 十年钢材价格
Wire Rod
Hot Rolled
Cold Rolled
20mm Medium
Plate YTD 44.7% 16.7% 5.0% 23.1% YTD YOY 54.5% 39.6% 31.6% 43.4%
wow 1.0% 0.8% 0.5% 0.4%
mom 11.2% 5.3% 4.4% 4.6%
yoy 38.8% 10.9% 3.8% 16.6%
52w H / L
4930 / 3407
4357 / 3011
4985 / 3626
4331 / 3195
1,000
2,000
3,000
4,000
5,000
6,000
Dec-16 Feb-17 Apr-17 Jun-17 Aug-17 Oct-17 Dec-17
Wire Rod (RMB/Tonne)
Hot Rolled (RMBTonne)
Cold Rolled (RMB/Tonne)
20mm Medium Plate (RMB/Tonne)
1,000
2,000
3,000
4,000
5,000
6,000
7,000
8,000
2007 2008 2009 2010 2011 2012 2013 2014 2015 2016 2017
Wire Rod (RMB/Tonne)Hot Rolled (RMBTonne)Cold Rolled (RMB/Tonne)20mm Medium Plate (RMB/Tonne)
Source: Bloomberg Source: Bloomberg
See the last page for disclaimer Critical Sector Data Update 行业关键数据更新 15 December 2017 Page 5 of 24

Critical Sector Data Update
Sector: Aviation, Automobiles
Figure 27 2-Y Cement prices Figure 28 7-Y Cement prices 两年国内水泥价格 七年国内水泥价格
North China
North East
East China
Central China
YTD 17.3% 21.5% 59.8% 32.7% YTD YOY 32.4% 13.4% 26.8% 29.1%
wow 0.0% 0.0% 4.1% 0.0%
mom 4.7% 0.0% 30.5% 13.0%
yoy 17.2% 19.0% 58.1% 32.9% 52w H/L
363 / 307
384 / 306
519 / 308
481 / 332
South China
South West
North West
YTD 9.4% 11.8% 15.7% YTD YOY 22.1% 23.7% 20.7%
wow 6.0% 3.0% -0.1%
mom 9.1% 12.8% 5.4%
yoy 9.3% 11.5% 13.2%
52w H/L 422 / 351
391 / 327
355 / 306
200
250
300
350
400
450
500
550
Dec/15 Mar/16 Jun/16 Sep/16 Dec/16 Mar/17 Jun/17 Sep/17 Dec/17
North China (RMB/Tonne) South West (RMB/Tonne)
North East (RMB/Tonne) East China (RMB/Tonne)
Central China (RMB/Tonne) South China (RMB/Tonne)
North West (RMB/Tonne)
200
250
300
350
400
450
500
550
Dec/10 Dec/11 Dec/12 Dec/13 Dec/14 Dec/15 Dec/16 Dec/17
North China (RMB/Tonne) South West (RMB/Tonne)North East (RMB/Tonne) East China (RMB/Tonne)South China (RMB/Tonne) South China (RMB/Tonne)North West (RMB/Tonne)
Source: China Cement Association
Figure 29: 7Y RPK & PLF Figure 30: 7-Y RTK & LF 七年收入客公里及客座率 七年总收入吨公里同比增速
RPK (Mn passenger
kilometers)
RTK (Mn ton
kilometers) PLF
(pps) LF
(pps) YTD YOY 13.8% 12.5% 0.5 0.8
mom -4.3% 3.2% (2.9) 0.2 yoy 17.5% 11.9% (0.9) (0.1)
52w H/ L 86984 / 71198
9580 / 7920
85 / 81
75 / 71
15,000
25,000
35,000
45,000
55,000
65,000
75,000
85,000
95,000
60
65
70
75
80
85
90
2010 2011 2012 2013 2014 2015 2016 2017
PLF (%) RPK (Million passenger-kilometers)-RHS
0
2,000
4,000
6,000
8,000
10,000
12,000
60
65
70
75
80
85
90
2010 2011 2012 2013 2014 2015 2016 2017
LF (%) RTK (Million tonne-kilometers) - RHS
Note: Latest data for RPK is 11/2017, for PLF is 09/2017.For RTK is 10/2017, for LF is 09/2017.
Source: Civil Aviation Administration of China Source: Civil Aviation Administration of China
Figure 31: 6-Y RPK YoY Growth Figure 32: 6-Y RTK YoY Growth 六年收入客公里同比增速 六年总收入吨公里同比增速
RPK RTK mom 5.0 ppt (0.30) ppt
yoy 2.5 ppt (1.27) ppt
52w H / L 19.3% / 9.3%
16.3% / 9.4%
0%
5%
10%
15%
20%
25%
Jan Feb Mar Apr May Jun Jul Aug Sep Oct Nov Dec
2011 2012 2013 2014 2015 2016 2017
0%
2%
4%
6%
8%
10%
12%
14%
16%
18%
20%
Jan Feb Mar Apr May Jun Jul Aug Sep Oct Nov Dec
2011 2012 2013 2014 2015 2016 2017
Note: Latest data for figure 32 is 10/2017. Source: Civil Aviation Administration of China Source: Civil Aviation Administration of China
See the last page for disclaimer Critical Sector Data Update 行业关键数据更新 15 December 2017 Page 6 of 24
Critical Sector Data Update
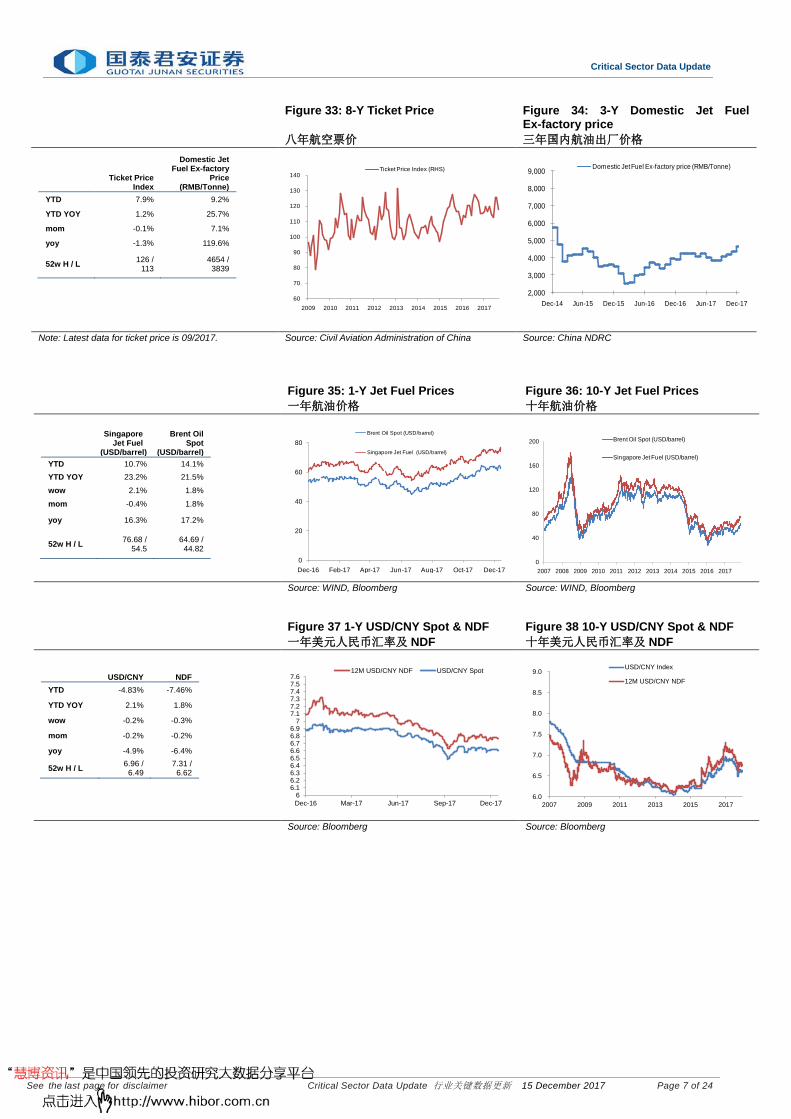
Figure 33: 8-Y Ticket Price Figure 34: 3-Y Domestic Jet Fuel Ex-factory price
八年航空票价 三年国内航油出厂价格
Ticket Price Index
Domestic Jet Fuel Ex-factory
Price (RMB/Tonne)
YTD 7.9% 9.2%
YTD YOY 1.2% 25.7%
mom -0.1% 7.1%
yoy -1.3% 119.6%
52w H / L 126 / 113
4654 / 3839
60
70
80
90
100
110
120
130
140
2009 2010 2011 2012 2013 2014 2015 2016 2017
Ticket Price Index (RHS)
2,000
3,000
4,000
5,000
6,000
7,000
8,000
9,000
Dec-14 Jun-15 Dec-15 Jun-16 Dec-16 Jun-17 Dec-17
Domestic Jet Fuel Ex-factory price (RMB/Tonne)
Note: Latest data for ticket price is 09/2017. Source: Civil Aviation Administration of China Source: China NDRC
Figure 35: 1-Y Jet Fuel Prices Figure 36: 10-Y Jet Fuel Prices 一年航油价格 十年航油价格
Singapore
Jet Fuel (USD/barrel)
Brent Oil Spot
(USD/barrel) YTD 10.7% 14.1% YTD YOY 23.2% 21.5%
wow 2.1% 1.8%
mom -0.4% 1.8%
yoy 16.3% 17.2%
52w H / L 76.68 / 54.5
64.69 / 44.82
0
20
40
60
80
Dec-16 Feb-17 Apr-17 Jun-17 Aug-17 Oct-17 Dec-17
Brent Oil Spot (USD/barrel)
Singapore Jet Fuel (USD/barrel)
0
40
80
120
160
200
2007 2008 2009 2010 2011 2012 2013 2014 2015 2016 2017
Brent Oil Spot (USD/barrel)
Singapore Jet Fuel (USD/barrel)
Source: WIND, Bloomberg Source: WIND, Bloomberg
Figure 37 1-Y USD/CNY Spot & NDF Figure 38 10-Y USD/CNY Spot & NDF 一年美元人民币汇率及 NDF 十年美元人民币汇率及 NDF
USD/CNY NDF
YTD -4.83% -7.46%
YTD YOY 2.1% 1.8%
wow -0.2% -0.3%
mom -0.2% -0.2%
yoy -4.9% -6.4%
52w H / L 6.96 / 6.49
7.31 / 6.62
66.16.26.36.46.56.66.76.86.9
77.17.27.37.47.57.6
Dec-16 Mar-17 Jun-17 Sep-17 Dec-17
12M USD/CNY NDF USD/CNY Spot
6.0
6.5
7.0
7.5
8.0
8.5
9.0
2007 2009 2011 2013 2015 2017
USD/CNY Index
12M USD/CNY NDF
Source: Bloomberg Source: Bloomberg
See the last page for disclaimer Critical Sector Data Update 行业关键数据更新 15 December 2017 Page 7 of 24

Critical Sector Data Update
Figure 39 7-Y Yearly Comparison of Car Sales
Figure 40 7-Y Yearly Comparison of Car Sales Growth YoY
七年汽车销量年度对比 七年汽车销量年度增长对比(同比)
Auto
Sales PV Sales CV Sales YTD YOY 4.0% 2.2% 16.2% mom 9.4% 10.1% 4.9% yoy 0.6% 0.0% 5.6%
52w H / L 3057340 / 1939248
2672264 / 1632748
446628 / 292812
0
500,000
1,000,000
1,500,000
2,000,000
2,500,000
3,000,000
3,500,000
Jan
Feb
Mar
Apr
May Jun
Jul
Aug
Sep Oct
Nov
Dec
2010
2011
2012
2013
2014
2015
2016
2017
-40%
-20%
0%
20%
40%
60%
80%
100%
120%
140%
Jan
Feb Mar
Ap
r
May Jun
Jul
Aug
Sep Oct
No
v
Dec
2010
2011
2012
2013
2014
2015
2016
2017
Source: China Association of Automobile
Manufacturers Source: China Association of Automobile Manufacturers
Figure 41 2-Y PV Retail Discount Rate Figure 42 1-Y Inventory Ratio of Dealers 两年乘用车零售折扣率 一年乘用车经销商库存系数
Discount Rate(pts)
Inventory Ratio of Dealers(pts)
YTD -0.20 0.41
YTD YOY -0.65 -0.77
mom -0.20 0.41
yoy -0.61 0.14
52w H / L 13.4 / 8.7
13.4 / 8.7
0
2
4
6
8
10
12
14
16
Sep/15 Dec/15 Mar/16 Jun/16 Sep/16 Dec/16 Mar/17 Jun/17 Sep/17
% Discount Rate
1.1
1.2
1.3
1.4
1.5
1.6
1.7
1.8
1.9
2.0
Aug/16 Nov/16 Feb/17 May/17 Aug/17
Inventory Ratio
Note: Latest data for figure41 is 09/2017; for figure 42 is 08/2017.
Source: I.S. Engine Source: WAYS Consulting
Figure 43 2-Y Shanghai Rubber Prices 两年上海橡胶价格
Rubber
Shanghai (RMB/MT)
YTD -21.51%
YTD YOY 25.9% wow 2.1%
mom 21.6%
yoy -28.8%
52w H / L 21605 / 11080
7,000
12,000
17,000
22,000
27,000
Dec-15 Mar-16 Jun-16 Sep-16 Dec-16 Mar-17 Jun-17 Sep-17 Dec-17
Rubber Shanghai (RMB/MT)
Source: Bloomberg
See the last page for disclaimer Critical Sector Data Update 行业关键数据更新 15 December 2017 Page 8 of 24

Critical Sector Data Update
Sector: Shipping & Logistics, Ports
Figure 44 1-Y BDI Figure 45 10-Y BDI 一年波罗的海干散货运价指数 十年波罗的海干散货运价指数
BDI
YTD 80.0%
YTD YOY 71.4%
wow 1.6%
mom 25.9%
yoy 79.1%
52w H / L 1743 / 685
0
200
400
600
800
1,000
1,200
1,400
1,600
1,800
2,000
Dec-16 Mar-17 Jun-17 Sep-17 Dec-17
BDI
0
2,000
4,000
6,000
8,000
10,000
12,000
14,000
2007 2008 2009 2010 2011 2012 2013 2014 2015 2016 2017
BDI
Source: Bloomberg Source: Bloomberg
Figure 46 1-Y BDTI & BCTI Figure 47 10-Y BDTI & BCTI 一年波罗的海原油运价指数及波罗的海成
品油运价指数 十年波罗的海原油运价指数及波罗的海成
品油运价指数
BDTI BCTI
YTD -11.4% 3.5%
YTD YOY 9.0% 24.6%
wow 0.0% 2.3%
mom 3.4% 20.6%
yoy -10.5% 43.0%
52w H / L 1088 / 614
867 / 491
300
400
500
600
700
800
900
1,000
1,100
1,200
Dec-16 Mar-17 Jun-17 Sep-17 Dec-17
BDTI BCTI
0
500
1,000
1,500
2,000
2,500
2007 2008 2009 2010 2011 2012 2013 2014 2015 2016 2017
BDTI BCTI
Source: Bloomberg Source: Bloomberg
Figure 48 1-Y BUNKER Figure 49 11-Y BUNKER 一年彭博 380 Centistoke 船用燃油价格/新加坡
十一年彭博 380 Centistoke 船用燃油价格
/新加坡
BUNKER
YTD 6.2%
YTD YOY 42.3%
wow 2.0%
mom -3.9%
yoy 11.1%
52w H / L 379.04 / 277.6
120
170
220
270
320
370
420
Dec-16 Mar-17 Jun-17 Sep-17 Dec-17
BUNKER (USD/Metric Tonne)
0
100
200
300
400
500
600
700
800
2006 2007 2008 2009 2010 2011 2012 2013 2014 2015 2016 2017
BUNKER (USD/Metric Tonne)
Source: Bloomberg Source: Bloomberg
See the last page for disclaimer Critical Sector Data Update 行业关键数据更新 15 December 2017 Page 9 of 24

Critical Sector Data Update
Figure 50 9-Y China PMI: Manufacturing - New Export Order Index
九年中国采购经理指数(制造业):新出口
订单
China PMI: Manufacturing – New Export
Order Index mom 0.7 ppt
yoy 0.5 ppt
52w H / L 52 / 50.1
20
30
40
50
60
70
2008 2009 2010 2011 2012 2013 2014 2015 2016 2017
China PMI: Manufacturing - New Export Order Index
Source: China Federation of Logistics & Purchasing
Figure 51 2-Y China Import & Export (USD, Seasonally Adjusted, YoY)
Figure 52 2-Y China Import & Export (USD, MoM)
两年中国月度进出口值增长(美元, 季节调
整:同比) 两年中国月度进出口值增长(美元, 环比)
China Monthly
Export (Seasonally
Adjusted)
China Monthly
Import (Seasonally
Adjusted)
China Monthly
Export & Import
(Seasonally Adjusted)
yoy (RMB) 7.4% 21.8% 13.3%
yoy (USD) 8.2% 23.2% 14.4%
52w H / L 16.9% / -4.3%
23.2% / 2.3%
18.4% / -1.5%
China Monthly
Export
China Monthly
Import
China Monthly
Export & Import
mom (RMB) -5.8% -12.2% -8.7%
mom (USD) -4.7% -11.1% -7.6%
-20%
-15%
-10%
-5%
0%
5%
10%
15%
20%
25%
30%
Oct-15 Feb-16 Jun-16 Oct-16 Feb-17 Jun-17 Oct-17
China Monthly Export (USD, Seasonally Adjusted, YoY)
China Monthly Import (USD, Seasonally Adjusted, YoY)
China Monthly Export & Import (USD, Seasonally Adjusted, YoY)
-40%
-30%
-20%
-10%
0%
10%
20%
30%
40%
50%
60%
Oct/15 Jan/16 Apr/16 Jul/16 Oct/16 Jan/17 Apr/17 Jul/17 Oct/17
China Monthly Export & Import (USD, MoM)
China Monthly Export (USD, MoM)
China Monthly Import (USD, MoM)
Note: Latest data for figures 51- 52 are 10/2017. Source: China Customs Source: China Customs
Figure 53 1-Y CCBFI Figure 54 5-Y CCBFI 一年中国沿海(散货)运价指数 五年中国沿海(散货)运价指数
China Costal Bulk Freight
Index (CCBFI)
YTD 47.3%
YTD YOY 22.8%
wow 4.8%
mom 17.4%
yoy 28.4%
52w H / L 1462 / 808
750
850
950
1,050
1,150
1,250
1,350
1,450
Dec-16 Mar-17 Jun-17 Sep-17 Dec-17
China Costal Bulk Freight Index (CCBFI)
500
700
900
1,100
1,300
1,500
1,700
2012 2013 2014 2015 2016 2017
China Costal Bulk Freight Index (CCBFI)
Source: Shanghai Shipping Exchange Source: Shanghai Shipping Exchange
See the last page for disclaimer Critical Sector Data Update 行业关键数据更新 15 December 2017 Page 10 of 24

Critical Sector Data Update
Sector: Coal and Electricity
Figure 55 1-Y CCFI Figure 56 5-Y CCFI 一年中国出口集装箱运价指数 五年中国出口集装箱运价指数
China Containerized Freight Index
(CCFI)
YTD -5.3%
YTD YOY 16.5%
wow -1.2%
mom -2.7%
yoy -0.4%
52w H / L 878 / 763
500
600
700
800
900
1,000
Dec-16 Mar-17 Jun-17 Sep-17 Dec-17
China Containerized Freight Index (CCFI)
550
650
750
850
950
1,050
1,150
1,250
1,350
1,450
2012 2013 2014 2015 2016 2017
China Containerized Freight Index (CCFI)
Source: Shanghai Shipping Exchange Source: Shanghai Shipping Exchange
Figure 57 1-Y SCFI 一年上海出口集装箱运价指数
Shanghai Containerized Freight Index
(SCFI)
YTD -27.3%
YTD YOY 31.1%
wow -3.9%
mom -10.0%
yoy -11.8%
52w H / L 990 / 704
300
400
500
600
700
800
900
1,000
1,100
Dec-16 Mar-17 Jun-17 Sep-17 Dec-17
Shanghai Containerized Freight Index (SCFI)
Source: Shanghai Shipping Exchange
Figure 58 6-Y 5,500Kcal Thermal Coal FOB at Qinhuangdao
Figure 59 3-Y Coal Inventory at Qinhuangdao
六年秦皇岛 5,500 大卡动力煤平仓价 三年秦皇岛煤炭库存 QHD Q5500
YTD 9.5%
YTD YOY 38.0%
wow 1.1%
mom 1.4%
yoy 2.6%
52w H / L 720 / 551
QHD Inventory
YTD -8.2%
YTD YOY 49.9%
wow 0.0%
mom -5.2%
yoy -4.5%
52w H / L 727 / 431
300350400450500550600650700750800850900
Jan Feb Mar Apr May Jun Jul Aug Sep Oct Nov Dec
RMB/t
2011 2012 2013 2014
2015 2016 2017
0
100
200
300
400
500
600
700
800
900
1,000
Dec-14 Dec-15 Dec-16 Dec-17
10Kt QHD Inventory
Source: CCTD Source: CCTD
See the last page for disclaimer Critical Sector Data Update 行业关键数据更新 15 December 2017 Page 11 of 24

Critical Sector Data Update
Sector: Property
Figure 60 5-Y Australia NEWC Thermal Coal Spot Price
Figure 61 3-Y Coal Inventory of Key Power Plants
五年澳大利亚纽卡斯尔动力煤现货价格 三年重点电厂煤炭库存
Australia NEWC Thermal Coal
Spot Price YTD 2.5% YTD YOY 35.9%
wow -0.1% mom -1.9% yoy 16.0%
52w H / L 101.8 / 72.4
Coal Inventory of Key Power
Plants
Inventory Day of Key Power
Plants YTD 21.2% 43.8% YTD YOY 1.5% -5.0% wow 1.7% -4.2% mom 27.6% 27.8% yoy 32.5% 21.1%
52w H / L 7,935 / 5,007
25.0 / 13.0
0
40
80
120
Dec-12 Dec-13 Dec-14 Dec-15 Dec-16 Dec-17
USD/t Australia NEWC thermal coal spot price
0
5
10
15
20
25
30
35
0
1,000
2,000
3,000
4,000
5,000
6,000
7,000
8,000
9,000
10,000
Nov
-14
Feb-
15
May
-15
Aug-
15
Nov
-15
Feb-
16
May
-16
Aug-
16
Nov
-16
Feb-
17
May
-17
Aug-
17
Nov
-17
Day10Kt Coal Inventory of Key Power PlantsInventory Day of Key Power Plants
Source: CCTD Source: CCTD
Figure 62 5-Y Monthly China Power Consumption yoy
Figure 63 5-Y Monthly China Utilization Hours for Thermal Capacity
五年中国月度用电量增长(同比) 五年中国火电装机月度利用小时
Monthly Power Consumption
yoy YTD YOY 6.7% mom -3.5% yoy 5.0%
52w H / L 17.2% / -1.7%
Monthly Thermal Capacity
Utilization YTD YOY 0.8% mom -3.3% yoy -6.3%
52w H / L 409 / 313
-15
-10
-5
0
5
10
15
20
25
30
Jan Feb Mar Apr May Jun Jul Aug Sep Oct Nov Dec
% 2012 2013 2014 2015 2016 2017
250
300
350
400
450
500
Jan Feb Mar Apr May Jun Jul Aug Sep Oct Nov Dec
Hours 2012 2013 2014 2015 2016 2017
Note: Latest data for figures 62- 63 are 10/2017. Source: National Energy Administration Source: China Electricity Council
Figure 64 1-Y Domestic Property Sector YoY Data (Accumulative)
Figure 65 10-Y Domestic Property Sector YoY Data(Accumulative)
一年商品房投资,新开工及销售增长 (累计同比)
十年商品房投资,新开工及销售增长 (累计同比)
Investment GFA newly Constructed
GFA Sold (Area)
YTD YOY 7.5% 6.9% 7.9%
mom -0.6% 17.4% 14.5%
yoy 4.6% 18.8% 5.3%
Commodity Building
Sold
Commodity Building
Area Sold (Residential)
Sales (Residential)
YTD YOY 12.7% 5.4% 9.9%
mom 12.7% 13.9% 12.5%
yoy 13.3% 4.1% 12.4%
0%5%
10%15%20%25%30%35%40%45%
Nov-16 Jan-17 Mar-17 May-17 Jul-17 Sep-17 Nov-17
Investment YoYGFA newly constructed YoYGFA sold YoYCommodity Building Sold YoYCommodity Building Area Sold (Residential) YoYSales (Residential) YoY
-40%
-20%
0%
20%
40%
60%
80%
100%
2007 2008 2009 2010 2011 2012 2013 2014 2015 2016 2017
Investment YoYGFA newly constructed YoYGFA sold YoYCommodity Building Sold YoYCommodity Building Area Sold (Residential) YoYSales (Residential) YoY
Source: National Bureau of Statistics of China
See the last page for disclaimer Critical Sector Data Update 行业关键数据更新 15 December 2017 Page 12 of 24

Critical Sector Data Update
Sector: Insurance
Sector: New Energy
Figure 66 5-Y Sector Premiums YTD yoy
Figure 67 5-Y P&C Insurance Premiums YTD yoy
五年行业保费收入同比增长(月度累计) 五年财产险保费收入同比增长(月度累计)
Sector Premiums (RMB bn)
YTD YOY 19.9% mom (31.1%) yoy 4.8%
52w H / L 855.3 / 185.4
P&C Insurance
Premiums (RMB bn) YTD YOY 13.4% mom (13.2%) yoy 12.8%
52w H / L 97.4 / 56.1
0.0%
10.0%
20.0%
30.0%
40.0%
50.0%
60.0%
70.0%
80.0%
Jan Feb Mar Apr May Jun Jul Aug Sep Oct Nov Dec
2012 2013 2014
2015 2016 2017
0.0%
5.0%
10.0%
15.0%
20.0%
25.0%
Jan Feb Mar Apr May Jun Jul Aug Sep Oct Nov Dec
2012 2013 2014
2015 2016 2017
Note: Latest data in figures 66-67 are 10/2017. Source: China Insurance Regulatory Commission Source: China Insurance Regulatory Commission
Figure 68 5-Y Human Insurance Premiums YTD yoy
Figure 69 5-Y Life Insurance Premiums YTD yoy
五年人身险保费收入同比增长(月度累计) 五年寿险保费收入同比增长(月度累计)
Human Insurance Premiums (RMB bn)
YTD YOY 22.2% mom (38.8%) yoy 0.5%
52w H / L 758.0 / 110.0
Life Insurance
Premiums (RMB bn)
YTD YOY 26.2% mom (40.7%) yoy -4.9%
52w H / L 686.2 / 85.3
(10.0%)
0.0%
10.0%
20.0%
30.0%
40.0%
50.0%
60.0%
70.0%
80.0%
90.0%
100.0%
Jan Feb Mar Apr May Jun Jul Aug Sep Oct Nov Dec
2012 2013 2014
2015 2016 2017
(20.0%)
0.0%
20.0%
40.0%
60.0%
80.0%
100.0%
Jan Feb Mar Apr May Jun Jul Aug Sep Oct Nov Dec
2012 2013 2014
2015 2016 2017
Note: Latest data in figures 68-69 are 10/2017. Source: China Insurance Regulatory Commission Source: China Insurance Regulatory Commission
Figure 70 3-Y Photovoltaic Products Price Changes
三年光伏产品价格变动
Polysilicon Wafer Cell Module YTD YOY 4.4% -18.2% -22.9% -30.8%
wow 2.0% -0.3% 0.0% -0.3%
mom 3.9% -0.8% -1.0% -0.6%
52w H / L
0.09 / 0.07
0.16 / 0.13
0.22 / 0.19
0.38 / 0.31
0.0
0.1
0.2
0.3
0.4
0.5
0.6
0.7
Dec-14Apr-15 Aug-15Dec-15Apr-16 Aug-16Dec-16Apr-17 Aug-17Dec-17
USD/W Polysilicon Wafer Cell Module
Source: Pvinsight
See the last page for disclaimer Critical Sector Data Update 行业关键数据更新 15 December 2017 Page 13 of 24

Critical Sector Data Update
Sector: Telecom
Sector: Internet
Figure 71 10-Y Monthly Telecom Revenue
十年月度通信收入
Monthly Telecom
Revenue (RMB 100 Million)
YTD 16.46%
mom 1.3%
yoy 6.4%
52w H / L 1109 / 922
0
200
400
600
800
1,000
1,200
2008 2009 2010 2011 2012 2013 2014 2015 2016 2017
Monthly Telecom Revenue (RMB 100 Million)
Note: Latest data in figure 71 is 10/2017. Source: Ministry of Industry and Information Technology of the PRC
Figure 72 10-Y Telephone Call: Mobile Minutes (Monthly Accumulate YoY)
Figure 73 10-Y Monthly Tele Users YoY
十年移动电话通话时长,月度累计增长(同 比)
十年月度通信用户增长(同比)
Telephone Call: Mobile (incl
Local), Million Minutes
YoY -3.8%
YTD YoY -4.5% MoM -1.6% 52w H / L 421382.78/ 223012.17
Total Tele Users
(million)
Mobile Users
(million)
Fixed-line Users
(million) YoY 4.3% 6.3% -8.0%
YTD YoY 4.3% 6.3% -8.0%
MoM 0.5% 0.6% -0.6%
52w H / L 236997.45 / 113671.11
1403.436 / 1319.663
213.26 / 196.178
-30%-20%-10%
0%10%20%30%40%50%60%70%
2007 2008 2009 2010 2011 2012 2013 2014 2015 2016 2017
Telephone call: mobile (incl Local): YTD YoY
-15%
-10%
-5%
0%
5%
10%
15%
20%
25%
2007 2008 2009 2010 2011 2012 2013 2014 2015 2016 2017
Total Tele Users YoY Mobile Users YoY
Fixed-line Users YoY
Note: Latest data in figures 72-73 are 10/2017. Source: Ministry of Industry and Information Technology of the PRC
Source: Ministry of Industry and Information Technology of the PRC
Figure 74 1-Y Monthly Internet and Mobile Subscriber Additions
Figure 75 Quarterly Global Smartphone Shipments
一年月度互联网和移动用户增数 季度全球智能手机出货量
Internet
Subscriber Additions
Mobile Subscriber
Additions mom -35.4% -43.4%
yoy 76.7% -27.8%
52w H / L 965.5 / 36.7
2588.6 / -254.8
Global Smartphone Shipments
YoY 2.8%
QoQ 9.2%
0
200
400
600
800
1,000
1,200
-500
0
500
1,000
1,500
2,000
2,500
3,000
Oct-16 Dec-16 Jan-17 Feb-17 Mar-17 Apr-17 May-17 Jun-17 Jul-17 Aug-17 Sep-17 Oct-17
Monthly Mobile Internet Subscriber Additions (LHS)
Monthly Internet Subscriber Additions (RHS)
Ten Thousand Ten Thousand
-5%
0%
5%
10%
15%
20%
25%
30%
35%
0
50
100
150
200
250
300
350
400
450
Global smartphone shipments (LHS) YoY Growth (RHS)Million
Note: Latest data in figure 74 is 10/2017, for figure 75 is 3Q/2017.
Source: Ministry of Industry and Information Technology of the PRC
Source: IDC
See the last page for disclaimer Critical Sector Data Update 行业关键数据更新 15 December 2017 Page 14 of 24

Critical Sector Data Update
Sector: Health Care
Figure 76 China Retail Commodity E-commerce GMV Growth
Figure 77 China Retail Service E-commerce GMV Growth
中国实物电商交易金额增长 中国服务业零售电商交易金额增长
China Retail Commodity E-commerce
YoY 21.2%
MoM 48.5%
China Retail Service E-commerce
YoY 34.1%
MoM -0.8%
0.0%
5.0%
10.0%
15.0%
20.0%
25.0%
30.0%
35.0%
40.0%
0
100
200
300
400
500
600
700
800
1-2M
163M
164M
165M
166M
167M
168M
169M
1610
M16
11M
1612
M16
1-2M
173M
174M
175M
176M
177M
178M
179M
1710
M17
11M
17
(RMB Bn)
Commodity E-commerce GMV YoY
0.0%
10.0%
20.0%
30.0%
40.0%
50.0%
60.0%
70.0%
0
50
100
150
200
250
1-2M
163M
164M
165M
166M
167M
168M
169M
1610
M16
11M
1612
M16
1-2M
173M
174M
175M
176M
177M
178M
179M
1710
M17
11M
17
(RMB Bn)
Service E-commerce GMV YoY
Source: National Bureau of Statistics of China , Guotai Junan International
Source: National Bureau of Statistics of China , Guotai Junan International
Figure 78 5-Y China Growth Rate of Value-Added of Pharmaceutical Industry (Accumulative)
Figure 79 5-Y Antibiotic Intermediates Prices
五年中国医药制造业增加值增长速度 五年抗生素中间体价格
China Growth Rate of Value-Added of Pharmaceutical
Industry (Accumulative) mom 0.3 ppt yoy 1.5 ppt
52w H / L 12.3 / 10.7
6-APA 7-ADCA 7-ACA
(Enzymatic Method)
4-AA GCLE (Exported)
YTD YoY 33.8% 39.2% 4.7% -3.4% 16.2% mom 0.0% 0.0% 0.0% 0.0% 0.0% yoy 58.6% 69.5% 30.4% -3.8% 23.9%
52w H / L 230.0 / 162.5
500.0 / 310.0
480.0 / 330.0
925.0 / 890.0
355.2 / 299.4
6.07.08.09.0
10.011.012.013.014.015.016.0
Nov-12 Nov-13 Nov-14 Nov-15 Nov-16 Nov-17
%
0.0
100.0
200.0
300.0
400.0
500.0
600.0
700.0
800.0
900.0
1,000.0
Nov-12 Nov-13 Nov-14 Nov-15 Nov-16 Nov-17
6-APA 7-ADCA 7-ACA (Enzymatic Method)4-AA GCLE (Exported)
RMB/Kg
Source: National Bureau of Statistics of China Source: WIND
Figure 80 5-Y Chengdu Traditional Chinese Medicinal Materials Price Index
Figure 81 5-Y Domestic Vitamins Prices
五年中国成都中药材价格指数 五年国内维生素价格
Chengdu Traditional Chinese Medicinal
Materials Price Index YTD YoY 9.1% wow 0.7% mom 2.4% yoy 7.0%
52w H / L 168.87 / 158.02
VA VB1 VB2
(80%) VB6 VC
Powder VD3 VE VK3
(MSB96%) YTD YoY 12.7% 43.9% 1.8% 33.1% 135.5% 163.4% -27.1% 139.9%
wow 48.8% 0.0% 0.0% 9.8% 3.6% 13.7% -2.2% 0.0% mom 129.4% -5.5% 0.0% 8.7% 3.6% 24.1% 76.0% -3.3% yoy 354.5% 45.1% 69.8% 183.5% 38.1% 671.4% 39.2% 28.9% 52w H / L
1,250.0 / 123.5
630.0 / 355.0
450.0 / 155.0
560.0 / 197.5
72.5 / 50.0
540.0 / 0.0
117.5 / 39.0
165.0 / 112.5
100
110
120
130
140
150
160
170
180
Dec-12 Dec-13 Dec-14 Dec-15 Dec-16 Dec-17
0.0
200.0
400.0
600.0
800.0
1,000.0
1,200.0
1,400.0
Dec-12 Dec-13 Dec-14 Dec-15 Dec-16 Dec-17
VA VB1VB2 (80%) VB6VC Powder VD3VE VK3(MSB96%)
RMB/Kg
Source: Ministry of Commerce in the People's Republic of China
Source: China Feed Industry Association
See the last page for disclaimer Critical Sector Data Update 行业关键数据更新 15 December 2017 Page 15 of 24

Critical Sector Data Update
Sector: Household Products
Figure 82 3-Y Analgesic-Antipyretic Bulk Drugs Prices
Figure 83 3-Y ACEI and Sartans Bulk Drugs Prices
三年解热镇痛类原料药价格 三年普利类与沙坦类原料药价格
Ibuprofen
Aceta- minophen
Metami- zole Naproxen Aspirin Caffeine
YTD YoY 6.7% 19.3% 10.9% 4.5% 29.9% 37.8% mom 0.0% 3.3% 0.0% 12.1% 0.0% 0.0% yoy 10.0% 36.3% 20.3% 20.4% 36.3% 47.2%
52w H / L 110.0 / 97.5
31.0 / 23.0
71.0 / 61.0
325.0 / 270.0
31.0 / 25.5
92.0 / 62.5
Captopril Lisinopril
Enalapril Maleate
Irbe- sartan
Val- sartan
Telmi- sartan
YTD YoY 7.1% -5.9% -2.1% -0.9% -1.8% -3.6% mom 0.0% 0.0% 0.0% 0.0% 0.0% 0.0% yoy 16.9% 0.0% 0.0% 2.9% 1.6% 0.0%
52w H / L 380.0 / 325.0
4,750.0 / 4,750.0
510.0 / 505.0
540.0 / 525.0
635.0 / 625.0
1,250.0 / 1,200.0
0.0
50.0
100.0
150.0
200.0
250.0
300.0
350.0
0.0
20.0
40.0
60.0
80.0
100.0
120.0
Nov-14 Nov-15 Nov-16 Nov-17
Ibuprofen (RHS) Acetaminophen (RHS)Metamizole (RHS) Aspirin (RHS)Caffeine (RHS) Naproxen (RHS)
RMB/Kg
200.0
300.0
400.0
500.0
600.0
700.0
800.0
200.0
1,200.0
2,200.0
3,200.0
4,200.0
5,200.0
6,200.0
Nov-14 Nov-15 Nov-16 Nov-17
Lisinopril (LHS) Telmisartan (LHS)Captopril (RHS) Enalapril Maleate (RHS)Irbesartan (RHS) Valsartan (RHS)
RMB/Kg
Source: WIND Source: WIND
Figure 84 1-Y NBSK & BHKP Prices Figure 85 10-Y NBSK & BHKP Prices 一年北方漂白软木及硬木牛皮浆价格 十年北方漂白软木及硬木牛皮浆价格
NBSK (USD/ton)
BHKP (USD/ton)
YTD 23.3% 48.6%
YTD YoY 9.3% 16.6%
wow 2.61% 1.50%
mom 4.0% 3.1%
yoy 23.3% 48.4%
52w H / L 997 / 809
970 / 651
600
650
700
750
800
850
900
950
1,000
1,050
Dec-16 Feb-17 Apr-17 Jun-17 Aug-17 Oct-17 Dec-17
NBSK (USD/Metric Tonne)
BHKP (USD/Metric Tonne)
400
600
800
1,000
1,200
2006 2007 2008 2009 2010 2011 2012 2013 2014 2015 2016 2017
NBSK (USD/Metric Tonne)
BHKP (USD/Metric Tonne)
Source: Bloomberg Source: Bloomberg
Figure 86 7-Y CUS Prices Figure 87 9-Y OCC Prices 七年中国硬木牛皮浆价格 九年美国废纸价格
CUS (USD/ton)
YTD 42.6%
YTD YoY 24.0%
wow 0.57%
mom 2.7%
yoy 44.9%
52w H / L 753 / 524
OCC (EUR/ton)
YTD 1.9%
YTD YoY 12.9%
wow -0.75%
mom -0.8%
yoy 0.2%
52w H / L 159 / 131
300
400
500
600
700
800
900
2010 2011 2012 2013 2014 2015 2016 2017
CUS (USD/Metric Tonne)
0
50
100
150
200
2008 2009 2010 2011 2012 2013 2014 2015 2016 2017
OCC (EUR/Metric Tonne)
Source: Bloomberg Source: Bloomberg
See the last page for disclaimer Critical Sector Data Update 行业关键数据更新 15 December 2017 Page 16 of 24

Critical Sector Data Update
Sector: Consumer (Food & Beverage)
Figure 88 7-Y Raw Milk Prices Figure 89 7-Y Flour Prices 七年生鲜乳价格 七年面粉价格
Raw Milk (RMB/kg)
YTD 0.0%
YTD YoY 0.3%
wow 0.3%
mom 0.6%
yoy 0.6%
52w H / L 3.55 / 3.40
Flour (RMB/kg)
YTD -2.7%
YTD YoY 13.4%
wow 0.0%
mom -0.3%
yoy 0.9%
52w H / L 3.65 / 3.54
2.0
2.5
3.0
3.5
4.0
4.5
2010 2011 2012 2013 2014 2015 2016 2017
Raw Milk Price (RMB/kg)
1.5
2.0
2.5
3.0
3.5
4.0
2010 2011 2012 2013 2014 2015 2016 2017
Flour Price (RMB/kg)
Source: Ministry of Agriculture of the PRC Source: Ministry of Agriculture of the PRC
Figure 90 9-Y Hog & Pork Prices Figure 91 7-Y Hog Inventory 九年生猪及猪肉价格 七年生猪存栏头数
Hog (RMB/kg) Pork (RMB/kg)
YTD -13.7% -13.8%
YTD YoY -19.4% -8.4%
wow 3.3% 1.5%
mom 6.0% 4.2%
yoy -11.2% -13.5%
52w H / L 18 / 13
26 / 21
Hog Inventory
(mn heads)
YTD -2.1%
YTD YoY -5.2%
mom -0.2%
yoy -7.4%
52w H / L 374.8/ 349.2
0
5
10
15
20
25
30
35
2008 2009 2010 2011 2012 2013 2014 2015 2016 2017
Hog Price (RMB/kg) Pork Price (RMB/kg)
300
320
340
360
380
400
420
440
460
480
500
2010 2011 2012 2013 2014 2015 2016 2017
Hog Inventory (mn heads)
Note: Latest data in figure 91 is 10/2017. Source: China Animal Agriculture Association Source: The Central People’s Government of the PRC
Figure 92 1-Y Palm Oil Prices Figure 93 10-Y Palm Oil Prices 一年棕榈油价格 十年棕榈油价格
Palm Oil (MYR/ton)
YTD -27.0%
YTD YoY 6.6%
wow -3.5%
mom -13.1%
yoy -25.7%
52w H / L 3,306 / 2,349
1,600
1,800
2,000
2,200
2,400
2,600
2,800
3,000
3,200
3,400
3,600
Dec-16 Feb-17 Apr-17 Jun-17 Aug-17 Oct-17 Dec-17
Palm Oil Price (MYR/Metric Tonne)
0
1,000
2,000
3,000
4,000
5,000
2007 2008 2009 2010 2011 2012 2013 2014 2015 2016 2017
Palm Oil Price (MYR/Metric Tonne)
Source: Malaysia Derivatives Exchange Source: Malaysia Derivatives Exchange
See the last page for disclaimer Critical Sector Data Update 行业关键数据更新 15 December 2017 Page 17 of 24

Critical Sector Data Update
Figure 94 1-Y PET Resin Prices Figure 95 10-Y PET Resin Prices 一年聚酯切片价格 十年聚酯切片价格
PET Resin (RMB/ton)
YTD -0.3%
YTD YoY 20.7%
wow -0.6%
mom -1.0%
yoy -0.3%
52w H / L 7,975.00 / 6,375.00
5,000
5,500
6,000
6,500
7,000
7,500
8,000
8,500
Dec-16 Feb-17 Apr-17 Jun-17 Aug-17 Oct-17 Dec-17
PET Resin Price (RMB/Tonne)
4,000
6,000
8,000
10,000
12,000
14,000
16,000
2007 2008 2009 2010 2011 2012 2013 2014 2015 2016 2017
PET Resin Price (RMB/Tonne)
Source: China Chemical & Fiber Economic Information
Network Source: China Chemical & Fiber Economic Information Network
Figure 96 1-Y Sugar Prices Figure 97 10-Y Sugar Prices 一年白糖价格 十年白糖价格
Sugar (RMB/ton)
YTD -3.0%
YTD YoY 13.7%
wow -0.8%
mom -0.2%
yoy -5.7%
52w H / L 6,910 / 6,325
5,000
5,500
6,000
6,500
7,000
7,500
Dec-16 Feb-17 Apr-17 Jun-17 Aug-17 Oct-17 Dec-17
Sugar Price (RMB/Tonne)
1,500
3,000
4,500
6,000
7,500
9,000
2007 2008 2009 2010 2011 2012 2013 2014 2015 2016 2017
Sugar Price (RMB/Tonne)
Source: Bloomberg Source: Bloomberg
Figure 98 7-Y Soybean & Soybean Oil Prices
Figure 99 7-Y Corn, Peanut & Rapeseed Prices
七年大豆及大豆油价格 七年玉米、花生及油菜籽价格
Soybean (RMB/ton)
Soybean Oil
(RMB/ton)
Soybean Oil: 5L Pack (RMB/ton)
YTD -3.5% -21.3% -1.7%
YTD YoY 2.4% -0.8% -0.7%
wow 0.0% -0.5% -0.1%
mom 0.1% -3.9% 0.5%
yoy -3.1% -21.5% -1.2%
52w H / L 3,739 / 3,496
7,502 / 5,708
10,090 / 9,820
Peanut
(RMB/ton) Rapeseed (RMB/ton)
Corn (RMB/ton)
YTD -10.5% -2.2% 5.5%
YTD YoY -3.1% 13.8% -6.6%
wow 0.1% -0.2% 0.5%
mom -0.6% 2.6% 2.1%
yoy -10.5% 10.5% 2.3%
52w H / L 9,396 / 7,768
5,640 / 4,600
1,704 / 1,508
4,000
6,000
8,000
10,000
12,000
14,000
2,500
3,000
3,500
4,000
4,500
5,000
2010 2011 2012 2013 2014 2015 2016 2017
Soybean (RMB/ton) - LHS
Soybean Oil (RMB/ton) - RHS
Soybean Oil: 5L Pack (RMB/ton) - RHS
0
2,500
5,000
7,500
10,000
12,500
15,000
0
1,000
2,000
3,000
4,000
5,000
6,000
2010 2011 2012 2013 2014 2015 2016 2017
Corn Price (RMB/ton) - LHSRapeseed Price (RMB/ton) - LHSPeanut Price (RMB/ton) - RHS
Source: National Bureau of Statistics of China, Ministry of Agriculture of the PRC
Source: www.cngrain.com
See the last page for disclaimer Critical Sector Data Update 行业关键数据更新 15 December 2017 Page 18 of 24
Critical Sector Data Update
Sector: Banking
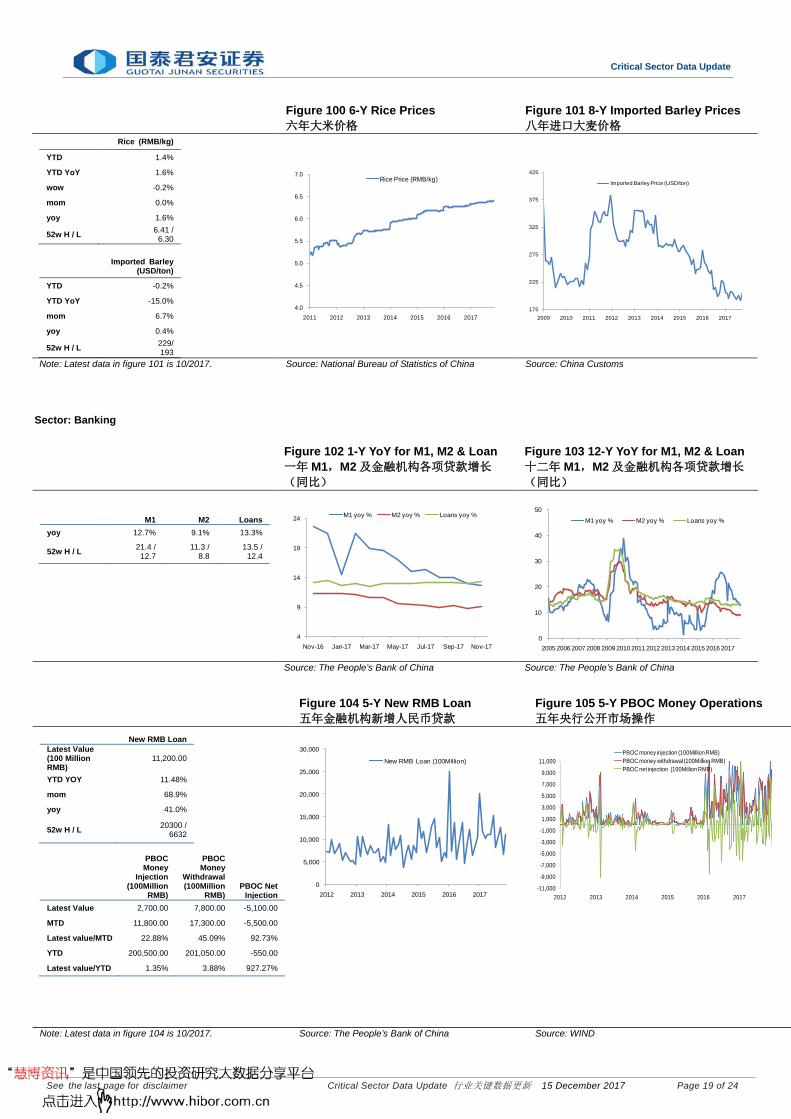
Figure 100 6-Y Rice Prices Figure 101 8-Y Imported Barley Prices 六年大米价格 八年进口大麦价格
Rice (RMB/kg)
YTD 1.4%
YTD YoY 1.6%
wow -0.2%
mom 0.0%
yoy 1.6%
52w H / L 6.41 / 6.30
Imported Barley
(USD/ton)
YTD -0.2%
YTD YoY -15.0%
mom 6.7%
yoy 0.4%
52w H / L 229/ 193
4.0
4.5
5.0
5.5
6.0
6.5
7.0
2011 2012 2013 2014 2015 2016 2017
Rice Price (RMB/kg)
175
225
275
325
375
425
2009 2010 2011 2012 2013 2014 2015 2016 2017
Imported Barley Price (USD/ton)
Note: Latest data in figure 101 is 10/2017. Source: National Bureau of Statistics of China Source: China Customs
Figure 102 1-Y YoY for M1, M2 & Loan Figure 103 12-Y YoY for M1, M2 & Loan 一年 M1,M2 及金融机构各项贷款增长 (同比)
十二年 M1,M2 及金融机构各项贷款增长 (同比)
M1 M2 Loans
yoy 12.7% 9.1% 13.3%
52w H / L 21.4 / 12.7
11.3 / 8.8
13.5 / 12.4
4
9
14
19
24
Nov-16 Jan-17 Mar-17 May-17 Jul-17 Sep-17 Nov-17
M1 yoy % M2 yoy % Loans yoy %
0
10
20
30
40
50
2005 2006 2007 2008 2009 2010 2011 2012 2013 2014 2015 2016 2017
M1 yoy % M2 yoy % Loans yoy %
Source: The People’s Bank of China Source: The People’s Bank of China
Figure 104 5-Y New RMB Loan Figure 105 5-Y PBOC Money Operations 五年金融机构新增人民币贷款 五年央行公开市场操作
New RMB Loan
Latest Value (100 Million RMB)
11,200.00
YTD YOY 11.48%
mom 68.9%
yoy 41.0%
52w H / L 20300 / 6632
PBOC Money
Injection (100Million
RMB)
PBOC Money
Withdrawal (100Million
RMB) PBOC Net
Injection Latest Value 2,700.00 7,800.00 -5,100.00
MTD 11,800.00 17,300.00 -5,500.00
Latest value/MTD 22.88% 45.09% 92.73%
YTD 200,500.00 201,050.00 -550.00
Latest value/YTD 1.35% 3.88% 927.27%
0
5,000
10,000
15,000
20,000
25,000
30,000
2012 2013 2014 2015 2016 2017
New RMB Loan (100Million)
-11,000
-9,000
-7,000
-5,000
-3,000
-1,000
1,000
3,000
5,000
7,000
9,000
11,000
2012 2013 2014 2015 2016 2017
PBOC money injection (100Million RMB)PBOC money withdrawal (100Million RMB)PBOC net injection (100Million RMB)
Note: Latest data in figure 104 is 10/2017. Source: The People’s Bank of China Source: WIND
See the last page for disclaimer Critical Sector Data Update 行业关键数据更新 15 December 2017 Page 19 of 24

Critical Sector Data Update
Sector: Infrastructure, Toll Roads
Figure 106 1-Y Shibor Figure 107 8-Y Shibor 一年上海银行间同业拆放利率 八年上海银行间同业拆放利率
Overnight 1-week 1-month
wow (pts) 0.116 0.072 0.148
mom (pts) -0.082 -0.015 0.565
yoy (pts) 0.413 0.366 1.457
52w H / L 2.938 / 2.094
2.968 / 2.39
4.699 / 3.125
0
1
2
3
4
5
6
Dec
/16
Jan/
17
Feb/
17
Mar
/17
Apr
/17
May
/17
Jun/
17
Jul/1
7
Aug
/17
Sep
/17
Oct
/17
Nov
/17
Dec
/17
%1-week 1-month
3-month overnight
0
2
4
6
8
10
12
14
16
2009 2010 2011 2012 2013 2014 2015 2016 2017
%
overnight 1-week1-month 3-month
Source: The People’s Bank of China Source: The People’s Bank of China
Figure 108 1-Y Transportation FAI Figure 109 7-Y Transportation FAI 一年各项交通固定资产投资增长(累计同
比) 七年各项交通固定资产投资增长(累计同
比)
Railway Highway
Inland River
mom 0.9% -4.7% -3.8%
YoY 57.2% 14.6% -7.9%
YTD yoy 0.5% 21.1% 5.2%
52w H / L 20.5% / -3.7%
36.0% / 2.3%
9.4% / -15.6%
Coastal Area Others
Total - Exclude Railway
mom -25.0% 113.4% -3.8%
YoY -41.4% 88.2% 12.9%
YTD yoy -21.9% -32.2% 17.5%
52w H / L 25.1% / -26.0%
112.2% / -54.6%
33.9% / 0.4%
-80%-60%-40%-20%0%20%40%60%80%100%120%140%
-30%
-20%
-10%
0%
10%
20%
30%
40%
Nov-16 Feb-17 May-17 Aug-17 Nov-17
Railway (Cumulative YoY)Highway (Cumulative YoY)Inland River (Cumulative YoY)Coastal Area (Cumulative YoY)Total - Exclude Railway (Cumulative YoY)Others (Cumulative YoY) (RHS)
-200%
-100%
0%
100%
200%
300%
400%
500%
-100%
-50%
0%
50%
100%
150%
200%
2010-11 2011-11 2012-11 2013-11 2014-11 2015-11 2016-11 2017-11
Railway (Cumulative YoY)Highway (Cumulative YoY)Inland River (Cumulative YoY)Coastal Area (Cumulative YoY)Total - Exclude Railway (Cumulative YoY)Others (Cumulative YoY) (RHS)
Source: National Bureau of Statistics of China, China Railway Corporation
Source: National Bureau of Statistics of China, China Railway Corporation
Figure 110 1-Y Urban FAI Figure 111 12-Y Urban FAI 一年城镇各产业固定资产投资增长(累计同
比) 十二年城镇各产业固定资产投资增长(累
计同比)
Total Urban
Primary Industry
Secondary Industry
Tertiary Industry
yoy 5.8% 8.7% 0.8% 8.9%
YTD yoy 7.2% 11.4% 2.6% 10.1%
52w H / L
9.2% / 7.2%
21.9% / 11.4%
4.2% / 2.6%
12.2% / 10.0%
0%
5%
10%
15%
20%
25%
30%
Nov-16 Jan-17 Mar-17 May-17 Jul-17 Sep-17 Nov-17
Total Urban FAI (Cumulative YoY)Primary Industry (Cumulative YoY)Secondary Industry (Cumulative YoY)Tertiary Industry (Cumulative YoY)
-30%
10%
50%
90%
130%
2004 2005 2006 2007 2008 2009 2010 2011 2012 2013 2014 2015 2016 2017
Total Urban FAI (Cumulative YoY)Primary Industry (Cumulative YoY)Secondary Industry (Cumulative YoY)Tertiary Industry (Cumulative YoY)
Source: National Bureau of Statistics of China Source: National Bureau of Statistics of China
See the last page for disclaimer Critical Sector Data Update 行业关键数据更新 15 December 2017 Page 20 of 24

Critical Sector Data Update
Sector: Consumer (Retailing)
Sector: Consumer (Apparel)
Figure 112 1-Y Transportation Statistics Figure 113 8-Y Transportation Statistics
一年公路旅客货运量统计 八年公路旅客货运量统计
Passenger Number
Freight Volume
Freight
Turnover YTD YOY -5.4% 10.6% 9.5%
mom -9.9% 6.6% 7.3%
yoy -4.3% 9.8% 7.0%
52w H / L
13.8 / 11.4
35.2 / 17.9
6388.8 / 3178.2
-15%
-5%
5%
15%
25%
35%
Nov-16 Feb-17 May-17 Aug-17 Nov-17
Passenger Number YoY
Freight Volume YoY
Freight Turnover YoY
-50%
-30%
-10%
10%
30%
50%
70%
Nov-09 Jul-10 Mar-11Nov-11 Jul-12 Mar-13Nov-13 Jul-14 Mar-15Nov-15 Jul-16 Mar-17Nov-17
Passenger Number YoY
Freight Volume YoY
Freight Turnover YoY
Source: National Bureau of Statistics of China Source: National Bureau of Statistics of China
Figure 114 10-Y Monthly Social Retail Sales YoY
Figure 115 Yearly Comparison of Social Retail Sales Growth
十年社会消费品零售总额月度同比 社会消费品零售总额年度增速对比
Retail Sales Growth: Monthly
YTD YOY 10.3%
mom 0.83%
yoy 10.2%
52w H / L 11.0% / 9.5%
0
5
10
15
20
25
Nov/07 Nov/08 Nov/09 Nov/10 Nov/11 Nov/12 Nov/13 Nov/14 Nov/15 Nov/16 Nov/17
%
7
9
11
13
15
17
19
21
23
25
Jan
Feb
Mar
Apr
May Jun
Jul
Aug
Sep Oct
Nov
Dec
% 2006
2007
2008
2009
2010
2011
2012
2013
2014
2015
2016
2017
Source: National Bureau of Statistics of China Source: National Bureau of Statistics of China
Figure 116 5-Y Retail Sales Growth of Clothing and Textile above Designated Size Monthly YoY
五年限额以上服装鞋帽零售额月度同比
Retail sales growth of
clothing and textile YTD YOY 7.6%
yoy 9.5%
52w H / L 10.0% / 6.1%
1%
6%
11%
16%
21%
26%
31%
36%
41%
Nov
-12
Mar
-13
Jul-1
3
Nov
-13
Mar
-14
Jul-1
4
Nov
-14
Mar
-15
Jul-1
5
Nov
-15
Mar
-16
Jul-1
6
Nov
-16
Mar
-17
Jul-1
7
Nov
-17
The retail sales growth of clothing and textile YoY
Source: National Bureau of Statistics of China
See the last page for disclaimer Critical Sector Data Update 行业关键数据更新 15 December 2017 Page 21 of 24

Critical Sector Data Update
Sector: Gaming
Data Last Updated on 15 / 12 / 2017 数据最后更新于 2017 年 12 月 15 日
Figure 117 1-Y China Cotton Price Index
Figure 118 3-Y China Cotton Price Index
一年国内棉花价格指数 三年国内棉花价格指数 China Cotton Index
YTD 0.0%
YTD YOY 16.9%
wow -0.3%
mom -1.2%
yoy -1.0%
52w H / L 16083 / 15769
15,200
15,400
15,600
15,800
16,000
16,200
Dec-16 Feb-17 Apr-17 Jun-17 Aug-17 Oct-17 Dec-17 10,000
15,000
20,000
Dec/14 Jun/15 Dec/15 Jun/16 Dec/16 Jun/17 Dec/17
Source: China Cotton Association Source: China Cotton Association
Figure 119 5-Y Macau Quarterly Gross Gaming Revenue yoy Growth
Figure 120 5-Y Macau Quarterly Gross Gaming Revenue qoq Growth
五年澳门季度博彩收入同比增长 五年澳门季度博彩收入季环比增长
Quarterly Total
Gross Gaming
Revenue (MOP mn)
Quarterly VIP Gross
Gaming Revenue
(MOP mn)
Quarterly Mass
Gross Gaming
Revenue (MOP mn)
Latest data 67,002 38,687 28,315
YTD YOY 18.8% 28.5% 8.0%
qoq 6.5% 7.9% 4.7%
yoy 21.8% 34.8% 8.1%
52w H / L 67,002.0 / 60,418.0
38,687.0 / 33,333.0
28,315.0 / 27,040.0
-50.0%
-40.0%
-30.0%
-20.0%
-10.0%
0.0%
10.0%
20.0%
30.0%
40.0%
Dec
/12
Mar
/13
Jun/
13S
ep/1
3D
ec/1
3M
ar/1
4Ju
n/14
Sep
/14
Dec
/14
Mar
/15
Jun/
15S
ep/1
5D
ec/1
5M
ar/1
6Ju
n/16
Sep
/16
Dec
/16
Mar
/17
Jun/
17S
ep/1
7
Quarterly Macau Gross Gaming Revenue (yoy)Quarterly VIP Gross Gaming Revenue (yoy)Quarterly Mass Gross Gaming Revenue (yoy)
-20.0%
-15.0%
-10.0%
-5.0%
0.0%
5.0%
10.0%
15.0%
20.0%
Dec
/12
Mar
/13
Jun/
13
Sep
/13
Dec
/13
Mar
/14
Jun/
14
Sep
/14
Dec
/14
Mar
/15
Jun/
15
Sep
/15
Dec
/15
Mar
/16
Jun/
16
Sep
/16
Dec
/16
Mar
/17
Jun/
17
Sep
/17
Quarterly Macau Gross Gaming Revenue (qoq)Quarterly VIP Gross Gaming Revenue (qoqQuarterly Mass Gross Gaming Revenue (qoq)
Note: Latest data for figures 119-120 are 09/2017. Source: Gaming Inspection and Coordination Bureau of
Macao SAR Source: Gaming Inspection and Coordination Bureau of Macao SAR
Figure 121 1-Y Macau Monthly Gross Gaming Revenue & Visitor Arrivals
Figure 122 1-Y Macau Monthly Gross Gaming Revenue & Visitor Arrivals Growth (YoY)
一年澳门月度博彩总收入和入境旅客 一年澳门月度博彩总收入和入境旅客增长 (同比)
Monthly Total
Gross Gaming
Revenue (MOP mn)
Monthly Total
Visitor Arrivals
(Thousand)
Monthly Mainland
China Visitor
Arrivals (Thousand)
Latest data 23,033
2,889
2,059
YTD YOY 19.5% 4.6% 7.0%
mom -13.5% 16.2% 19.6%
yoy 22.6% 7.9% 12.8%
52w H / L 26,633.0 / 19,255.0
2,918.0 / 2,378.6
2,058.5 / 1,544.2
0
500
1,000
1,500
2,000
2,500
3,000
3,500
0
5,000
10,000
15,000
20,000
25,000
30,000
Monthly Macau Gross Gaming Revenue (Left)Monthly Total Visitor Arrivals (Right)Monthly Mainland China Visitor Arrivals (Right)
MOP million Thousand
-10%
-5%
0%
5%
10%
15%
20%
25%
30%
35%
Monthly Macau Gross Gaming Revenue (yoy)Monthly Total Visitor Arrivals (yoy)Monthly Mainland China Visitor Arrivals (yoy)
Note: Latest data for Monthly Macau Gross Gaming Revenue is 11/2017; for Monthly Total Visitor Arrivals and Monthly Mainland China Visitor Arrivals are 10/2017.
Source: Gaming Inspection and Coordination Bureau of Macao SAR
Source: Gaming Inspection and Coordination Bureau of Macao SAR
See the last page for disclaimer Critical Sector Data Update 行业关键数据更新 15 December 2017 Page 22 of 24

Critical Sector Data Update
Research Department 研究部
Grace Liu 刘 谷 Head of Research, MarketStrategy, Petrochemicals
主管,市场策略、石化 [email protected] (852) 2509 7516
Noah Hudson Noah Hudson Consumer (Hotels), Gaming 消费(酒店)、博彩 [email protected] (86755) 23976684
Gary Wong 黄家玮 Environmental Protection,Infrastructure
环保、基建 [email protected] (852) 2509 2616
Square Chui 徐惠芳 Futures 期货 [email protected] (852) 2509 2629
Kevin Guo 郭 勇 Raw Materials, Gas 原材料、燃气 [email protected] (86755) 23976671
Ricky Lai 黎柏坚 Telecommunications, Internet 电信、互联网 [email protected] (852) 2509 2603
Richard Cao 曹 柱 Banking 银行 [email protected] (86755) 23976870
Jun Zhu 朱俊杰 Solar, Electric Equipment 太阳能、电力设备 [email protected] (852) 2509 7592
Andrew Song 宋 涛 Consumer (Retailing),Home Appliances
消费(零售)、家电 [email protected] (852) 2509 5313
Van Liu 刘斐凡 Property 房地产 [email protected] (86755) 23976672
Sean Xiang 向宇豪 Machinery, Construction Materials 机械、建材 [email protected] (86755) 23976725
Terry Hong 洪学宇 Consumer (Apparel) 消费(服装) [email protected] (86755) 23976722
Johnny Wong 王俊浩 Macroeconomics, Property 宏观、房地产 [email protected] (852) 2509 5348
Toliver Ma 马守彰 Aviation,Automobiles & Components
航空、汽车 [email protected] (852) 2509 5317
Spencer Fan 范明 Shipping & Logistics, Ports, 航运物流、港口 [email protected] (86755) 23976686
Barney Wu 吴宇扬 Consumer (Food & Beverage,Household Products)
消费(食品饮料、日用品) [email protected] (86755) 23976680
Gary Ching 程嘉伟 Market Strategy 市场策略 [email protected] (852) 2509 2665
Jake Wang 汪昌江 Wind & others, Market Strategy 风电及其他、市场策略 [email protected] (86755) 23976675
Wiley Huang 黄重钧 Insurance, Fixed-income 保险、债券 [email protected] (852) 2509 5409
David Liu 刘静骁 Petrochemicals 石化 [email protected] (852) 2509 5441
Kay Mai 麦梓琪 Health care 医药 [email protected] (86755) 23976685
Danny Law 罗沛达 Conglomerate, E-commerce 综合、电子商务 [email protected] (852) 2509 7768
Gary Yang 杨光 Research Assistant 研究助理 [email protected] (852) 2509 2642
Danny Deng 邓协 Research Assistant 研究助理 [email protected] (852) 2509 5464
Jason Zhou 周桓葳 Research Assistant 研究助理 [email protected] (852) 2509 5347
David Feng 冯廷帅 Research Assistant 研究助理 [email protected] (852) 2509 2113
Esabella Zhao 赵舒蔓 Research Assistant, Translator 研究助理、翻译员 [email protected] (86755) 23976681
Penny Pan 潘凌蕾 Secretary, Translator 秘书、翻译员 [email protected] (852) 2509 2632
See the last page for disclaimer Critical Sector Data Update 行业关键数据更新 15 December 2017 Page 23 of 24

Critical Sector Data Update
Company Rating Definition The Benchmark: Hong Kong Hang Seng Index / NASDAQ Composite Index
Time Horizon: 6 to 18 months
Rating Definition
Buy Relative Performance >15%; or the fundamental outlook of the company or sector is favorable.
Accumulate Relative Performance is 5% to 15%; or the fundamental outlook of the company or sector is favorable.
Neutral Relative Performance is -5% to 5%; or the fundamental outlook of the company or sector is neutral.
Reduce Relative Performance is -5% to -15%; or the fundamental outlook of the company or sector is unfavorable.
Sell Relative Performance <-15%; or the fundamental outlook of the company or sector is unfavorable.
Sector Rating Definition The Benchmark: Hong Kong Hang Seng Index / NASDAQ Composite Index
Time Horizon: 6 to 18 months
Rating Definition
Outperform Relative Performance >5%; or the fundamental outlook of the sector is favorable.
Neutral Relative Performance is -5% to 5%; or the fundamental outlook of the sector is neutral.
Underperform Relative Performance <-5%; or the fundamental outlook of the sector is unfavorable.
DISCLOSURE OF INTERESTS (1) Except for Shenzhen International Holdings Limited (00152 HK), the Analysts and their associates do not serve as an officer of the issuer mentioned in this
Research Report. (2) The Analysts and their associates do not have any financial interests in relation to the issuer mentioned in this Research Report. (3) Except for Except for GUOTAI JUNAN I (01788 HK),BINHAI INVESTMENT (02886 HK),CAM SCSMALLCAP (03157 HK),LINK HOLDINGS (08237 HK),
GFI MSCI A I-R (CNY) (83156 HK),GFI MSCI A I (03156 HK),Guotai Junan and its group companies do not hold equal to or more than 1% of the market capitalization of the issuer mentioned in this Research Report.
(4) Guotai Junan and its group companies have had investment banking relationships with Binhai Investment (02886 HK) / TANSH Global Food (03666 HK) / China South City (01668 HK) / Guangzhou R&F Properties- H shares (02777 HK) / Tianyun International (06836 HK) / Country Garden (02007 HK) / China Minsheng Banking Corp.- H shares (01988 HK) / Sino Biopharmaceutical (01177 HK) / Huaneng Renewables- H shares (00958 HK) / Huaneng Power- H shares (00902 HK) / Charmacy Pharmaceutical- H shares (02289 HK) / Huishang Bank- H shares (03698 HK) / Powerlong Real Estate (01238 HK) / Modern Land (01107 HK) / SMI Holdings Group (00198 HK) / Evergrande Real Estate (03333 HK) / GOME Electrical Appliances (00493 HK) / Guotai Junan Securities- H shares (02611 HK) / Dongjiang Environmental- H shares (00895 HK) / China Singyes Solar Technologies (00750 HK) / China Wood Optimization (01885 HK) / China Aoyuan Property (03883 HK) / Dali Foods (03799 HK) / 3SBio (01530 HK) / Sundart Holdings Ltd. (01568 HK) mentioned in this Research Report within the preceding 12 months.
(5) Guotai Junan and its group companies are not making a market in the securities mentioned in this Research Report. (6) Guotai Junan and its group companies have not employed an individual serving as an officer of any issuers mentioned in this Research Report. There is no
officer of any issuers mentioned in this Research Report associated with Guotai Junan and its group companies. DISCLAIMER This Research Report does not constitute an invitation or offer to acquire, purchase or subscribe for securities by Guotai Junan Securities (Hong Kong) Limited ("Guotai Junan"). Guotai Junan and its group companies may do business that relates to companies covered in research reports, including investment banking, investment services, etc. (for example, the placing agent, lead manager, sponsor, underwriter or invest proprietarily). Any opinions expressed in this report may differ or be contrary to opinions or investment strategies expressed orally or in written form by sales persons, dealers and other professional executives of Guotai Junan group of companies. Any opinions expressed in this report may differ or be contrary to opinions or investment decisions made by the asset management and investment banking groups of Guotai Junan. Though best effort has been made to ensure the accuracy of the information and data contained in this Research Report, Guotai Junan does not guarantee the accuracy and completeness of the information and data herein. This Research Report may contain some forward-looking estimates and forecasts derived from the assumptions of the future political and economic conditions with inherently unpredictable and mutable situation, so uncertainty may contain. Investors should understand and comprehend the investment objectives and its related risks, and where necessary consult their own financial advisers prior to any investment decision. This Research Report is not directed at, or intended for distribution to or use by, any person or entity who is a citizen or resident of or located in any jurisdiction where such distribution, publication, availability or use would be contrary to applicable law or regulation or which would subject Guotai Junan and its group companies to any registration or licensing requirement within such jurisdiction. © 2017 Guotai Junan Securities (Hong Kong) Limited. All Rights Reserved. 27/F., Low Block, Grand Millennium Plaza, 181 Queen’s Road Central, Hong Kong. Tel.: (852) 2509-9118 Fax: (852) 2509-7793 Website: www.gtja.com.hk
See the last page for disclaimer Critical Sector Data Update 行业关键数据更新 15 December 2017 Page 24 of 24