croda international plc 2012 preliminary results
TRANSCRIPT

Croda International Plc
2012 Preliminary Results
26 February 2013

Introduction
Steve Foots – Group Chief Executive

Strong performance in tough environment
Sales up 2.3% to £1051.9m
Operating profit up 7.4% to £255.4m
Pre-tax profit up 6.6% to £253.2m
Record ROS, up 1.2% points to 24.3%
Earnings per share up 8.2% to 130p
Dividend increased by 8.2% to 59.5p (payout ratio of 46%)
3
Results confirm the resilience of Croda’s business model and strategy
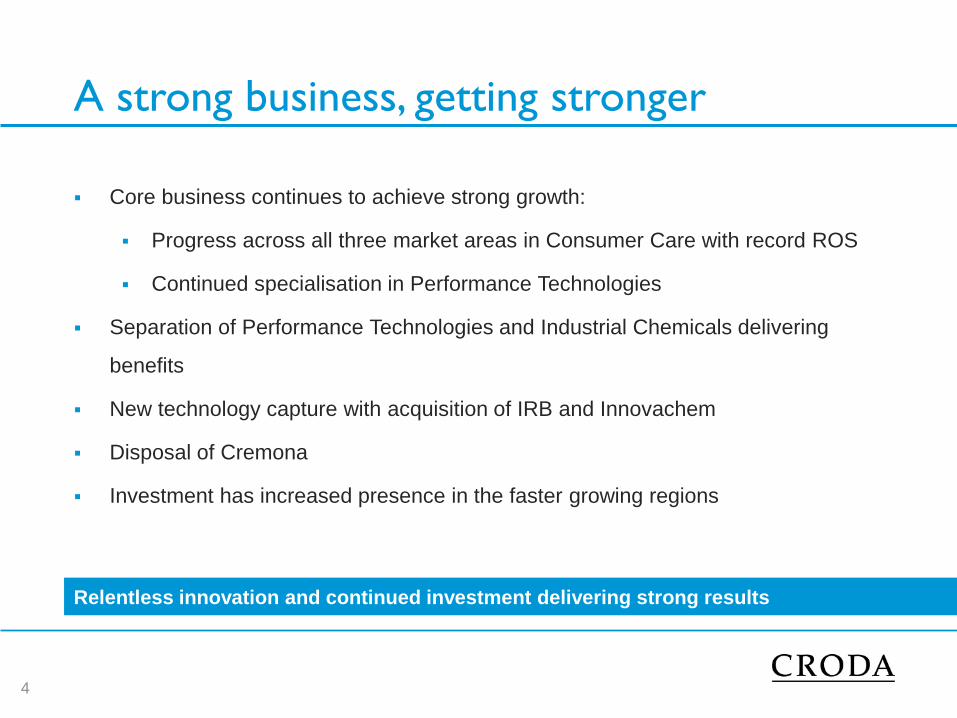
A strong business, getting stronger
Core business continues to achieve strong growth:
Progress across all three market areas in Consumer Care with record ROS
Continued specialisation in Performance Technologies
Separation of Performance Technologies and Industrial Chemicals delivering
benefits
New technology capture with acquisition of IRB and Innovachem
Disposal of Cremona
Investment has increased presence in the faster growing regions
4
Relentless innovation and continued investment delivering strong results

Financial Review
Sean Christie – Group Finance Director

2012 Q4 results

Q4 sales by segment
£m 2012 2011 Growth
Consumer Care 136.3 134.4 +1.4%
Performance Technologies 83.9 81.7 +2.7%
Industrial Chemicals 19.9 18.9 +5.3%
Total turnover 240.1 235.0 +2.2%
Good underlying sales growth in all three segments reduced by currency
translation
7

Sales trends v 2011
8
Q1 Q2 Q3 Q4 Year
Volume -0.7% +2.4% +8.8% +11.7% +5.1%
Price/mix +6.3% +1.0% -5.6% -6.0% -0.7%
Underlying +5.6% +3.4% +3.2% +5.7% +4.4%
Currency -0.2% -2.3% -2.8% -3.7% -2.2%
Acquisition - - +0.1% +0.2% +0.1%
Continuing
sales +5.4% +1.1% +0.5% +2.2% +2.3%
Underlying sales growth steadily improving post Q2
Currency translation headwind increased through 2012
2nd half growth in Industrial Chemicals flatters volumes and weakens mix
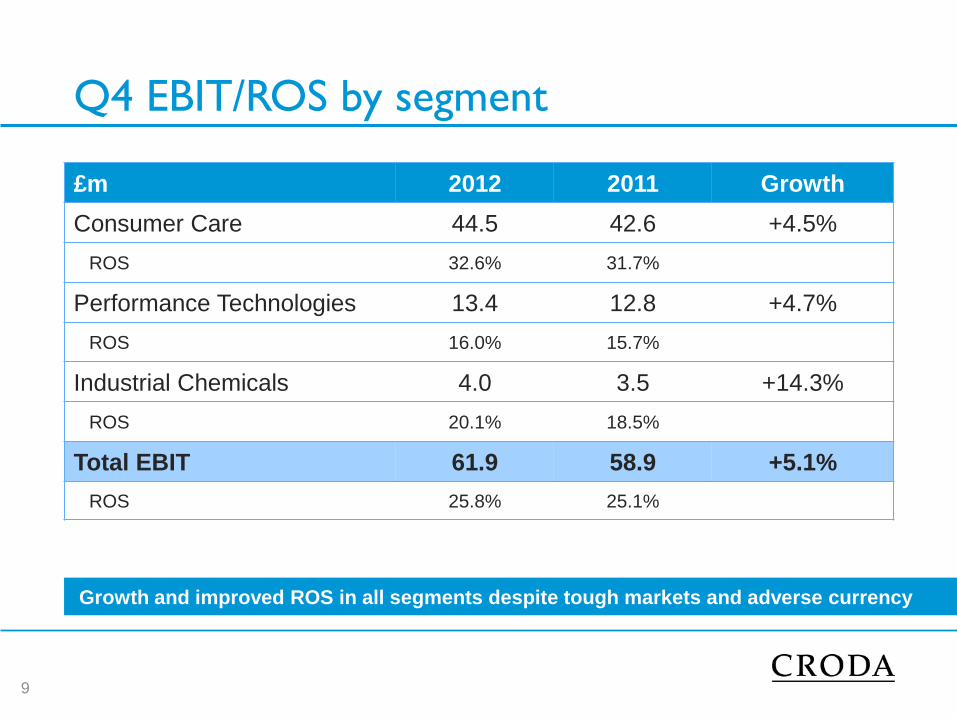
Q4 EBIT/ROS by segment
£m 2012 2011 Growth
Consumer Care 44.5 42.6 +4.5%
ROS 32.6% 31.7%
Performance Technologies 13.4 12.8 +4.7%
ROS 16.0% 15.7%
Industrial Chemicals 4.0 3.5 +14.3%
ROS 20.1% 18.5%
Total EBIT 61.9 58.9 +5.1%
ROS 25.8% 25.1%
9
Growth and improved ROS in all segments despite tough markets and adverse currency

2012 preliminary results

2012 turnover by destination
38%
26%
18%
10%
8%
W. Europe -1%
N. America +5%
Asia +3%
LATAM +4%
Other emergingmarkets* +8%
Good sales growth in Asia
and Latam in high end
products, partially obscured
by our exit from a number of
undifferentiated lines
Strong trading in North
America
Underlying European sales
growth in local currency is
masked by 7% hit on Euro
11
Underlying turnover growth in all regions despite strong 2011 comparatives
* Eastern Europe, Middle East and Africa
UK represents 5% of
total sales
36% of sales
in emerging
markets

Consumer Care
12
£m 2012 2011 Inc
Turnover 586.4 571.4 +2.6%
Operating profit 185.4 171.2 +8.3%
ROS 31.6% 30.0% 0
40
80
120
160
Q1 Q2 Q3 Q4
Sales (£m)
Profit growth in all quarters despite sales
weakness in Q3
All business areas saw underlying sales and
profit growth with Crop Care the strongest
performer 0
10
20
30
40
50
60
Q1 Q2 Q3 Q4
EBIT (£m)
2011
2012

Performance Technologies
13
0
20
40
60
80
100
120
Q1 Q2 Q3 Q4
Sales (£m)
Good progress towards 20% medium
term ROS target despite difficult
European marketplace
Weak European markets (particularly
automotive) reduced profitability in
Lubricants and Coatings and Polymers 0
5
10
15
20
Q1 Q2 Q3 Q4
EBIT (£m)
£m 2012 2011 Inc
Turnover 382.8 373.6 +2.5%
Operating profit 59.7 55.3 +8.0%
ROS 15.6% 14.8%
2011
2012

0
5
10
15
20
25
30
Q1 Q2 Q3 Q4
Sales (£m)
0
1
2
3
4
5
Q1 Q2 Q3 Q4
EBIT (£m)
Industrial Chemicals
14
Limited pricing power so sales, margins
and profit generation can be volatile
Strong H2 performance after weak first
half
£m 2012 2011 Inc
Turnover 82.7 83.0 -0.4%
Operating profit 10.3 11.2 -8.0%
12.5% 13.5%
2011
2012

2012 pre-tax profit up 6.6%
15
Another very strong performance in a difficult market
£m 2012 2011 Growth
Total operating profit 255.4 237.7 +7.4%
ROS 24.3% 23.1%
Financing (2.2) (0.2)
Pre-tax profit 253.2 237.5 +6.6%
Financing
Reduced pension funding credit due to assumption changes

2012 Earnings Per Share up 8.2%
16
£m 2012 2011 Growth
Pre-tax profit 253.2 237.5 +6.6%
Tax rate 30.8% 31.5%
Average number of shares 134.6m 135.3m
Earnings per share 130.0p 120.1p +8.2%
Tax rate reduced to 30.8%
Falling UK tax rates
Average number of shares reduced due to 2011 buyback

Total dividend up 8.2%
17
£m 2012 2011 Growth
Earnings per share 130.0p 120.1p +8.2%
Total dividend 59.5p 55.0p +8.2%
Pay-out ratio 46% 46%
Cover 2.2x 2.2x
Dividend policy:
Total dividend: 40-50% of full year earnings
Total dividend 59.5p
Interim dividend 26.75p
Final dividend 32.75p
Dividend growth exactly in line with earnings growth
So payout ratio and cover unchanged from 2011

Investing in the business
0
10
20
30
40
50
60
70
80
2012 2013 2014 2015
£m
Projected capital investment Estimated depreciation
2012 – 2015
Aiming to spend around twice
depreciation over next few years
>70% of spend in capacity
expansion, new technology and
energy reduction projects
More than doubling investment in
emerging markets (cf 2008 –
2011)
18

Capital expenditure
2012 capital spend £52.3m (2011: £58.3m)
1.6x depreciation versus the medium term target of 2x
Some of shortfall due to project phasing
ROIC improved slightly despite capital spend and M&A
Major spends include
The acrylic polymer plant
Capacity expansion in North America and Singapore
New warehouse and offices in Germany
19

Acquisitions
IRB acquired in July 2012
Cost €7.7m
Based in Italy
Integrated within Sederma
Global leader in plant stem cell technology
Innovachem acquired in December 2012
Cost $2.8m
Based in New Jersey, USA
New and patented product lines for Personal Care
20
Both acquisitions represent exciting niche opportunities in Personal Care

Disposal
Cremona sold November 2012
Final fatty acid/glycerine site acquired with Uniqema in 2006
Turnover in Industrial Chemicals and lower end of Performance
Technologies
Undifferentiated technology, not Croda’s core competence
Treated as discontinued in 2012 accounts
Loss on disposal £11.5m
21

Free cash flow – £181.0m
22
£m 2012 2011
EBITDA 285.0 274.6
Working Capital movement (51.7) (23.7)
Cash from operations 233.3 250.9
Capital expenditure (52.3) (58.3)
Free cash flow 181.0 192.6
3.8% growth in EBITDA
Working capital
High finished goods stock anticipating strong January trading
High raw material stocks ahead of anticipated price increases
High VAT refund due in Germany at year end

Net cash flow
£m 2012 2011
Free cash flow 181.0 192.6
Excess pension contributions (25.2) (17.4)
Share purchases/issues 1.1 (49.4)
Dividends paid (76.8) (67.7)
Interest (8.1) (10.1)
Tax (60.6) (57.7)
M&A 9.1 3.2
Other (mainly restructuring) (1.5) (3.2)
Net cash flow 19.0 (9.7)
Exchange differences 4.4 (1.1)
Change in net debt 23.4 (10.8)
23

Net debt reduced to £207.7m
24
* As per loan covenant calculations, rolling 12 months
£m 2012 2011
Net debt 207.7 231.1
Committed facilities 466.3 477.0
Committed headroom 258.6 245.9
Net debt/EBITDA* 0.7x 0.8x
EBITDA interest cover* 36.8x 33.5x
Main banking facilities run to May 2015
$100m fixed rate loan (5.94%) runs to January 2020
$45m other dollar denominated (floating)
€110m (floating)

Pension deficit decreases by £33.1m pre tax (IAS19 basis)
25
We do not plan to adopt the revised IAS19 rules until 2013, see appendix 3
£m 31 December 2012 31 December 2011
Market value of assets 712.3 647.5
Value of liabilities (878.1) (846.4)
Deficit pre tax (165.8) (198.9)
Deferred tax 44.9 57.3
Deficit post tax (120.9) (141.6)
Changes to certain assumptions and underlying market rates by over £33m pre tax, £20.7m post tax
New deficit reduction schedule for the UK agreed post triennial valuation
2012: £20.4m
2013: £38.4m
£20m (plus inflation) thereafter

Financial KPIs (I)
26
0%
5%
10%
15%
20%
25%
30%
08 09 10 11 12
ROS ROS
Now stands at 24.3%
CC: 31.6% (target: maintain)
PT: 15.6% (target: 20% medium term)
IC: 12.5% (target: maximise profitability)
ROIC
Very high after tax returns maintained
ROIC 23.8%
Far ahead of cost of capital
WACC 6.8%
Capital light business model 0%
5%
10%
15%
20%
25%
08 09 10 11 12
ROIC v
WACC

Financial KPIs (II)
27
-
20
40
60
80
100
120
140
2008 2009 2010 2011 2012
Eps (p)
EPS growth
8.2% growth achieved in 2012
Target 5-10%
Debt ratios
Debt/EBITDA 0.7x (target <3x)
EBITDA interest cover 36.8x (target >4x)
0
5
10
15
20
25
30
35
40
2008 2009 2010 2011 2012
Debt Ratios
x

Strategy Update
Steve Foots – Group Chief Executive

A global leading natural ingredients company
29
Croda helps create multi-million and billion pound brands for its customers
Plant & marine sources Highly trained sales force Flexible manufacturing Valuable intellectual property
Innovation Unmet customer needs Differentiated technologies
Skin Care Oral Care Crop protection Oil & Gas Hair Care Lubricants

Mega trends driving structural growth
30
Positioned well in very attractive growth markets
Beauty and ageing Health and well-being Sustainability
Population growth Disposable income increase Consumer spending growth
Personal Care Health Care Crop Care Lubricants Coatings &
Polymers
Polymer
Additives
Geo
Technologies Home Care

Developments
New niches in adjuvants, skin actives and
drug delivery
Over 50% of growth coming from new
product innovation
Acquisitions: IRB and Innovachem
Looking ahead
Higher brand awareness among emerging
economies
Product quality and safety in use
becoming a key differentiator
Open innovation increasing
Consumer Care
31
£m 2012 2011 Inc
Turnover 586.4 571.4 +2.6%
Operating profit 185.4 171.2 +8.3%
ROS 31.6% 30.0%
Innovation driving growth

Performance Technologies
32
£m 2012 2011 Inc
Turnover 382.8 373.6 +2.5%
Operating profit 59.7 55.3 +8.0%
ROS 15.6% 14.8%
Developments
Robust performance due to improved
speciality portfolio, reducing cyclicality
New niches in oil recovery and green
cleaners
Good growth in our slip additives for
polyolefins
Looking ahead
Asia and Latam set to grow
European demand likely to remain
subdued
Technology acquisition now on agenda
Innovation and margin expansion driving growth

Industrial Chemicals
33
£m 2012 2011 Inc
Turnover 82.7 83.0 -0.4%
Operating profit 10.3 11.2 -8.0%
12.5% 13.5%
Developments
Increasing speciality focus in USA post
distributor exit
Moving from product focus to niche
segment focus
Speciality fatty acid sales driving strong
growth in several markets
Looking ahead
Greater focus on specialities post
Cremona exit
Co-stream demand a function of activity in
Consumer Care and Performance
Technologies
Fast growing niche segments identified
Greater emphasis on specialities driving improvement
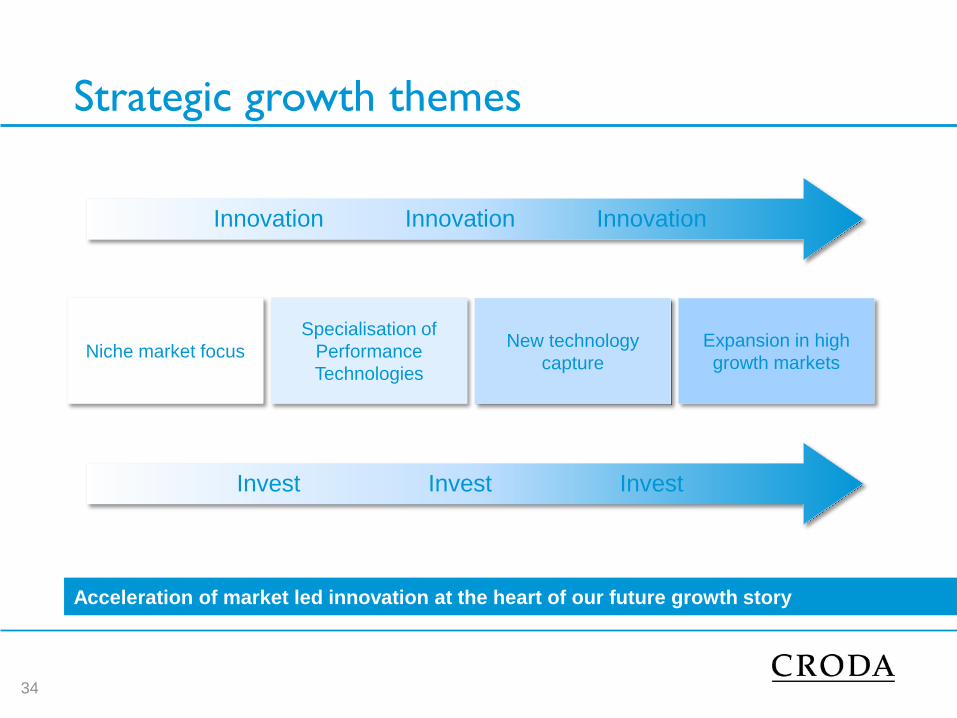
Strategic growth themes
34
Acceleration of market led innovation at the heart of our future growth story
Niche market focus
Specialisation of
Performance
Technologies
New technology
capture
Expansion in high
growth markets
Innovation Innovation Innovation
Invest Invest Invest

Innovation in niche markets – Consumer Care
35
Sustainable actives
Novel performance claims
Based on plant stem cells
from IRB
Market growth exceeding
pharma, high purity needed
Eye drop lubricants and
contact lens solutions
Novel Super Refined™ and
surfactant technologies
Regulation change creating
new niches
Elimination of spray drift to
neighbouring surroundings
In-house proprietary
measuring techniques driving
new product development
Skin creams
Sustainability
Eye care
Sustainability
Spray drift
Sustainability
Powerful sustainability mega trend creating new niches and new opportunities

Innovation in niche markets – Performance Technologies
36
Priplast™ range of 100%
bio-based ingredients
High performance
adhesives for car head-
lamps
Better water repellency
and durability
Replacement for
environmentally hazardous
chemicals
Gas fracking
Inverts polymer emulsions
faster than traditional
surfactants
NatSurf™ range of green
surfactants
Allows lower temperature
washing and reduces
emissions and saves on
energy
Car sealants
Sustainability
Gas fracking
Sustainability
Laundry concentrates
Sustainability
Powerful sustainability mega trend creating new niches and new opportunities

New technology development
Specialisation in Performance Technologies
37
All now supported by dedicated commercial teams placed in all regions of the world
Oil & Gas demulsifiers People
New capacity in Atlas
Point, USA
On stream June 2013,
enabling faster growth in
the Americas
Unique fatty acid platforms
Manufacture planned Q1
2013
Derivatives will serve many
industrial markets
Dedicated global sales
network in place
Continued transfer of skills
from Consumer Care
Asia and Latam teams
strengthened

Globalisation in Performance Technologies
38
Moving manufacturing closer to our customers
Lube esters, Atlas Point
£3.7m, 3.2 kT pa
On stream July 2012
30% sales growth in H2
Lube esters, Brazil
2 kT pa, no spend
needed
On stream H1 2013
Lube esters, Singapore
£1.8m, 4.5 kT pa
On stream Q1 2013 Lubricants
Europe
Overly exposed to Europe
Ester platforms transferred to local
markets
Enabling faster growth
Geo Technologies, Coatings & Polymers
and Home Care to follow in 2013

Very new technologies
New technologies
Technology capture increasing
All six new technologies will contribute this year to our growth story
Acrylic Polymers, Rawcliffe Bridge Biofermentation, Ditton Omega-3 technology, Leek
Polymeric emollients, USA Novel ester platforms, Spain & Singapore
39
IRB, Italy & France

IRB integration
Exceeding expectations already
Customer feedback very positive
Already coded in to new multinational global
formulations
Distributor exit complete
Several new product launches in place for this year
40
Sederma and IRB partnership is progressing smoothly
Leontocell™ Anti-wrinkle
Echingena™ Collagen booster

Shanghai, China
Edison, USA
Expanding in high growth markets – R&D
41
Investment to move Croda closer to our customers and their needs
Formulation support
Customer academy development
More focused new product development
Responsive technical service
Globally coordinated to maximise efficiency
Shiga, Japan
Campinas, Brazil

Regional training centres – Mexico
Ensuring our customers know
how, when and where to use
our products
Continued investment in the education of our customers
10 customer formulating
workshops
5 customer technology events
28% increase in sampling
activity in 2012 from 2011

Non-financial performance
Landfill Waste
2010 2011 2012
Financial Performance
A sustainable business model
43
Non-financial performance now a key differentiator in the eyes of our customers
2010 2011 2012
Water Consumption Energy Consumption
2010 2011 2012
5% 50% 7.5%
Dividend
2010 2011 2012
EPS
2010 2011 2012
Operating Profit
2010 2011 2012
+168% +137% +128%

What would the ideal sustainable manufacturing
business look like?
Croda is as close as any to this model
44
Nature’s raw materials Carbon neutral process Unique performance Biodegradable
Great customer & supplier value

Outlook
Positive start to 2013; expect 2013 to be another year of progress
Trading environment in Europe anticipated to remain challenging
Focus on innovation and technology will enable further growth
On-going investment in facilities and people will underpin progress, especially in
fast growing markets
Continued confidence in Croda’s long term prospects
45
Croda is well positioned to generate sustainable shareholder value

Questions
46

Croda International Plc
2012 Preliminary Results
Appendices
26 February 2013

Appendix 1: Sector sales trends by quarter
Q1 Q2 Q3 Q4 Year
Consumer Care +9.2% +2.5% -2.7% +1.4% +2.6%
Performance Technologies +3.5% +1.2% +2.5% +2.6% +2.5%
Industrial Chemicals -11.1% -7.2% +16.1% +5.3% -0.4%
Continuing sales +5.4% +1.1% +0.5% +2.2% +2.3%
48
2012 v 2011

Appendix I1: 2011 by quarter
£m Q1 Q2 Q3 Q4 Year
Consumer Care 145.7 146.5 144.8 134.4 571.4
Performance Technologies 99.2 100.3 92.4 81.7 373.6
Industrial Chemicals 22.6 23.5 18.0 18.9 83.0
Continuing sales 267.5 270.3 255.2 235.0 1,028.0
Consumer Care 41.8 45.0 41.8 42.6 171.2
Performance Technologies 14.6 14.2 13.7 12.8 55.3
Industrial Chemicals 2.7 3.5 1.5 3.5 11.2
Continuing operating profit 59.1 62.7 57.0 58.9 237.7
Interest (0.2) (0.3) (0.2) 0.5 (0.2)
Continuing pre-tax profit 58.9 62.4 56.8 59.4 237.5
49

Appendix III: 2012 by quarter
£m Q1 Q2 Q3 Q4 Year
Consumer Care 159.1 150.1 140.9 136.3 586.4
Performance Technologies 102.7 101.5 94.7 83.9 382.8
Industrial Chemicals 20.1 21.8 20.9 19.9 82.7
Continuing sales 281.9 273.4 256.5 240.1 1,051.9
Consumer Care 48.2 48.5 44.2 44.5 185.4
Performance Technologies 15.8 17.1 13.4 13.4 59.7
Industrial Chemicals 1.5 2.7 2.1 4.0 10.3
Continuing operating profit 65.5 68.3 59.7 61.9 255.4
Interest (0.7) (0.4) (0.4) (0.7) (2.2)
Continuing pre-tax profit 64.8 67.9 59.3 61.2 253.2
50

Appendix IV: 2012 restated for revised IAS19
standard on pension accounting £m Q1 Q2 Q3 Q4 Year
Consumer Care 48.2 48.5 44.2 44.5 185.4
Performance Technologies 15.8 17.1 13.4 13.4 59.7
Industrial Chemicals 1.5 2.7 2.1 4.0 10.3
Continuing operating profit 65.5 68.3 59.7 61.9 255.4
Interest (0.7) (0.4) (0.4) (0.7) (2.2)
Continuing pre-tax profit 64.8 67.9 59.3 61.2 253.2
Consumer Care 48.1 48.4 44.2 44.4 185.1
Performance Technologies 15.8 17.0 13.3 13.4 59.5
Industrial Chemicals 1.5 2.7 2.1 4.0 10.3
Continuing operating profit 65.4 68.1 59.6 61.8 254.9
Interest (4.3) (4.0) (4.0) (4.3) (16.6)
Continuing pre-tax profit 61.1 64.1 55.6 57.5 238.3
51
In 2013, the revision to IAS19 is expected to be somewhat less onerous, due
to the reduction in the pension deficit.