preliminary results 2018 - wilmington plc
TRANSCRIPT

Preliminary Results 2018Pedro Ros, Chief Executive Officer
Richard Amos, Chief Financial Officer
London, 12 September 2018

Safe Harbour Statement
This presentation and the subsequent question and answer session may containforward-looking statements that are based on current expectations or beliefs, as wellas assumptions about future events. There are risk factors that could cause results todiffer materially from those expressed or implied by such statements.
Wilmington disclaims any intention or obligation to revise or update any forward-looking statements that may be made during this presentation or the subsequentquestion and answer session, regardless of whether those statements are affected asa results of new information, future events or otherwise.
22
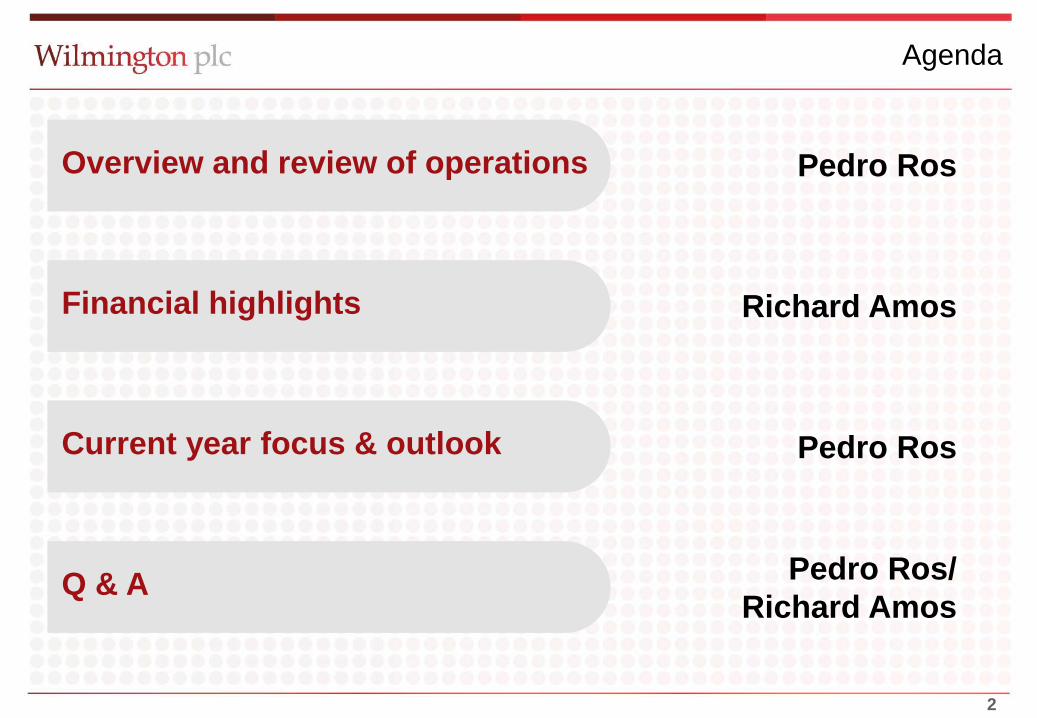
Agenda
Pedro Ros
Richard Amos
Pedro Ros
Overview and review of operations
Financial highlights
Q & A
Current year focus & outlook
Pedro Ros/ Richard Amos

33
Overview and review of operations
44
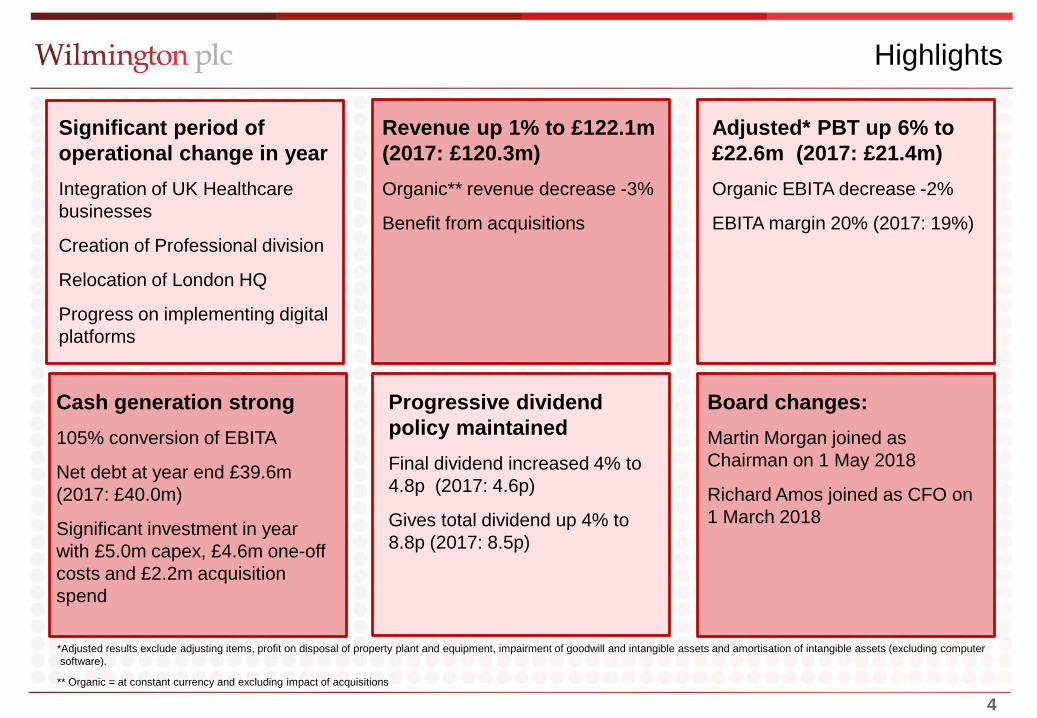
Highlights
Revenue up 1% to £122.1m(2017: £120.3m)Organic** revenue decrease -3%
Benefit from acquisitions
Adjusted* PBT up 6% to £22.6m (2017: £21.4m)Organic EBITA decrease -2%
EBITA margin 20% (2017: 19%)
Cash generation strong105% conversion of EBITA
Net debt at year end £39.6m (2017: £40.0m)
Significant investment in year with £5.0m capex, £4.6m one-off costs and £2.2m acquisition spend
Progressive dividend policy maintainedFinal dividend increased 4% to 4.8p (2017: 4.6p)
Gives total dividend up 4% to 8.8p (2017: 8.5p)
Significant period of operational change in yearIntegration of UK Healthcare businesses
Creation of Professional division
Relocation of London HQ
Progress on implementing digital platforms
Board changes:Martin Morgan joined as Chairman on 1 May 2018
Richard Amos joined as CFO on1 March 2018
*Adjusted results exclude adjusting items, profit on disposal of property plant and equipment, impairment of goodwill and intangible assets and amortisation of intangible assets (excluding computersoftware).
** Organic = at constant currency and excluding impact of acquisitions
55
Operational review
6
12 mths to30 June
2018
£m
2017
£m
AbsoluteVariance
%
OrganicVariance
%
Revenue
Operating Profit
Margin %
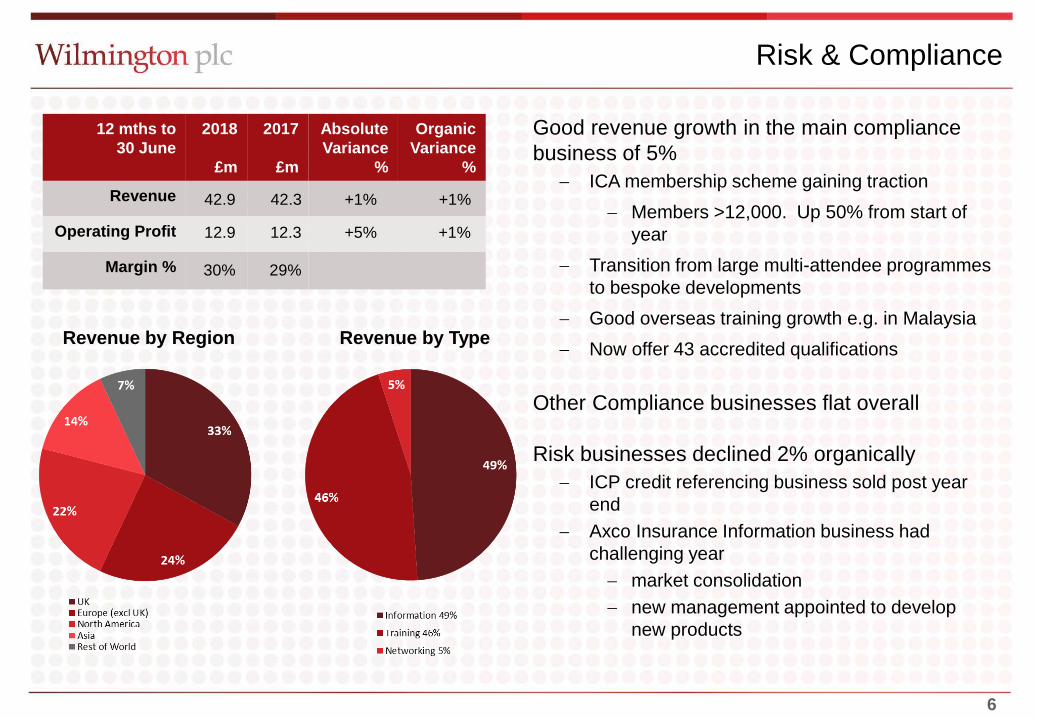
Revenue by Region Revenue by Type
Risk & Compliance
Good revenue growth in the main compliance business of 5%
− ICA membership scheme gaining traction− Members >12,000. Up 50% from start of
year− Transition from large multi-attendee programmes
to bespoke developments− Good overseas training growth e.g. in Malaysia− Now offer 43 accredited qualifications
Other Compliance businesses flat overall
Risk businesses declined 2% organically− ICP credit referencing business sold post year
end− Axco Insurance Information business had
challenging year− market consolidation− new management appointed to develop
new products
42.9 42.3
12.9 12.3
30% 29%
+1%
+5%
+1%
+1%
7
12 mths to30 June
2018
£m
2017
£m
AbsoluteVariance
%
OrganicVariance
%
Revenue
Operating Profit
Margin %
Revenue by Region Revenue by Type
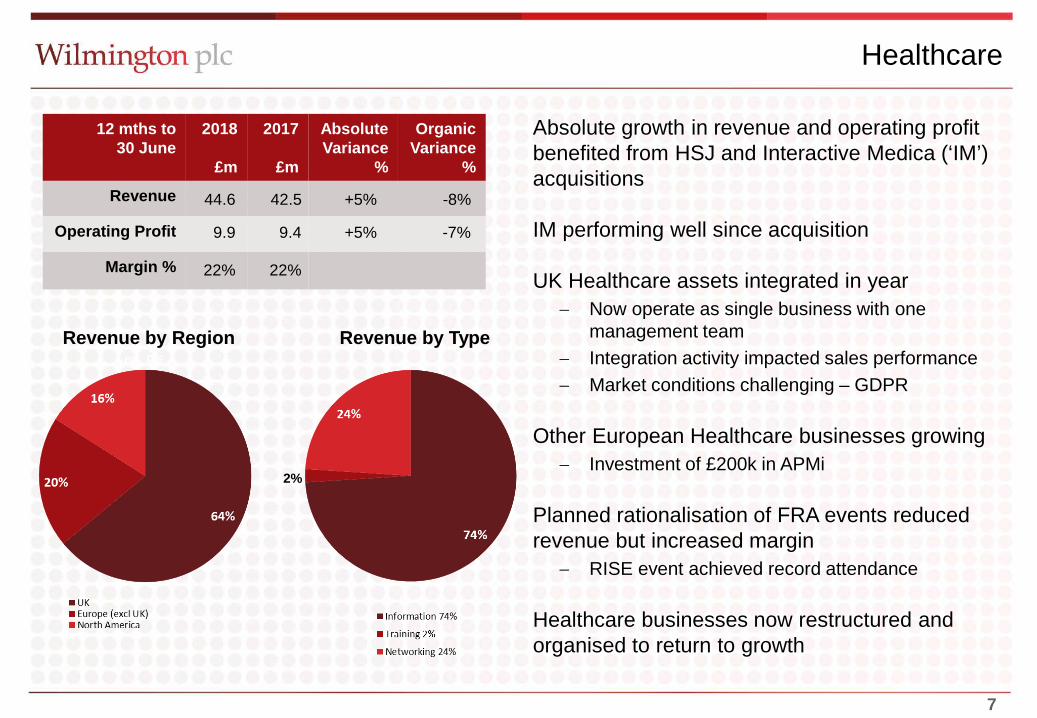
Healthcare
Absolute growth in revenue and operating profit benefited from HSJ and Interactive Medica (‘IM’) acquisitions
IM performing well since acquisition
UK Healthcare assets integrated in year− Now operate as single business with one
management team− Integration activity impacted sales performance− Market conditions challenging – GDPR
Other European Healthcare businesses growing− Investment of £200k in APMi
Planned rationalisation of FRA events reduced revenue but increased margin
− RISE event achieved record attendance
Healthcare businesses now restructured and organised to return to growth
44.6 42.5
9.9 9.4
22% 22%
+5%
+5%
-8%
-7%
2%
8
12 mths to30 June
2018
£m
2017
£m
AbsoluteVariance
%
OrganicVariance
%
Revenue
Operating Profit
Margin %
Revenue by Region Revenue by Type
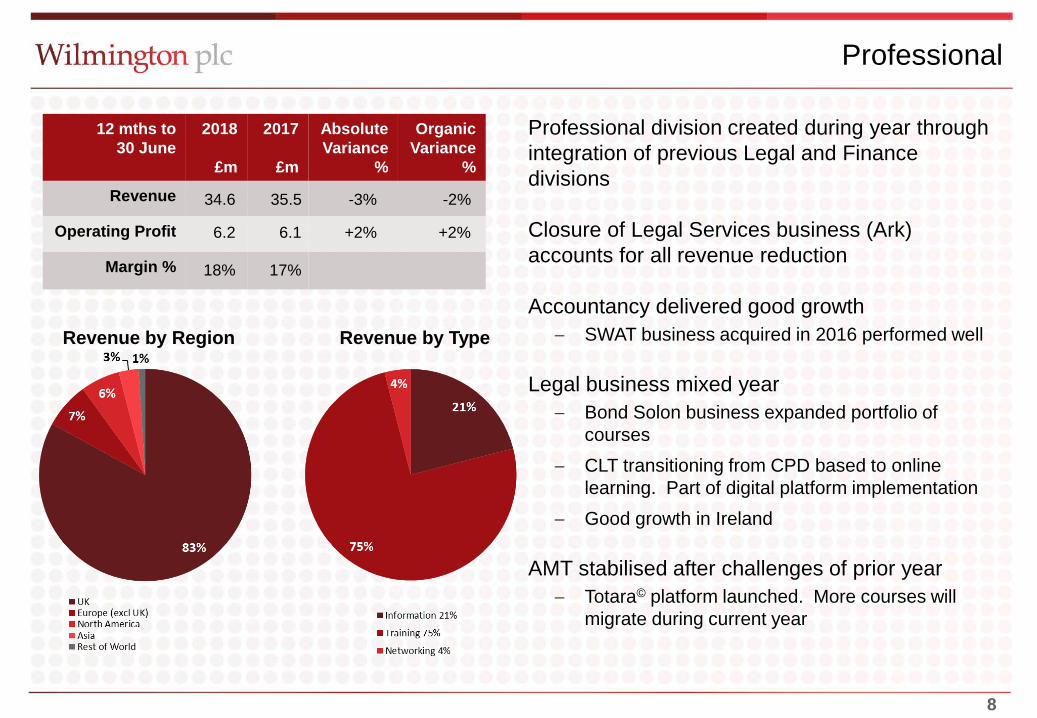
Professional
Professional division created during year through integration of previous Legal and Finance divisions
Closure of Legal Services business (Ark) accounts for all revenue reduction
Accountancy delivered good growth − SWAT business acquired in 2016 performed well
Legal business mixed year− Bond Solon business expanded portfolio of
courses− CLT transitioning from CPD based to online
learning. Part of digital platform implementation− Good growth in Ireland
AMT stabilised after challenges of prior year− Totara© platform launched. More courses will
migrate during current year
34.6 35.5
6.2 6.1
18% 17%
-3%
+2%
-2%
+2%

99
Financial highlights
1010
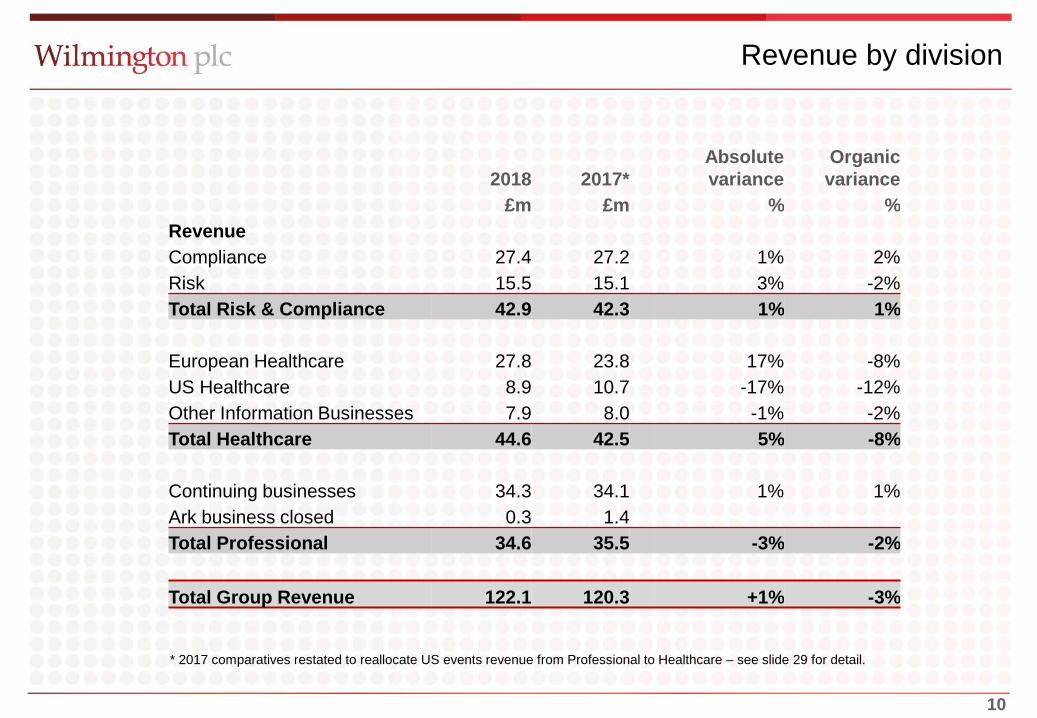
Revenue by division
2018 2017*Absolute variance
Organic variance
£m £m % %RevenueCompliance 27.4 27.2 1% 2%Risk 15.5 15.1 3% -2%Total Risk & Compliance 42.9 42.3 1% 1%
European Healthcare 27.8 23.8 17% -8%US Healthcare 8.9 10.7 -17% -12%Other Information Businesses 7.9 8.0 -1% -2%Total Healthcare 44.6 42.5 5% -8%
Continuing businesses 34.3 34.1 1% 1%Ark business closed 0.3 1.4Total Professional 34.6 35.5 -3% -2%
Total Group Revenue 122.1 120.3 +1% -3%
* 2017 comparatives restated to reallocate US events revenue from Professional to Healthcare – see slide 29 for detail.
11
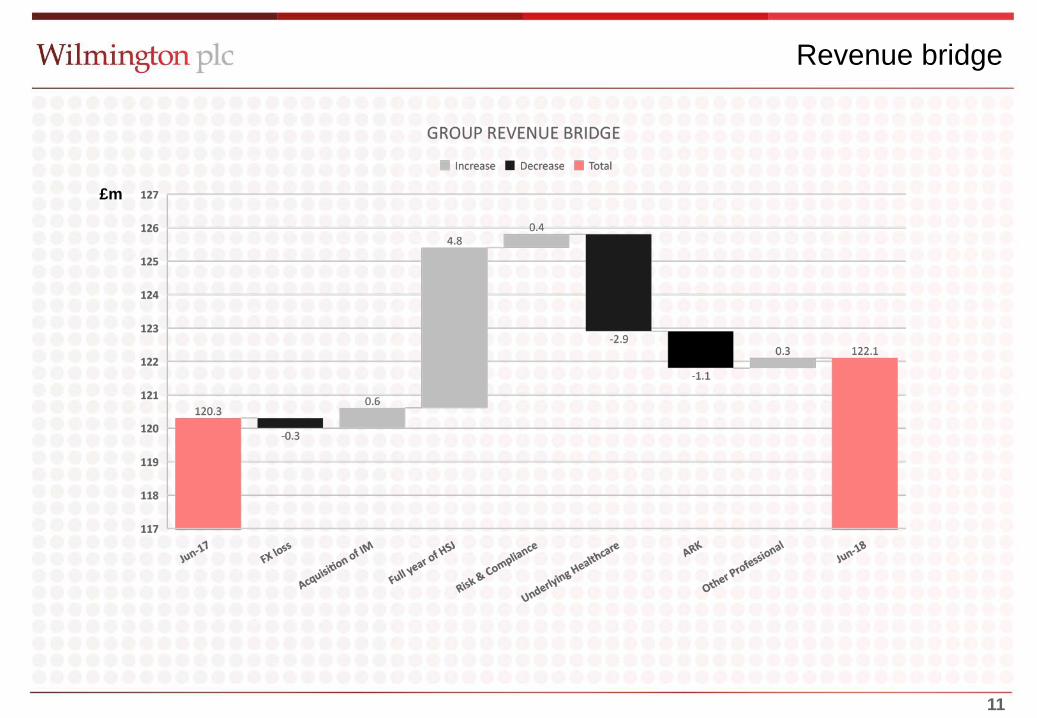
Revenue bridge
£m
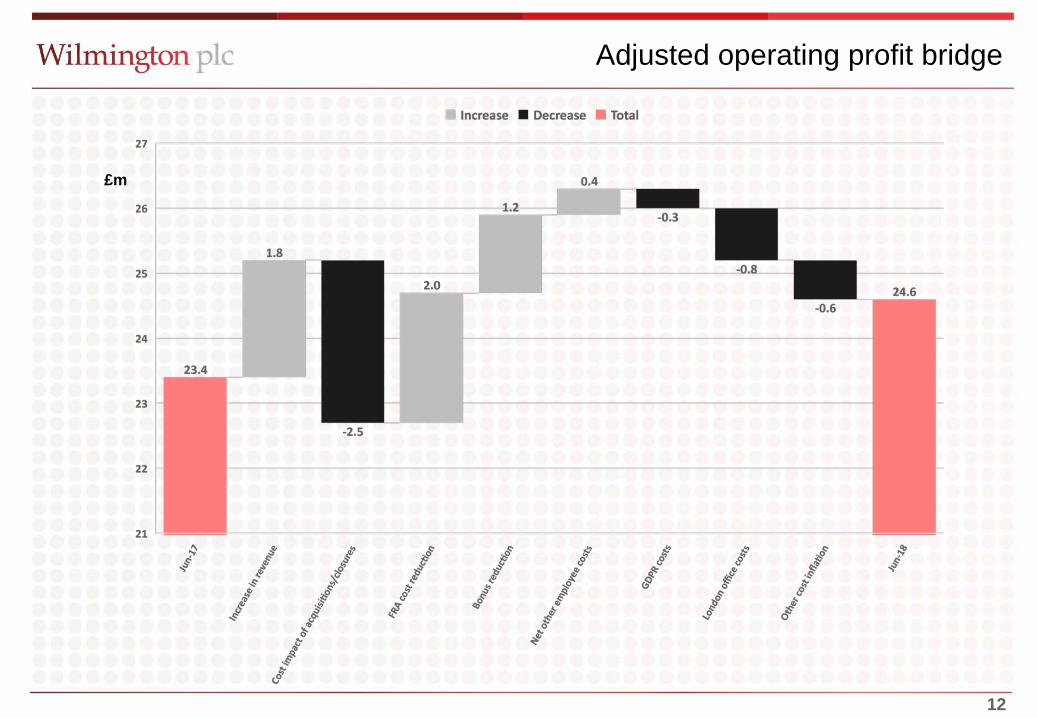
12
Adjusted operating profit bridge
£m
1313
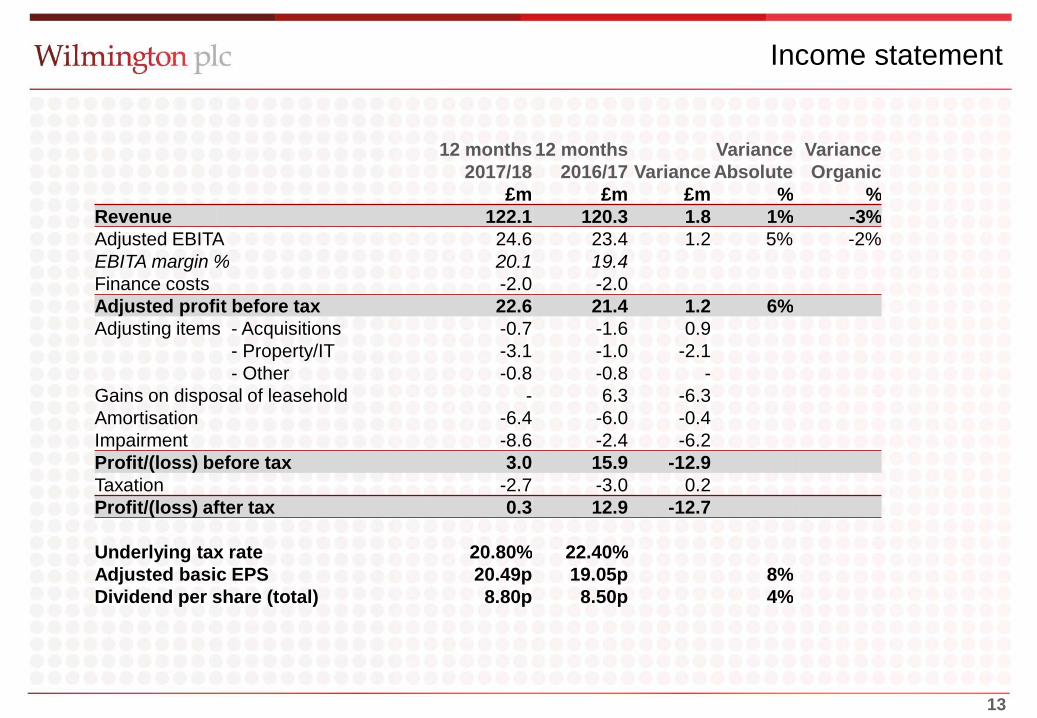
Income statement
12 months 12 months Variance Variance 2017/18 2016/17 Variance Absolute Organic
£m £m £m % %Revenue 122.1 120.3 1.8 1% -3%Adjusted EBITA 24.6 23.4 1.2 5% -2%EBITA margin % 20.1 19.4Finance costs -2.0 -2.0Adjusted profit before tax 22.6 21.4 1.2 6%Adjusting items - Acquisitions -0.7 -1.6 0.9
- Property/IT -3.1 -1.0 -2.1- Other -0.8 -0.8 -
Gains on disposal of leasehold - 6.3 -6.3Amortisation -6.4 -6.0 -0.4Impairment -8.6 -2.4 -6.2Profit/(loss) before tax 3.0 15.9 -12.9Taxation -2.7 -3.0 0.2Profit/(loss) after tax 0.3 12.9 -12.7
Underlying tax rate 20.80% 22.40%Adjusted basic EPS 20.49p 19.05p 8%Dividend per share (total) 8.80p 8.50p 4%
1414
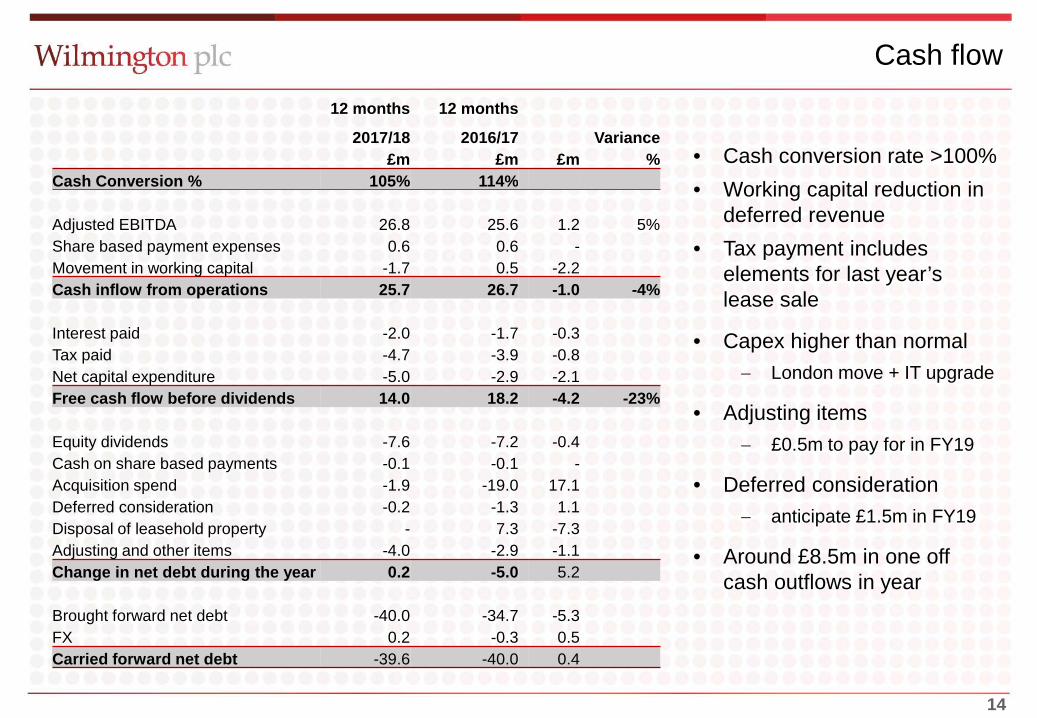
Cash flow12 months 12 months
2017/18 2016/17 Variance£m £m £m %
Cash Conversion % 105% 114%
Adjusted EBITDA 26.8 25.6 1.2 5%Share based payment expenses 0.6 0.6 -Movement in working capital -1.7 0.5 -2.2Cash inflow from operations 25.7 26.7 -1.0 -4%
Interest paid -2.0 -1.7 -0.3Tax paid -4.7 -3.9 -0.8Net capital expenditure -5.0 -2.9 -2.1Free cash flow before dividends 14.0 18.2 -4.2 -23%
Equity dividends -7.6 -7.2 -0.4Cash on share based payments -0.1 -0.1 -Acquisition spend -1.9 -19.0 17.1Deferred consideration -0.2 -1.3 1.1Disposal of leasehold property - 7.3 -7.3Adjusting and other items -4.0 -2.9 -1.1Change in net debt during the year 0.2 -5.0 5.2
Brought forward net debt -40.0 -34.7 -5.3FX 0.2 -0.3 0.5Carried forward net debt -39.6 -40.0 0.4
• Cash conversion rate >100%• Working capital reduction in
deferred revenue• Tax payment includes
elements for last year’s lease sale
• Capex higher than normal− London move + IT upgrade
• Adjusting items− £0.5m to pay for in FY19
• Deferred consideration− anticipate £1.5m in FY19
• Around £8.5m in one off cash outflows in year

1515
Summary balance sheet
Debt profile
53% 47%
2018 2017
Net debt Total facilities
£75m
£85m
2018 2017£m £m
Fixed assetsGoodwill/intangibles 104.4 117.9Property and P&E 6.4 4.4Other fixed assets 0.6 0.8
Working capitalDeferred revenue -24.8 -27.0Other working capital 1.9 3.2
Cash/DebtNet debt -39.6 -40.0Capitalised bank fees 0.3 0.4Deferred consideration -2.6 -2.5Financial instruments -0.3 -0.7
OtherTax liabilities -0.7 -1.9Deferred tax -3.1 -4.6
Net Assets 42.5 50.0
1616
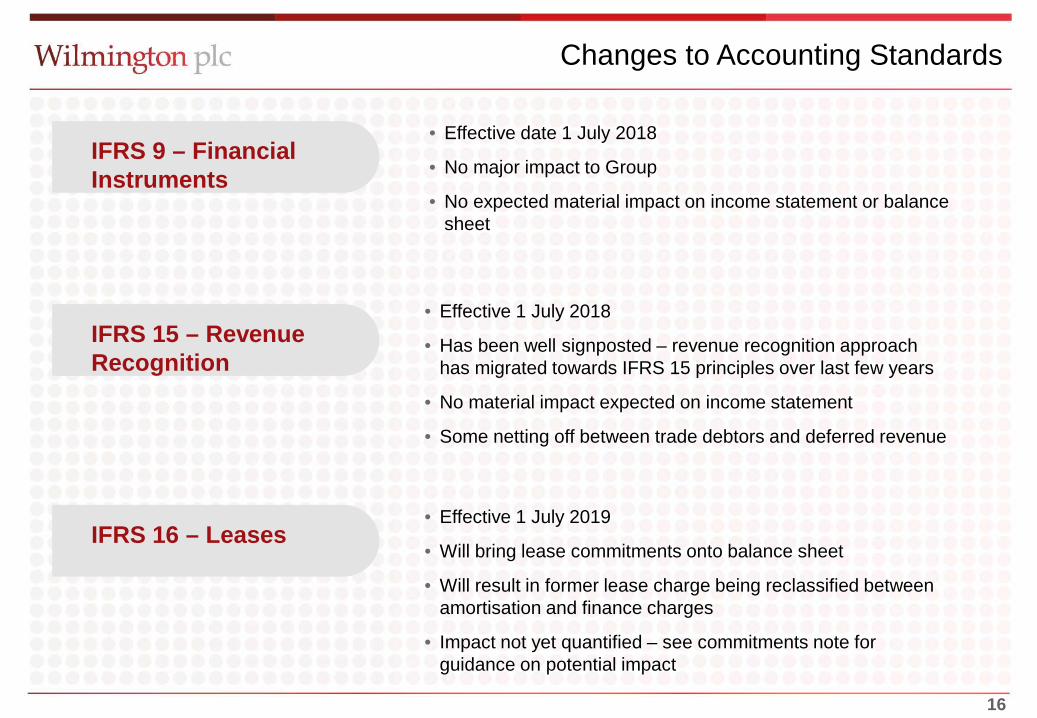
Changes to Accounting Standards
• Effective date 1 July 2018
• No major impact to Group
• No expected material impact on income statement or balance sheet
• Effective 1 July 2018
• Has been well signposted – revenue recognition approach has migrated towards IFRS 15 principles over last few years
• No material impact expected on income statement
• Some netting off between trade debtors and deferred revenue
• Effective 1 July 2019
• Will bring lease commitments onto balance sheet
• Will result in former lease charge being reclassified between amortisation and finance charges
• Impact not yet quantified – see commitments note for guidance on potential impact
IFRS 9 – Financial Instruments
IFRS 15 – Revenue Recognition
IFRS 16 – Leases

17
Current year focus and outlook
18
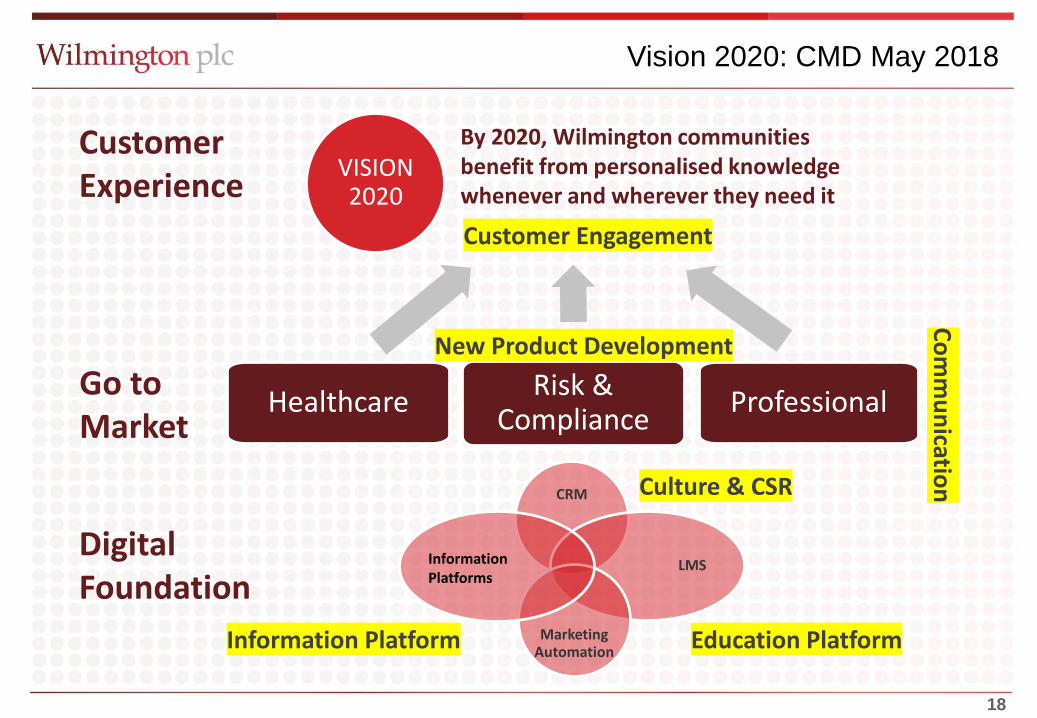
VISION 2020
Healthcare Risk & Compliance Professional
Education PlatformInformation Platform
New Product Development
Customer Engagement
Culture & CSR
By 2020, Wilmington communities benefit from personalised knowledge whenever and wherever they need it
Comm
unication
Customer Experience
Go toMarket
Digital Foundation
Vision 2020: CMD May 2018
CRM
LMS
Marketing Automation
Information Platforms
1919
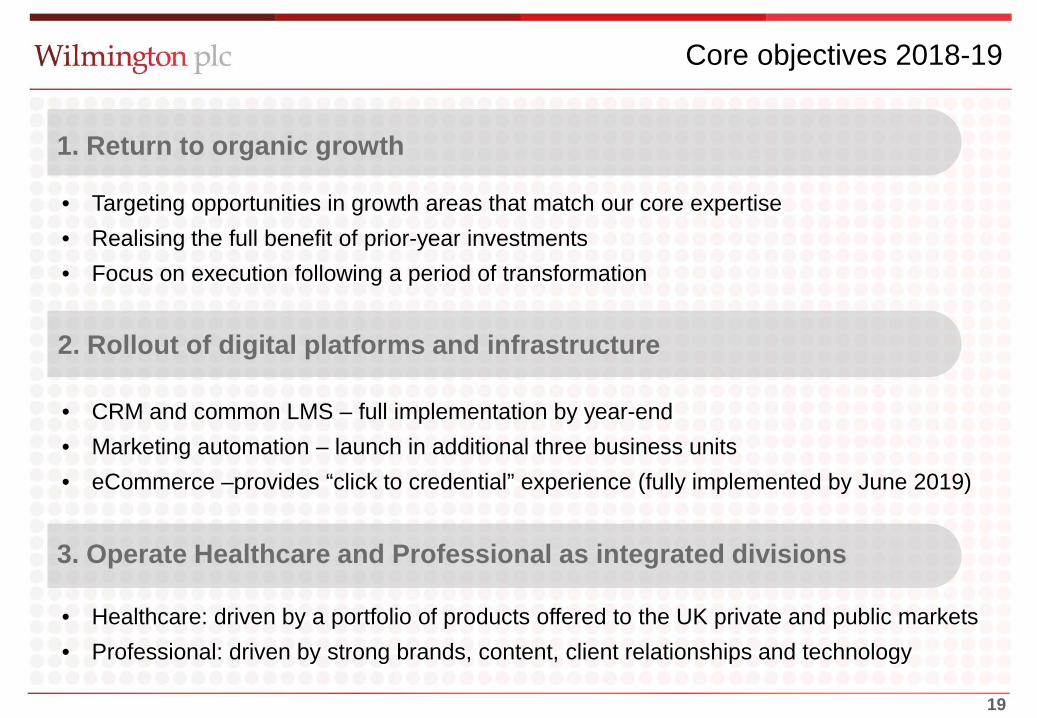
Core objectives 2018-19
• Targeting opportunities in growth areas that match our core expertise• Realising the full benefit of prior-year investments• Focus on execution following a period of transformation
• CRM and common LMS – full implementation by year-end• Marketing automation – launch in additional three business units• eCommerce –provides “click to credential” experience (fully implemented by June 2019)
• Healthcare: driven by a portfolio of products offered to the UK private and public markets • Professional: driven by strong brands, content, client relationships and technology
1. Return to organic growth
2. Rollout of digital platforms and infrastructure
3. Operate Healthcare and Professional as integrated divisions
2020
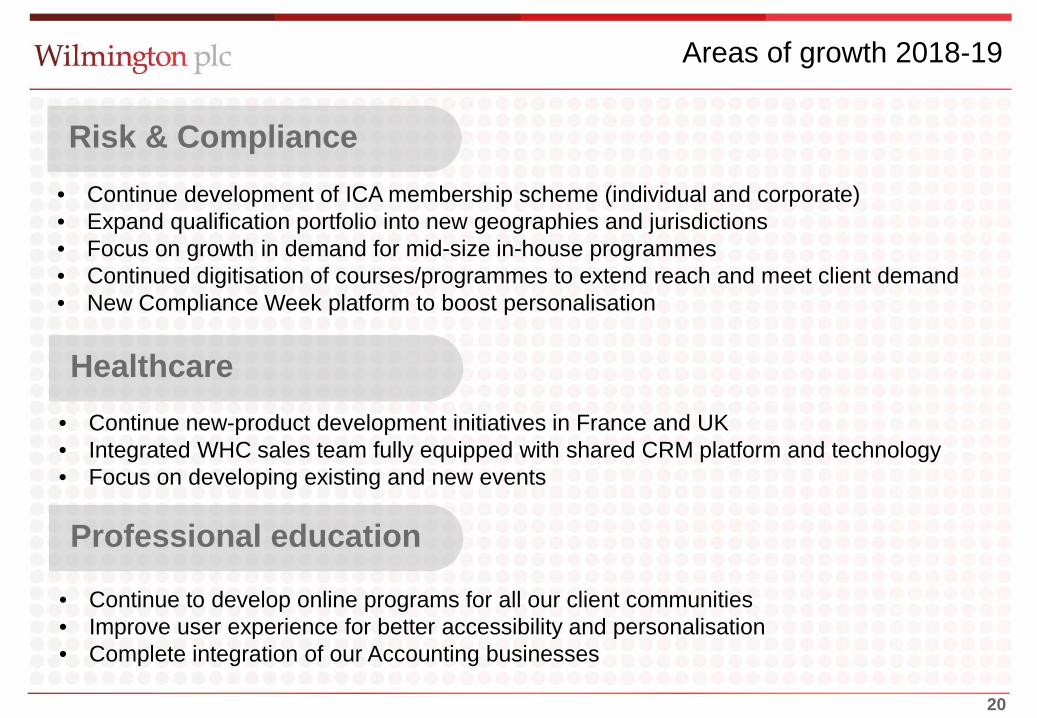
Areas of growth 2018-19
• Continue development of ICA membership scheme (individual and corporate)• Expand qualification portfolio into new geographies and jurisdictions • Focus on growth in demand for mid-size in-house programmes• Continued digitisation of courses/programmes to extend reach and meet client demand• New Compliance Week platform to boost personalisation
• Continue to develop online programs for all our client communities• Improve user experience for better accessibility and personalisation• Complete integration of our Accounting businesses
• Continue new-product development initiatives in France and UK• Integrated WHC sales team fully equipped with shared CRM platform and technology• Focus on developing existing and new events
Risk & Compliance
Healthcare
Professional education
2121
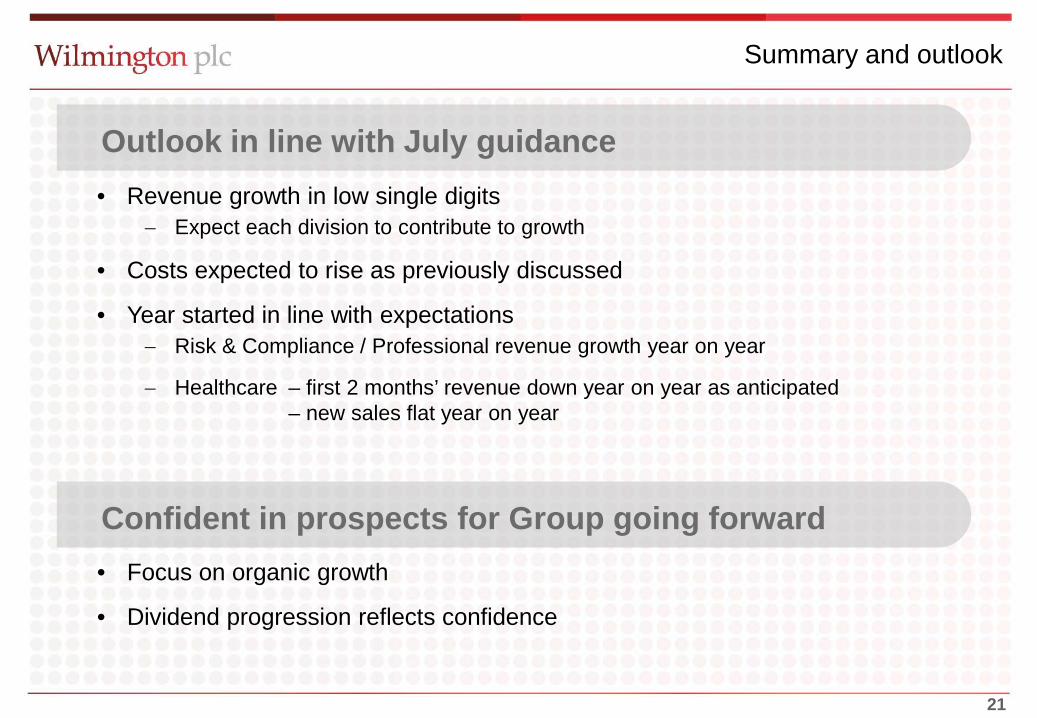
Summary and outlook
• Focus on organic growth
• Dividend progression reflects confidence
• Revenue growth in low single digits− Expect each division to contribute to growth
• Costs expected to rise as previously discussed
• Year started in line with expectations− Risk & Compliance / Professional revenue growth year on year
− Healthcare – first 2 months’ revenue down year on year as anticipated– new sales flat year on year
Confident in prospects for Group going forward
Outlook in line with July guidance

22
Q&A

2323
Appendices
2424
Glossary
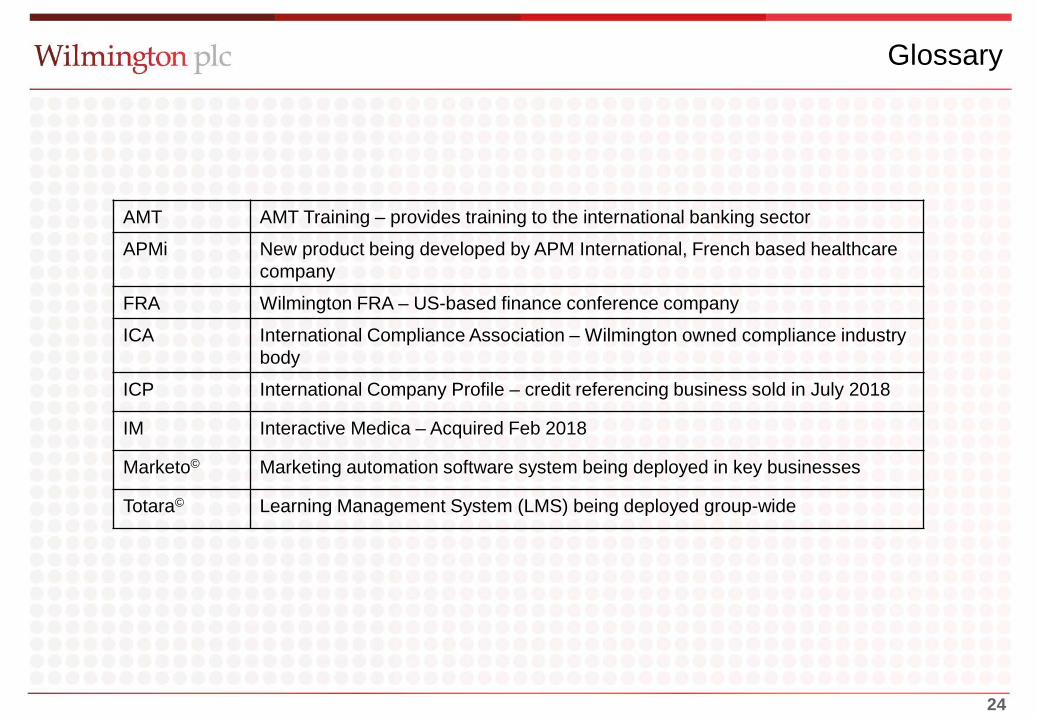
AMT AMT Training – provides training to the international banking sector
APMi New product being developed by APM International, French based healthcare company
FRA Wilmington FRA – US-based finance conference company
ICA International Compliance Association – Wilmington owned compliance industry body
ICP International Company Profile – credit referencing business sold in July 2018
IM Interactive Medica – Acquired Feb 2018
Marketo© Marketing automation software system being deployed in key businesses
Totara© Learning Management System (LMS) being deployed group-wide
2525
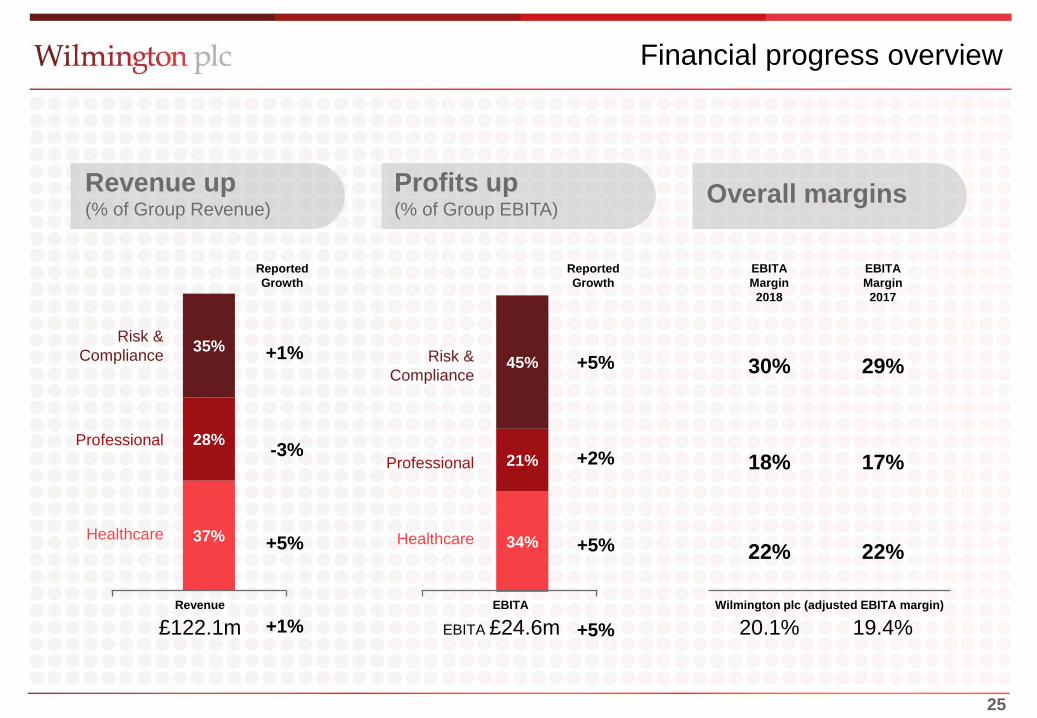
Financial progress overview
Revenue up(% of Group Revenue)
Profits up(% of Group EBITA)
Overall margins
19.4%Wilmington plc (adjusted EBITA margin)
20.1%
30%
18%
22%
29%
17%
22%
EBITAMargin2018
EBITAMargin2017
37%
28%
35%Risk &Compliance
Professional
Healthcare
ReportedGrowth
+1%
-3%
+5%
Revenue
£122.1m +1%
34%
21%
45%Risk &Compliance
Professional
Healthcare
ReportedGrowth
+5%
+2%
+5%
EBITA
EBITA £24.6m +5%
2626
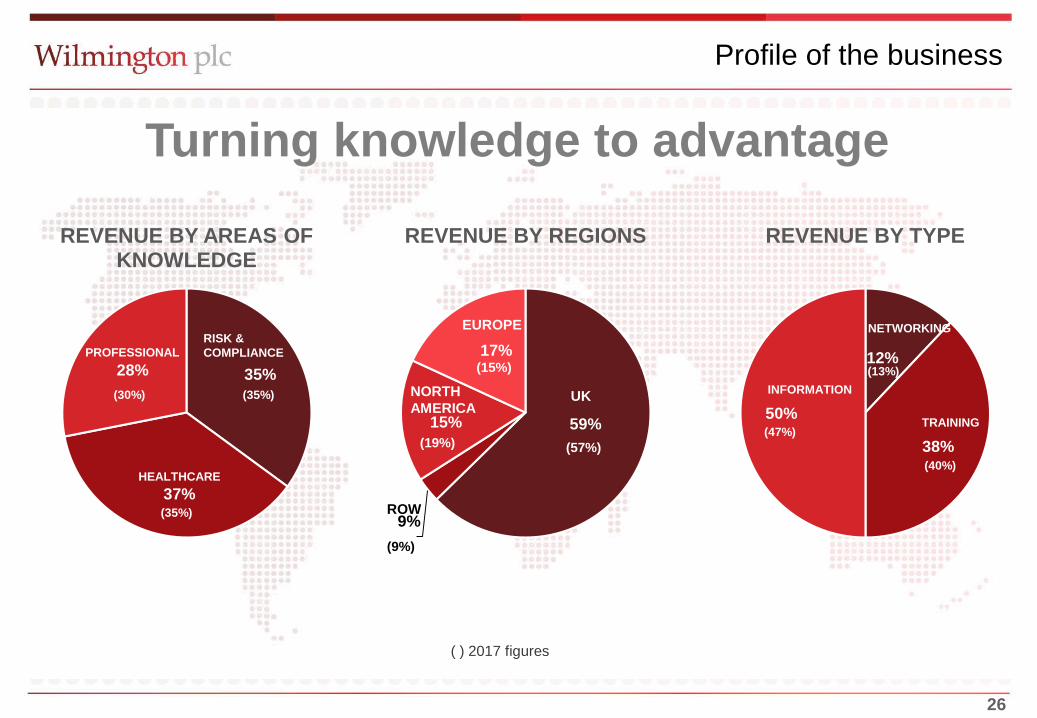
Turning knowledge to advantage
Profile of the business
35%
37%
28%
REVENUE BY AREAS OF KNOWLEDGE
RISK &COMPLIANCEPROFESSIONAL
HEALTHCARE
12%
38%
50%
REVENUE BY TYPE
NETWORKING
INFORMATION
TRAINING(47%)
(13%)
(40%)
( ) 2017 figures
59%
9%
15%
17%
REVENUE BY REGIONS
ROW
EUROPE
UKNORTH AMERICA
(57%)(19%)
(9%)
(15%)
(30%)
(35%)
(35%)
2727
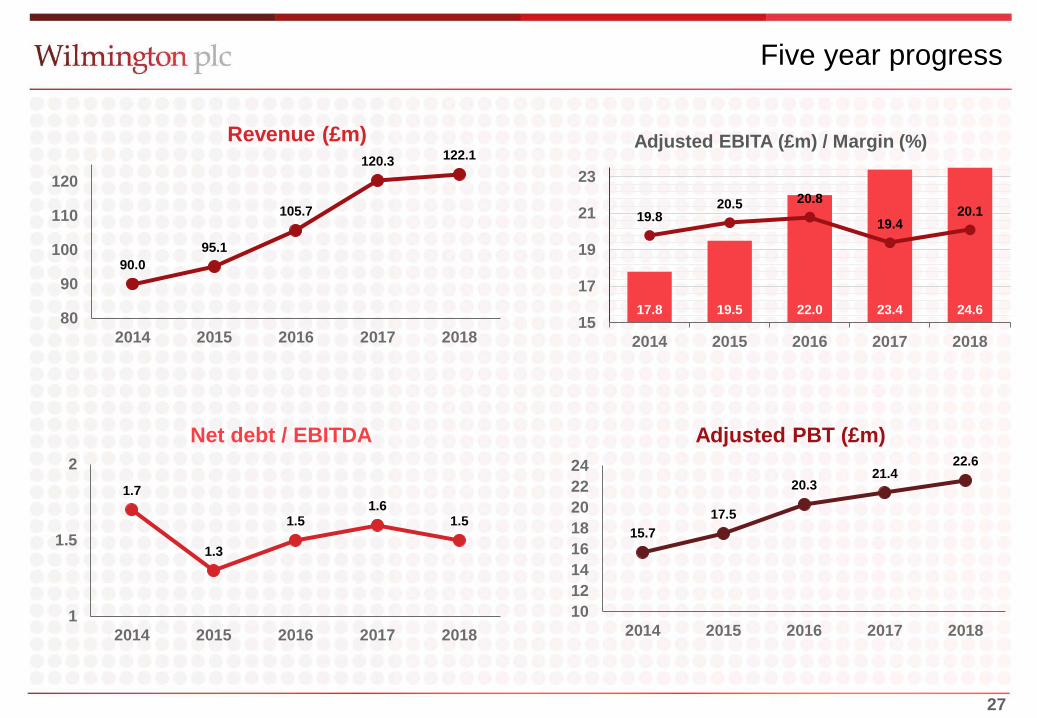
Five year progress
15.717.5
20.321.4
22.6
1012141618202224
2014 2015 2016 2017 2018
Adjusted PBT (£m)
90.095.1
105.7
120.3 122.1
80
90
100
110
120
2014 2015 2016 2017 2018
Revenue (£m)
1.7
1.3
1.51.6
1.5
1
1.5
2
2014 2015 2016 2017 2018
Net debt / EBITDA
17.8 19.5 22.0 23.4 24.6
19.820.5 20.8
19.420.1
15
17
19
21
23
2014 2015 2016 2017 2018
Adjusted EBITA (£m) / Margin (%)

2828
Adjusted operating profit by division
2018 2017*Absolute variance
Organic variance
£m £m % %Adjusted operating profit
Risk & Compliance 12.9 12.3 5% 1%Healthcare 9.9 9.4 5% -7%Professional 6.2 6.1 2% 2%Group overheads -3.8 -3.9 0% 0%SBP -0.6 -0.5
Total 24.6 23.4 5% -2%
* Restated – see slide 29
2929
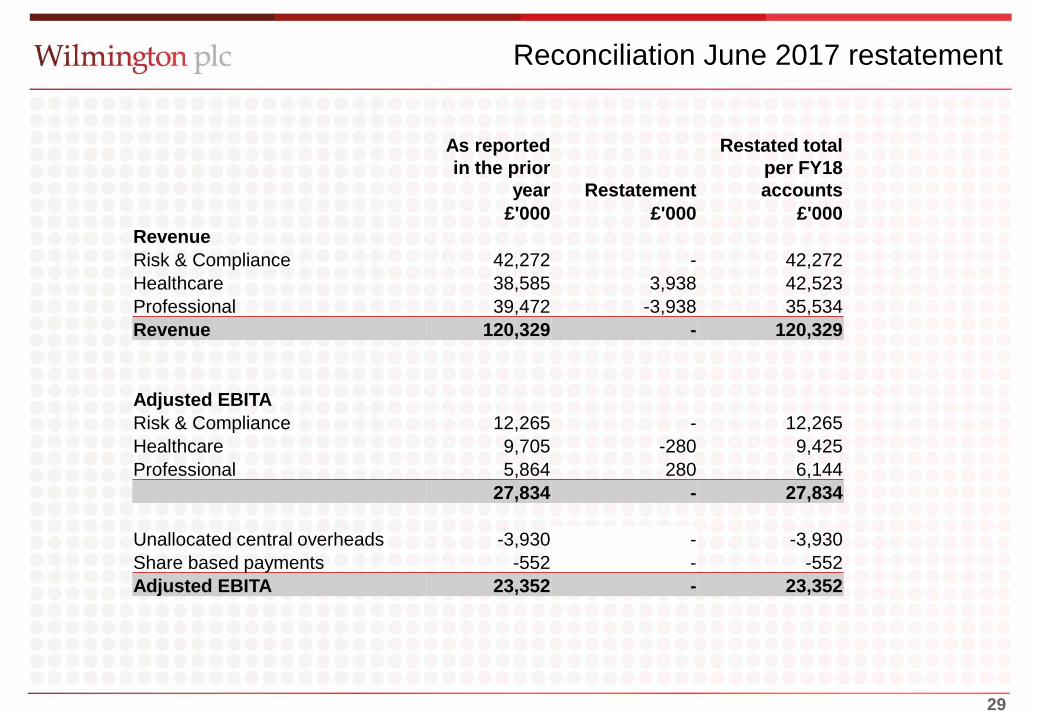
Reconciliation June 2017 restatement
As reported in the prior
year Restatement
Restated total per FY18 accounts
£'000 £'000 £'000RevenueRisk & Compliance 42,272 - 42,272 Healthcare 38,585 3,938 42,523 Professional 39,472 -3,938 35,534 Revenue 120,329 - 120,329
Adjusted EBITARisk & Compliance 12,265 - 12,265 Healthcare 9,705 -280 9,425 Professional 5,864 280 6,144
27,834 - 27,834
Unallocated central overheads -3,930 - -3,930 Share based payments -552 - -552 Adjusted EBITA 23,352 - 23,352
3030
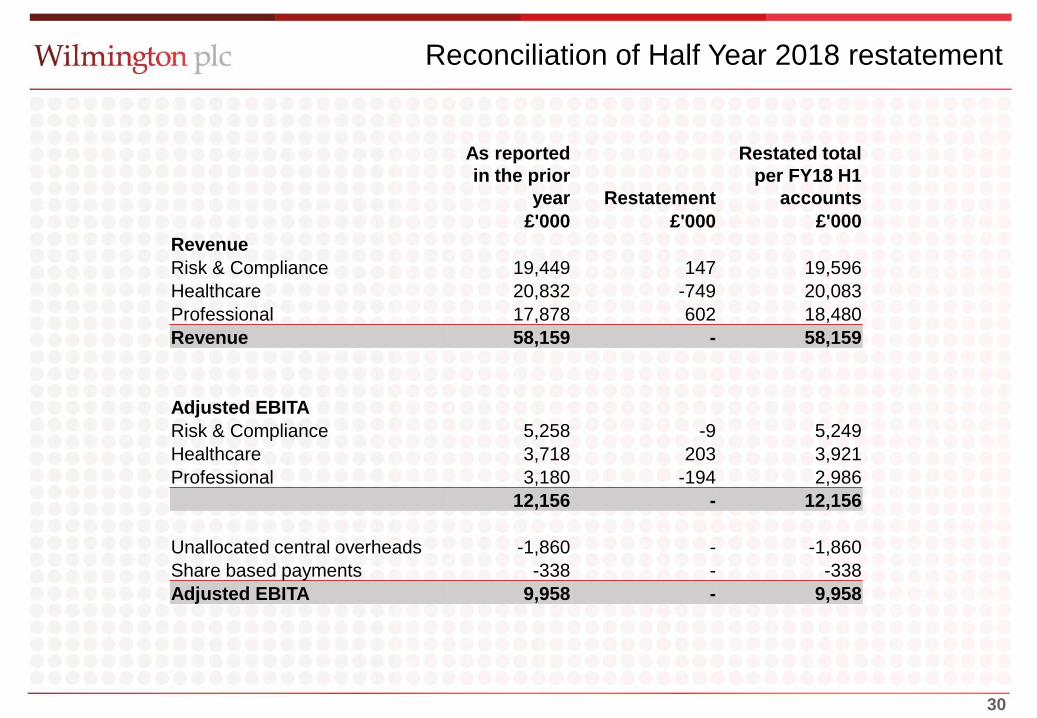
Reconciliation of Half Year 2018 restatement
As reported in the prior
year Restatement
Restated total per FY18 H1
accounts£'000 £'000 £'000
RevenueRisk & Compliance 19,449 147 19,596 Healthcare 20,832 -749 20,083 Professional 17,878 602 18,480 Revenue 58,159 - 58,159
Adjusted EBITARisk & Compliance 5,258 -9 5,249 Healthcare 3,718 203 3,921 Professional 3,180 -194 2,986
12,156 - 12,156
Unallocated central overheads -1,860 - -1,860 Share based payments -338 - -338 Adjusted EBITA 9,958 - 9,958

3131
Thank you.