preliminary results 2004/05 - kingfisher plc
TRANSCRIPT

Preliminary results 2004/05
Slides will be available atSlides will be available atwww.kingfisher.comwww.kingfisher.com

Francis MackayFrancis MackayChairmanChairman

2004/05 2004/05 –– Solid growthSolid growth
11.8%11.8%10.7%10.7%£706.5m£706.5mRetail profitRetail profit
+20bps+20bps
16.9%16.9%
16.2%16.2%
8.7%8.7%
Change Change (Reported)(Reported)
20.8p20.8pAdjusted EPSAdjusted EPS
8.9%8.9%ROICROIC
£686.5m£686.5mPBT*PBT*
3.9%3.9%9.9%9.9%£7,649.6m£7,649.6mRetail SalesRetail Sales
LFLLFLChange Change (Constant)(Constant)
ContinuingContinuingOperationsOperations
*Before goodwill amortisation and exceptional items*Before goodwill amortisation and exceptional items
10.4%10.4%10.65p10.65pDividends per shareDividends per share
Progress in all key areasProgress in all key areas
•• Growth in the UK despite weaker consumer Growth in the UK despite weaker consumer demand, stronger price competitiondemand, stronger price competition
•• Growth in France from a revitalising Castorama Growth in France from a revitalising Castorama and buoyant and buoyant BricoBrico DépôtDépôt
•• Continued expansion in Europe and AsiaContinued expansion in Europe and Asia•• Capitalising on our competitive advantagesCapitalising on our competitive advantages
–– Operating scaleOperating scale–– International diversityInternational diversity

Duncan TattonDuncan Tatton--BrownBrownGroup Finance DirectorGroup Finance Director

7,038 6,958
199274
219
7,650(80)
2003/04 CurrencyImpact
2003/04 @2004/05
rates
UK France Rest ofWorld
2004/05
Sales ahead in all our markets…Sales ahead in all our markets…
9.9%9.9%
4.8%4.8%12.0%12.0%
38.6%38.6%
Retail Sales (Continuing), £mRetail Sales (Continuing), £mConstant Currency YOY growthConstant Currency YOY growth
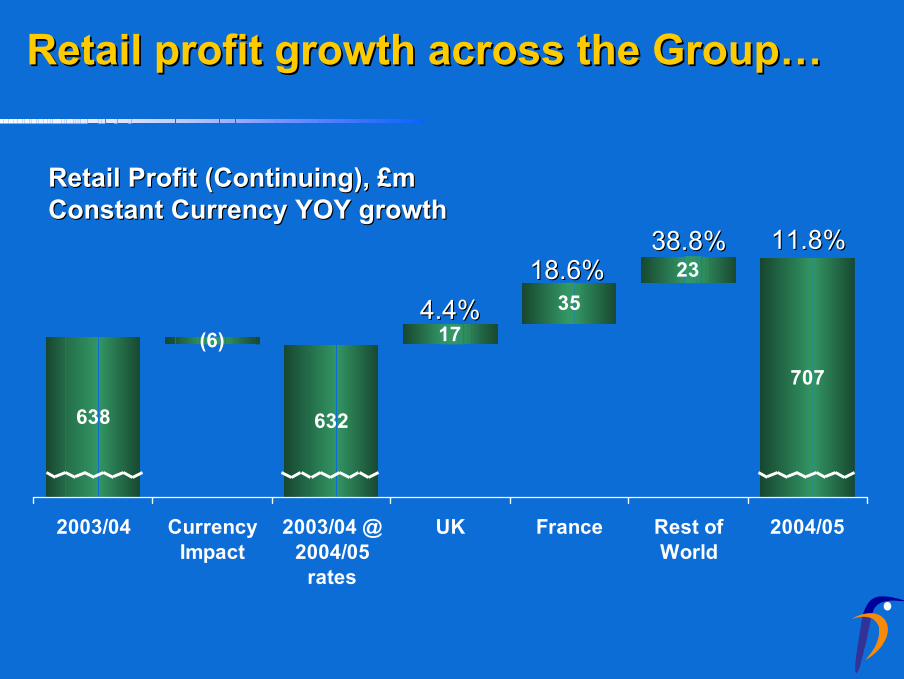
638 632
1735
23
707
(6)
2003/04 CurrencyImpact
2003/04 @2004/05
rates
UK France Rest ofWorld
2004/05
Retail profit growth across the Group…Retail profit growth across the Group…
11.8%11.8%
4.4%4.4%18.6%18.6%
38.8%38.8%
Retail Profit (Continuing), £mRetail Profit (Continuing), £mConstant Currency YOY growthConstant Currency YOY growth

Market share gains in an increasingly Market share gains in an increasingly competitive UK marketcompetitive UK market
Growth for 12 months to end January 2005Growth for 12 months to end January 2005
UK RMI MarketUK RMI Market
B&QB&Q
ScrewfixScrewfix
UK Total SalesUK Total Sales
2.0%2.0%
4.9%4.9%
3.6%3.6%
4.8%4.8%

B&Q B&Q -- sales and profits ahead despite sales and profits ahead despite slower growth in consumer spendingslower growth in consumer spending
+12.8%+12.8%
Operating marginOperating margin
Sales, £mSales, £m Retail Profit, £mRetail Profit, £mB&QB&Q
9.3%9.3% 9.5%9.5%
+9.8% +9.8% +4.9% +4.9%
9.8%9.8%
+7.7%+7.7%
3,5503,5503,8973,897 4,0884,088
330330372372
401401
2002/32002/3 2003/42003/4 2004/52004/5 2002/32002/3 2003/42003/4 2004/52004/5

ScrewfixScrewfix Direct Direct –– short term disruption short term disruption from move to new fulfilment centrefrom move to new fulfilment centre
+6.1%+6.1%
Operating marginOperating margin
Sales, £mSales, £m Retail Profit, £mRetail Profit, £mScrewfixScrewfix DirectDirect
9.7%9.7% 8.6%8.6%
+19.6% +19.6% +3.6% +3.6%
3.5%3.5%
(60)%(60)%
185185
221221 229229 1818 1919
88
2002/32002/3 2003/42003/4 2004/52004/5 2002/32002/3 2003/42003/4 2004/52004/5

France France -- share gains in an increasingly share gains in an increasingly price conscious marketprice conscious market
2.8%
2.6%
17.7%
7.7%
LFL growth for 12 months to end JanuaryLFL growth for 12 months to end January
5th5th9th9thCastoCasto
1st1st1st1stBricoBrico2004200420032003
Price PerceptionPrice Perception
French LFL MarketFrench LFL Market
Castorama FranceCastorama France
BricoBrico DépôtDépôt
France Total LFL France Total LFL

France France -- dual offer has delivered strong dual offer has delivered strong resultsresults
+25.7%*+25.7%*
Operating marginOperating margin
Sales, £mSales, £m Retail Profit, £mRetail Profit, £mTotal FranceTotal France
6.9%6.9% 8.0%8.0%
+9.5%* +9.5%* +12.0%*+12.0%*
8.4%8.4%
+18.6%* +18.6%*
19331933
2328232825472547
134134
186186
2002/32002/3 2003/42003/4 2004/52004/5 2002/32002/3 2003/42003/4 2004/52004/5
215215
*Constant currency*Constant currency

Rest of World Rest of World -- strong sales and profit strong sales and profit growthgrowth
33n/an/an/an/aDevelopingDeveloping
202038.8%38.8%38.6%38.6%TotalTotal
38.7%38.7%
21.3%21.3%
n/an/a
50.5%50.5%
15.5%15.5%
Profit growth*Profit growth*
n/an/aHornbachHornbach
11n/an/aTaiwanTaiwan
6678.5%78.5%ChinaChina
4435.3%35.3%ItalyItaly
6616.1%16.1%PolandPoland
New storesNew storesSales growth*Sales growth*2004/52004/5
* Constant currency* Constant currency

591 585
9 10 8
687
75
6
2003/04 Exchange 2003/04 @04/05 rates
RetailProfit
Property OtherOperating
Costs
Interest 2004/05
£m£mContribution to Constant Currency growthContribution to Constant Currency growth
Profit before tax up stronglyProfit before tax up strongly
+ 17.4%+ 17.4%
Before goodwill amortisation and Before goodwill amortisation and exceptionalsexceptionals

Earnings and dividends growth Earnings and dividends growth (Continuing Operations)(Continuing Operations)
1.841.84
9.65p9.65p
17.8p17.8p
£404.7m£404.7m
31.6%31.6%
£590.7m£590.7m
2003/042003/04
+10.4%+10.4%10.65p10.65pDividendsDividends
1.951.95Dividend coverDividend cover
+16.9%+16.9%20.8p20.8pAdjusted EPSAdjusted EPS
+18.4%+18.4%£479.3m£479.3mAdjusted earningsAdjusted earnings
--31.6%31.6%Headline tax rHeadline tax rateate
+16.2%+16.2%£686.5m£686.5mAdjusted PBTAdjusted PBT
% % ChangeChange2004/052004/05
Reported rates Reported rates -- Adjusted excludes goodwill amortisation and Adjusted excludes goodwill amortisation and exceptionalsexceptionals

Investing for future growth...Investing for future growth...
2005/62005/6£500m£500m--550m550m
New Stores New Stores -- PropertyPropertyNew Stores New Stores -- RetailRetail
2004/52004/5£407m£407m
Revamps & other store investmentRevamps & other store investmentInfrastructureInfrastructure
Gross Gross CapexCapex
25%25%
13%13%
39%39%
23%23%
19%19% 40%40%
16%16%
25%25%

£m, Continuing Group 2004/05 2003/04Operating Profit 685 635Depreciation/Profit on disposal 159 169Change in working capital (155) (27)Cashflow form Op. activity 689 777Net Capex (386) (362)Free cashflow (continuing) 303 415Chartwell Disposal - 793Total Group Free Cashflow 304 1,208
Strong cash flowStrong cash flow

£m, 2004/05 2003/04Free Pre Cashflow 304 1,208Interest 10 (170)Corporation tax (167) (287)Dividends (205) (119)Demerger items - 364Other movement 98 133
Movement in net debt 40 1,129Opening Net debt (844) (1,926)Translation on debt 10 (47)Closing Net debt (794) (844)
…. lower net debt…. lower net debt

47%
31%
22%
Property value by location as at 29 January 2005Property value by location as at 29 January 2005
Property values up 9% to £2.4bn...Property values up 9% to £2.4bn...
InternationalInternational
UKUK
FranceFrance

Growing returns on invested capitalGrowing returns on invested capital
7.6% 8.7%
2.6%
8.9%
1.1%
(0.1)%
•• Restated to exclude exiting businessesRestated to exclude exiting businesses
UnderlyingUnderlying Revaluation impactRevaluation impact
Post goodwillPost goodwill
2002/03*2002/03* 2003/042003/04 2004/052004/05

IFRS IFRS
•• Results for year to 29 Jan 2005 released Results for year to 29 Jan 2005 released todaytoday
•• Impact on profit after taxImpact on profit after tax–– 3% reduction (underlying 5%3% reduction (underlying 5%11))
•• Impact on net assets at 29 Jan 2005Impact on net assets at 29 Jan 2005–– 11% reduction (underlying 7%11% reduction (underlying 7%22))
•• Still subject to change/interpretationStill subject to change/interpretation
1. Excluding IAS21 functional currency benefit2. Excluding reversal of property revals recorded in UKGAAP

PensionsPensions
•• RevaluedRevalued scheme post scheme post -- KESA splitKESA split•• £250m investment over 3 years£250m investment over 3 years•• Invested in matching assetsInvested in matching assets•• Balance sheet neutral under IFRSBalance sheet neutral under IFRS•• No 2005/6 earnings impactNo 2005/6 earnings impact
20052005
•• Remove scrip alternativeRemove scrip alternative–– replaced with DRIPreplaced with DRIP
•• RefinancingRefinancing–– £500m with a 5 year term£500m with a 5 year term
•• Reporting changes Reporting changes –– opportunity to reviewopportunity to review–– property into B&Qproperty into B&Q

Duncan TattonDuncan Tatton--BrownBrownGroup Finance DirectorGroup Finance Director

Gerry MurphyGerry MurphyChief ExecutiveChief Executive

Kingfisher’s priorities Kingfisher’s priorities -- growth growth andand returnsreturns
Improving returnsImproving returns–– Driving LFLDriving LFL–– Optimising supplyOptimising supply–– Managing costs Managing costs
Consistent, sustainable growth Consistent, sustainable growth in economic returnsin economic returns
Investing for growthInvesting for growth–– New & revitalised storesNew & revitalised stores–– New marketsNew markets–– InfrastructureInfrastructure

Kingfisher’s advantages Kingfisher’s advantages -- scale and scale and diversitydiversity
•• Operating scaleOperating scale–– buying together, global sourcingbuying together, global sourcing–– better products, better pricesbetter products, better prices
•• DiversityDiversity–– sharing ideas, accelerating innovationsharing ideas, accelerating innovation–– ranges, formats, brands and ranges, formats, brands and
infrastructureinfrastructure

Scale Scale -- progressprogress
•• Common buying practices embeddedCommon buying practices embedded•• Enabled by new processes and systemsEnabled by new processes and systems•• CrossCross--group buying for 6 key categoriesgroup buying for 6 key categories•• Own Brand products now 24% of salesOwn Brand products now 24% of sales
cc.£140m gross incremental .£140m gross incremental benefits in 2004benefits in 2004

Scale Scale -- progressprogress
AsiaAsia
South South AfricaAfrica
ItalyItaly
Eastern Eastern EuropeEurope
AgentsAgents
•• Direct sourcing over US$550m in 2004Direct sourcing over US$550m in 2004•• New sourcing offices and import infrastructureNew sourcing offices and import infrastructure

Sharing ideasSharing ideas-- format developmentformat development
•• Medium Box evolution Medium Box evolution –– Taiwan, UK miniTaiwan, UK mini--Warehouse, Poland, ItalyWarehouse, Poland, Italy
•• Big Box evolutionBig Box evolution–– China, France, UK “stretch”China, France, UK “stretch”
•• Small Box evolution Small Box evolution –– France, SpainFrance, Spain–– UK trade counterUK trade counter


Sharing ideas Sharing ideas –– infrastructure infrastructure development…..supply chain & systemsdevelopment…..supply chain & systems
•• Castorama France Castorama France –– over 40% store deliveries centralisedover 40% store deliveries centralised–– over 25% more warehousing capacity addedover 25% more warehousing capacity added
•• BricoBrico DépôtDépôt–– first central distribution centre in Aprilfirst central distribution centre in April–– New systems in common with B&QNew systems in common with B&Q
•• International businesses International businesses –– supply chain scoped and plannedsupply chain scoped and planned

Sharing ideasSharing ideas-- range developmentrange development
•• Solid wood flooring: Poland, France, UKSolid wood flooring: Poland, France, UK•• Decorative ranges: France, China, UKDecorative ranges: France, China, UK•• Decoration service: China, TaiwanDecoration service: China, Taiwan

Rob CissellRob CissellCEO CEO –– B&QB&Q

Driving growth at B&Q Driving growth at B&Q –– seizing the seizing the opportunityopportunity
•• Customers want;Customers want;–– More style, fashion, individualityMore style, fashion, individuality–– Better serviceBetter service–– Better valueBetter value
•• Our opportunityOur opportunity–– Increase B&Q share of project spend from Increase B&Q share of project spend from
20%20%

Driving growth at B&Q Driving growth at B&Q –– better rangesbetter ranges
Select KitchenSelect Kitchen Zone BathroomZone Bathroom

Driving growth at B&Q Driving growth at B&Q –– better rangesbetter ranges
•• New seasonal rangesNew seasonal ranges

Driving growth at B&Q Driving growth at B&Q –– better rangesbetter ranges
•• Air conditioningAir conditioning
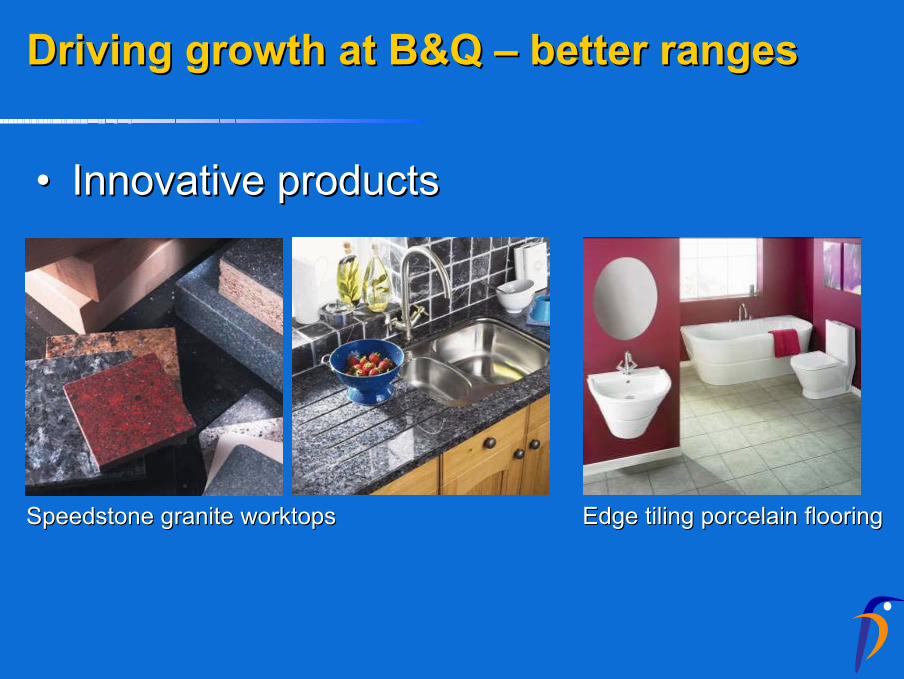
Driving growth at B&Q Driving growth at B&Q –– better ranges better ranges
•• Innovative productsInnovative products
SpeedstoneSpeedstone granite worktopsgranite worktops Edge tiling porcelain flooringEdge tiling porcelain flooring

Driving growth at B&Q Driving growth at B&Q –– better rangesbetter ranges
•• New own brand paintNew own brand paint

Driving growth at B&Q Driving growth at B&Q –– better valuebetter value
•• Price ReversePrice Reverse–– 5000 products reduced5000 products reduced–– Strong inStrong in--store communicationstore communication–– Strong advertising supportStrong advertising support–– Reinforce value messageReinforce value message

Driving growth at B&Q Driving growth at B&Q –– better better marketingmarketing
•• StyleStyle•• IndividualityIndividuality•• Clear value messageClear value message

Driving growth at B&Q Driving growth at B&Q –– better stores: better stores: minimini--WarehouseWarehouse
•• 42 mini42 mini--Warehouse conversions Warehouse conversions completecomplete
•• Average 12% uplifts in sales and profitsAverage 12% uplifts in sales and profits•• Positive uplift maintained in second year Positive uplift maintained in second year
of tradingof trading•• 22 conversions planned for 200522 conversions planned for 2005

Driving growth at B&Q Driving growth at B&Q –– better stores: better stores: Warehouse “stretch”Warehouse “stretch”
•• Unparalleled choice in the UKUnparalleled choice in the UK•• Trialling new ideas from France and Trialling new ideas from France and
ChinaChina•• 2 trial stretch stores2 trial stretch stores•• Broader customer appealBroader customer appeal
–– More project finishesMore project finishes–– Retained authority at the ‘harder’ endRetained authority at the ‘harder’ end


Driving growth at B&Q Driving growth at B&Q –– new storesnew stores
•• New stores for 2005New stores for 2005–– 5 Warehouse5 Warehouse–– 10 mini10 mini--WarehouseWarehouse–– 22 mini22 mini--Warehouse revampsWarehouse revamps
•• New miniNew mini--WarehousesWarehouses–– 20% of new space in last 2 years20% of new space in last 2 years
44
99
66
1111
1010
55
2003/42003/4 2004/52004/5 2005/62005/6
Mini WarehouseMini Warehouse
WarehouseWarehouse

Driving growth at B&Q Driving growth at B&Q –– better servicebetter service
•• Improve customer serviceImprove customer service–– More customer advisorsMore customer advisors–– More staff trainingMore staff training–– Service squadsService squads
–– Additional customer advisorsAdditional customer advisors–– Radio aided inRadio aided in--store communicationstore communication
–– Mystery shoppers/customer exit surveysMystery shoppers/customer exit surveys

Youcan
it…do

Gerry MurphyGerry MurphyChief ExecutiveChief Executive

Driving growth at Castorama Driving growth at Castorama –– better better ranges ranges
•• New themed decorative ranges New themed decorative ranges TechnicolourTechnicolourCharmCharm ContemporaryContemporaryAuthenticAuthentic


6.9€ 22.7€ 59.9€ 102.0€
Driving growth at Castorama Driving growth at Castorama –– better better rangesranges
Showers:Showers:•• Sourced in AsiaSourced in Asia•• Exclusive products, own brandsExclusive products, own brands

Driving growth at Castorama Driving growth at Castorama –– better better rangesranges
Kitchens Kitchens

Driving growth at Castorama Driving growth at Castorama –– better better valuevalue
•• Focus onFocus on–– More “Prix More “Prix JamaisJamais Vu” Special buysVu” Special buys–– More “premier prix”/entry level “Good” productsMore “premier prix”/entry level “Good” products–– More HIT More HIT CastoCasto branded “Better” productsbranded “Better” products–– Competitive prices on all best sellersCompetitive prices on all best sellers

Driving growth at Castorama Driving growth at Castorama –– better better marketingmarketing
•• New CataloguesNew Catalogues–– 3 issues3 issues–– c. 200 pages eachc. 200 pages each–– 4 million distribution 4 million distribution -- eacheach
•• New messagesNew messages–– Inspiring, innovative, Inspiring, innovative,
fashionable rangesfashionable ranges–– Affordable pricesAffordable prices–– Product and project adviceProduct and project advice

Driving growth at Castorama Driving growth at Castorama –– new & new & better storesbetter stores
•• Revamped storesRevamped stores–– Encouraging sales uplift from 2004 revamps, gathering paceEncouraging sales uplift from 2004 revamps, gathering pace–– 7 to be completed by spring 20057 to be completed by spring 2005
•• Relocated storesRelocated stores–– Sales uplift 16% from 2003 relocationsSales uplift 16% from 2003 relocations–– 2 planned for 20052 planned for 2005
•• New stores in new locationsNew stores in new locations–– 2 planned for 20052 planned for 2005
•• End 2005End 2005–– 25% space revitalised25% space revitalised
•• Transfers to Transfers to BricoBrico DépôtDépôt–– 2 in 2004, 1 planned for 20052 in 2004, 1 planned for 2005

Driving growth at Driving growth at BricoBrico DépôtDépôt –– now now 38% of Kingfisher sales in France38% of Kingfisher sales in France
•• More storesMore stores–– 64 end 200464 end 2004–– 6 new stores planned 20056 new stores planned 2005
•• More awarenessMore awareness–– Success of 2004 catalogueSuccess of 2004 catalogue–– 2005 catalogue imminent2005 catalogue imminent–– 9 million copies9 million copies
•• More capacityMore capacity–– First central distribution centre First central distribution centre
April 2005April 2005–– New IT systemsNew IT systems
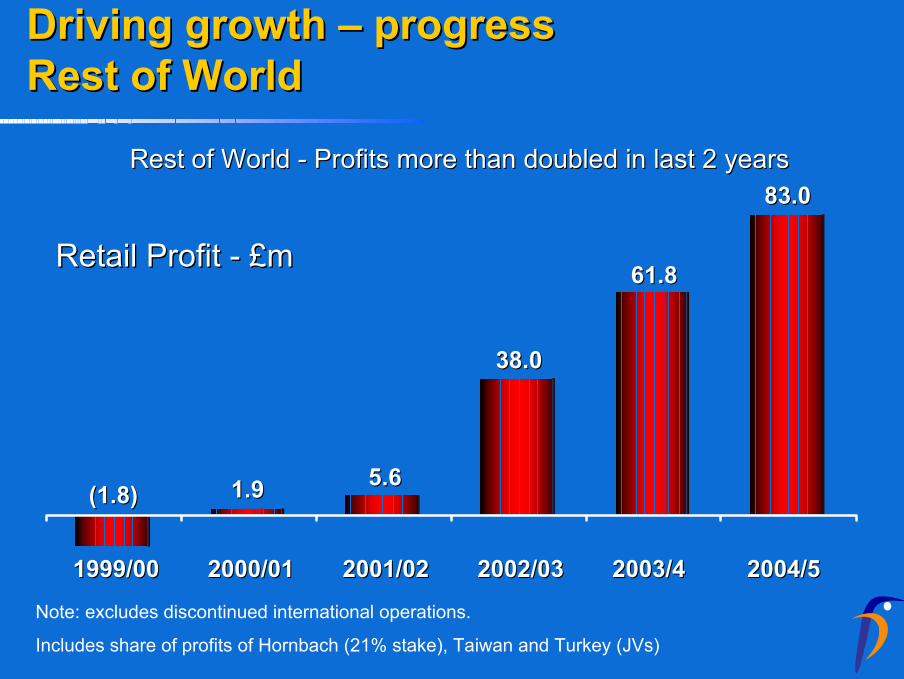
Driving growth Driving growth –– progress progress Rest of WorldRest of World
Rest of World Rest of World -- Profits more than doubled in last 2 yearsProfits more than doubled in last 2 years
Note: excludes discontinued international operations.
Includes share of profits of Hornbach (21% stake), Taiwan and Turkey (JVs)
1999/001999/00 2000/012000/01 2001/022001/02 2002/032002/03 2003/42003/4 2004/52004/5
Retail Profit Retail Profit -- £m£m
(1.8)(1.8) 1.91.9 5.65.6
38.038.0
61.861.8
83.083.0

Driving Driving –– continuing momentumcontinuing momentumRest of WorldRest of World
11+1+1--South KoreaSouth Korea
127127+32+329595TOTALTOTAL
88+4+444SpainSpain
66+1+155TurkeyTurkey
2020+2+21818TaiwanTaiwan
3434+13+132121ChinaChina
2727+5+52222ItalyItaly
3131+6+62525PolandPoland
Jan 2006 Jan 2006 EstEstPlanned 2005/6Planned 2005/6Stores Jan 2005Stores Jan 2005
And…Russia to comeAnd…Russia to come

ConclusionConclusion
•• Solid progress in 2004 in tougher marketsSolid progress in 2004 in tougher markets•• Focus on returns delivering resultsFocus on returns delivering results•• Continuing to invest for growthContinuing to invest for growth•• Slow start to 2005 and early EasterSlow start to 2005 and early Easter•• Clear plansClear plans
–– Drive B&Q and Castorama salesDrive B&Q and Castorama sales–– Expand Expand BricoBrico DépôtDépôt, Rest of World , Rest of World
•• Clear priorities Clear priorities –– growth and returnsgrowth and returns

Preliminary results 2004/05
Slides will be available atSlides will be available atwww.kingfisher.comwww.kingfisher.com

AppendicesAppendices

IFRS reduces earnings by 2.8%IFRS reduces earnings by 2.8%
456.2456.2
447.8447.8
469.5469.5£m£m
(4.6)%(4.6)%Earnings Earnings –– IFRS before oneIFRS before one--off off adjustmentsadjustments
8.48.4IAS 21 Functional CurrencyIAS 21 Functional Currency
(0.2)(0.2)OtherOther
% impact% impact£m£m
(2.8)%(2.8)%Earnings Earnings -- IFRSIFRS
(4.0)(4.0)(12.1)(12.1)
Leases/Lease incentivesLeases/Lease incentivesDeferred TaxDeferred Tax
(5.4)(5.4)Employee benefits/share based Employee benefits/share based paymentspayments
Earnings Earnings -- UK GAAPUK GAAP

IFRS reduces closing net assets by 11%IFRS reduces closing net assets by 11%(opening net assets: 7% reduction)(opening net assets: 7% reduction)
4,576.14,576.14106.14106.1Net assets before reversal of 2005 Net assets before reversal of 2005 property revaluationproperty revaluation
(185.1)(185.1)Reversal of property valuationReversal of property valuation
159.7159.7143.4143.4DividendsDividends3.13.1(2.6)(2.6)OtherOther
ClosingClosingOpeningOpening£m£m£m£m
4,391.04,391.0
(25.1)(25.1)
(205.9)(205.9)(279.9)(279.9)4,924.24,924.2
4,106.14,106.1Net assets Net assets -- IFRSIFRS
(21.0)(21.0)Leases/lease incentivesLeases/lease incentives
(151.5)(151.5)Employee benefits/share based Employee benefits/share based paymentspayments
(268.8)(268.8)Deferred TaxDeferred Tax4,406.64,406.6Net assets Net assets -- UK GAAPUK GAAP
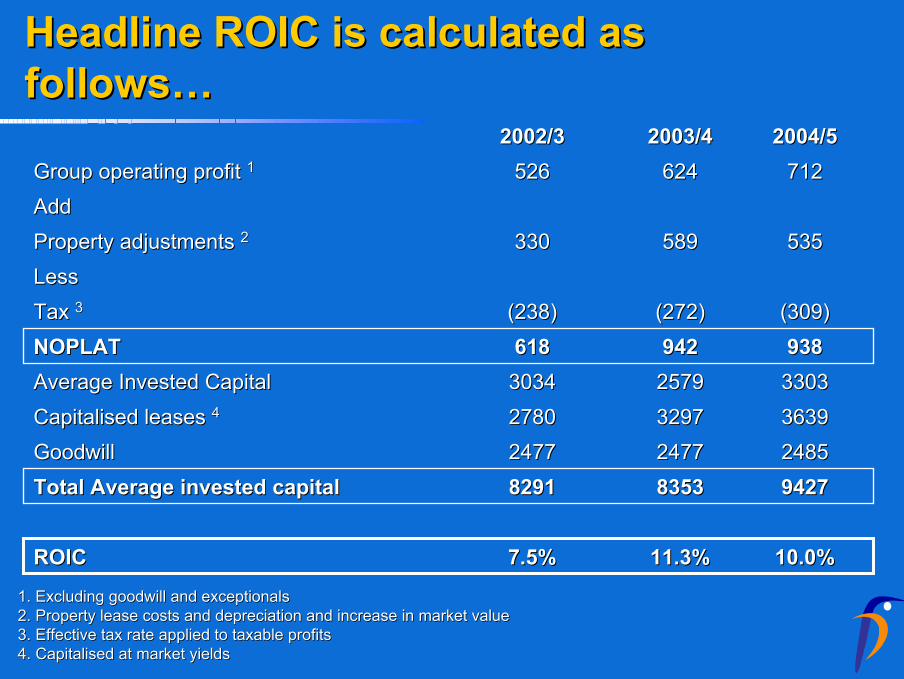
Headline ROIC is calculated as Headline ROIC is calculated as follows…follows…
942794278353835382918291Total Average invested capitalTotal Average invested capital
330333032579257930343034Average Invested CapitalAverage Invested Capital
363936393297329727802780Capitalised leases Capitalised leases 44
248524852477247724772477GoodwillGoodwill
10.0%10.0%11.3%11.3%7.5%7.5%ROICROIC
938938942942618618NOPLATNOPLAT(309)(309)(272)(272)(238)(238)Tax Tax 33
LessLess535535589589330330Property adjustments Property adjustments 22
AddAdd712712624624526526Group operating profit Group operating profit 11
2004/52004/52003/42003/42002/32002/3
1. Excluding goodwill and 1. Excluding goodwill and exceptionalsexceptionals2. Property lease costs and depreciation and increase in market 2. Property lease costs and depreciation and increase in market valuevalue3. Effective tax rate applied to taxable profits3. Effective tax rate applied to taxable profits4. Capitalised at market yields4. Capitalised at market yields

Underlying ROIC assumes value neutral Underlying ROIC assumes value neutral property market growth……property market growth……
915791578259825983298329Total Average invested capitalTotal Average invested capital
303330332486248630723072Average Invested CapitalAverage Invested Capital
363936393297329727802780Capitalised leases Capitalised leases 44
248524852477247724772477GoodwillGoodwill
8.9%8.9%8.7%8.7%7.6%7.6%ROICROIC
817817720720636636NOPLATNOPLAT(309)(309)(272)(272)(238)(238)Tax Tax 33
LessLess414414367367348348Property adjustments Property adjustments 22
AddAdd712712624624526526Group operating profit Group operating profit 11
2004/52004/52003/42003/42002/32002/3
1. Excluding goodwill and 1. Excluding goodwill and exceptionalsexceptionals2. Property lease costs and depreciation and assumes value neutr2. Property lease costs and depreciation and assumes value neutral growthal growth3. Effective tax rate applied to taxable profits3. Effective tax rate applied to taxable profits4. Capitalised at market yields4. Capitalised at market yields