crop yield & production trends in western canada yield trends final.pdf · 3 • data...
TRANSCRIPT

Crop Yield & Production
Trends in
Western Canada
R.J. Graf March 2013
2
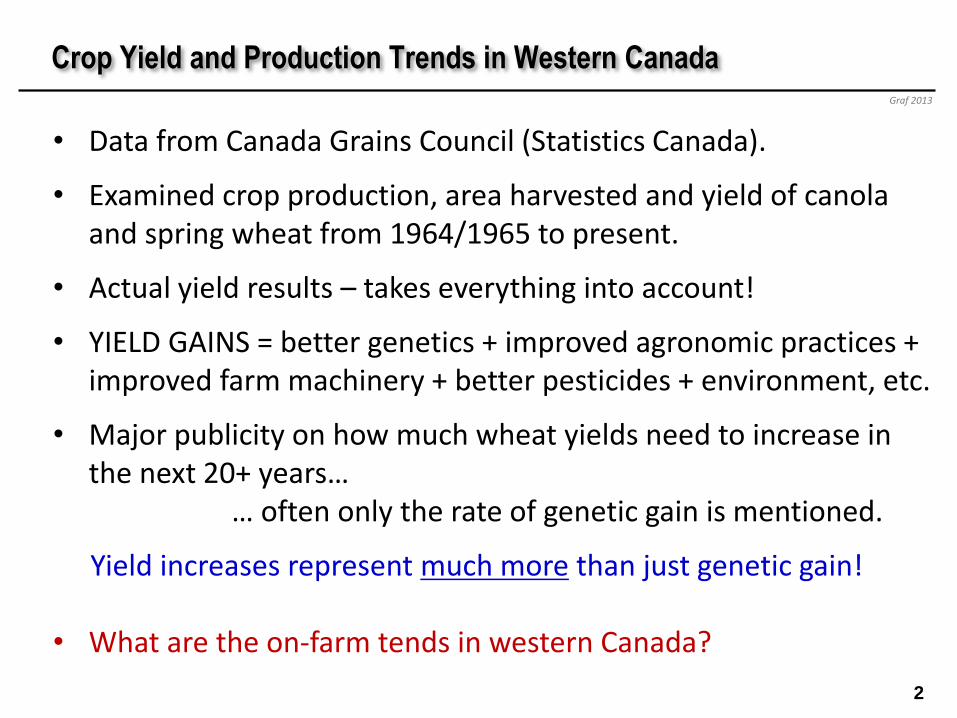
• Data from Canada Grains Council (Statistics Canada).
• Examined crop production, area harvested and yield of canola and spring wheat from 1964/1965 to present.
• Actual yield results – takes everything into account!
• YIELD GAINS = better genetics + improved agronomic practices + improved farm machinery + better pesticides + environment, etc.
• Major publicity on how much wheat yields need to increase in the next 20+ years…
… often only the rate of genetic gain is mentioned.
Yield increases represent much more than just genetic gain!
• What are the on-farm tends in western Canada?
Graf 2013
Crop Yield and Production Trends in Western Canada
3
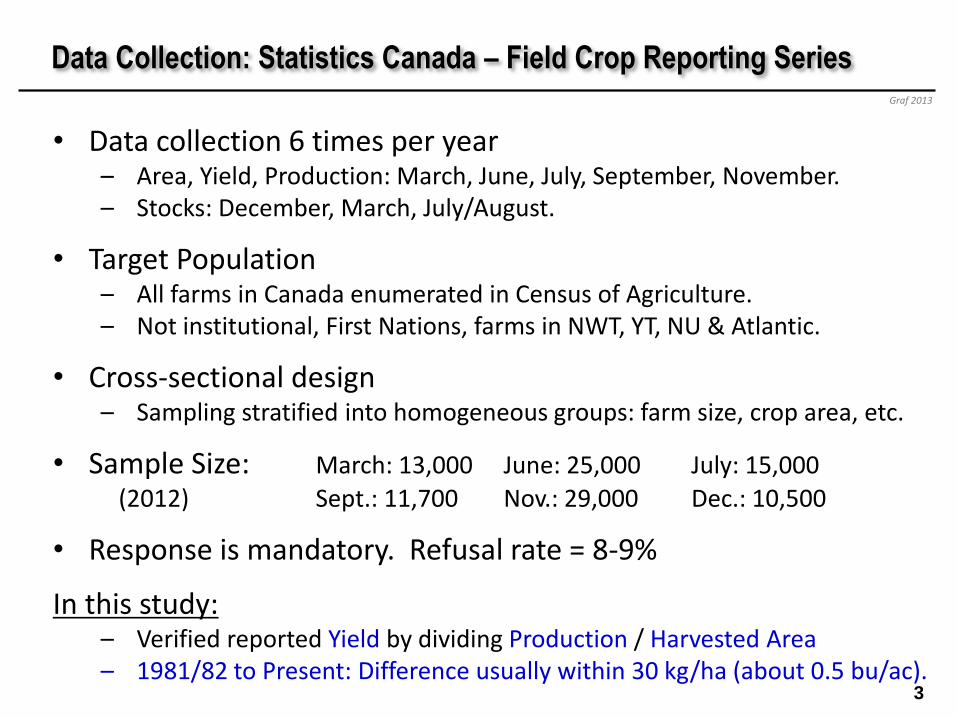
• Data collection 6 times per year – Area, Yield, Production: March, June, July, September, November. – Stocks: December, March, July/August.
• Target Population – All farms in Canada enumerated in Census of Agriculture. – Not institutional, First Nations, farms in NWT, YT, NU & Atlantic.
• Cross-sectional design – Sampling stratified into homogeneous groups: farm size, crop area, etc.
• Sample Size: March: 13,000 June: 25,000 July: 15,000
(2012) Sept.: 11,700 Nov.: 29,000 Dec.: 10,500
• Response is mandatory. Refusal rate = 8-9%
In this study: – Verified reported Yield by dividing Production / Harvested Area – 1981/82 to Present: Difference usually within 30 kg/ha (about 0.5 bu/ac).
Graf 2013
Data Collection: Statistics Canada – Field Crop Reporting Series

y = 30.926x + 1504.6
y = 26.242x + 1508.0
y = 17.617x + 1437.2
0
500
1000
1500
2000
2500
3000
3500
19
64
/65
19
65
/66
19
66
/67
19
67
/68
19
68
/69
19
69
/70
19
70
/71
19
71
/72
19
72
/73
19
73
/74
19
74
/75
19
75
/76
19
76
/77
19
77
/78
19
78
/79
19
79
/80
19
80
/81
19
81
/82
19
82
/83
19
83
/84
19
84
/85
19
85
/86
19
86
/87
19
87
/88
19
88
/89
19
89
/90
19
90
/91
19
91
/92
19
92
/93
19
93
/94
19
94
/95
19
95
/96
19
96
/97
19
97
/98
19
98
/99
19
99
/00
20
00
/01
20
01
/02
20
02
/03
20
03
/04
20
04
/05
20
05
/06
20
06
/07
20
07
/08
20
08
/09
20
09
/10
20
10
/11
20
11
/12
20
12
/13
Yie
ld (
kg/h
a)
Spring wheat yield, 1964/65 - 2012/13
AB
MB
SK
Linear (AB)
Linear (MB)
Linear (SK)
4
Graf 2013
Spring Wheat Yields by Province (1964/65 - 2012/13)
wheat canola
500 7 9
1000 15 18
1500 22 27
2000 30 36
2500 37 45
3000 45 54
3500 52 62
4000 59 71
Bu/acKg/Ha

y = 24.19x + 729.67
y = 20.422x + 840.38
y = 13.242x + 920.86
0
500
1000
1500
2000
2500
19
64
/65
19
65
/66
19
66
/67
19
67
/68
19
68
/69
19
69
/70
19
70
/71
19
71
/72
19
72
/73
19
73
/74
19
74
/75
19
75
/76
19
76
/77
19
77
/78
19
78
/79
19
79
/80
19
80
/81
19
81
/82
19
82
/83
19
83
/84
19
84
/85
19
85
/86
19
86
/87
19
87
/88
19
88
/89
19
89
/90
19
90
/91
19
91
/92
19
92
/93
19
93
/94
19
94
/95
19
95
/96
19
96
/97
19
97
/98
19
98
/99
19
99
/00
20
00
/01
20
01
/02
20
02
/03
20
03
/04
20
04
/05
20
05
/06
20
06
/07
20
07
/08
20
08
/09
20
09
/10
20
10
/11
20
11
/12
20
12
/13
Yie
ld (
kg/h
a)
Rapeseed / Canola yield, 1964/65 - 2012/13
AB
MB
SK
Linear (AB)
Linear (MB)
Linear (SK)
5
Graf 2013
Canola Yields by Province (1964/65 - 2012/13)
wheat canola
500 7 9
1000 15 18
1500 22 27
2000 30 36
2500 37 45
3000 45 54
3500 52 62
4000 59 71
Bu/acKg/Ha

6
• 1981/1982 – good starting point. • 1981: registration of Katepwa CWRS wheat. • 1982: registration of Westar B. napus canola. • Yield penalty associated with canola quality now overcome. • Canola well adapted and agronomic systems established.
• Another break at 2000/2001. • WGRF wheat investment (1994) starts producing varieties. • Hybrid canola starting to be introduced – not yet popular. • Herbicide tolerant canola on about 50% of acres.
• Location of “break” is somewhat arbitrary and will affect results. • Trend from 1981/1982 to present is most robust. • What changed during the two periods?
Graf 2013
Trend Line Analysis

y = 39.47x + 1862.5
y = 26.874x + 1952
y = 22.266x + 1641.1
0
500
1000
1500
2000
2500
3000
3500
19
81
/82
19
82
/83
19
83
/84
19
84
/85
19
85
/86
19
86
/87
19
87
/88
19
88
/89
19
89
/90
19
90
/91
19
91
/92
19
92
/93
19
93
/94
19
94
/95
19
95
/96
19
96
/97
19
97
/98
19
98
/99
19
99
/00
20
00
/01
20
01
/02
20
02
/03
20
03
/04
20
04
/05
20
05
/06
20
06
/07
20
07
/08
20
08
/09
20
09
/10
20
10
/11
20
11
/12
20
12
/13
Yie
ld (
kg/h
a)
Spring wheat yield, 1981/82 - 2012/13
AB
MB
SK
Linear (AB)
Linear (MB)
Linear (SK)
7
Graf 2013
Spring Wheat Yields by Province (1981/82 - 2012/13)
wheat canola
500 7 9
1000 15 18
1500 22 27
2000 30 36
2500 37 45
3000 45 54
3500 52 62
4000 59 71
Bu/acKg/Ha

y = 29.943x + 1025.9
y = 24.051x + 1119.2
y = 17.105x + 1068.2
0
500
1000
1500
2000
2500
19
81
/82
19
82
/83
19
83
/84
19
84
/85
19
85
/86
19
86
/87
19
87
/88
19
88
/89
19
89
/90
19
90
/91
19
91
/92
19
92
/93
19
93
/94
19
94
/95
19
95
/96
19
96
/97
19
97
/98
19
98
/99
19
99
/00
20
00
/01
20
01
/02
20
02
/03
20
03
/04
20
04
/05
20
05
/06
20
06
/07
20
07
/08
20
08
/09
20
09
/10
20
10
/11
20
11
/12
20
12
/13
Yie
ld (
kg/h
a)
Canola yield, 1981/82 - 2012/13
AB
MB
SK
Linear (AB)
Linear (MB)
Linear (SK)
8
Graf 2013
Canola Yields by Province (1981/82 - 2012/13)
wheat canola
500 7 9
1000 15 18
1500 22 27
2000 30 36
2500 37 45
3000 45 54
3500 52 62
4000 59 71
Bu/acKg/Ha

AB SK MB PP
1981/82 to 2012/13 Spring wheat 63% 42% 43% 43%
Canola 80% 45% 66% 56%
1981/82 to 1999/00 Spring wheat 40% 26% 14% 25%
Canola 21% 5% 42% 18%
2000/01 to 2012/13 Spring wheat 42% 49% 17% 42%
Canola 50% 60% 17% 36%
9
Based on exponential curve fitting Graf 2013
Yield Increases over Time

AB SK MB PP
1981/82 to 2012/13 Spring wheat 63% 42% 43% 43%
Canola 80% 45% 66% 56%
1981/82 to 1999/00 Spring wheat 40% 26% 14% 25%
Canola 21% 5% 42% 18%
2000/01 to 2012/13 Spring wheat 42% 49% 17% 42%
Canola 50% 60% 17% 36%
10
Based on exponential curve fitting Graf 2013
Yield Increases over Time

11
Based on exponential curve fitting Graf 2013
Using percentage increase can be misleading… • Number of data points and type of curve fitting affects results. • Yield of canola is lower than wheat. • E.g.: a 5¢ increase in a penny stock represents a large % increase
compared to a 5¢ increase in a high value stock.
AB SK MB PP
1981/82 to 2012/13 Spring wheat 63% 42% 43% 43%
Canola 80% 45% 66% 56%
1981/82 to 1999/00 Spring wheat 40% 26% 14% 25%
Canola 21% 5% 42% 18%
2000/01 to 2012/13 Spring wheat 42% 49% 17% 42%
Canola 50% 60% 17% 36%
Yield Increases over Time
AB SK MB PP
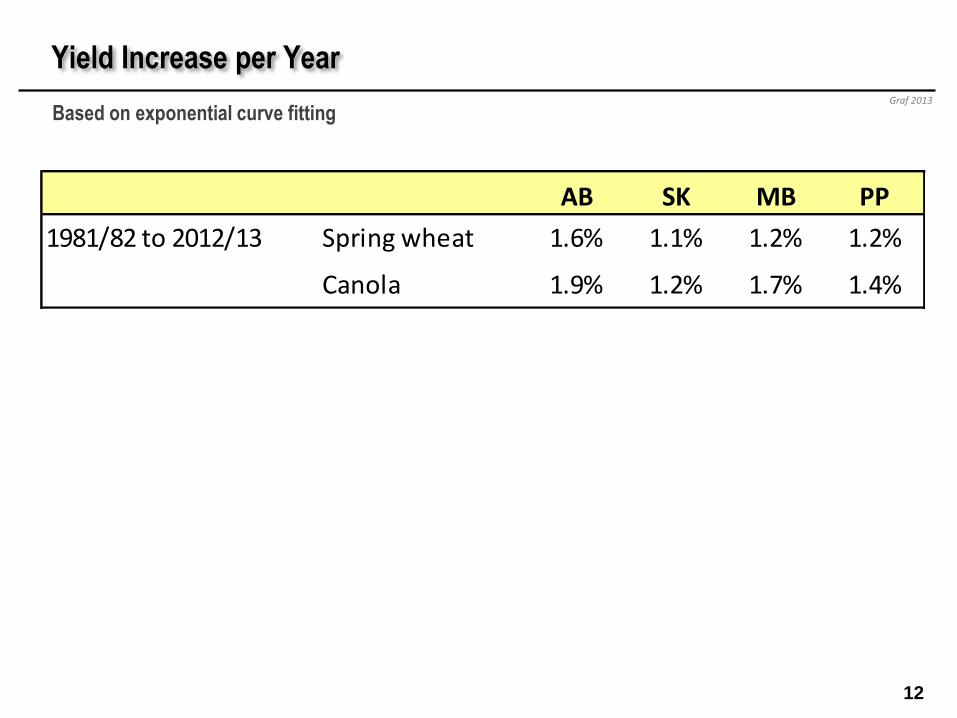
1981/82 to 2012/13 Spring wheat 1.6% 1.1% 1.2% 1.2%
Canola 1.9% 1.2% 1.7% 1.4%
1981/82 to 1999/00 Spring wheat 1.9% 1.3% 0.7% 1.3%
Canola 1.1% 0.3% 2.0% 0.9%
2000/01 to 2012/13 Spring wheat 3.0% 3.4% 1.3% 2.9%
Canola 3.4% 4.0% 1.3% 2.6%
12
Based on exponential curve fitting Graf 2013
Yield Increase per Year
AB SK MB PP
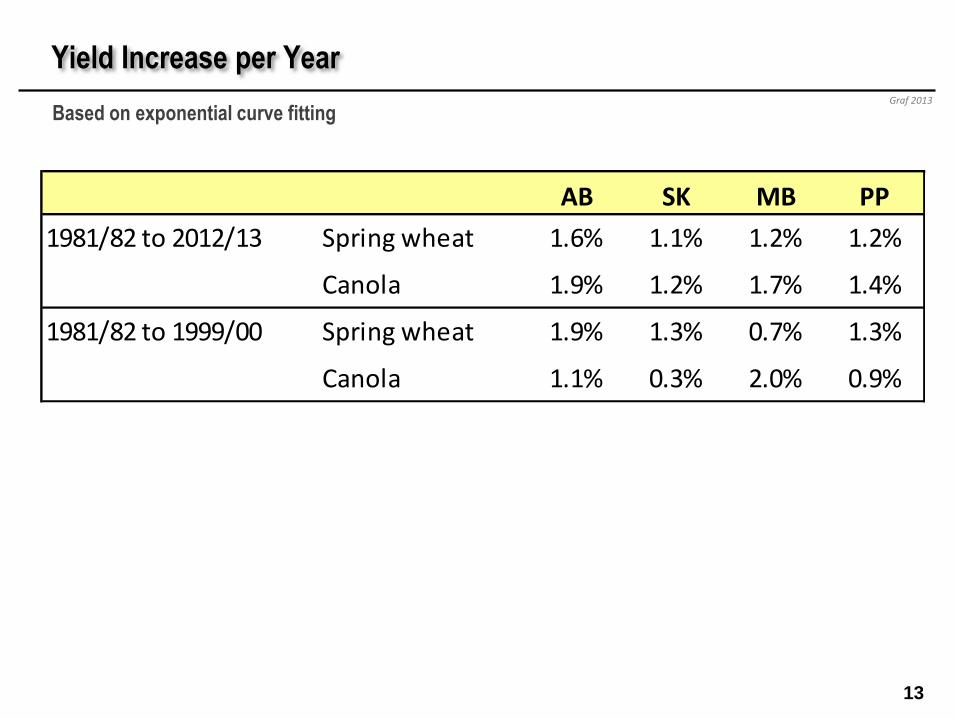
1981/82 to 2012/13 Spring wheat 1.6% 1.1% 1.2% 1.2%
Canola 1.9% 1.2% 1.7% 1.4%
1981/82 to 1999/00 Spring wheat 1.9% 1.3% 0.7% 1.3%
Canola 1.1% 0.3% 2.0% 0.9%
2000/01 to 2012/13 Spring wheat 3.0% 3.4% 1.3% 2.9%
Canola 3.4% 4.0% 1.3% 2.6%
13
Based on exponential curve fitting Graf 2013
Yield Increase per Year

14
Based on exponential curve fitting Graf 2013
Remember that using percentage increase can be misleading…
Yield Increase per Year
AB SK MB PP
1981/82 to 2012/13 Spring wheat 1.6% 1.1% 1.2% 1.2%
Canola 1.9% 1.2% 1.7% 1.4%
1981/82 to 1999/00 Spring wheat 1.9% 1.3% 0.7% 1.3%
Canola 1.1% 0.3% 2.0% 0.9%
2000/01 to 2012/13 Spring wheat 3.0% 3.4% 1.3% 2.9%
Canola 3.4% 4.0% 1.3% 2.6%
y = 26.284x + 1825.4
y = 21.208x + 1081.9
0
500
1000
1500
2000
2500
3000
3500
19
81
/82
19
82
/83
19
83
/84
19
84
/85
19
85
/86
19
86
/87
19
87
/88
19
88
/89
19
89
/90
19
90
/91
19
91
/92
19
92
/93
19
93
/94
19
94
/95
19
95
/96
19
96
/97
19
97
/98
19
98
/99
19
99
/00
20
00
/01
20
01
/02
20
02
/03
20
03
/04
20
04
/05
20
05
/06
20
06
/07
20
07
/08
20
08
/09
20
09
/10
20
10
/11
20
11
/12
20
12
/13
Yie
ld (
kg/h
a)
Prairie province spring wheat and canola yield, 1981/82 - 2012/13
PP Wheat Yield
PP Canola Yield
Linear (PP Wheat Yield)
Linear (PP Canola Yield)
15
Graf 2013
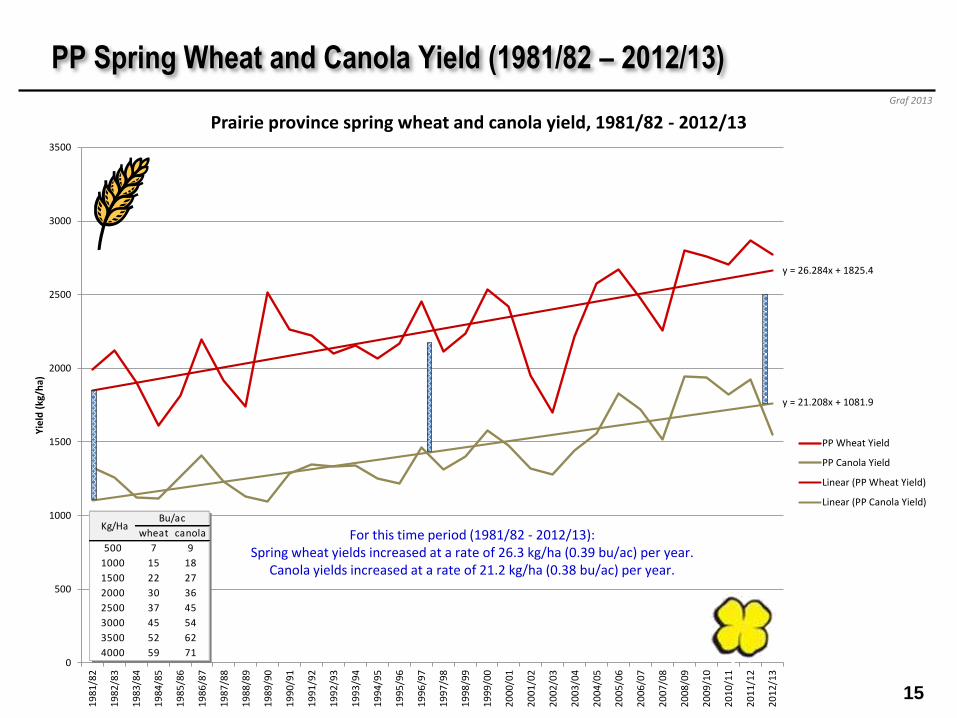
PP Spring Wheat and Canola Yield (1981/82 – 2012/13)
For this time period (1981/82 - 2012/13): Spring wheat yields increased at a rate of 26.3 kg/ha (0.39 bu/ac) per year.
Canola yields increased at a rate of 21.2 kg/ha (0.38 bu/ac) per year.
wheat canola
500 7 9
1000 15 18
1500 22 27
2000 30 36
2500 37 45
3000 45 54
3500 52 62
4000 59 71
Bu/acKg/Ha

y = 0.1745x + 60.64
0
10
20
30
40
50
60
70
80
90
100
19
81
/82
19
82
/83
19
83
/84
19
84
/85
19
85
/86
19
86
/87
19
87
/88
19
88
/89
19
89
/90
19
90
/91
19
91
/92
19
92
/93
19
93
/94
19
94
/95
19
95
/96
19
96
/97
19
97
/98
19
98
/99
19
99
/00
20
00
/01
20
01
/02
20
02
/03
20
03
/04
20
04
/05
20
05
/06
20
06
/07
20
07
/08
20
08
/09
20
09
/10
20
10
/11
20
11
/12
20
12
/13
Can
ola
Yie
ld (
% W
he
at)
Prairie canola yield as a percent of wheat yield, 1981/82 - 2012/13
Canola Yield
Linear (Canola Yield)
16
Graf 2013
PP Canola Yield relative to Spring Wheat (1981/82 - 2012/13)
Based on this method of calculation, canola yields increased 0.17% per year faster than spring wheat.

17
1981/1982 to 1999/2000 versus 2000/2001 to present: • What influenced the rate of gain? • What was the yield gain per dollar invested?
– 2011/12: Total Wheat Investment = approx. $25 Million. Spring Wheat: • WGRF supported varieties start be registered. • First CWRS varieties with ND germplasm (McKenzie, Superb, etc.) • First semi-dwarf CWRS varieties (Superb, CDC Go, etc.) • Wheat midge resistance introduced (Unity, Goodeve, etc.) • FHB resistance breeding reduced rate of progress.
Graf 2013
Comments: Spring Wheat
Source: AAFC

18
1981/1982 to 1999/2000 versus 2000/2001 to present: • What influenced the rate of gain? • What was the yield gain per dollar invested?
– 2011/12: Total Canola Investment = approx. $80 Million. Canola: • Excellent weed control with herbicide resistance. • Hybrids introduced and eventually predominate. • Lower yielding B. rapa (Polish canola) phased out. • Increased investment by private industry.
Graf 2013
Comments: Canola
Source: CSTA

19
Given that: • The input costs of canola (not just seed) are higher than wheat. • There is good potential for excellent net returns from canola. The result has been: • Better (best?) management practices are applied to canola. • Canola is usually seeded on the best land available. • As canola acreage increases the “next best” available land is
likely to be diverted away from wheat (and other crops). • Wheat has become a “secondary” crop that does not necessarily
receive the same care as canola. This trend also reduced the observed rate of yield gain in wheat.
Graf 2013
Canola Grown and Managed in Preference to Wheat

y = -185.67x + 22197
y = -179.37x + 11583
0
2000
4000
6000
8000
10000
12000
14000
16000
0
5000
10000
15000
20000
25000
30000
19
81
/82
19
82
/83
19
83
/84
19
84
/85
19
85
/86
19
86
/87
19
87
/88
19
88
/89
19
89
/90
19
90
/91
19
91
/92
19
92
/93
19
93
/94
19
94
/95
19
95
/96
19
96
/97
19
97
/98
19
98
/99
19
99
/00
20
00
/01
20
01
/02
20
02
/03
20
03
/04
20
04
/05
20
05
/06
20
06
/07
20
07
/08
20
08
/09
20
09
/10
20
10
/11
20
11
/12
20
12
/13
Har
vest
ed
Are
a (H
a x
10
00
)
Pro
du
ctio
n (
ton
ne
s x
10
00
)
Prairie Provinces: Total Production and Harvested Area - Spring Wheat
Production
Area
Linear (Production)
Linear (Area)
20
Graf 2013
PP Spring Wheat Production & Harvested Area (1981/82 - 2012/13)
For this time period, for every hectare taken out of spring wheat production, total spring wheat production was reduced by 1.03 tonnes.
(Average spring wheat yield over period = 2.22 t/ha)

y = 336.85x + 924.73
y = 162.21x + 1651.6
0
2000
4000
6000
8000
10000
12000
14000
16000
0
5000
10000
15000
20000
25000
30000
19
81
/82
19
82
/83
19
83
/84
19
84
/85
19
85
/86
19
86
/87
19
87
/88
19
88
/89
19
89
/90
19
90
/91
19
91
/92
19
92
/93
19
93
/94
19
94
/95
19
95
/96
19
96
/97
19
97
/98
19
98
/99
19
99
/00
20
00
/01
20
01
/02
20
02
/03
20
03
/04
20
04
/05
20
05
/06
20
06
/07
20
07
/08
20
08
/09
20
09
/10
20
10
/11
20
11
/12
20
12
/13
Har
vest
ed
Are
a (H
a x
10
00
)
Pro
du
ctio
n (
ton
ne
s x
10
00
)
Prairie Provinces: Total Production and Harvested Area - Canola
Production
Area
Linear (Production)
Linear (Area)
21
Graf 2013
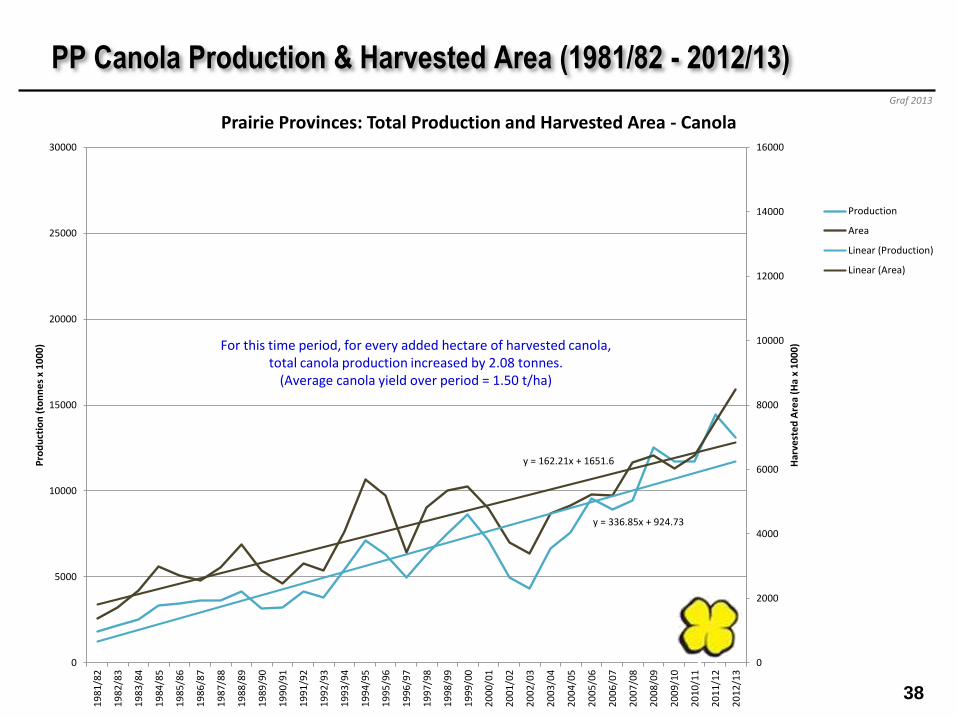
PP Canola Production & Harvested Area (1981/82 - 2012/13)
For this time period, for every added hectare of harvested canola, total canola production increased by 2.08 tonnes.
(Average canola yield over period = 1.50 t/ha)

22
Graf 2013
1981/82 to 1999/00: • Average spring wheat yield = 2.10 t/ha (31.3 bu/ac). • Rate of yield increase = 1.25% per year. • Average canola yield = 1.30 t/ha (23.2 bu/ac). • Rate of yield increase = 0.92% per year.
2000/01 to 2012/13: • Average spring wheat yield = 2.47 t/ha (36.7 bu/ac). • Rate of yield increase = 2.94% per year (1.08 bu/ac per year). • Average canola yield = 1.37 t/ha (29.9 bu/ac). • Rate of yield increase = 2.62% per year (0.78 bu/ac per year).
Plant breeding investment required to sustain current overall rates of yield increase (based on 2011/12 investments)
• Wheat: $25 Million per year. • Canola: $80 Million per year.
Have Things Changed Since 2000/01?

y = 68.137x + 1996.4
y = 41.509x + 1349.9
0
500
1000
1500
2000
2500
3000
3500
20
00
/01
20
01
/02
20
02
/03
20
03
/04
20
04
/05
20
05
/06
20
06
/07
20
07
/08
20
08
/09
20
09
/10
20
10
/11
20
11
/12
20
12
/13
Yie
ld (
kg/h
a)
Prairie province spring wheat and canola yield, 2000/01 - 2012/13
PP Wheat Yield
PP Canola Yield
Linear (PP Wheat Yield)
Linear (PP Canola Yield)
23
Graf 2013
PP Spring Wheat and Canola Yield (2000/01 – 2012/13)
For this time period (2000/01 – 2012/13): Spring wheat yields increased at a rate of 68.1 kg/ha (1.01 bu/ac) per year.
Canola yields increased at a rate of 41.5 kg/ha (0.74 bu/ac) per year.
wheat canola
500 7 9
1000 15 18
1500 22 27
2000 30 36
2500 37 45
3000 45 54
3500 52 62
4000 59 71
Bu/acKg/Ha
y = -0.1928x + 67.921
0
10
20
30
40
50
60
70
80
90
100
20
00
/01
20
01
/02
20
02
/03
20
03
/04
20
04
/05
20
05
/06
20
06
/07
20
07
/08
20
08
/09
20
09
/10
20
10
/11
20
11
/12
20
12
/13
Can
ola
Yie
ld (
% W
he
at)
Prairie canola yield as a percent of wheat yield, 2000/01 - 2012/13
Canola Yield
Linear (Canola Yield)
24
Graf 2013
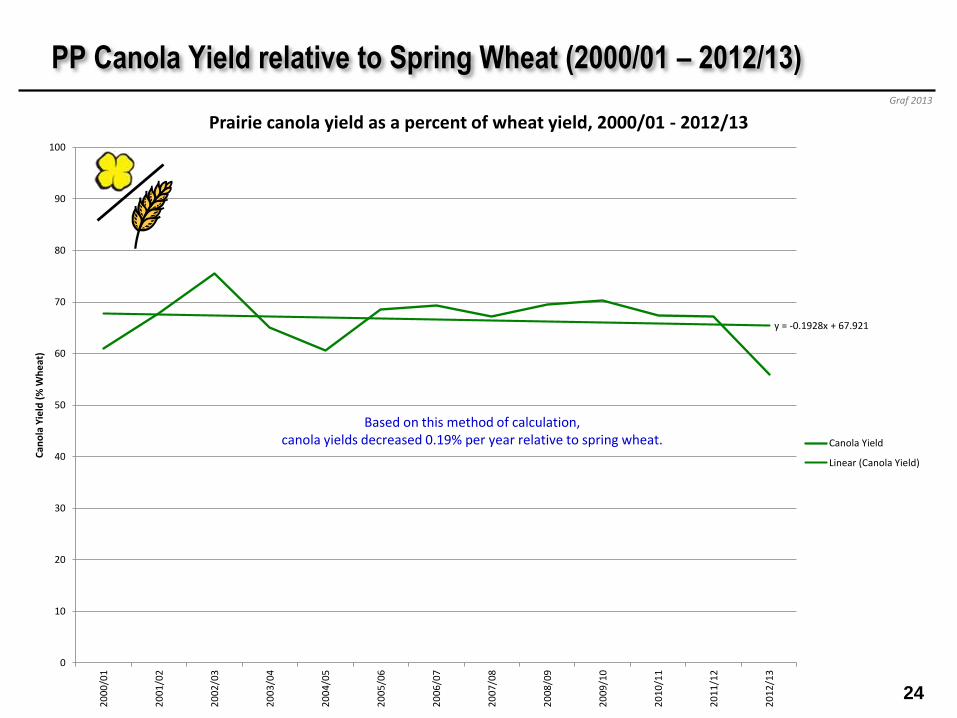
PP Canola Yield relative to Spring Wheat (2000/01 – 2012/13)
Based on this method of calculation, canola yields decreased 0.19% per year relative to spring wheat.
y = 58.561x + 2298
y = 52.925x + 1479.5
0
500
1000
1500
2000
2500
3000
3500
20
03
/04
20
04
/05
20
05
/06
20
06
/07
20
07
/08
20
08
/09
20
09
/10
20
10
/11
20
11
/12
Yie
ld (
kg/h
a)
Prairie province spring wheat and canola yield, 2003/04 - 2011/12
PP Wheat Yield
PP Canola Yield
Linear (PP Wheat Yield)
Linear (PP Canola Yield)
25
Graf 2013
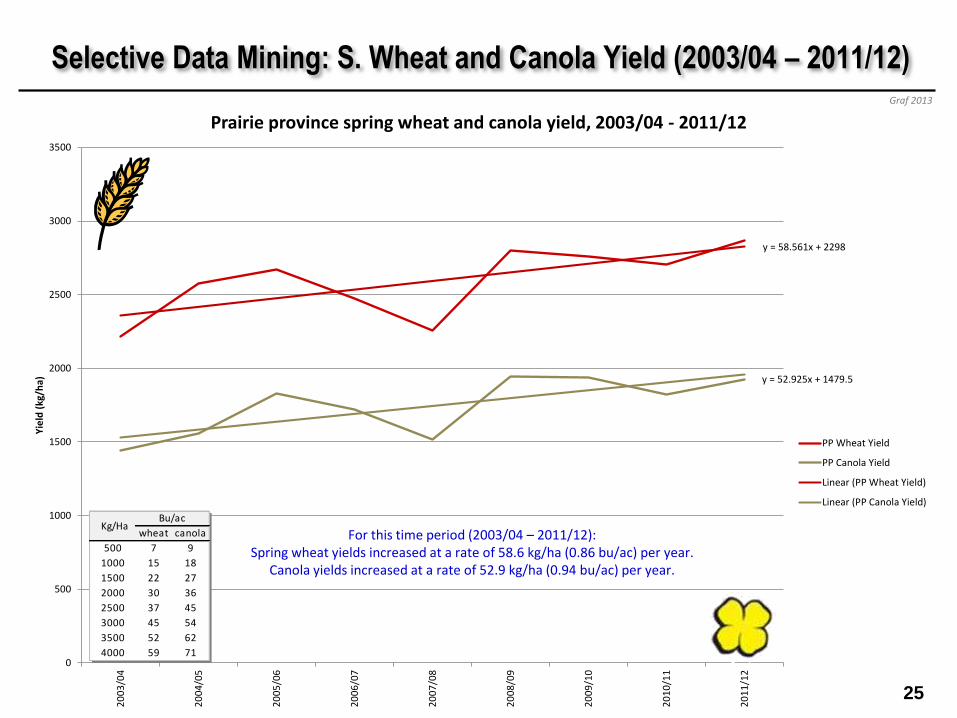
Selective Data Mining: S. Wheat and Canola Yield (2003/04 – 2011/12)
For this time period (2003/04 – 2011/12): Spring wheat yields increased at a rate of 58.6 kg/ha (0.86 bu/ac) per year.
Canola yields increased at a rate of 52.9 kg/ha (0.94 bu/ac) per year.
wheat canola
500 7 9
1000 15 18
1500 22 27
2000 30 36
2500 37 45
3000 45 54
3500 52 62
4000 59 71
Bu/acKg/Ha

y = 0.5364x + 64.562
0
10
20
30
40
50
60
70
80
90
100
20
03
/04
20
04
/05
20
05
/06
20
06
/07
20
07
/08
20
08
/09
20
09
/10
20
10
/11
20
11
/12
Can
ola
Yie
ld (
% W
he
at)
Prairie canola yield as a percent of wheat yield, 2003/04 - 2011/12
Canola Yield
Linear (Canola Yield)
26
Graf 2013
Selective Data Mining: Canola relative to S. Wheat (2003/04 – 2011/12)
By doing some “cherry-picking” of the data, this trend line indicates that
canola yields increased 0.54% faster than spring wheat.

27
While yield net returns ultimately pay the bills…
• What is disease resistance worth vs. the cost of fungicides?
• KVD reduced progress in wheat – effects of removal just starting.
• Wheat yield gains were made with current registration system. • More difficult to determine differences with less testing. • Can’t tell the difference? Mediocrity increases.
• Is there a “problem” that needs fixing?
• Yield may increase faster with fewer registration “impediments”. • Every trait added reduces effective population size. • What are some of these impediments?
Graf 2013
Questions to Ponder…

28
Disease resistance: - Stem rust? - Leaf rust? - Stripe rust? - FHB? - Bunt? - Loose smut? - Leaf spots?
Agronomics: - Early maturity? - Sprouting tolerance?
Pest resistance: - Wheat stem sawfly? - Wheat midge? - Wheat curl mite?
Quality: - Sprouting resistance? - Protein content? - Milling yield? - Consistency?
Graf 2013
Fewer registration “impediments” may mean faster progress: • Every trait added reduces effective population size. • What are some of these impediments?
A Double-Edged Sword
• Every trait added will slow down progress in other traits. • What are the benefits/costs for these and other traits? • Is the added cost of fungicides, potential grade loss, etc.
offset by higher yields?

29
• Spring wheat yields have not stagnated in western Canada.
• On-farm spring wheat and canola yields have increased substantially, particularly since 2000/01.
• Observed rates of on-farm yield increase were faster from 2000/01 – 2012/13 than 1981/82 – 1999/00 for both crops.
• 1981/82 – 1999/00: S. wheat yields increased faster than canola.
• Since 2000/01: Rate of canola yield increase is faster than wheat.
• Environment plays a large role in observing yield potential.
• Greater breeding investment resulted in higher rates of progress.
• The registration system for wheat has not been a major “bottleneck” to the introduction of superior genetics.
Graf 2013
A Few Basic Conclusions
30
Thank You
Dr. Robert Graf
Agriculture & Agri-Food Canada
Lethbridge Research Centre
5403 - 1st Avenue South
P.O. Box 3000
Lethbridge, AB T1J 4B1
Tel.: 403-317-2258
E-Mail: [email protected]
31
Supplementary Information

32
1981/82 - 2012/13 complete set of graphs
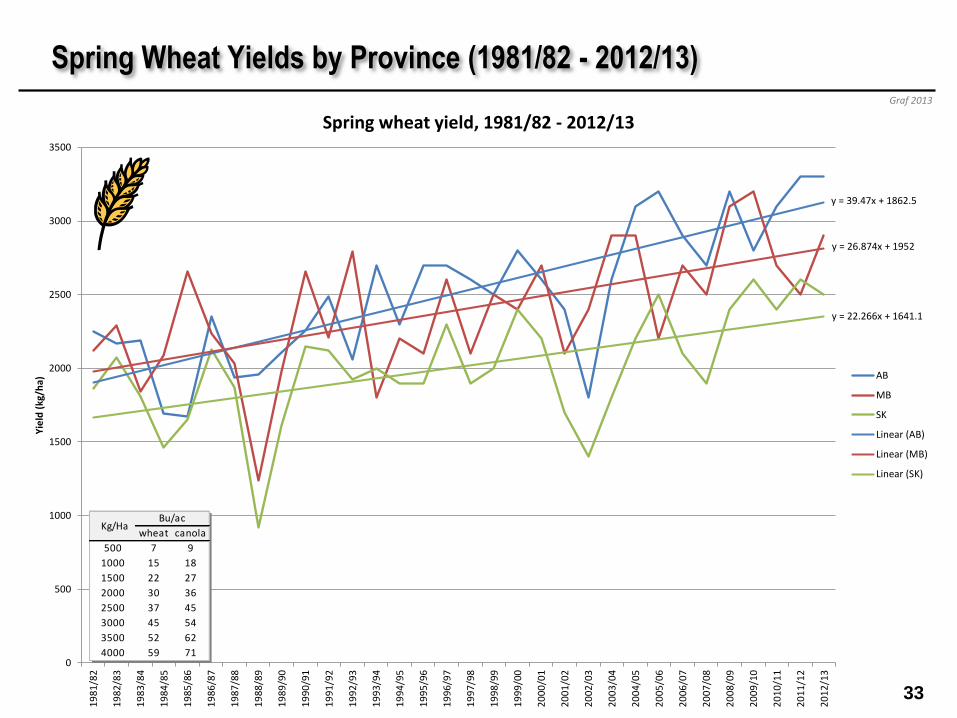
y = 39.47x + 1862.5
y = 26.874x + 1952
y = 22.266x + 1641.1
0
500
1000
1500
2000
2500
3000
3500
19
81
/82
19
82
/83
19
83
/84
19
84
/85
19
85
/86
19
86
/87
19
87
/88
19
88
/89
19
89
/90
19
90
/91
19
91
/92
19
92
/93
19
93
/94
19
94
/95
19
95
/96
19
96
/97
19
97
/98
19
98
/99
19
99
/00
20
00
/01
20
01
/02
20
02
/03
20
03
/04
20
04
/05
20
05
/06
20
06
/07
20
07
/08
20
08
/09
20
09
/10
20
10
/11
20
11
/12
20
12
/13
Yie
ld (
kg/h
a)
Spring wheat yield, 1981/82 - 2012/13
AB
MB
SK
Linear (AB)
Linear (MB)
Linear (SK)
33
Graf 2013
Spring Wheat Yields by Province (1981/82 - 2012/13)
wheat canola
500 7 9
1000 15 18
1500 22 27
2000 30 36
2500 37 45
3000 45 54
3500 52 62
4000 59 71
Bu/acKg/Ha

y = 29.943x + 1025.9
y = 24.051x + 1119.2
y = 17.105x + 1068.2
0
500
1000
1500
2000
2500
19
81
/82
19
82
/83
19
83
/84
19
84
/85
19
85
/86
19
86
/87
19
87
/88
19
88
/89
19
89
/90
19
90
/91
19
91
/92
19
92
/93
19
93
/94
19
94
/95
19
95
/96
19
96
/97
19
97
/98
19
98
/99
19
99
/00
20
00
/01
20
01
/02
20
02
/03
20
03
/04
20
04
/05
20
05
/06
20
06
/07
20
07
/08
20
08
/09
20
09
/10
20
10
/11
20
11
/12
20
12
/13
Yie
ld (
kg/h
a)
Canola yield, 1981/82 - 2012/13
AB
MB
SK
Linear (AB)
Linear (MB)
Linear (SK)
34
Graf 2013
Canola Yields by Province (1981/82 - 2012/13)
wheat canola
500 7 9
1000 15 18
1500 22 27
2000 30 36
2500 37 45
3000 45 54
3500 52 62
4000 59 71
Bu/acKg/Ha
y = 26.284x + 1825.4
y = 21.208x + 1081.9
0
500
1000
1500
2000
2500
3000
3500
19
81
/82
19
82
/83
19
83
/84
19
84
/85
19
85
/86
19
86
/87
19
87
/88
19
88
/89
19
89
/90
19
90
/91
19
91
/92
19
92
/93
19
93
/94
19
94
/95
19
95
/96
19
96
/97
19
97
/98
19
98
/99
19
99
/00
20
00
/01
20
01
/02
20
02
/03
20
03
/04
20
04
/05
20
05
/06
20
06
/07
20
07
/08
20
08
/09
20
09
/10
20
10
/11
20
11
/12
20
12
/13
Yie
ld (
kg/h
a)
Prairie province spring wheat and canola yield, 1981/82 - 2012/13
PP Wheat Yield
PP Canola Yield
Linear (PP Wheat Yield)
Linear (PP Canola Yield)
35
Graf 2013
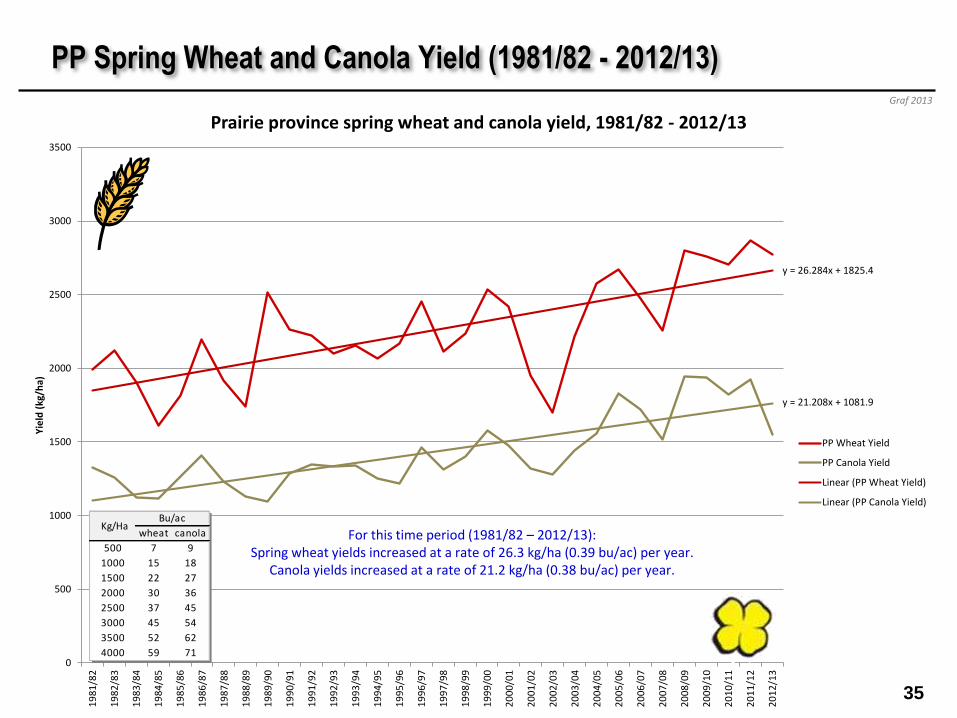
PP Spring Wheat and Canola Yield (1981/82 - 2012/13)
For this time period (1981/82 – 2012/13): Spring wheat yields increased at a rate of 26.3 kg/ha (0.39 bu/ac) per year.
Canola yields increased at a rate of 21.2 kg/ha (0.38 bu/ac) per year.
wheat canola
500 7 9
1000 15 18
1500 22 27
2000 30 36
2500 37 45
3000 45 54
3500 52 62
4000 59 71
Bu/acKg/Ha
y = 0.1745x + 60.64
0
10
20
30
40
50
60
70
80
90
100
19
81
/82
19
82
/83
19
83
/84
19
84
/85
19
85
/86
19
86
/87
19
87
/88
19
88
/89
19
89
/90
19
90
/91
19
91
/92
19
92
/93
19
93
/94
19
94
/95
19
95
/96
19
96
/97
19
97
/98
19
98
/99
19
99
/00
20
00
/01
20
01
/02
20
02
/03
20
03
/04
20
04
/05
20
05
/06
20
06
/07
20
07
/08
20
08
/09
20
09
/10
20
10
/11
20
11
/12
20
12
/13
Can
ola
Yie
ld (
% W
he
at)
Prairie canola yield as a percent of wheat yield, 1981/82 - 2012/13
Canola Yield
Linear (Canola Yield)
36
Graf 2013
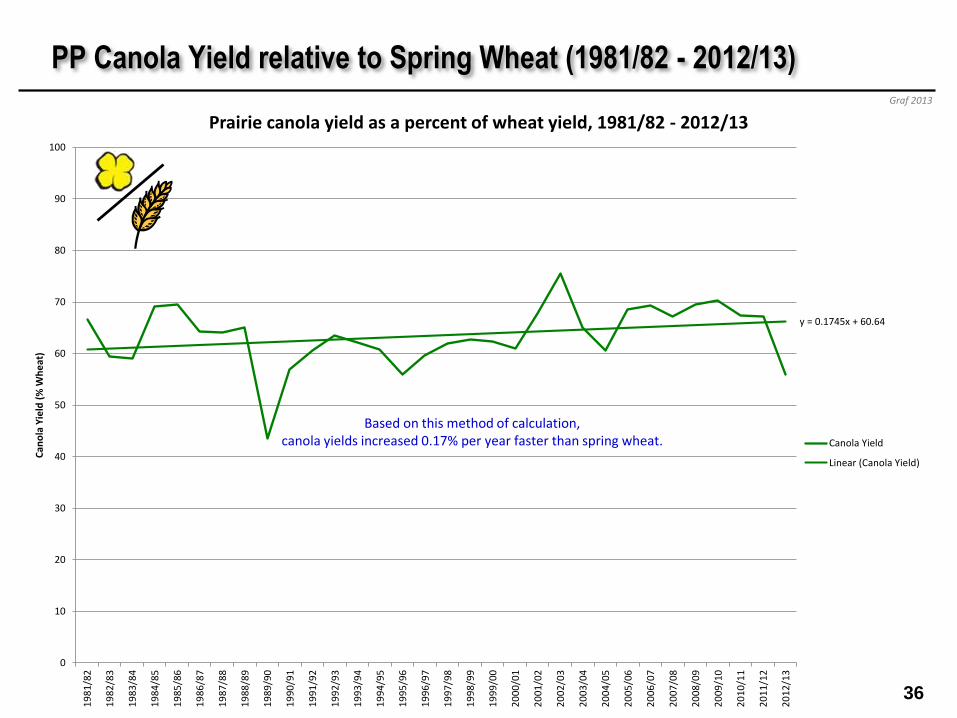
PP Canola Yield relative to Spring Wheat (1981/82 - 2012/13)
Based on this method of calculation, canola yields increased 0.17% per year faster than spring wheat.

y = -185.67x + 22197
y = -179.37x + 11583
0
2000
4000
6000
8000
10000
12000
14000
16000
0
5000
10000
15000
20000
25000
30000
19
81
/82
19
82
/83
19
83
/84
19
84
/85
19
85
/86
19
86
/87
19
87
/88
19
88
/89
19
89
/90
19
90
/91
19
91
/92
19
92
/93
19
93
/94
19
94
/95
19
95
/96
19
96
/97
19
97
/98
19
98
/99
19
99
/00
20
00
/01
20
01
/02
20
02
/03
20
03
/04
20
04
/05
20
05
/06
20
06
/07
20
07
/08
20
08
/09
20
09
/10
20
10
/11
20
11
/12
20
12
/13
Har
vest
ed
Are
a (H
a x
10
00
)
Pro
du
ctio
n (
ton
ne
s x
10
00
)
Prairie Provinces: Total Production and Harvested Area - Spring Wheat
Production
Area
Linear (Production)
Linear (Area)
37
Graf 2013
PP Spring Wheat Production & Harvested Area (1981/82 - 2012/13)
For this time period, for every hectare taken out of spring wheat production, total wheat production was reduced by 1.03 tonnes. (Average spring wheat yield over period = 2.22 t/ha)
y = 336.85x + 924.73
y = 162.21x + 1651.6
0
2000
4000
6000
8000
10000
12000
14000
16000
0
5000
10000
15000
20000
25000
30000
19
81
/82
19
82
/83
19
83
/84
19
84
/85
19
85
/86
19
86
/87
19
87
/88
19
88
/89
19
89
/90
19
90
/91
19
91
/92
19
92
/93
19
93
/94
19
94
/95
19
95
/96
19
96
/97
19
97
/98
19
98
/99
19
99
/00
20
00
/01
20
01
/02
20
02
/03
20
03
/04
20
04
/05
20
05
/06
20
06
/07
20
07
/08
20
08
/09
20
09
/10
20
10
/11
20
11
/12
20
12
/13
Har
vest
ed
Are
a (H
a x
10
00
)
Pro
du
ctio
n (
ton
ne
s x
10
00
)
Prairie Provinces: Total Production and Harvested Area - Canola
Production
Area
Linear (Production)
Linear (Area)
38
Graf 2013
PP Canola Production & Harvested Area (1981/82 - 2012/13)
For this time period, for every added hectare of harvested canola, total canola production increased by 2.08 tonnes.
(Average canola yield over period = 1.50 t/ha)

0
2000
4000
6000
8000
10000
12000
14000
16000
0
5000
10000
15000
20000
25000
30000
19
81
/82
19
82
/83
19
83
/84
19
84
/85
19
85
/86
19
86
/87
19
87
/88
19
88
/89
19
89
/90
19
90
/91
19
91
/92
19
92
/93
19
93
/94
19
94
/95
19
95
/96
19
96
/97
19
97
/98
19
98
/99
19
99
/00
20
00
/01
20
01
/02
20
02
/03
20
03
/04
20
04
/05
20
05
/06
20
06
/07
20
07
/08
20
08
/09
20
09
/10
20
10
/11
20
11
/12
20
12
/13
Har
vest
ed
Are
a (H
a x
10
00
)
Pro
du
ctio
n (
ton
ne
s x
10
00
)
Prairie Provinces: Total Production and Harvested Area - Spring Wheat & Canola
Wheat Production
Canola Production
Wheat Area
Canola Area
Linear (Wheat Production)
Linear (Canola Production)
Linear (Wheat Area)
Linear (Canola Area)
39
Graf 2013
PP Spring Wheat & Canola: Production & Harvested Area
(1981/82 - 2012/13)
y = 55.796x + 5065.3
y = -16.232x + 2660.3
0
500
1000
1500
2000
2500
3000
3500
4000
0
1000
2000
3000
4000
5000
6000
7000
8000
19
81
/82
19
82
/83
19
83
/84
19
84
/85
19
85
/86
19
86
/87
19
87
/88
19
88
/89
19
89
/90
19
90
/91
19
91
/92
19
92
/93
19
93
/94
19
94
/95
19
95
/96
19
96
/97
19
97
/98
19
98
/99
19
99
/00
20
00
/01
20
01
/02
20
02
/03
20
03
/04
20
04
/05
20
05
/06
20
06
/07
20
07
/08
20
08
/09
20
09
/10
20
10
/11
20
11
/12
20
12
/13
Har
vest
ed
Are
a (H
a x
10
00
)
Pro
du
ctio
n (
ton
ne
s x
10
00
)
Alberta: Total Production and Harvested Area - Spring Wheat
Production
Area
Linear (Production)
Linear (Area)
40
Graf 2013
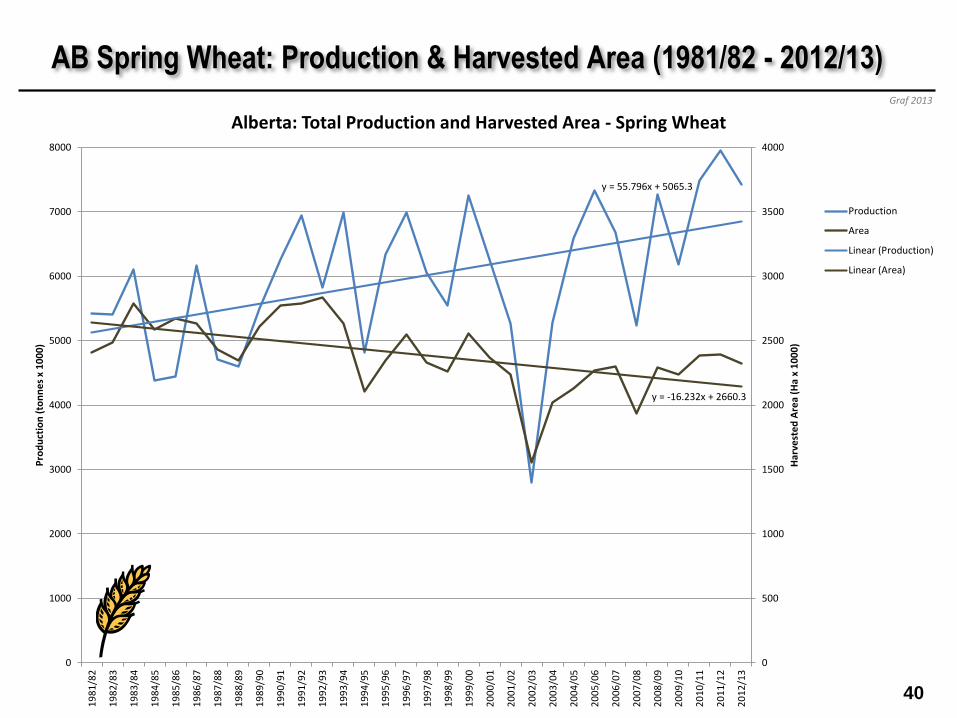
AB Spring Wheat: Production & Harvested Area (1981/82 - 2012/13)

y = 109.97x + 546.18
y = 40.957x + 812.24
0
500
1000
1500
2000
2500
3000
3500
4000
0
1000
2000
3000
4000
5000
6000
7000
8000
19
81
/82
19
82
/83
19
83
/84
19
84
/85
19
85
/86
19
86
/87
19
87
/88
19
88
/89
19
89
/90
19
90
/91
19
91
/92
19
92
/93
19
93
/94
19
94
/95
19
95
/96
19
96
/97
19
97
/98
19
98
/99
19
99
/00
20
00
/01
20
01
/02
20
02
/03
20
03
/04
20
04
/05
20
05
/06
20
06
/07
20
07
/08
20
08
/09
20
09
/10
20
10
/11
20
11
/12
20
12
/13
Har
vest
ed
Are
a (H
a x
10
00
)
Pro
du
ctio
n (
ton
ne
s x
10
00
)
Alberta: Total Production and Harvested Area - Canola
Production
Area
Linear (Production)
Linear (Area)
41
Graf 2013
AB Canola: Production & Harvested Area (1981/82 - 2012/13)

y = -203.23x + 13029
y = -131.85x + 6926.5
0
1000
2000
3000
4000
5000
6000
7000
8000
9000
0
2000
4000
6000
8000
10000
12000
14000
16000
19
81
/82
19
82
/83
19
83
/84
19
84
/85
19
85
/86
19
86
/87
19
87
/88
19
88
/89
19
89
/90
19
90
/91
19
91
/92
19
92
/93
19
93
/94
19
94
/95
19
95
/96
19
96
/97
19
97
/98
19
98
/99
19
99
/00
20
00
/01
20
01
/02
20
02
/03
20
03
/04
20
04
/05
20
05
/06
20
06
/07
20
07
/08
20
08
/09
20
09
/10
20
10
/11
20
11
/12
20
12
/13
Har
vest
ed
Are
a (H
a x
10
00
)
Pro
du
ctio
n (
ton
ne
s x
10
00
)
Saskatchewan: Total Production and Harvested Area - Spring Wheat
Production
Area
Linear (Production)
Linear (Area)
42
Graf 2013
SK Spring Wheat: Production & Harvested Area (1981/82 - 2012/13)
y = 160.36x + 210.49
y = 88.352x + 582.3
0
1000
2000
3000
4000
5000
6000
7000
8000
9000
0
2000
4000
6000
8000
10000
12000
14000
16000
19
81
/82
19
82
/83
19
83
/84
19
84
/85
19
85
/86
19
86
/87
19
87
/88
19
88
/89
19
89
/90
19
90
/91
19
91
/92
19
92
/93
19
93
/94
19
94
/95
19
95
/96
19
96
/97
19
97
/98
19
98
/99
19
99
/00
20
00
/01
20
01
/02
20
02
/03
20
03
/04
20
04
/05
20
05
/06
20
06
/07
20
07
/08
20
08
/09
20
09
/10
20
10
/11
20
11
/12
20
12
/13
Har
vest
ed
Are
a (H
a x
10
00
)
Pro
du
ctio
n (
ton
ne
s x
10
00
)
Saskatchewan: Total Production and Harvested Area - Canola
Production
Area
Linear (Production)
Linear (Area)
43
Graf 2013
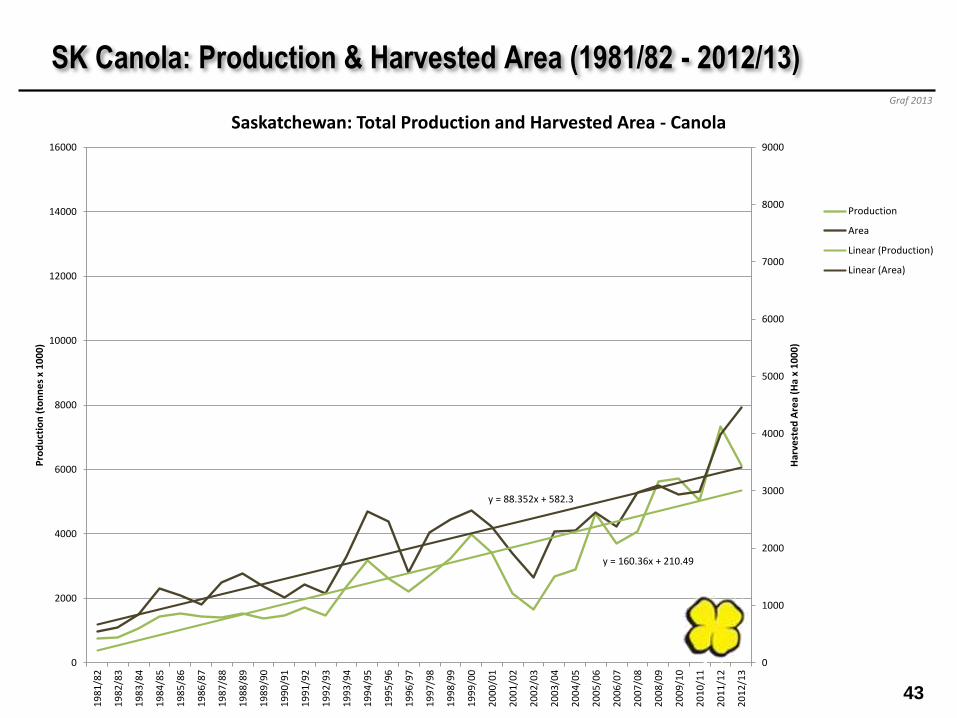
SK Canola: Production & Harvested Area (1981/82 - 2012/13)

y = -38.241x + 4102.6
y = -31.295x + 1996.2
0
500
1000
1500
2000
2500
3000
3500
4000
0
1000
2000
3000
4000
5000
6000
7000
8000
19
81
/82
19
82
/83
19
83
/84
19
84
/85
19
85
/86
19
86
/87
19
87
/88
19
88
/89
19
89
/90
19
90
/91
19
91
/92
19
92
/93
19
93
/94
19
94
/95
19
95
/96
19
96
/97
19
97
/98
19
98
/99
19
99
/00
20
00
/01
20
01
/02
20
02
/03
20
03
/04
20
04
/05
20
05
/06
20
06
/07
20
07
/08
20
08
/09
20
09
/10
20
10
/11
20
11
/12
20
12
/13
Har
vest
ed
Are
a (H
a x
10
00
)
Pro
du
ctio
n (
ton
ne
s x
10
00
)
Manitoba: Total Production and Harvested Area - Spring Wheat
Production
Area
Linear (Production)
Linear (Area)
44
Graf 2013
MB Spring Wheat: Production & Harvested Area (1981/82 - 2012/13)
y = 66.517x + 168.06
y = 32.905x + 257.03
0
500
1000
1500
2000
2500
3000
3500
4000
0
1000
2000
3000
4000
5000
6000
7000
8000
19
81
/82
19
82
/83
19
83
/84
19
84
/85
19
85
/86
19
86
/87
19
87
/88
19
88
/89
19
89
/90
19
90
/91
19
91
/92
19
92
/93
19
93
/94
19
94
/95
19
95
/96
19
96
/97
19
97
/98
19
98
/99
19
99
/00
20
00
/01
20
01
/02
20
02
/03
20
03
/04
20
04
/05
20
05
/06
20
06
/07
20
07
/08
20
08
/09
20
09
/10
20
10
/11
20
11
/12
20
12
/13
Har
vest
ed
Are
a (H
a x
10
00
)
Pro
du
ctio
n (
ton
ne
s x
10
00
)
Manitoba: Total Production and Harvested Area - Canola
Production
Area
Linear (Production)
Linear (Area)
45
Graf 2013
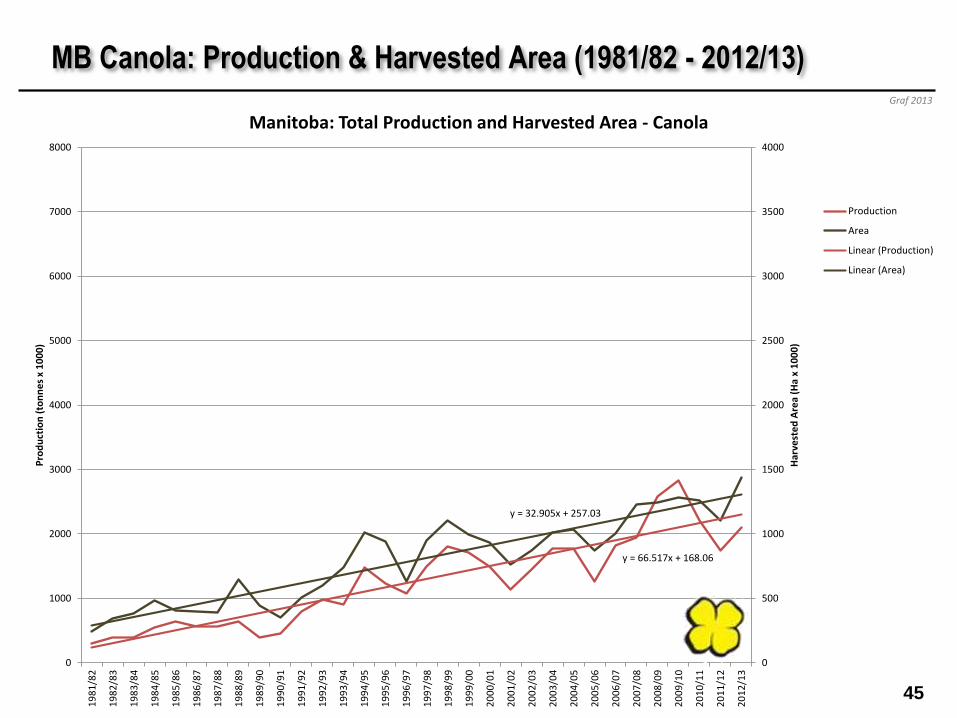
MB Canola: Production & Harvested Area (1981/82 - 2012/13)
46
1981/82 – 1999/00 complete set of graphs

y = 42.681x + 1859.5
y = 15.386x + 2049.0
y = 23.161x + 1661.6
0
500
1000
1500
2000
2500
3000
19
81
/82
19
82
/83
19
83
/84
19
84
/85
19
85
/86
19
86
/87
19
87
/88
19
88
/89
19
89
/90
19
90
/91
19
91
/92
19
92
/93
19
93
/94
19
94
/95
19
95
/96
19
96
/97
19
97
/98
19
98
/99
19
99
/00
Yie
ld (
kg/h
a)
Spring wheat yield, 1981/82 - 1999/00
AB
MB
SK
Linear (AB)
Linear (MB)
Linear (SK)
47
Graf 2013
Spring Wheat Yields by Province (1981/82 – 1999/00)
wheat canola
500 7 9
1000 15 18
1500 22 27
2000 30 36
2500 37 45
3000 45 54
3500 52 62
4000 59 71
Bu/acKg/Ha

y = 13.914x + 1173.4
y = 26.396x + 1099.9
y = 3.4386x + 1203.2
0
200
400
600
800
1000
1200
1400
1600
1800
19
81
/82
19
82
/83
19
83
/84
19
84
/85
19
85
/86
19
86
/87
19
87
/88
19
88
/89
19
89
/90
19
90
/91
19
91
/92
19
92
/93
19
93
/94
19
94
/95
19
95
/96
19
96
/97
19
97
/98
19
98
/99
19
99
/00
Yie
ld (
kg/h
a)
Canola yield, 1981/82 - 1999/00
AB
MB
SK
Linear (AB)
Linear (MB)
Linear (SK)
48
Graf 2013
Canola Yields by Province (1981/82 – 1999/00)
wheat canola
500 7 9
1000 15 18
1500 22 27
2000 30 36
2500 37 45
3000 45 54
3500 52 62
4000 59 71
Bu/acKg/Ha

y = 25.84x + 1854.1
y = 12.113x + 1167.9
0
500
1000
1500
2000
2500
3000
19
81
/82
19
82
/83
19
83
/84
19
84
/85
19
85
/86
19
86
/87
19
87
/88
19
88
/89
19
89
/90
19
90
/91
19
91
/92
19
92
/93
19
93
/94
19
94
/95
19
95
/96
19
96
/97
19
97
/98
19
98
/99
19
99
/00
Yie
ld (
kg/h
a)
Prairie province spring wheat and canola yield, 1981/82 - 1999/00
PP Wheat Yield
PP Canola Yield
Linear (PP Wheat Yield)
Linear (PP Canola Yield)
49
Graf 2013
PP Spring Wheat and Canola Yield (1981/82 – 1999/00)
For this time period (1981/82 – 1999/00): Spring wheat yields increased at a rate of 25.8 kg/ha (0.38 bu/ac) per year.
Canola yields increased at a rate of 12.1 kg/ha (0.22 bu/ac) per year.
wheat canola
500 7 9
1000 15 18
1500 22 27
2000 30 36
2500 37 45
3000 45 54
3500 52 62
4000 59 71
Bu/acKg/Ha
y = -0.2175x + 63.605
0
10
20
30
40
50
60
70
80
90
100
19
81
/82
19
82
/83
19
83
/84
19
84
/85
19
85
/86
19
86
/87
19
87
/88
19
88
/89
19
89
/90
19
90
/91
19
91
/92
19
92
/93
19
93
/94
19
94
/95
19
95
/96
19
96
/97
19
97
/98
19
98
/99
19
99
/00
Can
ola
Yie
ld (
% W
he
at)
Prairie canola yield as a percent of wheat yield, 1981/82 - 1999/00
Canola Yield
Linear (Canola Yield)
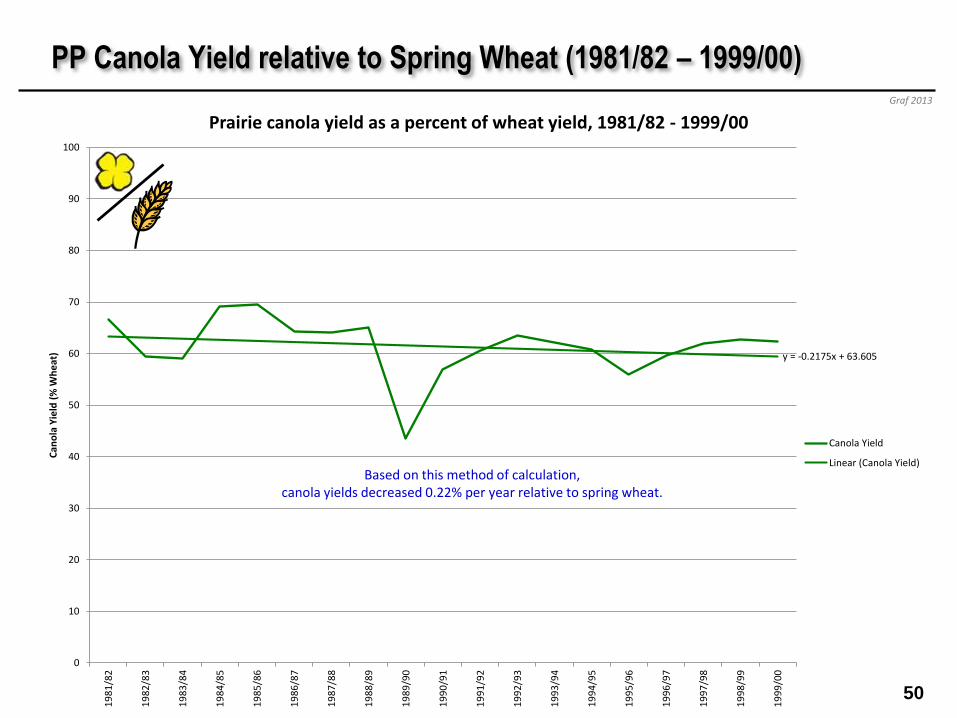
50
Graf 2013
PP Canola Yield relative to Spring Wheat (1981/82 – 1999/00)
Based on this method of calculation, canola yields decreased 0.22% per year relative to spring wheat.

y = -69.639x + 21483
y = -151.58x + 11401
0
2000
4000
6000
8000
10000
12000
14000
16000
0
5000
10000
15000
20000
25000
30000
19
81
/82
19
82
/83
19
83
/84
19
84
/85
19
85
/86
19
86
/87
19
87
/88
19
88
/89
19
89
/90
19
90
/91
19
91
/92
19
92
/93
19
93
/94
19
94
/95
19
95
/96
19
96
/97
19
97
/98
19
98
/99
19
99
/00
Har
vest
ed
Are
a (H
a x
10
00
)
Pro
du
ctio
n (
ton
ne
s x
10
00
)
Prairie Provinces: Total Production and Harvested Area - Spring Wheat
Production
Area
Linear (Production)
Linear (Area)
51
Graf 2013
PP Spring Wheat Production & Harvested Area (1981/82 – 1999/00)
For this time period, for every hectare taken out of spring wheat production, total spring wheat production was reduced by 0.46 tonnes.
(Average spring wheat yield over period = 2.10 t/ha)
y = 306.72x + 1422.5
y = 198.86x + 1459.1
0
2000
4000
6000
8000
10000
12000
14000
16000
0
5000
10000
15000
20000
25000
30000
19
81
/82
19
82
/83
19
83
/84
19
84
/85
19
85
/86
19
86
/87
19
87
/88
19
88
/89
19
89
/90
19
90
/91
19
91
/92
19
92
/93
19
93
/94
19
94
/95
19
95
/96
19
96
/97
19
97
/98
19
98
/99
19
99
/00
Har
vest
ed
Are
a (H
a x
10
00
)
Pro
du
ctio
n (
ton
ne
s x
10
00
)
Prairie Provinces: Total Production and Harvested Area - Canola
Production
Area
Linear (Production)
Linear (Area)
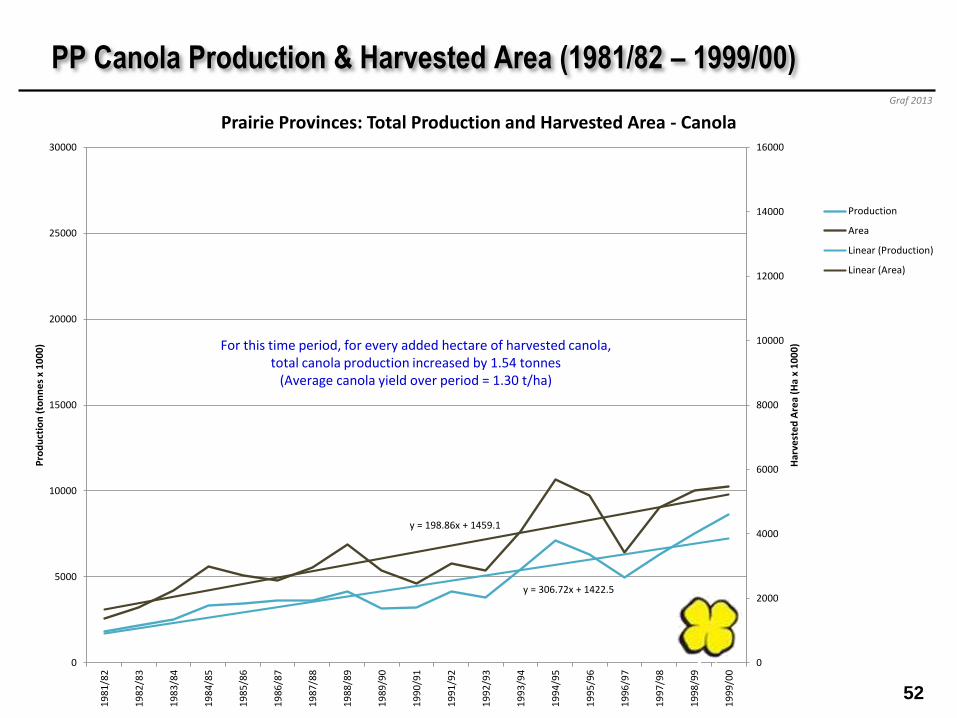
52
Graf 2013
PP Canola Production & Harvested Area (1981/82 – 1999/00)
For this time period, for every added hectare of harvested canola, total canola production increased by 1.54 tonnes
(Average canola yield over period = 1.30 t/ha)

0
2000
4000
6000
8000
10000
12000
14000
16000
0
5000
10000
15000
20000
25000
30000
19
81
/82
19
82
/83
19
83
/84
19
84
/85
19
85
/86
19
86
/87
19
87
/88
19
88
/89
19
89
/90
19
90
/91
19
91
/92
19
92
/93
19
93
/94
19
94
/95
19
95
/96
19
96
/97
19
97
/98
19
98
/99
19
99
/00
Har
vest
ed
Are
a (H
a x
10
00
)
Pro
du
ctio
n (
ton
ne
s x
10
00
)
Prairie Provinces: Total Production and Harvested Area - Spring Wheat & Canola
Wheat Production
Canola Production
Wheat Area
Canola Area
Linear (Wheat Production)
Linear (Canola Production)
Linear (Wheat Area)
Linear (Canola Area)
53
Graf 2013
PP Spring Wheat & Canola: Production & Harvested Area
(1981/82 - 1999/00)

y = 83.709x + 4940.3
y = -10.533x + 2638.4
0
500
1000
1500
2000
2500
3000
3500
4000
0
1000
2000
3000
4000
5000
6000
7000
8000
19
81
/82
19
82
/83
19
83
/84
19
84
/85
19
85
/86
19
86
/87
19
87
/88
19
88
/89
19
89
/90
19
90
/91
19
91
/92
19
92
/93
19
93
/94
19
94
/95
19
95
/96
19
96
/97
19
97
/98
19
98
/99
19
99
/00
Har
vest
ed
Are
a (H
a x
10
00
)
Pro
du
ctio
n (
ton
ne
s x
10
00
)
Alberta: Total Production and Harvested Area - Spring Wheat
Production
Area
Linear (Production)
Linear (Area)
54
Graf 2013
AB Spring Wheat: Production & Harvested Area (1981/82 – 1999/00)

y = 89.823x + 818.85
y = 52.703x + 761
0
500
1000
1500
2000
2500
3000
3500
4000
0
1000
2000
3000
4000
5000
6000
7000
8000
19
81
/82
19
82
/83
19
83
/84
19
84
/85
19
85
/86
19
86
/87
19
87
/88
19
88
/89
19
89
/90
19
90
/91
19
91
/92
19
92
/93
19
93
/94
19
94
/95
19
95
/96
19
96
/97
19
97
/98
19
98
/99
19
99
/00
Har
vest
ed
Are
a (H
a x
10
00
)
Pro
du
ctio
n (
ton
ne
s x
10
00
)
Alberta: Total Production and Harvested Area - Canola
Production
Area
Linear (Production)
Linear (Area)
55
Graf 2013
AB Canola: Production & Harvested Area (1981/82 – 1999/00)

y = -144.54x + 12699
y = -125.99x + 6906.4
0
1000
2000
3000
4000
5000
6000
7000
8000
9000
0
2000
4000
6000
8000
10000
12000
14000
16000
19
81
/82
19
82
/83
19
83
/84
19
84
/85
19
85
/86
19
86
/87
19
87
/88
19
88
/89
19
89
/90
19
90
/91
19
91
/92
19
92
/93
19
93
/94
19
94
/95
19
95
/96
19
96
/97
19
97
/98
19
98
/99
19
99
/00
Har
vest
ed
Are
a (H
a x
10
00
)
Pro
du
ctio
n (
ton
ne
s x
10
00
)
Saskatchewan: Total Production and Harvested Area - Spring Wheat
Production
Area
Linear (Production)
Linear (Area)
56
Graf 2013
SK Spring Wheat: Production & Harvested Area (1981/82 – 1999/00)
y = 140.66x + 504.24
y = 104.39x + 506.92
0
1000
2000
3000
4000
5000
6000
7000
8000
9000
0
2000
4000
6000
8000
10000
12000
14000
16000
19
81
/82
19
82
/83
19
83
/84
19
84
/85
19
85
/86
19
86
/87
19
87
/88
19
88
/89
19
89
/90
19
90
/91
19
91
/92
19
92
/93
19
93
/94
19
94
/95
19
95
/96
19
96
/97
19
97
/98
19
98
/99
19
99
/00
Har
vest
ed
Are
a (H
a x
10
00
)
Pro
du
ctio
n (
ton
ne
s x
10
00
)
Saskatchewan: Total Production and Harvested Area - Canola
Production
Area
Linear (Production)
Linear (Area)
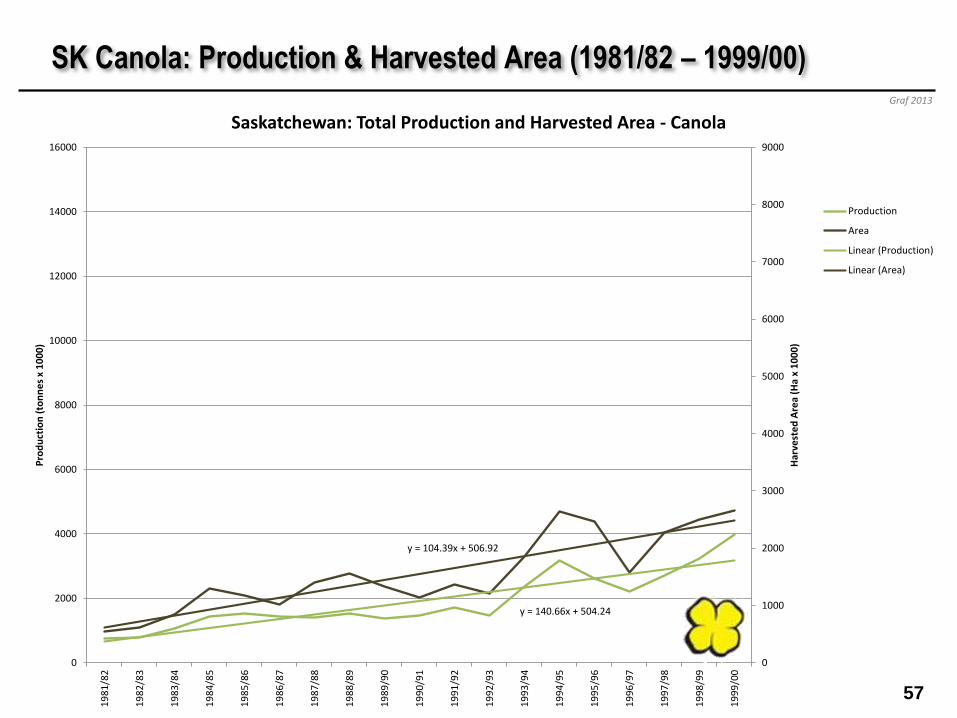
57
Graf 2013
SK Canola: Production & Harvested Area (1981/82 – 1999/00)

y = -8.8118x + 3843.2
y = -15.058x + 1856.4
0
500
1000
1500
2000
2500
3000
3500
4000
0
1000
2000
3000
4000
5000
6000
7000
8000
19
81
/82
19
82
/83
19
83
/84
19
84
/85
19
85
/86
19
86
/87
19
87
/88
19
88
/89
19
89
/90
19
90
/91
19
91
/92
19
92
/93
19
93
/94
19
94
/95
19
95
/96
19
96
/97
19
97
/98
19
98
/99
19
99
/00
Har
vest
ed
Are
a (H
a x
10
00
)
Pro
du
ctio
n (
ton
ne
s x
10
00
)
Manitoba: Total Production and Harvested Area - Spring Wheat
Production
Area
Linear (Production)
Linear (Area)
58
Graf 2013
MB Spring Wheat: Production & Harvested Area (1981/82 – 1999/00)
y = 76.241x + 99.412
y = 41.77x + 191.16
0
500
1000
1500
2000
2500
3000
3500
4000
0
1000
2000
3000
4000
5000
6000
7000
8000
19
81
/82
19
82
/83
19
83
/84
19
84
/85
19
85
/86
19
86
/87
19
87
/88
19
88
/89
19
89
/90
19
90
/91
19
91
/92
19
92
/93
19
93
/94
19
94
/95
19
95
/96
19
96
/97
19
97
/98
19
98
/99
19
99
/00
Har
vest
ed
Are
a (H
a x
10
00
)
Pro
du
ctio
n (
ton
ne
s x
10
00
)
Manitoba: Total Production and Harvested Area - Canola
Production
Area
Linear (Production)
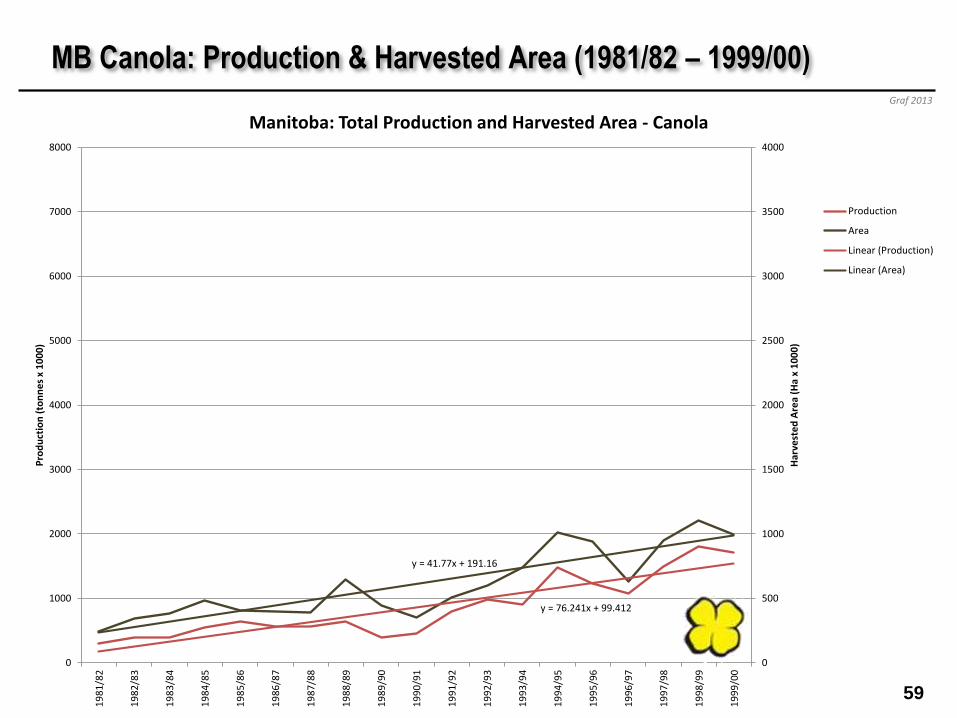
Linear (Area)
59
Graf 2013
MB Canola: Production & Harvested Area (1981/82 – 1999/00)
60
2000/01 - 2012/13 complete set of graphs
y = 78.022x + 2300.0
y = 15.386x + 2049.0
y = 68.681x + 1696.2
0
500
1000
1500
2000
2500
3000
3500
20
00
/01
20
01
/02
20
02
/03
20
03
/04
20
04
/05
20
05
/06
20
06
/07
20
07
/08
20
08
/09
20
09
/10
20
10
/11
20
11
/12
20
12
/13
Yie
ld (
kg/h
a)
Spring wheat yield, 2000/01 - 2012/13
AB
MB
SK
Linear (AB)
Linear (MB)
Linear (SK)
61
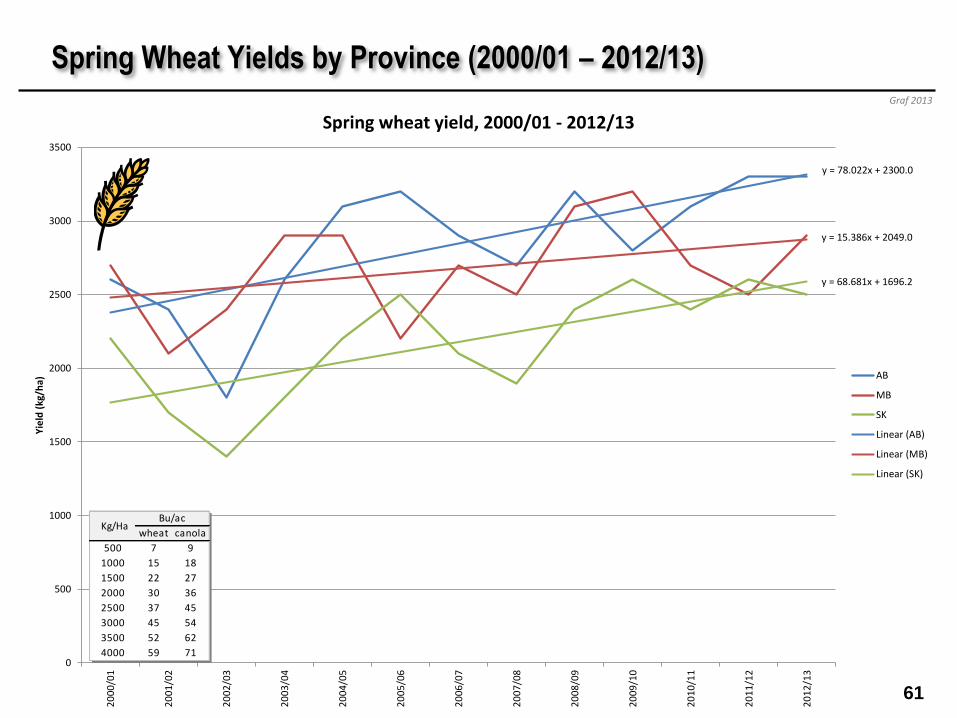
Graf 2013
Spring Wheat Yields by Province (2000/01 – 2012/13)
wheat canola
500 7 9
1000 15 18
1500 22 27
2000 30 36
2500 37 45
3000 45 54
3500 52 62
4000 59 71
Bu/acKg/Ha

y = 58.791x + 1411.5
y = 23.626x + 1573.1
y = 57.143x + 1115.4
0
500
1000
1500
2000
2500
20
00
/01
20
01
/02
20
02
/03
20
03
/04
20
04
/05
20
05
/06
20
06
/07
20
07
/08
20
08
/09
20
09
/10
20
10
/11
20
11
/12
20
12
/13
Yie
ld (
kg/h
a)
Canola yield, 2000/01 - 2012/13
AB
MB
SK
Linear (AB)
Linear (MB)
Linear (SK)
62
Graf 2013
Canola Yields by Province (2000/01 – 2012/13)
wheat canola
500 7 9
1000 15 18
1500 22 27
2000 30 36
2500 37 45
3000 45 54
3500 52 62
4000 59 71
Bu/acKg/Ha

y = 68.137x + 1996.4
y = 41.509x + 1349.9
0
500
1000
1500
2000
2500
3000
3500
20
00
/01
20
01
/02
20
02
/03
20
03
/04
20
04
/05
20
05
/06
20
06
/07
20
07
/08
20
08
/09
20
09
/10
20
10
/11
20
11
/12
20
12
/13
Yie
ld (
kg/h
a)
Prairie province spring wheat and canola yield, 2000/01 - 2012/13
PP Wheat Yield
PP Canola Yield
Linear (PP Wheat Yield)
Linear (PP Canola Yield)
63
Graf 2013
PP Spring Wheat and Canola Yield (2000/01 – 2012/13)
For this time period (2000/01 – 2012/13): Spring wheat yields increased at a rate of 68.1 kg/ha (1.01 bu/ac) per year.
Canola yields increased at a rate of 41.5 kg/ha (0.74 bu/ac) per year.
wheat canola
500 7 9
1000 15 18
1500 22 27
2000 30 36
2500 37 45
3000 45 54
3500 52 62
4000 59 71
Bu/acKg/Ha

y = -0.1928x + 67.921
0
10
20
30
40
50
60
70
80
90
100
20
00
/01
20
01
/02
20
02
/03
20
03
/04
20
04
/05
20
05
/06
20
06
/07
20
07
/08
20
08
/09
20
09
/10
20
10
/11
20
11
/12
20
12
/13
Can
ola
Yie
ld (
% W
he
at)
Prairie canola yield as a percent of wheat yield, 2000/01 - 2012/13
Canola Yield
Linear (Canola Yield)
64
Graf 2013
PP Canola Yield relative to Spring Wheat (2000/01 – 2012/13)
Based on this method of calculation, canola yields decreased 0.19% per year relative to spring wheat.
y = 0.2424x + 65.89
0
10
20
30
40
50
60
70
80
90
100
20
00
/01
20
01
/02
20
02
/03
20
03
/04
20
04
/05
20
05
/06
20
06
/07
20
07
/08
20
08
/09
20
09
/10
20
10
/11
20
11
/12
Can
ola
Yie
ld (
% W
he
at)
Prairie canola yield as a percent of wheat yield, 2000/01 - 2011/12
Canola Yield
Linear (Canola Yield)
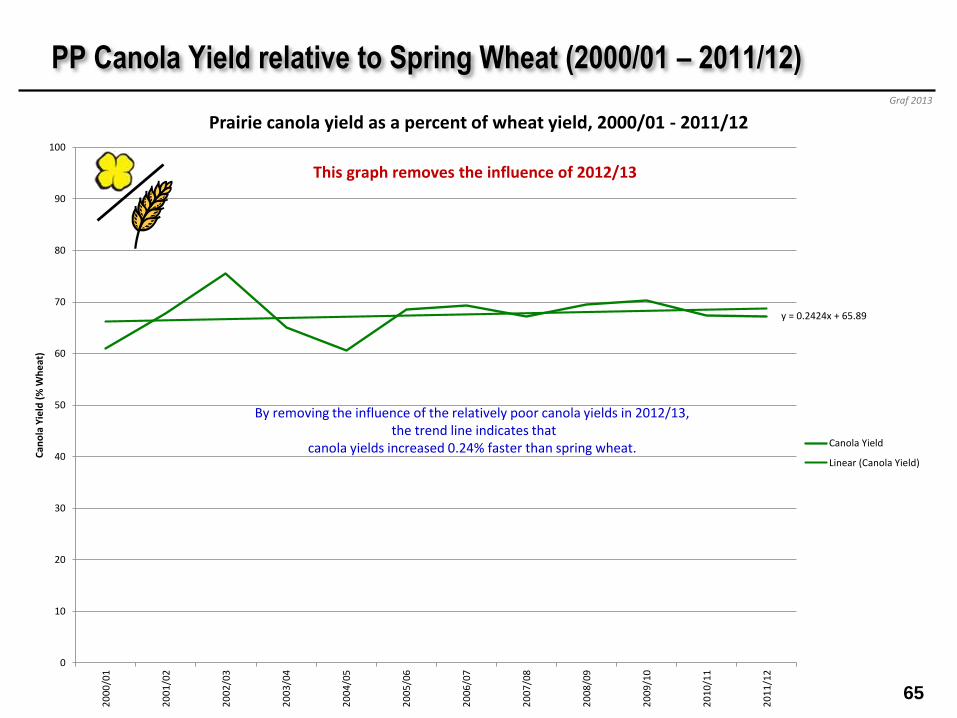
This graph removes the influence of 2012/13
65
Graf 2013
PP Canola Yield relative to Spring Wheat (2000/01 – 2011/12)
By removing the influence of the relatively poor canola yields in 2012/13, the trend line indicates that
canola yields increased 0.24% faster than spring wheat.
y = 0.5364x + 64.562
0
10
20
30
40
50
60
70
80
90
100
20
03
/04
20
04
/05
20
05
/06
20
06
/07
20
07
/08
20
08
/09
20
09
/10
20
10
/11
20
11
/12
Can
ola
Yie
ld (
% W
he
at)
Prairie canola yield as a percent of wheat yield, 2003/04 - 2011/12
Canola Yield
Linear (Canola Yield)
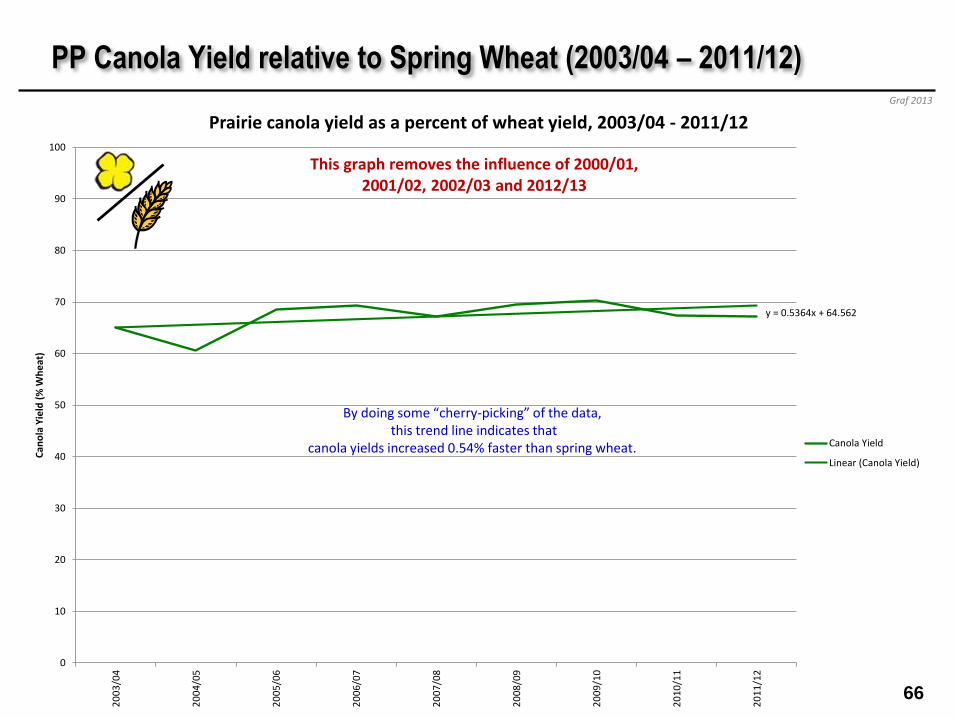
This graph removes the influence of 2000/01, 2001/02, 2002/03 and 2012/13
66
Graf 2013
PP Canola Yield relative to Spring Wheat (2003/04 – 2011/12)
By doing some “cherry-picking” of the data, this trend line indicates that
canola yields increased 0.54% faster than spring wheat.
y = 196.43x + 15342
y = -105.93x + 7520.3
0
2000
4000
6000
8000
10000
12000
14000
16000
0
5000
10000
15000
20000
25000
30000
20
00
/01
20
01
/02
20
02
/03
20
03
/04
20
04
/05
20
05
/06
20
06
/07
20
07
/08
20
08
/09
20
09
/10
20
10
/11
20
11
/12
20
12
/13
Har
vest
ed
Are
a (H
a x
10
00
)
Pro
du
ctio
n (
ton
ne
s x
10
00
)
Prairie Provinces: Total Production and Harvested Area - Spring Wheat
Production
Area
Linear (Production)
Linear (Area)
67
Graf 2013
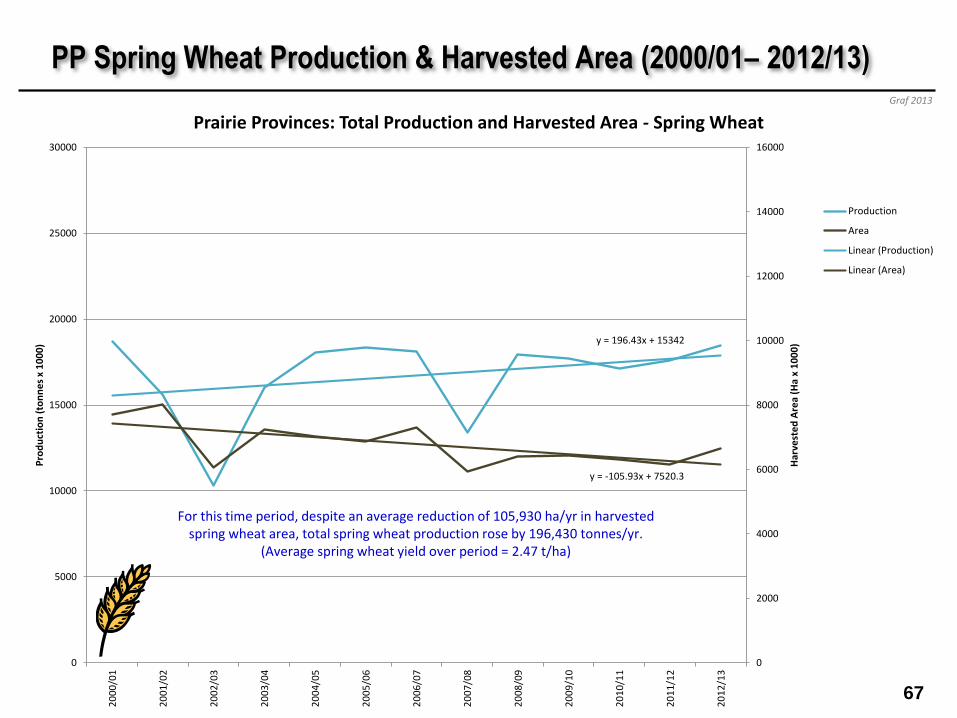
PP Spring Wheat Production & Harvested Area (2000/01– 2012/13)
For this time period, despite an average reduction of 105,930 ha/yr in harvested spring wheat area, total spring wheat production rose by 196,430 tonnes/yr.
(Average spring wheat yield over period = 2.47 t/ha)

y = 759.43x + 4079.6
y = 338.06x + 3248.4
0
2000
4000
6000
8000
10000
12000
14000
16000
0
5000
10000
15000
20000
25000
30000
20
00
/01
20
01
/02
20
02
/03
20
03
/04
20
04
/05
20
05
/06
20
06
/07
20
07
/08
20
08
/09
20
09
/10
20
10
/11
20
11
/12
20
12
/13
Har
vest
ed
Are
a (H
a x
10
00
)
Pro
du
ctio
n (
ton
ne
s x
10
00
)
Prairie Provinces: Total Production and Harvested Area - Canola
Production
Area
Linear (Production)
Linear (Area)
68
Graf 2013
PP Canola Production & Harvested Area (2000/01– 2012/13)
For this time period, for every added hectare of harvested canola, total canola production increased by 2.25 tonnes.
(Average canola yield over period = 1.67 t/ha)
0
2000
4000
6000
8000
10000
12000
14000
16000
0
5000
10000
15000
20000
25000
30000
20
00
/01
20
01
/02
20
02
/03
20
03
/04
20
04
/05
20
05
/06
20
06
/07
20
07
/08
20
08
/09
20
09
/10
20
10
/11
20
11
/12
20
12
/13
Har
vest
ed
Are
a (H
a x
10
00
)
Pro
du
ctio
n (
ton
ne
s x
10
00
)
Prairie Provinces: Total Production and Harvested Area - Spring Wheat & Canola
Wheat Production
Canola Production
Wheat Area
Canola Area
Linear (Wheat Production)
Linear (Canola Production)
Linear (Wheat Area)
Linear (Canola Area)
69
Graf 2013
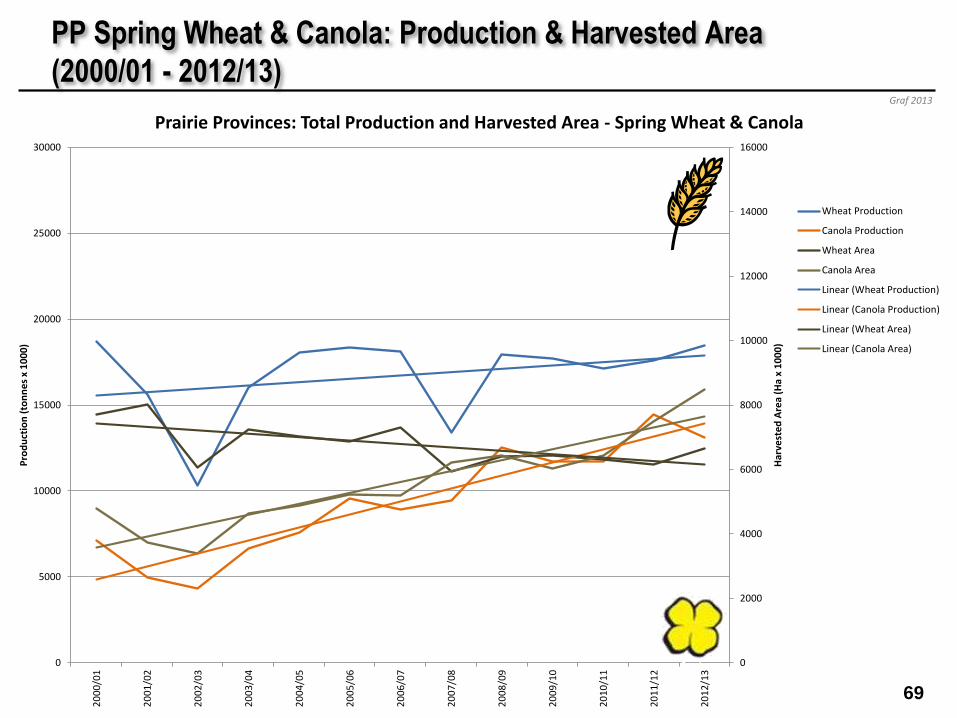
PP Spring Wheat & Canola: Production & Harvested Area
(2000/01 - 2012/13)

y = 225.95x + 4709
y = 24.388x + 2016.4
0
500
1000
1500
2000
2500
3000
3500
4000
0
1000
2000
3000
4000
5000
6000
7000
8000
20
00
/01
20
01
/02
20
02
/03
20
03
/04
20
04
/05
20
05
/06
20
06
/07
20
07
/08
20
08
/09
20
09
/10
20
10
/11
20
11
/12
20
12
/13
Har
vest
ed
Are
a (H
a x
10
00
)
Pro
du
ctio
n (
ton
ne
s x
10
00
)
Alberta: Total Production and Harvested Area - Spring Wheat
Production
Area
Linear (Production)
Linear (Area)
70
Graf 2013
AB Spring Wheat: Production & Harvested Area (2000/01 – 2012/13)

y = 292.02x + 1257.1
y = 114.8x + 976.68
0
500
1000
1500
2000
2500
3000
3500
4000
0
1000
2000
3000
4000
5000
6000
7000
8000
20
00
/01
20
01
/02
20
02
/03
20
03
/04
20
04
/05
20
05
/06
20
06
/07
20
07
/08
20
08
/09
20
09
/10
20
10
/11
20
11
/12
20
12
/13
Har
vest
ed
Are
a (H
a x
10
00
)
Pro
du
ctio
n (
ton
ne
s x
10
00
)
Alberta: Total Production and Harvested Area - Canola
Production
Area
Linear (Production)
Linear (Area)
71
Graf 2013
AB Canola: Production & Harvested Area (2000/01 – 2012/13)

y = 42.68x + 7069.9
y = -85.925x + 4043.7
0
1000
2000
3000
4000
5000
6000
7000
8000
9000
0
2000
4000
6000
8000
10000
12000
14000
16000
20
00
/01
20
01
/02
20
02
/03
20
03
/04
20
04
/05
20
05
/06
20
06
/07
20
07
/08
20
08
/09
20
09
/10
20
10
/11
20
11
/12
20
12
/13
Har
vest
ed
Are
a (H
a x
10
00
)
Pro
du
ctio
n (
ton
ne
s x
10
00
)
Saskatchewan: Total Production and Harvested Area - Spring Wheat
Production
Area
Linear (Production)
Linear (Area)
72
Graf 2013
SK Spring Wheat: Production & Harvested Area (2000/01 – 2012/13)
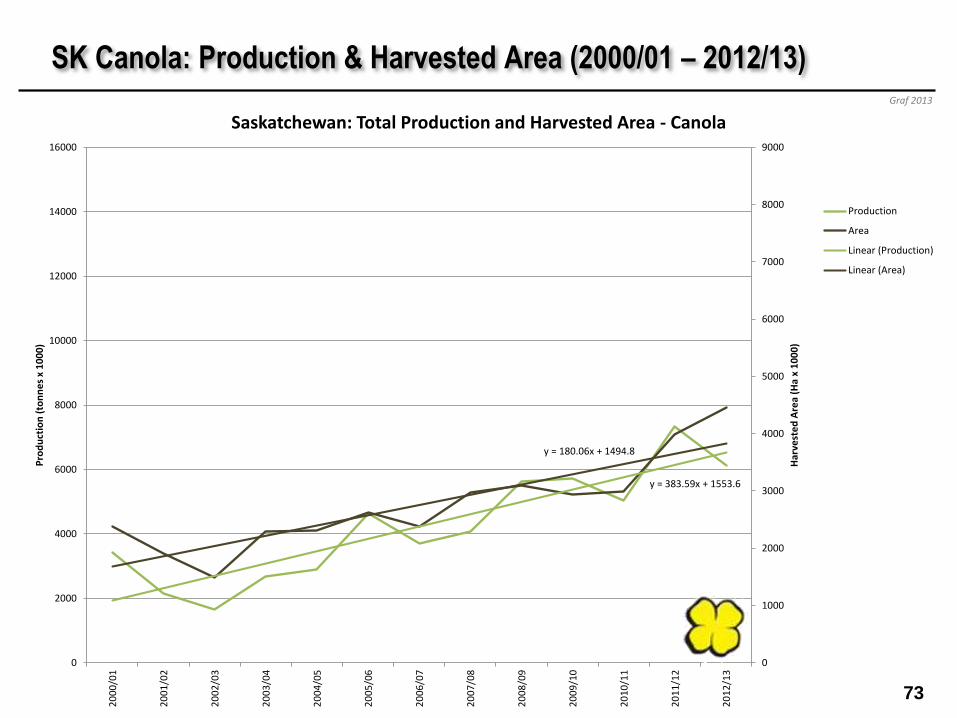
y = 383.59x + 1553.6
y = 180.06x + 1494.8
0
1000
2000
3000
4000
5000
6000
7000
8000
9000
0
2000
4000
6000
8000
10000
12000
14000
16000
20
00
/01
20
01
/02
20
02
/03
20
03
/04
20
04
/05
20
05
/06
20
06
/07
20
07
/08
20
08
/09
20
09
/10
20
10
/11
20
11
/12
20
12
/13
Har
vest
ed
Are
a (H
a x
10
00
)
Pro
du
ctio
n (
ton
ne
s x
10
00
)
Saskatchewan: Total Production and Harvested Area - Canola
Production
Area
Linear (Production)
Linear (Area)
73
Graf 2013
SK Canola: Production & Harvested Area (2000/01 – 2012/13)

y = -72.201x + 3562.9
y = -44.394x + 1460.2
0
500
1000
1500
2000
2500
3000
3500
4000
0
1000
2000
3000
4000
5000
6000
7000
8000
20
00
/01
20
01
/02
20
02
/03
20
03
/04
20
04
/05
20
05
/06
20
06
/07
20
07
/08
20
08
/09
20
09
/10
20
10
/11
20
11
/12
20
12
/13
Har
vest
ed
Are
a (H
a x
10
00
)
Pro
du
ctio
n (
ton
ne
s x
10
00
)
Manitoba: Total Production and Harvested Area - Spring Wheat
Production
Area
Linear (Production)
Linear (Area)
74
Graf 2013
MB Spring Wheat: Production & Harvested Area (2000/01 – 2012/13)
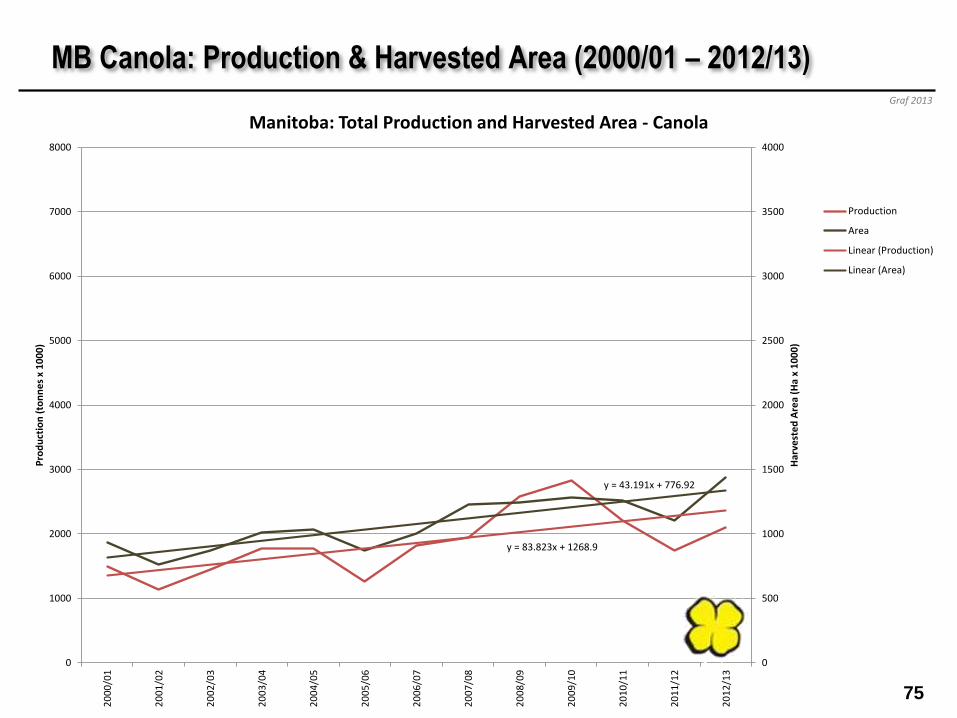
y = 83.823x + 1268.9
y = 43.191x + 776.92
0
500
1000
1500
2000
2500
3000
3500
4000
0
1000
2000
3000
4000
5000
6000
7000
8000
20
00
/01
20
01
/02
20
02
/03
20
03
/04
20
04
/05
20
05
/06
20
06
/07
20
07
/08
20
08
/09
20
09
/10
20
10
/11
20
11
/12
20
12
/13
Har
vest
ed
Are
a (H
a x
10
00
)
Pro
du
ctio
n (
ton
ne
s x
10
00
)
Manitoba: Total Production and Harvested Area - Canola
Production
Area
Linear (Production)
Linear (Area)
75
Graf 2013
MB Canola: Production & Harvested Area (2000/01 – 2012/13)
